the exit rates of liquidated venture capital funds
TRANSCRIPT

The Journal of Entrepreneurial Finance The Journal of Entrepreneurial Finance
Volume 10 Issue 1 Spring 2005 Article 5
12-2005
The Exit Rates of Liquidated Venture Capital Funds The Exit Rates of Liquidated Venture Capital Funds
Markus Laine Eqvitec Partners
Sami Torstila Helsinki School of Economics
Follow this and additional works at: https://digitalcommons.pepperdine.edu/jef
Recommended Citation Recommended Citation Laine, Markus and Torstila, Sami (2005) "The Exit Rates of Liquidated Venture Capital Funds," Journal of Entrepreneurial Finance and Business Ventures: Vol. 10: Iss. 1, pp. 53-73. Available at: https://digitalcommons.pepperdine.edu/jef/vol10/iss1/5
This Article is brought to you for free and open access by the Graziadio School of Business and Management at Pepperdine Digital Commons. It has been accepted for inclusion in The Journal of Entrepreneurial Finance by an authorized editor of Pepperdine Digital Commons. For more information, please contact [email protected], [email protected], [email protected].

The Exit Rates of Liquidated Venture Capital Funds
Markus Laine * Eqvitec Partners
and
Sami Torstila Helsinki School of Economics
Exit rates provide a simple yet practical measure for evaluating and benchmarking the performance of venture capital funds. We create a sample of 138 liquidated U.S. venture capital funds and investigate the outcomes of their 4,549 portfolio companies. We study exit rates, proportions of different exit routes, and their determinants. The median fiind in our sample exited 19% of portfolio companies through an IPO, 7% through a sale of listed equity, and 23% through mergers or acquisitions. There exist, however, interesting differences between fimd types: Li particular, large funds and fund management firms have significantly higher exit rates.
IntroductionWhat are the cross-sectional determinants of venture capitalist success? Institutional
investors participating in venture capital funds have a significant interest in the answer, as it
We wish to thank our anonymous referees and Matti Keloharju for helpful comments. We are grateful to Antti Kanto for advice with econometric issues and to Nuutti Kuosa for research assistance. Markus Laine started work on this project while at the Helsinki School of Economics, and the opinions presented herein do not necessarily reflect those of his present employer. We acknowledge financial support from the OKO Bank Group Research Foundation.
Markus Laine, M.Sc. (Econ.) is an Investment Manager at Eqvitec Partners, a technology venture capital firm focusing on the Nordic Countries. His professional interests focus on investment banking and venture capital.
Sami Torstila, D.Sc. (Econ.), LL.M., is a Professor of Finance (Fixed-Term) at Helsmki School of Economics. His research focuses on corporate finance and investment banking and has been published in journals such as Journal of Financial and Quantitative Analysis and Financial Management.
may help them decide which fund to choose. Research into cross-sectional differences and determinants of success is, however, made difficult by the scarcity of publicly available data on fund-specific returns. Consequently, new approaches are of interest in examining the comparative capabilities of venture capitalists.
Prior research on venture capital performance concentrates on the risk and return profiles of venture capital investments over time, and on comparisons with other asset classes such as stocks and bonds. There is evidence that venture capital investments have, on average, yielded higher returns than investments in the public equity markets (see e.g. Cochrane, 2004), but significant differences exist within the asset class. Other studies, such as Martin and Petty (1983), Ibbotson and Brinson (1987), and Kleiman and Schulman (1992) look at the stock prices of publicly traded venture capital firms. Finally, on the practitioner side, the National Venture Capital Association (NVCA) reports average rates of return on a regular basis. Performance by industry, region, across time, and other classifications is reported annually in the publications of NVCA.
The existing literature reveals three areas in which information is scarce. First, there exists limited research on the determinants of venture capital success. Second, the exit rates of venture capital investments have been relatively little studied: Schwienbacher (2002) shows results from a survey, while Cumming (2002) studies a sample of 17 European funds. Measures of exit rates are interesting not only as a proxy of investment success; they also have value to practitioners as they evaluate whether their investment memoranda are realistic. Is it, for example, reasonable for a venture capitalist to expect in its internal documentation that 50% of its investments will exit successfully, even if the median for similar funds is only 30%? Third, there appears to be a need for further research into liquidated funds, where future uncertainty no longer clouds the results. This has only become feasible in recent years.
This study looks at 138 U.S. based venture capital funds liquidated between 1990 and 2000 and investigates the ultimate disposition of each of their approximately 4,500 portfolio companies. Using this new dataset, we examine the proportion of successful exits to portfolio companies for each fund and investigate variables affecting this measure. We also study the proportion of different exit modes and show data on four different types of exits: 1. initial public offering only, 2. sale of listed equity (i.e. initial public offering followed by a merger or acquisition), 3. merger or acquisition only, and 4. M&A transaction followed by a stock market listing. Breakdowns and analyses of these measures allow practitioners to evaluate the realism of their currently planned exit strategy.
We examine several testable hypotheses regarding exit rates and the characteristics of venture capital funds. The exit rate may be affected by such factors as the size and portfolio composition of the fund, including industry preferences or a focus on early or late stage investments. Independent, banking, or corporate venture capital flinds^ may have different exit behavior based on differing incentive structures. We also study the evidence on learning effects among sequel funds: We define a sequel fund to be any fund that is not the first raised by a given fund management company. Finally, timing may be a significant factor: luck and market movements could be as relevant as managerial success or organization design.
Using the proportion of successful exits as dependent variable, we find that large fimds have significantly higher exit rates. This holds for measures of both fund size and firm
54
Such studies include Huntsman and Hoban (1980), Bygrave et al. (1989), Chiampou and Kallett (1989), Schilit (1993), Gompers and Lemer (1997), and Wright and Robbie (1998). We define a banking venture capital fund as an affiliate of a financial services firm; a corporate venture capital fimd as an affiliate of the an industrial firm; other funds are classified as independent.
55
capital under management. The larger fund management companies are presumably also the more established and reputable ones, and may capitalize on their reputation through certification as described in Megginson and Weiss (1991) for the IPO market. We investigate separately the possibility that the results are driven IPO market timing ability through a two-stage analysis controlling for the effects on all variables of a measure of IPO market timing: this does not change our results significantly.
The rest of this paper is organized as follows. Section I discusses the importance and profitability of various exit types to venture capitalists. Section II develops hypotheses as to variables likely to affect the exit rates and routes of a particular fund. Section III discusses the data used and the measurement of variables, while section IV describes the results obtained. Section V concludes.
I. The Choice of Exit ModeThe investment performance of venture capital funds is driven by successful exits.
There are several potential acquirers for the equity of a portfolio company. These include, most importantly, the investing public via the stock market, companies in the same or related industries as the portfolio company, other institutional investors, and, finally, the company or entrepreneur itself.
The public stock markets are often, though not always, the first choice. Black and Gilson (1999) state that U.S. venture capital funds earn an average 60% annual return on investment in IPO exits, compared to 15% in acquisition exits. Sahlman (1990) docimients that almost all of the returns to investors in venture capital are earned by companies that eventually go public, while Barry (1994) concludes that IPOs appear to be the most profitable way of exit.
However, alternatives to IPOs are certainly not trivial in frequency or importance (see Black and Gilson, 1998). Robb (2002) points out that an IPO is a feasible alternative for only few small businesses. Schwienbacher (2002) reports the following exit frequencies from a survey of 67 U.S. funds; IPO (+ sale of quoted equity) 29.9%, trade sale / acquisition 30.3%, management buyout 2.0%, secondary sale / refinancing 5.0%, and fmally liquidation (write-off), 32.8%.
Venture capitalists may rely on the IPO markets to a widely different extent depending on their strategy. Advantages of a non-IPO exit could be related to greater privacy or lesser external pressure on operating performance. Another disadvantage of an IPO exit may be that they often provide less immediate liquidity than most trade sales: a trade sale of a 100% stake liberates capital immediately, while only a part of the company is sold in an IPO^.
The second common alternative is an acquisition of the portfolio company by a firm in the same or a related industry, i.e. a trade sale. This alternative provides a great deal of different options as to the amount of stake sold, the consideration received (cash or stock), and the formulation of the sales and purchase agreement. Earn-out conditions (i.e. tying the transaction value to future financial performance) or strict formulations of the representations and warranties clauses may, in effect, make the payment received by the fund contingent on a number of future events.
An alternative type of buyer consists of financial investors such as other venture capitalist firms. Finding a second venture capitalist willing to buy the portfolio company at a reasonable price is not always obvious. Why should they see potential in a company their
Dubil (2002) models the optimal liquidation behavior of venture capitalists faced with a sale of concentrated
security holdings.
56
competitor is already trying to exit, unless their views are widely divergent?The company, entrepreneur, or management group of the company is the final
typical buyer. Such a transaction may happen in the context of a management buy-out from &e venture capitalist. Alternatively, the transaction can be embedded in the original investment contract in the form of put or call options.
Can we then use exit rates as a proxy for investment success? Exits will differ widely in their terms and the price obtained. We should certainly be careful in making inferences based on, say, the IPO exit rate only. Although IPOs have often been a high profit exit method, there may be characteristics of the portfolio compames or market situations in which a particular fund would find other exit methods more optimal.
The total rate of successful exits, however, while not a perfect proxy for performance, presents fewer problems. We can in most cases safely assume that a venture capitalist will prefer almost any kind of exit to liquidation. The exit rate can mostly be more clearly observed from the outside than the actual cash flows of the fund. In contrast, the calculation of performance through internal rates of return (IRR) is tricky in terms of both data availability and measurement problems. As an example of the latter, in IPO exits, venture capitalists typically keep a large stake for a certain period after the IPO and exit piece by piece (see Gumming and Macintosh, 2003, for partial exits). The difficult part for an outside observer would be to track all the actual cash flows the venture capitalist receives from selling portions of its ownership after the IPO.
II. Determinants of the exit rateThis section discusses a number of possible determinants of exit rates. The
determinants are divided into five categories: Compensation and incentives, learning and experience, portfolio size, portfolio composition, and timing.
A. Compensation and incentivesLike rates of return, compensation schemes in individual venture capital funds are
not public information. However, prior research discusses a number of issues relating to the compensation and incentives of different kinds of venture organizations.
Gompers and Lemer (1999b) study the agreements of 419 U.S. independent venture capital partnerships. They note that the agreements typically designate a percentage of the fund’s capital or assets as an annual management fee and a percent of profits (i.e. carried interest) to be paid out as investment returns are realized. Management fees typically vary between 1.5% and 3%. In 81% of the funds, the carried interest is found to be between 20% and 21%, and in over 300 funds exactly 20%.
As to captive venture capital funds, the compensation of managers appears not as performance based as in independent funds. Gompers and Lemer (1998) note that corporations have firequently been reluctant to compensate their venture managers though profit-sharing (i.e. carried interest) provisions, fearing that they might need to make overly large payments if their investments were successful. Typically, successful risk-taking may have been inadequately rewarded and failure excessively punished.
There exist also some differences relating to the fees charged by fimds from portfolio companies. According to the classification provided by VentureXpert, a minority of funds note that their business model relies only partially on investment success and is completed by charging direct fees such as closing fees, service fees, etc from the portfolio companies.
Based on this discussion, we suggest two testable hypotheses. First, referring to Gompers and Lemer (1998) the compensation stmctures of captive funds run by

corporations or banks are expected to create weaker incentives on average than the carried interest systems of independent venture capital funds. We expect to find that captive funds have lov^er exit rates than independent funds. Second, we expect funds that charge fees from their portfoHo companies to have lower rates of successful exits. This is because their financial incentives are less reliant on exits.
B. Learning and experienceIf fund managers learn from their experience and improve over time, we would
expect follow-on funds to perform better than their predecessors. We classify sole funds separately, because their performance may be affected by reverse survivorship bias: managers of badly performing funds never get an opportunity to raise another fund. Sole funds, as well as the first fund in a series, may therefore perform less well and have lower exit rates. Less experienced funds may face particular hurdles on the IPO market, where they have not yet built a certification reputation as in Megginson and Weiss (1991)
Proximity to information on innovative firms and capital markets may have an impact on learning and performance. Smith and Smith (2000) report that a majority of venture capital investments were made in Silicon Valley and New England. We expect to find that funds operating close to their target companies or in major financial centers should perform better on average and have a higher proportion of successful exits.
C. Portfolio sizeWe examine the capital under management of the fund management company as
well as the size of an individual fund. These two appear related, but their correlation coefficient is only 0.27. We relate management company size primarily to reputation and experience, whereas fund size has a link to the universe of investment opportunities available.
According to Gompers and Lemer (1999a), the age of the venture capital firm is likely to be positively related to its performance through experience and reputation. Unfortunately, we have no reliable data on the age or reputation of management firms. We test for these effects indirectly. Venture capital firms with a good track record are likely to attract more investors and better quality entrepreneurs than newcomers. As a result, a venture capital firm’s capital under management is a reasonable proxy for reputation. We therefore expect funds managed by larger firms to have longer experience and better reputations. They should have a higher proportion of successful exits and are more likely to have developed a certification reputation on the IPO market.
Sahlman (1990) documents that venture capitalists’ returns are directly related to the size of the fund’s investment portfolio. A possible mechanism explaining this is that larger funds are able to make larger individual investments while maintaining sufficient diversification. Accordingly, certain large investment opportunities are available only to large funds and not to small ones. With a larger universe of investments to choose fi-om, we expect the larger funds to find more attractive opportunities resulting in higher rates of successful exits. As our variable we choose fund size rather than the number of portfolio companies, as the latter is already used in our dependent variable [Successful exits / Portfolio companies]. The correlation between ln(fund size) and the number of portfolio companies is still 0.55, making it necessary to omit the variable altogether in some specifications of the model as a robustness check.
D. Portfolio compositionThe venture capital fund’s portfolio composition is likely to affect its exit rate and
57

58
the proportions of different exit routes. Variables to be considered include the fund’s investment stage focus and industry focus.
Other things equal, a given start-up company is less likely to succeed and provide exit opportunities than a comparable mature company: there are simply more things that can still go wrong. Li other words, the likelihood of failure decreases with time as the company becomes more mature. As a consequence, we expect to find that the later the stage at which the fund typically invests in portfolio companies, the greater the chance of a successful exit.
Funds also have differing industry focuses. We divide the sample into fimds focusing on information technology, medical (including biotechnology), or traditional industries. The past decade was a time of high technology: Telecommunications and other IT companies attracted much of the investors’ interest, particularly in the IPO markets of the latter part of the 1990s. We expect flmds concentrating on IT companies to have higher exit rates than other industries overall.
E. TimingA critical issue for the success of a venture capitalist fund is timing. Success can be a
matter not only of managerial skill and organizational ability, but also of plain luck. The exit markets are heavily cyclical, and the IPO market extremely so. A fimd maturing in a good IPO year will find its exit plans much simpler to implement. We expect that funds which have exited during years of high IPO activity have had the highest exit rates, and use measures of market activity as control variables. Additionally, we perform a two-stage analysis in which the effects of an IPO timing factor are first taken out.
We also study the effects of fund lifetime. The expected effect is that funds with a longer lifetime have more exits, as they have self-selected to wait longer for a favorable IPO market. This is not necessarily optimal, however, as a longer investment period puts pressure on IRR.
ni. Data and variablesThe data used in the study are collected from SDC VentureXpert, New Issues and
M&A databases. VentureXpert (provided by Venture Economics) provides data on venture capital and private equity worldwide from 1970 to present. So far, numerous venture capital related studies have used data from VentureXpertA^enture Economics (see. e.g. Bygrave et al., 1989; Brav and Gompers, 1997; Gompers and Lemer, 1998, 1999b). New Issues includes information on all types of equity and debt issues worldwide from 1962 to date, while the M&A database goes back to 1979 for U.S. transactions.
The funds studied are identified from the VentureXpert database using the followingcriteria:
a. fimd investment type is venture capital (i.e. no buyout or mezzanine funds);b. fund nationality is U.S. We only examine U.S. funds because of their better
coverage in the VentureXpert data;c. the fund is reported as liquidated between 1990 and 2000;d. the fund has not made investments or IPOs after its reported liquidation;e. necessary descriptive data for the fund is available;f. the fund has had at least ten portfolio companies
This leaves a total of 138 U.S.-based venture capital funds. Point f. is necessary to ensure smoother distributions of our exit rate variables, since funds with only very few portfolio companies will have extreme variation in exit rates. As shown in Figure 1, the
59
distribution of exit rates peaks at the 45-50% and 50-55% categories, which have an equal number of observations. Only four funds have exit rates below 25% and another four rates above 75%. No funds have exit rates below 10% or above 90%. In addition, we perform robustness checks where the eight outliers above are excluded and find that they do not drive our results.
We identify all the portfolio companies of these 138 funds through VentureXpert. After eliminating a few instances of double-counted companies, we have a total of 4,549 portfolio companies whose ultimate disposition we seek to identify. We look at the IPO and M&A information separately and finally combine the two.First, we use the SDC New Issues database to reveal the IPO exits for the sample flmds. We cross-check that the fund and portfolio company information match in both New Issues and VentureXpert and eluninate doubtful cases. We find 1,384 IPO matches (30% of sample companies).
The M&A information is more difficult to match. We first define an M&A exit as a transaction reported as “completed” and where control of the company is transferred. In other words, in the case of staged exits we only count the one transaction where the venture capitalist became a minority shareholder. To avoid including false exits, we also eliminate cases where the percentage of shares sold is not listed and the transaction is described as a “stake purchase”, or where the transaction is listed as taking place after fund liquidation. We start by using the “venture backed” flag of the M&A database, check that the fund name and portfolio company names match those on our list, and get 815 matches. The problem with the “venture backed” flag, however, is that it does not appear very reliable for older transactions: there are only 121 flagged transactions prior to 1989. For this reason, we extend our search to the whole M&A database and match portfolio companies by Committee on Uniform Securities Identification Procedures (CUSIP) numbers. More information on CUSIP codes is available at www.cusip.com. This provides 947 further matches. Finally, we look up companies from the M&A database by name and home state, and match 105 companies more. This brings our total of matched M&A transactions to 1,867 (41% of sample companies).
However, some of the matches show up on both the IPO and M&A side. The most common case is an IPO followed by a takeover, i.e. a sale of listed equity. There are 591 such cases in the data (13% of sample companies). In addition, in 7 cases an M&A transaction has been followed by a stock market listing in which the venture capitalist sold stock. This leaves us with 786 IPO only exits (17% of sample companies), 1,269 M&A only exits (28%), and 1,896 (45%) cases in which the portfolio company was liquidated or the outcome is otherwise unknown to us.
The Exit rate of a fund, which will be used as dependent variable in some of the analyses, is calculated as:
„ . Number of successful exitsExit rate = -------------------------- ------------- (1)
Number o f portfolio companies
where successful exits are understood as IPOs, M&A transactions, or combinations thereof.The first group of independent variables is related to compensation and incentives.
We divide the funds into three types: independent, banking, and corporate (CVQ. VentureXpert divides banking fimds into smaller groups such as investment bank affiliates and financial corporations, but because of their small number in the sample, we group all banking funds under the same category.
60
The fee structure of the fund in relation to portfolio companies is divided into two categories based on the classification in VentureXpert. This provides two categories, which are return on investment most important, but charges closing fees, service fees, etc., and return on investment is o f primary concern, does not charge fees.
The second group of independent variables relates to learning and experience. The funds are divided into three fund sequence types: sole, new, and follow-on funds. A fund can only be classified as sole or new, not both. Fund sequence number is the chronological number of the fund within a venture capital firm, e.g. two for the firm’s second fund. The classification of fund regions includes thirteen geographical areas in the U.S. Of greatest interest are regions locating close to finance and technology centers, defined here as greater Greater New York, New England, and Northern California. These three regions provide a dummy for favorable location.
A third group of variables includes measures of portfolio size. Firm capital under management describes the size of a fund’s management firm. It is the total amount of capital managed by all of the firm’s f\mds. Fund size is the amount of capital committed to the fund. Average investment is fund size divided by the number of portfolio companies. We use logarithmic transformations for all three size variables and use them in turns to avoid multicollinearity problems.
A group of variables relating to portfolio composition functions serves to control for stage and industry effects. Fund stage focus shows the fund’s investment strategy according to the stage of portfolio companies. The fund stages are divided into five categories:
Seed stage: Mainly portfolio companies that have not yet fully established commercial operations, and may also involve continued research and product development.Early stage: Mainly companies engaged in product development, initial marketing, manufacturing, and sales activities.Expansion stage: Mainly companies in the process of initial expansion (e.g. further plant expansion, marketing, working capital, or development of an improved product).Later stage: Mainly companies needing financing for growth such as producing, shipping and increasing sales volume.Balanced: Investment strategy that includes investment in portfolio companies at a variety of stages of development (seed, early, expansion, and later stage).
For the industry focus of the fund’s portfolio companies, we use a classification into three: information technology (IT), traditional industry, and medical (including biotechnology) focused funds, according to the mode type of portfolio company.
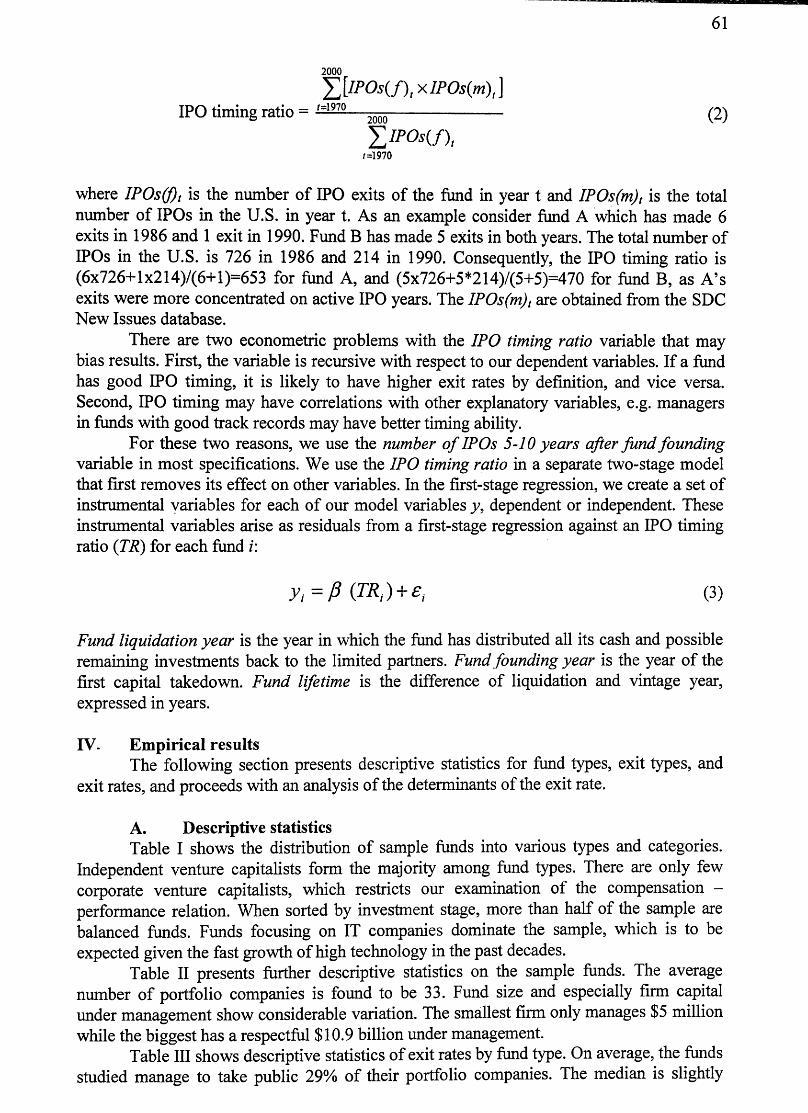
A final group of independent variables is related to fund timing. As an exogenous timing variable, relatively difficult for any fund manager to forecast with accuracy, we use the number o f IPOs in the U.S. 5 to 10 years after the founding year of the fund. Additionally, we define an IPO timing ratio {TR) which measures the fund’s success in timing its exits with the IPO market peak. It is a weighted average that indicates how large a portion of the fund’s IPO exits have occurred during hot IPO years. This is defined as:
61
2000
Y}jPOs{f),xIPOs{m),IPO timing ratio = — ----------------------- (2)
Y iP O s if ) ,/=1970
where IPOs(f)t is the number of IPO exits of the fund in year t and IPOs(m)t is the total number of IPOs in the U.S. in year t. As an example consider fund A which has made 6 exits in 1986 and 1 exit in 1990. Fund B has made 5 exits in both years. The total number of IPOs in the U.S. is 726 in 1986 and 214 in 1990. Consequently, the IPO timing ratio is (6x726+lx214)/(6+l)=653 for fund A, and (5x726+5*214)/(5+5)=470 for fund B, as A’s exits were more concentrated on active IPO years. The IPOs(m)t are obtained from the SDC New Issues database.
There are two econometric problems with the IPO timing ratio variable that may bias results. First, the variable is recursive with respect to our dependent variables. If a fund has good IPO timing, it is likely to have higher exit rates by definition, and vice versa. Second, IPO timing may have correlations with other explanatory variables, e.g. managers in funds with good track records may have better timing ability.
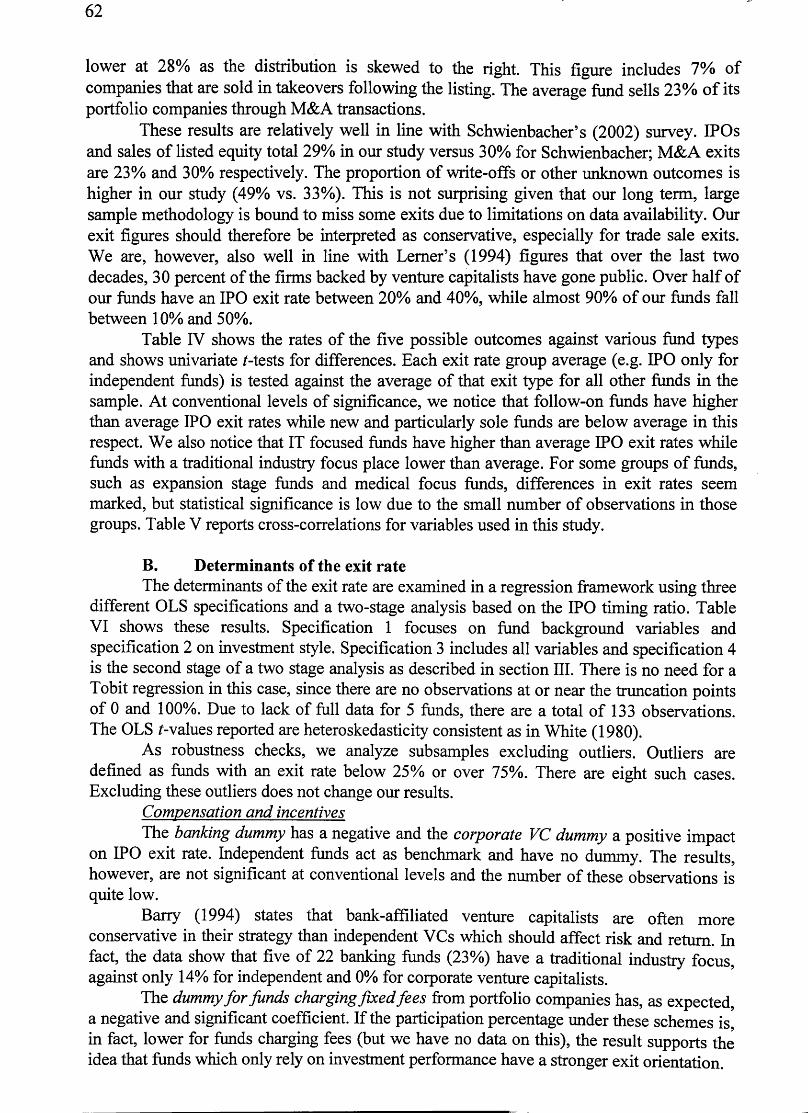
For these two reasons, we use the number o f IPOs 5-10 years after fund founding variable in most specifications. We use the IPO timing ratio in a separate two-stage model that first removes its effect on other variables. In the first-stage regression, we create a set of instrumental variables for each of our model variables y, dependent or independent. These instrumental variables arise as residuals from a first-stage regression against an IPO timing ratio (TR) for each fund i:
y i ^ p { T R , ) + £ i (3)
Fund liquidation year is the year in which the fund has distributed all its cash and possible remaining investments back to the limited partners. Fund founding year is the year of the first capital takedown. Fund lifetime is the difference of liquidation and vintage year, expressed in years.
rV. Empirical resultsThe following section presents descriptive statistics for fund types, exit types, and
exit rates, and proceeds with an analysis of the determinants of the exit rate.
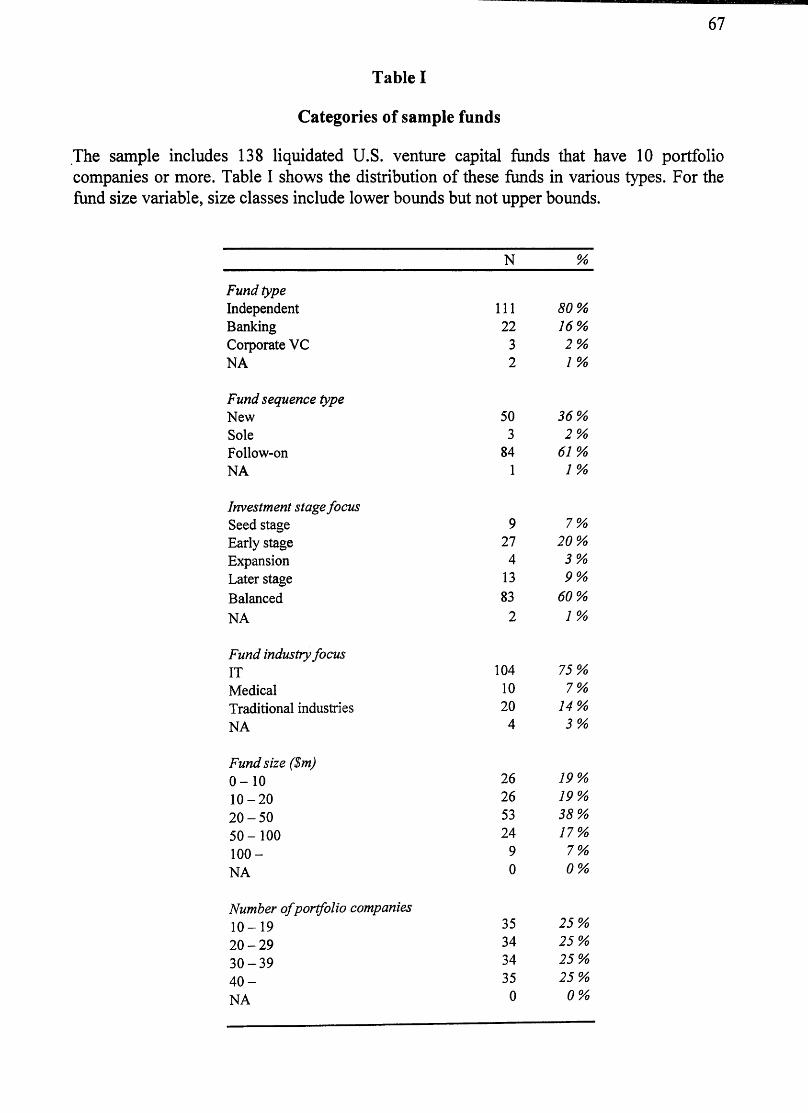
A. Descriptive statisticsTable I shows the distribution of sample fimds into various types and categories.
Independent venture capitalists form the majority among fund types. There are only few corporate venture capitalists, which restricts our examination of the compensation - performance relation. When sorted by investment stage, more than half of the sample are balanced funds. Funds focusing on IT companies dominate the sample, which is to be expected given the fast growth of high technology in the past decades.
Table II presents further descriptive statistics on the sample funds. The average number of portfolio companies is found to be 33. Fund size and especially firm capital under management show considerable variation. The smallest firm only manages $5 million while the biggest has a respectful $10.9 billion under management.
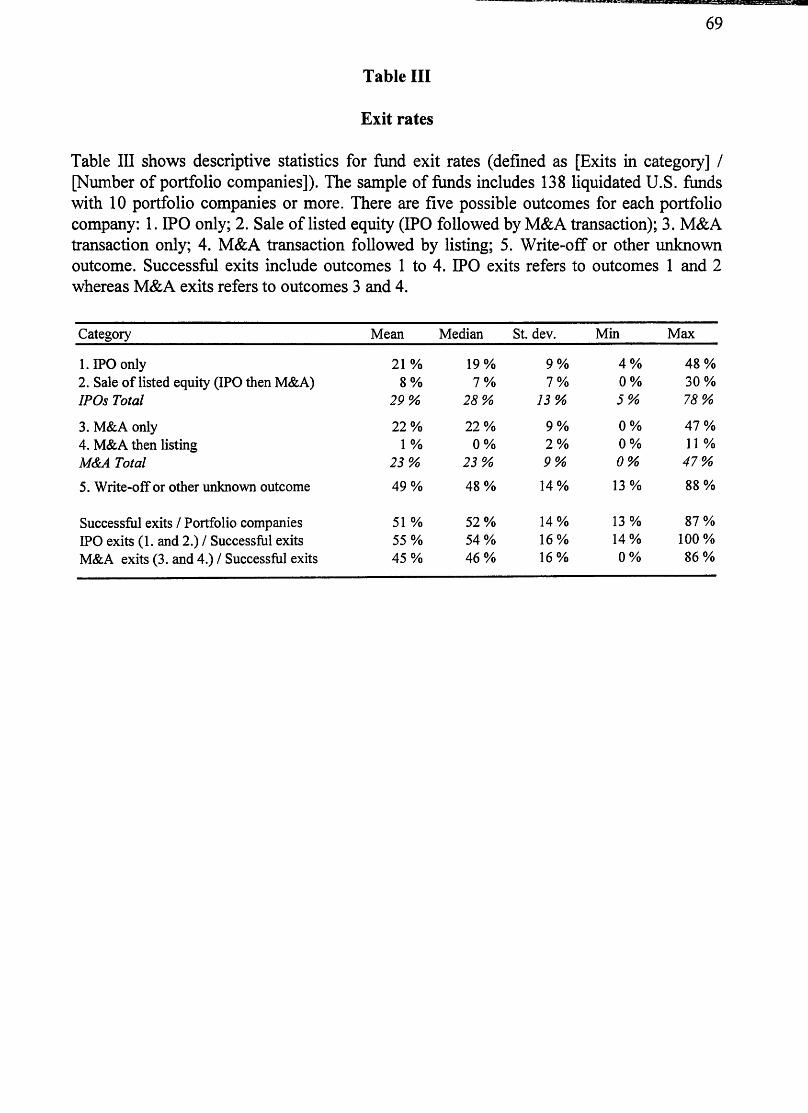
Table III shows descriptive statistics of exit rates by fund type. On average, the funds studied manage to take public 29% of their portfolio companies. The median is slightly
62
lower at 28% as the distribution is skewed to the right. This figure includes 7% of companies that are sold in takeovers following the listing. The average fund sells 23% of its portfolio companies through M&A transactions.
These results are relatively well in line with Schwienbacher’s (2002) survey. IPOs and sales of listed equity total 29% in our study versus 30% for Schwienbacher; M&A exits are 23% and 30% respectively. The proportion of write-offs or other unknown outcomes is higher in our study (49% vs. 33%). This is not surprising given that our long term, large sample methodology is bound to miss some exits due to limitations on data availability. Our exit figures should therefore be interpreted as conservative, especially for trade sale exits. We are, however, also well in line with Lemer’s (1994) figures that over the last two decades, 30 percent of the firms backed by venture capitalists have gone public. Over half of our funds have an IPO exit rate between 20% and 40%, while almost 90% of our funds fall between 10% and 50%.
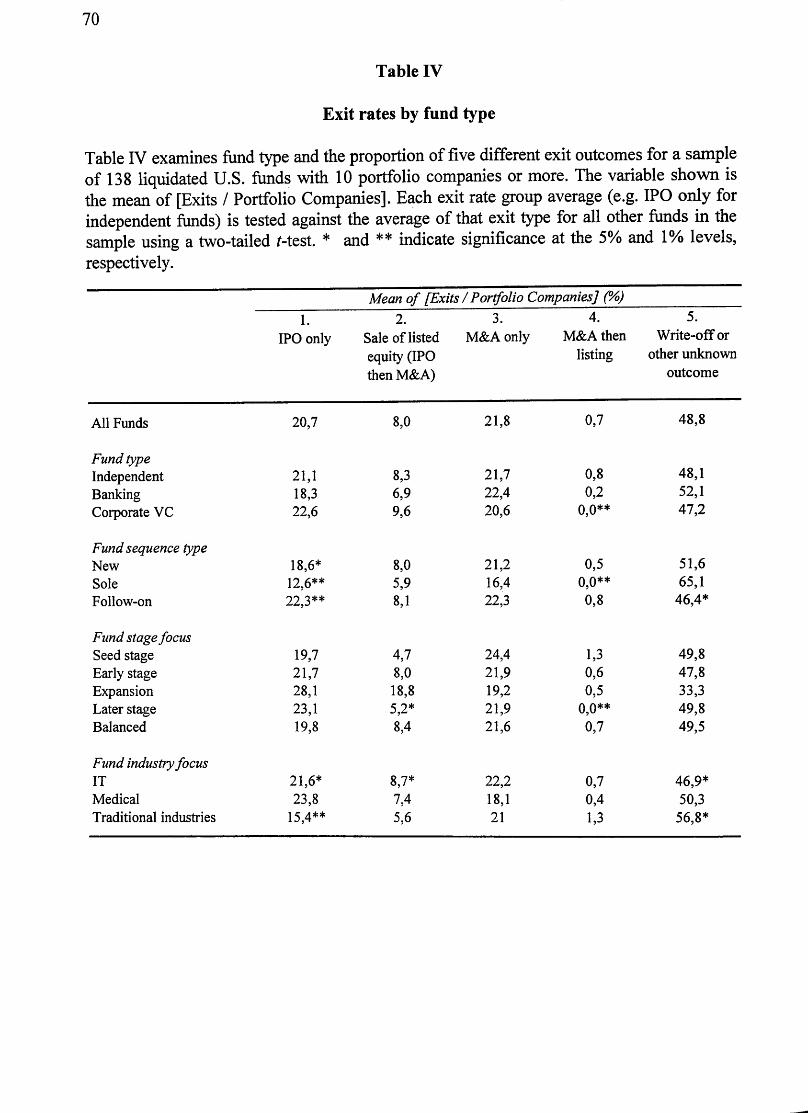
Table IV shows the rates of the five possible outcomes against various fund types and shows univariate Mests for differences. Each exit rate group average (e.g. IPO only for independent funds) is tested against the average of that exit type for all other fimds in the sample. At conventional levels of significance, we notice that follow-on funds have higher than average IPO exit rates while new and particularly sole funds are below average in this respect. We also notice that IT focused funds have higher than average IPO exit rates while funds with a traditional industry focus place lower than average. For some groups of funds, such as expansion stage funds and medical focus funds, differences in exit rates seem marked, but statistical significance is low due to the small number of observations in those groups. Table V reports cross-correlations for variables used in this study.
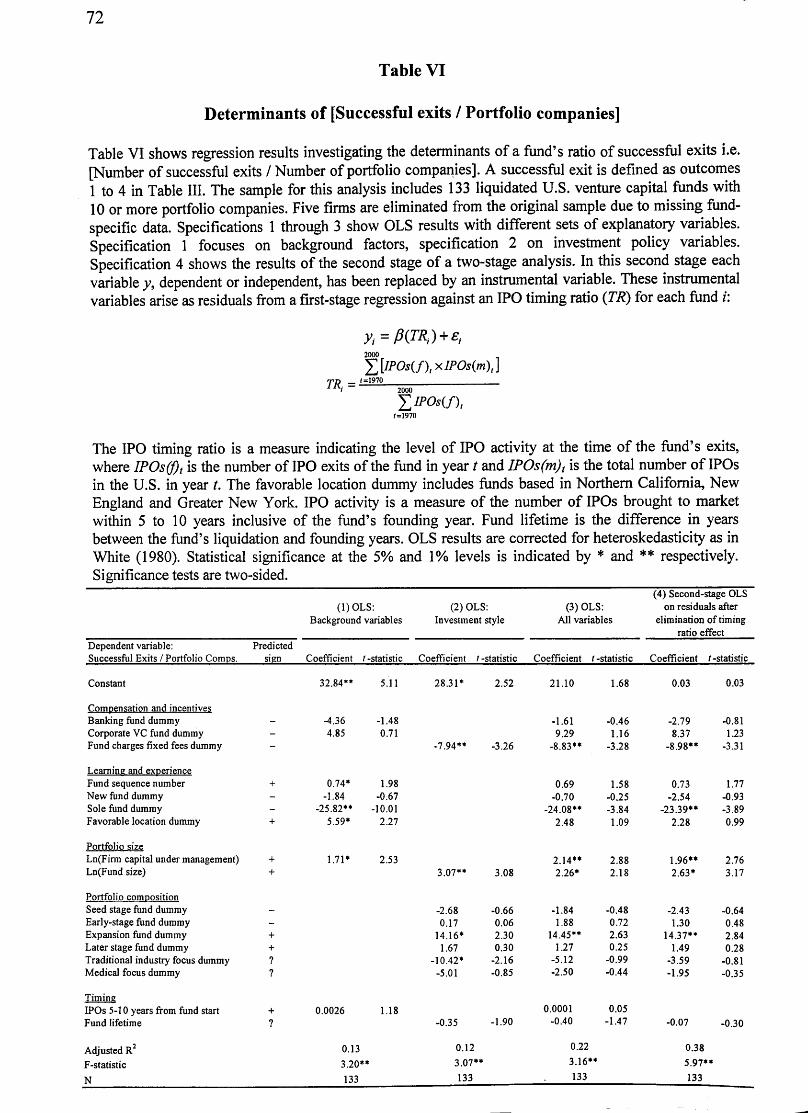
B. Determinants of the exit rateThe determinants of the exit rate are examined in a regression fi'amework using three
different OLS specifications and a two-stage analysis based on the IPO timing ratio. Table VI shows these results. Specification 1 focuses on fund background variables and specification 2 on investment style. Specification 3 includes all variables and specification 4 is the second stage of a two stage analysis as described in section III. There is no need for a Tobit regression in this case, since there are no observations at or near the truncation points of 0 and 100%. Due to lack of full data for 5 funds, there are a total of 133 observations. The OLS r-values reported are heteroskedasticity consistent as in White (1980).
As robustness checks, we analyze subsamples excluding outliers. Outliers are defined as funds with an exit rate below 25% or over 75%. There are eight such cases. Excluding these outliers does not change our results.
Comvensation and incentivesThe banking dummy has a negative and the corporate VC dummy a positive impact
on IPO exit rate. Independent funds act as benchmark and have no dummy. The results, however, are not significant at conventional levels and the number of these observations is quite low.
Barry (1994) states that bank-affiliated venture capitalists are often more conservative in their strategy than independent VCs which should affect risk and return. In fact, the data show that five of 22 banking funds (23%) have a traditional industry focus, against only 14% for independent and 0% for corporate venture capitalists.
The dummy for funds charging fixed fees from portfolio companies has, as expected, a negative and significant coefficient. If the participation percentage under these schemes is in fact, lower for funds charging fees (but we have no data on this), the result supports the idea that funds which only rely on investment performance have a stronger exit orientation.

63
Learnim and exverienceFund sequence number has the expected positive coefficient, but is not consistently
significant across specifications. Against a benchmark of follow-on funds, dummies for new fund and sole fund obtain coefficients of the expected negative sign. The sole fund dummy is in fact a highly significant negative determinant of the exit rate. For sole funds, there may be a process of natural selection going on. New funds that perform poorly make it harder for their managers to raise follow-on funds.
Another learning-related hypothesis investigated is that it may be easier to achieve successful exits in locations geographically close to a population of innovative firms and/or major financial centers. The favorable location dummy used gets a value of 1 for funds located in Northern California, New England and Greater New York and 0 otherwise. We find the expected positive sign but the significance of the result depends on the specification.
As an imreported robustness check related to learning, we perform an analysis of performance persistence within our sample. We take all funds which have follow-up funds, divide both the prior fund and the follow-up fund into three performance classes, and perform chi-squared tests to measure persistence. We only have 34 usable fund pairs and do not find results significant at conventional levels. There is, however, modest evidence of persistence among the funds with lower exit rates, possibly due to a similar investment strategy that is being followed.
We also examine whether there is performance persistence in a sequence of funds. Whether winners stay winners and losers stay losers has been studied especially in the mutual fund literature (see e.g. Carhart, 1997).
Portfolio sizeThe fund management firm’s log capital under management has, as expected, a
positive effect on the exit rate. The result is statistically significant at a 1% level when all variables are included. The finding provides support for the hypothesis that more reputable, and thus larger management firms benefit from their track record and influence in terms of exit success.
For log fund size we find the expected positive coefficients significant at the 5% level when all variables are included. This provides some support for Sahlman’s (1990) idea that larger funds should perform better as they are able to invest in a wider universe of potential portfolio companies.
Portfolio compositionDummies for seed stage, early-stage, expansion, and later stage funds act as control
variables. Balanced funds are the benchmark for the regression. The hypothesis is that funds investing in later stage firms should have a higher success rate than early stage investors, as more is known about the company. While the seed stage dummy is negative as expected, and all later stages positive, the expansion stage fund dummy is the only one that comes out significant at conventional levels.
The dummies for traditional industry focus and medical focus have negative coefficients. As opposed to the univariate tests, the significance of the finding is low also for traditional industry focus and depends on the specification.
TiminsThe variable IPOs 5-10 years from fund start is positive, as expected, fund
lifetime negative, but neither is significant at conventional levels. As described in section III, we use a specific IPO timing ratio in a two-stage analysis. The first stage computed new instrumental variables, obtained as residuals from a regression of each variable against the IPO timing ratio. Second-stage results are reported in specification 4 of Table VI. The
64
results are very much in line with the other specifications. This supports the idea that our results are robust to endogeneity caused by IPO timing ability.
V. ConclusionThis study investigates venture capital exit rates (a proxy of fund performance), the
proportions of different exit routes, as well as fund level variables that affect exit success. We create a new sample of 138 U.S. venture capital funds, all liquidated between 1990 and 2000 and all with 10 portfolio companies or more. These fimds had 4,549 portfolio companies. The median fund in our sample exited 19% of its portfolio companies through an IPO, 7% through a sale of Usted equity, and 23% through an M&A transaction, but there is significant variation across funds.
An empirical examination of the determinants of exit rates reveals the following facts. Large fund management firms have significantly higher rates of exit success, perhaps due to a better reputation as quality certifiers. So do larger funds, which may have a larger investment universe than smaller firms as described in Sahlman (1990).
Sole funds, i.e. funds that receive no follow-up have significantly lower exit rates. This is probably due to reverse survivorship bias: fund managers who perform badly never get another chance. The minority of funds which report not depending fully on investment performance and charging fees from portfolio companies have significantly lower exit rates. Finally, the stage and industry focus of the fund seem to matter less than thought, although expansion stage funds had larger exit rates in this sample.
65
R e f e r e n c e s
Barry, C. B., 1994, New directions in research on venture capital finance, Financial Management 23(31 3-15.
Black, B. S., Gilson R.J., 1998, Venture capital and the structure of capital markets: banks versus stock markets, Journal of Financial Economics 47,243-277.
Black, B. S., Gilson, R. J., 1999, Does venture capital require an active stock market? Journal of Applied Corporate Finance 11(4), 36-48.
Brav, A., Gompers, P. A., 1997, Myth or reality? The long-run underperformance of initial public offerings: evidence from venture and nonventure capital-backed companies, The Journal of Finance 52. 1791-1821.
Bygrave, W. E., Fast, N., Khoylian, R., Vincent, L., Yue, W., 1989, Early rates of return of 131 venture capital funds started 1978 - 1984, Journal of Business Venturing 4, 93- 105.
Carhart, M., 1997, On persistence in mutual fund performance, Journal of Finance 52, 57- 82.
Chiampou, G. F., Kallett, J. J., 1989, Risk/return profile of venture capital, Journal of Business Venturing 4, 1-10.
Cochrane, J., 2004, The risk and return of venture capital, Journal of Financial Economics, forthcoming.
Cumming. D.J., 2002, Contracts and exits in venture capital finance. Unpublished working paper, University of Alberta.
Cumming, D. J., Macintosh, J. G., 2003, A cross-country comparison of full and partial venture capital exits, Journal of Banking and Finance 27, 511-548.
Dubil, R., 2002, Optimal liquidation of venture capital stakes. The Journal of Entrepreneurial Finance and Business Ventures 7(2), 65-81.
Gompers P. A., Lemer, J., 1997, Risk and reward in private equity investments: the challenge of performance assessment, The Journal of Private Equity, 5-12.
Gompers, P. A., Lemer, J., 1998, The determinants of corporate venture capital success: organizational structure, incentives and complementarities, NBER working paper no. 6725.
Gompers, P. A., Lemer, J., 1999a. The Venture Capital Cycle (The MIT Press, Cambridge).
Gompers, P. A., Lemer, J., 1999b, An analysis of compensation in the U.S. venture capital partnership, Joumal of Financial Economics 51, 3-44.
66
Huntsman, B., Hoban, J. P., 1980, Investment in new enterprise: some empirical observations on risk, return, and market structure, Financial Management 9(2), 44- 51.
Ibbotson, R. G., Brinson, G. P., 1987. Investment Markets (McGraw-Hill, New York).
Kleiman, R. T, Shulman, J. M., 1992, The risk-retum attributes of publicly traded venture capital: implications for investors and public policy. Journal of Business Venturing 7, 195-208.
Lemer, J., 1994, Venture capitalists and the decision to go public, Journal of Financial Economics 35, 293-316.
Martin, J. D., Petty, J. W., 1983, An analysis of the performance of publicly traded venture capital companies. Journal of Financial and Quantitative Analvsis 18, 401-410.
Megginson, W. L., Weiss, K. A., 1991, Venture capitalist certification in initial public offerings. Journal of Finance 46, 879-903.
Robb, A. M., 2002, Small business financing: Differences between young and old firms, Journal of Entrepreneurial Finance and Business Ventures 7(2), 45-65.
Sahlman, W., 1990, The structure and governance of venture capital organizations. Journal of Financial Economics 27, 473-524.
Schilit, W. K., 1993, A comparative analysis of the performance of venture capital fimds, stocks and bonds, and other investment opportunities. International Review of Strategic Management 4, 301-320.
Schwienbacher, A., 2002, An empirical analysis of venture capital exits in Europe and in the United States, Unpublished working paper. University of Namur, (available at http://papers.ssm.com/sol3/papers.cfm?abstract_id=302001)
Smith J. K., Smith R. L., 2000. Entrepreneurial Finance (John Wiley & Sons, New York).
White, H., 1980, A heteroskedasticity-consistent covariance matrix estimator and a direct test for heteroskedasticity, Econometrica 48, 817-838.
Wright, M., Robbie, K., 1998, Venture capital and private equity: a review and synthesis. Journal of Business Finance & Accounting 25, 521-570.
67
Categories of sample funds
The sample includes 138 liquidated U.S. venture capital funds that have 10 portfolio companies or more. Table I shows the distribution of these funds in various types. For the fund size variable, size classes include lower bounds but not upper bounds.
Table I
N %
Fund typeIndependent 111 80%Banking 22 16%Corporate VC 3 2%NA 2 1 %
Fund sequence typeNew 50 36%Sole 3 2%Follow-on 84 61%NA 1 1%
Investment stage focusSeed stage 9 7%Early stage 27 20%Expansion 4 3%Later stage 13 9%
Balanced 83 60%
NA 2 1 %
Fund industry focusIT 104 75%
Medical 10 7%
Traditional industries 20 14%
NA 4 3%
Fund size ($m)0 - 1 0 26 19%
1 0 -2 0 26 19%
2 0 - 5 0 53 38%
5 0 -1 0 0 24 17%
1 0 0 - 9 7%
NA 0 0%
Number of portfolio companies1 0 -1 9 35 25%
2 0 - 2 9 34 25%
3 0 - 3 9 34 25%
4 0 - 35 25%
NA 0 0%

68
Table II
Descriptive statistics on sample funds
Table II reports the mean, median, standard deviation, minimum, and maximum for several descriptive variables for 138 liquidated U.S. venture capital funds with 10 portfolio companies or more. Firm capital under management includes all funds managed by the same venture capital firm. Fund sequence number is the chronological number of the fund within a venture capital firm, e.g.
Mean Median St. dev. Min Max
Number of portfolio companies 33 30 20 10 157Firm capital under management ($m) 1,065 373 2,076 5 10,857Fund size ($m) 36.3 25.7 38.4 1.0 284.3Fund sequence number 2.7 2.0 2.6 1 16Fund lifetime (years) 15.4 15.0 4.3 8.0 37
two for the firm’s second fund.
69
Table III
Exit rates
Table III shows descriptive statistics for fund exit rates (defined as [Exits in category] / [Number of portfolio companies]). The sample of funds includes 138 liquidated U.S. funds with 10 portfolio companies or more. There are five possible outcomes for each portfolio company: 1. IPO only; 2. Sale of listed equity (IPO followed by M&A transaction); 3. M&A transaction only; 4. M&A transaction followed by listing; 5. Write-off or other unknown outcome. Successful exits include outcomes 1 to 4. IPO exits refers to outcomes 1 and 2 whereas M&A exits refers to outcomes 3 and 4.
Category Mean Median St. dev. Min Max
1. IPO only 21 % 19% 9% 4% 48%2. Sale o f listed equity (IPO then M&A) 8% 7% 7% 0% 30%IPOs Total 29% 28% 13% 5% 78%
3. M&A only 22% 22% 9% 0% 47%4. M&A then listing 1% 0% 2% 0% 11 %M&A Total 23% 23% 9% 0% 47%
5. Write-off or other unknown outcome 49% 48% 14% 13% 88%
Successful exits / Portfolio companies 51 % 52% 14% 13% 87%
IPO exits (1. and 2.) / Successful exits 55% 54% 16% 14% 100%
M&A exits (3. and 4.) / Successful exits 45% 46% 16% 0% 86%
70
Table IV
Exit rates by fund type
Table IV examines fund type and the proportion of five different exit outcomes for a sample of 138 liquidated U.S. funds with 10 portfolio companies or more. The variable shown is the mean of [Exits / Portfolio Companies]. Each exit rate group average (e.g. IPO only for independent funds) is tested against the average of that exit tjpe for all other funds in the sample using a two-tailed Mest. * and ** indicate significance at the 5% and 1% levels, respectively.
Mean of [Exits / Portfolio Companies] (%)
1.IPO only
2.Sale of listed
equity (IPO then M&A)
3.M&A only
4.M&A then
listing
5.Write-off or
other unknown
outcome
All Funds 20,7 8,0 21,8 0,7 48,8
Fund typeIndependent 21,1 8,3 21,7 0,8 48,1
Banking 18,3 6,9 22,4 0,2 52,1
Corporate VC 22,6 9,6 20,6 0,0** 47,2
Fund sequence typeNew 18,6* 8,0 21,2 0,5 51,6
Sole 12,6** 5,9 16,4 0,0** 65,1
Follow-on 22,3** 8,1 22,3 0,8 46,4*
Fund stage focusSeed stage 19,7 4,7 24,4 1,3 49,8Early stage 21,7 8,0 21,9 0,6 47,8Expansion 28,1 18,8 19,2 0,5 33,3Later stage 23,1 5,2* 21,9 0,0** 49,8Balanced 19,8 8,4 21,6 0,7 49,5
Fund industry focusIT 21,6* 8,7* 22,2 0,7 46,9*Medical 23,8 7,4 18,1 0,4 50,3Traditional industries 15,4** 5,6 21 1,3 56,8*

71
Table V
Cross-correlations
Table V shows Pearson correlation coefficients between some of the key variables used. IPO exits include outcomes 1 and 2 and M&A exits outcomes 3 and 4 from Table III. Variables are defined similarly as in Table V. Statistical significance at the 5% and 1% levels is indicated by * and ** respectively. Significance tests are two-sided.
(1) (2) (3) (4) (5) (6) (7) (8) (9)(1) Sucessful exits / Portfolio cos 1.00**(2) IPO exits / Successful exits 0.24** 1.00**(3) M&A exits / Successful exits -0.24** -1.00** 1.00**(4) Fund sequence number 0.25** 0.10 -0.10 1.00**(5) Ln(C^. under management) 0.29** 0.20* -0.20* 0.21* 1.00**(6) Ln(Fund size) 0.21* 0.04 -0.04 -0.10 0.27** 1.00**(7) Ln(Average investment) 0.20* -0.01 0.01 -0.14 0.16 0.84** 1.00**(8) IPOs 5-10 years from founding 0.10 -0.06 0.06 0.09 -0.14 0.07 0.19* 1.00**(9) Fund lifetime -0.10 0.11 -0.11 -0.19* 0.16 -0.06 -0.24** -0.57** 1.00**
72
Table VI
Determinants of [Successful exits / Portfolio companies]
Table VI shows regression results investigating the determinants of a fund’s ratio of successful exits i.e. [Number of successful exits / Number of portfolio companies]. A successful exit is defined as outcomes 1 to 4 in Table III. The sample for this analysis includes 133 liquidated U.S. venture capital funds with 10 or more portfolio companies. Five firms are eliminated from the original sample due to missing fund- specific data. Specifications 1 through 3 show OLS results with different sets of explanatory variables. Specification 1 focuses on background factors, specification 2 on investment policy variables. Specification 4 shows the results of the second stage of a two-stage analysis. In this second stage each variable y, dependent or independent, has been replaced by an instrumental variable. These instrumental variables arise as residuals from a first-stage regression against an IPO timing ratio (TR) for each fund /:
2000
Y\lPOs(f),>^IPOs{m),]_ (=1970TR, =
The IPO timing ratio is a measure indicating the level of IPO activity at the time of the fund’s exits, where IPOs(f)t is the number of IPO exits of the fund in year t and IPOs(m)t is the total number o f IPOs in the U.S. in year t. The favorable location dummy includes funds based in Northern California, New England and Greater New York. IPO activity is a measure of the number of IPOs brought to market within 5 to 10 years inclusive of the fund’s founding year. Fund lifetime is the difference in years between the fund’s liquidation and founding years. OLS results are corrected for heteroskedasticity as in White (1980). Statistical significance at the 5% and 1% levels is indicated by * and ** respectively. Significance tests are two-sided.
( l )O L S :
Background variables
(2) OLS:
Investment style
(3) OLS:
All variables
(4) Second-stage OLS
on residuals after
elimination o f timing
ratio effect
Dependent variable: Predicted
Successful Exits / Portfolio Comps. sign Coefficient /-statistic Coefficient 1- statistic Coefficient f-statistic Coefficient r-statistic
Constant 32.84*» 5.11 28.31* 2.52 21.10 1.68 0.03 0.03
Compeiisatipn and incentivesBanking fund dummy - -4.36 -1.48 -1.61 -0.46 -2.79 -0.81Corporate VC fund dummy - 4.85 0.71 9.29 1.16 8.37 1.23Fund charges fixed fees dummy - -7.94** -3.26 -8.83** -3.28 -8.98** -3.31
Learning and exoerience
Fund sequence number + 0.74* 1.98 0.69 1.58 0.73 1.77N ew fund dummy - -1.84 -0.67 -0.70 -0.25 -2.54 -0.93Sole fund dummy - -25.82** ■10.01 -24.08** -3.84 -23.39** -3.89Favorable location dummy + 5.59* 2.27 2.48 1.09 2.28 0.99
Portfolio size
Ln(Firm capital under management) + 1.71* 2.53 2.14** 2.88 1.96** 2.76Ln(Fund size) + 3.07** 3.08 2.26* 2.18 2.63* 3.17
Portfolio composition
Seed stage fund dummy - -2.68 -0.66 -1.84 -0.48 -2.43 -0.64Early-stage fund dummy - 0.17 0.06 1.88 0.72 1.30 0.48Expansion fund dummy + 14.16* 2.30 14.45** 2.63 14.37** 2.84Later stage fund dummy + 1.67 0.30 1.27 0.25 1.49 0.28Traditional industry focus dummy ? -10.42* -2.16 -5.12 -0.99 -3.59 -0.81Medical focus dummy ? -5.01 -0.85 -2.50 -0.44 -1.95 -0.35
Timing
IPOs 5-10 years from fund start + 0.0026 1.18 0.0001 0.05
Fund lifetime 7 -0.35 -1.90 -0.40 -1.47 -0.07 -0.30
Adjusted 0.13 0.12 0.22 0.38
F-statistic 3.20** 3.07** 3.16** 5.97**
N 133 133 133 133

73
Figure 1
The distribution of successful exits
Successful exits in portfolio
Figure 1 shows a histogram of the rate of successful exits, defined as [Number of successful exits / Number of portfolio companies]. The sample includes 138 liquidated U.S. venture capital funds that have 10 portfolio companies or more. The definition of successful exit includes four classes of exits (outcomes 1 to 4) in Table 3. These are IPO only, sale of listed equity, M&A transaction only, and M&A transaction followed by listing. The histogram classes include lower but not upper bounds.
