the expression of the high-mobility group a2 protein in colorectal cancer and surrounding...
TRANSCRIPT

www.elsevier.com/locate/humpath
Human Pathology (2013) 44, 122–132
Original contribution
The expression of the high-mobility group A2 protein incolorectal cancer and surrounding fibroblasts is linked totumor invasiveness☆,☆☆
Claudio Rizzi a, Palmina Cataldi a, Aldo Iop a, Miriam Isola b, Riccardo Sgarra c,Guidalberto Manfioletti c, Vincenzo Giancotti c,d,⁎
aHealth Service Company ASS 5 “Bassa Friulana,” S.O.S Pathologic Anatomy and Histology and S.O.C. Oncology,Palmanova Hospital, 33057 Palmanova, Udine, ItalybDepartment of Medical, Experimental and Clinic Sciences, University of Udine, 33100 Udine, ItalycDepartment of Life Sciences, via L. Giorgieri 1, University of Trieste, 34100 Trieste, ItalydTrieste Protein Researches, via Manin 13, 33057 Palmanova, Udine, Italy
Received 16 February 2012; revised 3 May 2012; accepted 4 May 2012
“oR(G
T
0h
Keywords:Colorectal cancer;High-mobility groupprotein A2;
Immunohistochemistry;Vascular invasion;Budding;Stromal fibroblasts
Summary Tumor staging of colorectal cancer is typically based on conventional TNM and Dukesclassifications. However, additional information could be useful, and there is a significant interest inidentifying molecular markers that are related to genetic or epigenetic processes. Using immunohis-tochemistry, we analyzed the expression of the high-mobility group A2 (previously high-mobility group1-C [HMGI-C]) protein in 103 colorectal cancer cases to determine its use as a biomarker in colorectalcancer to integrate morphological staging. We found a progressive increase of the high-mobility groupA2 protein expression in colorectal cancer tumor samples from cases in which all of the tumor cells werenegative up to cases in which all of the tumor cells stained positive. Increased high-mobility group A2expression is strongly associated with an increase in tumor invasiveness, which was measured throughboth budding and vascular invasion (P b .0001). Kaplan-Meier estimates showed a decrease in overallsurvival when vascular invasion is present (P = .023). Moreover, a fraction of the analyzed samplesshowed high-mobility group A2–positive stromal fibroblasts. Although high-mobility group A2–positive tumors were associated with cell invasiveness, high-mobility group A2–positive stromalfibroblasts were correlated with less invasive tumors. High-mobility group A2 protein expression couldbe used as a prognostic marker to provide prospective information on patient outcome, complementingthe data obtained using conventional pathologic staging systems.© 2013 Elsevier Inc. All rights reserved.
☆ Conflict of interest: The authors disclose no conflict of interest.☆☆ This work was supported by the Health Service Company, ASS 5
Bassa Friulana”, Palmanova, Udine, Italy (C. R., P. C., and A. I.); Universityf Udine, Udine, Italy (M. I.); University of Trieste, Italy,MIUR (PRIN 2009),oma, Italy; the ItalianAssociation for Cancer Research (AIRC),Milano, Italy. M.); and Trieste Protein Researches, Palmanova, Udine, Italy (V. G.).⁎ Corresponding author. Department of Life Sciences, University di
rieste, via L. Giorgieri 1-34100 Trieste, Italy.E-mail address: [email protected] (V. Giancotti).
046-8177/$ – see front matter © 2013 Elsevier Inc. All rights reserved.ttp://dx.doi.org/10.1016/j.humpath.2012.05.001
1. Introduction
Colorectal cancer (CRC) is one of the leading causes ofdeath worldwide [1,2]. Conventional CRC staging is basedmainly on tumor TNM or Dukes staging (depth of tumorinvasion, lymph node involvement, and metastasis to otherorgans) and tumor differentiation grading [3,4]. Although the
123HMGA2 protein in colorectal cancer
value of this classification is well accepted and constitutesthe principal determinant in selecting the adjuvant therapiesafter tumor resection, supplementary information is neces-sary for a considerable number of CRC cases [5,6]. Indeed, amore in-depth evaluation of the tumor tissue properties (suchas budding and vascular invasion [VI]) and analyses of thetumor microenvironment (cells and molecular factors) areoften suggested [7-12].
High-mobility group A2 (HMGA2; previously high-mobility group 1-C [HMGI-C]) could be a molecular factorthat could improve the prognostic evaluation of CRC. Thisnuclear protein is normally expressed at high levels inembryonic tissues but absent or present at very low levels inadult tissues and differentiated cells, and it is oftenreactivated in neoplastic cell lines and tumors [13,14]. TheHMGA2 protein is involved in important biologic processessuch as development [15], cell cycle regulation [16],neoplastic transformation [14], and epithelial-mesenchymaltransition [17].
The aim of this retrospective study was to evaluate theexpression levels of HMGA2 in CRC relative to knownclinicopathogic parameters. We determined that HMGA2 isa useful molecular marker in distinguishing less aggressivefrom more aggressive cases, providing an additional tool forthe clinical evaluation of the disease.
2. Materials and methods
2.1. Patients and immunohistochemical analysis
A total of 103 patients diagnosed with a primary CRCbetween 2000 and 2003 at Palmanova Hospital (Udine, Italy)were selected for this retrospective study. In all of the cases,hematoxylin-stained slides were obtained together withclinicopathologic parameters at the surgical removal of thetumor. For each patient, the following data were collected:sex, age, TNM classification, Dukes staging, differentiationgrading, and therapy after surgery. Patient outcome wasevaluated as the number of months of survival from the dateof tumor resection up to April 2011. The 5- and 7-yearsurvivals after surgery were also calculated. None of thepatients received any neoadjuvant therapy before the surgicalremoval of the primary tumor. Cases of familial adenomatouspolyposis and hereditary nonpolyposis CRC were excluded.
Formalin-fixed, paraffin-embedded specimens of tumorswere cut into 4-μm sections, and immunohistochemicalanalyses were performed using a rabbit polyclonal antibodyagainst the recombinant HMGA2 protein. TheMDA-MB-231cell linewas used as a negative control for HMGA2 expressionand HepG2 (hepatocellular G2) cells, and 12.5-day-old mouseembryos were used as positive controls [15,18].
Samples were immunoanalyzed in a Ventana (Tucson,AZ) automated instrument (MU-750-800 assay, VmsBenchmark Stain), and diaminobenzidine nuclear staining
was evaluated under an optic microscope. The level ofHMGA2 expression in the tumor cell nuclei and surroundingfibroblasts was evaluated in 3-5 immunostained slides foreach of the 103 cases. The presence of VI (lymph node andblood vessels together were considered) was firstly evaluatedby surveying 4-7 hematoxylin-stained slides for each of the103 cases. The cases that showed budding or vessel invasionwere further analyzed by HMGA2 immunohistochemistry.Approximately 1000 slides were evaluated. We used a 5%negative/positive cutoff for negative HMGA2 nuclearexpression; however, higher cutoffs have been reported inthe literature (10% and 20%) [19,20], and when aprogressive expression is studied, intermediate cutoffs areassumed, as we report in this work (see Table 1) [7,19-22]. Insome calculations (see fibroblast results), the negativeHMGA2 expression cases did not include low-expressionpositive cases (actually negatives) [21,23]. However, theresults were consistent with those obtained using the 5%cutoff. Immunohistochemical slides were imaged by a Leicamicrosystem DM 3000 (CH-9435 Heerbrugg, Switzerland)supplied with a data application suite. Two pathologists (C.R. and P. C.) performed microscopic observations indepen-dently and agreed on the final conclusions.
2.2. Statistical analysis
Categorical data are presented as frequencies andpercentages. For continuous data, the mean and SD ormedian and range were calculated. The Shapiro-Wilk testwas used to test for normal distribution. Comparisons ofcontinuous variables were performed with the t test or Mann-Whitney U test, depending on the Shapiro-Wilk test results.χ2 Tests were used to analyze categorical values; whenassumptions for the χ2 test were not verified, Fisher exacttest was used. P b .050 was considered to be significant.Overall survival (OS) is graphically presented in Kaplan-Meier curves; the differences in OS between groups weretested with the log-rank test [24].
3. Results
3.1. The expression of the HMGA2 protein inCRC and its relationship with clinicopathologicparameters
Each of the 103 enrolled patients was scored for age, sex,survival, HMGA2 tumor expression, TNM classification,Dukes staging, differentiation grading, budding, VI,HMGA2 stromal fibroblast positivity, and therapy, produc-ing a numerical table composed of 103 lines and 15 columns(data not shown), and statistical analyses were carried out. Acomplete summary of the results is shown in Table 1.
The analyzed tumors showed a progressive increase of thedegree of HMGA2 positivity from cases in which no positive
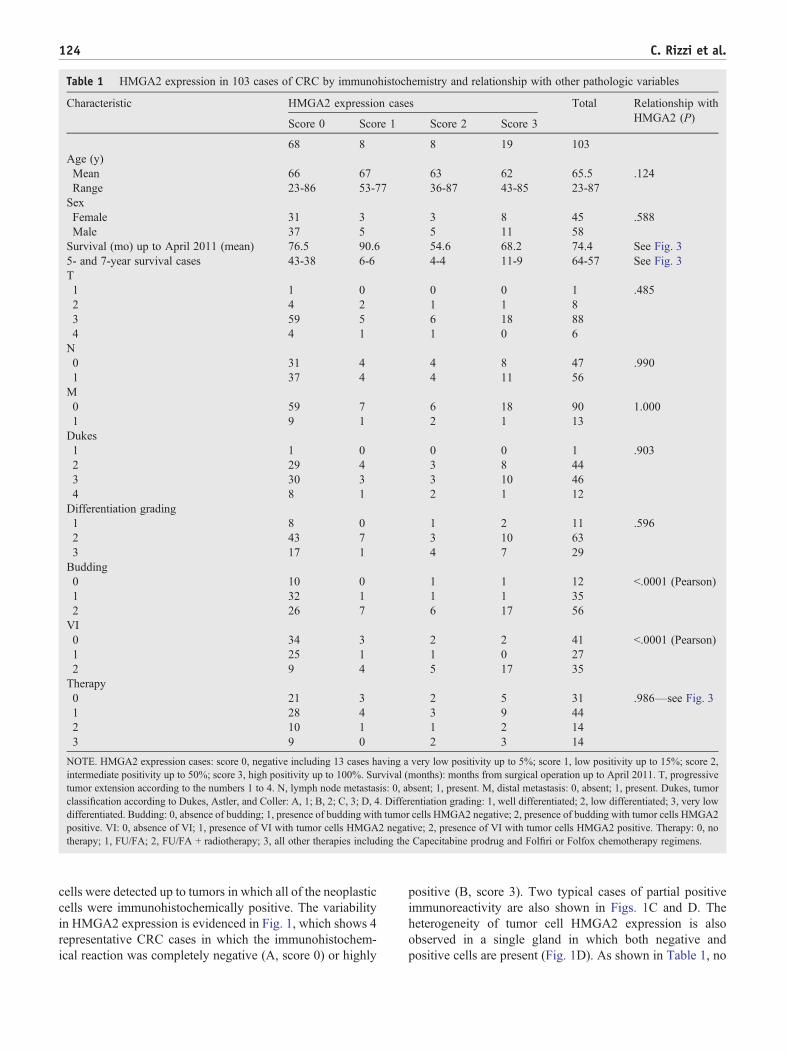
Table 1 HMGA2 expression in 103 cases of CRC by immunohistochemistry and relationship with other pathologic variables
Characteristic HMGA2 expression cases Total Relationship withHMGA2 (P)Score 0 Score 1 Score 2 Score 3
68 8 8 19 103Age (y)Mean 66 67 63 62 65.5 .124Range 23-86 53-77 36-87 43-85 23-87SexFemale 31 3 3 8 45 .588Male 37 5 5 11 58Survival (mo) up to April 2011 (mean) 76.5 90.6 54.6 68.2 74.4 See Fig. 35- and 7-year survival cases 43-38 6-6 4-4 11-9 64-57 See Fig. 3T1 1 0 0 0 1 .4852 4 2 1 1 83 59 5 6 18 884 4 1 1 0 6N0 31 4 4 8 47 .9901 37 4 4 11 56M0 59 7 6 18 90 1.0001 9 1 2 1 13Dukes1 1 0 0 0 1 .9032 29 4 3 8 443 30 3 3 10 464 8 1 2 1 12Differentiation grading1 8 0 1 2 11 .5962 43 7 3 10 633 17 1 4 7 29Budding0 10 0 1 1 12 b.0001 (Pearson)1 32 1 1 1 352 26 7 6 17 56VI0 34 3 2 2 41 b.0001 (Pearson)1 25 1 1 0 272 9 4 5 17 35Therapy0 21 3 2 5 31 .986—see Fig. 31 28 4 3 9 442 10 1 1 2 143 9 0 2 3 14
NOTE. HMGA2 expression cases: score 0, negative including 13 cases having a very low positivity up to 5%; score 1, low positivity up to 15%; score 2,intermediate positivity up to 50%; score 3, high positivity up to 100%. Survival (months): months from surgical operation up to April 2011. T, progressivetumor extension according to the numbers 1 to 4. N, lymph node metastasis: 0, absent; 1, present. M, distal metastasis: 0, absent; 1, present. Dukes, tumorclassification according to Dukes, Astler, and Coller: A, 1; B, 2; C, 3; D, 4. Differentiation grading: 1, well differentiated; 2, low differentiated; 3, very lowdifferentiated. Budding: 0, absence of budding; 1, presence of budding with tumor cells HMGA2 negative; 2, presence of budding with tumor cells HMGA2positive. VI: 0, absence of VI; 1, presence of VI with tumor cells HMGA2 negative; 2, presence of VI with tumor cells HMGA2 positive. Therapy: 0, notherapy; 1, FU/FA; 2, FU/FA + radiotherapy; 3, all other therapies including the Capecitabine prodrug and Folfiri or Folfox chemotherapy regimens.
124 C. Rizzi et al.
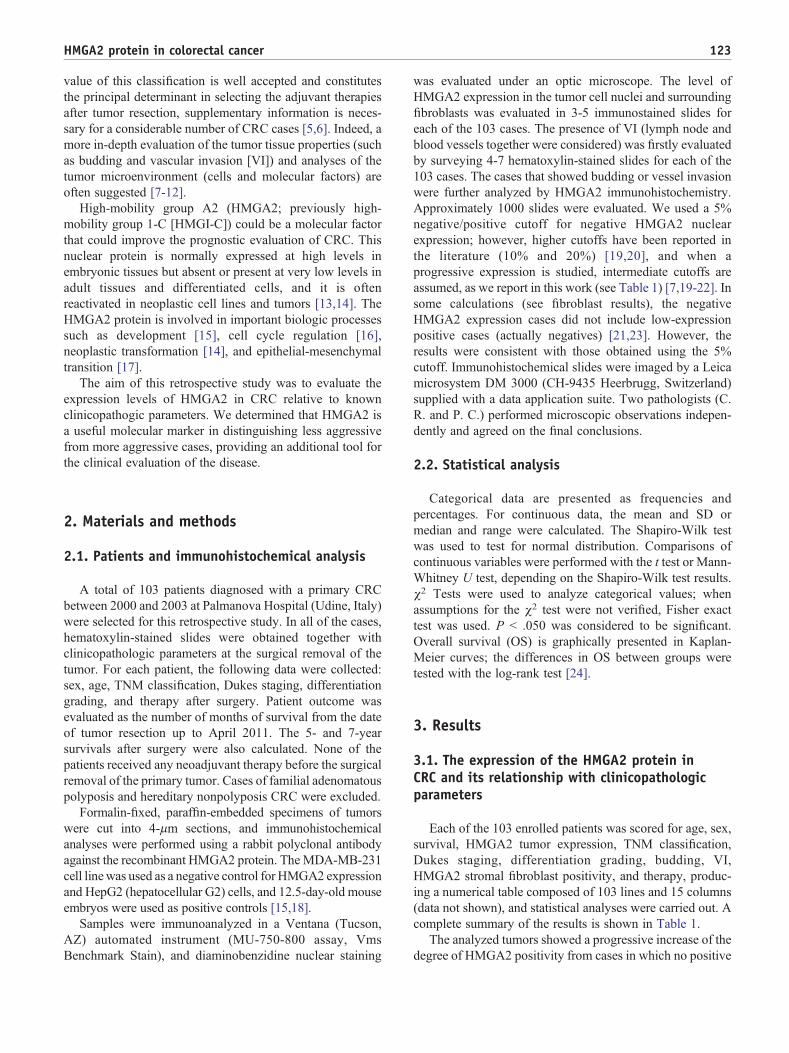
cells were detected up to tumors in which all of the neoplasticcells were immunohistochemically positive. The variabilityin HMGA2 expression is evidenced in Fig. 1, which shows 4representative CRC cases in which the immunohistochem-ical reaction was completely negative (A, score 0) or highly
positive (B, score 3). Two typical cases of partial positiveimmunoreactivity are also shown in Figs. 1C and D. Theheterogeneity of tumor cell HMGA2 expression is alsoobserved in a single gland in which both negative andpositive cells are present (Fig. 1D). As shown in Table 1, no

1 2
1 2
A B
C D
Fig. 1 Anti-HMGA2 immunohistochemical analysis of formalin-fixed, paraffin-embedded CRC samples. A, tumor with negative nuclearstaining. B, Tumor with highly positive nuclear staining. C, Partial positive immunoreactivity; arrow 1 indicates negative; arrow 2, positive. D,Partial positivity in a single gland; arrow 1 indicates negative; arrow 2, positive. Bar, 50 μm.
125HMGA2 protein in colorectal cancer
126 C. Rizzi et al.
significant associations were found between HMGA2expression and age, sex, TNM and Dukes classifications,or tumor differentiation parameters.
3.2. HMGA2 expression and tumor budding
Budding is a phenomenon by which isolated or smallclusters of cells (up to 4 or 5) acquire the ability to detachfrom the main neoplasia, leave the invasive front of a tumor,and seep into the surrounding stromal tissue [9,25]. Weevaluated budding with both hematoxylin-stained slides andimmunohistochemical analyses of tumor cells identified asinvading buds. Fig. 2 shows some examples of theseanalyses (A, HMGA2-negative budding cells; and B,HMGA2-positive budding cells). Using the scores reportedin Table 1, we found a very strong association betweenHMGA2 expression in the neoplasia and its expression inbudding cells (P b .0001). This association, as expected,demonstrates that invading buds are preferentially positivefor HMGA2 if the tumor is HMGA2 positive. However, weobserved that buds associated with completely negativetumors are sometimes HMGA2 positive, as shown inFig. 2C. In this study, 37% of HMGA2-negative neoplasiasshow HMGA2-positive buds, providing important informa-tion about the nature of the invading cells, that is,demonstrating that HMGA2 positivity is a property ofinvading cells. A comparison of budding and lymph nodestatus showed that the 2 properties are not related (P = .990).
3.3. HMGA2 expression and VI
The HMGA2 positivity of tumor cells was highlyassociated with blood and lymphatic vessels invasions inmost CRC neoplasias (P b .0001). Figs. 2D and E showexamples of vessel-invading tumor cells that are negativeand positive for HMGA2 expression, respectively. Asobserved for budding invasion, HMGA2-positive vessel-invading cells are sometimes found associated with mainneoplasias that are completely negative for HMGA2, asshown in Fig. 2F. Among cases in which main neoplasia isHMGA2 negative, 13% show HMGA2-positive vessel-invading cells. The relevance of this observation is thatalthough there are thousands of cells in the neoplasia,HMGA2 positivity is restricted to the few invasive cells.Moreover, we determined whether the level of HMGA2expression in the main neoplasia could be associated with anincrease in the level of vessel invasion, regardless of theHMGA2 positivity of invading cells. Indeed, a positiveassociation (P = .003) was observed, suggesting that elevatedlevels of HMGA2 expression in the tumor foster highervessel invasion.
Comparing vessel invasion data with nodal status (score0 or 1), the presence of tumor cells in the lymph nodes isclosely associated with the HMGA2 positivity of vessel-invading cells (P b .0001). Because Dukes staging also
includes lymph node evaluation, we determined whether anycorrelation existed between Dukes classification of the 103enrolled patients and VI. Dukes staging is stronglyassociated with total VI, including negative and positiveHMGA2 expression in invading cells (P b .0001).Consistently, VI is associated with distant metastases (P =.011). Finally, as conclusive data, HMGA2-positive vesselinvasion is also associated with HMGA2-positive budding(P b .0001). Table 2 summarizes the statistical relationshipbetween VI and the other clinicopathologic parameters.
3.4. The T3N0M0 group
There is still debate about the risk of relapse in T3N0M0
stage. Currently, few parameters are correlated with such arisk, including tumor grade, invasiveness, and the number ofevaluated lymph nodes. When one or more of these factorsare present, adjuvant chemotherapy can be considered.Recently, iron-deficient anemia has been suggested to bean independent predictor of long-term outcome in T3N0M0
[26]. In our work, 37 (36%) of the 103 cases studied wereclassified as T3N0M0. Although 37 cases constitute a smallsubgroup, statistical analyses of T3N0M0 cases alone gaveresults similar to those obtained for the entire sample set. Ofthe 103 cases, 66% show an HMGA2-negative neoplasia,and 34% have a positive neoplasia (from low up to highlevels). In the 37 T3N0M0 cases, 68% are associated with anegative neoplasia, and 32% are associated with a positiveneoplasia. This result suggests that the T3N0M0 cases havethe same distribution of HMGA2-negative and HMGA2-positive neoplasias as the entire sample. Furthermore,HMGA2 in the T3N0M0 cases is associated with budding(P = .001) and strongly associated with vessel invasion (P b.0001). As noted in all 103 cases, HMGA2 expression inmost T3N0M0 cases increases the amount of vessel invasionregardless of the HMGA2 status of the invading cells (P b.005). In conclusion, in CRC tumors, HMGA2 promotesboth budding and vessel invasion in all 103 of the cases andthe subset of T3N0M0 cases.
3.5. Tumor HMGA2 expression and patient outcome
The 103 enrolled patients received different therapiesafter surgery (Table 1). Therefore, we cannot assume thatthey are homogeneous in evaluating a relationship betweensurvival, clinicopathologic parameters, and HMGA2 expres-sion. Patients treated with 5-fluoro-uracil/folinic acid (FU/FA) constitute a sufficiently large subgroup (44 cases) that ishomogeneous with respect to drug treatment but variable forother clinicopathologic parameters (Table 1). Consideringthe aforementioned limitations, we constructed Kaplan-Meier curves on the entire patient set and the FU/FA-treatedsubgroup. In Figs. 3A and B, the survival probabilities forthe 103 cases with negative (N = 0) or positive lymph nodes(N = 1) (A) and the cases with negative (M = 0) or positive
N
PB
PI
N
D
B E
C F
A
127HMGA2 protein in colorectal cancer
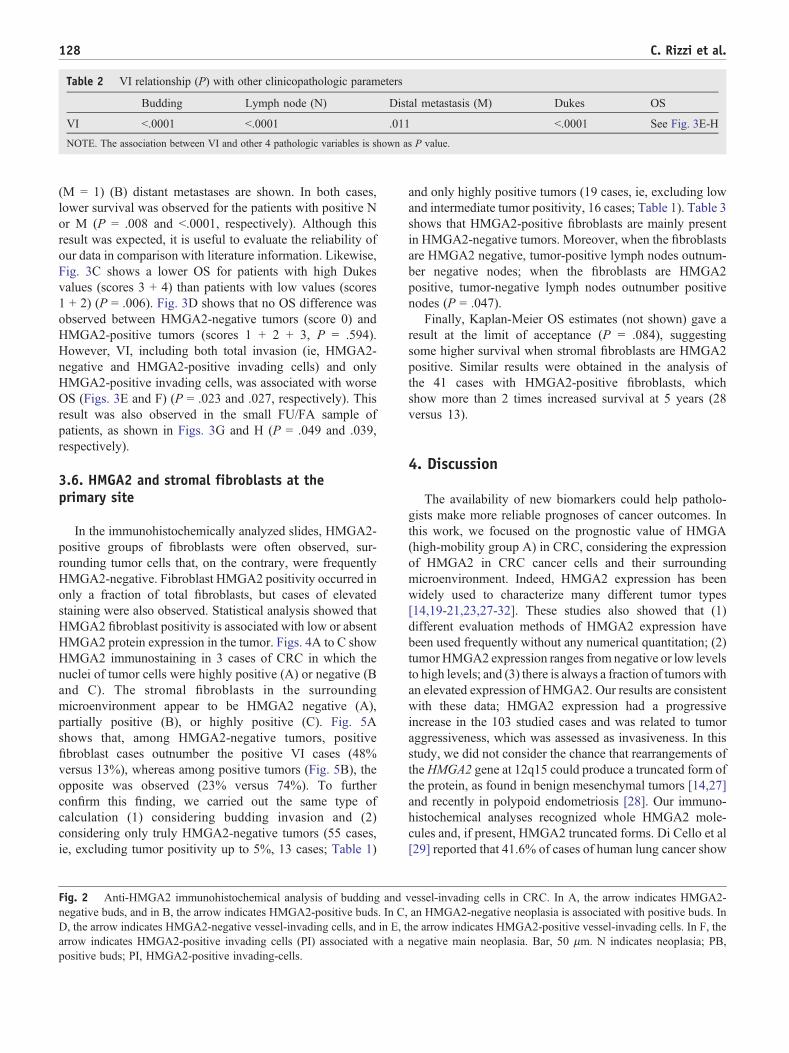
Table 2 VI relationship (P) with other clinicopathologic parameters
Budding Lymph node (N) Distal metastasis (M) Dukes OS
VI b.0001 b.0001 .011 b.0001 See Fig. 3E-H
NOTE. The association between VI and other 4 pathologic variables is shown as P value.
128 C. Rizzi et al.
(M = 1) (B) distant metastases are shown. In both cases,lower survival was observed for the patients with positive Nor M (P = .008 and b.0001, respectively). Although thisresult was expected, it is useful to evaluate the reliability ofour data in comparison with literature information. Likewise,Fig. 3C shows a lower OS for patients with high Dukesvalues (scores 3 + 4) than patients with low values (scores1 + 2) (P = .006). Fig. 3D shows that no OS difference wasobserved between HMGA2-negative tumors (score 0) andHMGA2-positive tumors (scores 1 + 2 + 3, P = .594).However, VI, including both total invasion (ie, HMGA2-negative and HMGA2-positive invading cells) and onlyHMGA2-positive invading cells, was associated with worseOS (Figs. 3E and F) (P = .023 and .027, respectively). Thisresult was also observed in the small FU/FA sample ofpatients, as shown in Figs. 3G and H (P = .049 and .039,respectively).
3.6. HMGA2 and stromal fibroblasts at theprimary site
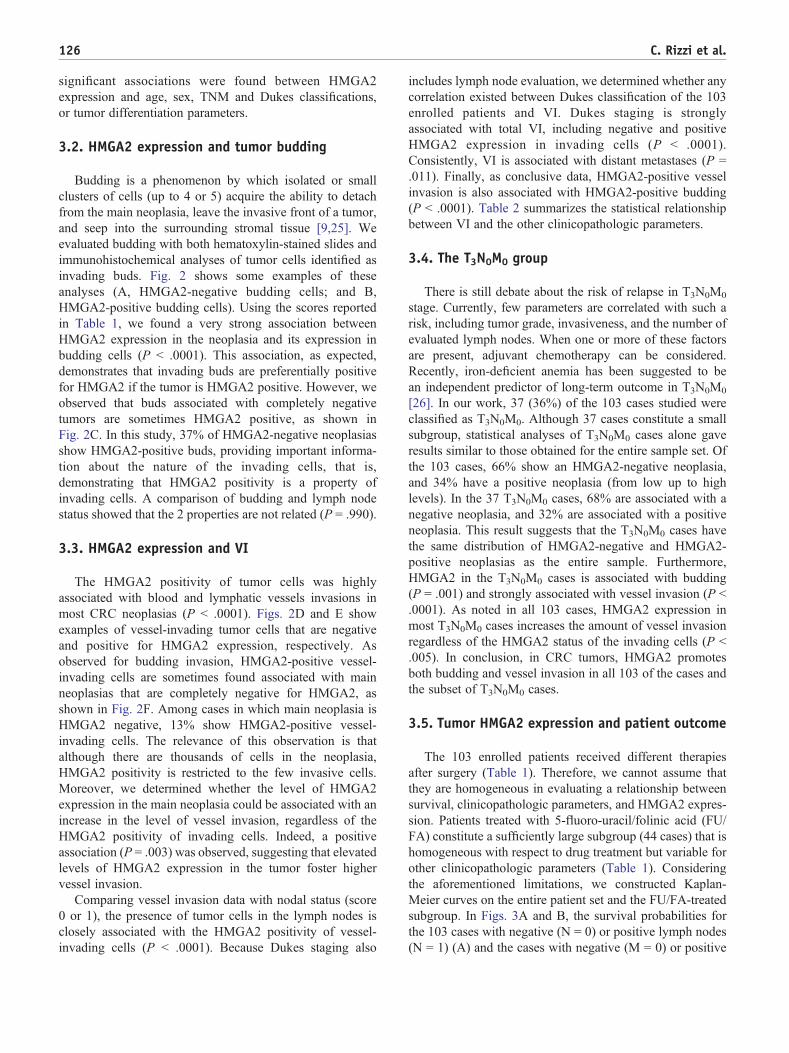
In the immunohistochemically analyzed slides, HMGA2-positive groups of fibroblasts were often observed, sur-rounding tumor cells that, on the contrary, were frequentlyHMGA2-negative. Fibroblast HMGA2 positivity occurred inonly a fraction of total fibroblasts, but cases of elevatedstaining were also observed. Statistical analysis showed thatHMGA2 fibroblast positivity is associated with low or absentHMGA2 protein expression in the tumor. Figs. 4A to C showHMGA2 immunostaining in 3 cases of CRC in which thenuclei of tumor cells were highly positive (A) or negative (Band C). The stromal fibroblasts in the surroundingmicroenvironment appear to be HMGA2 negative (A),partially positive (B), or highly positive (C). Fig. 5Ashows that, among HMGA2-negative tumors, positivefibroblast cases outnumber the positive VI cases (48%versus 13%), whereas among positive tumors (Fig. 5B), theopposite was observed (23% versus 74%). To furtherconfirm this finding, we carried out the same type ofcalculation (1) considering budding invasion and (2)considering only truly HMGA2-negative tumors (55 cases,ie, excluding tumor positivity up to 5%, 13 cases; Table 1)
Fig. 2 Anti-HMGA2 immunohistochemical analysis of budding andnegative buds, and in B, the arrow indicates HMGA2-positive buds. In CD, the arrow indicates HMGA2-negative vessel-invading cells, and in E, tarrow indicates HMGA2-positive invading cells (PI) associated with apositive buds; PI, HMGA2-positive invading-cells.
and only highly positive tumors (19 cases, ie, excluding lowand intermediate tumor positivity, 16 cases; Table 1). Table 3shows that HMGA2-positive fibroblasts are mainly presentin HMGA2-negative tumors. Moreover, when the fibroblastsare HMGA2 negative, tumor-positive lymph nodes outnum-ber negative nodes; when the fibroblasts are HMGA2positive, tumor-negative lymph nodes outnumber positivenodes (P = .047).
Finally, Kaplan-Meier OS estimates (not shown) gave aresult at the limit of acceptance (P = .084), suggestingsome higher survival when stromal fibroblasts are HMGA2positive. Similar results were obtained in the analysis ofthe 41 cases with HMGA2-positive fibroblasts, whichshow more than 2 times increased survival at 5 years (28versus 13).
4. Discussion
The availability of new biomarkers could help patholo-gists make more reliable prognoses of cancer outcomes. Inthis work, we focused on the prognostic value of HMGA(high-mobility group A) in CRC, considering the expressionof HMGA2 in CRC cancer cells and their surroundingmicroenvironment. Indeed, HMGA2 expression has beenwidely used to characterize many different tumor types[14,19-21,23,27-32]. These studies also showed that (1)different evaluation methods of HMGA2 expression havebeen used frequently without any numerical quantitation; (2)tumor HMGA2 expression ranges from negative or low levelsto high levels; and (3) there is always a fraction of tumors withan elevated expression of HMGA2. Our results are consistentwith these data; HMGA2 expression had a progressiveincrease in the 103 studied cases and was related to tumoraggressiveness, which was assessed as invasiveness. In thisstudy, we did not consider the chance that rearrangements oftheHMGA2 gene at 12q15 could produce a truncated form ofthe protein, as found in benign mesenchymal tumors [14,27]and recently in polypoid endometriosis [28]. Our immuno-histochemical analyses recognized whole HMGA2 mole-cules and, if present, HMGA2 truncated forms. Di Cello et al[29] reported that 41.6% of cases of human lung cancer show
vessel-invading cells in CRC. In A, the arrow indicates HMGA2-, an HMGA2-negative neoplasia is associated with positive buds. Inhe arrow indicates HMGA2-positive vessel-invading cells. In F, thenegative main neoplasia. Bar, 50 μm. N indicates neoplasia; PB,

1.00
0.75
0.50
0.00
0.25
0 50 100 150
N = 0
N = 1
Time from surgery date (months)
Ove
rall
Sur
viva
l (pr
obab
ility
)
Log-Rank P
1.00
0.75
0.50
0.00
0.25
0 50 100 150
N
N
Time from surgery date (months)
Ove
rall
Sur
viva
l (pr
obab
ility
)
Log-Rank P
1.00
0.75
0.50
0.00
0.25
0 50 100 150Time from surgery date (months)
Ove
rall
Sur
viva
l (pr
obab
ility
)
Log-Rank P
VI=0
VI=1+2
1.00
0.75
0.50
0.00
0.25
0 50 100 150Time from surgery date (months)
Ove
rall
Sur
viva
l (pr
obab
ility
)
Log-Rank P
1.00
0.75
0.50
0.00
0.25
0 50 100 150Time from surgery date (months)
Ove
rall
Sur
viva
l (pr
obab
ility
)
Log-Rank P
VI=0
VI=1+2
1.00
0.75
0.50
0.00
0.25
0 50 100 150Time from surgery date (months)
Ove
rall
Sur
viva
l (pr
obab
ility
)
Log-Rank P
VI=0
VI=1+2
1.00
0.75
0.50
0.00
0.25
0 50 100 150Time from surgery date (months)
Ove
rall
Sur
viva
l (pr
obab
ility
)
Log-Rank P
1.00
0.75
0.50
0.00
0.25
0 50 100 150Time from surgery date (months)
Ove
rall
Sur
viva
l (pr
obab
ility
)
Log-Rank P
VI=0
VI=1+2
1.00
0.75
0.50
0.00
0.25
0 50 100 150Time from surgery date (months)
Ove
rall
Sur
viva
l (pr
obab
ility
)
Log-Rank P
D=1+2
D=3+4
1.00
0.75
0.50
0.00
0.25
0 50 100 150Time from surgery date (months)
Ove
rall
Sur
viva
l (pr
obab
ility
)
Log-Rank P
1.00
0.75
0.50
0.00
0.25
0 50 100 150Time from surgery date (months)
Ove
rall
Sur
viva
l (pr
obab
ility
)
Log-Rank P
D=1+2
D=3+4
1.00
0.75
0.50
0.00
0.25
0 50 100 150Time from surgery date (months)
Ove
rall
Sur
viva
l (pr
obab
ility
)
Log-Rank P
HMGA2=0HMGA2=1+2+3
1.00
0.75
0.50
0.00
0.25
0 50 100 150Time from surgery date (months)
Ove
rall
Sur
viva
l (pr
obab
ility
)
Log-Rank P
1.00
0.75
0.50
0.00
0.25
0 50 100 150Time from surgery date (months)
Ove
rall
Sur
viva
l (pr
obab
ility
)
Log-Rank P
HMGA2=0HMGA2=1+2+3
1.00
0.75
0.50
0.00
0.25
0 50 100 150Time from surgery date (months)
Ove
rall
Sur
viva
l (pr
obab
ility
)
Log-Rank P
VI=0
VI=2
1.00
0.75
0.50
0.00
0.25
0 50 100 150Time from surgery date (months)
Ove
rall
Sur
viva
l (pr
obab
ility
)
Log-Rank P
1.00
0.75
0.50
0.00
0.25
0 50 100 150Time from surgery date (months)
Ove
rall
Sur
viva
l (pr
obab
ility
)
Log-Rank P
VI=0
VI=2
1.00
0.75
0.50
0.00
0.25
0 50 100 150Time from surgery date (months)
Ove
rall
Sur
viva
l (pr
obab
ility
)
Log-Rank P
VI=0
VI=2
1.00
0.75
0.50
0.00
0.25
0 50 100 150Time from surgery date (months)
Ove
rall
Sur
viva
l (pr
obab
ility
)
Log-Rank P
1.00
0.75
0.50
0.00
0.25
0 50 100 150Time from surgery date (months)
Ove
rall
Sur
viva
l (pr
obab
ility
)
Log-Rank P
VI=0
VI=2
1.00
0.75
0.50
0.00
0.25
0 50 100 150Time from surgery date (months)
Ove
rall
Sur
viva
l (pr
obab
ility
)
Log-Rank P
M=0
M=1
1.00
0.75
0.50
0.00
0.25
0 50 100 150Time from surgery date (months)
Ove
rall
Sur
viva
l (pr
obab
ility
)
Log-Rank P
1.00
0.75
0.50
0.00
0.25
0 50 100 150Time from surgery date (months)
Ove
rall
Sur
viva
l (pr
obab
ility
)
Log-Rank P
M=0
M=1
A E
GC
D H
FB
= .594 = .039
= .049
= .027
= .023 = .008
< .0001
= .006
Fig. 3 Kaplan-Meier OS curves for CRC clinicopathologic parameters and HMGA2 expression. A, Lymph nodes: 0, negative lymph nodes;1, positive lymph nodes. B, Distal metastases: 0, absence of metastases; 1, presence of metastases. C, Dukes: 1 + 2, low-value Dukes grade; 3 +4, high Dukes grade. D, HMGA2: 0, negative protein expression; 1 + 2 + 3, positive protein expression. E and F, VI of entire cohort: 0, absenceof VI; 1 + 2, presence of VI; 2, presence of HMGA2-positive VI. G and H, VI of FU/FA cases: 0, absence of VI; 1 + 2, presence of VI; 2,presence of HMGA2-positive VI. Log-rank significance is shown. N indicates lymph nodes; M, distal metastases; D, Dukes.
129HMGA2 protein in colorectal cancer
progressive HMGA2 immunoreactivity, with positivitycorrelating to a more advanced histologic tumor grade.Watanabe et al [30] reported that the increasing expression ofHMGA2 in human pancreatic cancer is accompanied by agradual decrease in E-cadherin–positive tumor cells, whichindicates tumor progression. In a recent detailed study, Betgeet al [12] demonstrated that venous and lymphatic invasion isa significant prognostic variable in patients with CRC. In this
study, we report that the HMGA2 protein promotes suchinvasion in both the entire 103 patient sets and the T3N0M0
subset; invasion is associated with a clear decrease in patientOS. A link betweenHMGA2 expression and invasiveness hasalready been observed in retinoblastoma in which higherlevels of HMGA2 expression are a characteristic of invasivetumors [31]. A significant association between HMGA2expression and invasiveness has also been demonstrated in a

Table 3 Comparison (percentage) between HMGA2-positivebudding and VI versus HMGA2-positive stromal fibroblast
Cases 68 35 55 19Neoplasia HMGA2 score 0 1 + 2 + 3 “Truly 0” 3
Case percentages
HMGA2-positive budding 37 83 25 89HMGA2-positive VI 13 74 9 89HMGA2-positive stromalfibroblasts
48 23 47 21
NOTE. Different sets of CRC cases have been compared. In the 2columns 0/1 + 2 + 3, the total 103 cases have been considered (68 + 35):case 68 included also HMGA2 positivity up to 5%, and case 35 includedalso moderate and intermediate HMGA2 positivity. In the 2 columns“Truly 0”/3, reduced samples have been considered (55 + 19); cases 55are those do not contain any positive cell (truly 0 positivity), whereascases 19 are those with very high positive cells (100%).
A
B
C
130 C. Rizzi et al.
breast cancer cell line in vitro [32]. In this study, we show asimilar association in CRC in vivo and demonstrate theinvolvement of HMGA2 in themain features of the tumors, assummarized in Table 2 for VI. This result is similar to β-catenin in colorectal adenocarcinomas in which strongnuclear β-catenin was found in the cells in the invasivefront, whereas central tumor areas (which we call the mainneoplasia) often lack β-catenin nuclear expression [33]. Asimilar association for endometrial carcinomas in vivo hasrecently been reported by Montserrat et al [34], in which thefront of deeply invasive tumors has high levels of HMGA2and other molecular factors.
The associations found for HMGA2 expression in thisstudy are consistent because this protein is simultaneouslyinvolved in 3 important and related biologic functions:neoplastic transformation, epithelial-mesenchymal transi-tion, and stem cells' identity [14,17,35].
The tumor and surrounding environment status are notstatic because the cells constituting this complex interlinkedsystem change (or progress) because of the pressure of aplethora of paracrine and autocrine factors secreted by residentand infiltrating cells [10,36]. In this work, we observed thischange in both CRC cells and stroma fibroblasts. Residentfibroblasts that express the HMGA2 protein can be consideredto be “activated” fibroblasts at an early stage of tumorprogression. Tumor necrosis factor α, transforming growthfactor β, and fibroblast growth factor (FGF) can all stimulateHMGA2 expression in stromal fibroblasts [37-40].
Regardless of the factor(s) that activate stromal fibroblastsin the CRC samples, this activation is mainly present whentumor cells do not express HMGA2 and concomitant with a
Fig. 4 HMGA2 immunoreactivity of stromal fibroblasts surround-ing the neoplasia. A, HMGA2-positive neoplasia and HMGA2-negative stromal fibroblasts. B, HMGA2-negative neoplasia and afraction of positive stromal fibroblasts: C, HMGA2-negativeneoplasia and highly positive stromal fibroblasts. Bar, 50 μm.

100
50
0
VascularInvasion
13%
StromalFibroblasts
48%
VascularInvasion
74%
StromalFibroblasts
23%
HMGA2negative neoplasias
HMGA2positive neoplasias
HM
GA
2 po
sitiv
e ca
ses
(%)
A B
Fig. 5 A, HMGA2-negative neoplasias have microenvironmentswith low levels of HMGA2-positive VI (13%) and relatively higherlevels of HMGA2-positive stromal fibroblasts (48%). B, HMGA2-positive neoplasias have microenvironments with higher levels ofHMGA2-positive VI (74%) and relatively lower levels of HMGA2-positive stromal fibroblasts (23%).
131HMGA2 protein in colorectal cancer
low level of tumor invasiveness (budding and vesselinvasion). At the later stages of the tumor-stroma interaction,cancer-associated fibroblasts (known as CAFs) appear andgenerate a favorable microenvironment for metastasis onset[36,41]. However, Finak et al [42], who studied stromal geneexpression in breast cancer using a stroma-derived prognosticpredictor procedure, reported that a good outcome couldresult from the overexpression of a distinct set of immune-related genes, including T cell and NK cell markers. Webelieve that our finding of HMGA2-positive stromalfibroblasts in some CRCs could reflect a similar situation.Two recent studies also focused on the relationship betweenthe stromal compartment and HMGA2 expression. Wu et al[43] and Dangi-Garimella et al [44] studied HMGA2expression in ovarian surface epithelial cells and in pancreaticductal adenocarcinoma cells, respectively. These studieshighlight the importance of stromal status in the HMGA2expression, which affects tumor cell behavior. Our resultssuggest another aspect of the stroma related to factors thatstimulate resident fibroblasts that is likely linked to earlierevents of tumor progression than those in the 2 cited works.
This work used a simple and common analyticalprocedure that could easily be performed at any hospitalwith a pathologic anatomy division. The close inspection ofboth hematoxylin-stained and HMGA2 immunohistochem-ical slides provided us with useful information about CRC
progression and invasiveness. The prognostic value ofHMGA2 in CRC can be described as follows: (1) worseprognosis: elevated levels of HMGA2 in tumor cells/highinvasiveness/low HMGA2 stromal fibroblast positivity and(2) better prognosis: low levels of HMGA2 in tumor cells/low invasiveness/moderate or high HMGA2 positivity ofstromal fibroblasts. We suggest that HMGA2 expressionanalysis should be included in the clinical evaluation of someCRC statuses such as the T3N0M0 cases, in which high levelsof HMGA2 expression could likely predict higher invasive-ness and worse prognosis.
Acknowledgments
The authors acknowledge the members of the S.O.S. ofAnatomia Patologica (Ospedale di Palmanova, Udine, Italy)for the important technical support in carrying out theimmunohistochemical analyses.
References
[1] Saika K, Makii R. Time trends in colon, rectum and anus cancermortality between 1995 and 2008 in Japan, USA and Europe on WHOmortality database. Jpn J Clin Oncol 2011;41:1153.
[2] Karsa LV, Lignini TA, Patnick J, Lambert R, Sauvaget C. Thedimension of the CRC problem. Best Pract Res Clin Gastroenterol2010;24:381-96.
[3] Jemal A, Siegel R, Xu J, Ward E. Cancer statistics 2010. CA Cancer JClin 2010;60:277-300.
[4] Compton CC, Greene FL. The staging of colorectal cancer: 2004 andbeyond. CA Cancer J Clin 2004;54:295-308.
[5] Meropol NJ. Ongoing challenge of stage II colon cancer. J Clin Oncol2011;29:3346-8.
[6] Wang LM, Sheahan K. Prognostic markers in colorectal pathology: ismorphology enough? Diagn Histophatol 2011;17:386-94.
[7] Zlobec I, Lugli A, Baker K, et al. Role of APAF-1, E-cadherin andperitumoral lymphocytic infiltration in tumor budding in colorectalcancer. J Pathol 2007;212:260-8.
[8] Nosho K, Kawasaki T, Ohnishi M, et al. PIK3CA mutation incolorectal cancer: relationship with genetic and epigenetic alterations.Neoplasia 2008;10:534-41.
[9] Hostettler I, Zlobec I, Terracciano L, Lugli A. ABCG5-positivity intumor buds is an indicator of poor prognosis in node-negativecolorectal cancer patients. World J Gastroenterol 2010;16:732-9.
[10] Pagès F, Galon J, Dieu-Nosjean M-C, et al. Immune infiltration inhuman tumors: a prognostic factor that should not be ignored.Oncogene 2010;29:1093-102.
[11] Wang C-G, Ye Y-J, Yuan J, et al. EZH2 and STAT expression profilesare correlated with colorectal cancer stage prognosis. World JGastroenterol 2010;16:2421-7.
[12] Betge J, Pollheimer MJ, Lindtner RA, et al. Intramural and extramuralvascular invasion in colorectal cancer. Cancer 2012;118:628-38.
[13] Sgarra R, Rustighi A, Tessari MA, et al. Nuclear phosphoproteinsHMGA and their relationship with chromatin structure and cancer.FEBS Lett 2004;574:1-8.
[14] Fusco A, Fedele M. Roles of HMGA proteins in cancer. Nature RevCancer 2007;7:899-910.
[15] Zhou X, Benson KF, Ashar HR, Chada K. Mutation responsible for themouse pigmy phenotype in the developmentally regulated factorHMGI-C. Nature 1995;376:371-4.
132 C. Rizzi et al.
[16] Tessari MA, Gostissa M, Altamura S, et al. Transcriptional activationof the cyclin A gene by the architectural transcription factor HMGA2.Mol Cell Biol 2003;23:9104-16.
[17] Thuault S, Tan EJ, Peinado H, et al. HMGA2 and Smads co-regulateSNAIL1 expression during induction of epithelial-to-mesenchymaltransition. J Biol Chem 2008;283:33437-46.
[18] Sgarra R, Maurizio E, Zammitti S, et al. Macroscopic differences inHMGA oncoproteins post-translational modifications: C-terminalphosphorylation of HMGA2 affects its DNA binding properties. JProteome Res 2009;8:2978-89.
[19] Abe N, Watanabe T, Suzuki Y, et al. An increased high-mobility groupA2 expression level is associated with malignant phenotype inpancreatic exocrine tissue. Br J Cancer 2003;89:2104-9.
[20] Meyer B, Loeschke S, Shultze A, et al. HMGA2 overexpression innon-small cell lung cancer. Mol Carcinog 2007;46:503-11.
[21] Mahajan A, Liu Z, Gellert L, et al. HMGA2: a biomarker significantlyoverexpressed in high-grade ovarian serous carcinoma. Mod Pathol2010;23:673-81.
[22] Hasebe T, Okada N, Tamura N, et al. p53 expression in tumor stromalfibroblasts is associated with the outcome of patients with invasiveductal carcinoma in the breast. Cancer Sci 2009;100:2101-8.
[23] Rahman MM, Qian ZR, Wang EL, et al. Frequent overexpression ofHMGA1 and 2 in gastroenteropancreatic neuroendocrine tumors andits relationship to let-7 downregulation. Br J Cancer 2009;100:501-10.
[24] Altman DG. Pratical statistics for medical research. Chapman & Hall;1991.
[25] Wang LM, Kevans D, Mulcahy H, et al. Tumor budding is a strong andreproducible prognostic marker in T3N0 colorectal cancer. Am J SurgPathol 2009;33:134-41.
[26] Zhen L, Zhe S, Zhenning W, et al. Iron-deficiency anemia: a predictorof diminished disease-free survival of T3N0M0 stage colon cancer. JSurg Oncol 2012;105:371-5.
[27] Shoenmakers EF, Wanschura S, Mols R, et al. Recurrent rearrange-ments in the high mobility group protein gene, HMGI-C, in benignmesenchymal tumors. Nat Genet 1995;10:436-44.
[28] Medeiros F, Wang X, Araujo ARC, et al. HMGA gene rearrangementis a recurrent somatic alteration in polypoid endometriosis. HUM
PATHOL 2012 [Epub ahead of print].[29] Di Cello F, Hillion J, Hristof A, et al. HMGA2 participates in
transformation in human lung cancer. Mol Cancer Res 2008;6:743-50.[30] Watanabe S, Ueda Y, Akaboshi S, et al. HMGA2 maintains oncogenic
Ras-induced epithelial-mesenchymal transition in human pancreaticcancer cells. Am J Pathol 2009;174:854-68.
[31] Mu G, Liu H, Zhou F, et al. Correlation of overexpression of HMGA1and HMGA2 with poor tumor differentiation, invasion, and prolifer-ation associated with let-7 down-regulation in retinoblastomas. HUM
PATHOL 2010;41:493-502.[32] Fabjani G, Tong D, Wolf A, et al. HMGA2 is associated with
invasiveness but not a suitable marker for the detection of circulatingtumor cells in breast cancer. Oncol Rep 2005;14:737-41.
[33] Brabletz T, Jung A, Hermann K, et al. Nuclear expression of theoncoprotein β-catenin in colorectal cancer is localized predominantlyat the invasion front. Pathol Res Pract 1998;194:701-4.
[34] Montserrat N, Mozos A, Llobet D, et al. Epithelial to mesenchymaltransition in early stage endometrioid endometrial carcinoma. HUM
PATHOL 2012;43:632-43.[35] Pfannkuche K, Summer H, Li O, et al. The high mobility group protein
HMGA2: a co-regulator of chromatin structure and pluripotency instem cells? Stem Cell Rev Rep 2009;5:224-30.
[36] Joyce JA, Pollard JW. Microenvironmental regulation of metastasis.Nat Rev 2009;9:239-52.
[37] Yac C, Grimm WA, Garner WL, et al. Epithelia to mesenchymaltransition in human skin wound healing is induced by Tumor NecrosisFactor-α through bone morphogenic protein-2. Am J Pathol 2010;176:2247-58.
[38] Alcorn JF, Guala AS, van der Velden J, et al. Jun N-terminal kinase 1regulates epithelial-to-mesenchymal transition induced by TNF-β1. JCell Sci 2008;121:1036-45.
[39] Lanahan A, Williams JB, Sanders LK. Growth factor-induced delayedearly response genes. Mol Cell Biol 1992;12:3919-29.
[40] Ayoubi T, Jansen E, Meulemans SMP, Van de Ven WJM. Regulationof HMGIC expression: an architectural transcriptional factor involvedin growth control and development. Oncogene 1999;18:5076-87.
[41] Cichon MA, Degnim AC, Visscher DW, Radisky DC. Microenviron-mental influences that drive progression from benign breast disease toinvasive breast cancer. J Mammary Gland Biol Neoplasia 2010;15:389-97.
[42] Finak G, Bertos N, Pepin F, et al. Stromal gene expression predictsclinical outcome in breast cancer. Nat Med 2008;14:518-27.
[43] Wu J, Liu Z, Shao C, et al. HMGA2 overexpression-induced ovariansurface epithelial transformation is mediated through regulation ofEMT genes. Cancer Res 2011;71:349-59.
[44] Dangi-Garimella S, Krantz SB, Barron MR, et al. Three-dimensionalcollagen I promotes Gemcitabine resistance in pancreatic cancerthrough MT1-MMP mediated expression of HMGA2. Cancer Res2011;71:1019-28.