the external environment for developing countries january 2009 the world bank development economics...
TRANSCRIPT

The External Environment for Developing Countries
January 2009The World Bank
Development EconomicsProspects Group

Global industrial production plummets into 4th quarter of 2008...
manufacturing production, ch% (saar)
-20
-15
-10
-5
0
5
10
15
Jan-07 Apr-07 Jul-07 Oct-07 Jan-08 Apr-08 Jul-08 Oct-08
Source: DEC Prospects Group.
OECD
Developing
World
50
60
70
80
90
100
110
Sep-08 Oct-08 Nov-08 Dec-08 Jan-09
Source: Thomson/Datastream, Morgan Stanley (*USD index).
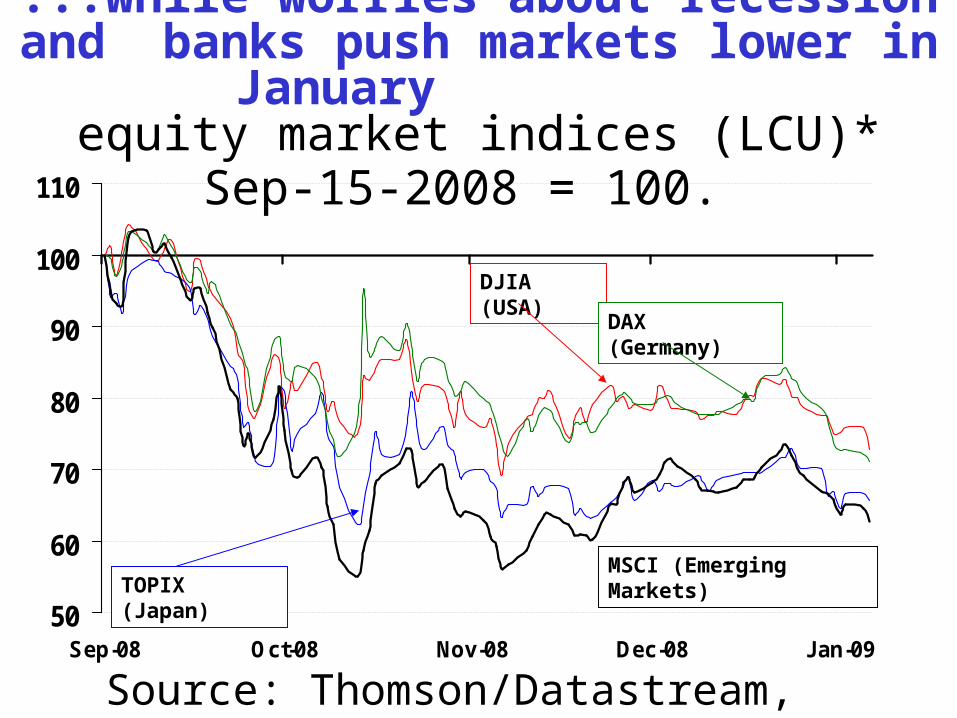
...while worries about recession and banks push markets lower in January
equity market indices (LCU)* Sep-15-
2008 = 100.
MSCI (Emerging Markets)TOPIX (Japan)
DJIA (USA)
DAX (Germany)

Industrial countries

U.S. employment losses in 2008 sum to 2.6 million...worst since 1945 change in non-farm employment,
‘000
-600
-500
-400
-300
-200
-100
0
100
200
Jan-07 Apr-07 Jul-07 Oct-07 Jan-08 Apr-08 Jul-08 Oct-08
Source: U.S. Department of Labor.
monthly change
3mma change

Falling exports, orders and production pressure U.S. GDP
export volumes, durable goods orders and IPmfg, ch% saar
-20
-15
-10
-5
0
5
10
Jan-07 Apr-07 Jul-07 Oct-07 Jan-08 Apr-08 Jul-08 Oct-08
-40
-30
-20
-10
0
10
20
30
40
Source: Department of Commerce, Federal Reserve.
Export volumes [R]
Durable goods orders [R]
Production [L]

0
1
2
3
4
5
6
Aug-07 Nov-07 Feb-08 May-08 Aug-08 Nov-08
Source: Thomson/Datastream.
Interbank market rates- and yield on ten-year note easing
Fed Funds target- and effective rates; Libor and T-note 10 yr
Fed Funds Target
LIBOR 6 months
T-note 10-year
Fed Funds Effective

Japan’s exports and production point to severe 4th quarter downturn
export volumes and manufacturing output, ch% saar
-25
-20
-15
-10
-5
0
5
10
Jan-07 Apr-07 Jul-07 Oct-07 Jan-08 Apr-08 Jul-08 Oct-08
-30
-20
-10
0
10
20
30
Source: Bank of Japan and Japan Cabinet Office.
Industrial production [L]
Export volumes [R]

Household spending turns to the doldrums in the last months of 2008
household expend, retail sales [L]; Tokyo consumer confidence [R]
-2
-1
0
1
2
3
Jan-07 Apr-07 Jul-07 Oct-07 Jan-08 Apr-08 Jul-08 Oct-08
25
30
35
40
45
50
Source: Japan Cabinet Office.
HH spending [L]
Consumer confidence [R]
Retail sales [L]

0.5
0.8
1.0
1.3
1.5
1.8
2.0
Jun-08 Jul-08 Aug-08 Sep-08 Oct-08 Nov-08 Dec-08 Jan-09
85
90
95
100
105
110
115
Source: Thomson/Datastream.
Yen strength on unwinding “carry trades” supports BOJ ease Yen/USD rate (inverse) [right]; TIBOR
and JGB 10-year [left]
Yen/dollar (inverse) [R]
TIBOR 6 months [L]
JGB- ten year [L]

European confidence plummets while ECB asesses economic damage
Euro Area consumer confidence [L]; IFO overall [R]
-30
-25
-20
-15
-10
-5
0
Jan-07 Apr-07 Jul-07 Oct-07 Jan-08 Apr-08 Jul-08 Oct-0885
90
95
100
105
110
115
Source: Eurostat-- Thomson/Datastream.
IFO overall [R]
EC Consumer confidence [L]

Production now in sharp decline across the Euro Area
manufacturing production, ch% (saar)
-20
-15
-10
-5
0
5
10
Jan-07 Apr-07 Jul-07 Oct-07 Jan-08 Apr-08 Jul-08 Oct-08
Source: Eurostat.
Germany
France
Italy
Euro Area
2.0
2.5
3.0
3.5
4.0
4.5
5.0
5.5
6.0
Aug-07 Nov-07 Feb-08 May-08 Aug-08 Nov-081.22
1.30
1.38
1.46
1.54
1.62
Source: Thomson/Datastream.
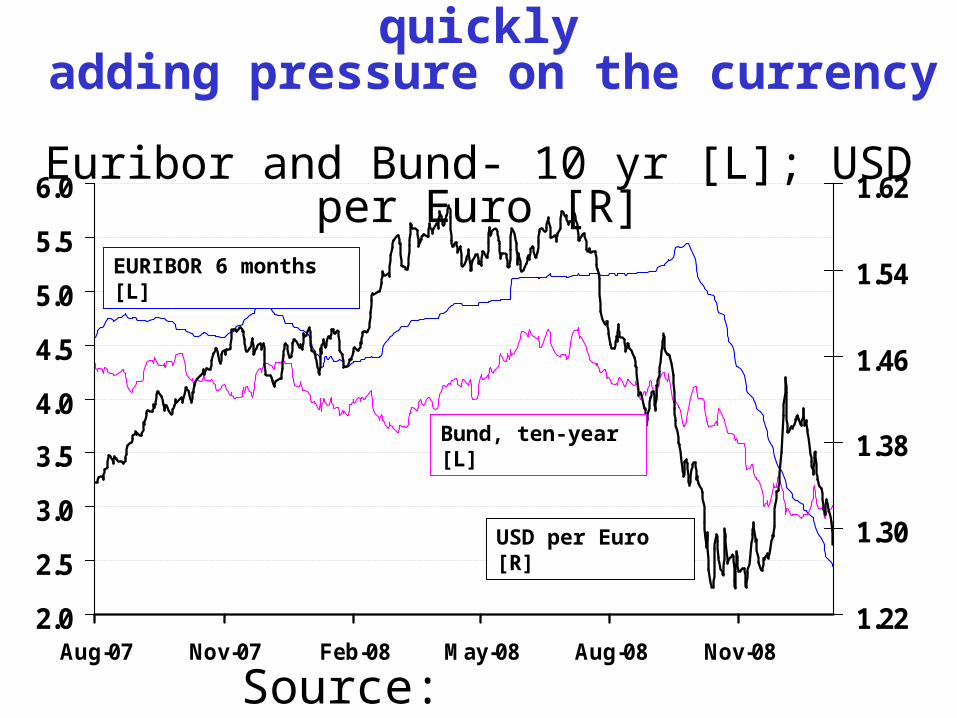
Euro interbank rates fall quickly adding pressure on the currency Euribor and Bund- 10 yr [L]; USD per
Euro [R]
USD per Euro [R]
EURIBOR 6 months [L]
Bund, ten-year [L]

Industrial production
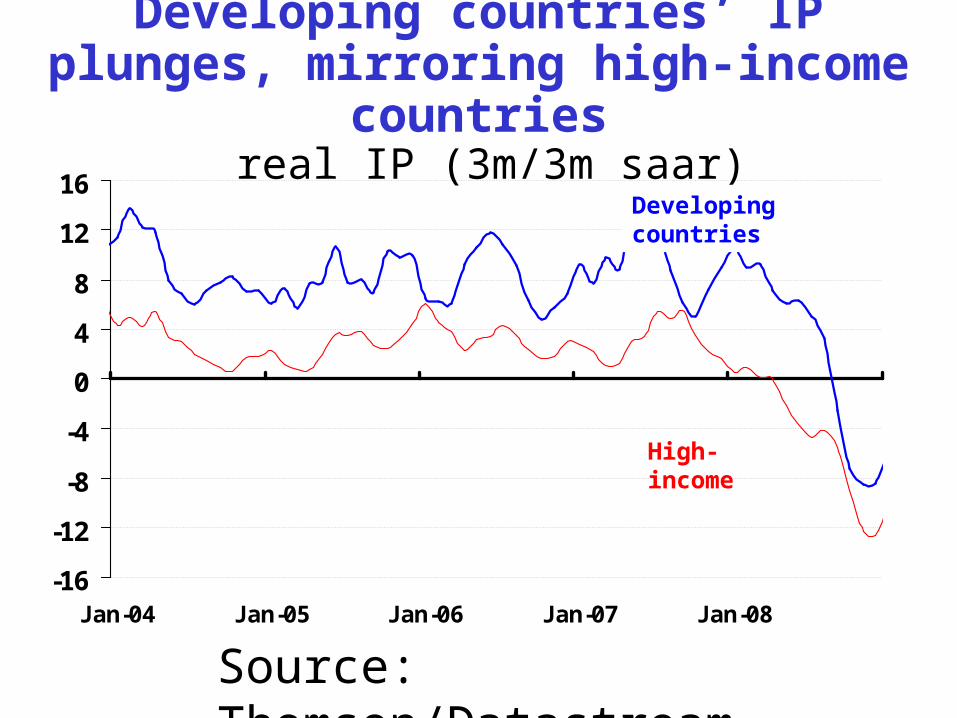
Developing countries’ IP plunges, mirroring high-income countries
real IP (3m/3m saar)
-16
-12
-8
-4
0
4
8
12
16
Jan-04 Jan-05 Jan-06 Jan-07 Jan-08
Source: Thomson/Datastream, DECPG.
High-income
Developing countries

East Asia and Central and Eastern Europe hit hardest
real IP (3m/3m saar)
-30
-20
-10
0
10
20
30
Jan-01 Jan-02 Jan-03 Jan-04 Jan-05 Jan-06 Jan-07 Jan-08 Jan-09
ECA
East Asia, excl China
Source: Thomson/Datastream, DECPG.

Dramatic IP contraction in export intensive economies
real IP (6m/6m saar)
-50
-40
-30
-20
-10
0
10
20
30
Jan-99 May-00 Sep-01 Jan-03 May-04 Sep-05 Jan-07 May-08
HungaryTurkey
Czech Republic
Korea
Taiwan
Source: Thomson/Datastream, DECPG.

International trade

Major OECD imports contract in step with domestic demand
import volumes: U.S, Japan, Germany and U.K. ch% 3mma y/y
-7.5
-5.0
-2.5
0.0
2.5
5.0
7.5
10.0
12.5
15.0
Jan-07 Apr-07 Jul-07 Oct-07 Jan-08 Apr-08 Jul-08 Oct-08
Source: National Agencies through Thomson/Datastream.
United States
Japan
Germany
U.K.

Developing exports in decline export volumes: China, India, Mexico and
Jordan ch% 3mma y/y
-15
-5
5
15
25
35
Jan-07 Apr-07 Jul-07 Oct-07 Jan-08 Apr-08 Jul-08 Oct-08
Source: National Agencies through Thomson/Datastream.
China
India
Jordan
Mexico

-80
-60
-40
-20
0
Jan-07 Apr-07 Jul-07 Oct-07 Jan-08 Apr-08 Jul-08 Oct-08
Source: Department of Commerce.
U.S. trade balance improves sharply in November on plummeting oil price
Goods balance
Oil balance
Non-oil balance
goods balance, and oil- and non-oil balances ($bn)
Oil prices

Oil prices appear to stabilize amid OPEC production cuts
25
35
45
55
65
75
85
95
105
115
125
135
Jan-03 Jan-04 Jan-05 Jan-06 Jan-07 Jan-08 Jan-09
25
26
27
28
29
30
31
$/bbl mb/d
Oil price [L scale]
OPEC-11 Production (x Angola) [R]
Source: IEA and DECPG Commodities Group.

Growth in U.S. Oil Demand (yr/yr)
-2000
-1500
-1000
-500
0
500
1000
Jan-04 Jan-05 Jan-06 Jan-07 Jan-08 Jan-09
Other
Resid
Distillate
Gasoline
kb/d
Source: IEA and DECPG Commodities Group.
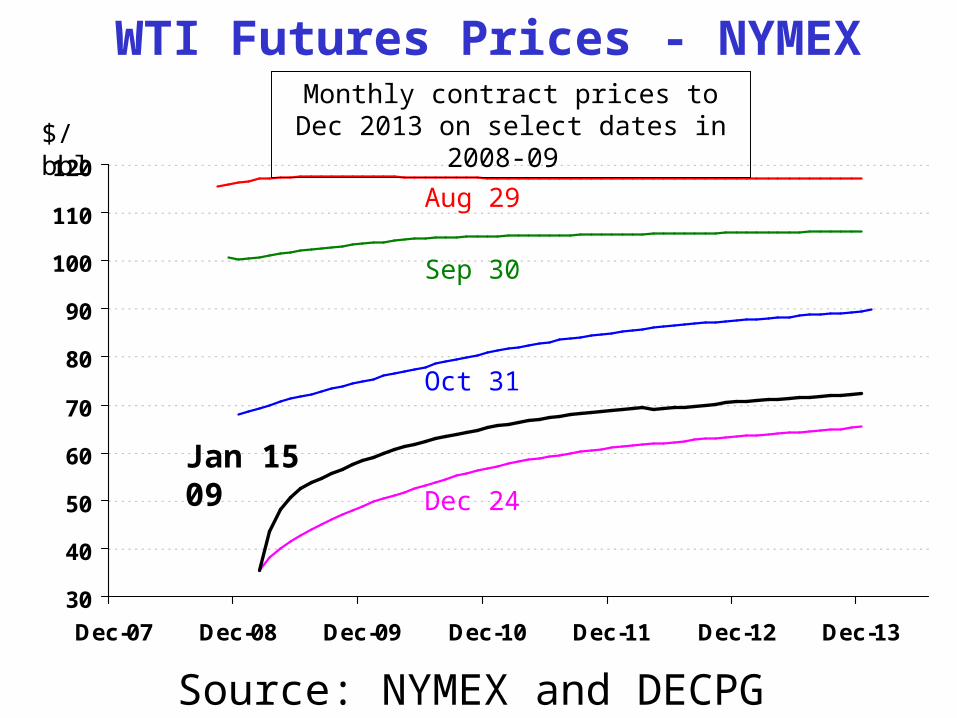
WTI Futures Prices - NYMEX
30
40
50
60
70
80
90
100
110
120
Dec-07 Dec-08 Dec-09 Dec-10 Dec-11 Dec-12 Dec-13
Jan 15 09
$/bbl
Monthly contract prices to Dec 2013 on select dates in 2008-09
Oct 31
Sep 30
Aug 29
Dec 24
Source: NYMEX and DECPG Commodities Group.

Non-oil commodity prices

100
150
200
250
300
350
Jan-05 Jan-06 Jan-07 Jan-08 Jan-09
Grains
Fats & Oils
Other Food
Agriculture price declines begin to moderate
2000=100
Source: Datastream and DECPG Commodities Group.

Metal prices rebound slightly on index rebalancing
2,000
3,000
4,000
5,000
6,000
7,000
8,000
9,000
Jan-05Jan-06
Jan-07Jan-08
Jan-09
0
50
100
150
200
250
300
350
400
450
$/ton ‘000 tons
Copper price
LME stocks
Source: LME and DECPG Commodities Group.
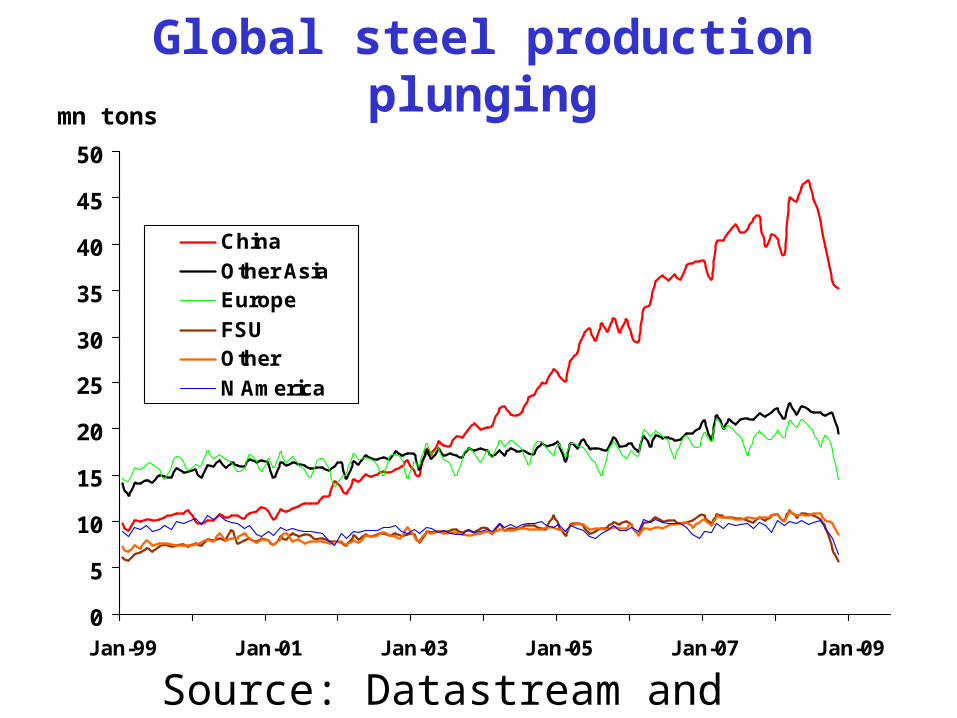
Global steel production plunging
0
5
10
15
20
25
30
35
40
45
50
Jan-99 Jan-01 Jan-03 Jan-05 Jan-07 Jan-09
China
Other AsiaEurope
FSUOther
N America
mn tons
Source: Datastream and DECPG Commodities Group.

International Finance

A difficult year for emerging market capital flows
Source: DECPG Finance Team.
Gross capital flows to emerging markets
$ billion
H1 Q3 Q4 Total H1 Q3 Q4 Dec Total
Total 349 163 139 652 253 73 44 16 371
Bonds 107 20 19 146 58 9 2 2 69
Banks 156 101 55 312 150 62 42 14 254
Equity 86 42 66 194 45 2 0 0 47
Lat. America 69 54 32 156 56 13 10 5 79
Bonds 31 6 8 45 17 1 2 2 20
E. Europe 156 45 46 247 101 35 21 4 158
Bonds 50 5 9 64 32 8 0.1 0.1 40
Asia 93 47 47 188 69 15 8 4 91
Bonds 18 5 1 23 7 0.4 0 0 7
Others 31 16 14 61 27 10 5 3 43
2007 2008

Equities post modest gains in December
percentage change (in local currency)
-55
-45
-35
-25
-15
-5
5
15
MSCIEmergingMarkets
MSCIMature
Markets
MSCI BRIC S&P 500 FTSE-100 Nikkei
Source: Bloomberg and DECPG Finance Team.
2008
Oct
Nov Dec

-20
-10
0
10
20
30
Jan-03 Jan-04 Jan-05 Jan-06 Jan-07 Jan-08 Jan-09
0
100
200
300
400
500
600
700
800
900
1000
Source: JPMorgan-Chase and DECPG Finance Team.
Sharp widening in EM bond spreads at year-end 2008
Yen/USD rate (inverse) [right]; TIBOR and JGB 10-year [left]
EMBIG annual retruns [Left]
EMBIG spread [Right]

Currencies

1.230
1.270
1.310
1.350
1.390
1.430
1.470
1.510
1.550
1.590
1.630
Jan-08 Mar-08 May-08 Jul-08 Sep-08 Nov-08 Jan-09
86
90
94
98
102
106
110
Source: Thomson/Datastream.
yen/USD
USD/Euro (inverse)
Dollar falls on Fed rate cutuntil ECB reduction seen as sure
USD per Euro (inverse) [Left] and Yen per USD [right]

1
2
3
4
5
6
Jan-08 Mar-08 May-08 Jul-08 Sep-08 Nov-08 Jan-09
Interest differentials well in favorof stronger euro since November USD Libor and EURIBOR (6 months),
percent EURIBOR 6 months
USD LIBOR 6 months
Source: Thomson/Datastream.

95
100
105
110
115
120
125
130
135
Sep-08 Oct-08 Nov-08 Dec-08 Jan-09
Source: Thomson/Datastream.
Dollar mixed against EM currencies LCU per USD indexes, Sept-15 2008=100
[*increase = weaker LCU] Turkish lira
Brazilian real
Korean won
Russian rouble

The External Environment for Developing Countries
January 2009The World Bank
Development EconomicsProspects Group