the eyes have it: user interfaces for information visualization ben shneiderman ([email protected])...
Post on 19-Dec-2015
219 views
TRANSCRIPT
The Eyes Have It:The Eyes Have It:User Interfaces for User Interfaces for
Information VisualizationInformation Visualization
Ben ShneidermanBen Shneiderman([email protected])([email protected])
Director, Human-Computer Interaction Laboratory Director, Human-Computer Interaction Laboratory Professor, Department of Computer ScienceProfessor, Department of Computer Science
Member, Institutes for Advanced Computer Studies &Member, Institutes for Advanced Computer Studies &Systems ResearchSystems Research
Human-Computer Interaction Laboratory
Interdisciplinary research community - Computer Science & Psychology - Information Studies & Education (www.cs.umd.edu/hcil)

User Interface Design Goals
Cognitively comprehensible:Consistent, predictable & controllable
Affectively acceptable: Mastery, satisfaction & responsibility
NOT:
Adaptive, autonomous & anthropomorphic
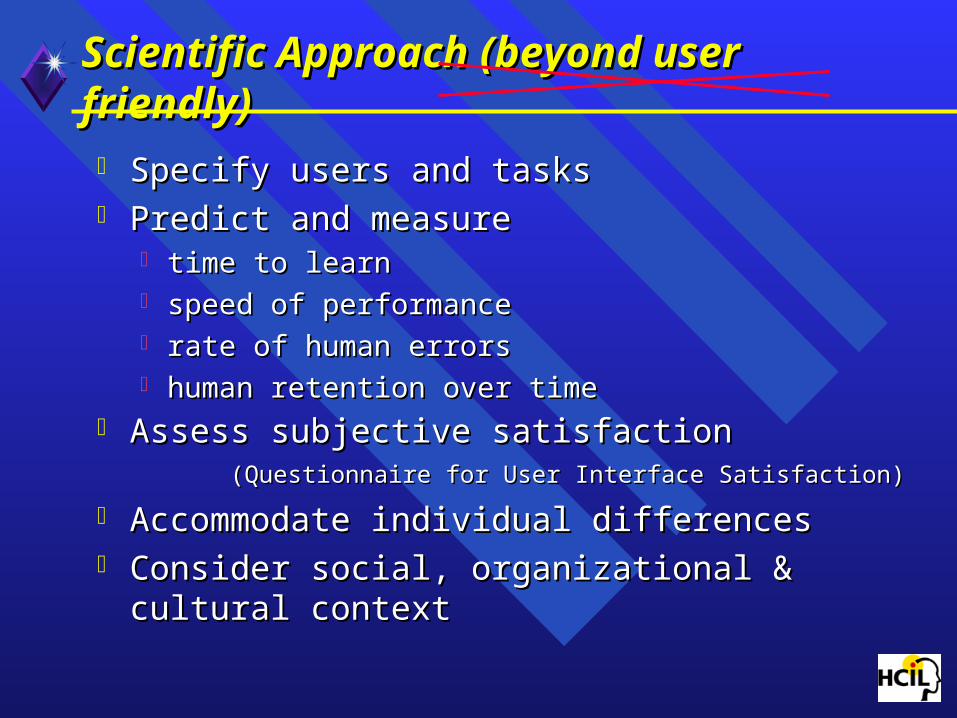
Scientific ApproachScientific Approach (beyond user friendly)(beyond user friendly)
Specify users and tasksSpecify users and tasks Predict and measurePredict and measure
time to learntime to learn speed of performancespeed of performance rate of human errorsrate of human errors human retention over timehuman retention over time
Assess subjective satisfactionAssess subjective satisfaction (Questionnaire for User Interface Satisfaction)(Questionnaire for User Interface Satisfaction)
Accommodate individual differencesAccommodate individual differences Consider social, organizational & cultural contextConsider social, organizational & cultural context
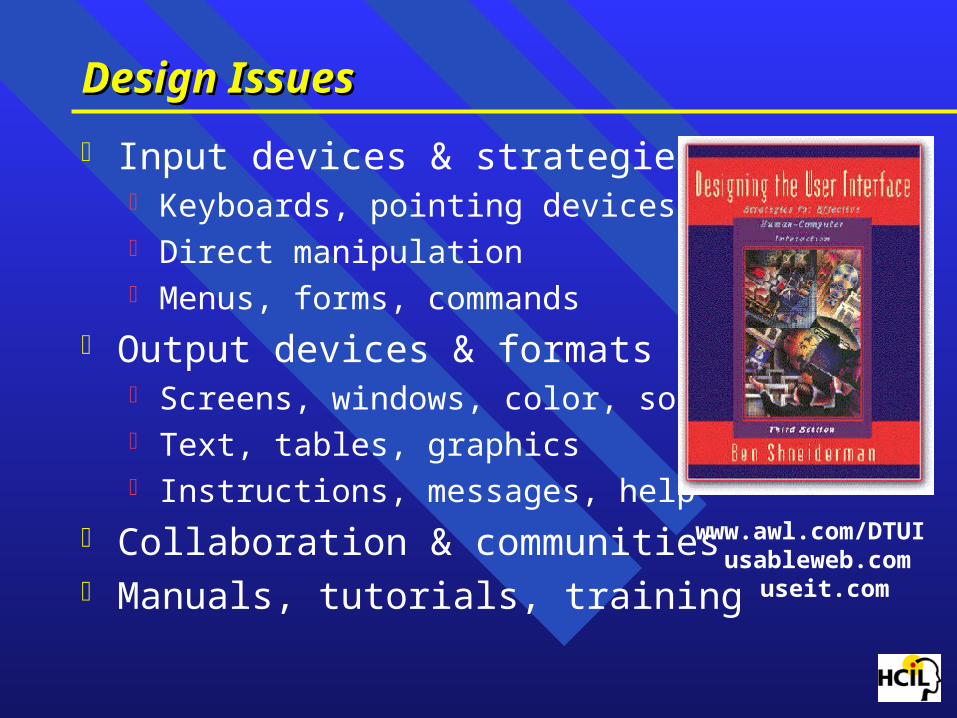
Design IssuesDesign Issues
Input devices & strategies Keyboards, pointing devices, voice Direct manipulation Menus, forms, commands
Output devices & formats Screens, windows, color, sound Text, tables, graphics Instructions, messages, help
Collaboration & communities Manuals, tutorials, training
www.awl.com/DTUI usableweb.com useit.com
Library of CongressLibrary of Congress
Scholars, Journalists, CitizensScholars, Journalists, Citizens
Teachers, StudentsTeachers, Students
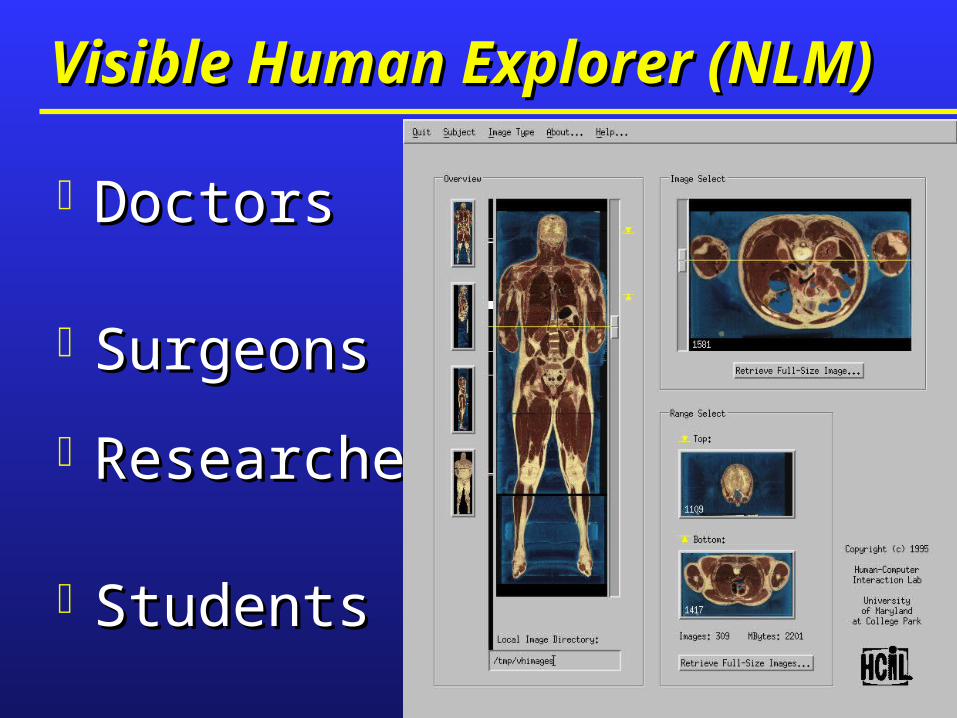
Visible Human Explorer (NLM)Visible Human Explorer (NLM)
DoctorsDoctors
SurgeonsSurgeons
ResearchersResearchers
StudentsStudents

NASA Environmental DataNASA Environmental Data
ScientistsScientists
FarmersFarmers
Land plannersLand planners
StudentsStudents
Bureau of CensusBureau of Census
Economists, Policy Economists, Policy makers, Journalistsmakers, Journalists
Teachers, StudentsTeachers, Students
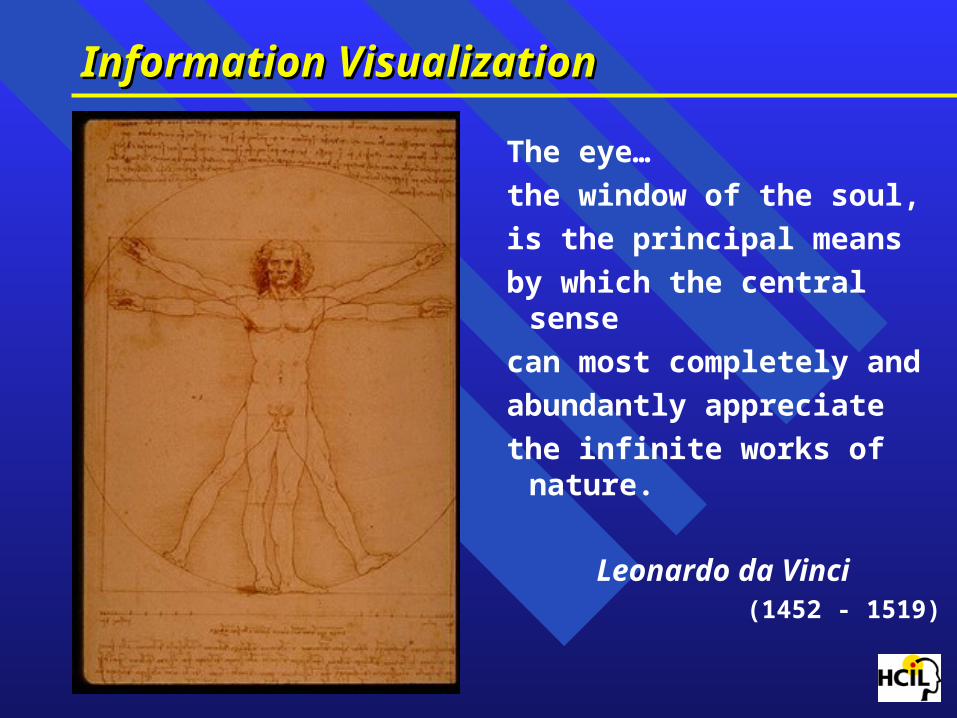
Information VisualizationInformation Visualization
The eye…
the window of the soul,
is the principal means
by which the central sense
can most completely and
abundantly appreciate
the infinite works of nature.
Leonardo da Vinci (1452 - 1519)
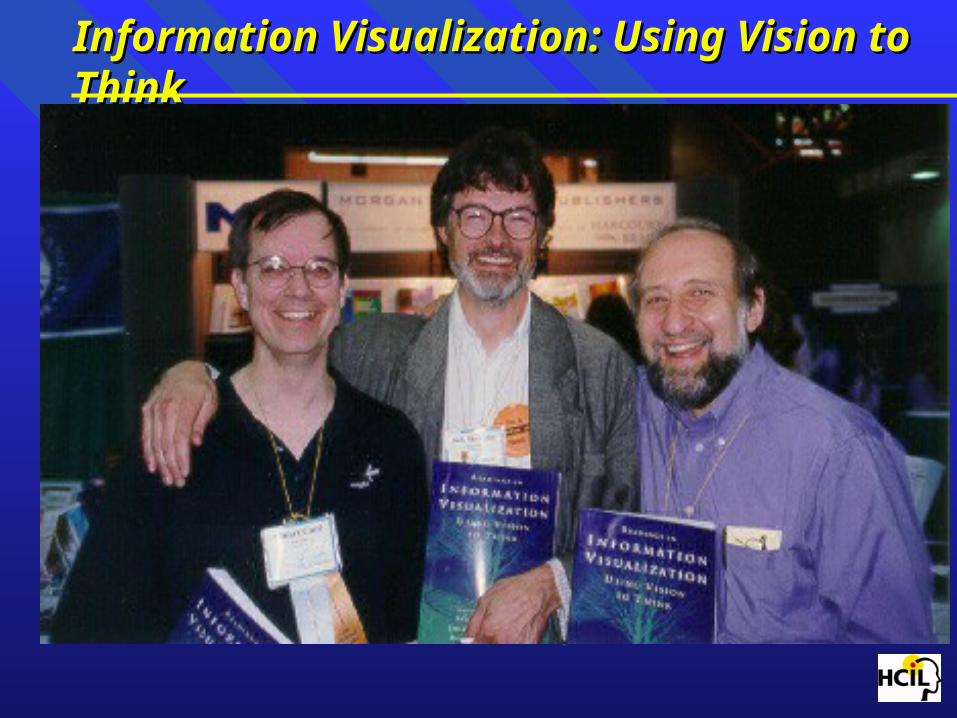
Information Visualization: Using Vision to Think Information Visualization: Using Vision to Think
Visual bandwidth is enormous Human perceptual skills are remarkable
Trend, cluster, gap, outlier... Color, size, shape, proximity...
Human image storage is fast and vast
Opportunities Spatial layouts & coordination Information visualization Scientific visualization & simulation Telepresence & augmented reality Virtual environments
Information Visualization: DefinitionInformation Visualization: Definition
Compact graphical presentation and
user interface for
manipulating large numbers of items (102 - 106),
possibly extracted from far larger datasets.
Enables users to make
discoveries,
decisions, or
explanations
about
patterns (trend, cluster, gap, outlier...),
groups of items, or
individual items.
Information Visualization: Research CentersInformation Visualization: Research Centers
Xerox PARC 3-D cone trees, perspective wall, spiral calendar table lens, hyperbolic trees, document lens, butterfly
Univ. of Maryland dynamic queries, range sliders, starfields, treemaps zoombars, tight coupling, dynamic pruning, lifelines
IBM Yorktown, AT&T-Lucent Technologies Georgia Tech, MIT Media Lab Univ. of Wisconsin, Minnesota, Calif-Berkeley
Information Visualization: Design GuidelinesInformation Visualization: Design Guidelines
Direct manipulation strategies Visual presentation of query components Visual presentation of results
Rapid, incremental and reversible actions Selection by pointing (not typing) Immediate and continuous feedback
Reduces errors Encourages exploration

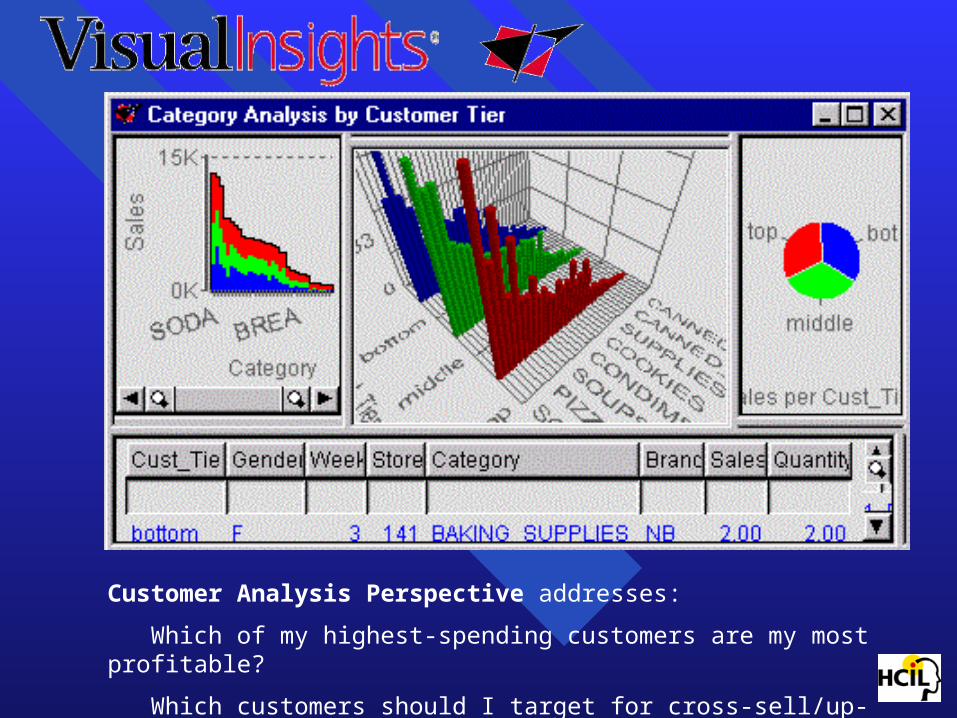
Customer Analysis Perspective addresses:
Which of my highest-spending customers are my most profitable?
Which customers should I target for cross-sell/up-sell opportunities?
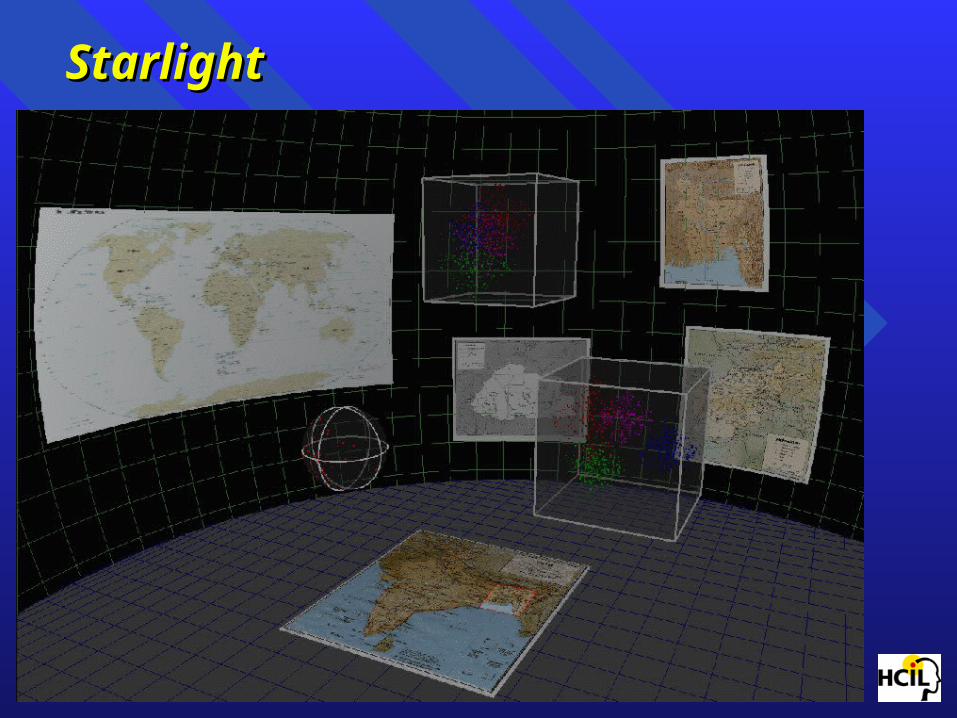
StarlightStarlight

Information Visualization: MantraInformation Visualization: Mantra
Overview, zoom & filter, details-on-demand Overview, zoom & filter, details-on-demand Overview, zoom & filter, details-on-demand Overview, zoom & filter, details-on-demand Overview, zoom & filter, details-on-demand Overview, zoom & filter, details-on-demand Overview, zoom & filter, details-on-demand Overview, zoom & filter, details-on-demand Overview, zoom & filter, details-on-demand Overview, zoom & filter, details-on-demand
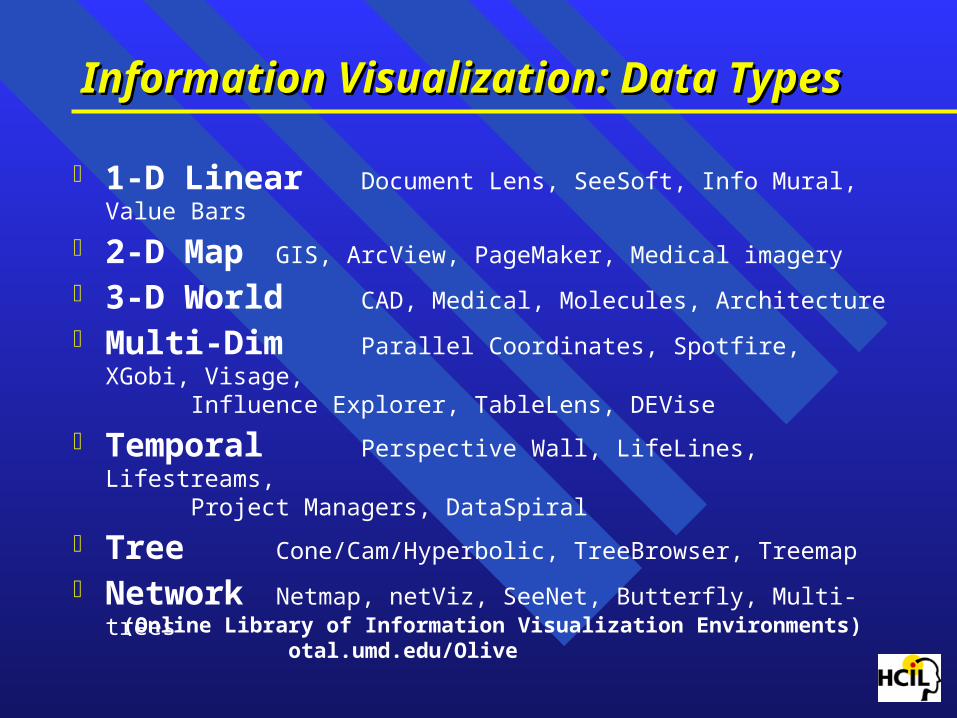
Information Visualization: Data TypesInformation Visualization: Data Types
1-D Linear Document Lens, SeeSoft, Info Mural, Value Bars
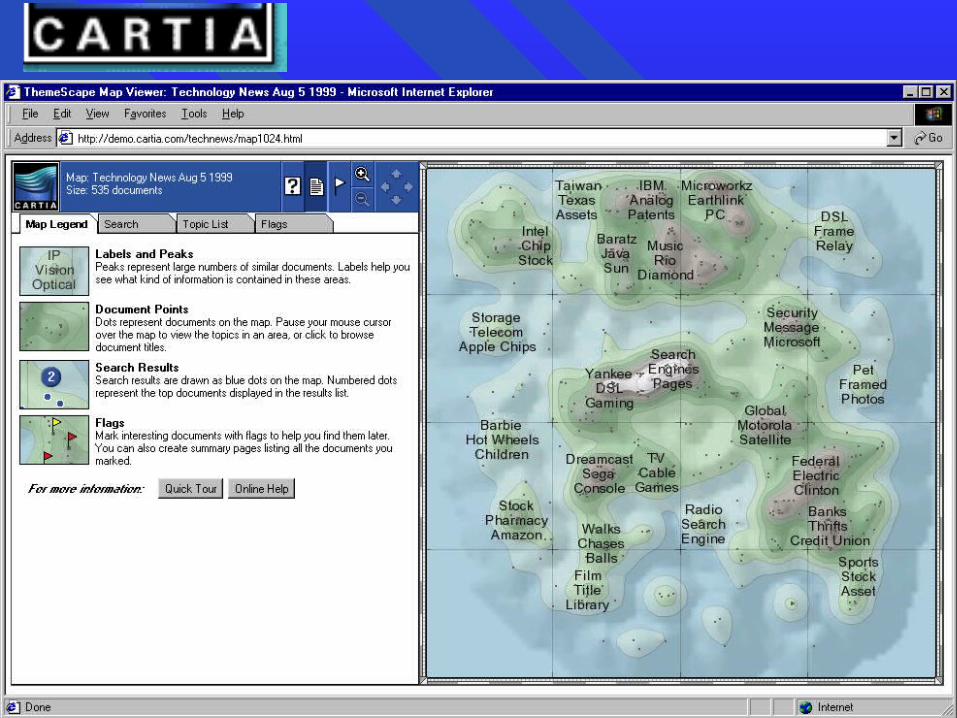
2-D Map GIS, ArcView, PageMaker, Medical imagery
3-D World CAD, Medical, Molecules, Architecture
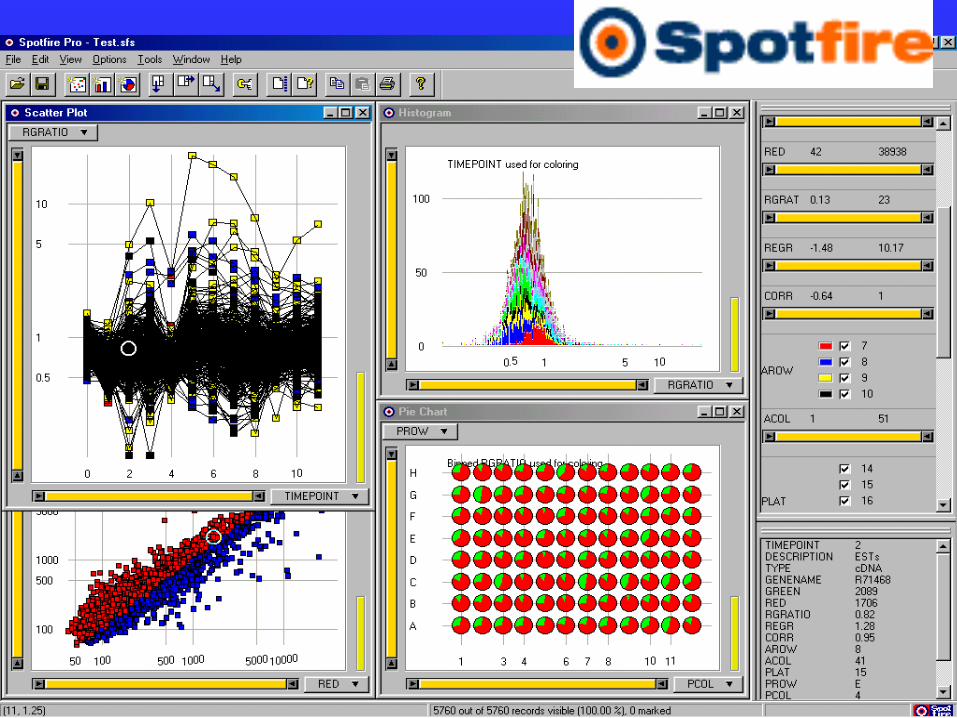
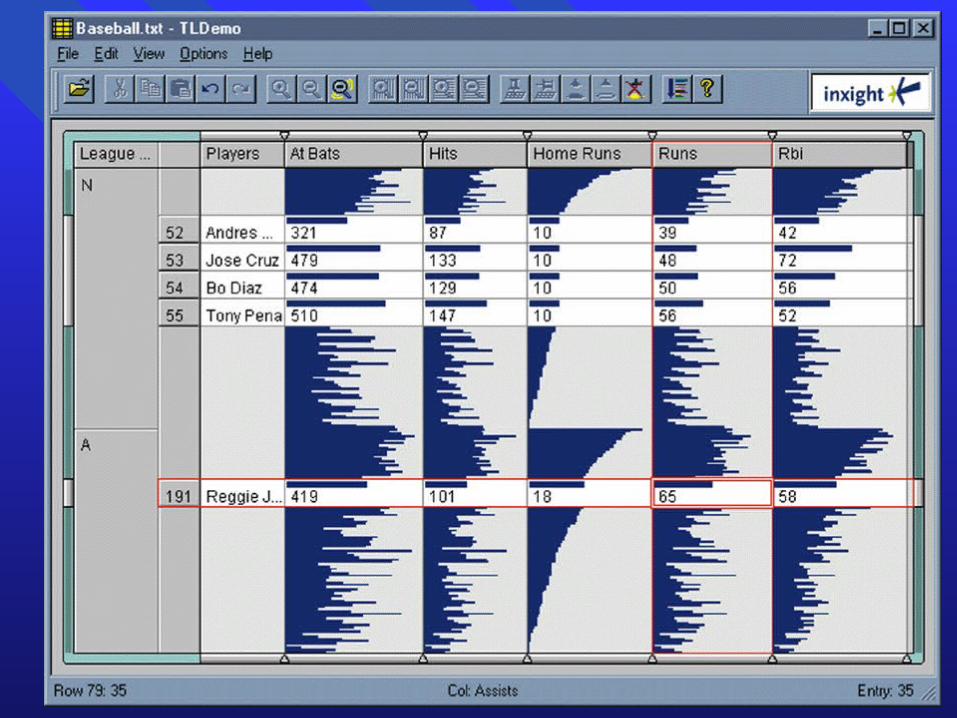
Multi-Dim Parallel Coordinates, Spotfire, XGobi, Visage, Influence Explorer, TableLens, DEVise
Temporal Perspective Wall, LifeLines, Lifestreams, Project Managers, DataSpiral
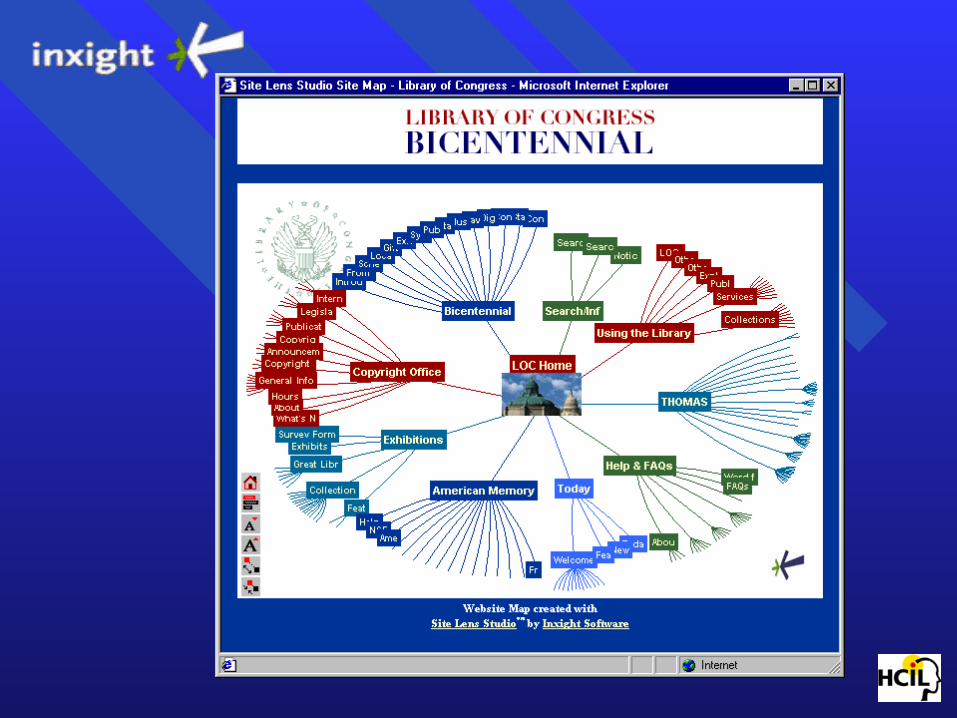
Tree Cone/Cam/Hyperbolic, TreeBrowser, Treemap
Network Netmap, netViz, SeeNet, Butterfly, Multi-trees(Online Library of Information Visualization Environments) otal.umd.edu/Olive
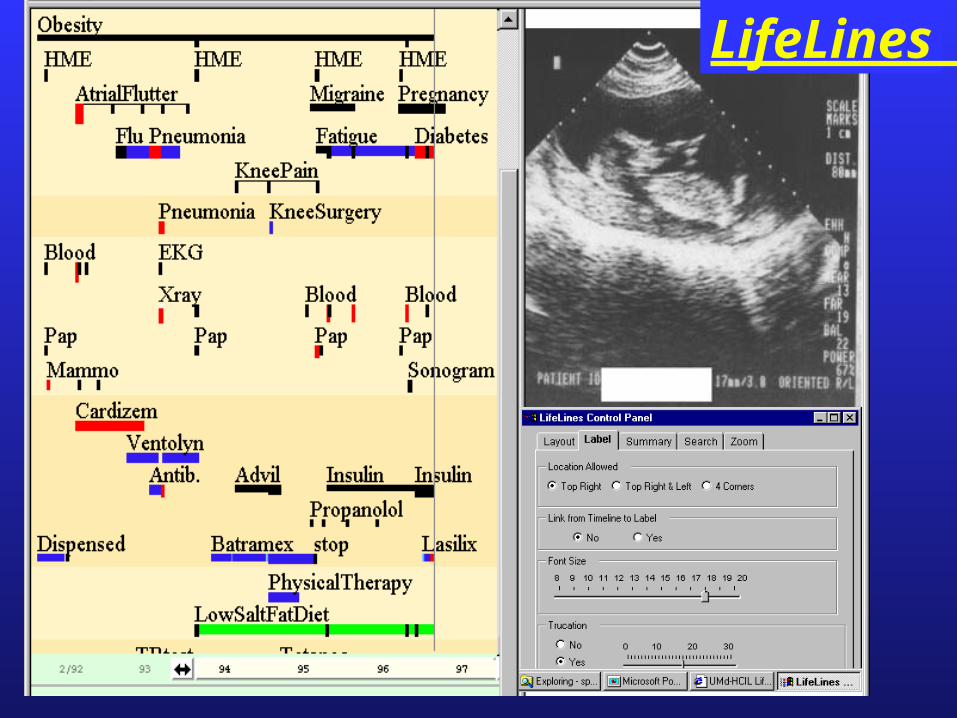
LifeLines
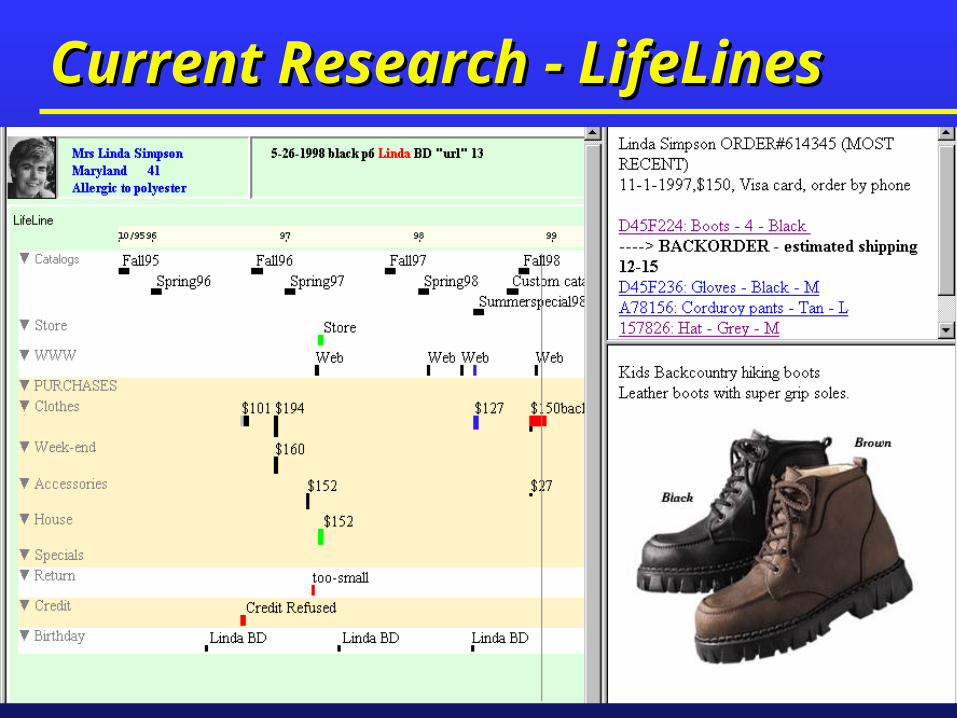
Current Research - LifeLinesCurrent Research - LifeLines
Temporal data visualizationTemporal data visualization
Medical patient historiesMedical patient historiesCustomer relationship managementCustomer relationship managementLegal case historiesLegal case histories
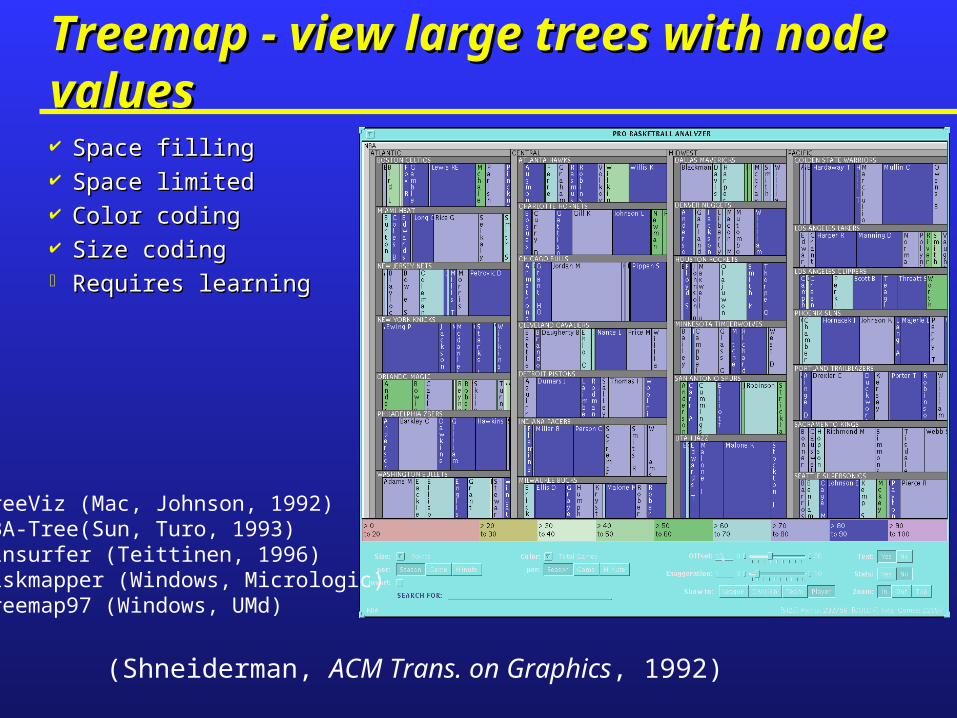
Treemap - view large trees with node valuesTreemap - view large trees with node values
Space fillingSpace filling Space limitedSpace limited Color codingColor coding Size codingSize coding Requires learningRequires learning
(Shneiderman, ACM Trans. on Graphics, 1992)
TreeViz (Mac, Johnson, 1992)NBA-Tree(Sun, Turo, 1993)Winsurfer (Teittinen, 1996)Diskmapper (Windows, Micrologic)Treemap97 (Windows, UMd)
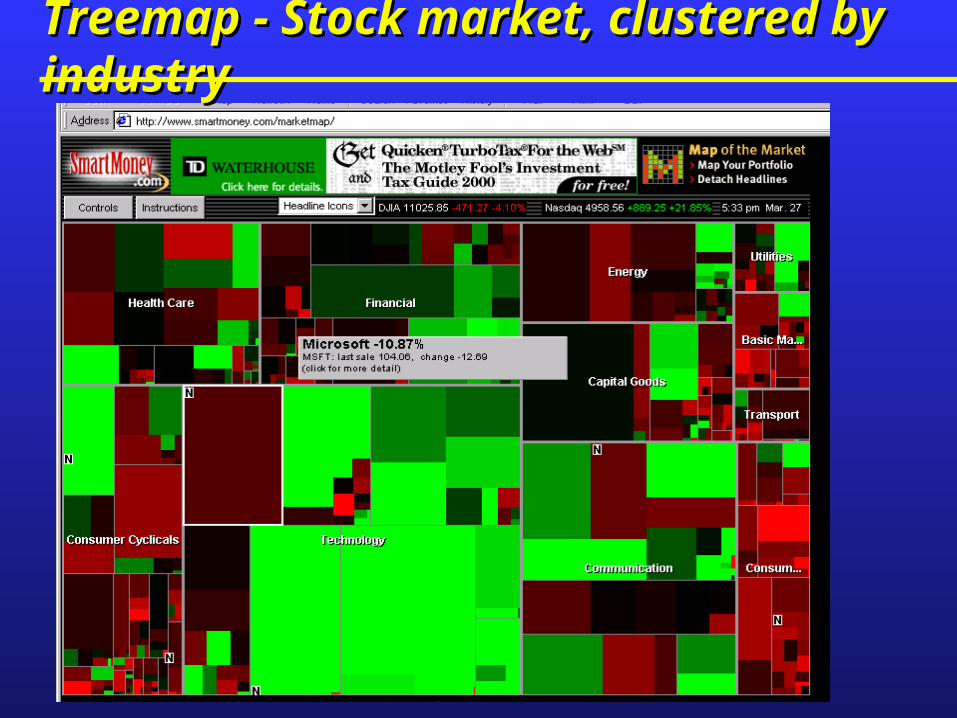
Treemap - Stock market, clustered by industryTreemap - Stock market, clustered by industry
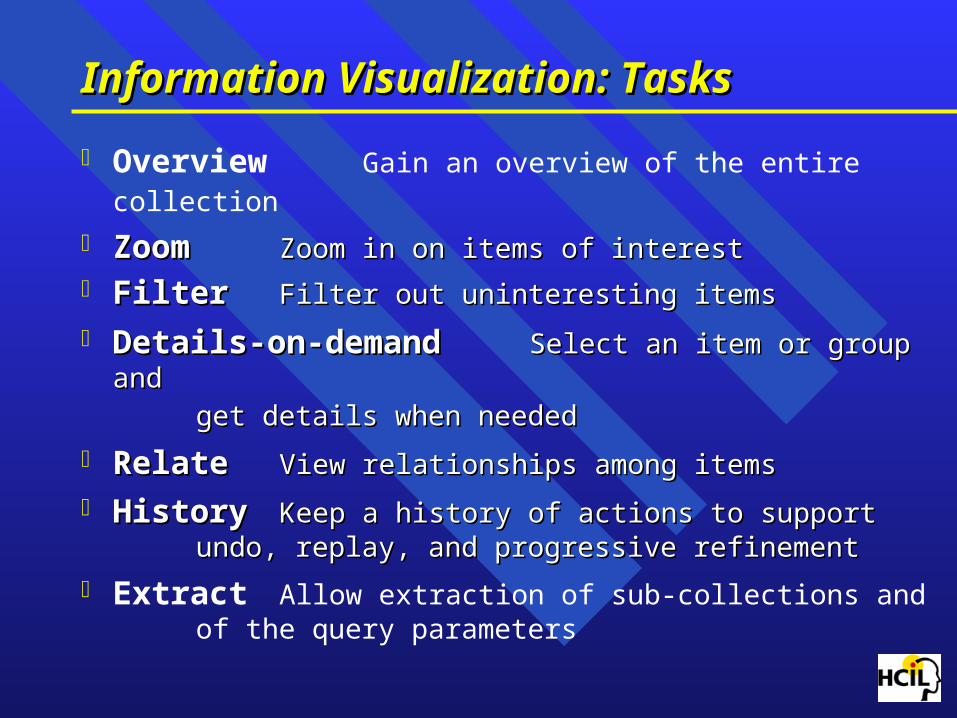
Information Visualization: TasksInformation Visualization: Tasks
Overview Gain an overview of the entire collection Zoom Zoom Zoom in on items of interestZoom in on items of interest FilterFilter Filter out uninteresting itemsFilter out uninteresting items
Details-on-demandDetails-on-demand Select an item or group and Select an item or group and
get details when neededget details when needed RelateRelate View relationships among itemsView relationships among items
HistoryHistory Keep a history of actions to support Keep a history of actions to support undo, replay, and progressive refinementundo, replay, and progressive refinement
Extract Allow extraction of sub-collections and of the query parameters
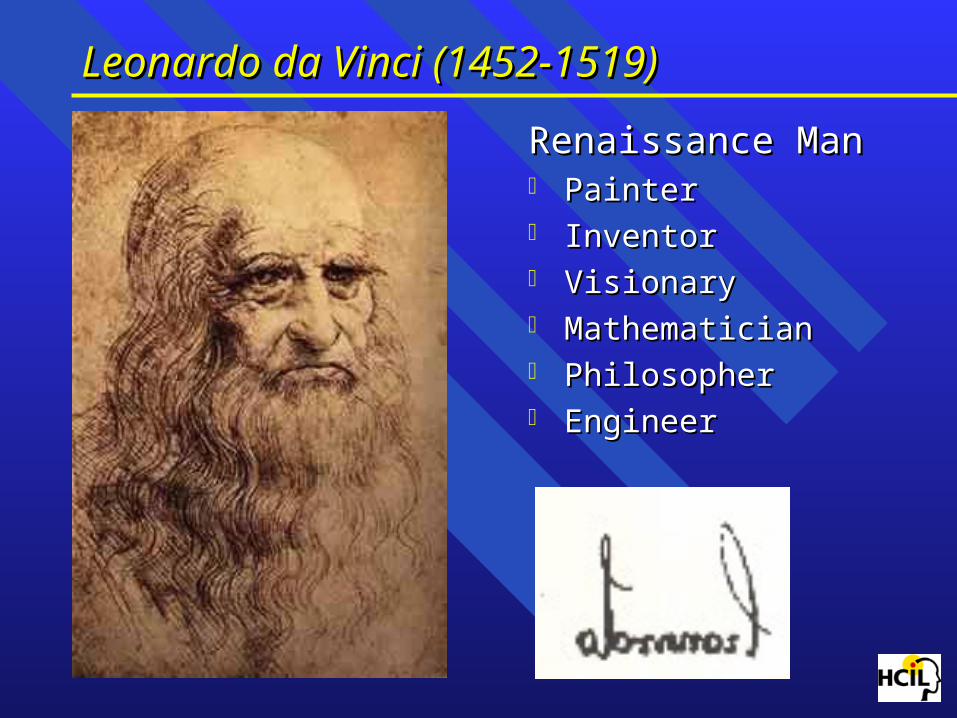
Leonardo da Vinci (1452-1519)Leonardo da Vinci (1452-1519)
Renaissance ManRenaissance Man PainterPainter InventorInventor VisionaryVisionary MathematicianMathematician PhilosopherPhilosopher EngineerEngineer

ACM Conference on Universal Usability
Washington, DC November 16-17, 2000
www.acm.org/sigchi/cuu
Human-Computer Interaction Laboratory
www.cs.umd.edu/hcil
For More InformationFor More Information
Visit the HCIL website for 140 papers & info on videosVisit the HCIL website for 140 papers & info on videos (www.cs.umd.edu/hcil)(www.cs.umd.edu/hcil)
See Chapter 15 on Info VisualizationSee Chapter 15 on Info Visualization Shneiderman, B., Shneiderman, B., Designing the User Interface:Designing the User Interface: Strategies for Effective Human-Computer Interaction: Strategies for Effective Human-Computer Interaction: Third Edition Third Edition (1998) (1998) (www.aw.com/DTUI)(www.aw.com/DTUI)
January 1999 book of readings:January 1999 book of readings: Card, S., Mackinlay, J., and Shneiderman, B. Card, S., Mackinlay, J., and Shneiderman, B. Information Visualization: Using Vision to ThinkInformation Visualization: Using Vision to Think