the face of today’s small- business owner · 2009. 10. 28. · the face of today’s...
TRANSCRIPT

The face of today’s small-business ownerUsing demographic and credit information to understand the needs of today’s small-business owner
An Experian white paper
An Experian white paper | Page 3
The small-business owner
The face of today’s small-business owner
About this studyUnderstanding today’s business owner is vital to any marketing campaign. After all, small-business owners — or companies comprising fewer than 500 employees — make up 99.7 percent of all U.S. businesses and total approximately 23 million businesses in the United States, according to the Small Business Administration (2004). Large and midsize companies seeking to sell products and services to the small-business owner will find this study useful and insightful in helping determine how to target and/or engage this highly sought-after audience.
This study examines the role demographic information plays in understanding the face of today’s small-business owner. Not only does it provide insights on the demographic makeup of a small-business owner, but it also helps marketers better understand issues facing business owners in various industries. In addition, the study highlights the correlation between the credit score of the small business and the small-business owner.
This report will offer insight into these important questions:
• Whatistheaverageageandincomeofasmall-businessowner,andhowdothese averages compare across major industries?
• Howmanysmall-businessownersalsoarehomeowners,whatistheiraveragelength of residence, and what part of the country do they live in?
• Whichsmall-businessownersaremostcharitable,andwhatcausesareimportantto them?
• Howreceptivearesmall-businessownerstomail-orderande-mailoffers?
• Doesthecreditscoreofasmallbusinesscorrelatetothecreditscoreofitsowner?
MethodologyTo develop this study, Experian® analyzed proprietary data from its INSOURCESM consumer demographic database and a specialized segment of Experian’s National BusinessDatabaseknownasBusinessOwnerLink.Byutilizingbothbusinessandconsumer information, Experian is able to provide the most comprehensive view of today’s small-business owner.
Experian first selected a random sample of 1 million small-business owners from more than 3 million Business Owner Link records. Then, researchers cross-referenced the business owner records against the 250 million consumer records from the INSOURCE consumer demographic database to compare small-business owners with the general U.S. population. The data was collected on Aug. 31, 2004.

Page 4 | The face of today’s small-business owner
The small-business owner
Section I: Small-business owner profile
AffluenceSmall-business owners are wealthier than the general population, with 69 percent more likely to belong to affluent suburbia. Small-business owners have an average income of $71,690, which is 21 percent higher than that of the U.S. population at $59,378.
Additionally, small-business owners are more likely to reside in higher-value homes; 75 percent own a home valued at $500,000 or more. Small-business owners also are at least 30 percent more interested in golfing, boating, fitness, tennis, and domestic and foreign travel than the overall population, activities that traditionally are reserved for the more affluent population.
Where the wealth lies A look at the percentage of small-business owners per decile
0%
5%
10%
15%
20%Small-business owner
National consumer average
10th9th8th7th6th5th4th3rd2nd1stWealth decilesHighest Lowest
As noted here, the small-business owner is represented higher in the top four deciles compared with the national average.
• 45percentmorelikely to reside in the highest wealth decile
• 2percentlesslikely to reside in the lowest wealth decile
Traditional household Small-business owners tend to come from traditional households — one in which there is a male head of household who is married with children. This contrasts with the popular view of a small-business owner as a younger or single entrepreneur. The national average head of household age of a small-business owner is 50.3 years old.

An Experian white paper | Page 5
Traditional households Small-business owners’ households as compared with national averages
10%
20%
30%
40%
50% Small-business owner
General population
HomeownersChildrenMale headof household
Married
National average
+
+
+
+
+
• 42percentmorelikelyto be married than the general population
• 20percentmorelikelytobe in a household with a male head of household
• 25percentmorelikelyto have children
• 11percentmorelikelyto be homeowners
Location of residence Whilesmall-businessownersaredispersedacrosstheUnitedStates,therearesome significant regional differences. This research finds that business owners are overrepresented in the Pacific and Mountain time zones compared with the general U.S. population. Conversely, this research shows that small-business owners are underrepresented in the Eastern time zone, as they are 20 percent less likely to reside in the Eastern region of the United States than the overall population.
Where small-business owners reside Likelihood as compared with the overall population, by time zone
Hawaii
Alaska
Pacific
Mountain
Central
Eastern
Time zone
National consumeraverage (%)
Small-businessowner (%)
40.3
29.97.0
22.2
0.30.3
50.2
28.7
6.1
14.5
0.20.3
• Easterntimezone: 20 percent less likely than the overall population
• Pacifictimezone: 53 percent more likely than the overall population
• Mountaintimezone: 16 percent more likely than the overall population
The small-business owner
Page 6 | The face of today’s small-business owner
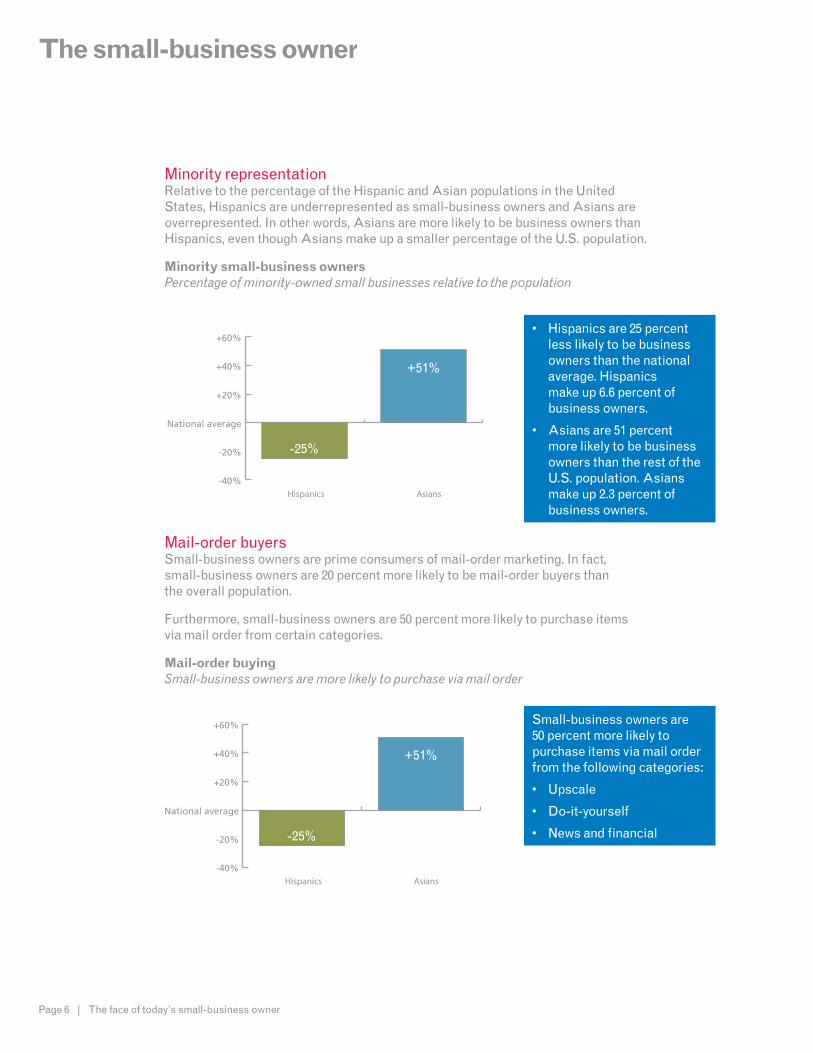
Minority representation RelativetothepercentageoftheHispanicandAsianpopulationsintheUnitedStates,Hispanicsareunderrepresentedassmall-businessownersandAsiansareoverrepresented. In other words, Asians are more likely to be business owners than Hispanics,eventhoughAsiansmakeupasmallerpercentageoftheU.S.population.
Minority small-business owners Percentage of minority-owned small businesses relative to the population
-40%
-20%
National average
+20%
+40%
+60%
AsiansHispanics
-25%
+51%
• Hispanicsare25percentless likely to be business owners than the national average.Hispanics make up 6.6 percent of business owners.
• Asiansare51percent more likely to be business owners than the rest of the U.S. population. Asians make up 2.3 percent of business owners.
Mail-order buyers Small-business owners are prime consumers of mail-order marketing. In fact, small-business owners are 20 percent more likely to be mail-order buyers than the overall population.
Furthermore, small-business owners are 50 percent more likely to purchase items via mail order from certain categories.
Mail-order buying Small-business owners are more likely to purchase via mail order
-40%
-20%
National average
+20%
+40%
+60%
AsiansHispanics
-25%
+51%
Small-business owners are 50 percent more likely to purchase items via mail order from the following categories:
• Upscale
• Do-it-yourself
• Newsandfinancial
The small-business owner

An Experian white paper | Page 7
Interest in technology Small-business owners are at least 30 percent more interested in using their PC and/or being online than the general U.S. population. Also, small-business owners are 54 percent more likely to be receptive to e-mail than the general population, with an overall e-mail receptive rate of 34 percent.
Technology use Small-business owners are more interested in technology
Overall population
+10%
+20%
+30%
+40%
+50%
+60%
E-mail usePC use
+30%
+54%
Section II: Industry focus
Demographics
IncomeThere are notable differences in the average income of a small-business owner when compared across industries. As noted in Section I, small-business owners have a 21 percent higher income than the general population, with an average income of $71,690.
The finance, insurance and real-estate industry boasts the most affluent small-business owners, with an average income 36 percent higher than other industries and nearly $10,000 more than the average income of a small-business owner. This is consistent with the fact that small-business owners in finance, insurance and real estate have high education levels and the highest percentage of undergraduate degrees when compared with other industries. Additionally, small-business owners in industries such as services, wholesale trade, public administration and manufacturing boast above-average incomes.
The small-business owner

Page 8 | The face of today’s small-business owner
Average income of a small-business owner By industry, as compared with the overall U.S. population
Rank Industry Average small-business owner income
1 Finance, insurance, real estate $80,500
2 Services $75,700
3 Wholesaletrade $73,200
4 Public administration $72,300
5 Manufacturing $71,900
6 Retail trade $69,500
7 Construction $68,300
8 Mining $66,200
9 Transportation $64,100
10 Agriculture, forestry, fishing $57,800
Overall consumer average income $59,378
AgeThe national consumer average head of household age is 51.7 years old, while small-business owners are slightly younger, with an average age of 50.3 years old. Whileseveralindustries,suchasminingandwholesaletrade,rankonoraroundthenational average, it’s significant to note that small-business owners in the finance, insurance and real-estate industry have the highest average age of any industry, with anaverageageof54.1yearsold.However,thisnumberisonlyabouttwoyearsolderthan the national average. In general, most small-business owners fall within three to four years of the national average.
Average age of a small-business owner By industry, as compared with the overall U.S. population
Rank Industry Average age (years)
1 Finance, insurance, real estate 54.1
2 Agriculture, forestry, fishing 53.5
3 Wholesaletrade 52.4
4 Mining 51.7
5 Services 50.4
6 Public administration 50.2
7 Manufacturing 50.1
8 Retail trade 49.9
9 Transportation 49.2
10 Construction 48.3
The small-business owner

An Experian white paper | Page 9
Length of residence Small-business owners tend to stay at a residence longer than the general population.Whilethenationalaveragelengthofresidenceis8.7years,it’sinterestingto note that no small-business owners in the industries examined in this report have a length of residence at or below the national average.
Small-business owners in the agriculture, the forestry and fishing, and the mining industries tend to stay longest in a residence, possibly because they are more likely to reside in rural areas. For example, those in agriculture and forestry and fishing are 4.2 times more likely to live in rural towns and farms and 57 percent more likely to be located in remote working towns. Small-business owners in the mining industry are 93 percent more likely to live in rural towns and on farms. Those living in rural areas tend to be less transient, as their job is much more dependent on location.
Average length of residence Average of small-business owner by industry, in years
Rank Industry Average length of residence
1 Agriculture, forestry, fishing 12.7 years
2 Mining 10.7 years
3 Wholesaletrade 10.3 years
4 Manufacturing 10.2 years
5 Finance, insurance, real estate 9.9 years
6 Construction 9.9 years
7 Services 9.3 years
8 Retail trade 9.2 years
9 Transportation 9.2 years
10 Public administration 8.9 years
HouseholdmakeupGeneral data shows that small-business owners are more likely than the general population to come from more traditional households, where there is typically a male head of household, married with children and a homeowner.
Whenexaminedbyindustry,small-businessownersintheconstruction,mining,wholesale trade and agriculture, forestry and fishing industries are most likely to be married. Also, construction business owners are the most likely to have children — almost doubling the national average. Those in finance, insurance and real estate are least likely to have children.
The small-business owner

Page 10 | The face of today’s small-business owner
Small-business owners in agriculture, forestry and fishing are the most likely to be homeowners, while those in the services industry are the least likely of small-business owners to be homeowners.
Household makeup Small-business owners are more likely to come from traditional households
+0 +10 +20 +30 +40 +50 +60
+0 +10 +20 +30 +40 +50 +60
Wholesale trade
Transportation
Services
Retail trade
Public administration
Mining
Manufacturing
Finance, insurance, real estate
Construction
Agriculture, forestry, fishing
Average
Married
+0 +5 +10 +15 +20 +25 +30
+0 +5 +10 +15 +20 +25 +30
Wholesale trade
Transportation
Services
Retail trade
Public administration
Mining
Manufacturing
Finance, insurance, real estate
Construction
Agriculture, forestry, fishing
Average
Male head of household
+0 +5 +10 +15 +20 +25 +30
+0 +5 +10 +15 +20 +25 +30
Wholesale trade
Transportation
Services
Retail trade
Public administration
Mining
Manufacturing
Finance, insurance, real estate
Construction
Agriculture, forestry, fishing
Average
Children
+0 +5 +10 +15 +20 +25
+0 +5 +10 +15 +20 +25
Wholesale trade
Transportation
Services
Retail trade
Public administration
Mining
Manufacturing
Finance, insurance, real estate
Construction
Agriculture, forestry, fishing
Average
Homeowners
Numbers represented in the above graphs are the percentage more likely than the overall population
The small-business owner

An Experian white paper | Page 11
Minority representation ThefollowingisabreakdownofHispanicandAsianethnicgroupsasrepresentedby small-business owners within the various Standard Industrial Classification codes compared with the overall consumer population.
Hispanic and Asian small-business owners Compared with the overall consumer population
+0% +2% +4% +6% +8% +10%
+0% +2% +4% +6% +8% +10%
AsianHispanic
Wholesale trade
Transportation
Services
Retail trade
Public administration
Mining
Manufacturing
Finance, insurance, real estate
Construction
Agriculture, forestry, fishing
Average 8.8
3.8
6.8
4.5
5.2
4.6
5.9
8.9
6.1
8.8
6.3
1.5
0.6
0.8
1.6
1.7
0.6
2.0
3.7
2.5
1.0
2.6
Civic-minded activities/Charitable givingAs noted, small-business owners are more likely to make charitable donations than those who do not own a business. This study examined small-business charitable trends for environmental, religious, political and health causes.
Charitable causes Percentage of small-business owners who donate to causes compared with the overall consumer population
+0% +5% +10% +15% +20% +25% +30% +35%
+0% +5% +10% +15% +20% +25% +30% +35%
PoliticalReligiousEnvironmental
Wholesale trade
Transportation
Services
Retail trade
Public administration
Mining
Manufacturing
Finance, insurance, real estate
Construction
Agriculture, forestry, fishing
Average
• Small-businessownersinthefinance,insuranceand real-estate industries have the highest religious and political contribution rates of all industries researched in this report.
• Small-businessownersinthetransportationandconstruction trades have the lowest charitable donation rates. In fact, transportation is the only industry where business owners are less likely than the overall population to be donors.
• Thewholesaletradeindustryboaststhesecond-highest donation rates in environmental and political causes.
• Small-businessownersinfinance,insuranceandreal estate are more than 90 percent more likely to donate to religious and political causes. This trend is likely a result of this group’s having the highest average income of any of the industries studied.
The small-business owner

Page 12 | The face of today’s small-business owner
Consumer behavior
Mail-order buyers As noted in Section I, small-business owners are prime consumers to target via mail order, as they are 20 percent more likely to be mail-order buyers than the overall population.
Whenanalyzedbyindustry,small-businessownersinfinance,insuranceandrealestate are the most likely to be consumers of mail-order products and services. In fact, business owners in this industry account for the highest buy rates of news and financial products and business supply items.
Those in the transportation industry are least likely to be mail-order purchasers. A close second to last are business owners in the retail trade industry, as by nature they are loyal to retail shopping because it is their business.
IndustryMore likely to be mail-order buyer
Mail-order buy rate
Categories
Finance, insurance, real estate
32 77.6
50 percent or more likely to purchase upscale products, male products, do-it-yourself items, news and financial, food and vitamins, business supplies and gift items; highest buy rates of news and financial and business supplies
Agriculture, forestry, fishing
29 82.5
50 percent or more likely to purchase male products, do-it-yourself items, children’s products, crafts and hobby products, athletic equipment, furnishings and linens, and gardening supplies
Mining 27 81.8
50 percent or more likely to purchase upscale products, male products, sweepstakes/contests, do-it-yourself items, news and financial, crafts and hobby products, gardening supplies, and food and vitamins
Wholesaletrade
25 79
50 percent or more likely to purchase upscale, male products, do-it-yourself items, news and financial, crafts and hobby products, and business supplies; second-highest buy rates via mail order for news and financial and business supplies
The small-business owner

An Experian white paper | Page 13
IndustryMore likely to be mail-order buyer
Mail-order buy rate
Categories
Manufacturing 25 80
50 percent or more likely to purchase upscale products, male products, do-it-yourself items, news and financial products, crafts and hobby products, food and vitamins, and business supplies
Services 24 80.750 percent or more likely to purchase upscale, news and financial, food and vitamins, and business supplies
Construction 23 78.750 percent or more likely to purchase do-it-yourself items; not overly intensive mail-order purchasers
Public administration
20 77.6
50 percent or more likely to purchase upscale products, male products, do-it-yourself items, news and financial, children’s products, crafts and hobby products, athletic equipment, furnishings and linens, food and vitamins, and business supplies
Retail trade 20 77.6 Appear to be loyal to retail shopping
Transportation 16 67.3Least likely to be mail-order buyers among business owners
E-mail receptivity Small-business owners in the agriculture, forestry and fishing industry have the lowest e-mail receptivity rates and are 24 percent less likely than the general population to be receptive to e-mail marketing. But this trend is not the norm. In general, small-business owners are 54 percent more likely to be receptive to e-mail than the general population, and the most e-mail receptive audiences include those in services, finance, insurance and real estate and public administration.
The small-business owner

Page 14 | The face of today’s small-business owner
E-mail receptivity Percentage of small-business owners by industry who are more likely to be receptive to e-mail
Rank Industry Percent more likely
1 Services 73
2 Finance, insurance, real estate 69
3 Public administration 68
4 Wholesaletrade 56
5 Manufacturing 53
6 Retail trade 53
7 Construction 41
8 Mining 33
9 Transportation 15
10 Agriculture, forestry, fishing -24
Section III: Analyzing the credit score of a business and business owner
Industry research suggests that small-business owners often blur the lines of their business and personal expenses,1 using their personal and commercial credit cards and bank accounts interchangeably. Such information strongly suggests there could be a correlation between a small-business owner’s and a business’s credit risk.
Knowing how a small-business owner’s personal credit score correlates with the credit score of his or her business offers financial institutions looking to market to this target audience a more comprehensive and holistic view of a business’s creditworthiness and risk, helping them make important lending and financing decisions.
The following research offers a trend2 analysis between a business owner’s business credit score and his or her personal credit score.
MethodologyExperian examined a random sample of 1,000 records from Scorex PLUS,SM a high-performance credit scoring model that provides individuals with a personal credit score, and Commercial Intelliscore,SM an advanced credit scoring model that provides credit scores for more than 18 million U.S. businesses, to determine if there are any significant correlations between the two scores.
The small-business owner
1MasterCard Small Business Economic and Spend Outlook Survey, May 20042Trend designations were based on a comparison of credit data from Quarter 8 and Quarter 1 of the sample set.

An Experian white paper | Page 15
The small-business owner
Key findings• Sixty-onepercentoftherecordshadastableconsumercreditscoreversus
53 percent for the commercial credit score. These findings suggest that a business’s credit score is more dynamic and may fluctuate depending on business ebbs and flows, while a personal credit score exhibits more stability over time.
• Twenty-fourpercentofcommercialcreditscoresdeclinedovertimeversus16 percent of the consumer credit scores. This finding supports the fact that a business’s credit score is again more dynamic and changes as a business evolves. Most importantly, these findings mean that marketers should take both scores into account when determining a business’s creditworthiness and risk.
• Thereisasignificantpositivecorrelationbetweentheconsumercreditscoreand the commercial credit score. Thus, positive changes in one score frequently are associated with positive changes in the other score. Conversely, negative changes in one score frequently are associated with negative changes in the other score.
• Thecorrelationbetweentheconsumercreditscoreandthecommercialcreditscore increases directionally over time.
Whilethereisadefinitecorrelationbetweenhowasmall-businessownermeetspersonal obligations and business obligations, it is always a good idea to blend consumer and commercial scores. In blending these scores, one can elevate predictiveness and get a much better picture of the credit quality of a particular small business.
ConclusionWithsmallbusinessesdominatingthebusiness-to-businessmarket,itisclearthatthey are a lucrative and influential segment to market to. The characteristics of these small businesses are unique, so it is critical to uncover distinguishing information on them when planning a marketing campaign.
This report shed light on the fact that small-business owners come from higher income levels, are more civic-minded than the general population, are more likely to be computer/online users and are more receptive to e-mail marketing efforts than the general population. The report also spotlighted the true distinctions of small-business owners across various industries.
In addition to understanding the demographic makeup of today’s small-business owners, this study showed that there is a correlation between a business owner’s personal credit score and his or her business’s credit score. This factor can help marketers better determine whom they should and shouldn’t target for financial products and services — enabling them to make better, faster and more successful marketing decisions.
Page 16 | The face of today’s small-business owner
Savvy marketers realize that a 360-degree view of today’s small-business owner can make or break their marketing campaign. The more information marketers know about their target audience, the greater chance of success they will experience in their future marketing endeavors.
About Commercial IntelliscoreSM
Using a commercial database of more than 18 million U.S. businesses combined with advanced technology and enhanced algorithms, Experian’s Commercial IntelliscoreSM enables clients to process a greater number of transactions more accurately and cost-effectively.
About Scorex PLUSSM
Scorex PLUSSM is a high-performance scoring alternative for lenders who are seeking the latest in advanced scoring technology. It provides a greater level of detail, offers custom scalability for easier adoption and can be applied in a tri-bureau environment.
About INSOURCESM
INSOURCESMDatabase,whichcomprisesapproximately250millionindividualsand 110 million living units, is updated continually from thousands of public and proprietary sources. INSOURCE records are coded for mailing and telemarketing use. The database also provides information on households experiencing important life events, such as new homeowners and parents, who are likely to make purchases to support their new situation.
About Business Owner LinkBusiness Owner Link provides information on more than 3 million small-business owners, enabling marketers to make reliable marketing decisions. Business Owner Link intelligence includes the business owner’s name and personal address and the demographic profile of the business.
The small-business owner
An Experian white paper | Page 17
The small-business owner
About ExperianExperian is a global leader in providing information, analytical and marketing services to organizations and consumers to help manage the risk and reward of commercial and financial decisions.
Combining its unique information tools and deep understanding of individuals, markets and economies, Experian partners with organizations around the world to establish and strengthen customer relationships and provide their businesses with competitive advantage.
For consumers, Experian delivers critical information that enables them to make financial and purchasing decisions with greater control and confidence. Clients include organizations from financial services, retail and catalog, telecommunications, utilities, media, insurance, automotive, leisure, e-commerce, manufacturing, property and government sectors.
Experian plc is listed on the London Stock Exchange (EXPN) and is a constituent oftheFTSE100index.ExperianhascorporateheadquartersinDublin,Ireland,andoperational headquarters in Costa Mesa, Calif., and Nottingham, UK. The Group employs approximately 15,500 people in 38 countries worldwide, supporting clients in more than 65 countries around the world. Continuing sales for the year ended March 31, 2008, were in excess of $4 billion.
For more information, visit Experian plc’s Web site on www.experiangroup.com.

475 Anton Blvd.Costa Mesa, CA 92626T: 1 800 850 4389www.experianmarketingservices.com
©2008ExperianInformationSolutions,Inc.•Allrightsreserved
Experian and the marks used herein are service marks or registered trademarks of Experian Information Solutions, Inc.
Other product and company names mentioned herein may be the trademarks of their respective owners.
09/08•9004/1018•4789-CS