the feasibility of endocardial propagation mapping using magnetic resonance guidance in a swine...
TRANSCRIPT

IEEE TRANSACTIONS ON MEDICAL IMAGING, VOL. 31, NO. 4, APRIL 2012 977
The Feasibility of Endocardial PropagationMapping Using Magnetic Resonance Guidancein a Swine Model, and Comparison WithStandard Electroanatomic Mapping
Samuel O. Oduneye*, Labonny Biswas, Sudip Ghate, Venkat Ramanan, Jennifer Barry, Avishag Laish-FarKash,Ehud Kadmon, Tawfiq Zeidan Shwiri, Eugene Crystal, and Graham A. Wright
Abstract—The introduction of electroanatomic mapping (EAM)has improved the understanding of the substrate of ventriculartachycardia. EAM systems are used to delineate scar regionsresponsible for the arrhythmia by creating voltage or activationtime maps. Previous studies have identified the benefits of creatingMR-guided voltage maps; however, in some cases voltage mapsmay not identify regions of slow propagation that can cause thereentrant tachycardia. In this study, we obtained local activationtime maps and analyzed propagation properties by performingMR-guidedmapping of the porcine left ventricle while pacing fromthe right ventricle. Anatomical and myocardial late gadoliniumenhancement images were used for catheter navigation and iden-tification of scar regions. Our MR-guided mapping procedureshowed qualitative correspondence to conventional clinical EAMsystems in healthy pigs and demonstrated altered propagation inendocardial infarct models.
Index Terms—Electrophysiology, image-guided treatment, mag-netic resonance imaging (MRI).
I. INTRODUCTION
R ADIO-FREQUENCY (RF) ablation has been shown toreduce recurrence rate of ventricular tachycardia (VT)
in patients with structural heart disease [1]. For sustainedmonomorphic VTs, scar tissue within the myocardium createsthe conditions for a reentrant VT; specifically, a reentrantpathway may arise between dense infarct scar zones or betweena scar and an anatomical obstacle [2]–[4]. Such pathways have
Manuscript received August 19, 2011; revised October 24, 2011; acceptedOctober 25, 2011. Date of publication November 04, 2011; date of currentversion April 04, 2012. This work was supported by the Canadian Institutesof Health Research and the Ontario Research Fund. Asterisk indicates corre-sponding author.*S. O. Oduneye is with the Imaging Research, Sunnybrook Research Insti-
tute, Toronto, ON, M4N 3M5 Canada, and also with the Department of MedicalBiophysics, University of Toronto, Toronto, ON, M5G 2M9 Canada (e-mail:[email protected]).L. Biswas, S. Ghate, V. Ramanan, and J. Barry are with the Sunnybrook Re-
search Institute, Toronto, ON, M4N 3M5 Canada.A. Laish-FarKash, E. Kadmon, T. Zeidan Shwiri, and E. Crystal are with the
Arrhythmia Services, Sunnybrook Health Science Centre, Toronto ON, M4N3M5 Canada.G. A. Wright is with the Imaging Research, Sunnybrook Research Institute,
Toronto, ON, M4N 3M5 Canada, and also with the Department of Medical Bio-physics, University of Toronto, Toronto, ON, M5G 2M9 Canada.Color versions of one or more of the figures in this paper are available online
at http://ieeexplore.ieee.org.Digital Object Identifier 10.1109/TMI.2011.2174645
been shown to contain bundles of surviving myocytes intermin-gled with fibrosis, creating areas of slow conduction [5], [6]; thedepolarization wave propagates in the narrow bundles of viablemyocardium often following a circuitous route, effectivelyproducing a slow conduction velocity channel needed for thereentrant tachycardia. To eliminate these arrhythmogenic slowconduction zones associated with present and potential VTs inpatients with myocardial infarctions, these channels must bemapped and ablated. Recently, the understanding of VT mech-anisms has greatly increased in part due to the introduction ofelectroanatomic mapping (EAM) systems. These systems, suchas Ensite NavX and CARTO, are used to define the geometry ofthe cardiac chambers and to determine the regions responsiblefor the arrhythmia by creating voltage and/or activation timemaps. In the case of VT, careful and detailed identificationof reentry circuits is extremely important to increase successrates in ablation treatments. Previous studies have presentedalternative methods to delineate scar regions in sinus rhythmand during right ventricular apex stimulation with voltage maps[7], [8]. However, in [2], it was also shown that conventionallydefining all tissue with voltage potential below 0.5 mV as scar,might not be applicable to all cases and may lead to missedidentification of slow conduction channels. This case is espe-cially true when the slow conduction channel (which has highervoltage potential) is completely surrounded by a low voltagepotential area. Therefore, assessment of local activation times(LAT) may provide additional and complementary information,particularly a critical functional description of slow conductionchannels, during cardiac mapping in patients affected by VT.Recently, there has been an effort to guide electrophysiology
(EP) studies directly with magnetic resonance imaging (MRI)[9]–[11]. Three aspects make this approach extremely attrac-tive: 1) MRI has a superior soft tissue contrast, which increasesthe ability to identify arrhythmogenic areas, 2) both the patientand the interventional cardiologist are not exposed to ionizingradiation, and 3) 3-D navigation of catheters and visualizationof anatomical structures. Despite the success of MR-guided EPprocedures, studies in the ventricle have, to date, mainly focusedon creating voltage maps, which may be of limited utility, aspreviously mentioned in identifying slow conduction channelsoften responsible for VT.The objectives of the current research are 1) to show the fea-
sibility and performance of an electrophysiology (EP) study in
0278-0062/$26.00 © 2011 IEEE
978 IEEE TRANSACTIONS ON MEDICAL IMAGING, VOL. 31, NO. 4, APRIL 2012
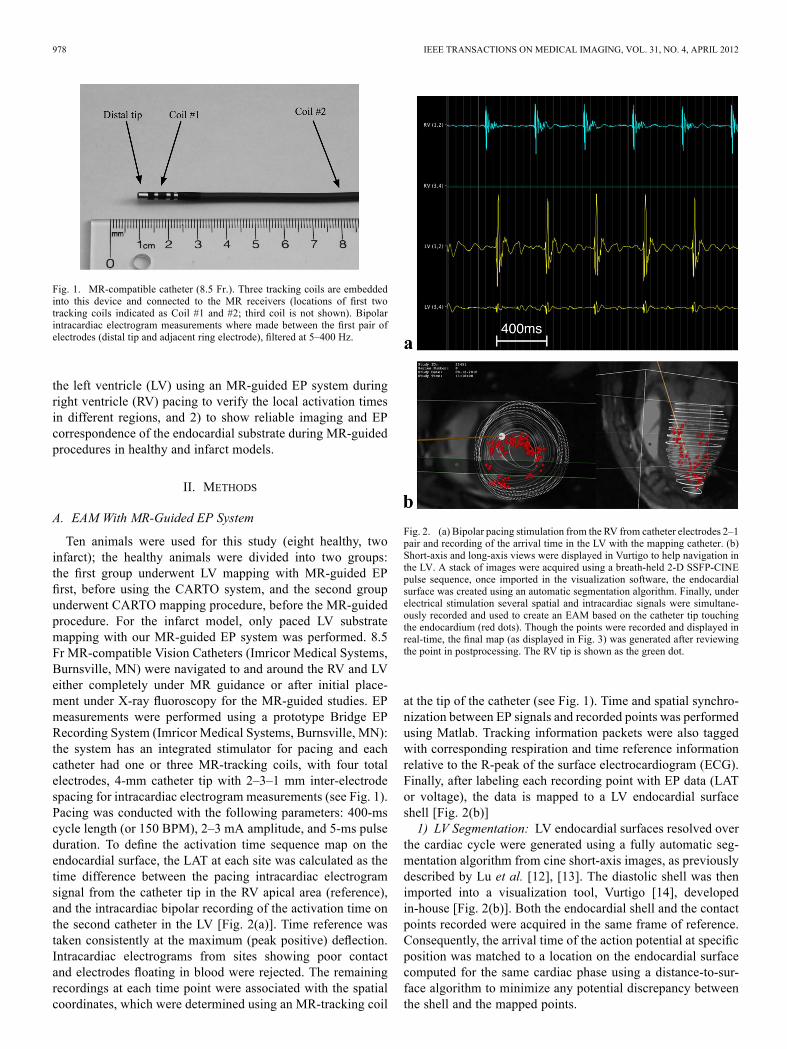
Fig. 1. MR-compatible catheter (8.5 Fr.). Three tracking coils are embeddedinto this device and connected to the MR receivers (locations of first twotracking coils indicated as Coil #1 and #2; third coil is not shown). Bipolarintracardiac electrogram measurements where made between the first pair ofelectrodes (distal tip and adjacent ring electrode), filtered at 5–400 Hz.
the left ventricle (LV) using an MR-guided EP system duringright ventricle (RV) pacing to verify the local activation timesin different regions, and 2) to show reliable imaging and EPcorrespondence of the endocardial substrate during MR-guidedprocedures in healthy and infarct models.
II. METHODS
A. EAM With MR-Guided EP System
Ten animals were used for this study (eight healthy, twoinfarct); the healthy animals were divided into two groups:the first group underwent LV mapping with MR-guided EPfirst, before using the CARTO system, and the second groupunderwent CARTO mapping procedure, before the MR-guidedprocedure. For the infarct model, only paced LV substratemapping with our MR-guided EP system was performed. 8.5Fr MR-compatible Vision Catheters (Imricor Medical Systems,Burnsville, MN) were navigated to and around the RV and LVeither completely under MR guidance or after initial place-ment under X-ray fluoroscopy for the MR-guided studies. EPmeasurements were performed using a prototype Bridge EPRecording System (Imricor Medical Systems, Burnsville, MN):the system has an integrated stimulator for pacing and eachcatheter had one or three MR-tracking coils, with four totalelectrodes, 4-mm catheter tip with 2–3–1 mm inter-electrodespacing for intracardiac electrogram measurements (see Fig. 1).Pacing was conducted with the following parameters: 400-mscycle length (or 150 BPM), 2–3 mA amplitude, and 5-ms pulseduration. To define the activation time sequence map on theendocardial surface, the LAT at each site was calculated as thetime difference between the pacing intracardiac electrogramsignal from the catheter tip in the RV apical area (reference),and the intracardiac bipolar recording of the activation time onthe second catheter in the LV [Fig. 2(a)]. Time reference wastaken consistently at the maximum (peak positive) deflection.Intracardiac electrograms from sites showing poor contactand electrodes floating in blood were rejected. The remainingrecordings at each time point were associated with the spatialcoordinates, which were determined using an MR-tracking coil
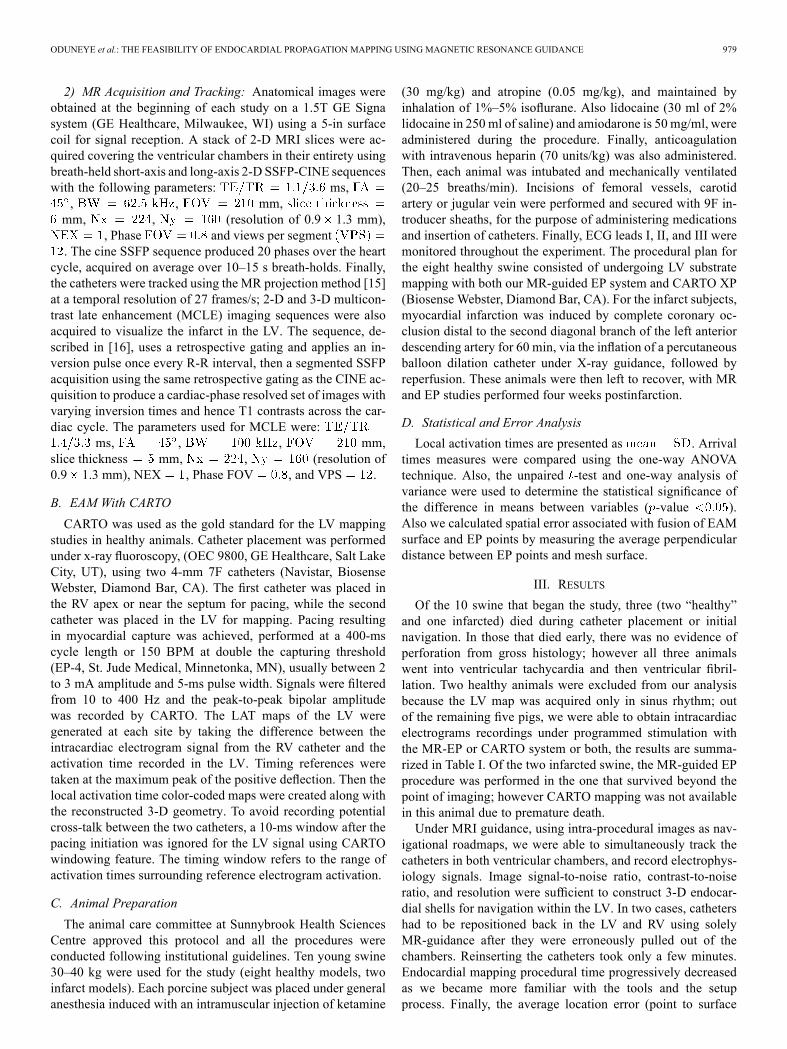
Fig. 2. (a) Bipolar pacing stimulation from the RV from catheter electrodes 2–1pair and recording of the arrival time in the LV with the mapping catheter. (b)Short-axis and long-axis views were displayed in Vurtigo to help navigation inthe LV. A stack of images were acquired using a breath-held 2-D SSFP-CINEpulse sequence, once imported in the visualization software, the endocardialsurface was created using an automatic segmentation algorithm. Finally, underelectrical stimulation several spatial and intracardiac signals were simultane-ously recorded and used to create an EAM based on the catheter tip touchingthe endocardium (red dots). Though the points were recorded and displayed inreal-time, the final map (as displayed in Fig. 3) was generated after reviewingthe point in postprocessing. The RV tip is shown as the green dot.
at the tip of the catheter (see Fig. 1). Time and spatial synchro-nization between EP signals and recorded points was performedusing Matlab. Tracking information packets were also taggedwith corresponding respiration and time reference informationrelative to the R-peak of the surface electrocardiogram (ECG).Finally, after labeling each recording point with EP data (LATor voltage), the data is mapped to a LV endocardial surfaceshell [Fig. 2(b)]1) LV Segmentation: LV endocardial surfaces resolved over
the cardiac cycle were generated using a fully automatic seg-mentation algorithm from cine short-axis images, as previouslydescribed by Lu et al. [12], [13]. The diastolic shell was thenimported into a visualization tool, Vurtigo [14], developedin-house [Fig. 2(b)]. Both the endocardial shell and the contactpoints recorded were acquired in the same frame of reference.Consequently, the arrival time of the action potential at specificposition was matched to a location on the endocardial surfacecomputed for the same cardiac phase using a distance-to-sur-face algorithm to minimize any potential discrepancy betweenthe shell and the mapped points.
ODUNEYE et al.: THE FEASIBILITY OF ENDOCARDIAL PROPAGATION MAPPING USING MAGNETIC RESONANCE GUIDANCE 979
2) MR Acquisition and Tracking: Anatomical images wereobtained at the beginning of each study on a 1.5T GE Signasystem (GE Healthcare, Milwaukee, WI) using a 5-in surfacecoil for signal reception. A stack of 2-D MRI slices were ac-quired covering the ventricular chambers in their entirety usingbreath-held short-axis and long-axis 2-D SSFP-CINE sequenceswith the following parameters: ms,, , mm,mm, , (resolution of 0.9 1.3 mm),
, Phase and views per segment. The cine SSFP sequence produced 20 phases over the heart
cycle, acquired on average over 10–15 s breath-holds. Finally,the catheters were tracked using the MR projection method [15]at a temporal resolution of 27 frames/s; 2-D and 3-D multicon-trast late enhancement (MCLE) imaging sequences were alsoacquired to visualize the infarct in the LV. The sequence, de-scribed in [16], uses a retrospective gating and applies an in-version pulse once every R-R interval, then a segmented SSFPacquisition using the same retrospective gating as the CINE ac-quisition to produce a cardiac-phase resolved set of images withvarying inversion times and hence T1 contrasts across the car-diac cycle. The parameters used for MCLE were:
ms, , , mm,slice thickness mm, , (resolution of0.9 1.3 mm), NEX , Phase FOV , and VPS .
B. EAM With CARTO
CARTO was used as the gold standard for the LV mappingstudies in healthy animals. Catheter placement was performedunder x-ray fluoroscopy, (OEC 9800, GE Healthcare, Salt LakeCity, UT), using two 4-mm 7F catheters (Navistar, BiosenseWebster, Diamond Bar, CA). The first catheter was placed inthe RV apex or near the septum for pacing, while the secondcatheter was placed in the LV for mapping. Pacing resultingin myocardial capture was achieved, performed at a 400-mscycle length or 150 BPM at double the capturing threshold(EP-4, St. Jude Medical, Minnetonka, MN), usually between 2to 3 mA amplitude and 5-ms pulse width. Signals were filteredfrom 10 to 400 Hz and the peak-to-peak bipolar amplitudewas recorded by CARTO. The LAT maps of the LV weregenerated at each site by taking the difference between theintracardiac electrogram signal from the RV catheter and theactivation time recorded in the LV. Timing references weretaken at the maximum peak of the positive deflection. Then thelocal activation time color-coded maps were created along withthe reconstructed 3-D geometry. To avoid recording potentialcross-talk between the two catheters, a 10-ms window after thepacing initiation was ignored for the LV signal using CARTOwindowing feature. The timing window refers to the range ofactivation times surrounding reference electrogram activation.
C. Animal Preparation
The animal care committee at Sunnybrook Health SciencesCentre approved this protocol and all the procedures wereconducted following institutional guidelines. Ten young swine30–40 kg were used for the study (eight healthy models, twoinfarct models). Each porcine subject was placed under generalanesthesia induced with an intramuscular injection of ketamine
(30 mg/kg) and atropine (0.05 mg/kg), and maintained byinhalation of 1%–5% isoflurane. Also lidocaine (30 ml of 2%lidocaine in 250 ml of saline) and amiodarone is 50 mg/ml, wereadministered during the procedure. Finally, anticoagulationwith intravenous heparin (70 units/kg) was also administered.Then, each animal was intubated and mechanically ventilated(20–25 breaths/min). Incisions of femoral vessels, carotidartery or jugular vein were performed and secured with 9F in-troducer sheaths, for the purpose of administering medicationsand insertion of catheters. Finally, ECG leads I, II, and III weremonitored throughout the experiment. The procedural plan forthe eight healthy swine consisted of undergoing LV substratemapping with both our MR-guided EP system and CARTO XP(Biosense Webster, Diamond Bar, CA). For the infarct subjects,myocardial infarction was induced by complete coronary oc-clusion distal to the second diagonal branch of the left anteriordescending artery for 60 min, via the inflation of a percutaneousballoon dilation catheter under X-ray guidance, followed byreperfusion. These animals were then left to recover, with MRand EP studies performed four weeks postinfarction.
D. Statistical and Error Analysis
Local activation times are presented as . Arrivaltimes measures were compared using the one-way ANOVAtechnique. Also, the unpaired -test and one-way analysis ofvariance were used to determine the statistical significance ofthe difference in means between variables ( -value ).Also we calculated spatial error associated with fusion of EAMsurface and EP points by measuring the average perpendiculardistance between EP points and mesh surface.
III. RESULTS
Of the 10 swine that began the study, three (two “healthy”and one infarcted) died during catheter placement or initialnavigation. In those that died early, there was no evidence ofperforation from gross histology; however all three animalswent into ventricular tachycardia and then ventricular fibril-lation. Two healthy animals were excluded from our analysisbecause the LV map was acquired only in sinus rhythm; outof the remaining five pigs, we were able to obtain intracardiacelectrograms recordings under programmed stimulation withthe MR-EP or CARTO system or both, the results are summa-rized in Table I. Of the two infarcted swine, the MR-guided EPprocedure was performed in the one that survived beyond thepoint of imaging; however CARTO mapping was not availablein this animal due to premature death.Under MRI guidance, using intra-procedural images as nav-
igational roadmaps, we were able to simultaneously track thecatheters in both ventricular chambers, and record electrophys-iology signals. Image signal-to-noise ratio, contrast-to-noiseratio, and resolution were sufficient to construct 3-D endocar-dial shells for navigation within the LV. In two cases, cathetershad to be repositioned back in the LV and RV using solelyMR-guidance after they were erroneously pulled out of thechambers. Reinserting the catheters took only a few minutes.Endocardial mapping procedural time progressively decreasedas we became more familiar with the tools and the setupprocess. Finally, the average location error (point to surface
980 IEEE TRANSACTIONS ON MEDICAL IMAGING, VOL. 31, NO. 4, APRIL 2012
TABLE I
distance) of the acquired mapping points was calculated tobe mm. Our spatial error seems to be significantlylower than the CartoMerge point to surface registration errorsin the ventricle reported in the literature: mm [17],
mm [18], mm [19], mm [20].
A. Electroanatomical Mapping (EAM) Results
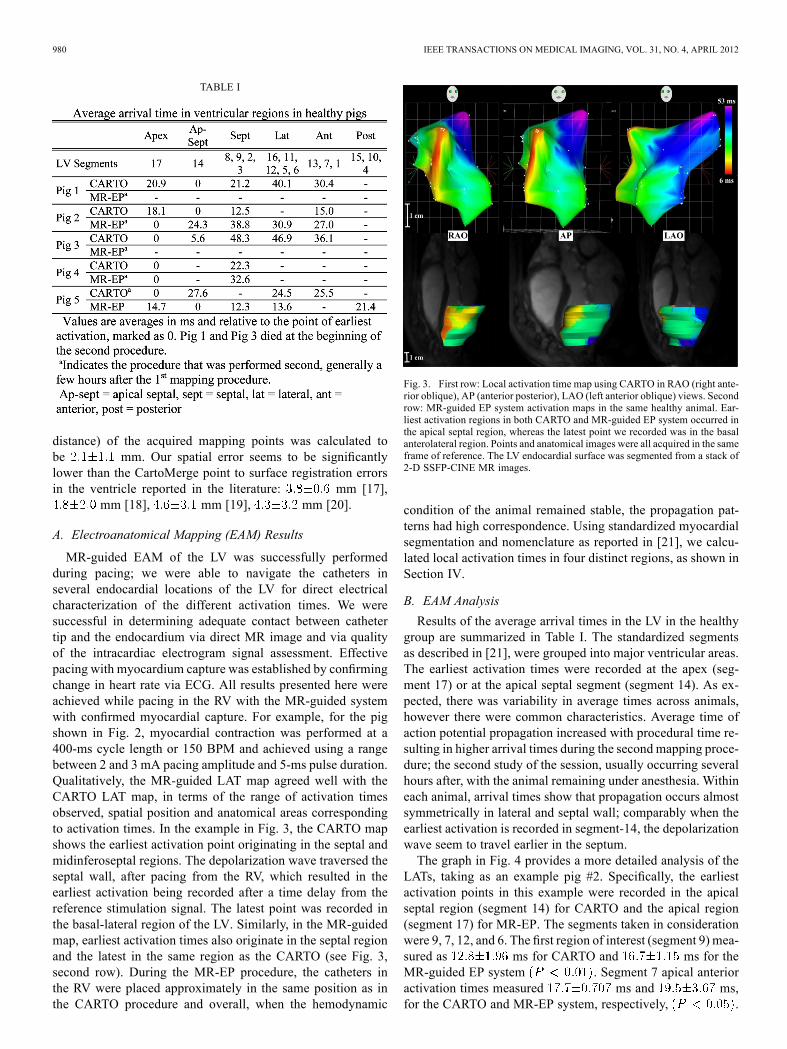
MR-guided EAM of the LV was successfully performedduring pacing; we were able to navigate the catheters inseveral endocardial locations of the LV for direct electricalcharacterization of the different activation times. We weresuccessful in determining adequate contact between cathetertip and the endocardium via direct MR image and via qualityof the intracardiac electrogram signal assessment. Effectivepacing with myocardium capture was established by confirmingchange in heart rate via ECG. All results presented here wereachieved while pacing in the RV with the MR-guided systemwith confirmed myocardial capture. For example, for the pigshown in Fig. 2, myocardial contraction was performed at a400-ms cycle length or 150 BPM and achieved using a rangebetween 2 and 3 mA pacing amplitude and 5-ms pulse duration.Qualitatively, the MR-guided LAT map agreed well with theCARTO LAT map, in terms of the range of activation timesobserved, spatial position and anatomical areas correspondingto activation times. In the example in Fig. 3, the CARTO mapshows the earliest activation point originating in the septal andmidinferoseptal regions. The depolarization wave traversed theseptal wall, after pacing from the RV, which resulted in theearliest activation being recorded after a time delay from thereference stimulation signal. The latest point was recorded inthe basal-lateral region of the LV. Similarly, in the MR-guidedmap, earliest activation times also originate in the septal regionand the latest in the same region as the CARTO (see Fig. 3,second row). During the MR-EP procedure, the catheters inthe RV were placed approximately in the same position as inthe CARTO procedure and overall, when the hemodynamic
Fig. 3. First row: Local activation time map using CARTO in RAO (right ante-rior oblique), AP (anterior posterior), LAO (left anterior oblique) views. Secondrow: MR-guided EP system activation maps in the same healthy animal. Ear-liest activation regions in both CARTO and MR-guided EP system occurred inthe apical septal region, whereas the latest point we recorded was in the basalanterolateral region. Points and anatomical images were all acquired in the sameframe of reference. The LV endocardial surface was segmented from a stack of2-D SSFP-CINE MR images.
condition of the animal remained stable, the propagation pat-terns had high correspondence. Using standardized myocardialsegmentation and nomenclature as reported in [21], we calcu-lated local activation times in four distinct regions, as shown inSection IV.
B. EAM Analysis
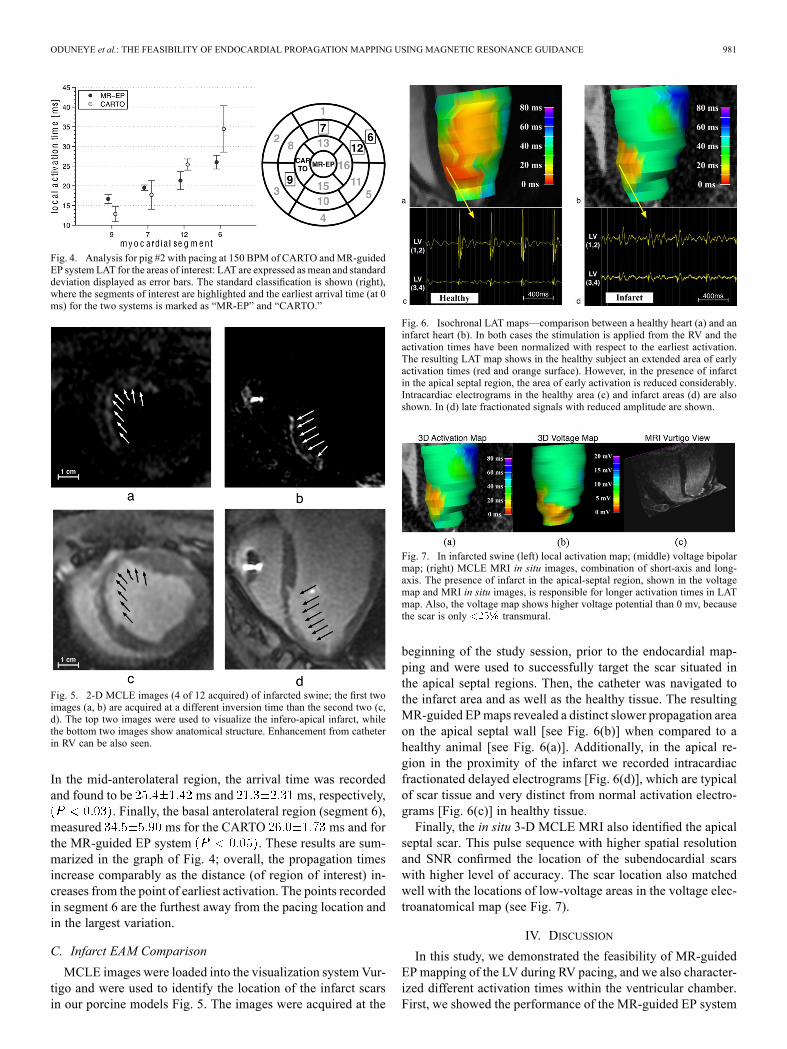
Results of the average arrival times in the LV in the healthygroup are summarized in Table I. The standardized segmentsas described in [21], were grouped into major ventricular areas.The earliest activation times were recorded at the apex (seg-ment 17) or at the apical septal segment (segment 14). As ex-pected, there was variability in average times across animals,however there were common characteristics. Average time ofaction potential propagation increased with procedural time re-sulting in higher arrival times during the second mapping proce-dure; the second study of the session, usually occurring severalhours after, with the animal remaining under anesthesia. Withineach animal, arrival times show that propagation occurs almostsymmetrically in lateral and septal wall; comparably when theearliest activation is recorded in segment-14, the depolarizationwave seem to travel earlier in the septum.The graph in Fig. 4 provides a more detailed analysis of the
LATs, taking as an example pig #2. Specifically, the earliestactivation points in this example were recorded in the apicalseptal region (segment 14) for CARTO and the apical region(segment 17) for MR-EP. The segments taken in considerationwere 9, 7, 12, and 6. The first region of interest (segment 9) mea-sured as ms for CARTO and ms for theMR-guided EP system . Segment 7 apical anterioractivation times measured ms and ms,for the CARTO and MR-EP system, respectively, .
ODUNEYE et al.: THE FEASIBILITY OF ENDOCARDIAL PROPAGATION MAPPING USING MAGNETIC RESONANCE GUIDANCE 981
Fig. 4. Analysis for pig #2 with pacing at 150 BPM of CARTO andMR-guidedEP system LAT for the areas of interest: LAT are expressed asmean and standarddeviation displayed as error bars. The standard classification is shown (right),where the segments of interest are highlighted and the earliest arrival time (at 0ms) for the two systems is marked as “MR-EP” and “CARTO.”
Fig. 5. 2-D MCLE images (4 of 12 acquired) of infarcted swine; the first twoimages (a, b) are acquired at a different inversion time than the second two (c,d). The top two images were used to visualize the infero-apical infarct, whilethe bottom two images show anatomical structure. Enhancement from catheterin RV can be also seen.
In the mid-anterolateral region, the arrival time was recordedand found to be ms and ms, respectively,
. Finally, the basal anterolateral region (segment 6),measured ms for the CARTO ms and forthe MR-guided EP system . These results are sum-marized in the graph of Fig. 4; overall, the propagation timesincrease comparably as the distance (of region of interest) in-creases from the point of earliest activation. The points recordedin segment 6 are the furthest away from the pacing location andin the largest variation.
C. Infarct EAM Comparison
MCLE images were loaded into the visualization systemVur-tigo and were used to identify the location of the infarct scarsin our porcine models Fig. 5. The images were acquired at the
Fig. 6. Isochronal LAT maps—comparison between a healthy heart (a) and aninfarct heart (b). In both cases the stimulation is applied from the RV and theactivation times have been normalized with respect to the earliest activation.The resulting LAT map shows in the healthy subject an extended area of earlyactivation times (red and orange surface). However, in the presence of infarctin the apical septal region, the area of early activation is reduced considerably.Intracardiac electrograms in the healthy area (c) and infarct areas (d) are alsoshown. In (d) late fractionated signals with reduced amplitude are shown.
Fig. 7. In infarcted swine (left) local activation map; (middle) voltage bipolarmap; (right) MCLE MRI in situ images, combination of short-axis and long-axis. The presence of infarct in the apical-septal region, shown in the voltagemap and MRI in situ images, is responsible for longer activation times in LATmap. Also, the voltage map shows higher voltage potential than 0 mv, becausethe scar is only transmural.
beginning of the study session, prior to the endocardial map-ping and were used to successfully target the scar situated inthe apical septal regions. Then, the catheter was navigated tothe infarct area and as well as the healthy tissue. The resultingMR-guided EPmaps revealed a distinct slower propagation areaon the apical septal wall [see Fig. 6(b)] when compared to ahealthy animal [see Fig. 6(a)]. Additionally, in the apical re-gion in the proximity of the infarct we recorded intracardiacfractionated delayed electrograms [Fig. 6(d)], which are typicalof scar tissue and very distinct from normal activation electro-grams [Fig. 6(c)] in healthy tissue.Finally, the in situ 3-D MCLE MRI also identified the apical
septal scar. This pulse sequence with higher spatial resolutionand SNR confirmed the location of the subendocardial scarswith higher level of accuracy. The scar location also matchedwell with the locations of low-voltage areas in the voltage elec-troanatomical map (see Fig. 7).
IV. DISCUSSION
In this study, we demonstrated the feasibility of MR-guidedEP mapping of the LV during RV pacing, and we also character-ized different activation times within the ventricular chamber.First, we showed the performance of the MR-guided EP system

982 IEEE TRANSACTIONS ON MEDICAL IMAGING, VOL. 31, NO. 4, APRIL 2012
compared to a clinical standard system, CARTO. EAMs werecreated in healthy swine to verify that the two systems quali-tatively yielded similar propagation patterns. Second, we com-pared the local activation times in healthy models, identifyingthe different ventricle segments and comparing the arrival timesof the depolarization wave in those segments for CARTO andMR-EP. Finally, we observed the effects of infarcted tissue onthe local activation time maps.The acquisition of LAT maps with an MR-guided mapping
system has several potential benefits in an EP study. LAT maps,have the potential of identifying a reentry circuit responsiblefor VT, in cases when a voltage map does not detect slow con-ducting channels associated with the presence heterogeneoustissue with mixed electrical properties. The conventional classi-fication of dense infarct scar as voltage potential below 0.5 mVhas significant limitations including the fact that it may missbundles of surviving myocytes surrounded by low voltage re-gions which are still able to depolarize, creating the substrate forVT. Therefore, MR-guided LATmaps may complement voltagemaps. Our MR-guided EP system also reduces registration pro-cessing steps when compared to CARTO, potentially reducingthe sources of registration errors. Both the endocardial shell andthe touch-point geometry were acquired in the same frame ofreference; no manual image segmentation and landmark selec-tion process was required to align the anatomy to the EP infor-mation, reducing procedural steps.This study presented several challenges. For example, the
missing data in Table I was the result of some animals under-going sudden cardiac events. The majority of them had episodesof ventricular tachycardia/fibrillation leading to deaths hoursinto the procedure. In all those cases, cardiac defibrillation andmechanical compression were performed by our veterinarystaff. In two cases we were able to revive the animals, butthe ensuing cardiac function was extremely compromised,resulting in early termination of the study. In one case thepig died following a sudden depression of cardiac functionand heart rate, which could not be reversed with heart rateincreasing medications (i.e., epinephrine).In our animal studies, we observed measurement variability
that can be classified into two types: variability across theanimals and variability within each animal. The discrepanciesobserved across the animals have already been explained in theliterature [22]. During intracardiac procedures, prophylacticmeasures are used to prevent arrhythmias and vasospasmbecause swine are very prone to induction of ventricularfibrillation when the myocardium is stimulated or irritated.Specifically, anti-arrhythmic drugs are given along withanesthetic drugs. As a consequence, there is a challenge inreproducing the exact electrophysiological conditions acrossanimals, since both anesthetic and anti-arrhythmic drugs havea varied degree of effect in each animal. Despite our effortsto mitigate these effects we still observed variability acrossanimals. The author in [22] suggests that analysis results wouldbenefit from using each animal as its own control, comparingeach animal’s experimental measurements to its own baselinemeasurements. The intra-animal variability, which is respon-sible for the limited MRI-CARTO agreement observed, is acomplex issue and it depends on several factors. Placing two
pacing catheters in the same identical positions between theCARTO and MR-EP procedures was a challenge and mayhave also contributed to some discrepancies observed acrossmeasurements within the same animal. Attaching (via screw)a pacing lead onto the myocardium may improve results dueto location consistency. An additional contributing factor tothe deviation between measurements is the mode of actionof anesthetic gases on ion currents and ion channels in car-diomyocytes; this topic is still the subject of investigation[23]. In the case of isoflurane, it is believed that it interfereswith the action potential duration by changing the kineticsof , decisive for the upstroke component of the actionpotential. Most notably, this anesthetic extends the “recovery”time of the channels required to restore the resting state fromwhich a renewed depolarization is capable of evoking a fullactivation, resulting in slowing down conduction [24]. Effectsof isoflurane in swine models and other volatile gasses havebeen inconsistent with some studies showing increase actionpotential duration while others showing shortening. However,the overall consensus seems to be that these gases are certainlycontributing to changes in cardiomyocytes behavior. In ourstudies we observed a relative slow conduction effect with time,which seems to be in agreement with Suzuki et al. observations[24], which found isoflurane to increase the effective refractoryperiod. Most notably, in our studies propagation delays weretypically longer in the second mapping session compared tothe first in each study (with either CARTO or MR-EP system);this is most likely due to isoflurane accumulation effects onconduction velocity in the ventricular myocardium after severalhours of anesthetic [25]. Therefore, the combination of isoflu-rane effect on ionic currents and concentration of isoflurane, isthe most likely cause of intra-animal variability.In our infarct studies, 2-D and 3-D MRI results provided crit-
ical information including wall thickness, scar presence, extentof scars, and local structure. In clinical settings, this informa-tion could affect procedure management. The MCLE imagesalso provided different contrasts across different cardiac phases,which made the MR-guided EP procedure easier: the visual-ization of the scar facilitated navigation of the catheter tip di-rectly to the specific location. In the resulting EAM, we ob-served voltage higher than 0 mV and slower conduction timeon the endocardial surface immediately adjacent to the infarct,which may suggest that the depolarization wave still traveledaround or through the infarct region, albeit at a reduced ve-locity. The result was not totally unexpected since the infarctwas % transmural and also bundles of viable tissue mayhave been still present in the region.Our system has also some known limitations. Although
acquired points are displayed in real time onto the LV shell,the raw EP signals are recorded by the Bridge system, whereasimaging and tracking information are displayed on Vurtigo,which runs on a seperate system; after the completion of thestudy, processing the data consist of synchronizing timingand spatial information and the elimination of rejected points.These results are then imported into Vurtigo for creation of theEAM volumes. Mapped points in the LV depicting poor contactaccording to the electrogram signal were rejected. Additionalfiltering was performed by using only points from the same
ODUNEYE et al.: THE FEASIBILITY OF ENDOCARDIAL PROPAGATION MAPPING USING MAGNETIC RESONANCE GUIDANCE 983
cardiac phase cycle as the surface shell (generally diastole).Ideally, a real-time data processing approach would facilitateimmediate data reacquisition if poor data were acquired, moreclosely resembling the conventional clinical systems. Further-more, there is a fusion error between prior MRI volumes andEP points. The catheter touch-points were filtered to matchthe cardiac phase (diastole); however, a limiting factor is thetemporal resolution (50 ms) of the prior MRI volume. Wemeasured the latency of communication between the scanneracquisition board to display in Vurtigo and found it to be 64ms ms. Therefore, the spatial error would correspond tothe displacement of the cardiac wall over this time interval dueto a small diastolic motion and a small respiratory motion. Wecalculated this error by measuring the average perpendiculardistance point to surface (in diastolic phase). Additional spatialregistration errors that require estimation and/or compensationare the cycle-to-cycle variation due to cardiac and respiratorymotion. Validation and improvement of the spatial and temporalfusion is a work in progress.
V. CONCLUSION
In this paper, we performed EP studies in the porcine LVusing an MR-guided EP system while pacing from the RV; wefound qualitative agreement between the activation times and aclinical gold standard. We showed that imaging and MR guidedelectrophysiologic measurements were possible in a few ani-mals with myocardial infarction.
ACKNOWLEDGMENT
The authors would like to thank Dr. M. Pop for usefulconversations; R. Flor and S. Pintilie for technical supportduring in vivo experiments, and Imricor Medical Systems forproviding the Bridge System and MR-compatible electrophysi-ology catheters.
REFERENCES[1] W. Stevenson et al., “Radiofrequency catheter ablation of ventricular
tachycardia after myocardial infarction,”Circulation, vol. 98, no. 4, pp.308–308, Jul. 1998.
[2] A. Arenal et al., “Tachycardia related channel in the scar tissue inpatients with sustained monomorphic ventricular tachycardias: Influ-ence of the voltage scar definition,” Circulation, vol. 110, no. 17, pp.2568–2574, Oct. 2004.
[3] C. de Chillou et al., “Isthmus characteristics of reentrant ventriculartachycardia after myocardial infarction,” Circulation, vol. 105, no. 6,pp. 726–731, Feb. 2002.
[4] C. Knackstedt, P. Schauerte, and P. Kirchhof, “Electro-anatomic map-ping systems in arrhythmias,” J. Working Groups Cardiac Pacing, Ar-rhythmias, Cardiac Cellular Electrophysiol. Eur. Soc. Cardiol., vol.10, pp. iii28–iii34, Nov. 2008.
[5] J. De Bakker et al., “Slow conduction in the infarcted human heart.’Zigzag’ course of activation,”Circulation, vol. 88, no. 3, pp. 915–915,Sep. 1993.
[6] J. M. de Bakker et al., “Reentry as a cause of ventricular tachycardiain patients with chronic ischemic heart disease: Electrophysiologic andanatomic correlation,” Circulation, vol. 77, no. 3, pp. 589–606, Mar.1988.
[7] C. B. Brunckhorst et al., “Ventricular mapping during atrial andventricular pacing. Relationship of multipotential electrograms toventricular tachycardia reentry circuits after myocardial infarction,”Eur. Heart J., vol. 23, no. 14, pp. 1131–1138, Jul. 2002.
[8] K. Soejima et al., “Electrically unexcitable scar mapping based onpacing threshold for identification of the reentry circuit isthmus: Fea-sibility for guiding ventricular tachycardia ablation,” Circulation, vol.106, no. 13, pp. 1678–1683, Sep. 2002.
[9] S. R. Dukkipati et al., “Electroanatomic mapping of the left ventriclein a porcine model of chronic myocardial infarction with magneticresonance-based catheter tracking,” Circulation, vol. 118, no. 8, pp.853–862, Aug. 2008.
[10] S. Nazarian et al., “Feasibility of real-timemagnetic resonance imagingfor catheter guidance in electrophysiology studies,” Circulation, vol.118, no. 3, pp. 223–223, Jul. 2008.
[11] E. Schmidt et al., “Electro-Anatomic mapping and radio-frequency ab-lation of porcine left atria and atrio-ventricular nodes using magneticresonance catheter tracking,” Circ. Arrhythm Electrophysiol., vol. 2,no. 6, pp. 695–704, Dec. 2009.
[12] Y. Lu et al., “Pattern recognition of abnormal left ventricle wall motionin cardiac MR,” in Conf. MICCAI2009, 2009, vol. 5762, pp. 750–758.
[13] Y. Lu et al., “Segmentation of left ventricle in cardiac cine MRI: Anautomatic image-driven method,” FIMH, pp. 339–347, 2009.
[14] S. Pintilie et al., VURTIGO: Visualization Software for Real-Time,Image-Guided Interventions 2009 [Online]. Available: mirror.transact.net.au
[15] C. L. Dumoulin, S. P. Souza, and R. D. Darrow, “Real-time posi-tion monitoring of invasive devices using magnetic resonance,”Magn.Reson. Med., vol. 29, no. 3, pp. 411–415, Mar. 1993.
[16] J. S. Detsky et al., “Inversion-recovery-prepared SSFP for cardiac-phase-resolved delayed-enhancement MRI,” Magn. Reson. Med., vol.58, no. 2, pp. 365–372, Aug. 2007.
[17] A. P. Wijnmaalen et al., “Head-to-head comparison of contrast-en-hanced magnetic resonance imaging and electroanatomical voltagemapping to assess post-infarct scar characteristics in patients withventricular tachycardias: Real-time image integration and reversedregistration,” Eur. Heart J., vol. 32, no. 1, pp. 104–114, Jan. 2011.
[18] Y. Okumura et al., “Three-dimensional ultrasound for image-guidedmapping and intervention: Methods, quantitative validation, and clin-ical feasibility of a novel multimodality image mapping system,” Circ.Arrhythm Electrophysiol., vol. 1, no. 2, pp. 110–119, Jun. 2008.
[19] T. Dickfeld et al., “MRI-Guided ventricular tachycardia ablation: In-tegration of late gadolinium-enhanced 3-D scar in patients with im-plantable cardioverter-defibrillators,” Circ. Arrhythm Electrophysiol.,vol. 4, no. 2, pp. 172–184, Apr. 2011.
[20] B. Desjardins et al., “Infarct architecture and characteristics on delayedenhanced magnetic resonance imaging and electroanatomic mappingin patients with postinfarction ventricular arrhythmia,” Heart Rhythm,vol. 6, no. 5, pp. 644–651, May 2009.
[21] M. D. Cerqueira et al., “Standardized myocardial segmentation andnomenclature for tomographic imaging of the heart: A Statement forhealthcare professionals from the cardiac imaging committee of thecouncil on clinical cardiology of the american heart association,” Cir-culation, vol. 105, no. 4, pp. 539–542, Jan. 2002.
[22] M. Swindle, Swine in the Laboratory: Surgery, Anesthesia, Imaging,and Experimental Techniques. Boca Raton, FL: CRC Press, 2007.
[23] R. Huneke et al., “Effects of volatile anesthetics on cardiac ion chan-nels,” Acta Anaesthesiol Scand., vol. 48, no. 5, pp. 547–61, May 2004.
[24] A. Suzuki et al., “Biphasic effects of isoflurane on the cardiac actionpotential: An ionic basis for anesthetic-induced changes in cardiac elec-trophysiology,” Anesthesiology, vol. 97, no. 5, pp. 1209–1217, Nov.2002.
[25] S. Ozaki et al., “Effects of isoflurane on conduction velocity and max-imum rate of rise of action potential upstroke in guinea pig papillarymuscles,” Anesth. Analg., vol. 70, no. 6, pp. 618–623, Jun. 1990.