the fine tuning of metabolism, autophagy and ... · g de luca6, c isidoro*,3 and e dogliotti*,1 ......
TRANSCRIPT

OPEN
The fine tuning of metabolism, autophagy anddifferentiation during in vitro myogenesis
P Fortini*,1, C Ferretti1, E Iorio2, M Cagnin3, L Garribba1, D Pietraforte2, M Falchi4, B Pascucci1,5, S Baccarini1, F Morani3, S Phadngam3,G De Luca6, C Isidoro*,3 and E Dogliotti*,1
Although the mechanisms controlling skeletal muscle homeostasis have been identified, there is a lack of knowledge of theintegrated dynamic processes occurring during myogenesis and their regulation. Here, metabolism, autophagy and differentiationwere concomitantly analyzed in mouse muscle satellite cell (MSC)-derived myoblasts and their cross-talk addressed by drug andgenetic manipulation. We show that increased mitochondrial biogenesis and activation of mammalian target of rapamycin complex1 inactivation-independent basal autophagy characterize the conversion of myoblasts into myotubes. Notably, inhibition ofautophagic flux halts cell fusion in the latest stages of differentiation and, conversely, when the fusion step of myocytes is impairedthe biogenesis of autophagosomes is also impaired. By using myoblasts derived from p53 null mice, we show that in the absenceof p53 glycolysis prevails and mitochondrial biogenesis is strongly impaired. P53 null myoblasts show defective terminaldifferentiation and attenuated basal autophagy when switched into differentiating culture conditions. In conclusion, wedemonstrate that basal autophagy contributes to a correct execution of myogenesis and that physiological p53 activity is requiredfor muscle homeostasis by regulating metabolism and by affecting autophagy and differentiation.Cell Death and Disease (2016) 7, e2168; doi:10.1038/cddis.2016.50; published online 31 March 2016
Muscle satellite cells (MSCs) in adult muscle remain quiescentuntil external stimuli (such as injury or even exercise) triggertheir re-entry into the cell cycle. Their progeny, myoblasts, fuseto form new multinucleated myofibers. In this study, the abilityof MSC to give rise to muscle progenitor cells (that is,myoblasts) that could differentiate and fuse in vitro has beenexploited to analyze the integrated network of signalingpathways that operate during myogenesis.Autophagy undergoes a fine tuning during cell and tissue
differentiation in order to adapt to the dynamic changesoccurring in the tissue microenvironment.1 Using the stableC2C12 cell line, it was shown that autophagy is induced duringmuscle differentiation despite the concomitant activation ofmammalian target of rapamycin (mTOR).2 Interestingly,inhibition of autophagy was found to impair the differentiationand fusion of C2C12 myoblasts, while favoring theirapoptosis.3 Autophagy is increased in muscle in severalphysiological and pathological conditions, including fasting,atrophy and exercise.4 Much less is known about the linkbetween cell metabolism and autophagy during muscledifferentiation under physiological conditions.
p53 has been shown to promote myoblast differentiationby regulating the function of pRb,5,6 and to have a pleiotropicrole in muscle metabolism by promoting exercise-inducedmitochondrial biogenesis in skeletal muscle.7,8 How thephysiological level of p53 impacts on these changes duringdifferentiation has not been explored.The role of p53 in the regulation of autophagy is multi-
facets.9 Nuclear p53 positively regulates autophagy followingexogenous stress, resulting in a pro-death or pro-survivaloutcomes.10 Conversely, cytoplasmic p53 inhibits autophagyunder starvation or endoplasmic reticulum (ER) stress.11
What is the role of p53 in the regulation of basal autophagyduring myogenesis and its physiological implications are stillunknown.We address these issues using mouse skeletal MSC-
derived myoblasts that when differentiate in vitro well mimicthe dynamic processes occurring in vivo when a myoblastis asked to differentiate and fuse into a fully differentiatedmyotube. The findings here reported unravel a clear role forbasal autophagy inmuscle differentiation and identify a role forp53 in muscle metabolism and basal autophagy.
1Department of Environment and Primary Prevention, Molecular Epidemiology Unit, Istituto Superiore di Sanità, Rome, Italy; 2Department of Cell Biology and Neuro-sciences, Istituto Superiore di Sanità, Rome, Italy; 3Department of Health Sciences, Università del Piemonte Orientale 'Amedeo Avogadro', Novara, Italy; 4National AIDSCenter, Istituto Superiore di Sanità, Rome, Italy; 5Institute of Crystallography, Consiglio Nazionale delle Ricerche, Rome, Italy and 6Department of Haematology, Oncologyand Molecular Medicine, Istituto Superiore di Sanità, Rome, Italy*Corresponding author: P Fortini or E Dogliotti, Department of Environment and Primary Prevention, Molecular Epidemiology Unit, Istituto Superiore di Sanità, Viale ReginaElena 299, Rome 00161, Italy. Tel: +39 6 49902580; Fax: +39 6 49903650; E-mail: [email protected] or [email protected] C Isidoro, Università del Piemonte Orientale 'Amedeo Avogadro', Department of Health Sciences, Laboratorio di Patologia Molecolare, Via Savaroli, Novara 17 28100,Italy. E-mail: [email protected]
Received 29.5.15; revised 12.1.16; accepted 22.1.16; Edited by G Melino
Abbreviations: ACC1, acetyl CoA carboxylase; AMPk, 5' adenosine monophosphate-activated protein kinase; Atg 5, autophagy protein 5; Becn1, beclin 1; COXIV,cytochrome c oxidase; DM, differentiation medium; EPR, electron paramagnetic resonance; ER, endoplasmic reticulum; FOXO3, forkhead box O3; G6PD, glucose-6-phosphate dehydrogenase; GM, growth medium; GSH, reduced glutathione; GSSG, oxidized glutathione; IF, immunofluorescence; Lamp1, lysosome-associatedmembrane protein; LC3, light chain 3; MHC, myosin heavy chain; MSC, muscle satellite cell; mTOR, mammalian target of rapamycin; mTORC1, mammalian target ofrapamycin complex 1; NAC, N-acetyl cysteine; NMR, nuclear magnetic resonance; oxphos, succinate ubiquinone oxydoreductase; PGC-1α, peroxisome proliferator-activated receptor gamma coactivator 1 alpha; PGC-1β, peroxisome proliferator-activated receptor gamma coactivator 1 beta; PPP, pentose phosphate pathway;S6, ribosomal S6 subunit; WB, western blot
Citation: Cell Death and Disease (2016) 7, e2168; doi:10.1038/cddis.2016.50& 2016 Macmillan Publishers Limited All rights reserved 2041-4889/16
www.nature.com/cddis

Results
Metabolic remodeling and mitochondrial biogenesisoccur during differentiation. The metabolic profile duringmyogenesis was analyzed by 1H-NMR in mouse MSC-derived myoblasts induced to differentiate in vitro. Therelevant changes in the levels of specific metabolites arepresented in Figure 1 and the complete spectrum ofmetabolites is shown in Supplementary Table S1A. Remark-ably, the activation of muscle creatine kinase and thedecreased requirement for phospholipid synthesis that occurduring myogenesis in vivo were faithfully reproduced in vitro,as shown by the increased levels of total creatine (tCr)(Figure 1a) and decreased levels of phosphocholine (PCho)(Figure 1b) at the latest differentiation time. During differ-entiation, the absolute concentration of lactate did notsignificantly change (Figure 1c). A slight increase of the
absolute concentration of ATP+ADP (Figure 1d) wasobserved whereas AMP levels were relatively stable.(Supplementary Table S1A).The pentose phosphate pathway (PPP) is not very active
in muscle cells and is upregulated in pathophysiologicalconditions.12 Indeed, the mRNA levels of glucose-6-phosphate dehydrogenase (G6PD) decreased during differ-entiation (Figure 1e) and the ratio between reduced (GSH) andoxidized (GSSG) glutathione also decreased (Figure 1f). Theincrease in the level of glutathione as measured by NMR inmyoblasts versus myotubes (Supplementary Table S1A) wasconfirmed by the significant increase in the levels of bothGSH and GSSG during the myoblast–myotube transition(data not shown). Mitochondrial (mt) DNA molecules(Figure 2a) and the levels of mitochondrial proteins, suchas the cytochrome c oxidase (COXIV) and the succinateubiquinone oxydoreductase (oxphos) (Figure 2b) significantly
Figure 1 The metabolic profile changes during myogenesis. The concentration of acqueous metabolites, as measured by 1H-NMR, is reported as nmol/106 cells (mean ±S.D. for n⩾ 3) for (a) tCr (creatine plus phosphocreatine), (b) phosphocholine (PCho), (c) lactate and (d) intracellular level of ATP+ ADP. (e) mRNA levels of G6PD duringdifferentiation as determined by qRT-PCR. Expression levels were normalized versus two housekeeping genes, HGPRT and 18 S. Relative expression levels are shown withrespect to the basal level of the proliferating myoblasts, which is set equal to 1 (mean ±S.D. for n⩾ 3). (f) GSH and GSSG ratio obtained by enzymatic assay titration (mean ±S.D. for n≥ 3). Statistical analysis was performed to compare the values obtained in proliferating myoblasts (P) with those obtained in differentiated cells (24–72 h in DM).*P-value o0.05; **Po0.01; ***Po0.001
Autophagy in skeletal muscle is required to complete differentiationP Fortini et al
2
Cell Death and Disease

increased during myogenesis. Peroxisome proliferator-activated receptor gamma coactivator 1 alpha (PGC-1α) issignificantly upregulated in the course of muscle differentia-tion, whereas peroxisome proliferator-activated receptorgamma coactivator 1 beta (PGC-1β) remained unchanged(Figure 2c).In conclusion, the metabolic profile of our in vitro cell system
well mimics what occurs in the skeletal muscle in vivo showingthat during differentiation aerobic metabolism greatlyincreases, whereas the PPP is downregulated.
Autophagy is activated during myogenesis. When pro-liferating myoblasts were switched to grow in differen-tiation medium (DM), the transcript levels of autophagy-related genes, such as light chain 3 (LC3) and forkheadbox O3 (FOXO3), increased (Supplementary Figures S1Aand B) suggesting that autophagy may take place duringdifferentiation.
Autophagy was investigated by immunofluorescence (IF)and western blotting (WB) analyses in differentiating myo-blasts. IF staining of LC3, a hallmark of autophagosomes,13
and of the lysosome-associated membrane protein, Lamp1,indicated that autophagy is active since the first 24 h of culturein DM (Figure 3a, top). When lysosomal inhibitors were used,the accumulation of LC3-positive vacuoles was observed(Figure 3a, bottom). The colocalization of LC3 and Lamp1 andthe increased LC3 fluorescence in the presence of inhibitorsconfirm the induction of autophagy. Figure 3b shows WB anddensitometric analysis of LC3-I to LC3-II conversion thatnegligible in myoblasts (lane 1), whereas it increases duringdifferentiation time (lanes 3–4). Under exposure to lysosomalinhibitors (lanes 5–8), the progressive accumulation of theLC3-II isoform upon switching the culture into the DMconfirmed the occurrence of autophagic flux during myogen-esis. WB (Figure 3c) and IF analysis (Figure 3d) of p62 reflectslysosomal proteolysis during muscle differentiation indicativeof ongoing autophagy flux. Autophagic flux was confirmed byusing myogenic precursor cells freshly isolated (1-month-oldmice) (Supplementary Figure S2).
Autophagy is required to accomplish myotube fusion. Toinvestigate the functional cross-talk between autophagyand completion of muscle differentiation, we adopted threestrategies. First, we attempted to inhibit autophagy geneti-cally: Beclin 1 (Becn1), a key activator of Vps34 (ref. 14) wassilenced by targeted siRNA (Figure 4). Complete knockdownof Becn1 expression, versus sham-counterpart, wasachieved only between 48 and 72-h differentiation time(Figure 4b, lanes 6–7). Progressive LC3-II accumulationoccurring in sham-transfected cultures (Figure 4a, lanes 5–8)in the presence of lysosomal inhibitors was significantlyreduced in siBecn1 cultures (lanes 9–16) and, consistently,p62 degradation was impaired when Becn1 was silenced(Figure 4c, lanes 4–6). Phosphorylation of the ribosomal S6subunit (pS6) is observed during myogenesis of bothnormal and siBecn cultures (Figure 4b), suggesting thatdifferentiation-associated autophagy is mammalian target ofrapamycin complex 1 (mTORC1) inactivation independent(see below). Remarkably, the fusion index between 48 and72 h in siBecn-transfected cultures was reduced by 1.7-fold(Figure 4d), whereas the differentiation index was unaffected(data not shown). Disappointingly, siRNA targeting of ATG5was unable to inhibit autophagy, likely due to residual(approximately 20% expression) but sufficient levels ofprotein to trigger autophagy.15 To corroborate these findings,a straightforward strategy was used. If the fusion step isassociated with the induction of autophagy, it is expected thatthe autophagic flux is reduced in myocytes that are fullydifferentiated but not fused into syncytial myotubes. Althoughin myotubes (Figure 5a), LC3-II accumulated in the presenceof inhibitors (lanes 5–7), consistent with ongoing autophagicflux, this accumulation was not observed in myocytes(Figure 5b, lanes 4–6), thus indicating a block in thebiogenesis of autophagosomes in the absence of fusion.Finally, as the general antioxidant N-acetyl cysteine (NAC)
has been shown to significantly decrease the basal autopha-gic flux in skeletal muscles of mice,16 we explored whether theinhibition of autophagy by this means would also induce a
Figure 2 Mitochondrial biogenesis is upregulated during differentiation.(a) Mitochondrial versus nuclear DNA was determined by absolute quantitativeRT-PCR. (b) WB analysis was performed with anti-oxphos and anti-CoxIV antibodieson whole-protein extracts; 20 μg of total protein were loaded in each lane;l.c.= loading control. (c) Levels of mRNA transcripts of PGC1s were determined bycomparative qRT-PCR. Expression levels were normalized versus two housekeepinggenes, HGPRT and 18 S. In (c) and (e). the reported values are the means of threeindependent experiments±S.D.; the value of proliferating myoblasts (P) is set equalto 1. *P-value o0.05; **Po0.01; ***Po0.001
Autophagy in skeletal muscle is required to complete differentiationP Fortini et al
3
Cell Death and Disease

block in differentiation (Figure 6). In all, 5 mM NAC effectivelyinhibited the basal autophagic flux (Figure 6a). Remarkably,under NAC incubation, the fusion index significantlydecreased by approximately 2.5-fold (Figure 4c), providingfurther evidence that basal autophagy is strictly associatedwith a successful fusion step. It is of note that ROS levels, asmeasured by EPR, which showed a progressive increaseduring differentiation were significantly reduced by the additionof NAC (Figure 6b).
Autophagy in differentiating muscle cells is independentof mTORC1 inactivation. By using pS6, as a surrogate ofmTORC1 activity, it appears that this pathway is active duringdifferentiation, although a progressive decrease of total S6 isobserved during differentiation (Figure 7a). In the same timewindow, the levels of the Thr172 phosphorylated formof 5' adenosine monophosphate-activated protein kinase
(pAMPk) (Figure 7a) and the AMPk downstream target acetylCoA carboxylase (pACC1) (Figure 7b) increased duringdifferentiation time.To verify that basal autophagy was activated at the maximal
level, we inhibited mTOR with rapamycin (Figure 7b). Theinhibition of mTOR-dependent protein synthesis branch wastestified by the absence of pS6 in differentiating cells (lanes 4–6). Rapamycin induced the accumulation of LC3-II and theconcomitant degradation of p62 (lanes 4–6), indicating thatautophagy was further stimulated when mTOR was inhibited.The combination of these two events indicates that under thiscondition, the autophagic flux was accelerated along with agreat stimulation of autophagosome formation. In fact,degradation of p62 was faster in rapamycin-treated cells,concomitantly to a progressive LC3-II accumulation (comparelanes 1–3 with lanes 4–6). A marked inhibition of fusion wasobserved in the presence of rapamycin (data not shown),
Figure 3 Autophagy is induced during skeletal muscle differentiation. (a) Representative fluorescence confocal microscopy images of wild-type muscle cells duringdifferentiation: LC3 (green) and Lamp1 (red). Myoblasts were grown in DM and fixed at different differentiation times (0, 6, 24, 48 and 72 h). (b) Top: WB analysis of the autophagymarkers LC3-I (18 kDa) and LC3-II (16 kDa), and (c) p62 (62 kDa) in wild-type muscle cells grown in DM for different periods of time (0, 24, 48 and 72 h). The autophagic fluxinhibitors, ammonium chloride and leupeptin (NH4Cl/Leu, 20 mM/100 μM), were added 2 h before cell harvest; l.c.= loading control. (b and c) Bottom: fold changes of theindicated proteins relative to the l.c. were determined by densitometric scanning. The values are normalized for the levels in proliferating cells. One experiment out of at least threeindependent experiments is shown. (d) Representative fluorescence confocal microscopy images of wild-type muscle cells during differentiation (24, 48 and 72 h in DM): Beclin 1(green) and p62 (red). Nuclei are stained with DAPI
Autophagy in skeletal muscle is required to complete differentiationP Fortini et al
4
Cell Death and Disease

consistent with a previous report indicating that mTORinactivation is detrimental for myogenesis via regulation offusion factors.17
Lack of p53 affects cell metabolism, basal autophagy andmyogenesis. The effect of p53 loss on metabolism andbasal autophagy was investigated in myoblasts derived fromp53 null mice. When p53 was genetically knocked out, thedifferentiation as well as the fusion index were inhibited5,6
(data not shown). p53 deprivation had a clear impact on thebalance between aerobic respiration and glycolysis duringmyogenesis. In the latest stages of differentiation, asignificant increase of the levels of lactate (Figure 8a), aswell as of the absolute concentration of ATP+ADP (Figure 8b)(48 and 72 h), was observed The complete spectrum ofmetabolites is shown in Supplementary Table S1B. In p53null myoblasts, the mtDNA copy number (Figure 8c), as well
as COXIV and oxphos protein levels (Figure 8d), do notincrease during differentiation and mitochondria do notform tubular structures or networks (as in wild-type cells)but aggregates (Supplementary Figure S3). PGC-1α,significantly upregulated during differentiation in wild-typecells, fails to increase in p53 null cells (Figure 8e). Similar towild-type cells, the PPP pathway is inhibited during differen-tiation as shown by decreased levels of G6PD mRNA(Supplementary Figure S4A) and reduced/oxidized glu-tathione ratios (Supplementary Figure S4B) as a function ofthe differentiation time.As observed in wild-type myoblasts, in p53 null myoblasts
the transcript levels of LC3 and FOXO3 increased duringdifferentiation (Supplementary Figures S5A and B). It isunlikely that p53 is involved in their activation because, in thissame time window, the level of p53 decreases18 and, whenp53 is stabilized by nutlin, the mRNA levels of LC3 are
Figure 4 Downregulation of Beclin 1 inhibits differentiation-associated autophagy and affects the fusion step. WB analysis of MHC (200 kDa) and LC3-I (18 kDa) and II(16 kDa) (a), pS6 (32 kDa) and Beclin 1 (60 kDa) (b) and p62 (62 kDa) (c) in whole-cell extracts from muscle cells either untreated (sham, Interferin only) or treated with 20 mMBeclin 1 small interfering RNAs (siBecn). The interference procedure was carried out in proliferating myoblasts that immediately after transfection were shifted in DM for differentperiods of time (0, 24, 48 and 72 h). A mix of ammonium chloride and leupeptin (NH4Cl/Leu, 20 mM/100 μM) was added to the medium 2 h before cell harvest as indicated;l.c.= loading control. In panel (c) (bottom), the values of the densitometric scanning of the bands of p62 versus l.c. are provided. (d) Fusion index of sham (Interferin only) andBeclin 1-silenced terminally differentiated (TD) muscle cells (mean ±S.D.)
Autophagy in skeletal muscle is required to complete differentiationP Fortini et al
5
Cell Death and Disease

Figure 5 Autophagy is required for the fusion of myocytes into multinucleated myotubes. WB analysis of MHC (200 kDa), desmin (53 kDa) and LC3-I (18 kDa) and II (16 kDa)in whole-cell extracts from muscle cells allowed to terminally differentiate and fuse in multinucleated myotubes (a) or to reach the status of fully differentiated myocytes bypreventing cell contact (b). A mix of ammonium chloride and leupeptin (NH4Cl/Leu, 20 mM/100 μM) was added to the medium 2 h before cell harvest as indicated. (a and b)Bottom: fold changes of the indicated proteins relative to the loading control (l.c.) were determined by densitometric scanning. One representative experiment (out of two) is shown
Figure 6 Inhibition of autophagy by NAC affects the fusion step. (a) WB analysis of LC3-I (18 kDa) and II (16 kDa) in whole-cell extracts from muscle cells either untreated(left panel) or exposed to a mix of ammonium chloride and leupeptin (NH4Cl/Leu, 20 mM/100 μM) added to the medium 2 h before cell harvest (right panel); l.c.= loading control.(b) ROS levels as detected by EPR (relative intensity of CP•) in muscle cells either proliferating (P) or during differentiation (24, 48 and 72 h in DM) with and without NAC addition(5 mM f.c.) to the medium. (c) Fusion index of muscle cells at different differentiation times (24, 48 and 72 h in DM) with and without NAC addition (5 mM f.c.) to the medium(mean ± S.D.; n= 3). Without NAC: white boxes; with NAC: black boxes. This concentration of NAC (5 mM) inhibited by about 18% the intensity of 0.5 mM pre-formed stableCP• after 20 min at 37 °C
Autophagy in skeletal muscle is required to complete differentiationP Fortini et al
6
Cell Death and Disease

unchanged, whereas the p53 transcriptional target Apaf-1(that is, downregulated during myogenesis, SupplementaryFigure S5C) is actively transcribed during differentiation.The raise in autophagy during myogenesis of p53 null
myoblasts appears greatly attenuated, as indicated by the lowrate of LC3-I/LC3-II conversion and of accumulation of LC3-IIin the presence of lysosome inhibitors and the relative stabilityof p62 (Figure 9a). The muscle-specific marker, desmin,did not increase during differentiation supporting a role ofp53 in myogenesis (Figure 9a). Consistent with a low basalautophagic flux, p53 null myotubes showed reduced expres-sion of Beclin 1 in terms of fluorescence-positive aggregates(top panel) and increased accumulation of p62 (bottom panel)(Figure 9b). When the fluorescence associated with LC3 wasquantified (Figure 9c), the kinetics of vacuolar LC3 levels (thatis, autophagosome accumulation) showed similar levelsduring differentiation confirming an attenuated autophagicflux during differentiation of p53 null cells. Notably, p53 nullcells (at any time of the differentiation process) presentedwith abnormalities in the acidic compartments (Figure 9b). The
lysosomes appear enlarged and scattered throughout thecells. It is known that when autophagy is induced, lysosomesare recruited at the microtubule organizing center in order tofuse with autophagosome and form the autolysosomes.19
Consistently, the proportion of green area (LC3, autophago-somes) that overlapped with the yellow area (LC3-Lamp1,autophagolysosomes), assumed as an estimation of thecapacity of autophagosomes to fuse with lysosomes,amounted to approximately 6% (in p53-wt MSCs this areawas 5 fold bigger) (Figure 9d). Our data indicate that loss ofp53 negatively impact on the autophagy–lysosomal system inMSCs. The mTORC1 pathway is active during differentiationalso in p53 null myoblasts (Figure 9e). The levels of theThr172 -pAMPk (left panel) and of its substrate pACC1(right panel) did not increase in p53 null cells. Interestingly,high levels of pAMPk and of its substrate pACC1 weredetected in p53 null cells already at 24-h differentiation time.
Discussion
The integration of metabolic and differentiation path-ways. We show that our in vitro cell system faithfully mimicsthe metabolic reprogramming that is required for thedivergent functions of myoblasts and myotubes. A reconfi-guration of metabolic programs toward oxidative phosphor-ylation (OXPHOS) with increased mitochondrial biogenesisand activity is observed when myoblasts fuse into multi-nucleated myofibers, indicating that these processes are cellautonomous.When p53 is genetically ablated, mitochondrial biogenesis
is impaired and glycolysis prevails. p53 has been shown toinfluence metabolic pathways through several mechanisms,20
and the control of muscle metabolism reflects one of thefunctions of basal levels of p53.An increase in the total level of glutathione and also of
GSH was detected when myoblasts were shifted to DM for24 h in agreement with previous studies.21,22 The GSH contentincrease could represent a compensatory response to elevatedROS levels occurring during differentiation. A decrease ofG6PD expression level and, consequently, of the glutathioneredox balance is observed in wild-type and p53 muscle cells,when they reach terminal differentiation, indicating a tightcontrol of the PPP in muscle.12
It is well established that p53 knockdown impairs myogenicdifferentiation via downregulation of pRb.5,6 The impairment ofmitochondrial function and activity that we observe in theabsence of p53 may contribute to defective myogenesis aswell. The abrogation of p53 manifests as impairment ofPGC-1α transcriptional stimulation during in vitro differentia-tion and, interestingly, a reduction of the expression of PGC-1α in conjunction with diminished mitochondrial contentand functionality was also reported in the gastrocnemiusmuscle extracted from p53 KO mice compared with itswild-type counterpart.8 The p53 null animals showed greaterfatigability and less locomotory endurance than wild-typeanimals indicating that mitochondrial biogenesis and muscleperformance are causally associated in vivo as well as in vitro.In agreement with a p53-mediated PGC-1 α regulation, it hasbeen reported that p53 binds to the promoter of PGC-1α of
Figure 7 Basal autophagy is mTORC1 inactivation independent and isassociated with AMPK activation during myogenesis. (a) WB analysis of pS6, S6(32 kDa), pAMPk and AMPK (62 kDa) (left panel) and MHC (200 kDa) and p-ACC(280 kDa) (right panel) in whole-cell extracts during differentiation (24, 48 and 72 h inDM); l.c.= loading control. (b) WB analysis of MHC (200 kDa), p62 (62 kDa), desmin(53 kDa), pS6 (32 kDa), LC3-I (18 kDa) and LC3-II (16 kDa) in whole-cell extractsfrom muscle cells during differentiation in standard culturing conditions or in thepresence of 5 mM rapamycin (rap)
Autophagy in skeletal muscle is required to complete differentiationP Fortini et al
7
Cell Death and Disease

both human and mouse genes and this event is positivelyrelated to increased PGC-1α expression and abrogated byinhibiting nitric oxide synthase.23 These data are somehow incontrast with data showing that p53 activated by telomeredysfunction binds and represses PGC-1α promoter.24 Thus,the interaction between p53 and PGC-1α appears to bespecific to the cellular milieu.25 A new role for PGC-1α as a‘guardian’ of the normal mitophagic flux during myogenesis byblocking an excessive ROS production has been recentlyproposed.26 It is likely that the downregulation of PGC-1αwhen p53 is defective by increasing ROS productioncontributes to the alteration of the mitochondrial network asobserved in p53 null myotubes.
The integration of autophagy and metabolic pathways.Autophagy is intimately linked with cell metabolism27 and itshomeostatic role in preserving muscle mass has been well
documented.28,29 This process is of particular importance inlong-lived post-mitotic cells such as skeletal muscle fibers toadapt to different forms of cellular stresses by operating alysosome-mediated degradation of obsolete and super-oxidized self-structures. The regulation of autophagy inmuscle cells subjected to acute exercise30,31 and uponnutrient starvation32,33 have been clearly dissected, but littleis known about the regulation of basal autophagy duringmyogenesis. Here we show that when myoblasts differenti-ate, autophagy is activated as a part of the metabolicreprogramming. Autophagy is upregulated soon after themyoblasts are cultured in DM, and thereafter keeps ongoingin myotubes. However, in myocytes that cannot fuse intomyotubes, the autophagy flux is not hyper-modulated. Interminally differentiated myotubes, autophagosomes accu-mulate, despite their production is reduced, mainly becauseof inefficient fusion with lysosomes. This fact could be
Figure 8 The metabolic profile and mitochondrial biogenesis are affected in the absence of p53. The concentration of acqueous metabolites, as measured by 1H-NMR in p53null muscle cells, is reported as nmol/106 cells (mean ±S.D. for n≥ 3) for (a) lactate, and (b) intracellular level of ATP+ ADP (8.53 p.p.m.). (c) Mitochondrial versus nuclear DNAwas determined by absolute quantitative RT-PCR. (d) WB analysis was performed with anti-oxphos and anti-CoxIV antibodies on whole-protein extracts; 20 μg of total proteinwere loaded in each lane; l.c.= loading control. (e) Levels of mRNA transcripts of PGC1s were determined by comparative qRT-PCR. Expression levels were normalized versustwo housekeeping genes, HGPRTand 18 S. In (c) and (e), the reported values are the means of three independent experiments± S.D.; the value of proliferating myoblasts (P) isset equal to 1. *P-value o0.05; **Po0.01; ***Po0.001
Autophagy in skeletal muscle is required to complete differentiationP Fortini et al
8
Cell Death and Disease

attributed to an insufficient pool of lysosomes available forautolysosome formation. Indeed, biogenesis and reformationof lysosomes in cells in which autophagy is upregulatedrequire much time and energy.34
In contrast with most cell types, in skeletal muscle,autophagy was suggested to be independent of mTORC1but controlled by FoxO3.35,36 Yet, more recently, evidencehas been provided that also in skeletal muscle mTORC1is the dominant regulator of autophagy induction andensures a tight coordination of metabolic pathways.37 Herewe show that, when autophagy is activated during differen-tiation, S6 ribosomal protein is still phosphorylated. Thus,in contrast to starvation-induced autophagy, the mTORC1
kinase signaling pathway is active during myogenesis. Evenmore, the complete inhibition of mTORC1 by rapamycin andthe associated increase of the autophagic flux in myotubessupports the view that mTORC1 has a tonic inhibition onautophagy under basal conditions. Our findings are in linewith previously reported observations of mTOR inactivation-independent autophagy during the differentiation of C2C12cells.2
AMPkα1 catalytic subunit potentiates myogenin expressionand myogenesis.38 We observe that AMPkα is activated in thelate stages of muscle differentiation as indicated by phosphor-ylation of AMPkα and its downstream target, ACC1, likely tomeet the demands of ATP consumption.39 Activated AMPk
Figure 9 Autophagy is attenuated in the absence of p53 null cells and lysosomal activity is less efficient during myogenesis. (a) Left: WB analysis of desmin (53 kDa), LC3-I(18 kDa) and LC3-II (16 kDa) and p62 (62 kDa) performed on whole-cell extracts from p53 null cells during differentiation. Right: to measure the autophagic flux a mix ofammonium chloride and leupeptin (NH4Cl/Leu 20 mM/100 μM) was added to the medium 2 h before cell harvest. (b) Representative fluorescence microscopy images of p53 nullmuscle cells during differentiation. (Top) LC3 (green) and Lamp1 (red); (Bottom) p62 (red) and Beclin 1 (green). The nuclei were stained with DAPI. ImageJ quantification offluorescence intensity of LC3 (c) and of LC3-Lamp1 (yellow area) versus LC3 (green area) (d) in wt and p53 null muscle cells was performed as described in Materials andmethods section. Statistical analysis was performed by one-way ANOVA followed by Newman–Keuls test. *P= 0.05, **Po0.01, ***Po0.001. (e) WB analysis of pS6, S6(32 kDa), pAMPk and AMPK (62 kDa) (left) and MHC (200 kDa) and p-ACC (280 kDa) (right) in whole-cell extracts of p53 null muscle cells during differentiation (24, 48 and 72 hin DM); l.c.= loading control
Autophagy in skeletal muscle is required to complete differentiationP Fortini et al
9
Cell Death and Disease
has been shown to interact with mTOR thus suppressingmTORC1 activity and indirectly promoting autophagy,40
but it can also directly enhance autophagy by activatingULK1.41 As during myogenesis, mTORC1 and AMPk areboth active, we favor the model where energy sensing, AMPk,is directly connected via ULK1 to basal autophagy duringmyogenesis.The role of p53 on autophagy depends on its subcellular
localization as well as on the cellular context.11 Here, we showthat total abrogation of p53 in MSC-derived myoblasts leads toa lower autophagic flux as shown by accumulation of p62. Aclear reduction in the number of lysosomes and autophago-lysosomes was also observed in the absence of p53. Tofurther support this observation, attenuated lysosomal capa-city and lower autophagic flux was recently reported in restingmuscles of p53 KO mice.8 Intriguingly, the genetic ablation ofcathepsin D in zebrafish reflected in dystrophic developmentof the skeletal musculature.42 Here we show that p53 nullmyoblasts imperfectly develop into myotubes. We speculatethat it is the clearance of damaged mitochondria (mitophagy)that is specifically affected in the absence of p53 as shown byaccumulation of abnormal mitochondria in p53 null myotubes(Supplementary Figure 3S).43 The lysosomal–mitochondrialaxis where oxidative stress produced by damaged mitochon-dria would lead to lysosomal rupture in a loop system44 mayprovide a mechanistic basis for attenuation of autophagy andthus imperfect myogenesis in the absence of p53. Interest-ingly, when p53 is lacking, baseline levels of AMPk activationare higher than in wild-type cells but there is no furtherincrease duringmyogenesis. The augmented AMPk activationat baseline level may represent an adaptive response to thepresence of mitochondrial damage and energetic stress.45 Inresponse, AMPk would promote catabolic pathways togenerate more ATP in agreement with the switch to glycolysisand increased ATP levels observed in p53 null cells. AMPkactivation induces phosphorylation of p53 on serine 15 andthis phosphorylation is required to initiate a metabolic AMPk-dependent cell cycle arrest46 that responds to glucoseavailability and occurs despite active mTOR.47 We speculatethat, in the absence of p53, AMPk-dependent autophagy is notactivated. In this scenario, AMPk would coordinates cell fate(i.e. proliferation, autophagy) with metabolic resources.
The integration of autophagy and differentiation path-ways. Autophagy has a fundamental role in organ develop-ment and cell differentiation5 but no data are available on thefunctional role of basal autophagy during myogenic differ-entiation. We provide robust evidence that autophagy is animportant part of successful muscle differentiation. As shownin Figure 10, skeletal myogenesis proceeds in vitro through ahighly ordered sequence of events culminating in the cellfusion to form multinucleated myotubes. We found thatmyoblasts that have been silenced for Beclin 1 proceedthrough all these events with the exception of the fusion stepthat is significantly reduced. Similarly, inhibition of autophagyby NAC impacts on the fusion step. Under our NAC treatmentconditions, the increased levels of ROS produced duringdifferentiation are significantly inhibited. Whether the effect ofNAC on autophagy is solely because of its ROS scavengingactivity16 and/or to its role in GSH synthesis48 deservesfurther investigations. In support of an interdependence ofautophagy and differentiation, myocytes, which are fullydifferentiated mononucleated cells that did not undergofusion, were unable to rise the basal level of autophagy.We conclude that a fine tuning and balancing of autophagy iscritical to allow the correct development of the skeletalmuscle tissue, as it functions to maintain a close time-relatedconnection between the synthesis of differentiation-as-sociated proteins with the fusion of myocytes into myotubes.Successful differentiation of satellite-derived myoblasts intofunctional myotubes is a fundamental prerequisite for muscleregeneration, a repair process that is of primary importancein maintaining muscle function.49,50 Our findings provide abetter understanding of the gene networks operating duringmuscle differentiation thus opening new avenues for thetherapies of muscle disorders and injuries.
Materials and MethodsCell growth conditions and treatment. Mouse (strain FVB) MSC-derivedmyoblasts were a generous gift of M Crescenzi. Mouse (strain C3H) MSC-derivedp53 null myoblasts were a kind gift of S Soddu. Both cell lines were isolated,cultured and differentiated as described in Tiainen et al.51
Lysosomal inhibitors (20 mM ammonium chloride plus 100 μM leupeptin ) wereadded 2 h before cell collection. NAC (5 mM f.c.) and rapamycin (20 nM f.c.) werere-added every 24 h. All reagents were purchased from Sigma (St Louis, MO, USA).
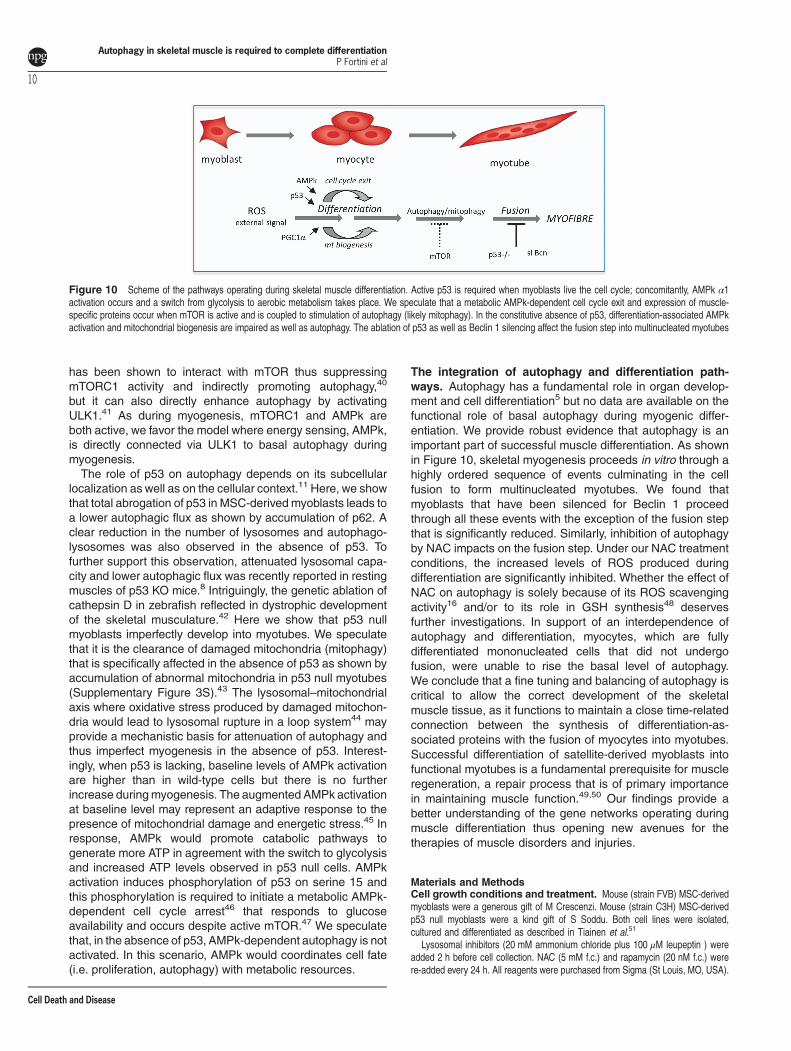
Figure 10 Scheme of the pathways operating during skeletal muscle differentiation. Active p53 is required when myoblasts live the cell cycle; concomitantly, AMPk α1activation occurs and a switch from glycolysis to aerobic metabolism takes place. We speculate that a metabolic AMPk-dependent cell cycle exit and expression of muscle-specific proteins occur when mTOR is active and is coupled to stimulation of autophagy (likely mitophagy). In the constitutive absence of p53, differentiation-associated AMPkactivation and mitochondrial biogenesis are impaired as well as autophagy. The ablation of p53 as well as Beclin 1 silencing affect the fusion step into multinucleated myotubes
Autophagy in skeletal muscle is required to complete differentiationP Fortini et al
10
Cell Death and Disease

The differentiation index was calculated as % nuclei in myosin heavy chain (MHC)-positive cells/total number of nuclei and the fusion index as the average number ofnuclei in MHC-positive cells/total number of MHC-positive cells.
Mitochondrial DNA copy number and gene expression analysis.Relative mitochondrial DNA copy number was analyzed by absolute QPCR usingTaqMan probes. Mitochondrial and nuclear DNA were detected by using ND2 andRplp0 single tube Taqman real-time PCR assay, respectively (cat. no. 4331182; LifeTechnologies, Austin, TX, USA).RNA was extracted by RNeasy kit (cat. no. 74106; Qiagen, Hilden, Germany) and
cDNA synthesis was carried out by the high capacity cDNA reverse transcription kit(cat. no. 4368813; Life Technologies). Gene expression analysis was carried out usingsingle tube Taqman real-time PCR assays (cat. no. 4331182; Life Technologies).
RNA interference. Beclin 1 siRNA oligonucleotides (Dharmacon, Chicago, IL,USA) were used for silencing (20 nM f.c.). Transfection was performed usingInterferin (Polyplus Transfection, Inc., New York, NY, USA). The efficacy of silencingwas monitored by QPCR and WB. Myoblasts were seeded in 100 mm or 35 mmgelatin-coated plates in growth medium (GM) and silenced the day after seedingand shifted in DM immediately after transfection.
IF analysis. Cells were seeded in slide flasks gelatin coated and fixed for 10 minby cold absolute methanol at the indicated times. Primary and secondary antibodiesare described in Supplementary Information. Glass cover slides were mounted witha drop of ProLong Gold antifade reagent containing DAPI (Molecular ProbesInvitrogen, Monza, Milano, Italy). Mitochondrial morphology was analyzed bystaining with 40 nM Mito Tracker green (Thermo Fisher Scientific Inc., Monza,Milano, Italy, M7514).Images were taken on an inverted microscope equipped with a confocal spectral
imaging system (Olympus Fluoview 1000, Olympus, Tokyo, Japan) and, for someexperiments, with a fluorescence microscope (Leica, Wetzlar, Germany, DMI6000B).Emitted fluorescence was recorded during single excitation sessions in the same fieldand same conditions for stack images collection. The ImageJ software (http://rsbweb.nih.gov/ij/) was used for quantification of the fluorescent signal.47
Protein analysis. Cell homogenates were prepared by ultrasonication ina buffer containing detergents and proteases and phosphatases inhibitors (RocheApplied Science, Mannheim, Germany). Proteins were separated on NuPAGE 4–12%and 3–8% NuPAGE Tris-Acetate precast polyacrylamide gels (Life Technologies) andanalyzed by WB using the antibodies described in Supplementary Information.Immunocomplexes were revealed by using a peroxidase-conjugated secondaryantibody (Bio-Rad, Richmond, CA, USA), as appropriate. WB were developed byusing the West Dura kit (Pierce Chemical, Rockford, IL, USA). The results werevisualised and estimated by Chemi Doc XRS+ with Image lab Software (Bio-Rad).A loading control HSP90 was used.
NMR spectroscopy. Cells were washed twice with ice-cold physiological salinesolution and pellets suspended in 0.5 ml of ice-cold twice-distilled water. Aqueousextracts were processed as previously described.52 High-resolution NMR experiments(25 °C) were performed at 9.4 T and 16.4 T (Bruker AVANCE spectrometers, BrukerGmbH, Karlsruhe, Germany). 1H-NMR spectra of cell extracts were acquired using90° flip angle, 30-s repetition time, 32 K time domain data points and 128 transients.The amount of intracellular ATP was also measured by a luciferin/luciferase-based
assay (Roche Applied Science).
GSH and GSSG measurement. Sample aliquots (1x10⁶ cells/ml) weredeproteinized by adding 1.22 M iced trichloroacetic acid (1:2 v/v), kept 5 min inice and centrifuged at 10 000 r.p.m. for 5 min at 4 °C. GSH was determinedspectrophotometrically at 412 nm, in the clear supernatants 5 min after the additionof 0.1 mM 5,50-dithiobis-(2-nitrobenzoic) acid (DTNB) reagent to 0.1 mM phosphatebuffer/1 mM diethylenetriaminepentaacetic acid, pH 7.4, containing aliquots ofsamples or GSH standard curve. GSSG was measured in 25 μl cleared acidifiedsupernatants by using DTNB-GSSG reductase recycling assay.53 GSH and GSSGcontent were normalized for cell number.
EPR measurement of ROS levels. Cells were washed twice withphosphate-buffered solution (PBS), pH 7.4, and pellets suspended to obtain aconcentration of 10 × 106 cells/ml. The spin probe 1-hydroxy-3-carboxy-2,2,5,5-tetramethylpyrrolidine (CPH; ENZO Life Sciences Inc., Lausen, Switzerland) was
dissolved in degassed PBS without Ca2+ and Mg2+ (Sigma D5652), pH 7.4,extensively treated with Chelex-100 (Bio-Rad) to avoid metal contamination. In all,0.5 mM CPH was added to 100 μl myoblast suspensions. The oxidation of CPHwas monitored by the formation of the characteristic three-line spectrum withhyperfine coupling constant of 1.63± 0.04 mT attributable to the correspondingnitroxide radical 3-carboxyproxyl radical (CP•). Samples were drawn up into a gas-permeable teflon tube with 0.81 mm internal diameter and 0.05 mm wall thickness(Zeuss Industrial Products, Raritan, NJ, USA). The teflon tube was inserted into aquartz tube and fixed to the EPR cavity. Spectra were acquired 20 min after theaddition of the spin probe at 37 °C. The low field shoulder of this spectrum waschosen to quantify the CP• because the middle component centered at g 2.0overlaps with other free radical signals found in biological systems. Spectra wereacquired with a Bruker E-scan continuous wave X-band benchtop spectrometer(Bruker, Rheinstetten, Germany) with the following instrumental settings: modulationfrequency, 100 kHz; microwave frequency, 9.7 GHz; microwave power, 10 mW;modulation amplitude, 0.1 mT; conversion time, 20.5 ms; time constant, 82 ms;sweep time, 21 s; number of scans, 60.
Conflict of InterestThe authors declare no conflict of interest.
Acknowledgements. We are grateful to Dr. Roberta Castino and Dr. SerenaCecchetti for assistance in IF imaging at confocal microscopy and to Dr. AntonioMusarò (Università La Sapienza, Rome) and Gianmaria Fimia (IRCCS L Spallanzani,Rome) for critically reading the manuscript. This work was partially supported byFunding support: A.I.R.C. (grant to ED); Fondazione S Paolo (project neuroscience2010 to CI). The fluorescence imaging facility in CI’s laboratory is supported byComoli, Ferrari and Co. SpA (Novara, Italy).
Note added in proof
When this paper was under revision, Gottlieb and co-workerspublished a paper (Sin et al., Autophagy, 2015, doi: 10.1080-/15548627.2015.1115172), where they confirm the role ofautophagy in myogenic differentiation.
1. Mizushima N, Komatsu M. Autophagy: renovation of cells and tissues. Cell 2011; 147:728–741.
2. Tanida I, Wakabayashi M, Kanematsu T, Minematsu-Ikeguchi N, Sou YS, Hirata M et al.Lysosomal turnover of GABARAP-phospholipid conjugate is activated during differentiationof C2C12 cells to myotubes without inactivation of the mTor kinase-signaling pathway.Autophagy 2006; 2: 264–271.
3. McMillan EM, Quadrilatero J. Autophagy is required and protects against apoptosis duringmyoblast differentiation. Biochem J 2014; 462: 267–277.
4. Vainshtein A, Grumati P, Sandri M, Bonaldo P. Skeletal muscle, autophagy, and physicalactivity: the ménage à trois of metabolic regulation in health and disease. J Mol Med 2014;92: 127–137.
5. Porrello A, Cerone MA, Coen S, Gurtner A, Fontemaggi G, Cimino L et al. p53 regu-lates myogenesis by triggering the differentiation activity of pRb. J Cell Biol 2000; 151:1295–1304.
6. Cam H, Griesmann H, Beitzinger M, Hofmann L, Beinoraviciute-Kellner R, Sauer M et al. p53family members in myogenic differentiation and rhabdomyosarcoma development. CancerCell 2006; 10: 281–293.
7. Park JY, Wang PY, Matsumoto T, Sung HJ, Ma W, Choi JW et al. p53 improves aerobicexercise capacity and augments skeletal muscle mitochondrial DNA content. Circ Res 2009;105: 705–712.
8. Saleem A, Carter HN, Hood DA. p53 is necessary for the adaptive changes in cellular milieusubsequent to an acute bout of endurance exercise. Am J Physiol Cell Physiol 2014a; 306:C241–C249.
9. Rufini A, Tucci P, Melino G. Senescence and aging:the critical roles of p53. Oncogene 2013;32: 5129–5143.
10. Maiuri MC, Galluzzi L, Morselli E, Kepp O, Malik SA, Kroemer G. Autophagy regulation byp53. Curr Opin Cell Biol 2010; 22: 181–185.
11. Tasdemir E, Chiara Maiuri M, Morselli E, Criollo A, D'Amelio M, Djavaheri-Mergny M et al.A dual role of p53 in the control of autophagy. Autophagy 2008; 4: 810–814.
12. Cacchiarelli D, Martone J, Girardi E, Cesana M, Incitti T, Morlando M et al. MicroRNAsinvolved in molecular circuitries relevant for the Duchenne muscular dystrophypathogenesis are controlled by the dystrophin/nNOS pathway. Cell Metab 2010; 12:341–351.
Autophagy in skeletal muscle is required to complete differentiationP Fortini et al
11
Cell Death and Disease

13. Klionsky DJ, Abdalla FC, Abeliovich H, Abraham RT, Acevedo-Arozena A, Adeli K et al.Guidelines for the use and interpretation of assays for monitoring autophagy. Autophagy2012; 8: 445–544.
14. He C, Klionsky DJ. Regulation mechanisms and signaling pathways of autophagy. Annu RevGenet 2009; 43: 67–93.
15. Hosokawa N, Hara Y, Mizushima N. Generation of cell lines with tetracycline-regulatedautophagy and a role for autophagy in controlling cell size. FEBS Lett 2006; 580: 2623–2629.
16. Rahman M, Mofarrahi M, Kristof AS, Nkengfac B, Harel S, Hussain SN. Reactive oxygenspecies regulation of autophagy in skeletal muscles. Antioxid Redox Signal 2014; 20:443–459.
17. Sun Y, Ge Y, Drnevich J, Zhao Y, Band M, Chen J. Mammalian target of rapamycin regulatesmiRNA-1 and follistatin in skeletal myogenesis. J Cell Biol 2010; 189: 1157–1169.
18. Fortini P, Ferretti C, Pascucci B, Narciso L, Pajalunga D, Puggioni EM et al. DNA damageresponse by single-strand breaks in terminally differentiated muscle cells and the control ofmuscle integrity. Cell Death Differ 2012; 19: 1741–1749.
19. Korolchuk VI, Saiki S, Lichtenberg M, Siddiqi FH, Roberts EA, Imarisio S et al. Lysosomalpositioning coordinates cellular nutrient responses. Nat Cell Biol 2011; 13: 453–460.
20. Vousden KH, Ryan KM. p53 and metabolism. Nat Rev Cancer 2009; 9: 691–700.21. Ardite E, Barbera JA, Roca J, Fernández-Checa JC. Glutathione depletion impairs myogenic
differentiation of murine skeletal muscle C2C12 cells through sustained NF-kappaBactivation. Am J Pathol 2004; 165: 719–728.
22. Ding Y, Choi KJ, Kim JH, Han X, Piao Y, Jeong JH et al. Endogenous hydrogen peroxideregulates glutathione redox via nuclear factor erythroid 2-related factor 2 downstream ofphosphatidylinositol 3-kinase during muscle differentiation. Am J Pathol 2008; 172:1529–1541.
23. Aquilano K, Baldelli S, Pagliei B, Cannata SM, Rotilio G, Ciriolo MR. p53 orchestrates thePGC-1α-mediated antioxidant response upon mild redox and metabolic imbalance. AntioxidRedox Signal 2012; 18: 386–399.
24. Sahin E, Colla S, Liesa M, Moslehi J, Müller FL, Guo M et al. Telomere dysfunction inducesmetabolic and mitochondrial compromise. Nature 2011; 470: 359–365.
25. Saleem A, Hood DA. Acute exercise induces tumour suppressor protein p53 translocation tothe mitochondria and promotes a p53-Tfam-mitochondrial DNA complex in skeletal muscle.J Physiol 2013; 591: 3625–3636.
26. Baldelli S, Aquilano K, Ciriolo MR. PGC-1α buffers ROS-mediated removal of mitochondriaduring myogenesis. Cell Death Dis 2014; 5: e1515.
27. Levine B, Kroemer G. Autophagy in the pathogenesis of disease. Cell 2008; 132: 27–42.28. Masiero E, Agatea L, Mammucari C, Blaauw B, Loro E, Komatsu M et al. Autophagy is
required to maintain muscle mass. Cell Metab 2009; 10: 507–515.29. Masiero E, Sandri M. Autophagy inhibition induces atrophy and myopathy in adult skeletal
muscles. Autophagy 2010; 6: 307–309.30. He C, Bassik MC, Moresi V, Sun K, Wei Y, Zou Z et al. Exercise-induced BCL2-regulated
autophagy is required for muscle glucose homeostasis. Nature 2012; 481: 511–515.31. LoVerso F, Carnio S, Vainshtein A, Sandri M. Autophagy is not required to sustain exercise
and PRKAA1/AMPK activity but is important to prevent mitochondrial damage duringphysical activity. Autophagy 2014; 10: 1883–1894.
32. Efeyan A, Zoncu R, Chang S, Gumper I, Snitkin H, Wolfson RL et al. Regulation of mTORC1by the Rag GTPases is necessary for neonatal autophagy and survival. Nature 2013; 493:679–683.
33. McAlpine F, Williamson LE, Tooze SA, Chan EY. Regulation of nutrient-sensitive autophagyby uncoordinated 51-like kinases 1 and 2. Autophagy 2013; 9: 361–373.
34. Yu L, McPhee CK, Zheng L, Mardones GA, Rong Y, Peng J et al. Termination of autophagyand reformation of lysosomes regulated by mTOR. Nature 2010; 465: 942–946.
35. Mammucari C, Milan G, Romanello V, Masiero E, Rudolf R, Del Piccolo P et al. FoxO3controls autophagy in skeletal muscle in vivo. Cell Metab 2007; 6: 458–471.
36. Zhao J, Brault JJ, Schild A, Cao P, Sandri M, Schiaffino S et al. FoxO3 coordinately activatesprotein degradation by the autophagic/lysosomal and proteasomal pathways in atrophyingmuscle cells. Cell Metab 2007; 6: 472–483.
37. Castets P, Lin S, Rion N, Di Fulvio S, Romanino K, Guridi M et al. Sustained activation ofmTORC1 in skeletal muscle inhibits constitutive and starvation-induced autophagy andcauses a severe, late-onset myopathy. Cell Metab 2013; 17: 731–744.
38. Fu X, Zhao JX, Zhu MJ, Foretz M, Viollet B, Dodson MV et al. AMP-activated protein kinaseα1 but not α2 catalytic subunit potentiates myogenin expression and myogenesis. Mol CellBiol 2013; 33: 4517–4525.
39. Jørgensen SB, Richter EA, Wojtaszewski JF. Role of AMPK in skeletal muscle metabolicregulation and adaptation in relation to exercise. J Physiol 2006; 574: 17–31.
40. Feng Z, Zhang H, Levine AJ, Jin S. The coordinate regulation of the p53 and mTORpathways in cells. Proc Natl Acad Sci USA 2005; 102: 8204–8209.
41. Kim J, Kundu M, Viollet B, Guan KL. AMPk and mTOR regulate autophagy through directphosphorylation of Ulk1. Nat Cell Biol 2011; 13: 132–141.
42. Follo C, Ozzano M, Montalenti C, Ekkapongpisit M, Isidoro C. Similarities anddifferences in the biogenesis, processing and lysosomal targeting between zebrafishand human pro-Cathepsin D: functional implications. Int J Biochem Cell Biol 2013; 45:273–282.
43. Saleem A, Iqbal S, Zhang Y, Hood DA. Effect of p53 on mitochondrial morphology, importand assembly in skeletal muscle. Am J Physiol Cell Physiol 2014b; 308: C319–C329.
44. Terman A, Gustafsson B, Brunk UT. The lysosomal-mitochondrial axis theory of postmitoticaging and cell death. Chem Biol Interact 2006; 163: 29–37.
45. Pauly M, Daussin F, Burelle Y, Li, Godin R, Fauconnier J et al. AMPK activation stimulatesautophagy and ameliorates muscular dystrophy in the mdx mouse diaphragm. Am J Pathol2012; 181: 583–592.
46. Jones RG, Plas DR, Kubek S, Buzzai M, Mu J, Xu Y et al. AMP-activated protein kinaseinduces a p53-dependent metabolic checkpoint. Mol Cell 2005; 18: 283–293.
47. Morani F, Phadngam S, Follo C, Titone R, Thongrakard V, Galetto A et al. PTEN deficiencyand mutant p53 confer glucose-addiction to thyroid cancer cells: impact of glucose depletionon cell proliferation, cell survival, autophagy and cell migration. Genes Cancer 2014; 5:226–239.
48. Aquilano K, Baldelli S, Ciriolo MR. Glutathione: new roles in redox signaling for an oldantioxidant. Front Pharmacol 2014; 5: 196.
49. Tedesco FS, Dellavalle A, Diaz-Manera J, Messina G, Cossu G. Repairing skeletal muscle:regenerative potential of skeletal muscle stem cells. J Clin Invest 2010; 120: 11–19.
50. Sacco A, Mourkioti F, Tran R, Choi J, Llewellyn M, Kraft P et al. Short telomeres and stemcell exhaustion model Duchenne muscular dystrophy in mdx/mTR mice. Cell 2010; 143:1059–1071.
51. Tiainen M, Pajalunga D, Ferrantelli F, Soddu S, Salvatori G, Sacchi A et al.. Terminallydifferentiated skeletal myotubes are not confined to G0 but can enter G1 upon growth factorstimulation. Cell Growth Differ 1996; 7: 1039–1050.
52. Pascucci B, Lemma T, Iorio E, Giovannini S, Vaz B, Iavarone I et al. An altered redox balancemediates the hypersensitivity of Cockayne syndrome primary fibroblasts to oxidative stress.Aging Cell 2012; 11: 520–529.
53. Anderson ME. Determination of glutathione and glutathione disulfide in biological samples.Methods Enzymol 1985; 113: 548–555.
Cell Death and Disease is an open-access journalpublished by Nature Publishing Group. This work is
licensed under a Creative Commons Attribution 4.0 InternationalLicense. The images or other third party material in this article areincluded in the article’s Creative Commons license, unless indicatedotherwise in the credit line; if the material is not included under theCreative Commons license, users will need to obtain permission fromthe license holder to reproduce the material. To view a copy of thislicense, visit http://creativecommons.org/licenses/by/4.0/
Supplementary Information accompanies this paper on Cell Death and Disease website (http://www.nature.com/cddis)
Autophagy in skeletal muscle is required to complete differentiationP Fortini et al
12
Cell Death and Disease

SUPPLEMENTAL INFORMATION
Figure S1
Gene reprogramming during muscle differentiation involves autophagy-related genes. Analysis
of mRNA levels of the autophagy genes LC3 (A) and FoxO3 (B) in muscle cells during differentiation
(after 24, 48 and 72h growth in DM) as determined by qRT-PCR. Expression levels were normalized
versus two housekeeping genes, HGPRT and 18S. Relative expressions are shown with respect to
the basal level of proliferating myoblasts (P) which was set equal to 1. The reported values are the
means of three independent experiments ± SD.
Fig. S2
The induction of autophagy during skeletal muscle differentation is confirmed in primary
myogenic cell cultures. Western blot analysis of the autophagy markers LC3-I (18 kDa), LC3-II (16
kDa) and p62 (62 kDa) in wild-type primary myogenic cells grown in DM at the indicated times
(lanes 1-3). The autophagic flux inhibitors, ammonium chloride and leupeptin (NH4Cl /Leu,
20mM/100microM), were added 2h before cell harvest (lanes 4-6); l.c.=loading control.
Figure S3
Mitochondria of p53 null myotubes are structurally abnormal. In vivo imaging of the
mitochondrial network by confocal microscopy. Wild-type (wt) and p53 null terminally
differentiated (TD) muscle cells were incubated with MitoTracker green probe for 30 min before
image collection. In normal myotubes mitochondria form tubular structures or networks while
mitochondrial aggregates are visible in p53 null myotubes
Figure S4
G6PD expression levels and glutathione redox balance in p53 null muscle cells during
differentiation. (A) Comparative analysis during differentiation of mRNA levels of glucose-6-
phosphate dehydrogenase (G6PD) as determined by qRT-PCR. Expression levels were normalized
versus two housekeeping genes, HGPRT and 18S. Relative expressions are shown with respect to
the basal level of the proliferating myoblasts which is set equal to 1. The reported values are the
means of three independent experiments ± SD. (B) GSH and GSSG ratio obtained by enzymatic
assay titration (mean ±SD for n≥3). Statistical analysis was performed to compare the values

obtained in proliferating myoblasts (P) with those obtained in differentiated cells (24-72 h in DM).
*p value <0.05; **p<0.01; ***p<0.001.
Figure S5
Gene reprogramming of autophagy-related genes occurs also during differentiation of p53 null
myoblasts. Analysis of mRNA levels of the autophagy genes LC3 (A) and FoxO3 (B) in p53 null cells
during differentiation (after 24, 48 and 72h growth in DM) as determined by qRT-PCR. Expression
levels were normalized versus two housekeeping genes, HGPRT and 18S. Relative expressions are
shown with respect to the basal level of proliferating myoblasts (P) which was set equal to 1. The
reported values are the means of three independent experiments ± SD. (C) Comparative gene
expression levels of Apaf1 and LC3 during differentiation time in the presence of nutlin-3. The p53
stabilizer was freshly renewed every 24h. The expression levels of the samples differentiated in
the presence of nutlin were set equal to 1 at each time point. (D) Gene expression levels of Apaf1
and LC3 during differentiation time in the presence of nutlin-3.

Table S1: NMR quantification of intracellular metabolites involved in glucose, phospholipid and energetic metabolism in wild type (wt), and p53 null myoblasts (time 0) and during differentiation (24h, 48h, 72h).
Metabolitea wt/0h p53 null/0h
wt/24h p53 null/24h
MEANb SD MEANb SD p MEANb SD MEANb SD p mio-ins 11.70 5.03 30.66 21.20 0.14 20.16 1.25 45.24 17.08 0.06 Glycine 4.95 1.37 5.93 28.04 19.65 18.53 1.66 0.56 Tau 21.72 9.38 18.56 3.88 0.61 47.13 6.94 49.51 17.35 0.79 tCr 11.73 4.25 5.29 0.25 0.04 19.43 9.10 15.57 6.34 0.50 Asp 9.89 7.92 16.44 3.35 0.39 19.01 12.04 28.64 20.19 0.60 GS 16.87 8.86 28.51 4.92 0.12 31.14 4.62 56.37 24.13 0.14 Gln 21.08 24.85 11.97 41.91 Glt 16.96 6.91 45.31 16.70 0.01 28.75 6.34 58.32 38.06 0.18 Succ 2.14 2.07 1.62 2.82 2.01 3.63 Glx 49.42 25.67 90.39 19.63 0.06 86.27 16.66 143.70 75.08 0.19 Acetate 4.48 1.81 7.53 3.38 0.14 7.16 3.78 9.57 7.03 0.53 Alanine 9.89 4.47 12.90 3.11 0.35 18.39 6.33 34.71 18.07 0.10 Lactate 15.55 2.35 18.58 4.10 0.22 20.15 3.37 26.69 9.44 0.19 Isoleucine 3.14 2.21 4.28 2.35 0.67 4.35 4.20 3.76 Valine 4.76 4.18 6.41 1.52 0.65 4.57 5.38 3.24 GPC 0.75 0.18 0.70 1.06 0.95 2.19 1.48 0.88 0.81 0.19 PCho 8.66 3.03 5.85 2.88 0.24 11.49 4.87 17.66 7.24 0.17 Cho 0.51 0.40 0.38 0.50 0.71 1.26 1.04 1.24 1.03 0.98 Metabolitea wt/48h p53 null/48h wt/72h p53 null/72h
MEANb SD MEANb SD p MEANb SD MEANb SD P mio-ins 24.31 1.37 64.18 8.42 0.00 23.26 8.06 54.95 15.67 0.02 Glycine 21.96 19.32 49.82 27.67 0.67 39.69 0.14 Tau 42.35 3.31 67.72 4.31 0.00 37.66 14.33 52.82 8.17 0.09 tCr 37.87 8.23 35.58 3.79 0.63 39.34 20.39 39.27 7.92 1.00 Asp 17.87 1.31 32.61 5.03 0.01 19.23 6.92 32.15 10.10 0.13 GS 36.21 0.64 80.29 10.14 0.00 31.31 13.60 60.60 19.15 0.05 Gln 48.62 28.38 60.03 Glt 39.35 11.91 118.75 16.59 0.00 38.00 17.83 109.89 29.97 0.00 Succ 4.22 3.57 3.92 1.23 5.28 Glx 101.08 17.35 250.22 37.63 0.00 99.40 32.88 231.67 65.39 0.01 Acetate 8.49 2.68 11.20 5.09 0.34 7.33 4.19 8.22 1.71 0.70 Alanine 21.84 4.76 64.56 2.40 0.00 26.20 12.25 52.41 15.94 0.02 Lactate 19.87 4.80 43.70 9.64 0.00 23.42 9.63 36.59 12.35 0.09 Isoleucine 5.31 9.48 3.91 4.09 1.23 11.61 1.69 0.04 Valine 6.42 9.66 2.36 4.49 0.31 11.90 0.43 0.00 GPC 3.95 4.92 2.39 1.46 0.57 5.13 2.24 3.14 0.24 0.29 PCho 14.30 6.68 23.33 13.56 0.28 6.47 3.76 16.25 7.30 0.02 Cho 1.79 1.36 1.22 1.10 0.56 1.29 1.01 1.28 1.32 0.99
aAbbreviations: asp, aspartate Cho, free choline; Glx, glutamate(glt) plus glutamine (gln) and glutathione (GS); GPC, glycerophosphocholine; Lac, lactate; m-Ins, myo-inositol; PCho, phosphocholine; tau, taurine; tCr, total creatine (creatine plus phosphocreatine).
bThe concentration of metabolites is reported as nmol/106 cells, (mean± maximum deviation for n=2; ±SD for n≥3).

Supplemental Experimental Procedures
Isolation of murine skeletal muscle satellite cells (MSC) was conducted as described below. Briefly,
skeletal MSC were isolated from the hind limb muscles of young FVB;129 mice. MSC were
maintained as actively proliferating adult stem cells (myoblasts) and induced to differentiate in
post-mitotic myotubes by modifying the cell growth conditions. In particular, myoblasts were sub-
cultured in the growth medium (GM: F-10 nutrient mixture plus glutamax supplemented with 10%
of fetal calf serum, 100 U/ml penicillin/streptomycin, 3% chicken embryo extract, obtained from
10- to 11-day-old embryos, and 2.5 mg/ml of recombinant human FGF-basic (Peprotech, Rocky Hill,
NJ, USA). To induce terminal differentiation, the GM was replaced with the differentiation medium
(DM:Dulbecco’s modified Eagle medium plus glutamax, supplemented with 10% foetal calf serum
and 100 U/ml penicillin/streptomycin). Cells were incubated at 38°C, 10% CO2. The efficiency of
cell differentiation was routinely controlled by immunofluorescence analysis with myosin heavy
chain (MHC) antibodies and evaluation of the differentiation and fusion indexes. The
differentiation index is calculated as the percentage of nuclei belonging to MHC-positive cells
divided by the total nuclei. The fusion index is calculated as the average number of nuclei in MHC-
positive cells (which contain three or more nuclei) divided by the total number MHC-positive cells.
Relative mitochondrial DNA copy number was analysed by absolute QPCR using TaqMan probes
for mitochondrial ND2 and nuclear 36B4 genes. The mitochondrial genome copy number of the
myoblasts was set as 1. Total DNA was isolated using QIAamp DNA mini kit (QIAGEN).
RNA extraction was carried out using RNeasy mini kit (QIAGEN). cDNA synthesis and relative gene
expression analysis were carried out using the High Capacity cDNA reverse transcription kit and
TaqMan real-time PCR assays purchased by Applied Biosystems accordingly to the manufacturer’s
instructions.
Immunofluorescence analysis
Mitochondrial morphology was analysed by staining with 40 nM Mito Tracker green (Thermo
Fisher Scientific Inc. M7514) for 30 min in saline solution.

Images were taken on an inverted microscope (Olympus) equipped with a confocal spectral
imaging system (Olympus Fluoview 1000) using a (Olympus) planapo objective 60X oil A.N. 1,42.
Excitation light was obtained by an Argon Ion Laser 488 nm or 594 nm for green or red
fluorescence, respectively. Emitted fluorescence was recorded during single excitation sessions in
the same field and same conditions for stack images collection.
Protein expression analysis
List of antibodies:
Mouse monoclonal anti-complex II 70 KDa Fp subunit antibody (Invitrogen 459200); rabbit
polyclonal Cox IV antibody (Cell Signaling Technology, Inc. MA, USA #4844); rabbit monoclonal
anti-S6 ribosomal protein (Cell Signaling Technology, Inc. MA, USA #2217), rabbit monoclonal anti
phospho-S6 ribosomal protein (Cell Signaling Technology, Inc. MA, USA #4856), rabbit polyclonal
anti-Beclin 1 (Santa Cruz Biotechnology, Inc. CA USA sc-11427), rabbit polyclonal anti-LC3 (MBL
Medical & Biological Laboratories, Ltd., Japan), guinea pig polyclonal anti-p62 (Progen, Biotechnik
GmbH,GP62-C, Germany), mouse monoclonal anti-desmin (Abcam, RD30, UK), polyclonal anti-
myosin heavy chain (a kind gift from Dr. Marco Crescenzi), rabbit polyclonal anti-phospho-Acetyl-
CoA carboxylase (Ser79) (Cell Signaling Technology, Inc. MA, USA #3661), anti-Acetyl-CoA
carboxylase (Cell Signaling Technology, Inc. MA, USA #3662) rabbit polyclonal anti-AMPk alpha
(Cell Signaling Technology, Inc. MA, USA # 2532), rabbit polyclonal anti-phospho-AMPk alpha
(Thr172) (Cell Signaling Technology, Inc. MA, USA # 2535), HSP 90alpha/beta (Santa Cruz
Biotechnology, Inc. CA USA sc-13119). HSP 90alpha/beta has been used as loading control (l.c.).
Immunocomplexes were revealed by using a peroxidase-conjugated secondary antibody (Biorad),
as appropriate, and subsequent peroxidase-induced chemiluminescence reaction
(PerkinElmer,Waltham, MA USA).
NMR spectroscopy.
Aqueous extracts were prepared in EtOH 70% according to an established protocol (Pascucci et
al., 2012). Briefly, samples were ultra-sonicated at 20 kHz by a MSE ultrasonic disintegrator Mk2
(Crawley, Sussex, UK) and centrifuged at 14000 x g for 30 min. Supernatants were lyophilized twice
in a RVT 4104 Savant lyophilizer (Mildford), and the residue resuspended in 0.7 ml D2O (Sigma-
Aldrich, St. Louis, MO) containing 0.1 mM 3-(trimethylsilyl)-propionic-2,2,3,3-d4 acid sodium salt
(TSP) as internal standard. High-resolution NMR experiments (25°C) were performed at 9.4T and

16.4 T (Bruker AVANCE spectrometer, Bruker GmbH, Karlsruhe, Germany). 1H-NMR spectra of cell
extracts were acquired using 90° flip angle, 30 s repetition time, 32K time domain data points and
128 transients.