the first three steps in selecting a sample size - p.mean · the first three steps in selecting a...
TRANSCRIPT

The first three steps in selecting a sample size
Steve SimonP.Mean Consultingwww.pmean.com

2. Why do I offer this webinar for free?
I offer free statistics webinars partly for fun and partly to build up goodwill for my consulting business, – www.pmean.com/consult.html
Also see my Facebook and LinkedIn pages– www.facebook.com/pmean– www.linkedin.com/in/pmean
I provide a free newsletter about Statistics, The Monthly Mean.– www.pmean.com/news– www.facebook.com/group.php?gid=302778306676

3. Abstract
Abstract: One of your most critical choices in designing a research study is selecting an appropriate sample size. A sample size that is either too small or too large will be wasteful of resources and will raise ethical concerns. In this class, you will learn how to: identify the information you need to produce a power calculation; justify an appropriate sample size for your research; and examine the sensitivity of the sample size to changes in your research design. .

4. Outline
1. Pop quiz 2. Sample size justification is an economic
justification3. Definitions4. Specifying a research hypothesis5. Identifying the variation in your outcome6. Determining the minimum clinically important
difference7. Repeat of pop quiz

5. Pop quiz #1
A good sample size will produce1. Large values for both alpha and beta.2. A large value for alpha and a small value for
beta.3. A small value for alpha and a large value for
beta.4. Small values for both alpha and beta.5. I'm awfully glad I'm a Beta, because I don't
work so hard. 6. I don’t know the answer.

6. Pop quiz #2
One of the three things you need to calculate an appropriate sample size is
1. A confidence interval for your outcome variable2. A range for your outcome variable3. A standard deviation for your outcome variable.4. A standard error for your outcome variable.5. Any of these is fine. 6. I don’t know the answer.

7. Pop quiz #3The minimum clinically important difference is
determined by1. Finding a balance between the benefits and the
harms of a new drug.2. Finding a balance between the cost of sampling an
additional patient and the incremental reduction in uncertainty.
3. Finding a balance between Type I and Type II error rates.
4. Finding a balance between your work and your family.
5. More than one answer above is correct.6. I don’t know the answer.

8. Sample size justification is an economic justification
A researcher is finishing up a six year, ten million dollar NIH grant and writes up in the final report "This is a new and innovative surgical procedure and we are 95% confident that the cure rate is somewhere between 3% and 96%."

9. Sample size justification is an economic justification
The heart and soul of all sample size calculations is economic. You want to insure that your research dollars are well spent, that you are getting something of value for your investment.
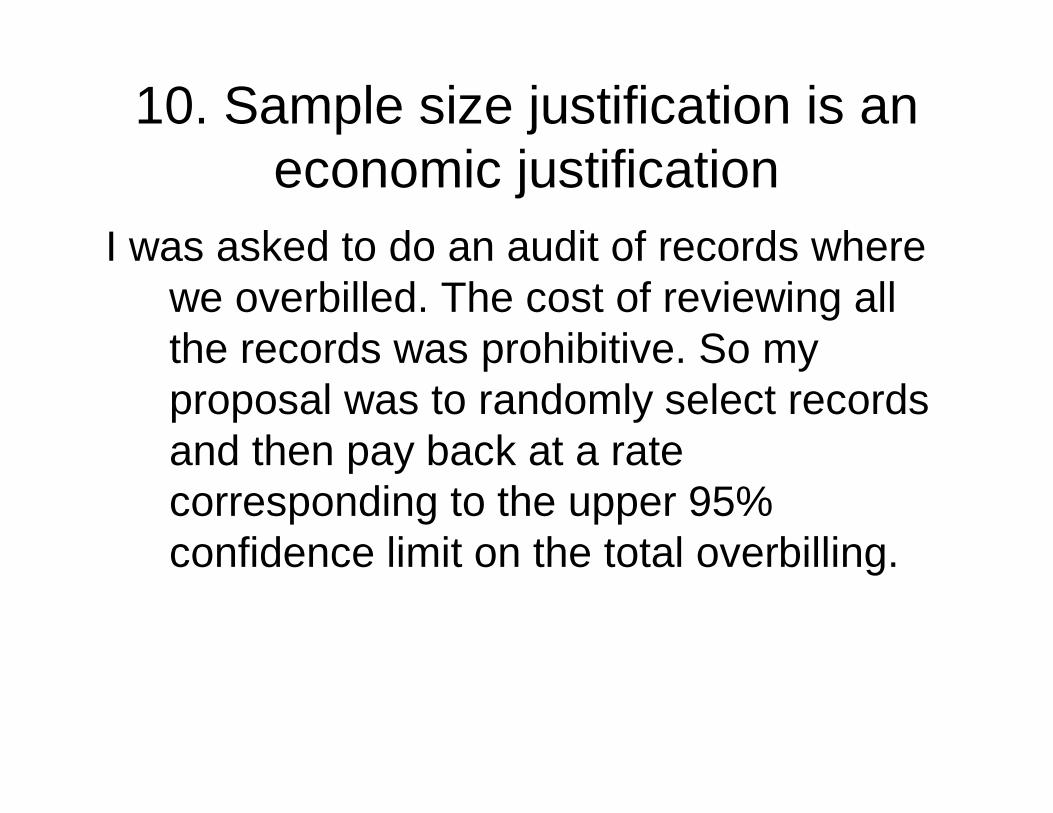
10. Sample size justification is an economic justification
I was asked to do an audit of records where we overbilled. The cost of reviewing all the records was prohibitive. So my proposal was to randomly select records and then pay back at a rate corresponding to the upper 95% confidence limit on the total overbilling.

11. Sample size justification is an economic justification
The ideal sample size in such a setting is the sample size where the cost of collecting an additional record is just matched by the resulting gain in precision.
– If we are spending $100 for an extra record, and the interval shrinks by $200 if we add that record, then we are benefiting from a larger sample.
– If we are spending $100 for an extra record, and the interval shrinks by $50 if we add that record, then our sample is too large.

12. Sample size justification is an economic justification

13. Sample size justification is an economic justification
The curve in the previous graph shows the general concept of diminishing returns. With a small sample size, each additional record has a large payoff in reduction of uncertainty. But as the sample size increases, the incremental payoff grows smaller. Eventually, the incremental benefit of further reducing uncertainty is counterbalanced by the incremental increase in sampling costs.
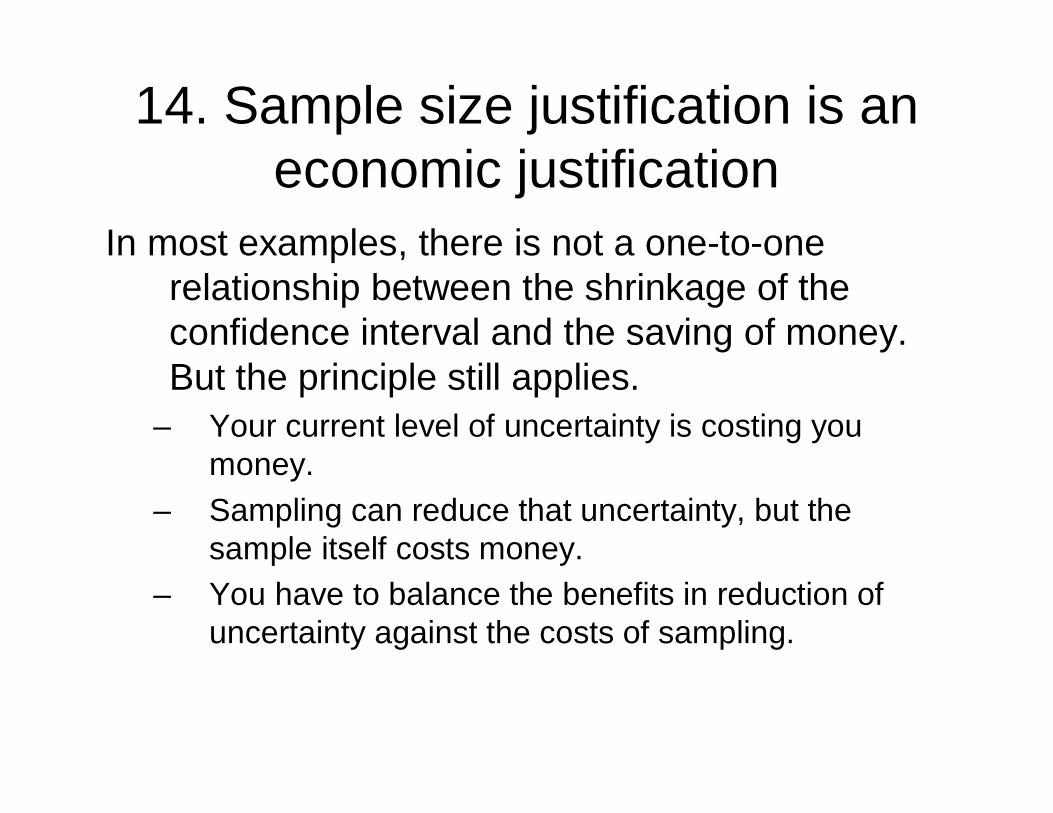
14. Sample size justification is an economic justification
In most examples, there is not a one-to-one relationship between the shrinkage of the confidence interval and the saving of money. But the principle still applies.
– Your current level of uncertainty is costing you money.
– Sampling can reduce that uncertainty, but the sample itself costs money.
– You have to balance the benefits in reduction of uncertainty against the costs of sampling.

15. Ethical concerns about sample size.
People volunteer for research studies for three reasons:
1. To earn some money,2. To find out more about the research process, or3. To help other people.
If the research study has such a small sample size that the results are uninterpretable then you have helped no one. You have broken an implicit promise to those volunteers.

16. Ethical concerns about sample size.
Too large a sample size is also an ethical problem. Research volunteers often suffer during a clinical trial.
– They may experience pain,– They may endure a risky procedure, and/or– They may forgo an appropriate medical treatment (if
there is a placebo arm) or endure an inferior treatment (if there is an active control).
Too large a sample size creates needless suffering among research volunteers.

17. Definitions: Type I Error
• In your research, you specify a null hypothesis (typically labeled H0) and an alternative hypothesis (typically labeled Ha, or sometimes H1). By tradition, the null hypothesis corresponds to no change. A Type I error is rejecting the null hypothesis when the null hypothesis is true.

18. Definitions: Type I Error
• Example: Consider a new drug that we will put on the market if we can show that it is better than a placebo. In this context, H0 would represent the hypothesis that the average improvement (or perhaps the probability of improvement) among all patients taking the new drug is equal to the average improvement (probability of improvement) among all patients taking the placebo. A Type I error would be allowing an ineffective drug onto the market.

19. Definitions: Type II Error
• A Type II error is accepting the null hypothesis when the null hypothesis is false. Many studies have small sample sizes that make it difficult to reject the null hypothesis, even when there is a big change in the data. In these situations, a Type II error might be a possible explanation for the negative study results.
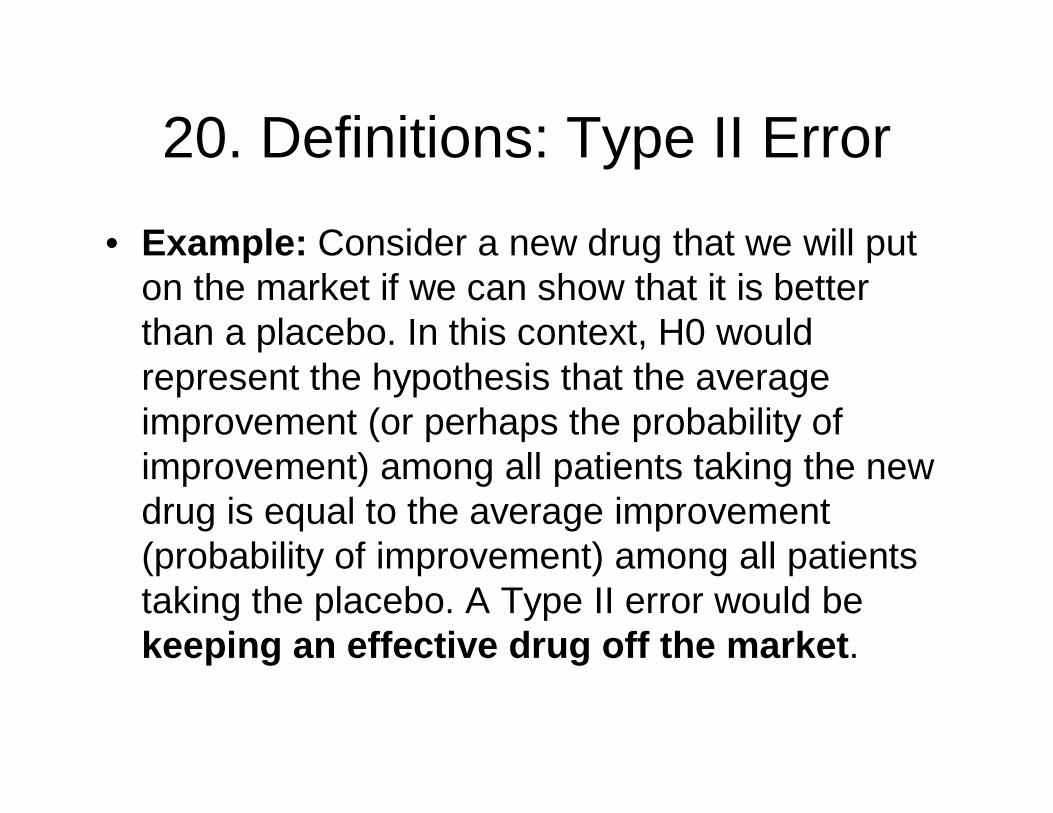
20. Definitions: Type II Error
• Example: Consider a new drug that we will put on the market if we can show that it is better than a placebo. In this context, H0 would represent the hypothesis that the average improvement (or perhaps the probability of improvement) among all patients taking the new drug is equal to the average improvement (probability of improvement) among all patients taking the placebo. A Type II error would be keeping an effective drug off the market.

21. Definitions: Alpha, Beta, and Power
• Alpha = P[ Type I error ]• Beta = P[ Type II error ]• Power = P[ Rej H0 | H0 false] = 1 - Beta.A good sample size will produce small
values for Alpha (0.1 or less) and Beta (0.2 or less). Equivalently, a good sample size will produce small values for Alpha and large values for power (0.8 or higher).

22. The three steps to determine an appropriate sample size
There are three basic steps in determining an appropriate sample size:
1. Specifying a research hypothesis2. Identifying the variation in your outcome3. Determining the minimum clinically
important difference

23. Specifying a research hypothesis
Not all research can or should have a research hypothesis. But for those studies that do have a research hypothesis, this needs to be shared with your consulting statistician. This will help him/her identify the appropriate
1. research design, and2. test statistic

24. Specifying a research hypothesis
I like to use the PICO format described in Evidence-Based Medicine to help people formulate a good research hypothesis. A research hypothesis will usually (but not always) have four elements:
– P: patient population. This is the group of patients that you want to examine.
– I: intervention. This is what you do to the group of patients that you think will help them improve.
– C: comparison group. This is the group of patients without the intervention that you want to compare to.
– O: outcome. This is the variable that will indicate whether or not the intervention is successful.
Sometimes you may have an exposure (something bad that your patients have to endure) rather than an intervention.

25. Specifying a research hypothesis
What do you do if you don't have a research hypothesis? In some research studies, the goal is exploratory. You don't have a formal hypothesis at the start of the study, but rather you are hoping that the data you collect will generate hypotheses for future studies. The path to selecting a sample size in these settings is quite different. Often you want to establish that the confidence intervals for some of the key descriptive statistics in these studies has a reasonable amount of precision.
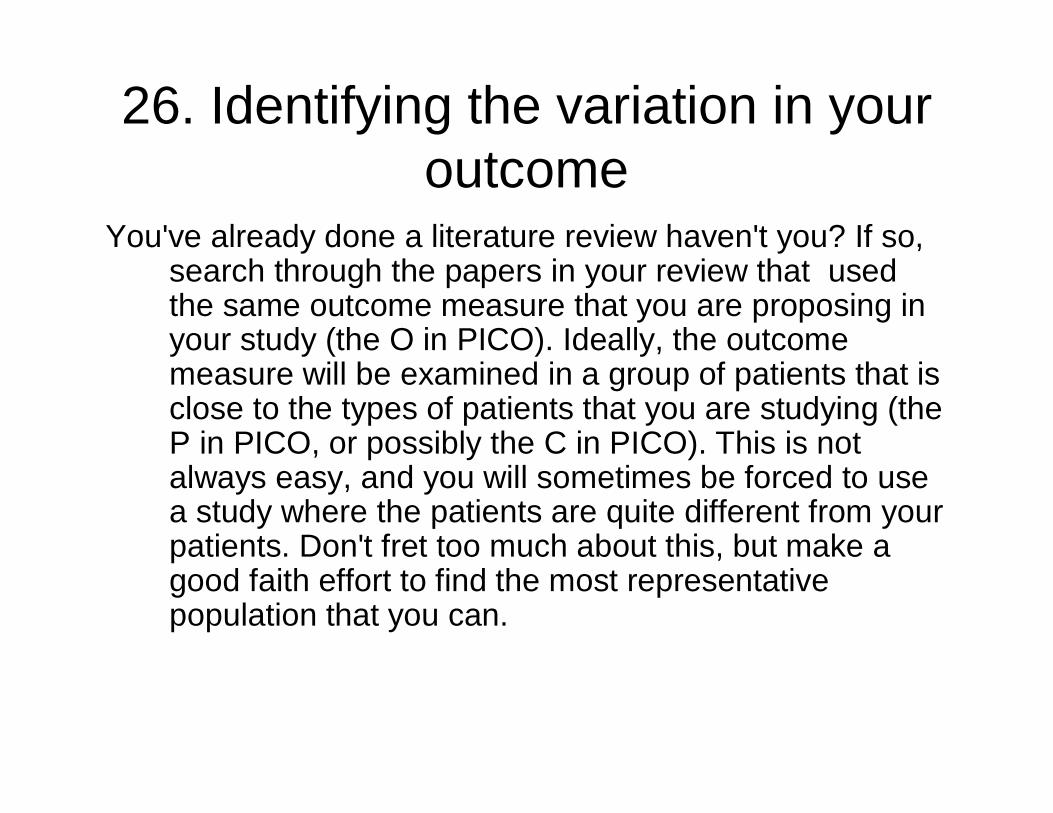
26. Identifying the variation in your outcome
You've already done a literature review haven't you? If so, search through the papers in your review that used the same outcome measure that you are proposing in your study (the O in PICO). Ideally, the outcome measure will be examined in a group of patients that is close to the types of patients that you are studying (the P in PICO, or possibly the C in PICO). This is not always easy, and you will sometimes be forced to use a study where the patients are quite different from your patients. Don't fret too much about this, but make a good faith effort to find the most representative population that you can.

27. Identifying the variation in your outcome
Some clients will raise an objection here and say that their research is unique, so it is impossible to find a comparable paper. It is true that most research is unique (otherwise it wouldn't be research). But what these people are worried about is that their intervention (the I in PICO) is unique. In these situations, the remainder of the hypothesis is usually quite mundane: the patients, the comparison group, and the outcome (P, C, and O in PICO) are all well studied. If you find a study where the P, C, and O match reasonably well, but the I doesn't, then you are probably going to get a good estimate of variation.

28. Identifying the variation in your outcome
If there are major dissimilarities because this patient population (P) is very different than any previously studied patient population, or because the outcome measure (O) is newly developed by the researcher, then perhaps a pilot study would be needed to establish a reasonable estimate of variation.

29. Identifying the variation in your outcome
Sometimes you can infer a standard deviation through general principles. If a variable is constrained to be between 0 and 100, it would be impossible, for example, for the standard deviation to be five thousand.
There are approximate formulas relating the range of a distribution to the standard deviation. Divide the range by four or six to get an approximate standard deviation.
There are also formulas that allow you calculate a standard deviation from a coefficient of variation, a confidence interval, or a standard error. Just about any measure of variation can be converted into a standard deviation.

30. Identifying the variation in your outcome
In some situations, the amount of variation in a proportion or count is larger than would be expected by the statistical distributions (binomial and Poisson) traditionally associated with these measures. Still, a calculation based on binomial or Poisson assumptions is a reasonable starting point for further calculations.

31. Identifying the variation in your outcome
If your outcome measure is a proportion, then the variation is related to the estimated proportion. Similarly, the variation in a count variable is related to the mean of the counts. Find a paper that establishes a proportion or average count in a control group similar to your control group and any competent statistician will be able to get an estimate of variation.

32. Identifying the variation in your outcome
In some situations, the amount of variation in a proportion or count is larger than would be expected by the statistical distributions (binomial and Poisson) traditionally associated with these measures. Still, a calculation based on binomial or Poisson assumptions is a reasonable starting point for further calculations.

33. Determining the minimum clinically important difference
The minimum clinically significant difference is the boundary between a difference so small that no one would adopt the new intervention on the basis of such a meager changer and a difference large enough to make a difference (that is, to convince people to change their behavior and adopt the new therapy).

34. Determining the minimum clinically important difference
Establishing the minimum clinically relevant difference is a tricky task, but it is something that should be done prior to any research study. The minimum clinically relevant difference is determined by medical experts and not by statisticians. You might start by asking yourself "How much of an improvement would I have to see before I would adopt a new treatment?" Also, try talking with some of your colleagues. And look at the size of improvements for other successful treatments.

35. Determining the minimum clinically important difference
For binary outcomes, the choice is not too difficult in theory. Suppose that an intervention "costs" X dollars in the sense that it produces that much pain, discomfort, and inconvenience, in addition to any direct monetary costs. Suppose the value of a cure is kX where k is a number greater than 1. A number less than 1, of course, means that even if you could cure everyone, the costs outweigh the benefits of the cure.

36. Determining the minimum clinically important difference
For k>1, the minimum clinically significant difference in proportions is 1/k. So if the cure is 10 times more valuable than the costs, then you need to show at least a 10% better cure rate (in absolute terms) than no treatment or the current standard of treatment. Otherwise, the cure is worse than the disease.

37. Determining the minimum clinically important difference
It helps to visualize this with certain types of alternative medicine. If your treatment is aromatherapy, there is almost no cost involved, so even a very slight probability of improvement might be worth it. But Gerson therapy, which involves, among other things, coffee enemas, is a different story. An enema is reasonably safe, but is not totally risk free. And it involves a substantially greater level of inconvenience than aromatherapy. So you'd only adopt Gersontherapy if it helped a substantial fraction of patients. Exactly how many depends on the dollar value that you place on having to endure a coffee enema, a task that I will leave for someone else to quantify.

38. Determining the minimum clinically important difference
• For continuous variables, the minimum clinically significant difference could be defined as above. Define a threshold that represents "better" versus "not better" and then try to shift the entire distribution so that the fraction "better" under the new treatment is at least 1/k.
• There have also been efforts to elucidate, through experiments, interviews, and other approaches, what the average person considers an important shift to be. For the visual analog scale of pain, for example, a shift of at least 15 mm is considered the smallest value that is noticeable to the average patient.
39. Example
• In a study of two different skin barriers for burn patients, we are interested in three outcome measures: pain, healing time, and cost. We will randomly assign half of the patients to one skin barrier and half to the other.

40. Example• For pediatric patients we usually measure
pain with the Oucher, a five point scale that has been validated for children. A review of previous studies using the Oucher have shown that it has a standard deviation of about 1.5 units. We would be interested in seeing how large a sample size is needed to show a change of 1 unit, the smallest individual change attainable on the Oucher. We want to have a power of .80, or equivalently, the probability of a Type II error of .20.

41. Example
• The formulas for sample size vary from problem to problem. The sample size needed for a comparison of means from two independent groups is
42. Example• We use the letter "z" to represent a standard
normal distribution. Alpha represents the probability of a Type I error (usually .05). Beta represents the probability of a Type II error (we usually want this to somewhere between .05 and .20). Sigma represents the standard deviation, and this formula allows for the possibility of different standard deviations in group 1 and group 2. Don't forget that the formula requires you to square these standard deviations. Finally, D is the clinically relevant difference.

43. Example
So in order to achieve 80% power for detecting a one unit difference in the Oucher score, which has a reported standard deviation of 1.5, we would need to sample 36 patients in each group.

44. Example• Healing time is a more difficult endpoint to assess.
Medical textbooks cite that the healing time for second degree burns has a range of 4 days (minimum 10, maximum 14). A study of healing times for a glove made from one of the skin barriers showed a healing time range of 6 (minimum 2 and maximum 8 days).
• A rule of thumb is that the standard deviation is about one fourth to one sixth the size of the range. So we could have a standard deviation as small as 0.67 or as large as 1.5. An average change of one day in healing time would be considered clinically relevant.

45. Example
• If we use the largest possible estimate of standard deviation, we would get (coincidentally) the exact same sample size of 36 per group. If we used the smallest estimate of the standard deviation, we would need only 7 subjects per group.

46. Example• For one type of skin barrier, a study of costs showed a
range of $4.00 ($5.50 to $9.50). We would like to be able to detect a difference as small as $0.50 in costs.
• Using the same rule of thumb, we get an estimate of the standard deviation of either 0.67 or 1.0. Using the smaller estimate of standard deviation, we would need 29 subjects per group using the smaller estimate of standard deviation. We would need 63 subjects per group, using the larger estimate.
• A sample size of 63 is untenable, so we decide that we can live with a study that could only detect a $1.00 change in costs. For this size difference, we would need 16 subjects per group using the larger standard deviation.
47. Example
• In summary, to achieve adequate power for all three endpoints, we would need 36 patients per group,. This is larger than we need for the healing time endpoint. It is also larger than what we need for the cost endpoint, unless we wanted to detect a $0.50 change in costs. To detect such a small difference, we need a sample size of 63 subjects per group.

48. Flies in the ointmentCertain research designs require more effort to
determine an appropriate sample size. The formulas are much more complicated and you need to provide more information than just a standard deviation of your outcome variable. Be cautious about sample size calculations for
– Cluster randomized trials.– Hierarchical models.– Longitudinal designs.– Multi-center trials.– Survival data.

49. Flies in the ointment
Think carefully about how quickly you can recruit patients for a clinical trial. A trial that takes 15 years to complete will be probably be useless.
Try to estimate how many patients will refuse to participate, how many will fail to meet all eligibility requirement, and how many patienswill drop out prior to the completion of the study. Adjust your sample size upward to account for these factors.

50. SummaryA good sample size will produce small probabilities
for Type I and Type II errors (small values for Alpha and Beta).
The first step in determining sample size is to specify a research hypothesis.
You also need a measure of variation for your outcome variable and the minimum clinically important difference.
The minimum clinically important difference is the smallest change that would be considered sufficient to justify changing your clinical practice.

51. Pop quiz #1
A good sample size will produce1. Large values for both alpha and beta.2. A large value for alpha and a small value for
beta.3. A small value for alpha and a large value for
beta.4. Small values for both alpha and beta.5. I'm awfully glad I'm a Beta, because I don't
work so hard. 6. I don’t know the answer.

52. Pop quiz #2
One of the three things you need to calculate an appropriate sample size is
1. A confidence interval for your outcome variable2. A range for your outcome variable3. A standard deviation for your outcome variable.4. A standard error for your outcome variable.5. Any of these is fine. 6. I don’t know the answer.

53. Pop quiz #3The minimum clinically important difference is
determined by1. Finding a balance between the benefits and the
harms of a new drug.2. Finding a balance between the cost of sampling an
additional patient and the incremental reduction in uncertainty.
3. Finding a balance between Type I and Type II error rates.
4. Finding a balance between your work and your family.
5. More than one answer above is correct.6. I don’t know the answer.