the fiscal and economic impact of breed discriminatory
TRANSCRIPT

The Fiscal and Economic Impact of Breed Discriminatory Legislation in
Overland Park, Kansas
Results from a 35 Year Experiment
Prepared by John Dunham & Associates
May 6, 2021

1
The Fiscal and Economic Impact of Breed Discriminatory Legislation in Overland Park, Kansas
Results from a 35 Year Experiment
Executive Summary
The city of Overland Park is the second largest city in the State of Kansas and has had restrictions on the
ownership of pit bull type dogs since 1986. At that time, the restriction required a person to keep their pet in a fenced area and keep the animal muzzled in public settings. The policy also required pet owners to
maintain additional homeowners’ insurance to cover the cost of damage the animal might cause.1
Following up on these restrictions, in 2006, the city enacted a full ban on any pit bull dog or wolf-hybrid
(Tundra Shepherd). Pit Bulls were defined not only as three specific breeds (Staffordshire Bull Terrier,
American Staffordshire Terrier and American Pit Bull Terrier), but also as any dog that looks like one of
these three breeds of dog.2
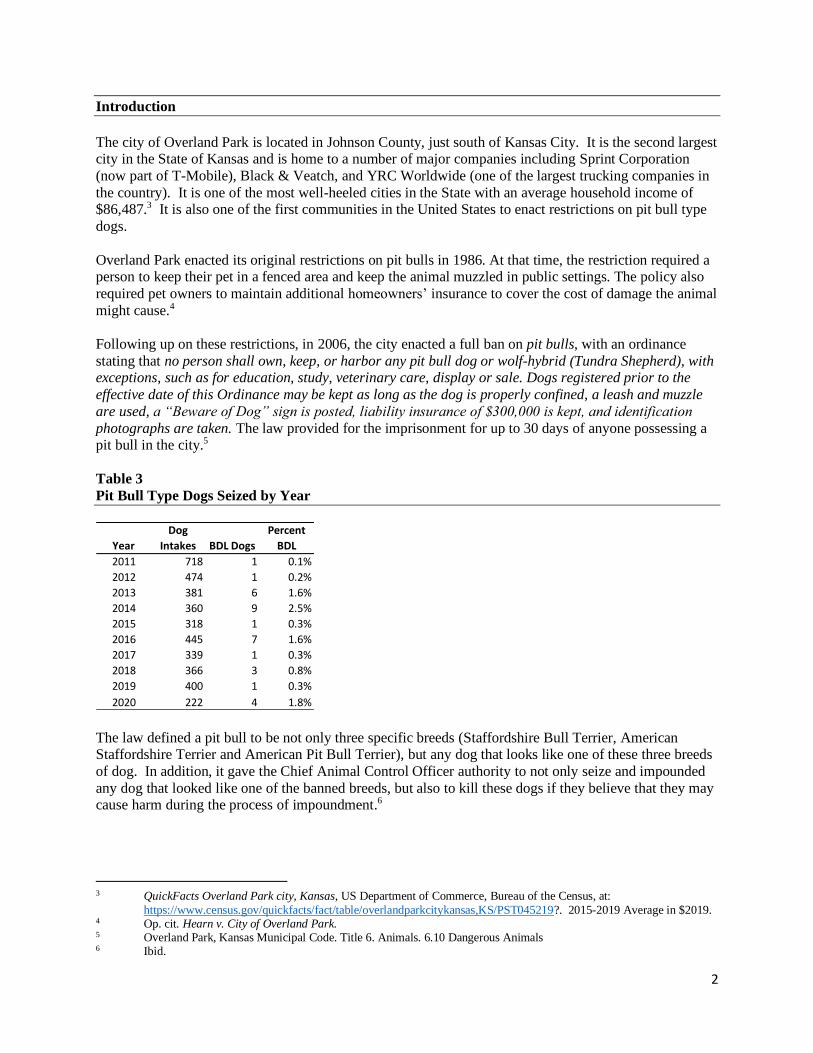
Table 1
Pit Bull Type Dogs Seized by Year
Data are not available going back to 2006; however, since 2011 a total only 34 animals were detained by
the city under this ordinance. Even if the maximum number of dogs apprehended in a year that were subject to the BDL (9) were apprehended in the 5 years prior to 2011, the total number of dogs would be
just 79.
The cost of enforcing the ordinance since 2011 is estimated to be $842,170 or roughly $107,200 per dog,
with no reported effect on safety or public health. In addition, lost tax revenues from residents who may
have moved from Overland Park or those who decided not to come to the community, along with lost revenues from veterinary care, grooming and other services for dogs have cost the city as much as $8.5
million in economic activity per year and about 105 full-time equivalent jobs.
Table 2
Estimated Economic Impact of BDL in Overland Park
1 Hearn v. City of Overland Park, 772 P.2d 758 (Kan. 1989), at: www.animallaw.info/case/hearn-v-city-overland-park 2 Overland Park, Kansas Municipal Code. Title 6. Animals. 6.10 Dangerous Animals
Year
Dog
Intakes BDL Dogs
Percent
BDL
2011 718 1 0.1%
2012 474 1 0.2%
2013 381 6 1.6%
2014 360 9 2.5%
2015 318 1 0.3%
2016 445 7 1.6%
2017 339 1 0.3%
2018 366 3 0.8%
2019 400 1 0.3%
2020 222 4 1.8%
Direct Indirect Induced Total
Jobs 84.7 3.4 17.0 105.1
Wages 3,214,105$ 180,629$ 771,691$ 4,166,424$
Economic Output 5,186,688$ 732,811$ 2,549,458$ 8,468,957$
2
Introduction
The city of Overland Park is located in Johnson County, just south of Kansas City. It is the second largest city in the State of Kansas and is home to a number of major companies including Sprint Corporation
(now part of T-Mobile), Black & Veatch, and YRC Worldwide (one of the largest trucking companies in
the country). It is one of the most well-heeled cities in the State with an average household income of $86,487.3 It is also one of the first communities in the United States to enact restrictions on pit bull type
dogs.
Overland Park enacted its original restrictions on pit bulls in 1986. At that time, the restriction required a person to keep their pet in a fenced area and keep the animal muzzled in public settings. The policy also
required pet owners to maintain additional homeowners’ insurance to cover the cost of damage the animal
might cause.4
Following up on these restrictions, in 2006, the city enacted a full ban on pit bulls, with an ordinance
stating that no person shall own, keep, or harbor any pit bull dog or wolf-hybrid (Tundra Shepherd), with exceptions, such as for education, study, veterinary care, display or sale. Dogs registered prior to the
effective date of this Ordinance may be kept as long as the dog is properly confined, a leash and muzzle
are used, a “Beware of Dog” sign is posted, liability insurance of $300,000 is kept, and identification
photographs are taken. The law provided for the imprisonment for up to 30 days of anyone possessing a pit bull in the city.5
Table 3
Pit Bull Type Dogs Seized by Year
The law defined a pit bull to be not only three specific breeds (Staffordshire Bull Terrier, American Staffordshire Terrier and American Pit Bull Terrier), but any dog that looks like one of these three breeds
of dog. In addition, it gave the Chief Animal Control Officer authority to not only seize and impounded
any dog that looked like one of the banned breeds, but also to kill these dogs if they believe that they may cause harm during the process of impoundment.6
3 QuickFacts Overland Park city, Kansas, US Department of Commerce, Bureau of the Census, at:
https://www.census.gov/quickfacts/fact/table/overlandparkcitykansas,KS/PST045219?. 2015-2019 Average in $2019. 4 Op. cit. Hearn v. City of Overland Park. 5 Overland Park, Kansas Municipal Code. Title 6. Animals. 6.10 Dangerous Animals 6 Ibid.
Year
Dog
Intakes BDL Dogs
Percent
BDL
2011 718 1 0.1%
2012 474 1 0.2%
2013 381 6 1.6%
2014 360 9 2.5%
2015 318 1 0.3%
2016 445 7 1.6%
2017 339 1 0.3%
2018 366 3 0.8%
2019 400 1 0.3%
2020 222 4 1.8%

3
While Overland Park was not the first community to ban pit bulls, that distinction likely goes to the Village of Tijeras, New Mexico, it was an early adopter of this sort of legislation. The Overland Park ban
itself went into effect in 2006, and since then it is estimated that 79 pit bull type dogs have been seized.7
Many communities have found that hastily enacted Breed Discriminatory Laws (BDLs) have been difficult and expensive to enforce, while having no impact on public health. As such, communities across
the country (including Johnson County where Overland Park is located), have either revoked or
significantly weakened such legislation.
This analysis examines the cost of the BDL in Overland Park since it went into effect in 2006.
The Denver Experience
The City and County of Denver Colorado adopted an ordinance similar to Overland Park’s in 1989.
According to a recent study, since the BDL has been in place, the City and County of Denver and its
animal control agency, Denver Animal Protection, have spent at least $5.8 million enforcing the legislation.8
Data from 2007 to 2017 indicate that the number of banned dogs being taken into the City’s animal
shelter has been falling at a rate of 0.03 dogs per year to 0.12 dogs per 1,000 residents. In 2017, there were 41 dogs in the care of DAS under the city’s ordinance which is much lower than the average since
the BDL went into effect. These dogs were held in the shelter for an average of about two weeks, after
which 46.3 percent (19 dogs) were euthanized. Under the City’s ban, these dogs cannot be adopted out, but can be returned to owners or transferred to other shelters outside of the city. Of the 41 dogs held
under the ban in 2017, only one was adopted,9 19 were returned to their owner, and 2 were transferred.10
The numbers from Denver show that a total of 7,784 dogs were impounded under the ordinance from 1989-2017, or about 278 per year on average. This is out of a total average of about 166,970 dogs owned
by residents of the City (0.17 percent of all dogs). Based on data from the City itself, the cost to enforce
the law is roughly $750 per dog.11 These costs include:
• Intake costs
• Kenneling costs
• Testing costs
• Animal control costs
• Euthanasia costs
• Court and legal costs
According to the Denver study, in addition to these costs, the city suffered additional economic burdens from the BDL. These included the loss of an estimated $3.7 million/year in grooming, boarding, and
medical care-related services that would have been provided by area firms, for a total of $108 million in
lost pet service revenues since the legislation was enacted in 1989. The study also estimated that the
7 Note this figure may include wolves but it is unlikely that a lot of people in Overland Park are keeping wolves as pets.
Data from the Great Plains SPCA for the period from 2011-2020. The maximum annual reported figure for detained dogs (9) was assumed to apply to prior years.
8 2017 Dollars. See: Hawes, Sloane, et. al., Denver Breed-Specific Legislation, Animal Law Review, Volume 26, Spring 2020.
9 After further examination, it appears this dog was ultimately determined to be an American Bulldog and not a restricted breed, therefore was eligible to be placed up for adoption.
10 Op cit. Hawes, Sloane, et. al. 11 Ibid.
4
transfer of affected dogs to surrounding communities has resulted in a cost of $1 million since 1989 for shelters in neighboring cities.12 This suggests that a BDL in Denver has cost the city’s taxpayers and
businesses upwards of $111.7 million over the course of 29 years, while impacting surrounding
communities as well.
The Impact of the BSL Ordinance on Overland Park
While the Denver study provides a good baseline for the cost of BDLs, each community is different.
Denver is a city of over 727,000 people, while the population of Overland Park is just under 195,500.
Colorado as a state has different costs than Kansas, and animal control officers must deal with a range of other species like bears, deer and mountain lions that are rare to see in the suburbs of Kansas City.
Even so, the types of activities required to enforce a BDL and to shelter and/or euthanize animals are similar across communities.
The Fiscal Cost of Enforcing the BSL Ordinance
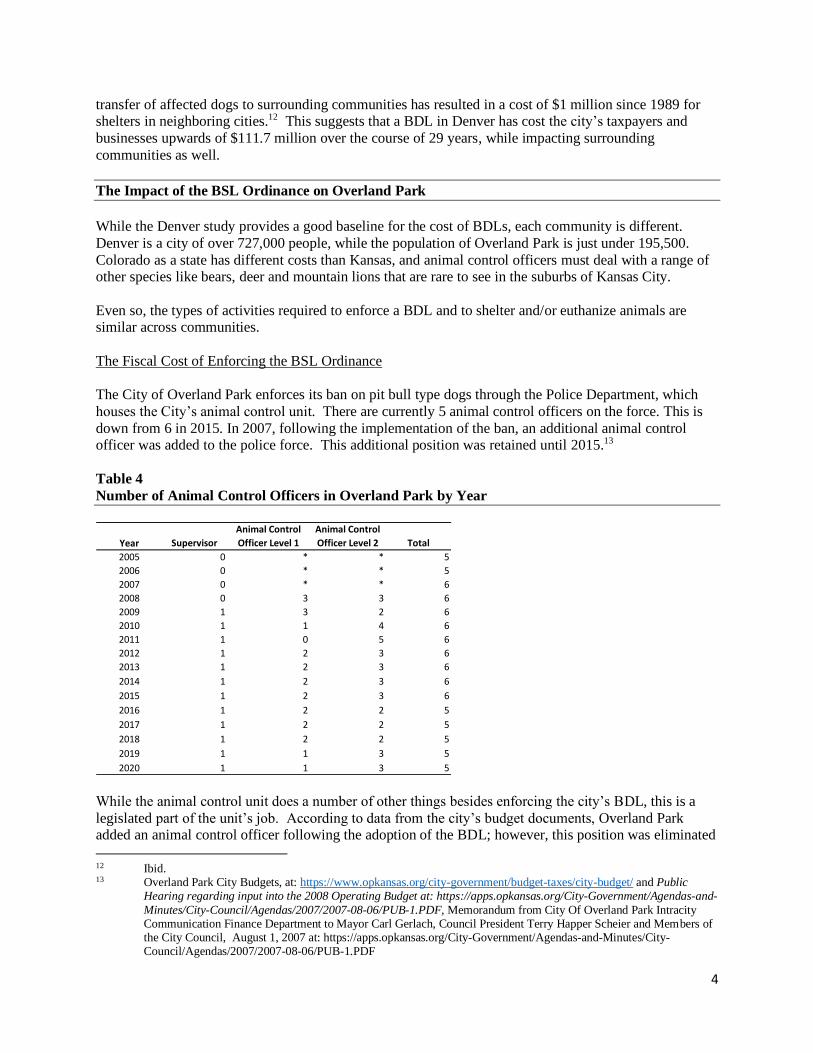
The City of Overland Park enforces its ban on pit bull type dogs through the Police Department, which
houses the City’s animal control unit. There are currently 5 animal control officers on the force. This is
down from 6 in 2015. In 2007, following the implementation of the ban, an additional animal control officer was added to the police force. This additional position was retained until 2015.13
Table 4
Number of Animal Control Officers in Overland Park by Year
While the animal control unit does a number of other things besides enforcing the city’s BDL, this is a
legislated part of the unit’s job. According to data from the city’s budget documents, Overland Park added an animal control officer following the adoption of the BDL; however, this position was eliminated
12 Ibid. 13 Overland Park City Budgets, at: https://www.opkansas.org/city-government/budget-taxes/city-budget/ and Public
Hearing regarding input into the 2008 Operating Budget at: https://apps.opkansas.org/City-Government/Agendas-and-
Minutes/City-Council/Agendas/2007/2007-08-06/PUB-1.PDF, Memorandum from City Of Overland Park Intracity Communication Finance Department to Mayor Carl Gerlach, Council President Terry Happer Scheier and Members of the City Council, August 1, 2007 at: https://apps.opkansas.org/City-Government/Agendas-and-Minutes/City-Council/Agendas/2007/2007-08-06/PUB-1.PDF
Year Supervisor
Animal Control
Officer Level 1
Animal Control
Officer Level 2 Total
2005 0 * * 5
2006 0 * * 5
2007 0 * * 6
2008 0 3 3 6
2009 1 3 2 6
2010 1 1 4 6
2011 1 0 5 6
2012 1 2 3 6
2013 1 2 3 6
2014 1 2 3 6
2015 1 2 3 6
2016 1 2 2 5
2017 1 2 2 5
2018 1 2 2 5
2019 1 1 3 5
2020 1 1 3 5
5
in 2016. Denver also reduced its level of enforcement over time and the city’s BDL was revised in 2018. Now rather than banning dogs based solely on their appearance, restrictions are designed to make owners
responsible for their pets’ actions, and dogs are only euthanized or banned from the city based on their
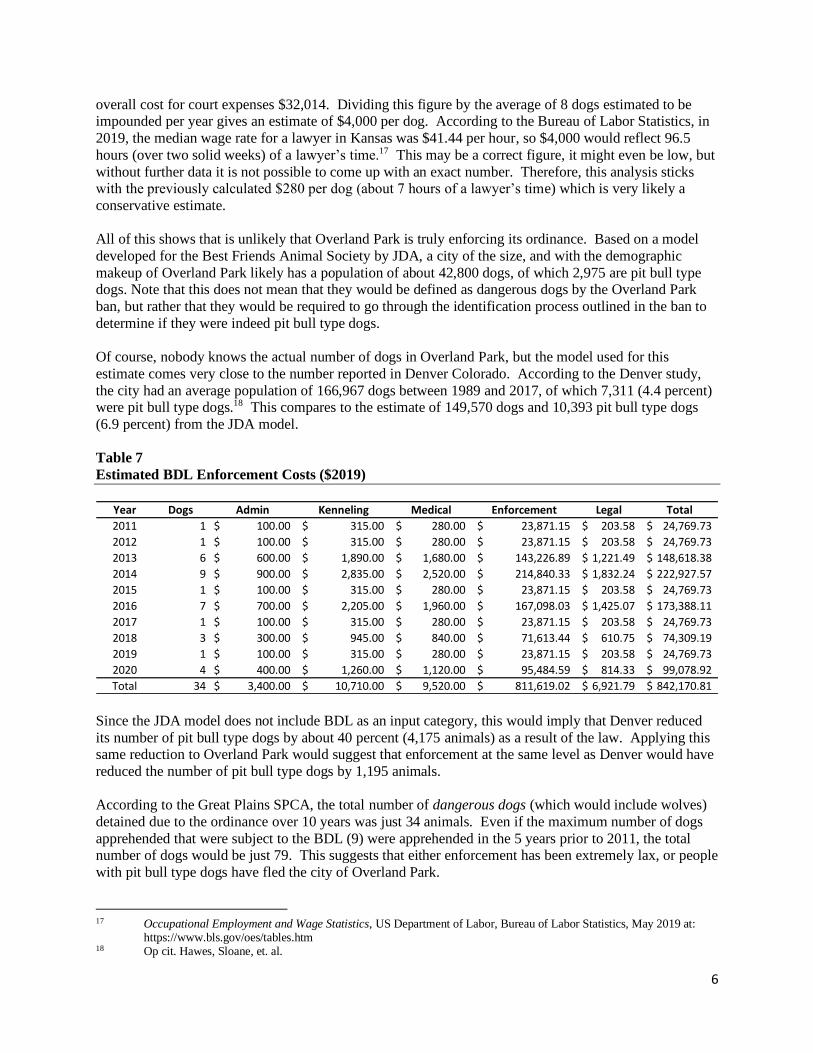
demonstrated behavior. 14 Based on the number of dogs detained each year, and the number that were found to be in violation of the
BDL, on average since 2011 (the earliest year for which data are available), animal control officers detain
about 73 dogs per officer, and less than 1 restricted dog per officer.
The actual marginal per dog costs for enforcing the BDL are not extremely high, however the
enforcement costs add up and can become quite high. Based on information from the Great Plains SPCA, the organization that handles sheltering and care for animals retrieved by Overland Park’s animal control
officers, the city spent just $5,560 to kennel, test and euthanize the 8 dogs that were identified as pit bull
type over the past three years.
Table 5
Amount Paid by Overland Park to SPCA for Handling Dogs Under the BDL
These costs are about 54.5 percent higher than those projected in a model developed for the Best Friends Animal Society by JDA.15 Examining like costs from the model, it was forecast that the kenneling and
medical costs per dog would be roughly $405 in Overland Park. This is $450 in 2019 dollars and
suggests that the model is extremely conservative.
Table 6
Comparison Between JDA Estimates and Overland Park Costs
But these are not the total costs. According to the JDA model, the City of Overland Park would spend an
additional $1,080 in enforcement costs, and $204 in legal costs per dog to administer the BDL law.
Based on the number of dogs detained over the past 10 years, this equals $67,268; however, this is based on an extremely low number of dogs being detained. If the cost of an animal control officer is allocated
across this small number of dogs, the cost would rise to over $872,170, or about $84,217 per year, or
about $10,660 per dog. This compares with about $750 per detained dog in Denver.16
A similar argument could be said for the legal costs required to enforce the ordinance. Many pet owners
would be expected to take the city to court if it were to threaten their pet, and anecdotal reports suggest that these cases can go on for over a year. The JDA model allocates these costs across the 174 dogs that it
estimates would be detained annually by animal control officers. This is based on an estimate for the
14 Op cit. Hawes, Sloane, et. al. 15 The Fiscal Impact of Breed Discriminatory Legislation in the United States, Prepared for Best Friends Animal Society,
John Dunham & Associates, April 17, 2012, at: http://bestfriends.guerrillaeconomics.net/ 16 Op cit. Hawes, Sloane, et. al.
Year Admin Kennelling Medical Total
2018 300.00$ 945.00$ 840.00$ 2,085.00$
2019 100.00$ 315.00$ 280.00$ 695.00$
2020 400.00$ 1,260.00$ 1,120.00$ 2,780.00$
Total 800.00$ 2,520.00$ 2,240.00$ 5,560.00$
JDA Model SPCA
Cost Per Dog 449.94$ 695.00$
6
overall cost for court expenses $32,014. Dividing this figure by the average of 8 dogs estimated to be impounded per year gives an estimate of $4,000 per dog. According to the Bureau of Labor Statistics, in
2019, the median wage rate for a lawyer in Kansas was $41.44 per hour, so $4,000 would reflect 96.5
hours (over two solid weeks) of a lawyer’s time.17 This may be a correct figure, it might even be low, but
without further data it is not possible to come up with an exact number. Therefore, this analysis sticks with the previously calculated $280 per dog (about 7 hours of a lawyer’s time) which is very likely a
conservative estimate.
All of this shows that is unlikely that Overland Park is truly enforcing its ordinance. Based on a model
developed for the Best Friends Animal Society by JDA, a city of the size, and with the demographic
makeup of Overland Park likely has a population of about 42,800 dogs, of which 2,975 are pit bull type dogs. Note that this does not mean that they would be defined as dangerous dogs by the Overland Park
ban, but rather that they would be required to go through the identification process outlined in the ban to
determine if they were indeed pit bull type dogs.
Of course, nobody knows the actual number of dogs in Overland Park, but the model used for this
estimate comes very close to the number reported in Denver Colorado. According to the Denver study,
the city had an average population of 166,967 dogs between 1989 and 2017, of which 7,311 (4.4 percent) were pit bull type dogs.18 This compares to the estimate of 149,570 dogs and 10,393 pit bull type dogs
(6.9 percent) from the JDA model.
Table 7
Estimated BDL Enforcement Costs ($2019)
Since the JDA model does not include BDL as an input category, this would imply that Denver reduced
its number of pit bull type dogs by about 40 percent (4,175 animals) as a result of the law. Applying this same reduction to Overland Park would suggest that enforcement at the same level as Denver would have
reduced the number of pit bull type dogs by 1,195 animals.
According to the Great Plains SPCA, the total number of dangerous dogs (which would include wolves)
detained due to the ordinance over 10 years was just 34 animals. Even if the maximum number of dogs
apprehended that were subject to the BDL (9) were apprehended in the 5 years prior to 2011, the total number of dogs would be just 79. This suggests that either enforcement has been extremely lax, or people
with pit bull type dogs have fled the city of Overland Park.
17 Occupational Employment and Wage Statistics, US Department of Labor, Bureau of Labor Statistics, May 2019 at:
https://www.bls.gov/oes/tables.htm 18 Op cit. Hawes, Sloane, et. al.
Year Dogs Admin Kenneling Medical Enforcement Legal Total
2011 1 100.00$ 315.00$ 280.00$ 23,871.15$ 203.58$ 24,769.73$
2012 1 100.00$ 315.00$ 280.00$ 23,871.15$ 203.58$ 24,769.73$
2013 6 600.00$ 1,890.00$ 1,680.00$ 143,226.89$ 1,221.49$ 148,618.38$
2014 9 900.00$ 2,835.00$ 2,520.00$ 214,840.33$ 1,832.24$ 222,927.57$
2015 1 100.00$ 315.00$ 280.00$ 23,871.15$ 203.58$ 24,769.73$
2016 7 700.00$ 2,205.00$ 1,960.00$ 167,098.03$ 1,425.07$ 173,388.11$
2017 1 100.00$ 315.00$ 280.00$ 23,871.15$ 203.58$ 24,769.73$
2018 3 300.00$ 945.00$ 840.00$ 71,613.44$ 610.75$ 74,309.19$
2019 1 100.00$ 315.00$ 280.00$ 23,871.15$ 203.58$ 24,769.73$
2020 4 400.00$ 1,260.00$ 1,120.00$ 95,484.59$ 814.33$ 99,078.92$
Total 34 3,400.00$ 10,710.00$ 9,520.00$ 811,619.02$ 6,921.79$ 842,170.81$

7
Table 8
Number of Dogs Brought to Shelter by Overland Park Animal Control
The Economic Cost of the BDL Ordinance:
Not only does the Overland Park pit bull ban cost the city roughly $84,200 per year to enforce, but it also
has an economic impact on the community. This impact consists of three parts:
• The opportunity cost of the $84,217 spent annually to enforce the ban;
• Lost residents due to people not moving to Overland Park because of the ban;
• Lost retail activity in the city due to people not purchasing animal care products and services.
While none of these three things are huge individually, added together they have a measurable, and significant impact on the economy of Overland Park.
The opportunity cost of enforcement:
Opportunity costs are an important part of economics. Every purchase made by an individual, or a
government, implies that some other purchase was not made. In the case of individuals, expenditures are
made to maximize benefits, so if one really enjoys pizza, but is not as fond of say burgers, they will benefit by purchasing a pizza and forgoing a burger. In this case, the opportunity cost of having a pizza,
is the loss of a burger.
The same is true of government. In this case, it is estimated that the city of Overland Park expended
$842,170 dollars in tax revenues between 2011 and 2020 enforcing the BDL. This money could have
been not spent by the city, but rather retained by taxpayers. In other words, the opportunity cost of enforcing the BDL was the purchases that the city’s taxpayers would have made in (for example) local
restaurants, at local retailers, or on home improvements.
Based on an analysis using the IMPLAN Input/Output Model (See Methodology), were taxpayers to have retained these funds rather than them being spent on the BDL, they would have generated $70,393
annually in new economic activity in the city, leading to about half of a full-time equivalent new job
paying $21,307 in wages and benefits. In other words, by taxing residents and spending the money on animal control efforts, the city of Overland Park is taking away business from other businesses in the
community, primarily residential real estate, medical care and investment services.
Lost residents due to people not moving to (or leaving) Overland Park because of the ban:
Year
Dog
Intakes BDL Dogs
Percent
BDL
2011 718 1 0.1%
2012 474 1 0.2%
2013 381 6 1.6%
2014 360 9 2.5%
2015 318 1 0.3%
2016 445 7 1.6%
2017 339 1 0.3%
2018 366 3 0.8%
2019 400 1 0.3%
2020 222 4 1.8%

8
As the analysis suggests, had the ban in Overland Park been as effective at reducing pit bull type dogs, as Denver’s restrictions, there would have been 1,116 additional dogs detained. This means that either
people have hidden their dogs from the authorities, or people with pit bull type dogs have either left
Overland Park or simply not moved there.
Interestingly, the trend of population growth in Overland Park shifted after 2006, with annual growth of
2,539.4 people prior to the ban falling to 2,293.0 following the ban. This would mean that over the 14
years (through 2019) that the ban went into effect, the population of Overland Park has grown by 4,120 fewer people.19 In Overland Park there are an average of 2.43 persons per household, so this would mean
that there are 1,696 fewer households.20
Based on the most recent Overland Park budget, the city collected about $55.6 million in revenues from
sales taxes in 2019, and roughly $50.3 million in property tax revenues. These were the two largest tax
revenue sources for Overland Park. The city’s 2019 mill levy was 13.566 mills, meaning that the
assessed valuation of property at that time was $41.6 billion, or roughly $515,435 per household. If there were 1,696 fewer households in the city due to the BDL, that would suggest that there would be $874.0
million less in assessed value to tax, resulting in $1,185,712 less in property tax revenues.
Figure 1
Population of Overland Park – Pre-Ban v. Post-Ban Trend
Overland Park also has a one percent sales tax that is collected on nearly all goods and services sold in the community. Kansas only exempts medical services and construction materials from sales taxes.
According to the Bureau of Labor Statistics, the average family in midwestern cities such as Overland
Park spent $33,865 in goods and services that would be considered taxable in Overland Park.
All these products and services would not be purchased in Overland Park as the city is just a small part of
the overall Kansas City metropolitan area. Some shopping would occur in other parts of Johnson County,
while other goods and services might be purchased from providers in other parts of the country or even
19 Data from City and Town Intercensal Datasets: 2000-2010, US Department of Commerce, Bureau of the Census, at:
https://www.census.gov/data/datasets/time-series/demo/popest/intercensal-2000-2010-cities-and-towns.html and City
and Town Population Totals: 2010-2019, US Department of Commerce, Bureau of the Census, at: https://www.census.gov/data/datasets/time-series/demo/popest/2010s-total-cities-and-towns.html
20 QuickFacts: Overland Park city, Kansas, US Department of Commerce, Bureau of the Census, at: https://www.census.gov/quickfacts/fact/table/overlandparkcitykansas/PST045219. 2015-2019 Average.
150,000
160,000
170,000
180,000
190,000
200,000
210,000
1995 2000 2005 2010 2015 2020
Po
pu
lati
on
Pre-Ban Trend
Post-Ban Trend
9
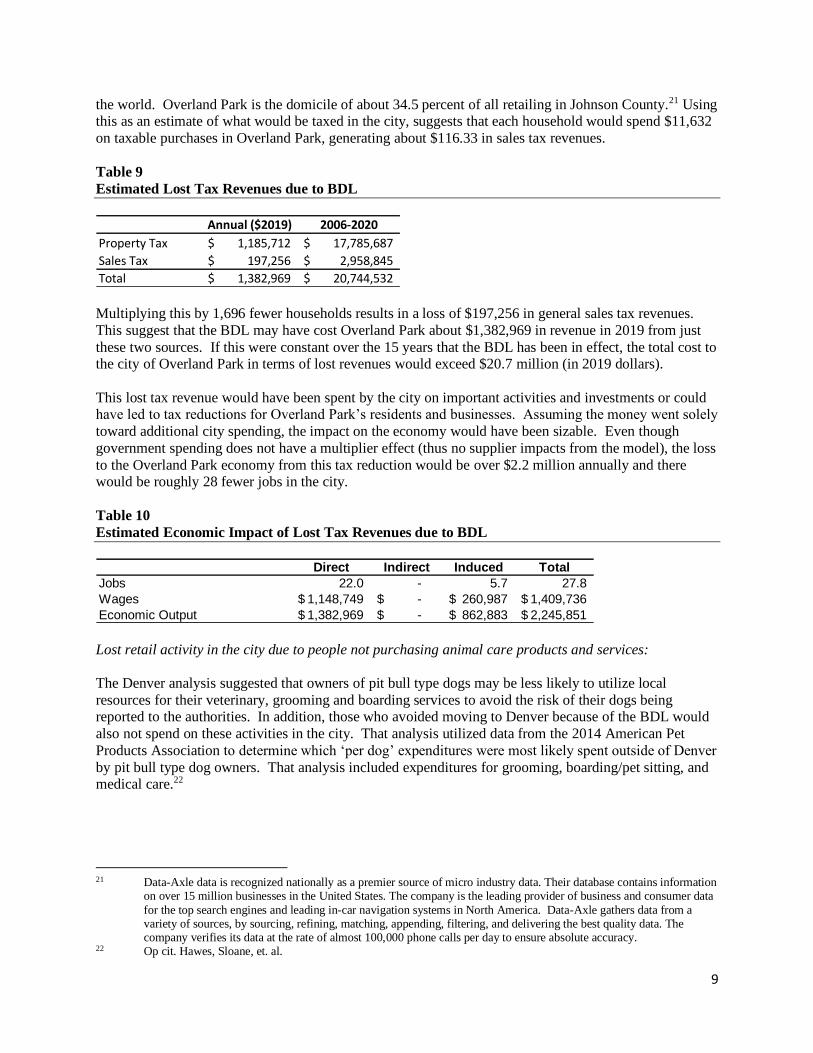
the world. Overland Park is the domicile of about 34.5 percent of all retailing in Johnson County.21 Using this as an estimate of what would be taxed in the city, suggests that each household would spend $11,632
on taxable purchases in Overland Park, generating about $116.33 in sales tax revenues.
Table 9
Estimated Lost Tax Revenues due to BDL
Multiplying this by 1,696 fewer households results in a loss of $197,256 in general sales tax revenues.
This suggest that the BDL may have cost Overland Park about $1,382,969 in revenue in 2019 from just
these two sources. If this were constant over the 15 years that the BDL has been in effect, the total cost to the city of Overland Park in terms of lost revenues would exceed $20.7 million (in 2019 dollars).
This lost tax revenue would have been spent by the city on important activities and investments or could have led to tax reductions for Overland Park’s residents and businesses. Assuming the money went solely
toward additional city spending, the impact on the economy would have been sizable. Even though
government spending does not have a multiplier effect (thus no supplier impacts from the model), the loss
to the Overland Park economy from this tax reduction would be over $2.2 million annually and there would be roughly 28 fewer jobs in the city.
Table 10
Estimated Economic Impact of Lost Tax Revenues due to BDL
Lost retail activity in the city due to people not purchasing animal care products and services:
The Denver analysis suggested that owners of pit bull type dogs may be less likely to utilize local
resources for their veterinary, grooming and boarding services to avoid the risk of their dogs being reported to the authorities. In addition, those who avoided moving to Denver because of the BDL would
also not spend on these activities in the city. That analysis utilized data from the 2014 American Pet
Products Association to determine which ‘per dog’ expenditures were most likely spent outside of Denver
by pit bull type dog owners. That analysis included expenditures for grooming, boarding/pet sitting, and medical care.22
21 Data-Axle data is recognized nationally as a premier source of micro industry data. Their database contains information
on over 15 million businesses in the United States. The company is the leading provider of business and consumer data
for the top search engines and leading in-car navigation systems in North America. Data-Axle gathers data from a variety of sources, by sourcing, refining, matching, appending, filtering, and delivering the best quality data. The company verifies its data at the rate of almost 100,000 phone calls per day to ensure absolute accuracy.
22 Op cit. Hawes, Sloane, et. al.
Annual ($2019) 2006-2020
Property Tax 1,185,712$ 17,785,687$
Sales Tax 197,256$ 2,958,845$
Total 1,382,969$ 20,744,532$
Direct Indirect Induced Total
Jobs 22.0 - 5.7 27.8
Wages 1,148,749$ -$ 260,987$ 1,409,736$
Economic Output 1,382,969$ -$ 862,883$ 2,245,851$
10
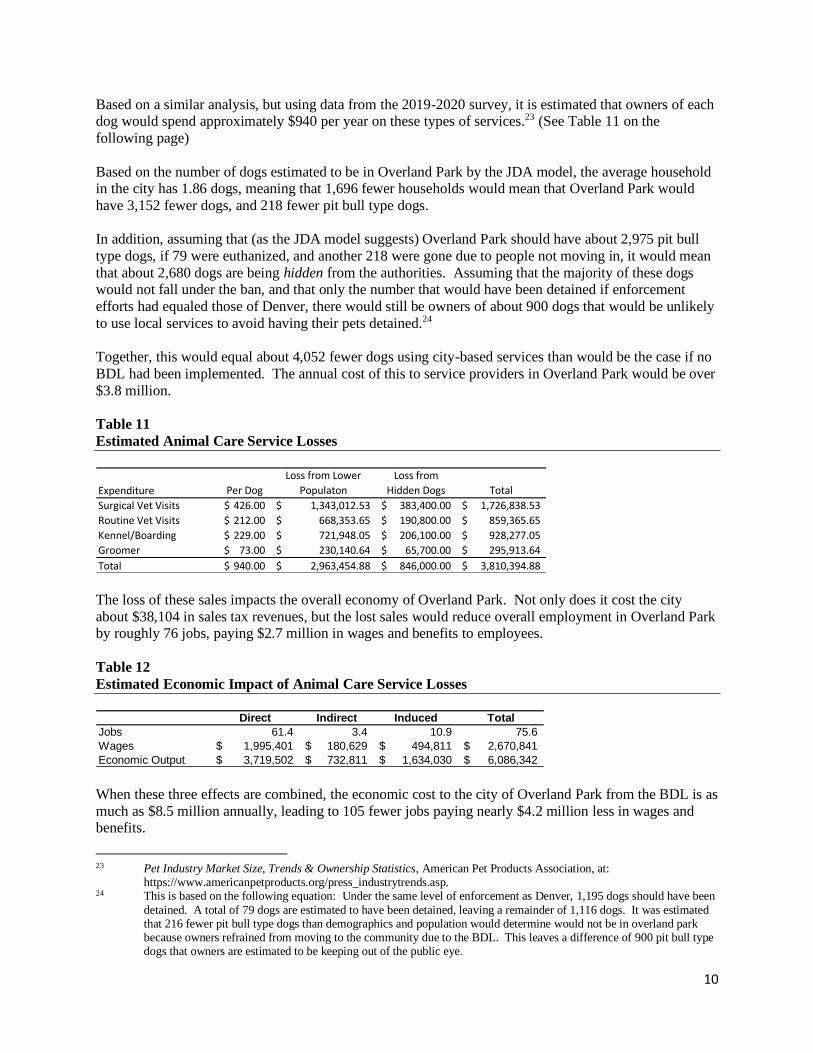
Based on a similar analysis, but using data from the 2019-2020 survey, it is estimated that owners of each dog would spend approximately $940 per year on these types of services.23 (See Table 11 on the
following page)
Based on the number of dogs estimated to be in Overland Park by the JDA model, the average household in the city has 1.86 dogs, meaning that 1,696 fewer households would mean that Overland Park would
have 3,152 fewer dogs, and 218 fewer pit bull type dogs.
In addition, assuming that (as the JDA model suggests) Overland Park should have about 2,975 pit bull
type dogs, if 79 were euthanized, and another 218 were gone due to people not moving in, it would mean
that about 2,680 dogs are being hidden from the authorities. Assuming that the majority of these dogs would not fall under the ban, and that only the number that would have been detained if enforcement
efforts had equaled those of Denver, there would still be owners of about 900 dogs that would be unlikely
to use local services to avoid having their pets detained.24
Together, this would equal about 4,052 fewer dogs using city-based services than would be the case if no
BDL had been implemented. The annual cost of this to service providers in Overland Park would be over
$3.8 million.
Table 11
Estimated Animal Care Service Losses
The loss of these sales impacts the overall economy of Overland Park. Not only does it cost the city
about $38,104 in sales tax revenues, but the lost sales would reduce overall employment in Overland Park by roughly 76 jobs, paying $2.7 million in wages and benefits to employees.
Table 12
Estimated Economic Impact of Animal Care Service Losses
When these three effects are combined, the economic cost to the city of Overland Park from the BDL is as
much as $8.5 million annually, leading to 105 fewer jobs paying nearly $4.2 million less in wages and benefits.
23 Pet Industry Market Size, Trends & Ownership Statistics, American Pet Products Association, at:
https://www.americanpetproducts.org/press_industrytrends.asp. 24 This is based on the following equation: Under the same level of enforcement as Denver, 1,195 dogs should have been
detained. A total of 79 dogs are estimated to have been detained, leaving a remainder of 1,116 dogs. It was estimated that 216 fewer pit bull type dogs than demographics and population would determine would not be in overland park because owners refrained from moving to the community due to the BDL. This leaves a difference of 900 pit bull type dogs that owners are estimated to be keeping out of the public eye.
Expenditure Per Dog
Loss from Lower
Populaton
Loss from
Hidden Dogs Total
Surgical Vet Visits 426.00$ 1,343,012.53$ 383,400.00$ 1,726,838.53$
Routine Vet Visits 212.00$ 668,353.65$ 190,800.00$ 859,365.65$
Kennel/Boarding 229.00$ 721,948.05$ 206,100.00$ 928,277.05$
Groomer 73.00$ 230,140.64$ 65,700.00$ 295,913.64$
Total 940.00$ 2,963,454.88$ 846,000.00$ 3,810,394.88$
Direct Indirect Induced Total
Jobs 61.4 3.4 10.9 75.6
Wages 1,995,401$ 180,629$ 494,811$ 2,670,841$
Economic Output 3,719,502$ 732,811$ 1,634,030$ 6,086,342$
11
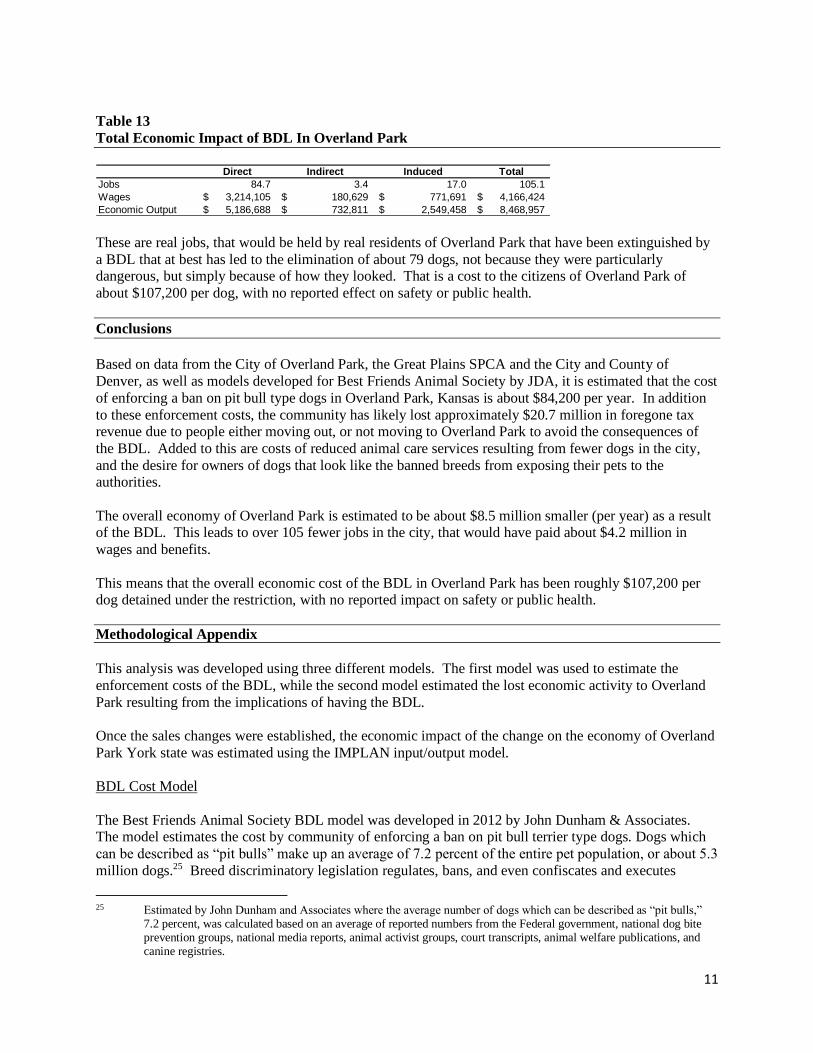
Table 13
Total Economic Impact of BDL In Overland Park
These are real jobs, that would be held by real residents of Overland Park that have been extinguished by
a BDL that at best has led to the elimination of about 79 dogs, not because they were particularly dangerous, but simply because of how they looked. That is a cost to the citizens of Overland Park of
about $107,200 per dog, with no reported effect on safety or public health.
Conclusions
Based on data from the City of Overland Park, the Great Plains SPCA and the City and County of
Denver, as well as models developed for Best Friends Animal Society by JDA, it is estimated that the cost
of enforcing a ban on pit bull type dogs in Overland Park, Kansas is about $84,200 per year. In addition
to these enforcement costs, the community has likely lost approximately $20.7 million in foregone tax revenue due to people either moving out, or not moving to Overland Park to avoid the consequences of
the BDL. Added to this are costs of reduced animal care services resulting from fewer dogs in the city,
and the desire for owners of dogs that look like the banned breeds from exposing their pets to the authorities.
The overall economy of Overland Park is estimated to be about $8.5 million smaller (per year) as a result of the BDL. This leads to over 105 fewer jobs in the city, that would have paid about $4.2 million in
wages and benefits.
This means that the overall economic cost of the BDL in Overland Park has been roughly $107,200 per dog detained under the restriction, with no reported impact on safety or public health.
Methodological Appendix
This analysis was developed using three different models. The first model was used to estimate the
enforcement costs of the BDL, while the second model estimated the lost economic activity to Overland
Park resulting from the implications of having the BDL.
Once the sales changes were established, the economic impact of the change on the economy of Overland
Park York state was estimated using the IMPLAN input/output model.
BDL Cost Model
The Best Friends Animal Society BDL model was developed in 2012 by John Dunham & Associates. The model estimates the cost by community of enforcing a ban on pit bull terrier type dogs. Dogs which
can be described as “pit bulls” make up an average of 7.2 percent of the entire pet population, or about 5.3
million dogs.25 Breed discriminatory legislation regulates, bans, and even confiscates and executes
25 Estimated by John Dunham and Associates where the average number of dogs which can be described as “pit bulls,”
7.2 percent, was calculated based on an average of reported numbers from the Federal government, national dog bite prevention groups, national media reports, animal activist groups, court transcripts, animal welfare publications, and canine registries.
Direct Indirect Induced Total
Jobs 84.7 3.4 17.0 105.1
Wages 3,214,105$ 180,629$ 771,691$ 4,166,424$
Economic Output 5,186,688$ 732,811$ 2,549,458$ 8,468,957$

12
certain pets based solely on their appearance or lineage and regardless of the pets’ individual behavior or temperament. In this case, the pets usually include the pure breeds (American Pit Bull Terrier, American
Staffordshire Terrier, and Staffordshire Bull Terrier), as well as any short haired muscular, mixed breed
dog.26
In addition to being disruptive and particularly ineffective in achieving their goals, breed discriminatory
laws can be costly. Cities that enact canine profiling provisions often have the legal burden of proving the
heritage of the dog.27 This could not only exhaust the limited resources of the already underfunded animal control programs by redirecting funding to seizing pets and flooding shelters with potentially
“unadoptable” dogs because of the breed designation; it could cost individual communities millions of
dollars while failing to enhance public safety.28 The costs of enforcing breed discriminatory legislation include but are not limited to:
• Animal control and enforcement costs,
• Expenses for kenneling and veterinary care,
• Expenses related to euthanasia and carcass disposal,
• Litigation costs from residents appealing or contesting the law, and
• DNA testing costs.
Additional costs depending on current resources available to a specific community’s animal control
program may include:
• Additional shelter veterinarians,
• Increased enforcement staffing, and
• Capital costs associated with increased shelter space needed.
The Best Friends Animal Society Dog Population and Breed Discriminatory Legislation Model first
estimates the number of dogs in a given community.29 Using the average proportion of pit bull terrier type
26 Some localities have made these definitions so broad as to include nearly every pet dog. For example, according to the
Miami code, the term pit bull dog refers “to any dog which exhibits those distinguishing characteristics which: Substantially conform to the standards established by the American Kennel Club for American Staffordshire Terriers or Staffordshire Bull Terriers; or substantially conform to the standards established by the United Kennel Club for
American Pit Bull Terriers.” However, the code goes on to state that deficiencies in the dogs' conformance to these standards shall not be construed to indicate that the subject dog is not a "pit bull dog.” In fact, the testimony by any veterinarian, zoologist, animal behaviorist, or animal control officer that a particular dog exhibits distinguishing physical characteristics of a pit bull is enough to ban any dog from entering the County. See: Miami-Dade County Florida Code of Ordinances Section 5-17-5.
27 City of Pierre v. Blackwell, 635 N.W. 2d 581, 586 (S.D. 2001). 28 The United Kingdom banned “pit bulls” in 1991. Klaassen (1996) examined the U.K.’s Dangerous Dog Act and
concluded that the ban had no effect on stopping dog attacks. The study examined incidents seen at one urban accident
and emergency department before the implementation of the act and again two years later. See: Klaassen, B, Does the Dangerous Dog Act Protect Against Animal Attacks: A Prospective Study of Mammalian Bites in the Accident and Emergency Department, Injury, March 1996. A more recent study compared dog bites reported to the public-health department of Aragon, Spain, for the five-year period before the implementation of the city’s Dangerous Dog Act in 1999 and the five-year period after. Rosado, Belén et al., Spanish: Dangerous Animals Act: Effect of the Epidemiology of Dog Bites, Journal of Veterinary Behavior, September 2007. The allegedly dangerous breeds accounted for 2.4 percent of the dog bites before the breed-discriminatory law was introduced and 3.5 percent of the dog bites after the law was implemented. The authors state that the “results suggest that BSL was fundamentally flawed … [and] not
effective in protecting people from dog bites in a significant manner.”
29 The number of licensed dogs is but a small percentage of the actual dog population. The absence of a central dog registry or census has made it impossible to determine exact number of dogs in a given location, let alone the number of dogs affected by a breed discriminating legislation.
13
dogs to total dogs, an estimate of the number of dogs affected by the breed discriminatory legislation can be determined. 30
The model utilizes non-linear programming to determine the number of dogs in a geographical area using
demographic data about the population (number of households, population, area, structural type of housing, gender, poverty rate, ethnicity, and married rate).
Non-linear programming is the process of solving a system of constraints over a set of unknown real variables, while maximizing or minimizing an objective function. In this case, the model uses
demographic data on the population of a certain location and data points found on specific cities, counties,
and states to solve for the population of dogs in that given geographical area.31
In the case of this model demographic data on the population is based on Census Bureau statistics.32 Data
points for the non-linear programming model were collected from the Federal government, national dog
bite prevention groups, national media reports, animal activist groups, court transcripts, animal welfare publications, and canine registries. Data collected on the proportion of dogs which can be described as pit
bulls to total number of dogs ranged from 2 percent up to 9.7 percent. An average of these figures is
found to be 7.2 percent.
Once the total dog population estimates have been established, they are entered into a model linked to
data about the average number of dogs which can be described as “pit bulls” in the total dog population in that location.
Once the number of dogs in a given location has been calculated, those impacted by the BDL can be
estimated using the national averages obtained as part of this analysis. An average was calculated from the data collected on the proportion of dogs which might be described as “pit bulls” from citywide and
nationwide figures culled from research by national dog bite prevention groups, national media reports,
animal activist groups, court transcripts, animal welfare publications, and canine registries.
Not every dog captured will be euthanized as some are able to be released after litigation and appeals
based on a variety of reasons. Some dog owners will be able to save their dogs by agreeing to move out of
the jurisdiction, and some dogs will be rescued by animal rescue groups. An estimate of the number of dogs that are euthanized is calculated based on averages for reporting jurisdictions.
Once the number of pets impacted by the breed discriminatory legislation is calculated, costs to implement canine profiling can be determined. Costs were broken down into five categories:
• Enforcement costs were based on animal control costs of over 2,800 law enforcement agencies
across the United States.33
• Kenneling and veterinary costs were based on average national costs which were indexed by price for every state according to government costs reported by Census.34
30 John Dunham and Associates calculations, 2012. For this analysis the number of dogs considered to be “pit bulls” is
equal to 7.2 percent of total dog population. 31 Data collected on dog population from the following locations: New York, NY; Boulder County, CO; Philadelphia,
PA; Portland, OR; Missoula, MT; San Francisco, CA; Los Angeles, CA; Colorado Springs, CO; Chicago, IL; Pierce County, WA; Snohomish County, WA; Kitsap, WA; Tacoma, WA.
32 U.S. Census Bureau 2010 American Community Survey 33 U.S. Dept. of Justice, Bureau of Justice Statistics. Law Enforcement Management And Administrative Statistics
(Lemas): 2003 Sample Survey Of Law Enforcement Agencies, Computer data file:ICPSR04411-v1. Washington, DC: U.S. Dept. of Commerce, Bureau of the Census, 2006. These are the most recent data of this type available.
34 Data on the number of dogs captured in areas where breed discriminating laws were being enforced averaged 5.87% of the total population of dogs that can be described as pit bulls each year. Average national costs for kenneling were

14
• Euthanasia and disposal costs were based on the number of dogs which can be described as pit
bulls that are eventually euthanized under the breed discriminatory law and the average national cost of euthanasia, again indexed by price for every state.35
• Possible litigation were calculated from average per capita court costs across states and fitted to
data found on previous cases where breed discriminatory legislation was challenged.
• DNA testing costs were calculated using the average price for the DNA tests and the number of
confiscated pit bull type dogs to be euthanized.36
Economic Impact Model
The costs of the BDL in Overland Park were converted to economic impact figures using the IMPLAN Input/Output model.37 The model adopts an accounting framework through which the relationships
between different inputs and outputs across industries and sectors are computed. This model can show the
impact of a given economic decision – such as a retailer opening– on a pre-defined, geographic region. It is based on the national income accounts generated by the US Department of Commerce, Bureau of
Economic Analysis (BEA).38
The IMPLAN model is designed to run based on the input of specific direct economic factors. It uses a detailed methodology (see IMPLAN Methodology section) to generate estimates of the other direct
impacts, tax impacts and supplier and induced impacts based on these entries. In the case of this model,
estimated costs of enforcement, lost tax revenues and lost pet care sales in Overland Park is the starting point for the analysis.
Once the changes in sales have been established, they are entered into a model linked to the IMPLAN database. The IMPLAN data are used to generate estimates of employment direct wages and output.
Wages are derived from the U.S. Department of Labor’s ES-202 reports. IMPLAN uses this data to
provide annual average wage and salary establishment counts, employment counts, and payrolls at the
county level. Since this data only covers payroll employees, it is modified to add information on independent workers, agricultural employees, construction workers, and certain government employees.
Data are then adjusted to account for counties where non-disclosure rules apply. Wage data include not
only cash wages, but health and life insurance payments, retirement payments and other non-cash compensation. In short, it includes all income paid to workers by employers.
Total output is the value of production by industry in a given state. It is estimated by IMPLAN from
sources similar to those used by the Bureau of Economic Analysis (BEA) in its RIMS II series. Where no Census or government surveys are available, IMPLAN uses models such as the Bureau of Labor
Statistics’ growth model to estimate the missing output.
found to be about 15 dollars per day, for an average of 16 days. This cost was then indexed by price across states using data on direct expenditure from U.S. Census Bureau State and Local Government Finances: 2009. On-line at: http://www.census.gov/govs/estimate/
35 Average proportions of dogs that are euthanized and cost of euthanasia are calculated to be about $40 per dog and about 72 percent of dogs captured were euthanized. The average cost is then indexed by price using data on direct expenditure from U.S. Census Bureau State and Local Government Finances: 2009.
36 Average costs for DNA testing, $120, were obtained from Best Friends and applied to the number of dogs to be euthanized. Litigation costs were based on data obtained from court appeals in locations where breed discriminating legislation was challenged. Average per capita costs were calculated from these locations and using judicial and legal expenditure figures from U.S. Census Bureau State and Local Government Finances: 2009, indexed by price across states.
37 The model uses 2018 input/output accounts. 38 The IMPLAN model is based on a series of national input-output accounts known as RIMS II. These data are
developed and maintained by the U.S. Department of Commerce, Bureau of Economic Analysis as a policy and economic decision analysis tool.
15
IMPLAN Methodology39
Input-output analysis, for which Wassily Leontief received the 1973 Nobel Prize in Economics for, is an
econometric technique used to examine the relationships within an economy. It captures all monetary market transactions for consumption in a given period and for a specific geography. The IMPLAN model
uses data from many different sources – as published government data series, unpublished data, sets of
relationships, ratios, or as estimates. IMPLAN gathers this data, converts them into a consistent format,
and estimates the missing components.
There are three different levels of data generally available in the United States: federal, state, and county.
Most of the detailed data are available at the county level, but there are many issues with disclosure, especially in the case of smaller industries. IMPLAN overcomes these disclosure problems by combining
a large number of datasets and estimating variables that are not found in the merged data. The data are
then converted into national input-output matrices (Use, Make, By-products, Absorption, and Market Shares) as well as national tables for deflators, regional purchase coefficients, and margins.
The IMPLAN Make matrix represents the production of commodities by industry. The Bureau of
Economic Analysis (BEA) Benchmark I/O Study of the US Make Table forms the bases of the IMPLAN model. The Benchmark Make Table is updated to current year prices and rearranged into the IMPLAN
sector format. The IMPLAN Use matrix is based on estimates of final demand, value-added by sector,
and total industry and commodity output data as provided by government statistics or estimated by IMPLAN. The BEA Benchmark Use table is then bridged to the IMPLAN sectors. Once the re-sectoring
is complete, the Use tables can be updated based on the other data and model calculations of interstate
and international trade.
In the IMPLAN model, as with any input-output framework, all expenditures are in terms of producer
prices. This allocates all expenditures to the industries that produce goods and services. As a result, all
data not received in producer prices are converted using margins derived from the BEA Input-Output model. Margins represent the difference between producer and consumer prices. As such, the margins for
any good add up to one.
Deflators, which account for relative price changes during different time periods, are derived from the
Bureau of Labor Statistics (BLS) Growth Model. The 224 sector BLS model is mapped to the 544 sectors
of the IMPLAN model. Where data are missing, deflators from BEA’s Survey of Current Businesses are
used.
Finally, the Regional Purchase Coefficients (RPCs) – essential to the IMPLAN model – must be derived.
IMPLAN is derived from a national model, which represents the “average” condition for a particular industry. Since national production functions do not necessarily represent particular regional differences,
adjustments need to be made. Regional trade flows are estimated based on the Multi-Regional Input-
Output Accounts, a cross-sectional database with consistent cross interstate trade flows developed in 1977. These data are updated and bridged to the 544 sector IMPLAN model.
Once the databases and matrices are created, they go through an extensive validation process. IMPLAN
builds separate state and county models and evaluates them, checking to ensure that no ratios are outside of recognized bounds. The final datasets and matrices are not released until extensive testing takes place.
39 This section is paraphrased from IMPLAN Professional: Users Guide, Analysis Guide, Data Guide, Version 2.0, MIG,
Inc., June 2000.
16
About John Dunham & Associates
John Dunham & Associates (JDA) is a leading economic consulting firm specializing in the economics of
fast-moving issues. JDA is an expert at translating complex economic concepts into clear, easily
understandable messages that can be transmitted to any audience. Our company’s clients have included a wide variety of businesses and organizations, including some of the largest Fortune 500 companies in
America, such as:
• Altria
• Diageo
• Feld Entertainment
• Forbes Media
• MillerCoors
• Verizon
• Wegmans Stores
John Dunham is a professional economist with over 35 years of experience. He holds a Master of Arts
degree in Economics from the New School for Social Research as well as an MBA from Columbia
University. He also has a professional certificate in Logistics from New York University. Mr. Dunham has worked as a manager and an analyst in both the public and private sectors. He has experience in
conducting cost-benefit modeling, industry analysis, transportation analysis, economic research, and tax
and fiscal analysis. As the Chief Domestic Economist for Philip Morris, he developed tax analysis programs, increased cost-center productivity, and created economic research operations. He has presented
testimony on economic and technical issues in federal court and before federal and state agencies.
Prior to Phillip Morris John was an economist with the Port Authority of New York and New Jersey as
well as for the City of New York.