the fiscal dominance through banking system: a case study
TRANSCRIPT

Iran. Econ. Rev. Vol. 24, No. 3, 2020. pp. 853-883
The Fiscal Dominance through Banking System:
A Case Study on the Relationship between Government
and Banking System in Iran’s Economy1
Ali Taiebnia2, Mohsen Mehrara3, Seyed Hamid Pourmohammad Gelsefidi*4
Received: 2019, December 25 Accepted: 2020, March 22
Abstract ran's economy still has a two-digit inflation rate with high fluctuations, which is mainly caused by fiscal dominance. According
to the relevant literature, the most important fiscal dominance mechanism is borrowing from the central bank. After prohibiting direct borrowing from the Central Bank by Iran's government, the budget deficits are partially addressed by off-budgeting operations, achieved from the banking system. In addition to introducing the Off-budgeting mechanism of fiscal dominance through the banking system, this study aimed to detect whether fiscal dominance in Iran was the result of the government’s borrowing from the banks and consequently, its indirect borrowing from the Central Bank. The bank ledgers data from March 2007 to June 2018 was used in this study, and it was revealed that an increase in the government’s debts to the banks had a significant positive effect on the banks’ debt to the Central Bank; the effect is more highlighted in specialized and privatized banks, respectively. This finding is robust when the banks’ balance sheet status, banking health status, and macroeconomic status have controlled. Keywords: Budget Deficit, Off-budget Operations, Banking System, Fiscal Dominance, Money Supply. JEL Classification: E62, H62, G21, E51.
1. Introduction
The high inflation rate is one of the fundamental problems in Iran’s
economy. Inflation makes the poor poorer, increases inequality,
causes fluctuations and uncertainties in the economy, and
1. This paper is extracted from Hamid Pourmohammad Gelsefidi's Ph.D. thesis at Kish International Campus, University of Tehran. 2. Faculty of Economics, University of Tehran, Tehran, Iran ([email protected]). 3. Faculty of Economics, University of Tehran, Tehran, Iran ([email protected]). 4. Department of Economics, Kish International Campus, University of Tehran, Kish, Iran (Corresponding Author: [email protected]).
I

854/ The Fiscal Dominance through Banking System: …
consequently decreases investments by the private sector. Even
though most countries have overcome the inflation phenomenon,
unfortunately, Iran’s economy has a two-digit inflation rate with high
fluctuations.
The monetary authority, central banker, plays a critical role in
controlling inflation. Regarding the type of inflation, Central Bank can
choose to conduct active or passive monetary policy operations. In an
active monetary policy, the fiscal policy and monetary policy are
assumed to be independent of each other, and the Central Bank can
choose an inflation target and use the tools in hand. In a passive
monetary policy, however, monetary policy is considered to have a
close relationship with fiscal policy, and they are interconnected by
the budget deficit. In this regard, fiscal dominance, which is the focus
of this paper, appears. By definition, “fiscal dominance refers to a
situation under which the fiscal authorities do not commit to balancing
expenditure and revenues, so the monetary authorities will be forced
to balance government revenues and expenditure. Accordingly,
“monetary policy must adjust to deliver the level of seigniorage
required to balance the government’s budget” (Walsh, 2010). In other
words, monetary authority by using different means has to finance the
budget deficit of the government.
According to the relevant literature, the most important fiscal
dominance mechanism is to finance budget deficits by the Central
Bank. The Central Bank finances budget deficits in two ways: (1)
government’s direct borrowing from the Central Bank, and (2) the
Central Bank’s intervention in the official debt market to purchase
government-issued bonds via open-market operations.
For many years, fiscal dominance has been a concern in developing
countries with governments having low budget disciplines and
continuous budget deficits, which would finally get monetized and
financed by the Central Bank resources. Some examples of studies
addressing this issue are Gardea et al. (2012) in Argentina, Blanchard
(2004) in Brazil, Ersel and Özatay (2008) in Turkey, and Fratianni and
Spinelli (2001) in Italy. In this regard, numerous studies have shown
how fiscal dominance in these countries has led to inflation and
decreased rates of trade, consumption, and production and has finally
challenged political stability in these countries.

Iran. Econ. Rev. Vol. 24, No. 3, 2020 /855
However, fiscal dominance is not restricted to the developing
countries and is a more complex phenomenon in developed
economies, as these countries have access to developed financial
markets and their governments can issue securities with various
maturities and finance deficits using non-monetary means. In these
countries, the main point of concern about fiscal dominance is not
abolishing debt by creating inflation but raising uncertainty about the
long term interest rate of the government debts. In these countries, the
Central Bank’s policies cannot be independent of the fiscal policy
when the Central Bank’s balance sheet expands. Issuing debts by the
government has turned it to the largest issuer of debt securities and
demander of funds, and at the same time, it has turned the Central
Bank into the largest buyer of the debt securities and supplier of
funds. Under the shadow of the high ratio of debts to GDP, the
interrelationship between the monetary policy, fiscal policy, and debt
management would be of high importance, necessitating a high level
of cooperation and a mutual understanding among the entities in
charge (Blommestein, 2011).
Additionally, in countries with vast natural resources, another
means that may lead to fiscal dominance is the foreign-currency
income, which emerges as the Central Bank exchanges the
government’s natural resources; as such the Central Bank’s exchange
rate is affected by the government’s actions. Such countries usually
prefer to follow a fixed exchange rate regime so that they usually have
to deal with fiscal dominance and inflation is thus a major problem in
these countries. The inflation resulting from fiscal dominance and
fixed exchange rate regimes make these countries adopt procyclical
fiscal policies. Elbadawi et al. (2017) explain that the mere fact of
having a resource-dependent income does not lead to achieving
procyclical fiscal policies. In other words, structures and rules set in
the economy may maintain countercyclical conditions (e.g. Norway).
In Iran's economy, more than 70 percent of the government's
expenditure is financed by foreign currency income and money
creation, thereby leading to lower levels of production and jobs versus
higher inflation rates (Tavakolian, 2015). In such a situation, there is
another means for changes in the monetary base, i.e. changing the
foreign assets of the Central Bank. Thus, the standard way of fiscal
856/ The Fiscal Dominance through Banking System: …
dominance determination, that is the significance of the relationship
between the government debt and monetary base, cannot be clearly
defined; however, the adoption of other indicators has proved the
existence fiscal dominance in Iran's economy during the years after
the Revolution (Asgharpour et al., 2016).
In Iran, due to poor development of domestic financial markets, the
lack of an effective taxation system, and the existence of limitations
on borrowing from foreign countries, the government’s budget is often
financed by selling the foreign currency of oil exports to the Central
Bank of Iran (oil dominance) or borrowing from the CBI (fiscal
dominance). Both methods increase the monetary base, and thus,
increasing the inflation rate. Consequently, the share of seigniorage in
the government’s finances increases. Additionally, due to the current
structural weaknesses, another means of financing the government’s
budget deficits is borrowing from the banks, which is restricted to Iran
in terms of scale and quality and also leads to a shift in the banks’ debt
to the CBI (fiscal dominance). Accordingly, in addition to the direct
dominance of fiscal policy over the monetary base, there is also an
indirect dominance through the banking system.
Fiscal dominance in Iran has disabled the CBI to use monetary
tools in reaching the inflation target, which makes the monetary policy
undisciplined, and leads to the procyclical fiscal policy. It can be
concluded that an expansionary fiscal policy financed by debts to the
CBI leads to a business cycle in the real economy as well as an
increase in the inflation rate (Zamanzadeh et al., 2013).
This study aimed to explain the off-budget mechanisms of fiscal
dominance and detect whether fiscal dominance is the result of
borrowing from the banks and consequently indirect borrowing from
the Central Bank. The mechanisms of fiscal dominance through the
banking system are discussed in the second section of this paper. The
third section describes the adopted dataset and introduces the
variables. In the fourth section, the model specifications are presented.
The estimation results of the model are reported in Section 5, and the
study is concluded in the sixth section.
2. Fiscal Dominance Mechanisms through Banking System
This section classifies fiscal dominance mechanisms in Iran into two

Iran. Econ. Rev. Vol. 24, No. 3, 2020 /857
categories of conventional mechanisms and off-budgeting
mechanisms, while the institutional constructs of the country are also
considered.
Figure 1 presents four fiscal dominance channels, which are
discussed in the literature and appear to be active in Iran’s economy.
1. Increasing the government’s direct debt to the Central Bank,
2. Increasing the government’s debt to the Central Bank by loans
received from banks,
3. Increasing net foreign asset of the CBI by oil foreign currency
revenue,
4. Increasing net foreign assets of the CBI by exchanging the
foreign currency of the National Development Fund (NDF).
Only the first two channels that are activated by the banking system
are analyzed in this study.
Figure 1: Fiscal Dominance Mechanisms in Iran
2.1 Conventional Fiscal Dominance Mechanisms: Direct Borrowing
from the Central Bank
Central Bank:
Net Claims on
Government
Government Fiscal
Operation
Government
debt to banking
system
Central Bank:
Claims on
other
Depository Corporations
Monetary
Base
Budget Deficit
Purchasing government bonds by
the Central Bank
Withdrawing
from NDF
Central Bank:
Net Foreign
Assets
Sales of oil revenue's
currency to the
Central Bank
Central Bank: Net Domestic
Assets
858/ The Fiscal Dominance through Banking System: …
One of the conventional fiscal dominance mechanisms is direct
government borrowing from the Central Bank, which was of concern
for many years in developing countries and would eventually finance
their continuous budget deficits by the monetary base. If direct
borrowing from the Central Bank becomes coupled with worsening
production capacity in the economy, it leads to hyperinflation. As the
most recent example, this happened in Zimbabwe during 2008-2009.
For this reason, most countries have banned direct government
borrowing from the Central Bank. For example, this prohibition is
expressed in the Maastricht Treaty which is the foundation of the
European Union’s fiscal management. In Iran, this technique to
finance budget deficit was possible until the enactment of the Third
Development Plan; however, according to Article 69 of this Act, it is
prohibited and currently has no legal basis.
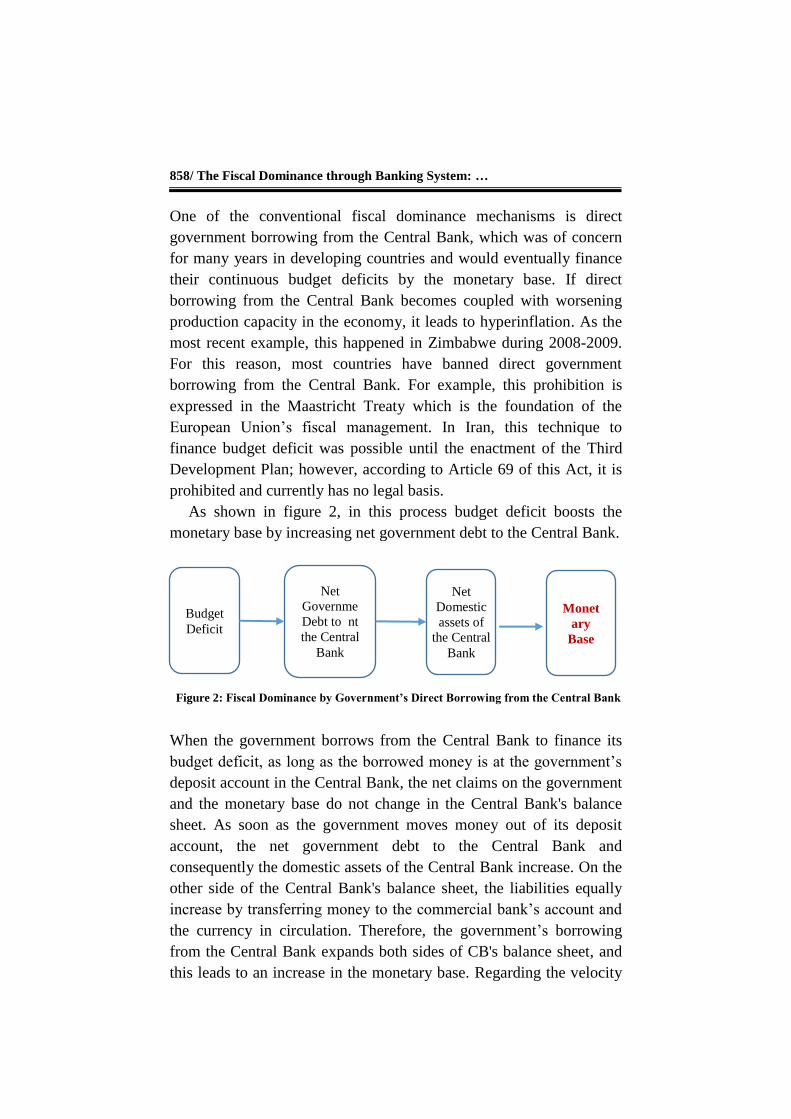
As shown in figure 2, in this process budget deficit boosts the
monetary base by increasing net government debt to the Central Bank.
When the government borrows from the Central Bank to finance its
budget deficit, as long as the borrowed money is at the government’s
deposit account in the Central Bank, the net claims on the government
and the monetary base do not change in the Central Bank's balance
sheet. As soon as the government moves money out of its deposit
account, the net government debt to the Central Bank and
consequently the domestic assets of the Central Bank increase. On the
other side of the Central Bank's balance sheet, the liabilities equally
increase by transferring money to the commercial bank’s account and
the currency in circulation. Therefore, the government’s borrowing
from the Central Bank expands both sides of CB's balance sheet, and
this leads to an increase in the monetary base. Regarding the velocity
Figure 2: Fiscal Dominance by Government’s Direct Borrowing from the Central Bank
Net Governme
nt Debt to
the Central
Bank
Monet
ary
Base
Net
Domestic
assets of
the Central
Bank
Budget
Deficit
Iran. Econ. Rev. Vol. 24, No. 3, 2020 /859
of money, it would also lead to an increase in broad money and
eventually increase the total demand and price levels.
2.2. Off-budgeting Fiscal Dominance: Creating Debt to the Banking
System
Given the lack of sufficient and sustainable resources, the government
annually finances some part of its budget deficit by off-budget means.
In reality, the lack of sufficient and sustainable resources has made
some part of the government expenditures to be financed from off-
budget resources. This method of financing from unsustainable
resources of other entities causes fiscal dominance and is finally
reflected in the Central Bank’s balance sheet. Government's off-
budget operations are emanating from sovereign duties, the acts of
parliament, and government policies which are not reflected in the
annual budget Tables but financed by debt. In other words, if the
reported budget deficit and the increase in debt are not equal in a
fiscal year, the difference would be equal to the government’s off-
budget fiscal operations (Irwin, 2015). Implementing off-budget
operations would result in government liabilities to an entity beyond
the government’s budget. Off-budget operations may not appear in the
budget annual reports; however, they would finalize these debts and
make the government refund since they are reflected in the lenders’
audited financial statements as the government’s debts.

860/ The Fiscal Dominance through Banking System: …
Figure 3: Fiscal Dominance through the Banking System
The government’s main off-budget operation in Iran is to borrow
from the banking system (excluding CBI). Some parts of the
government’s subsidizing policies, which are approved in the
parliament or the executive instructions passed by the cabinet, the
Economic Council, or the Money and Credit Council, are annually
financed by the banking resources. Furthermore, sometimes
imbalances in the government’s cash flow for some inevitable
expenditure forces the government to borrow from the banks. High
levels of government commitments and insufficiency of resources
usually disable the government to pay back the facilities it has
borrowed upon its maturity.
In addition to the facilities that the government directly receives
Monetary Base
Net Domestic Assets of
the Central Bank
Budget Deficit
Net Claims on Government in the banking system
Granted facilities
backed by the government’s guarantee to private and
public entities and SOEs
Government bonds and
facilities to the government
Paying one-twelfth of
estimated taxes and
government dividends by state-owned banks each
month
SOEs bonds backed by the government’s
guarantee
Iran. Econ. Rev. Vol. 24, No. 3, 2020 /861
from the banking system, some of the state-owned enterprises (SOEs)
and legal or personal entities and contractors (in line with article 56 of
the Law on the Administration of Certain Financial Regulations of the
Government, 2005) borrow from the banking system backed by the
government’s guarantee. Since these facilities are known as the
government's contingent liability, due to moral hazards, the borrower
in many cases has refused to pay back the facilities upon maturity;
therefore, they have been realized as the government’s debt.
Additionally, the execution of development projects the government
and contractors issue bonds (backed by the government guarantees
and in some cases SOEs guarantees) leads to fiscal dominance.
In some cases, the Market Adjustment Committee, disregarding the
available financial resources of the government, makes the
government finance the difference between the planned and the
market price of some basic goods to adjust the market. In most cases,
SOEs such as Government Trading Corporation of Iran (GTC), State
Livestock Affairs Logistics (S.L.A.L), and Central Organization Rural
Cooperatives of Iran (CORC) handle such operations on the behalf of
the government. In many cases, the government borrows from the
banking system to finance such expenditures.
Furthermore, the government receives one-twelfth of the estimated
taxes and government dividends from state-owned banks before the
end of the fiscal year, following the approved numbers in the budget
law, which in some cases are more than the amount of the tax and
dividends to be received according to the financial performance of
these SOEs. This also reflects the existence of fiscal dominance
between the government and the banking system (the details of Off-
budgeting fiscal dominance in the bank's balance sheet are presented
in Appendix 1).
In short, the government’s commitments to banks can be
categorized under two general groups:
A. Government’s commitments (Above the line Items in the
government's balance sheet): most important of which are listed
below.
securities and bonds;
Facilities for buying basic commodities, such as wheat, tea
and other crops following the Law on Guarantees for the
862/ The Fiscal Dominance through Banking System: …
Purchase of Essential Agricultural Products (1989)
and Article 36 of the Law on Administration of Certain
Governmental Financial Regulations (2014);
Agricultural insurance following the Agricultural Insurance
Law (1983);
Opening letter of credit (LC) for ministries and SOEs
following Article 62 of the General Auditing Law;
Reconstruction and renovation of rural houses following
Article 11 of the Organizing and Supporting the Housing
Production and Supply Law (2008);
Unexpected events following Section 6 of the Acceleration of
Reconstruction of Damaged Areas in the Disaster Law (2013)
and Article 33 of the fifth Law on the Five Year
Development Plan (2016);
Subsided interest of facilities, for which the government is
responsible, including:
Interest rate subsidy for Mehr Housing facilities, approved by
the Council of Ministers on 2001-11-20;
Interest rate subsidy for rural housing facilities;
Interest rate subsidy for facilities related to Article 56 of the
Law on the Administration of Certain Financial Government
Regulations (2005);
Government’s debt to the state-owned banks for payment of
taxes and government dividends following Article 224 of the
fifth Law on the Five Year Development Plan (2016), Article
4 of the Law on the Administration of Certain Financial
Government Regulations (2014) and Annual Budget Laws.
B. Government’s contingent liabilities such as guarantee (Below
the line items in the government's balance sheet), the most
important of which are as follows:
Unexpected events based on Article 13 of Establishing a
Disaster Management Organization Act;
Providing governmental organizations and SOEs with
government-supported facilities under article 62 of General
Auditing Law and article 56 of the Law on the Administration
of Certain Financial Government Regulations (2005).
Iran. Econ. Rev. Vol. 24, No. 3, 2020 /863
Rial-bonds or foreign currency bonds of SOEs;
Natural gas lanes to rural areas and cities without gas,
guaranteed by Petroleum Ministry in annual budget laws;
Granting foreign currency facilities to transportation sectors
following budget laws.
The aforementioned commitments and guarantees resulted from the
laws discussed above have faced the government with a high flow of
debt to the banking system every year. Since paying back such a level
of debt is not possible for the government, on some occasions, the
government settles and barters the debts above. In the beginning,
barters and settlings are done by relying on the government assets,
unsettled funds in the banks, and resources gained from the loan
repayment of the Oil Stabilization Fund (OSF). During the exchange
rate shocks, some of the government’s debts, especially debts caused
an increase in the bank's debts to the CBI, have been settled by the
foreign exchange asset revaluation of CBI. In recent years, type one
and type two of Treasury Clearance Documents1 have been used to
repay government debts. Fiscal dominance may occur when type two
of treasury documents are used. However, when tangible assets are
transferred from the government to the banks, this is not the case. This
claim should be examined in future research.
3. Iran’s Micro Data on Banking System
3.1 Data Sources
The following data resources have been used for the analysis here:
Bank ledgers: Bank self-reported data, March 2007 to June 2018;
National accounts (SNA) of the Statistical Center of Iran:
Quarterly, Constant 2004;
Government’s fiscal statistics (GFS) of the Central Bank:
Quarterly, Spring 2005- Spring 2018.
Since the government has no debts to private banks during almost all
periods, these banks are excluded from the study. Accordingly, the
remaining banks are:
1. According to the treasury clearance documents – in type 2, the government debt to contractors will be offset against a part of their bank debt. In turn, the banks reduce their borrowings from the CBI by an equal amount. Once completed, government debt to contractors will decline by the same amount of increasing the government's debt to the CBI, leaving total outstanding government deb constant.
864/ The Fiscal Dominance through Banking System: …
State-owned commercial banks: Melli, Sepah, and Post Bank;
Privatized commercial banks: Mellat, Tejarat, Saderat, and
Refah;
Specialized banks: Maskan, Keshavarzi, Industry and Mine,
Export Development, and Tose’e Ta’avon.
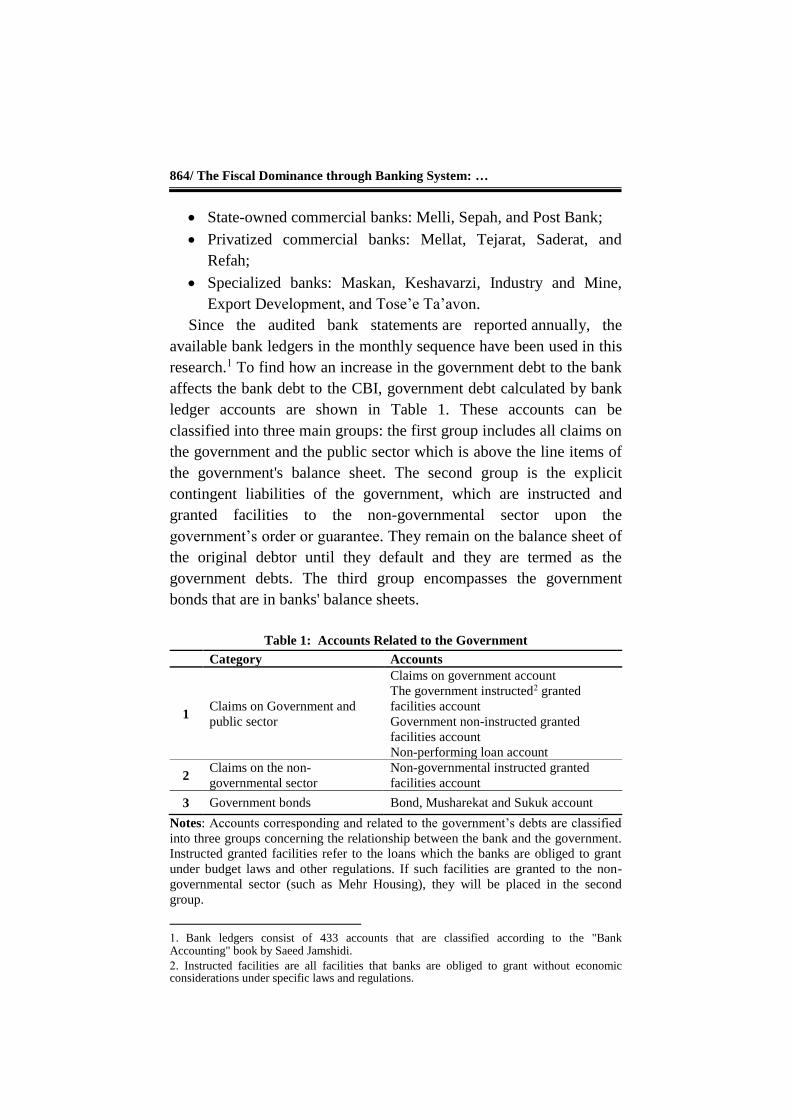
Since the audited bank statements are reported annually, the
available bank ledgers in the monthly sequence have been used in this
research.1 To find how an increase in the government debt to the bank
affects the bank debt to the CBI, government debt calculated by bank
ledger accounts are shown in Table 1. These accounts can be
classified into three main groups: the first group includes all claims on
the government and the public sector which is above the line items of
the government's balance sheet. The second group is the explicit
contingent liabilities of the government, which are instructed and
granted facilities to the non-governmental sector upon the
government’s order or guarantee. They remain on the balance sheet of
the original debtor until they default and they are termed as the
government debts. The third group encompasses the government
bonds that are in banks' balance sheets.
Table 1: Accounts Related to the Government
Category Accounts
1 Claims on Government and
public sector
Claims on government account
The government instructed2 granted
facilities account
Government non-instructed granted
facilities account
Non-performing loan account
2 Claims on the non-
governmental sector
Non-governmental instructed granted
facilities account
3 Government bonds Bond, Musharekat and Sukuk account
Notes: Accounts corresponding and related to the government’s debts are classified
into three groups concerning the relationship between the bank and the government.
Instructed granted facilities refer to the loans which the banks are obliged to grant
under budget laws and other regulations. If such facilities are granted to the non-
governmental sector (such as Mehr Housing), they will be placed in the second
group.
1. Bank ledgers consist of 433 accounts that are classified according to the "Bank Accounting" book by Saeed Jamshidi.
2. Instructed facilities are all facilities that banks are obliged to grant without economic considerations under specific laws and regulations.
Iran. Econ. Rev. Vol. 24, No. 3, 2020 /865
The bank debt to the CBI is derived from the sum of the accounts
classified under the “debt to the CBI” category. Although there are
numerous accounts of this kind, only four accounts play significant
roles in this regard. For state-owned banks the account “debt to the
CBI in the current account,” for the privatized banks “foreign
currency deposit of CBI,” and for the specialized banks “facilities
received from the CBI” are dominant.
The data were cleaned and irregularities1 of certain accounts were
addressed. The variables also have some outliers. These may be due to
an experimental error or show significant changes in some accounts.
For example, capital raising of the banks is usually recorded at the end
of the year and sometimes doubles the accumulated capital account.
To solve this problem, ±0.5 percent of the high and low ends are
winsorized2.
3.2 Summary Statistics
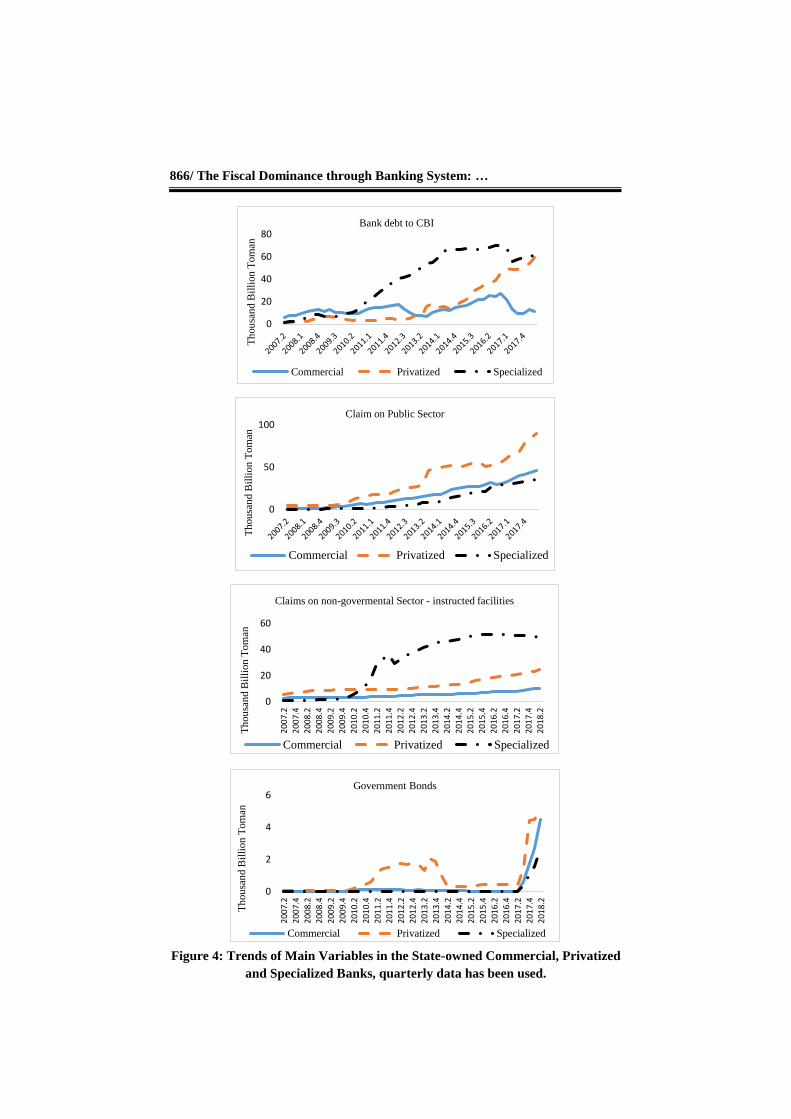
The Debt of the specialized banks to the CBI has increased greatly
since 2009, which is the result of the Mehr Housing Plan credit line.
Bank claims on non-governmental instructed facilities' growth in this
period confirm it as well. The debt of the privatized banks to the CBI
has increased since 2013 onwards and become more dramatic after
2016 when the bank claims on the public sector have increased as
well. For the state-owned commercial banks, no obvious long-run
trend in debt to the CBI is observed since the government in some
periods has raised their capital in the form of settling their debts to the
CBI; however, the banks' claims on public sector have increased
continuously. Government bonds as a whole are considered minor in
comparison to the other granted facilities even though there are certain
times in which the government bonds show a substantial increase.
Hence, one might consider its effect on the CBI claims negligible. The
effect of government debt on the banks on the banks’ debt to the
CBI is discussed in Section 5.
1. The irregularities either happen in the form of one or two month surges in the balance of accounts when they are zero or when the accumulated profit/losses account for two banks have a large adjustment at the end of the year; in these conditions, the average amount of few months has been replaced. 2. For example, replacing at 1% means that, instead of all observations of the first to fifth percentiles, the average of the fifth percentile is set. Likewise, instead of all observations of 95th to 100th percentiles, the average of 95th percentile is replaced.
866/ The Fiscal Dominance through Banking System: …
Figure 4: Trends of Main Variables in the State-owned Commercial, Privatized
and Specialized Banks, quarterly data has been used.
0
20
40
60
80
Th
ou
san
d B
illi
on
Tom
an
Bank debt to CBI
Commercial Privatized Specialized
0
50
100
Th
ou
san
d B
illi
on
Tom
an
Claim on Public Sector
Commercial Privatized Specialized
0
20
40
60
200
7.2
200
7.4
200
8.2
200
8.4
200
9.2
200
9.4
201
0.2
201
0.4
201
1.2
201
1.4
201
2.2
201
2.4
201
3.2
201
3.4
201
4.2
201
4.4
201
5.2
201
5.4
201
6.2
201
6.4
201
7.2
201
7.4
201
8.2
Th
ou
san
d B
illi
on
Tom
an
Claims on non-govermental Sector - instructed facilities
Commercial Privatized Specialized
0
2
4
6
200
7.2
200
7.4
200
8.2
200
8.4
200
9.2
200
9.4
201
0.2
201
0.4
201
1.2
201
1.4
201
2.2
201
2.4
201
3.2
201
3.4
201
4.2
201
4.4
201
5.2
201
5.4
201
6.2
201
6.4
201
7.2
201
7.4
201
8.2
Th
ou
san
d B
illi
on
Tom
an
Government Bonds
Commercial Privatized Specialized
Iran. Econ. Rev. Vol. 24, No. 3, 2020 /867
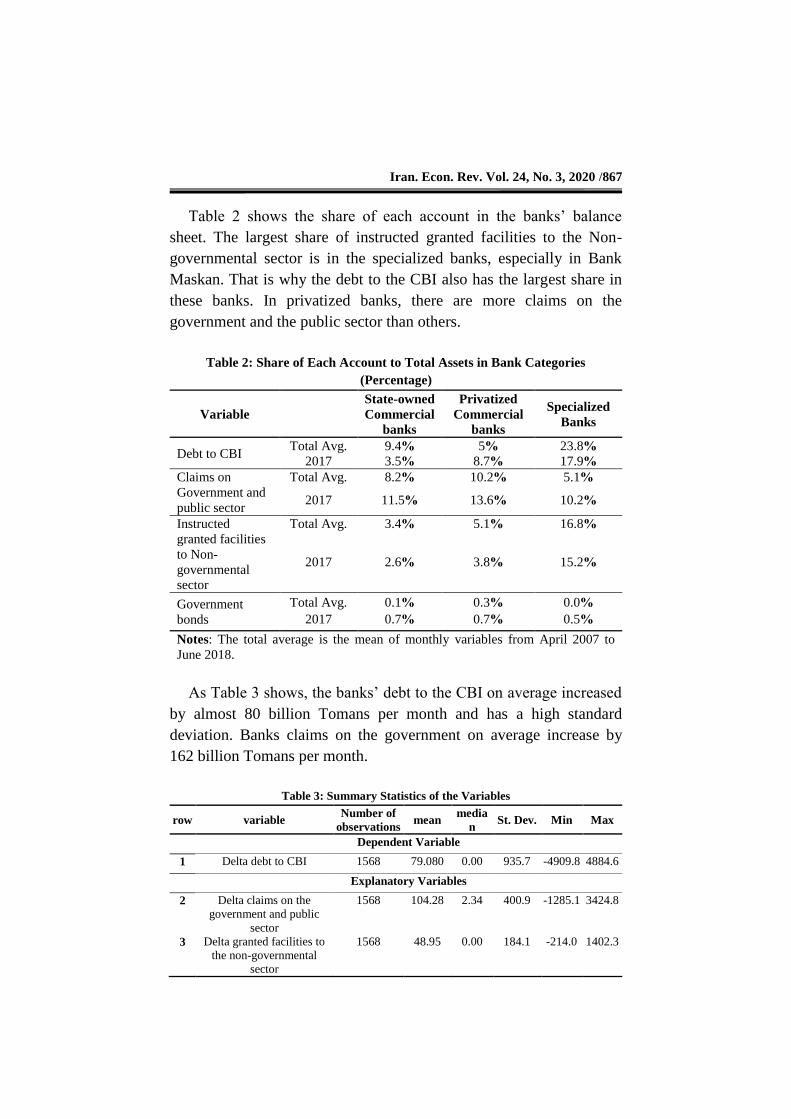
Table 2 shows the share of each account in the banks’ balance
sheet. The largest share of instructed granted facilities to the Non-
governmental sector is in the specialized banks, especially in Bank
Maskan. That is why the debt to the CBI also has the largest share in
these banks. In privatized banks, there are more claims on the
government and the public sector than others.
Table 2: Share of Each Account to Total Assets in Bank Categories
(Percentage)
Variable
State-owned
Commercial
banks
Privatized
Commercial
banks
Specialized
Banks
Debt to CBI Total Avg. 9.4% 5% 23.8%
2017 3.5% 8.7% 17.9%
Claims on
Government and
public sector
Total Avg. 8.2% 10.2% 5.1%
2017 11.5% 13.6% 10.2%
Instructed
granted facilities
to Non-
governmental
sector
Total Avg. 3.4% 5.1% 16.8%
2017 2.6% 3.8% 15.2%
Government
bonds
Total Avg. 0.1% 0.3% 0.0%
2017 0.7% 0.7% 0.5%
Notes: The total average is the mean of monthly variables from April 2007 to
June 2018.
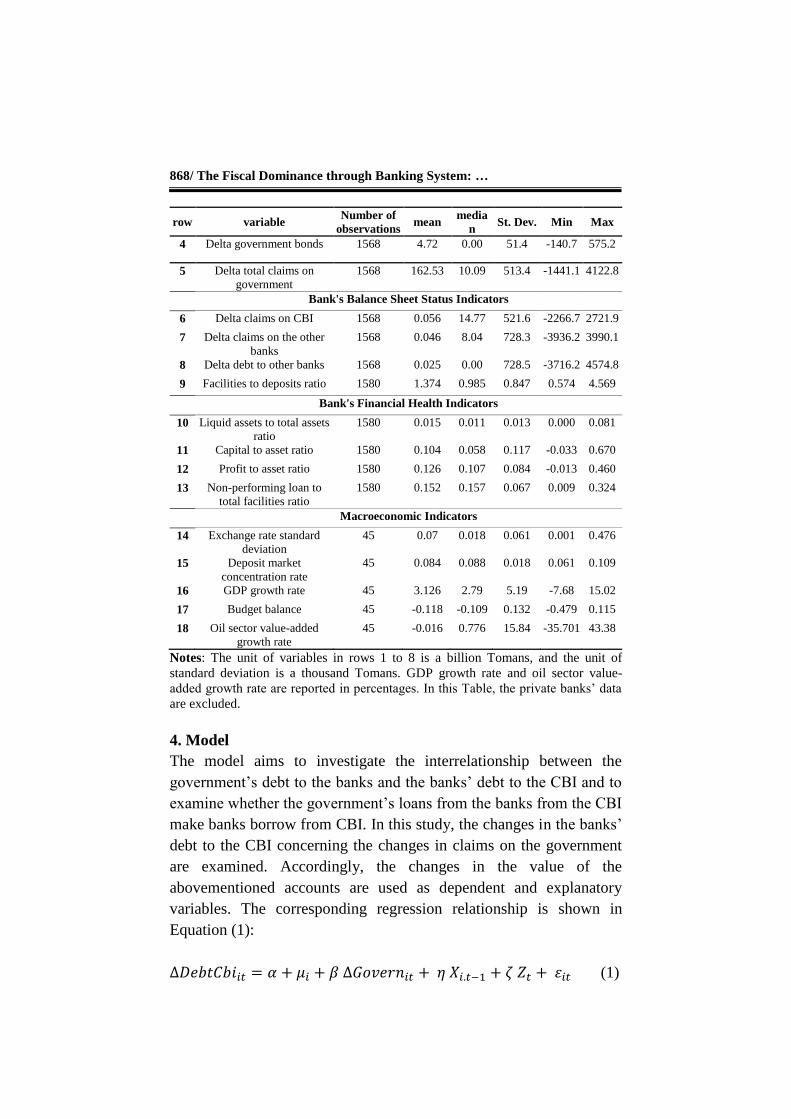
As Table 3 shows, the banks’ debt to the CBI on average increased
by almost 80 billion Tomans per month and has a high standard
deviation. Banks claims on the government on average increase by
162 billion Tomans per month.
Table 3: Summary Statistics of the Variables
row variable Number of
observations mean
media
n St. Dev. Min Max
Dependent Variable
1 Delta debt to CBI 1568 79.080 0.00 935.7 -4909.8 4884.6
Explanatory Variables
2 Delta claims on the
government and public
sector
1568 104.28 2.34 400.9 -1285.1 3424.8
3 Delta granted facilities to
the non-governmental
sector
1568 48.95 0.00 184.1 -214.0 1402.3
868/ The Fiscal Dominance through Banking System: …
row variable Number of
observations mean
media
n St. Dev. Min Max
4 Delta government bonds 1568 4.72 0.00 51.4 -140.7 575.2
5 Delta total claims on
government
1568 162.53 10.09 513.4 -1441.1 4122.8
Bank's Balance Sheet Status Indicators
6 Delta claims on CBI 1568 0.056 14.77 521.6 -2266.7 2721.9
7 Delta claims on the other
banks
1568 0.046 8.04 728.3 -3936.2 3990.1
8 Delta debt to other banks 1568 0.025 0.00 728.5 -3716.2 4574.8
9 Facilities to deposits ratio 1580 1.374 0.985 0.847 0.574 4.569
Bank's Financial Health Indicators
10 Liquid assets to total assets
ratio
1580 0.015 0.011 0.013 0.000 0.081
11 Capital to asset ratio 1580 0.104 0.058 0.117 -0.033 0.670
12 Profit to asset ratio 1580 0.126 0.107 0.084 -0.013 0.460
13 Non-performing loan to
total facilities ratio
1580 0.152 0.157 0.067 0.009 0.324
Macroeconomic Indicators
14 Exchange rate standard
deviation
45 0.07 0.018 0.061 0.001 0.476
15 Deposit market
concentration rate
45 0.084 0.088 0.018 0.061 0.109
16 GDP growth rate 45 3.126 2.79 5.19 -7.68 15.02
17 Budget balance 45 -0.118 -0.109 0.132 -0.479 0.115
18 Oil sector value-added
growth rate
45 -0.016 0.776 15.84 -35.701 43.38
Notes: The unit of variables in rows 1 to 8 is a billion Tomans, and the unit of
standard deviation is a thousand Tomans. GDP growth rate and oil sector value-
added growth rate are reported in percentages. In this Table, the private banks’ data
are excluded.
4. Model
The model aims to investigate the interrelationship between the
government’s debt to the banks and the banks’ debt to the CBI and to
examine whether the government’s loans from the banks from the CBI
make banks borrow from CBI. In this study, the changes in the banks’
debt to the CBI concerning the changes in claims on the government
are examined. Accordingly, the changes in the value of the
abovementioned accounts are used as dependent and explanatory
variables. The corresponding regression relationship is shown in
Equation (1):
Δ𝐷𝑒𝑏𝑡𝐶𝑏𝑖𝑖𝑡 = 𝛼 + 𝜇𝑖 + 𝛽 Δ𝐺𝑜𝑣𝑒𝑟𝑛𝑖𝑡 + 𝜂 𝑋𝑖.𝑡−1 + 𝜁 𝑍𝑡 + 𝜀𝑖𝑡 (1)

Iran. Econ. Rev. Vol. 24, No. 3, 2020 /869
where Δ𝐷𝑒𝑏𝑡𝐶𝑏𝑖𝑖𝑡 shows the changes in the debt level of bank 𝑖 to the
CBI in period 𝑡, compared to period 𝑡 − 1. In the same way,
Δ𝐺𝑜𝑣𝑒𝑟𝑛𝑖𝑡 is the total change in claims on the government for bank 𝑖
in period 𝑡 compared to period 𝑡 − 1. Variable 𝐺𝑜𝑣𝑒𝑟𝑛 is calculated
using the sum of the accounts in Table 1 by Equation (2):
𝐺𝑜𝑣𝑒𝑟𝑛𝑖𝑡 = 𝐶𝑙𝑎𝑖𝑚𝐺𝑜𝑣𝑖𝑡 + 𝐶𝑙𝑎𝑖𝑚𝑁𝑜𝑛𝐺𝑜𝑣𝑖𝑡 + 𝐺𝑜𝑣𝐵𝑜𝑛𝑑𝑖𝑡 (2)
where 𝐶𝑙𝑎𝑖𝑚𝐺𝑜𝑣𝑖𝑡, 𝐶𝑙𝑎𝑖𝑚𝑁𝑜𝑛𝐺𝑜𝑣𝑖𝑡 and 𝐺𝑜𝑣𝐵𝑜𝑛𝑑𝑖𝑡 show the claims
on the government and public sector, the instructed granted facilities
to the non-governmental sector and the government bonds. Since the
relationship between the government and the banks can be different in
each of these accounts, the model can also be written and analyzed as
Equation (3):
Δ𝐷𝑒𝑏𝑡𝐶𝑏𝑖𝑖𝑡 = 𝛼 + 𝜇𝑖 + 𝛽1 Δ𝐶𝑙𝑎𝑖𝑚𝐺𝑜𝑣𝑖𝑡 + 𝛽2 Δ𝐶𝑙𝑎𝑖𝑚𝑁𝑜𝑛𝐺𝑜𝑣𝑖𝑡 +
𝛽3 Δ𝐺𝑜𝑣𝐵𝑜𝑛𝑑𝑖𝑡 + 𝜂 𝑋𝑖.𝑡−1 + 𝜁 𝑍𝑡 + 𝜀𝑖𝑡 (3)
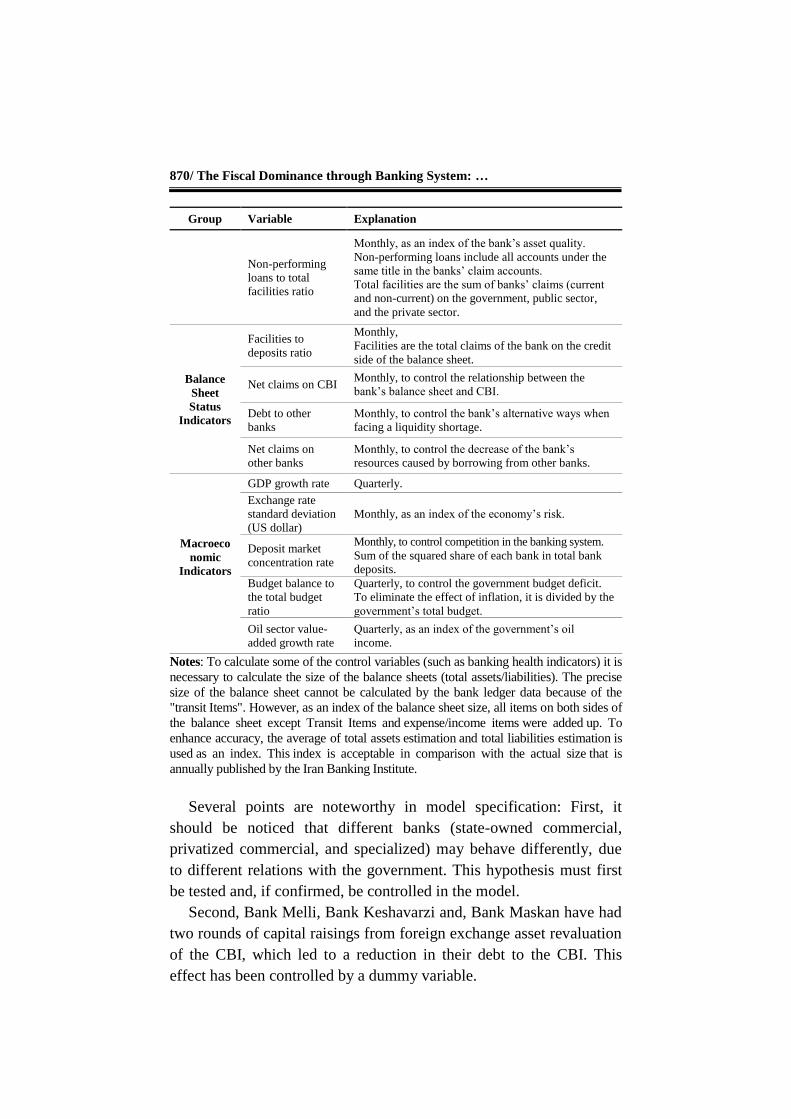
where, 𝑋𝑖.𝑡−1 is the control variables vector for bank 𝑖 in period 𝑡 − 1.
These variables include the bank’s financial health indicators and the
bank’s balance sheet status variables. To decrease the endogeneity that
arises from being simultaneous, the first lag of these variables is
entered into the model. Zt is the macroeconomic variables vector that
is similar for all banks for any value of 𝑡. To control other features of
the banks that are not observable or measurable, banks' fixed effects
𝜇𝑖 are included in the model, as presented in Table 4.
Table 4: Control Variables
Group Variable Explanation
Financial
Health
Indicators
Liquid assets to
total assets ratio
Monthly, as an index of the bank’s liquidity
management quality.
Liquid assets are the sum of several accounts under
the same title in the bank’s balance sheet.
Capital account to
total assets ratio
Monthly, The capital account includes the payable
capital account, other (including legal) reserve
account, and accumulated profit (loss) account.
Profit to total
assets ratio Monthly.
870/ The Fiscal Dominance through Banking System: …
Group Variable Explanation
Non-performing
loans to total
facilities ratio
Monthly, as an index of the bank’s asset quality.
Non-performing loans include all accounts under the
same title in the banks’ claim accounts.
Total facilities are the sum of banks’ claims (current
and non-current) on the government, public sector,
and the private sector.
Balance
Sheet
Status
Indicators
Facilities to
deposits ratio
Monthly,
Facilities are the total claims of the bank on the credit
side of the balance sheet.
Net claims on CBI Monthly, to control the relationship between the
bank’s balance sheet and CBI.
Debt to other
banks
Monthly, to control the bank’s alternative ways when
facing a liquidity shortage.
Net claims on
other banks
Monthly, to control the decrease of the bank’s
resources caused by borrowing from other banks.
Macroeco
nomic
Indicators
GDP growth rate Quarterly.
Exchange rate
standard deviation
(US dollar)
Monthly, as an index of the economy’s risk.
Deposit market
concentration rate
Monthly, to control competition in the banking system.
Sum of the squared share of each bank in total bank
deposits.
Budget balance to
the total budget
ratio
Quarterly, to control the government budget deficit.
To eliminate the effect of inflation, it is divided by the
government’s total budget.
Oil sector value-
added growth rate
Quarterly, as an index of the government’s oil
income.
Notes: To calculate some of the control variables (such as banking health indicators) it is
necessary to calculate the size of the balance sheets (total assets/liabilities). The precise
size of the balance sheet cannot be calculated by the bank ledger data because of the
"transit Items". However, as an index of the balance sheet size, all items on both sides of
the balance sheet except Transit Items and expense/income items were added up. To
enhance accuracy, the average of total assets estimation and total liabilities estimation is
used as an index. This index is acceptable in comparison with the actual size that is
annually published by the Iran Banking Institute.
Several points are noteworthy in model specification: First, it
should be noticed that different banks (state-owned commercial,
privatized commercial, and specialized) may behave differently, due
to different relations with the government. This hypothesis must first
be tested and, if confirmed, be controlled in the model.
Second, Bank Melli, Bank Keshavarzi and, Bank Maskan have had
two rounds of capital raisings from foreign exchange asset revaluation
of the CBI, which led to a reduction in their debt to the CBI. This
effect has been controlled by a dummy variable.

Iran. Econ. Rev. Vol. 24, No. 3, 2020 /871
Third, the existence of co-integration between the delta government’s
debt to the banks and delta banks’ debt to the CBI should be tested. Kao
and Westerlund's test indicates these delta form variables are stationary (I
(0)); hence, there is no concern about their co-integration.
5. Results
This model is a Fixed Effects model with imbalanced panel data, in
which changes in the debt to the CBI is the dependent variable, and
the changes in total claims on the government are the explanatory
variable. Table 5 shows the explanatory variable coefficient; in the
first and the second columns the control variables are not included in
the model specification. As it can be noticed, without controlling the
banks’ capital-raising periods, the coefficient of the "changes in
claims on the government" would not be significant.
As mentioned earlier, sometimes the state-owned and specialized
bank's capital has been raised by foreign exchange asset revaluation
and their debt to the CBI has settled. During this period, the bank's
claims on the government have increased while the bank’s debt to the
CBI has decreased. This is why the coefficient becomes significant at
a 5% level when the capital raising periods in Column 2 is controlled.
The third column presents the main specification of the fixed
effects model using an imbalanced panel dataset. The results show
that each 1-billion-Toman increase in the claims on the government
causes a 200million-Toman increase in the banks’ debt to the CBI.
Table 5: Fixed Effects Models Estimation Results
variable
FE regression excluding
control variables FE regression including
control variables
(main specification) 1 2
Delta total claims on government 0.165 0.216* 0.208*
(1.23) (2.2) (2.95)
Dummy variable for state-owned
and specialized banks’ capital
raising periods
constant 52.17* 50.99** -23.67
(2.38) (3.35) (-0.16)
Number of observations 1568 1568 1520
Notes: * represents the significance at the 0.05 level, and the numbers in parentheses
are t-statistics.

872/ The Fiscal Dominance through Banking System: …
5.2 Sensitivity Analysis
Table 6 shows the sensitivity analysis for the estimation methods and
the variables. The first column encompasses the main specification
using the Fixed Effects model for all banks, and the second column
shows the result of Ordinary Least Squared Regression, controlled for
bank categories. In the other columns, the Fixed Effects model is
estimated by bank categories (state-owned, privatized, and specialized
banks) separately. In all columns, capital raisings are controlled. It is
observed that the coefficients of the changes in claims on the
government in Columns 1 and 2 are positive and significant.
In Column 3, which is corresponding to the state-owned banks, the
coefficient of the explanatory variable is negative and
significant; however, in Columns 4 and 5, the coefficients are positive
and significant for the privatized and specialized banks. Accordingly,
the relationship between changes in claims on the government and
changes in debts to the CBI in state-owned banks is rather different
from other banks.
The two-way relationship between the banks and the CBI has been
controlled by the bank's claims on the CBI variable; if banks hold
enough balance on their reserve account with the CBI, they can
borrow much more easily from the CBI. Bank's claims on the other
banks and bank's debt to other banks are also included in the model.
As can be observed, the coefficient of changes in debts to other banks
is negative and significant; indicating that borrowing from the CBI
and the other banks are substitutes. The coefficient of claims on the
other banks is positive and significant. This finding was expected
result since the claims on the other banks reduce the banks' resources
and the bank refers to the CBI to solve the liquidity shortage.
The macroeconomic indicators are not significant. This is probably
because such variables affect the dependent variable by the bank’s
financial health indicators and have no independent effect.

Iran. Econ. Rev. Vol. 24, No. 3, 2020 /873
Table 6: Model Estimation Results
(1) (2) (3) (4) (5)
variables
FE regression (main
specification)
OLS regression
FE regression
state-owned banks
FE regression privatized
banks
FE regression specialized
banks
Exp
lanat
ory
V
aria
ble
s
Delta claims on government and public sector
0.208* 0.221** -0.187** 0.247* 0.210**
(2.95) (2.69) (-14.96) (2.54) (4.71)
Ban
k's
Bal
ance
Sh
eet
Sta
tus
Indic
ato
rs
first lag of delta claims on CBI
-0.169*** -0.164** -0.165 -0.196* 0.0490
(-4.63) (-2.80) (-2.59) (-3.63) (1.01)
first lag of delta claims on the other banks
-0.0255 -0.0231 0.0797 -0.0760 0.0721
(-0.58) (-0.50) (1.41) (-2.57) (0.73)
first lag of delta debt to other banks
0.297*** 0.297*** 0.323** 0.338* -0.0401
(4.74) (4.33) (16.98) (5.62) (-0.56)
first lag of facilities to deposits ratio
38.83 42.30 -120.8 -561.2 77.87**
(1.07) (1.94) (-2.00) (-0.74) (5.68)
Ban
k's
Fin
anci
al H
ealt
h
Indic
ato
rs
first lag of liquid assets to total assets ratio
-3551.0 -2421.7 -3401.0 2310.4 -7941.8
(-1.55) (-1.19) (-2.46) (0.59) (-1.50)
first lag of capital to total asset ratio
-68.44 -35.64 -328.1 -180.8 -918.5
(-0.15) (-0.16) (-0.17) (-0.06) (-1.97)
first lag of profit to total asset ratio
273.2 236.0 5584.3 1511.6* -1510.6
(0.18) (0.61) (2.30) (3.22) (-1.23)
first lag of non-performing loan to total facilities ratio
-637.7 -568.0 -816.6 728.0 -425.5
(-1.68) (-1.69) (-1.08) (2.43) (-1.33)
Mac
roec
ono
mic
In
dic
ato
rs
Exchange rate standard deviation
222.6 226.8 -485.9 -4.447 636.4
(0.42) (0.47) (-0.79) (-0.00) (1.37)
Deposit market concentration rate
2264.1 2164.1 -3542.1 -3605.3 6350.6
(0.81) (1.25) (-1.39) (-3.07) (2.59)
GDP growth rate -4.185 -3.847 0.271 0.823 0.153
(-1.21) (-0.63) (0.06) (0.14) (0.06)
Budget balance 304.1 300.7 388.7 520.6 249.0
(1.89) (1.51) (1.40) (1.53) (0.89)
Oil sector value-added growth rate
3.564 3.570* 3.985 4.994 0.318
(2.13) (1.97) (0.76) (2.65) (0.49)
constant -23.67 -19.50 190.5 633.9 -92.43
(-0.16) (-0.12) (1.27) (0.78) (-0.74)
dummy variable for capital raising periods
dummy variable for bank categories
Number of observations
1520 1520 390 520 610
Notes: * represents the significance at 0.05 level, and the numbers in parentheses are
t-statistics.

874/ The Fiscal Dominance through Banking System: …
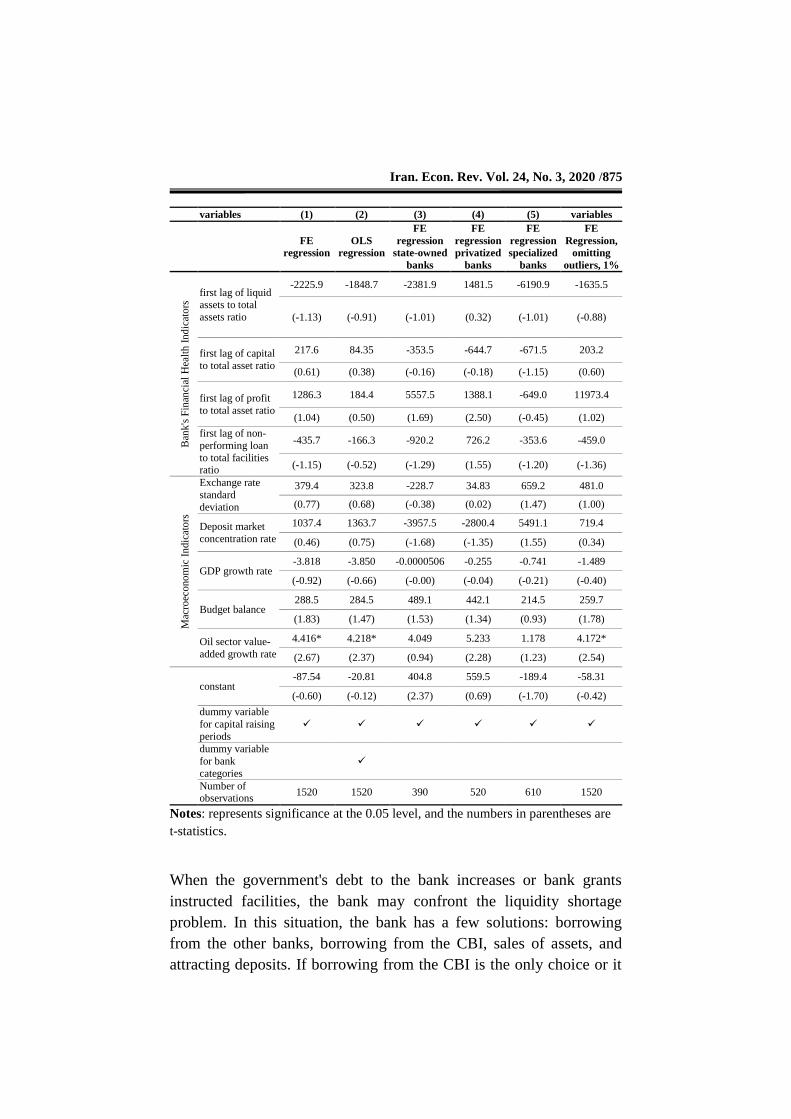
Model estimation by different types of claims on the government is
presented in Table 7.
The changes in instructed granted facilities to the non-
governmental sector are significant at the 5% level in the main
specification, indicating that granting instructed facilities to the non-
governmental sector leads to an increase in banks' debt to the CBI.
This result is robust when outliers are controlled at the 1% level. The
coefficient for specialized banks is significant at 10% level; however,
this is not true for the state-owned and privatized banks.
Table 7: Model Estimation by Different Types of Claims on the Government
variables (1) (2) (3) (4) (5) variables
FE
regression
OLS
regression
FE
regression
state-owned
banks
FE
regression
privatized
banks
FE
regression
specialized
banks
FE
Regression,
omitting
outliers, 1%
Exp
lanat
ory
Var
iable
s
Delta claims on government and
public sector
0.157 0.169 -0.123 0.218 0.131 0.100
(1.22) (1.47) (-0.59) (1.33) (0.61) (0.65)
Delta instructed
granted facilities to non-
governmental
sector
0.761*** 0.597*** -2.669 1.027 0.535 0.750***
(10.33) (4.27) (-1.16) (1.68) (2.58) (14.09)
Delta government bonds
0.489 0.517 -0.00615 1.387 1.568 1.186
(0.56) (0.57) (-0.00) (1.46) (1.03) (0.82)
Ban
k's
Bal
ance
Sh
eet
Sta
tus
Ind
icat
ors
first lag of delta
claims on CBI
-0.165** -0.163** -0.167 -0.197* 0.0702 -0.0158**
(-3.91) (-2.76) (-2.07) (-3.34) (1.47) (-3.79)
first lag of delta
claims on other banks
-0.0277 -0.0266 0.0609 -0.0803 0.0764 -0.0365
(-0.60) (-0.57) (1.95) (-2.62) (0.74) (-0.78)
first lag of delta debt to other
banks
0.297*** 0.294*** 0.304* 0.341* -0.0459 0.289***
(4.73) (4.29) (8.19) (5.54) (-0.75) (4.45)
first lag of facilities to
deposits ratio
-9.946 25.12 -261.0 -539.0 48.91* -11.51
(-0.42) (1.13) (-1.14) (-0.77) (3.67) (-0.53)
Iran. Econ. Rev. Vol. 24, No. 3, 2020 /875
variables (1) (2) (3) (4) (5) variables
FE
regression
OLS
regression
FE
regression
state-owned
banks
FE
regression
privatized
banks
FE
regression
specialized
banks
FE
Regression,
omitting
outliers, 1%
Ban
k's
Fin
anci
al H
ealt
h I
nd
icat
ors
first lag of liquid
assets to total
assets ratio
-2225.9 -1848.7 -2381.9 1481.5 -6190.9 -1635.5
(-1.13) (-0.91) (-1.01) (0.32) (-1.01) (-0.88)
first lag of capital
to total asset ratio
217.6 84.35 -353.5 -644.7 -671.5 203.2
(0.61) (0.38) (-0.16) (-0.18) (-1.15) (0.60)
first lag of profit
to total asset ratio
1286.3 184.4 5557.5 1388.1 -649.0 11973.4
(1.04) (0.50) (1.69) (2.50) (-0.45) (1.02)
first lag of non-
performing loan
to total facilities ratio
-435.7 -166.3 -920.2 726.2 -353.6 -459.0
(-1.15) (-0.52) (-1.29) (1.55) (-1.20) (-1.36)
Mac
roec
ono
mic
In
dic
ato
rs
Exchange rate
standard
deviation
379.4 323.8 -228.7 34.83 659.2 481.0
(0.77) (0.68) (-0.38) (0.02) (1.47) (1.00)
Deposit market
concentration rate
1037.4 1363.7 -3957.5 -2800.4 5491.1 719.4
(0.46) (0.75) (-1.68) (-1.35) (1.55) (0.34)
GDP growth rate -3.818 -3.850 -0.0000506 -0.255 -0.741 -1.489
(-0.92) (-0.66) (-0.00) (-0.04) (-0.21) (-0.40)
Budget balance 288.5 284.5 489.1 442.1 214.5 259.7
(1.83) (1.47) (1.53) (1.34) (0.93) (1.78)
Oil sector value-
added growth rate
4.416* 4.218* 4.049 5.233 1.178 4.172*
(2.67) (2.37) (0.94) (2.28) (1.23) (2.54)
constant -87.54 -20.81 404.8 559.5 -189.4 -58.31
(-0.60) (-0.12) (2.37) (0.69) (-1.70) (-0.42)
dummy variable
for capital raising
periods
dummy variable
for bank
categories
Number of observations
1520 1520 390 520 610 1520
Notes: represents significance at the 0.05 level, and the numbers in parentheses are
t-statistics.
When the government's debt to the bank increases or bank grants
instructed facilities, the bank may confront the liquidity shortage
problem. In this situation, the bank has a few solutions: borrowing
from the other banks, borrowing from the CBI, sales of assets, and
attracting deposits. If borrowing from the CBI is the only choice or it

876/ The Fiscal Dominance through Banking System: …
costs less, the bank goes to the CBI. Since borrowing from the CBI
may not occur at the same time as increasing the government’s debt, it
seems necessary to consider the variable lags in the model. So first the
correlation coefficients between lags of claims on government and
delta debt to the CBI are calculated. Then, the model is estimated with
different lags, and significant lags are determined.
In Table 8, the correlation between debt to the CBI and
explanatory variables’ lags is shown. The current and forth lags of
delta claims on the government and public sector have a significant
correlation with debt to the CBI. All the lags are significant for delta
instructed granted facilities to the non-governmental sector; however,
no lag of delta government bonds is significant. Finally, the first,
third, and fourth lags are significant for total claims on the
government the current amount.
Table 8: Correlation Coefficients between Lags of Claims on Government and
Delta Debt to CBI
Delta claims on
government
and public
sector
Delta instructed
granted facilities
to the non-
governmental
sector
Delta
government
bonds
Delta total
claims on
government
t 0.0753* 0.1202* 0.0455 0.1158*
t-1 0.0488 0.1420* 0.0124 0.0984*
t-2 -0.0415 0.1448* -0.0446 0.0152
t-3 0.0043 0.1286* 0.0346 0.0599*
t-4 0.0831* 0.1478* 0.0443 0.1363*
Notes: * represents significance at the 0.05 level.
In Table 9, the model is estimated as a robustness check to control
the effect of lagged explanatory and control variables. In Column 2,
the first and third lags of the explanatory variable are added, and the
first lag of control variables (i.e. bank's balance sheet status and bank's
financial health indicators) is replaced. These lags neither are
significant nor decrease the significance of the current amount of delta
claims on the government and public sector. Columns 3 and 4 show
the third and 12th lags of control variables, respectively. In Column 3,
the explanatory variable’s coefficient is significant at the 10% level,

Iran. Econ. Rev. Vol. 24, No. 3, 2020 /877
and in Column 4, it is significant at the 5% level. Therefore, the lags
of explanatory and control variables do not influence the significance
of the Delta claims on the government and public sector effectively.
Table 9: Estimation Results to Control for the Effect of Lagged Explanatory
and Control Variables
(1) (2) (3) (4)
variables
FE regression
(main
specification)
first lag of
control
variables
third lag of
control
variables
12th lag of
control
variables
Ex
pla
nat
ory
Var
iab
les
Delta claims on
the government
and public sector
0.208* 0.194* 0.196 0.212*
(2.95) (2.76) (2.07) (2.32)
first lag 0.0674
(1.81)
third lag 0.0395
(0.70)
Ban
k's
Bal
ance
Sh
eet
Sta
tus
Ind
icat
ors
nth lag of delta
claims on CBI
-0.169*** -0.171** -0.0857 0.0442
(-4.63) (-4.34) (-1.90) (0.69)
nth lag of delta
claims on the
other banks
-0.0255 -0.0274 0.0515 -0.0314
(-0.58) (-0.61) (1.50) (-0.94)
nth lag of delta
debt to other
banks
0.297*** 0.295*** -0.0100 0.131
(4.74) (4.74) (-0.45) (1.29)
nth lag of facilities
to deposits ratio
38.83 30.26 12.39 -12.78
(1.07) (1.01) (0.48) (-0.56)
Ban
k's
Fin
anci
al H
ealt
h
Ind
icat
ors
nth lag of liquid
assets to total
assets ratio
-3551.0 -3275.7 3058.3 8389.4
(-1.55) (-1.44) (1.33) (1.60)
nth lag of capital
to total asset ratio
-68.44 -43.23 100.6 -77.14
(-0.15) (-0.10) (0.25) (-0.23)
nth lag of profit to
total asset ratio
273.2 499.4 -352.8 -1192.8
(0.18) (0.40) (-0.30) (-0.89)
nth lag of non-
performing loan
to total facilities
ratio
-637.7 -596.2 -546.3 -177.7
(-1.68) (-1.53) (-1.35) (-0.52)
Mac
roec
on
om
ic
Ind
icat
ors
Exchange rate
standard
deviation
222.6 181.9 45.94 -0.686
(0.42) (0.33) (0.09) (-0.00)
Deposit market
concentration rate
2264.1 2398.8 1313.2 1495.9
(0.81) (0.84) . (0.73)
GDP growth rate -4.185 -4.590 -2.650 -6.202
(-1.21) (-1.31) (-0.77) (-0.98)

878/ The Fiscal Dominance through Banking System: …
(1) (2) (3) (4)
variables
FE regression
(main
specification)
first lag of
control
variables
third lag of
control
variables
12th lag of
control
variables
Budget balance 304.1 322.7 332.0 264.6
(1.89) (1.99) (1.93) (1.08)
Oil sector value-
added growth rate
3.564 3.764 2.844 4.322
(2.13) (2.19) (1.75) (1.69)
Constant -74.63 48.91 52.85
(-0.46) (0.42) (0.59)
Dummy variable
for capital raising
periods
Dummy variable
for bank
categories
Number of
observations 1520 1496 1496 1388
nth lag 1 1 3 12
6. Conclusion
Iran’s economy still has a two-digit inflation rate with high
fluctuations; however, the monetary authorities have not been
successful in controlling this problem. Fiscal dominance is the main
reason why the Central Bank is unable to control the inflation rate.
The most conventional way leading to fiscal dominance is financing
the budget deficits by borrowing from the Central Bank, which was
prohibited in Iran since the enactment of the Third Development Plan.
However, the lack of control over the budget deficits caused by the
government’s failure to implement the fiscal reform program has
made the government borrow from the banking system. Since this way
of fiscal dominance is unacceptable in Iran’s political economy, the
government has not disclosed the debt services of borrowing from the
banking system in the annual budget documents. Gradually, this
portion of the government’s expenditure was taken out from the
annual budget documents; hence, off-budget operations were
performed by the banking system. While the government’s debt to the
banks was accumulating, the government would neither disclose nor
pay its debts back to the banks.
Government arrears to contractors and banks jeopardize the already
fragile banking system. A legacy of government payment arrears,
Iran. Econ. Rev. Vol. 24, No. 3, 2020 /879
combined with state-directed lending, and poor risk management
practices of banks have left the bank's balance sheets impaired and
capital position weak. This, in turn, results in liquidity shortages. To
solve this issue, the government sometimes bartered its assets (e.g.
foreign assets) as a means to pay its debts.
As discussed, the main items that create the government’s debt to
the banks include the government-backed guarantees of financial
facilities, debt securities issued by the government and SOEs,
resolutions of the Market Balance Committee, guaranteed purchase of
agricultural commodities, insurance of crops, and collecting taxes and
government dividends of state-owned banks before the end of each
fiscal year.
Using bank ledgers panel data from March 2007 to June 2018, this
study revealed that fiscal dominance through the banks exists and
increasing government’s debt to the banking system has a significant
positive effect on increasing the banks’ debt to the Central Bank in the
form of an overdraft and credit line. As such each 1 billion-Toman
increase in the claims on the government caused a 200 million-Toman
increase in the banks’ debt to the CBI.
The changes in bank's claims on the government have a significant
negative effect on the changes in state-owned banks' debt to the
Central Bank; however, it has a significant positive effect on
privatized and specialized banks. This effect is more highlighted in
specialized and privatized banks, respectively. It is robust to control
variables; hence, the relationship in state-owned banks is rather
different from that of the other banks.
Proving the significance of this relationship implies the necessity of
decreasing the government’s structural budget deficits to control the
inflation arising from increasing the monetary base. To achieve this
goal, various regulations that commit the government to numerous
entities should be reviewed and reformed in a manner that such
liabilities become temporary commitments. The government should
limit them to available permanent resources and stop using the
banking system to implement quasi-fiscal policies. For those
government commitments that cannot be omitted and can only be
financed via bank's borrowing, it should be marketable by issuing debt
securities. This would liquidate the government’s debt and prevent it
880/ The Fiscal Dominance through Banking System: …
from turning into frozen assets. Consequently, it would prevent the
liquidity shortage of the banks; hence, the banks would not need to
refer to the Central Bank to confront liquidity shortages. Hence, the
banks would sell the government's debt securities in the market and
finance the required liquidity needs.
References
Asgharpour, H., Salmani, B., & Niki Oskoui, K. (2015). An Experimental
Analysis of Fiscal Policy in the Iranian Economy: Self-explanatory
Structural Approach. Economic Policymaking, 7(13), 133-162.
Blanchard, O. (2004). Fiscal Dominance and Inflation Targeting: Lessons
from Brazil. National Bureau of Economic Research, Retrieved from
https://www.nber.org/papers/w10389.pdf.
Blommestein, H. J., & Turner, P. (2011). Interactions between Sovereign
Debt Management and Monetary Policy Under Fiscal Dominance and
Financial Instability. Retrieved from
https://papers.ssrn.com/sol3/Delivery.cfm/SSRN_ID1964627_code584482.p
df?abstractid=1964627&mirid=1.
Elbadawi, I., Goaied, M., & Tahar, M. B. (2017). Fiscal-Monetary
Interdependence and Exchange Rate Regimes in Oil Dependent Arab
Economies. Economic Research Forum Working Papers, Retrieved from
http://erf.org.eg/wp-content/uploads/2017/06/1116.pdf
Ersel, H., & Özatay, F. (2008). Fiscal Dominance and Inflation Targeting:
Lessons from Turkey. Emerging Markets Finance and Trade, 44(6), 38-51.
Fratianni, M., & Spinelli, F. (2001). Fiscal Dominance and Money Growth
in Italy: The Long Record. Explorations in Economic History, 38(2), 252-
272.
Gadea, M. D., Sabaté, M., & Sanz, I. (2012). Long-run Fiscal Dominance in
Argentina, 1875-1990. Financial History Review, 19(3), 311-335.
Irwin, T. C. (2015). Defining the Government's Debt and Deficit. Journal of
Economic Surveys, 29(4), 711-732.
Jamshidi, S. (2018) Bank Accounting, Codification of Financial Statements.

Iran. Econ. Rev. Vol. 24, No. 3, 2020 /881
Tehran: Monetary and Banking Research Institute, Central Bank of the
Islamic Republic of Iran.
Tavakkolian, H. (2014). Estimating Fiscal Dominance and Its Welfare Costs,
A Dynamic Stochastic General Equilibrium Model. Bank and Monetary
Researches Quarterly, 7(21), 329-359.
Turner, P. (2011). Fiscal Dominance and the Long-term Interest Rate.
Financial Markets Group Research Centre, Retrieved from
http://www.lse.ac.uk/fmg/workingPapers/specialPapers/PDF/SP199.pdf
Walsh, C. E. (2010). Monetary Theory and Policy. Cambridge, MA: MIT
Press Books.
Zamanzadeh, H., & Djalali Naeini, A. (2011). Fiscal Dominance Modeling
and Fiscal Policy in the Iranian Economy, General Equilibrium Approach.
Bank and Monetary Research Periodical, 5(13), 1-34.
882/ The Fiscal Dominance through Banking System: …
Appendix:
How Off-budgeting Fiscal Dominance Appear in Bank's Balance
Sheet: Case Study of Bank Keshavarzi
The financial statements of Bank Keshavarzi’s during 2017 1and 2018
are examined to analyze the effects of the government’s borrowing
from the banking system. Considering the legal duties and statute of
Bank Keshavarzi, the off-budget operations constantly take place in
this bank, making it an appropriate hotbed for debates and future
studies. The government’s off-budget operations in this bank are
performed in two different ways: 1) granting facilities to the
government for guaranteed purchase of wheat, basic commodities,
agricultural commodities insurance, and its interest, 2) granting
facilities to farmers, backed by the government’s guarantee.
In the first type of off-budget operation (granting facilities to the
government), Bank Keshavarzi has received a special credit line from
CBI for the guaranteed purchase of wheat from the farmers based on
laws. In this regard, debts to CBI appear on the debit side of its
balance sheet and credit to the government is written down on the
credit side of its balance sheet. In this case, since the bank has
received a credit line from CBI, the debt is reflected in CBI’s balance
sheet immediately.
In the second type of off-budgeting operation (government's
backed facilities to farmers), the credit side of the balance sheet is
initially increased by the claims of the private sector, and the debit
side of the balance sheet also increases as a result of increasing
reserves for loan creation. After several periods, the farmers’
defaulted loans are moved under the claims on the government.
Consequently, the composition of the asset side of the balance sheet is
changed at the moment; however, the balance sheet of Bank
Keshavarzi is already expanded.
When the government’s debt to Bank Keshavarzi increases and the
bank faces liquidity shortage, the government should clear or barter its
debt in different ways. This study is written Bank Keshavarzi's
1. In Iran we use Shamsi calendar which starts in the month March of Gregorian calendar. So in this article, Shamsi dates have been converted to Gregorian dates, hence the number of the Gregorian year is coordinated with each Shamsi year.
Iran. Econ. Rev. Vol. 24, No. 3, 2020 /883
statement 2017-2018, in which the debt was cleared by two types of
treasury clearance documents. In the CBI’s balance sheet, Bank
Keshavarzi’s debt to CBI decreases, and the government’s net debt to
CBI increases. Therefore, even though CBI’s balance sheet does not
expand at this moment, but it expanded before as a result of this off-
budgeting mechanisms.
The composition of CBI's balance sheet changes and the
government’s debt to CBI, which is more likely to get prolonged
increases. With decreasing the Bank Keshavarzi’s debt to CBI, it is
possible to repeat this cycle once more, and this mechanism can be
used once more, causing no harm to the beneficiaries as CBI
undergoes more pressure. The existence of fiscal dominance is proved
in this way using a fixed-effect model with unbalanced panel datasets.