the fisheries and aquaculture sector in · pdf filefisheries and aquaculture. the fisheries...
TRANSCRIPT
FISH
ERIE
S A
ND
AQ
UA
CULT
UR
E
The fisheries and aquaculture sector in France
> K
ey fi
gure
s
> EDITION april 2015
Les cahiers de
ProductionFirmsTradeConsumption
SummaryProduction page 3Total sales of fisheries and aquaculture products
Sales of fisheries products at auction
Sales of aquaculture products
Fishing fleet
Aquaculture firms
Jobs
Firms page 15Fishmonger firms
Trading firms
Processing firms
Trade page 19Supply balance
Imports and exports by main species
Imports and exports by presentation
Imports and exports by species group
Imports and exports by geographical area
Consumption page 25Supply balance
Households purchases
Catering purchases
Breakdown of purchases by distribution channel
Les cahiers de FranceAgriMer / The fisheries and aquaculture sector in France / edition 2015 / FranceAgriMer / 12 rue Henri Rol-Tanguy / TSA 20002 / 93555 Montreuil cedex / tél. : +33 1 73 30 30 00 / www.franceagrimer.fr / Directeur de la publication : Éric Allain / Redaction : unité Produits animaux, pêche et aquaculture / Conception and realisation : service Communication FranceAgriMer, studio PAO / N° ISSN 2259-9177 Crédits photos : Institut Maritime de la Prévention, Lionel Flageul - Normapêche Bretagne, Institut des milieux aquatiques, Thierry Guigue, FranceAgriMer / Droits réservés

Production
Les cahiers de FranceAgriMer 2015 / Key figures / FISHERIES AND AQUACULTURE. /3
fishing fleet / aquaculture firms / jobs total sales of fisheries and aquaculture products
>
4/ Fisheries and aquaculture sector in France > EDITION april 2015. © FranceAgriMer 2014 /
Production / landings and aquaculture
Total sales / metropolitan France and overseas territories
by method of production (tons) (3)
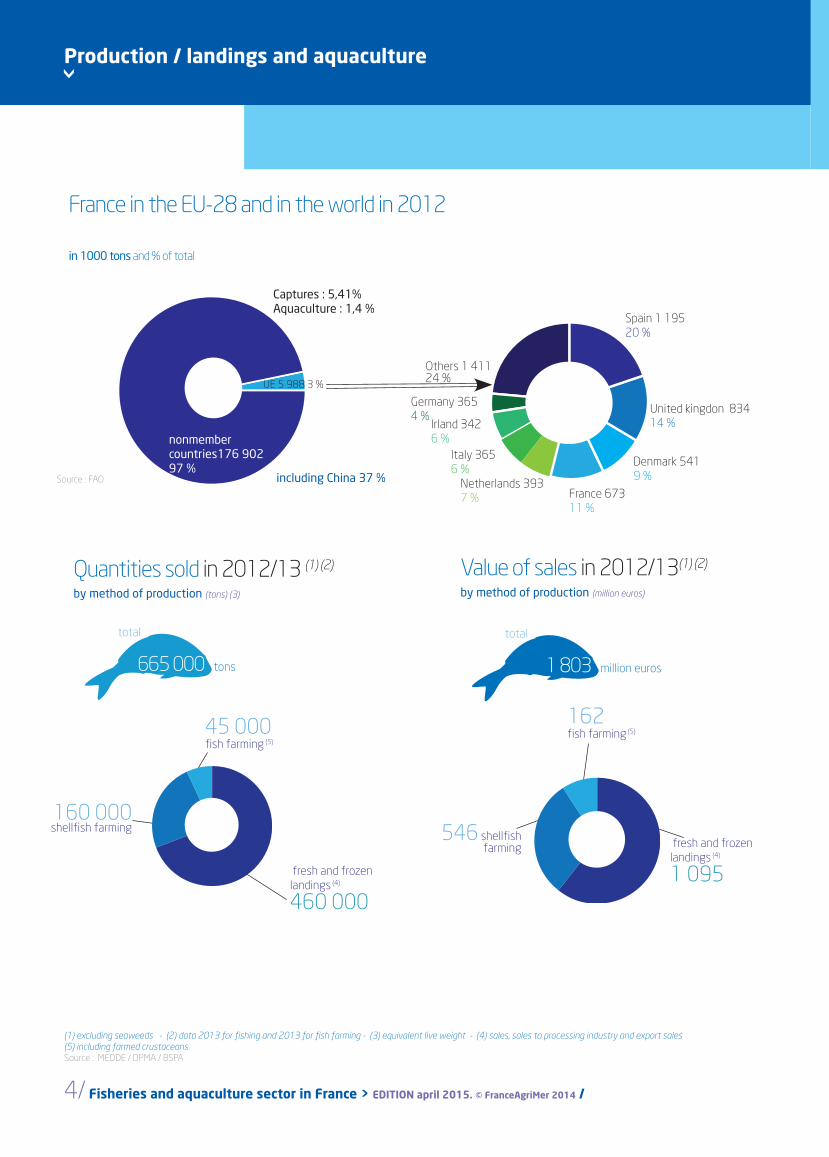
Quantities sold in 2012/13 (1) (2) Value of sales in 2012/13(1) (2)
by method of production (million euros)
total
1 803 million euros
total
665 000 tons
45 000fish farming (5)
160 000 shellfish farming
fresh and frozen landings (4)
460 000
162fish farming (5)
fresh and frozen landings (4)
1 095
546 shellfish farming
(1) excluding seaweeds - (2) data 2013 for fishing and 2013 for fish farming - (3) equivalent live weight - (4) sales, sales to processing industry and export sales(5) including farmed crustaceans Source : MEDDE / DPMA / BSPA
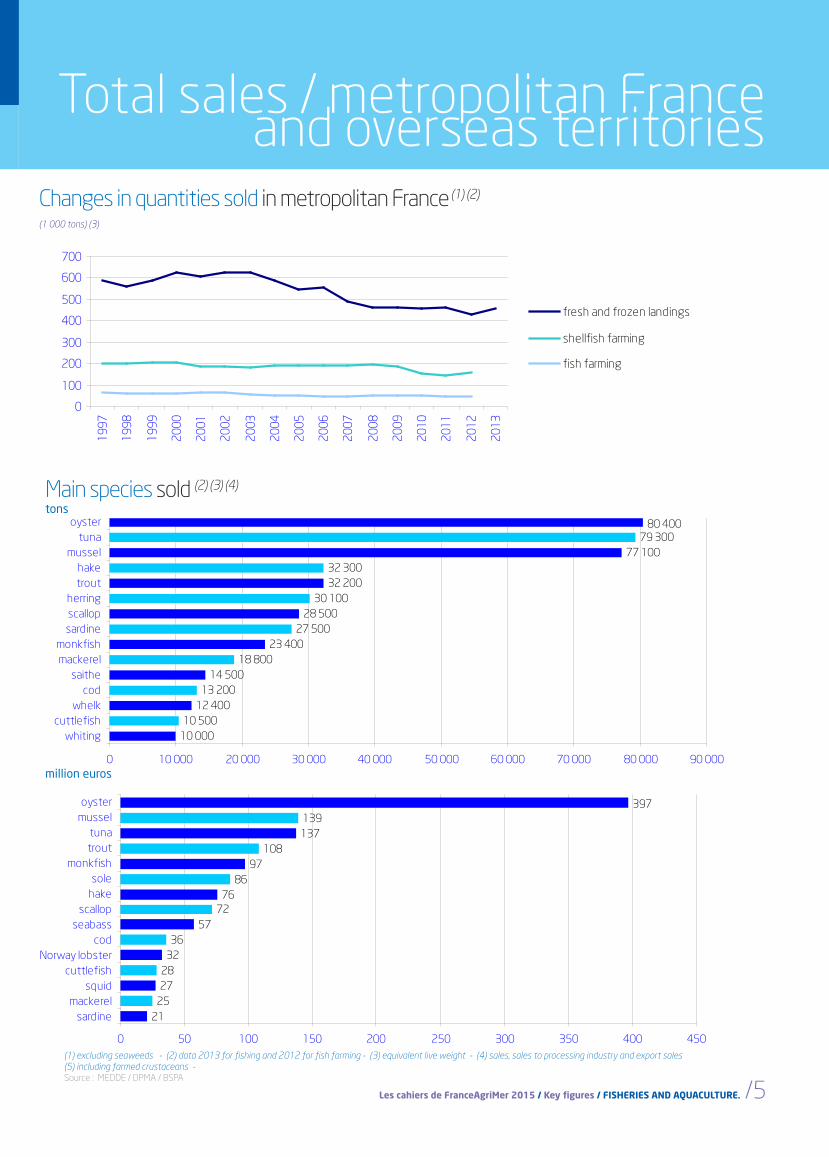
21252728
3236
5772
7686
97108
137139
397
0 50 100 150 200 250 300 350 400 450
sardinemackerel
squidcuttlefish
Norway lobstercod
seabassscallop
hakesole
monkfishtrouttuna
musseloyster
Captures : 5,4 %Aquaculture : 1,5 %
Pays-tiers : 171 980
France in the EU-28 and in the world in 2012
in 1000 tons and % of total
Captures : 5,41%Aquaculture : 1,4 %
nonmember countries176 90297 %
UE 5 988 3 %
including China 37 %Source : FAO
Spain 1 195 20 %
United kingdon 83414 %
Denmark 541 9 %
Netherlands 3937 %
Others 1 41124 %
France 67311 %
Italy 3656 %
Irland 342 6 %
Germany 3654 %
Les cahiers de FranceAgriMer 2015 / Key figures / FISHERIES AND AQUACULTURE. /5
0
100
200
300
400
500
600
700
1997
1998
1999
2000
2001
2002
2003
2004
2005
2006
2007
2008
2009
2010
2011
2012
2013
fresh and frozen landings
shellfish farming
fish farming
Total sales / metropolitan France and overseas territories
Value of sales in 2012/13(1) (2)
Main species sold (2) (3) (4)
tons
(1) excluding seaweeds - (2) data 2013 for fishing and 2012 for fish farming - (3) equivalent live weight - (4) sales, sales to processing industry and export sales(5) including farmed crustaceans - Source : MEDDE / DPMA / BSPA
Changes in quantities sold in metropolitan France (1) (2)
(1 000 tons) (3)
million euros
10 00010 500
12 40013 200
14 50018 800
23 40027 500
28 50030 100
32 20032 300
77 10079 300
80 400
0 10 000 20 000 30 000 40 000 50 000 60 000 70 000 80 000 90 000
whitingcuttlefish
whelkcod
saithemackerelmonkfish
sardinescallopherring
trouthake
musseltuna
oyster
21252728
3236
5772
7686
97108
137139
397
0 50 100 150 200 250 300 350 400 450
sardinemackerel
squidcuttlefish
Norway lobstercod
seabassscallop
hakesole
monkfishtrouttuna
musseloyster
>
6/ Fisheries and aquaculture sector in France > EDITION april 2015. © FranceAgriMer 2014 /
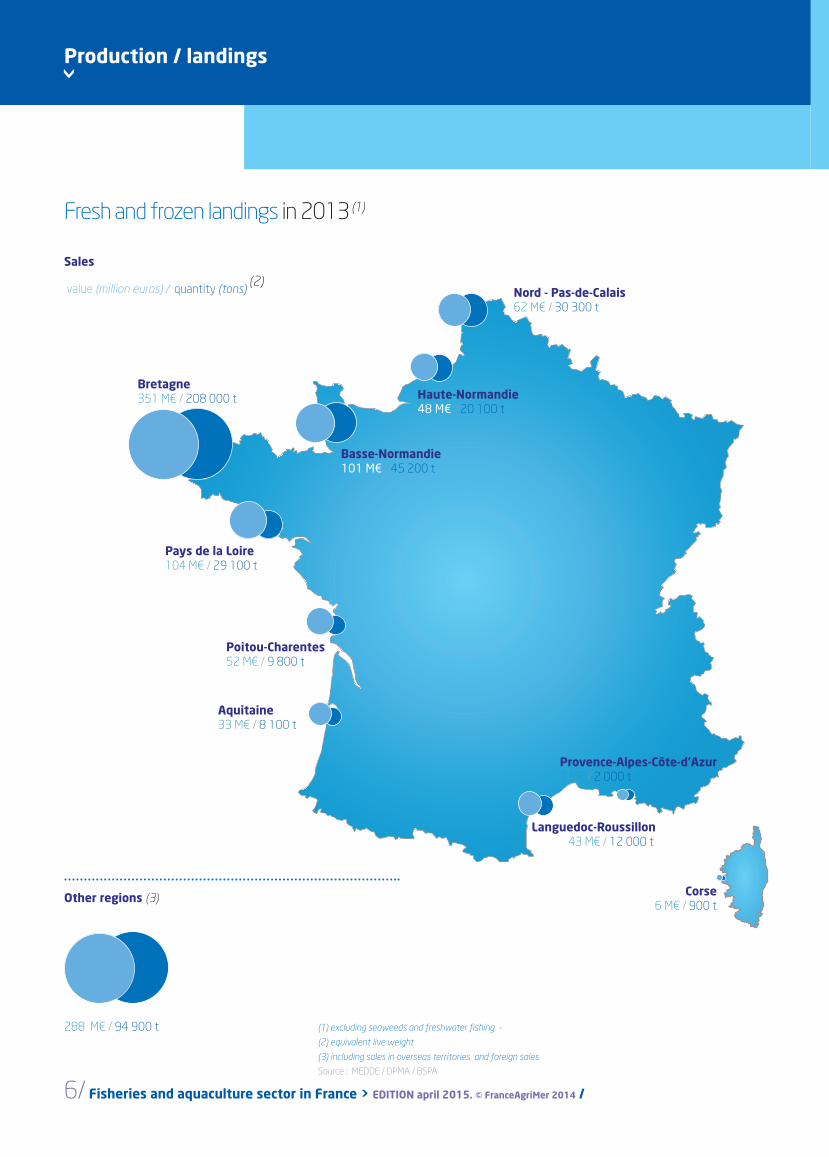
Production / landings
Fresh and frozen landings in 2013 (1)
Sales
value (million euros) / quantity (tons) (2)
Other regions (3)
288 M¤ / 94 900 t
Nord - Pas-de-Calais62 M€ / 30 300 t
Haute-Normandie 48 M€ / 20 100 t
Basse-Normandie101 M€ / 45 200 t
Bretagne351 M€ / 208 000 t
Pays de la Loire104 M€ / 29 100 t
Poitou-Charentes52 M€ / 9 800 t
Aquitaine33 M€ / 8 100 t
Languedoc-Roussillon 33 M€ 43 M€ / 12 000 t
Provence-Alpes-Côte-d’Azur7 M€ / 2 000 t
Corse6 M€ / 900 t
(1) excluding seaweeds and freshwater fishing -
(2) equivalent live weight
(3) including sales in overseas territories and foreign sales
Source : MEDDE / DPMA / BSPA

Les cahiers de FranceAgriMer 2015 / Key figures / FISHERIES AND AQUACULTURE. /7
Sales of fishery products
Sales of fishery products at auction in 2014
Source : Ric / FranceAgriMer
Number of auctions in 2014 : 38
Douarnenez
Audierne
St GuénoléLe Guilvinec
Dunkerque
Boulogne-sur-Mer
DieppeFécamp
Grandcamp
St Quay Portrieux
Roscoff
BrestPort en Bessin
ErquyConcarneau
Granville
Cancale
Cherbourg
St Malo
Île d’Yeu
La Rochelle
St Gilles Croix de Vie
La Turballe
Port de BoucAgde
SèteLe Grau du Roi
LorientQuiberon
Sables d’Olonne
Île d’Oléron
Royan
Arcachon
St Jean de Luz
Port La Nouvelle
NoirmoutierLe Croisic
Loctudy
value of sales 613 million euros
Sales by French vessels
quantities sold
200 900 tons
value of sales 23 million euros
Sales by foreign-registered vessels
quantities sold
8 300 tons

>
8/ Fisheries and aquaculture sector in France > EDITION april 2015. © FranceAgriMer 2014 /
Sales of fishery products
Source : Ric / FranceAgriMer
Quantities sold and value of sales by french vessels at the main auctions in 2014
quantities sold (tons) value of sales (1 000 euros)
> Production / sales at auction
6983 001
1 5142 818
1 83610 756
2 041976
5 0852 086
3 3778 176
9771 8731 835
8 6221 055
18 9955 432
2 8639 684
17 4511 151
4 6501 442
6 21110 499
12 486137
1 1987 861
5 2471 669
8 5563 2333 193
21 1121 151
1 05913 468
5 68710 810
5 67128 178
13 4428 068
26 2959 609
6 29938 027
6 62512 11412 186
20 3504 238
57 04320 894
10 67719 019
64 1146 884
4 2946 823
21 29024 423
31 582464
3 17515 344
13 1993 557
21 6168 149
9 21942 554
6 437
0 10 000 20 000 30 000 40 000 50 000 60 000 70 000
Port de BoucLe Grau du Roi
SèteAgde
Port la NouvelleSaint Jean de Luz
ArcachonRoyanOléron
La RochelleLes Sables d'Olonne
Saint Gilles Croix de VieIle d'Yeu
NoirmoutierLe Croisic
La TurballeQuiberon
LorientConcarneau
LoctudyLe Guilvinec
Saint GuénoléAudierne
DouarnenezBrest
RoscoffSaint Quay Portrieux
ErquySaint Malo
CancaleGranville
CherbourgGrandcamp
Port en BessinFécampDieppe
Boulogne-sur-MerDunkerque
Les cahiers de FranceAgriMer 2015 / Key figures / FISHERIES AND AQUACULTURE. /9
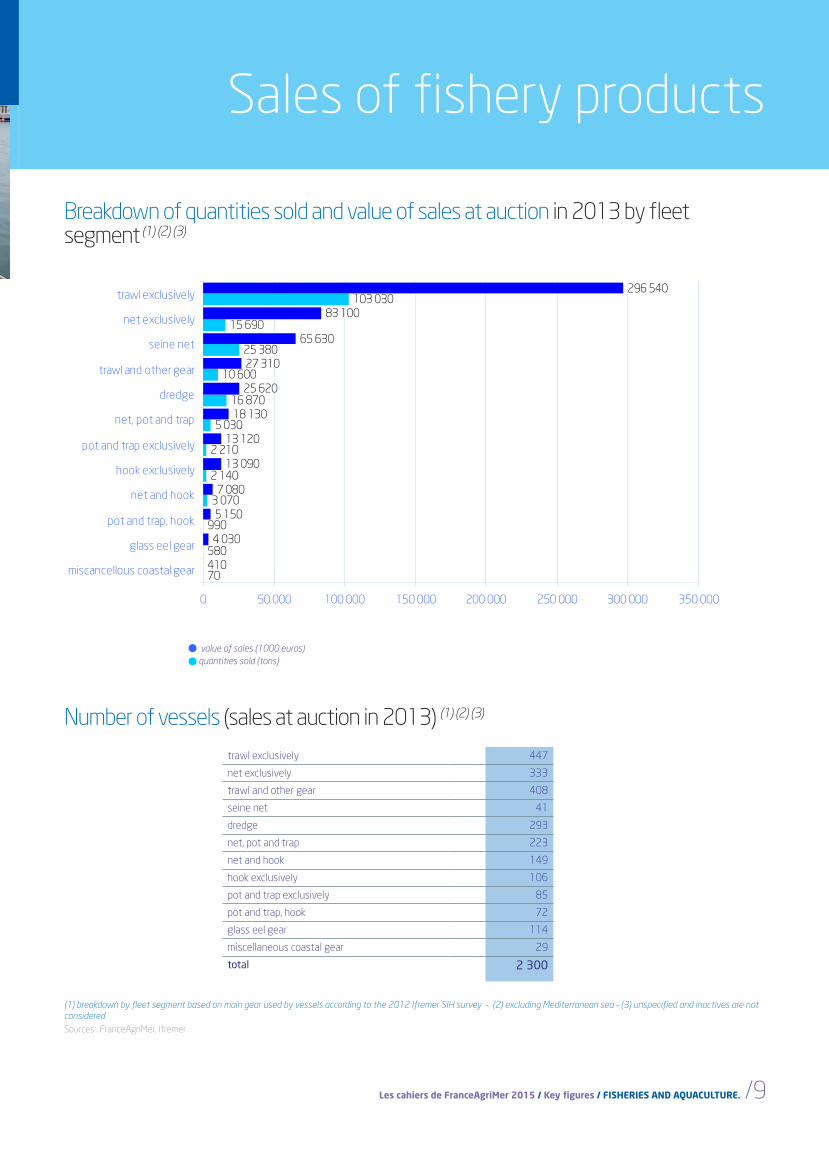
Sales of fishery products
quantities sold (tons)
Breakdown of quantities sold and value of sales at auction in 2013 by fleet segment (1) (2) (3)
(1) breakdown by fleet segment based on main gear used by vessels according to the 2012 Ifremer SIH survey - (2) excluding Mediterranean sea - (3) unspecified and inactives are not considered
quantities sold (tons) value of sales (1 000 euros)
Number of vessels (sales at auction in 2013) (1) (2) (3)
trawl exclusively 447
net exclusively 333
trawl and other gear 408
seine net 41
dredge 293
net, pot and trap 223
net and hook 149
hook exclusively 106
pot and trap exclusively 85
pot and trap, hook 72
glass eel gear 114
miscellaneous coastal gear 29
total 2 300
Sources : FranceAgriMer, Ifremer
value of sales (1000 euros)
70
580
990
3 070
2 140
2 210
5 030
16 870
10 600
25 380
15 690
103 030
410
4 030
5 150
7 080
13 090
13 120
18 130
25 620
27 310
65 630
83 100
296 540
0 50 000 100 000 150 000 200 000 250 000 300 000 350 000
miscancellous coastal gear
glass eel gear
pot and trap, hook
net and hook
hook exclusively
pot and trap exclusively
net, pot and trap
dredge
trawl and other gear
seine net
net exclusively
trawl exclusively

>
10/ Fisheries and aquaculture sector in France > EDITION april 2015. © FranceAgriMer 2014 /
0
100
200
300
400
500
600
700
800
900
20012002 20032004 20052006 20072008 20092010 20112012 20132014
cephalopodsbivalvescrustaceanstuna and small pelagicsother fish
7 5608 5008 7609 0609 5709 9209 93010 120
11 70013 270
14 52015 850
22 80024 990
33 28039 620
43 05043 830
62 78068 620
0 10 000 20 000 30 000 40 000 50 000 60 000 70 000 80 000
turbotwhelk
seabreamanchovy
codhaddock
red mulletmackerel
pollacksardine
John Dorywhiting
cuttlefishsquid
Norway lobsterscallop
seabasshakesole
monkfish
5301 020
1 4201 570
2 8402 9703 040
3 7104 4804 730
5 3805 6905 930
6 4507 250
8 64013 250
14 48017 040
17 590
0 5 000 10 000 15 000 20 000
turbotseabrea
John Doryred
pollackNorway
codseabass
whelksquid
haddockanchovy
solecuttlefismackerel
whitingmonkfish
scallopsardine
hake
Production / sales at auction
Sales of aquaculture products in metropolitan France
Sales of fishery products
Main species sold at auction by French vessels in 2014
Changes in quantities sold by the French vessels by species group (1 000 tons)
Changes in value of sales by the French vessels by species group (million euros)
Value of sales (1 000 euros)Quantities sold (tons)
Source : Ric / FranceAgriMer
mussel
77 000
0
50
100
150
200
250
300
350
20012002200320042005200620072008200920102011201220132014
cephalopodsbivalvescrustaceanstuna and small pelagicsother fish

Les cahiers de FranceAgriMer 2015 / Key figures / FISHERIES AND AQUACULTURE. /11
0
100
200
300
400
500
600
700
800
900
20012002 20032004 20052006 20072008 20092010 20112012 20132014
cephalopodsbivalvescrustaceanstuna and small pelagicsother fish
7 5608 5008 7609 0609 5709 9209 93010 120
11 70013 270
14 52015 850
22 80024 990
33 28039 620
43 05043 830
62 78068 620
0 10 000 20 000 30 000 40 000 50 000 60 000 70 000 80 000
turbotwhelk
seabreamanchovy
codhaddock
red mulletmackerel
pollacksardine
John Dorywhiting
cuttlefishsquid
Norway lobsterscallop
seabasshakesole
monkfish
Sales of aquaculture products in metropolitan France
Shellfish farming
Fish farming
Quantities sold for consumption (tons) (1) Value of sales (million euros)
total sales
546 million euros
total sales
159 600 tons
Quantities sold in 2012 (tons) (1) (3) Value of sales in 2012 (million euros)
(1) equivalent live weight - (2) excluding grant aids - (3) total sales ( consumption, repopulation, recreational fishing, sales to another farmer (4) including farmed crustaceans
total sales
162 million euros
2 100other bivalves
oyster
80 000mussel
77 000
10other bivalves
oyster (2)
397
mussel
139
5 000seabass, seabream and other marine fish
trout and salmon
32 200
carp and other freshwater fish (3)
8 200
37seabass, seabream and other marine fish
trout and salmon
108
carp and other freshwater fish (4)
17
Source : MEDDE / DPMA / BSPA (aquaculture survey 2012)
total sales
45 400

>
12/ Fisheries and aquaculture sector in France > EDITION april 2015. © FranceAgriMer 2014 /
0
1 000
2 000
3 000
4 000
5 000
6 000
1995
1996
1997
1998
1999
2000
2001
2002
2003
2004
2005
2006
2007
2008
2009
2010
2011
2012
2013
2014
Fishing fleet / Aquaculture firmsProduction
Fishing fleet in 2014
Breakdown of total vessels by length (metropolitan France) Breakdown of total vessels by fishery category (metropolitan France) (1)
Small scale fisheries out of port ≤ 24 hours Coastal fisheries 24 hours < out of port ≤ 96 hours Offshore fisheries out of port > 96 hours High seas fisheries vessels over 1 000 GRT (gross register tonnage) or vessels over 150 GRT if out of port > 20 days
Total France
7 121 vessels
Source : MEDDE / DAM /SDSIM (Fichier BARPOP)
4 472metropolitan France 2 649overseas
territories
2 763
817 704
147 410
500
1 000
1 500
2 000
2 500
3 000
less than10 meters
from 10 to< 12
meters
from 12 to< 24
meters
from 24 to< 40
meters
more than40 meters
3 253
457 27028 17
0500
1 0001 5002 0002 5003 0003 500
small scalefisheries
coastalfisheries
offshorefisheries
hight seasfisheries
bothaquaculture
and smallscale
fisheries
Les cahiers de FranceAgriMer 2015 / Key figures / FISHERIES AND AQUACULTURE. /13
0
1 000
2 000
3 000
4 000
5 000
6 000
1995
1996
1997
1998
1999
2000
2001
2002
2003
2004
2005
2006
2007
2008
2009
2010
2011
2012
2013
2014
Fishing fleet / Aquaculture firms
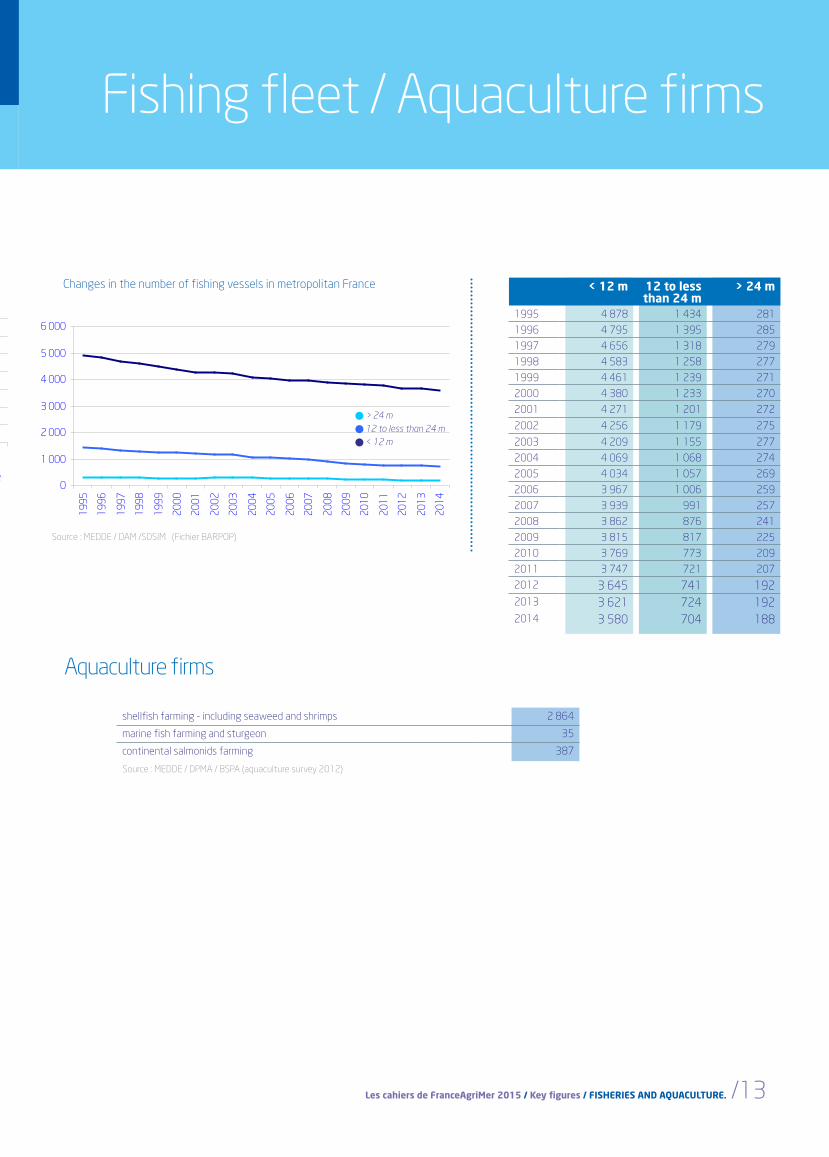
Aquaculture firms
Breakdown of total vessels by fishery category (metropolitan France) (1)
Changes in the number of fishing vessels in metropolitan France
shellfish farming - including seaweed and shrimps 2 864
marine fish farming and sturgeon 35
continental salmonids farming 387
Source : MEDDE / DPMA / BSPA (aquaculture survey 2012)
Source : MEDDE / DAM /SDSIM (Fichier BARPOP)
> 24 m 12 to less than 24 m < 12 m
3 253
457 27028 17
0500
1 0001 5002 0002 5003 0003 500
small scalefisheries
coastalfisheries
offshorefisheries
hight seasfisheries
bothaquaculture
and smallscale
fisheries
< 12 m 12 to less than 24 m
> 24 m
1995 4 878 1 434 281
1996 4 795 1 395 285
1997 4 656 1 318 279
1998 4 583 1 258 277
1999 4 461 1 239 271
2000 4 380 1 233 270
2001 4 271 1 201 272
2002 4 256 1 179 275
2003 4 209 1 155 277
2004 4 069 1 068 274
2005 4 034 1 057 269
2006 3 967 1 006 259
2007 3 939 991 257
2008 3 862 876 241
2009 3 815 817 225
2010 3 769 773 209
2011 3 747 721 207
2012 3 645 741 1922013 3 621 724 1922014 3 580 704 188

14/ Fisheries and aquaculture sector in France > EDITION april 2015. © FranceAgriMer 2014 /
JobsNumber of seamen employed on board French fishing vessels in 2012 (seamen of all nationalities)
> Production
Metropolitan France
16 777Total France
Number of full time equivalent jobs in 2011 (1)
Regional sharing13 309metropolitan France
overseas territories
3 168
Languedoc-Roussillon 1 077
Haute-Normandie 616
Basse-Normandie 1 404
Pays de la Loire 1 172
Poitou-Charentes 783
Aquitaine 1 480
Provence-Alpes-Côte d’Azur 907
Bretagne 4 823
Corse 309
less than 1 000between 1 000 and 2 000between 2 000 and 5 000more than 5 000
overseas territories 3 168
Source : MEDDE/DAM/SDSIM
jobs FTEJshellfish farming 17 715 8 574marine fish farming and sturgeon 648 602continental salmonids farming 1 762 1 263
(1) including seasonal jobs
Source : MEDDE/DPMA/BSPA (aquaculture survey 2012)
Nord - Pas-de-Calais - Picardie 968
7 461
2 690
3 246
981
4 779
0
1 000
2 000
3 000
4 000
5 000
6 000
7 000
8 000
smal
l sca
le fi
sher
ies
coas
tal f
isher
ies
offs
hore
fish
erie
s
high
seas
fish
erie
sbo
th a
quac
ultu
re a
nd s
mall
scale
fish
erie
s
fishmonger's / trading / processing by sales / by region
Firms
Les cahiers de FranceAgriMer 2015 / Key figures / FISHERIES AND AQUACULTURE. /15

>
16/ Fisheries and aquaculture sector in France > EDITION april 2015. © FranceAgriMer 2014 /
Trading firmsfirms
Fishmonger's in 2014
2 926
number of establishments net sales
1 135 million euros
7 475
full time equivalent jobs
Sources : Via.Aqua and Proteis for FranceAgriMer
Number of establishments per region
moins de 50de 50 à 150de 150 à 250plus de 250
Languedoc-Roussillon 292
Haute-Normandie 99
Île-de-France 373
Alsace 12
Franche-Comté 16
Lorraine 29
Basse-Normandie 116Champagne-Ardenne 23
Limousin 21
Picardie 56
Nord - Pas-de-Calais 144
Provence-Alpes-Côte d’Azur 372
Bretagne 326
Bourgogne 22
Rhône-Alpes 100
Auvergne 30
Midi-Pyrénées 131
Centre 57
Pays de la Loire 226
Poitou-Charentes 213
Aquitaine 239
Corse 29
Fishmonger firms
Les cahiers de FranceAgriMer 2015 / Key figures / FISHERIES AND AQUACULTURE. /17
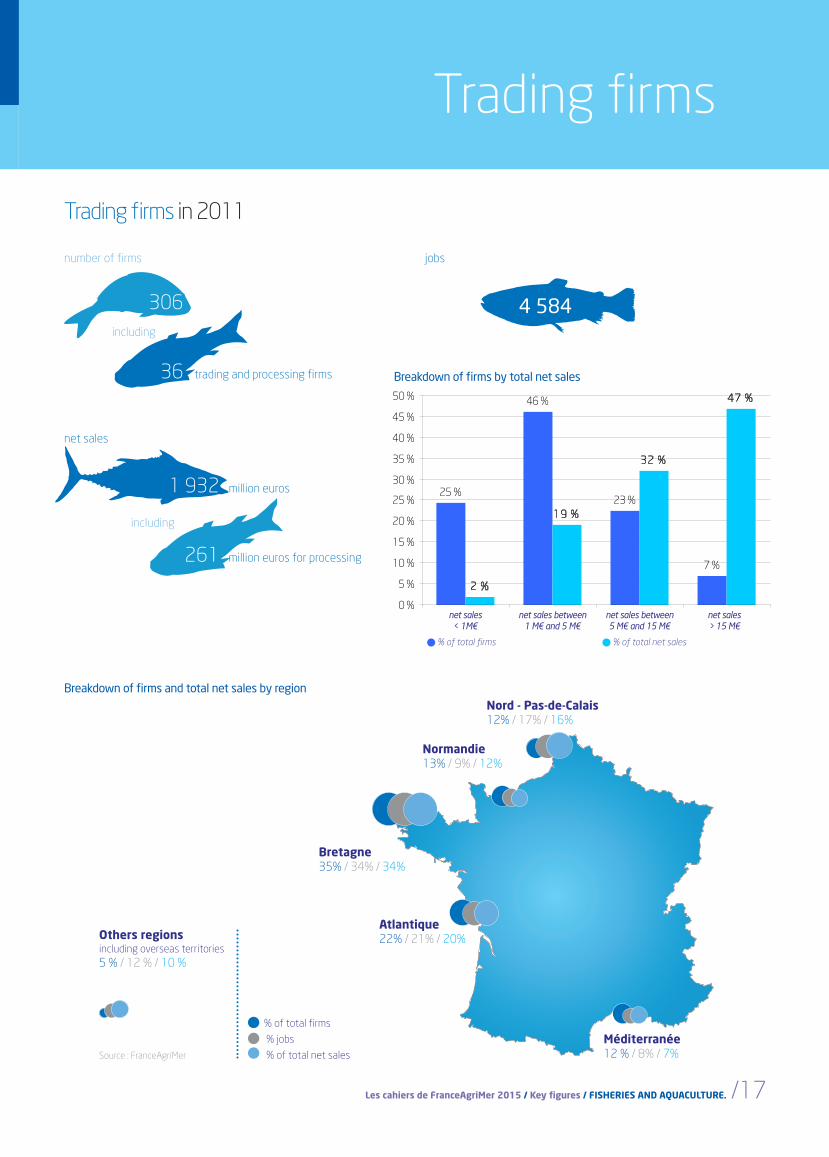
Trading firms
Trading firms in 2011
306
number of firms
36 trading and processing firms
including
4 584
jobs
Breakdown of firms and total net sales by region
% of total firms
Breakdown of firms by total net sales
% of total net sales
1 932 million euros
net sales
261 million euros for processing
including
net sales between 5 M€ and 15 M€
net sales between 1 M€ and 5 M€
net sales > 15 M€
net sales < 1M€
Nord - Pas-de-Calais 12% / 17% / 16%
Normandie 13% / 9% / 12%
Bretagne 35% / 34% / 34%
Atlantique 22% / 21% / 20%
Méditerranée 12 % / 8% / 7%
% of total firms
% jobs
% of total net sales
Others regionsincluding overseas territories5 % / 12 % / 10 %
Source : FranceAgriMer
25 %
46 %
23 %
7 %
2 %
19 %
32 %
47 %
0 %
5 %
10 %
15 %
20 %
25 %
30 %
35 %
40 %
45 %
50 %
CA < 1 M€ CA de 1 M€ à 5 M€ CA de 5 M€ à 15M€
CA > 15 M€
>
18/ Fisheries and aquaculture sector in France > EDITION april 2015. © FranceAgriMer 2014 /
firms
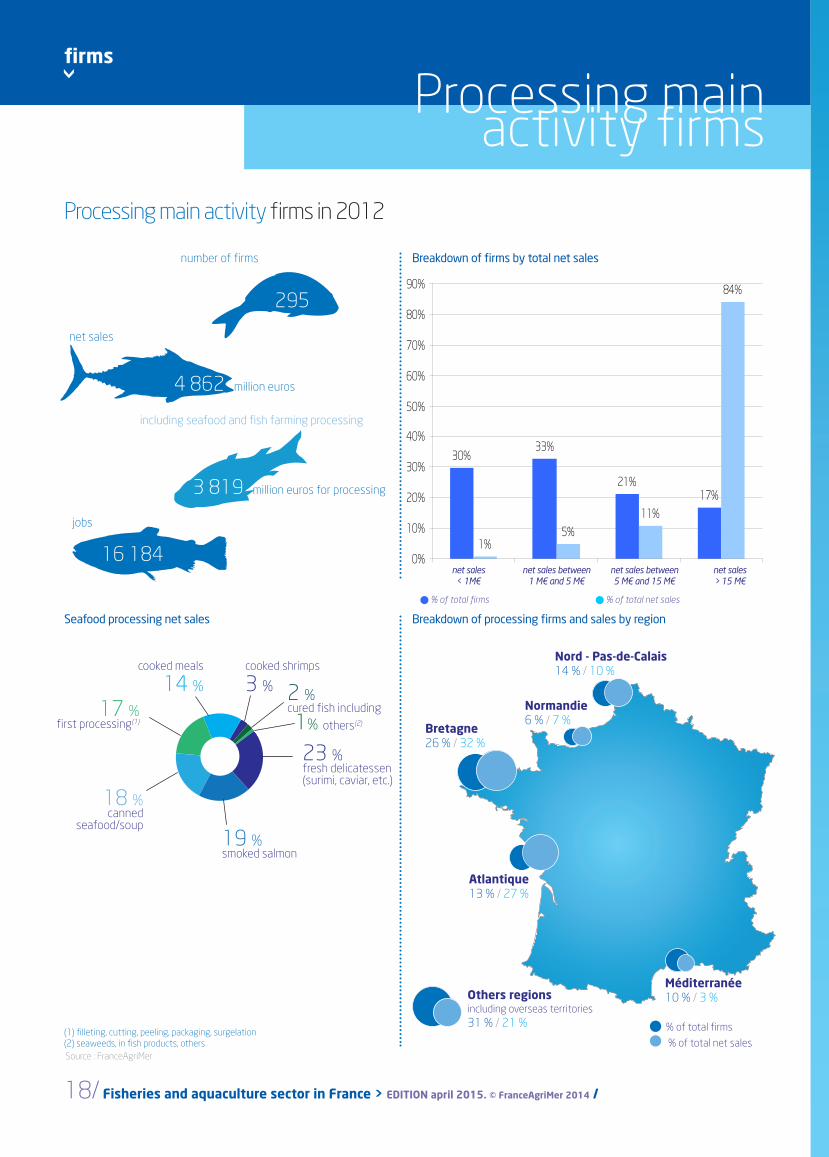
Processing main activity firms
Seafood processing net sales
Processing main activity firms in 2012
Breakdown of processing firms and sales by region
cooked shrimps
3 %cooked meals
14 %17 %
first processing(1)
18 %canned
seafood/soup
23 %fresh delicatessen (surimi, caviar, etc.)
1% others(2)
19 %smoked salmon
Source : FranceAgriMer
(1) filleting, cutting, peeling, packaging, surgelation(2) seaweeds, in fish products, others
295
number of firms
16 184
jobs
% of total firms
Breakdown of firms by total net sales
% of total net sales
% of total firms
% of total net sales
net sales between 5 M€ and 15 M€
net sales between 1 M€ and 5 M€
net sales > 15 M€
net sales < 1M€
Others regionsincluding overseas territories31 % / 21 %
Nord - Pas-de-Calais 14 % / 10 %
Normandie 6 % / 7 %
Bretagne 26 % / 32 %
Atlantique 13 % / 27 %
Méditerranée 10 % / 3 %
4 862 million euros
net sales
3 819 million euros for processing
including seafood and fish farming processing
2 %cured fish including
30%33%
21%17%
1%5%
11%
84%
0%
10%
20%
30%
40%
50%
60%
70%
80%
90%
CA < 1 M€ CA de 1 à 5 M€ CA de 5 à 15 M€ CA > 15 M€

imports / exports by presentation / by species / by geographical origine / main species
Trade
Les cahiers de FranceAgriMer 2015 / Key figures / FISHERIES AND AQUACULTURE. /19
% of total firms
% of total net sales
Méditerranée 10 % / 3 %

>
20/ Fisheries and aquaculture sector in France > EDITION april 2015. © FranceAgriMer 2014 /
Trade
Supply balance Imports and exports / metropolitan France and overseas territories
Net weight (1 000 tons)
Source : French customs
Value (million euros)
Live weight (1 000 tons)
Supply balance in 2013
-1 200
-1 000
-800
-600
-400
-200
0
200
400
exportations
importations
300400
200
0
- 200
- 400
- 600
- 800
- 1 000
- 1 200- 1 090
-2 500
-2 000
-1 500
-1 000
-500
0
500
1 000
exportations
importations
1 000
500
0
- 500
- 1000
- 1 500
- 2 000
- 2 500 - 2 070
540
2 000
1 000
0
- 1 000
- 2 000
- 3 000
- 4 000
- 5 000
- 6000-6 000
-5 000
-4 000
-3 000
-2 000
-1 000
0
1 000
2 000
balance
importations
exportations
1 350
- 3 660- 5 010
Source : Douanes françaises

Les cahiers de FranceAgriMer 2015 / Key figures / FISHERIES AND AQUACULTURE. /21
4851585963777887
139200211
369587
7691 003
0 200 400 600 800 1 000 1 200
seabreamhake
cephalopodsmackerel
Norway lobstersardinemussel
crablobster
saithe, pollackscallop
codtuna
shrimpsalmon
Imports - main species in 2014
Exports - main species in 2014
Source : French customs
Value (million euros)
Value (million euros)
Imports and exports / metropolitan France and overseas territories
17182020
24272729
3339
4863
104152
176
0 50 100 150 200
anchovycod
seabassmonkfish
troutsolecrab
hakescalloplobster
cephalopodsoystershrimp
tunasalmon

>
22/ Fisheries and aquaculture sector in France > EDITION april 2015. © FranceAgriMer 2014 /
191
64
25
50
207
0 50 100 150 200 250
non food use
bivalves and cephalopods
crustaceans
trout, salmon, eel and fresh water fish
marine fish
171
323
177
246
1 157
0 200 400 600 800 1 000 1 200 1 400
non food use
bivalves andcephalopods
crustaceans
trout, salmon, eel andfresh water fish
marine fish
143
958
172
1 973
1 761
0 500 1 000 1 500 2 000 2 500
non food use
canned
salted, dried, smoked
frozen
live, fresh, chilled
171
460
70
922
451
0 200 400 600 800 1 000
non food use
canned
salted, dried, smoked
frozen
live, fresh, chilled
>
Trade / aquatic products
Imports by volume (1 000 tons) Imports by value (million euros)
Imports by presentation in 2014
(1) data collection methodology is detailed on inside back cover - Source : French customs
Imports by volume (1 000 tons) Imports by value (million euros)
Imports by species group in 2014
net weight
Imports and exports / metropolitan France and overseas territories
live weight (1)
net weightlive weight (1)
143
483
1 088
1 084
2 209
0 500 1 000 1 500 2 000 2 500
non food use
bivalves andcephalopods
crustaceans
trout, salmon, eel andfresh water fish
marine fish

Les cahiers de FranceAgriMer 2015 / Key figures / FISHERIES AND AQUACULTURE. /23
191
64
25
50
207
0 50 100 150 200 250
non food use
bivalves and cephalopods
crustaceans
trout, salmon, eel and fresh water fish
marine fish
191
56
12
156
122
0 50 100 150 200 250
non food use
canned
salted, dried, smoked
frozen
live, fresh, chilled
143
958
172
1 973
1 761
0 500 1 000 1 500 2 000 2 500
non food use
canned
salted, dried, smoked
frozen
live, fresh, chilled
Imports and exports / metropolitan France and overseas territories
Exports by presentation in 2014
(1) data collection methodology is detailed on inside back cover - Source : French customs
Exports by volume (1 000 tons) Exports by value (million euros)
Exports by species group in 2014Exports by volume (1 000 tons) Exports by value (million euros)
132
176
69
392
582
0 100 200 300 400 500 600 700
non food use
canned
salted, dried, smoked
frozen
live, fresh, chilled
132
201
175
226
619
0 100 200 300 400 500 600 700
non food use
bivalves and cephalopods
crustaceans
trout, salmon, eel and fresh water fish
marine fish
net weightlive weight (1)
net weightlive weight (1)
>
24/ Fisheries and aquaculture sector in France > EDITION april 2015. © FranceAgriMer 2014 /
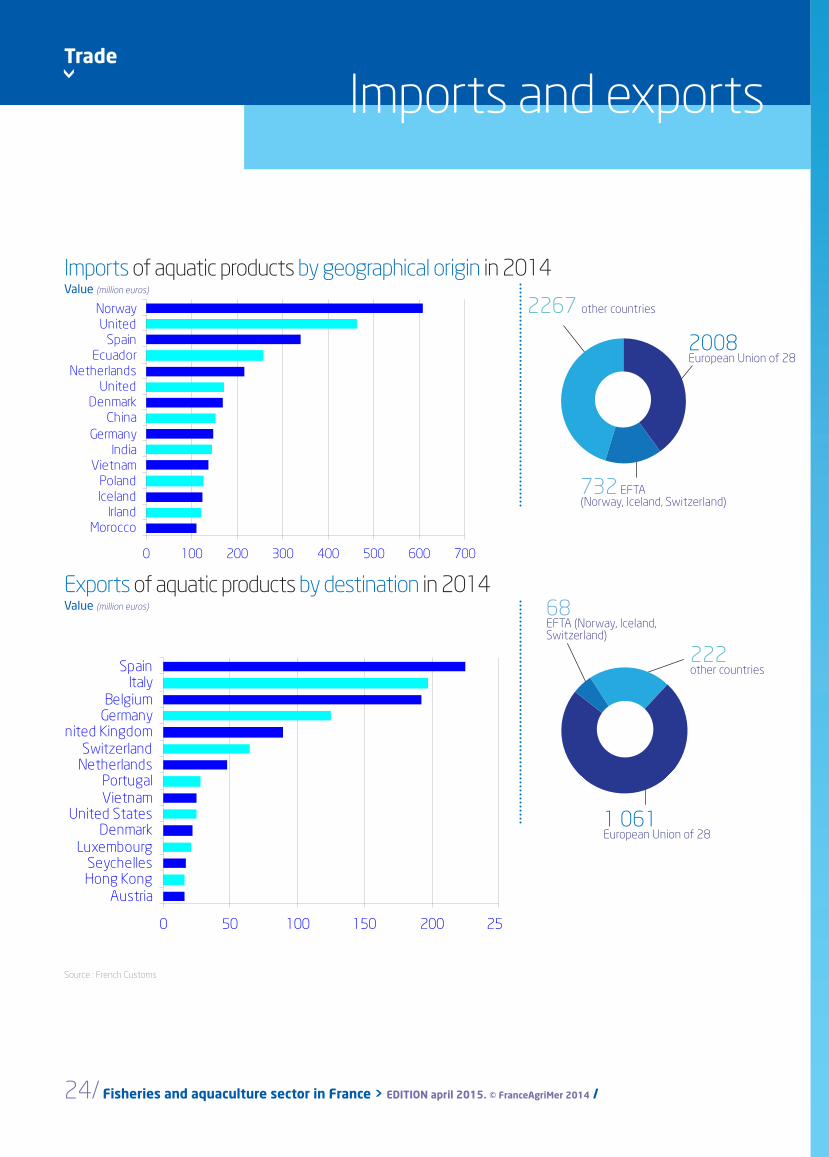
Trade
Imports of aquatic products by geographical origin in 2014
Exports of aquatic products by destination in 2014
Source : French Customs
Value (million euros)
Value (million euros)
Imports and exports
2008European Union of 28
2267 other countries
732 EFTA (Norway, Iceland, Switzerland)
1 061European Union of 28
222other countries
68EFTA (Norway, Iceland,Switzerland)
0 100 200 300 400 500 600 700
MoroccoIrland
IcelandPoland
VietnamIndia
GermanyChina
DenmarkUnited
NetherlandsEcuador
SpainUnited
Norway
0 50 100 150 200 250
AustriaHong KongSeychelles
LuxembourgDenmark
United StatesVietnamPortugal
NetherlandsSwitzerland
United KingdomGermanyBelgium
ItalySpain

supply balance / purchases households / catering / breakdown of purchases by distribution channel
Consumption
Les cahiers de FranceAgriMer 2015 / Key figures / FISHERIES AND AQUACULTURE. /25
2008European Union of 28

>
26/ Fisheries and aquaculture sector in France > EDITION april 2015. © FranceAgriMer 2014 /
Consumption / supply balance
Supply balance in 2014 (1) (2) (3)
Balance changes in production, imports and exports (1) (2) (3)
production (4) supply bilanexportationsimportations
(1) data collection methodology is detailed on inside back cover - (2) live weight - (3) excluding non food use - (4) estimates for2014 - Source : FranceAgriMer
in volume (1 000 tons) in value (million euros)
(1 000 tons)
imports production (4)
exports
Supply balance
production (4) supply bilanexportationsimportations
0
500
1 000
1 500
2 000
2 500
1999 2000 2001 2002 2003 2004 2005 2006 2007 2008 2009 2010 2011 2012 2013 2014
660
1 900
-350
2 210
-500
0
500
1 000
1 500
2 000
2 500
1 788
4 860
-1 220
5 420
-2 000
-1 000
0
1 000
2 000
3 000
4 000
5 000
6 000

Les cahiers de FranceAgriMer 2015 / Key figures / FISHERIES AND AQUACULTURE. /27
(1) data collection methodology is detailed on inside back cover - (2) live weight - (3) average 2011-2013 - Source : FranceAgriMer
Breakdown by products in 2013 (1) (2)
11 %shellfish from captures
58 %finfish from captures
12 %farmed shellfish
19 % farmed finfish
35 kg
Average annual consumptionper capita (2) (3)
Supply balance
(kg)
Changes in supply balance (1) (2)
total finfish shellfish (bivalves, crustaceans
and cephalopods)
Average growth rate over the last ten years 1%
0
5
10
15
20
25
30
35
40
1999 2000 2001 2002 2003 2004 2005 2006 2007 2008 2009 2010 2011 2012 2013
poissons coquillages, crustacés et céphalopodes total

28/ Fisheries and aquaculture sector in France > EDITION april 2015. © FranceAgriMer 2014 /
0%
20%
40%
60%
80%
100%
120%
produits frais produits traiteurréfrigérés (3)
conserves produits surgelés
Percentage of purchasing households in 2014 (2)
32 %chilled delicatessen
frozen products
20 %
canned products
15 %
33 %fresh products
fresh products chilled canned products frozen products delicatessen (3)
79 %
96 % 95 %87 %
Households spending in 2014 (1)
(1) data collection methodology is detailed on inside back cover - (2) a purchasing households buys the product at least once a year - (3) with bar code -Source : FranceAgriMer following Kantar Worldpanel
total
7 065 million euros
> Consumption / households purchases
Purchases by French households for home consumption

Les cahiers de FranceAgriMer 2015 / Key figures / FISHERIES AND AQUACULTURE. /29
Purchases of aquatic products by french households for home consumption in 2014(1)
Fresh products
Canned products
Chilled delicatessen
Frozen products
Purchases by French households for home consumption
(1) data collection methodology is detailed on inside back cover - Source : FranceAgriMer following Kantar Worldpanel
75 % supermarkets
14 %hard discount
78 % supermarkets
9 % hard discount
3 %fishmongers and markets
50 % supermarkets 31 %
freezer centers and home delivery 10 %
hard discount
67 % supermarkets
15 % markets
9 % fishmongers

>
30/ Fisheries and aquaculture sector in France > EDITION april 2015. © FranceAgriMer 2014 /
Consumption / households purchases
Breakdown of expenditures by presentation and species group in 2014 (1)
18 %cooked shrimp
cured fish
34 %
35 %others
13 %surimi
52 %fish fillets
crustaceans
9 %
bivalves and cephalopods
23 %16 %whole fish
Fresh products
Frozen products
Chilled delicatessen
Canned products
(1) data collection methodology is detailed on inside back cover - Source : FranceAgriMer following Kantar Worldpanel
ready meals
28 %
crustaceans
10 %fish
49 %
13 %bivalves and cephalopods
others16 %
50 %tuna (excluding tuna salads)
mackerel
15 %
sardine
15 %
tuna salads
4 %
Purchases by French households for home consumptio

Les cahiers de FranceAgriMer 2015 / Key figures / FISHERIES AND AQUACULTURE. /31
tuna salads
4 %
Purchases by French households for home consumptio
(1) data collection methodology is detailed on inside back cover - (2) net weight Source : FranceAgriMer following Kantar Worldpanel
tons (2)
million euros
Main species purchased fresh in 2014 (1)
4 1304 1704 1804 4504 7804 8604 8905 1605 360
6 1507 450
23 26023 390
23 96043 280
0 5 000 10 000 15 000 20 000 25 000 30 000 35 000 40 000 45 000 50 000
seabreamsardine
monkfishhake
mackerelwhiting
whelkbrown crab
troutscallopsaithe
salmoncod
oystermussel
4344484950
616164
707374
156190
333346
0 50 100 150 200 250 300 350 400
hakebrown
seabreamNorway
seabasssole
whitingtrout
monkfishsaithe
scallopmusseloyster
codsalmon
1011
111111121212
181819
2035
4142
0 5 10 15 20 25 30 35 40 45
seabasshaddock
seabreammackerel
scallopsardine
whelkling
whitingtrout
oystersaithe
musselcod
salmon
percentage of purchasing households (%)

32/ Fisheries and aquaculture sector in France > EDITION april 2015. © FranceAgriMer 2014 /
Spending in 2013
Source : FranceAgriMer following Crédoc
by presentation (million euros) by catering outlet type (million euros)
1 135 million euros
total
> Consumption / catering
Purchases of aquatic products by the catering sector
26%
2%
62%
10%
0%
10%
20%
30%
40%
50%
60%
70%
fresh products chilled delicatessen frozen products canned production
0
100
200
300
400
500
600
700
fresh products chilleddelicatessen
frozen products cannedproduction
0
100
200
300
400
500
600
self-managedinstitutional
catering
institutionalcatering firms
independantrestaurant outlets
restaurant chainsand groups

Les cahiers de FranceAgriMer 2015 / Key figures / FISHERIES AND AQUACULTURE. /33
Purchases of aquatic products by the catering sector
Spending by catering outlet and by presentation in 2013
Self-managed institutional catering
Independant restaurant outlets
Institutional catering firms
Restaurant chains and groups
Source : FranceAgriMer following Crédoc
26%
2%
62%
10%
0%
10%
20%
30%
40%
50%
60%
70%
fresh products chilled delicatessen frozen products canned production
67%
8%
23%
2%
0%
10%
20%
30%
40%
50%
60%
70%
80%
fresh products chilled delicatessen frozen products canned production
11%
2%
82%
4%
0%
10%
20%
30%
40%
50%
60%
70%
80%
90%
fresh products chilled delicatessen frozen products canned production
65%
3%
30%
2%0%
10%
20%
30%
40%
50%
60%
70%
fresh products chilled delicatessen frozen products canned production

>
34/ Fisheries and aquaculture sector in France > EDITION april 2015. © FranceAgriMer 2014 /
Consumption
Breakdown of purchases by distribution channel
Breakdown of purchases by presentation for different outlets (value)
Breakdown of purchases by outlet for different presentations (quantities) (3)
(1) including hard discount, freezer centres and home delivery - (2) including direct sales - (3) net weight
Source : Kantar Worldpanel and Crédoc for FranceAgriMer
supermarkets (1) fishmongers and markets (2)
restaurantsinstitutional catering
fresh products chilled delicatessenfrozen productscanned products
22%
66%
87%
27%
2%
6%
13%
34%
68%
25%
0%
23%
8%
2%
0%
17%
0% 10% 20% 30% 40% 50% 60% 70% 80% 90% 100%
institutional catering
restaurants
fishmongers and markets (2)
supermarkets (1)
95%
71%
95%
60% 18%
11%
19%
18%
4%
2%2%
2%
1%
3%
0% 10% 20% 30% 40% 50% 60% 70% 80% 90% 100%
canned products
frozen products
chilled delicatessen
fresh products

Les cahiers de FranceAgriMer 2015 / Key figures / FISHERIES AND AQUACULTURE. /35
supermarkets (1) fishmongers and markets (2)
restaurantsinstitutional catering
Data collection methodology
Data Included data are the last available in 12 april 2015.
Foreign Trade Raw Import/export data is provided by French Customs on a net weight basis. It is converted here into their live weight equivalent, i.e. before any product processing, using coefficients that have been established for each product code.
Processing Processing firms data arise from a survey carried out in 2013 among main or secondary processing activity identified firms. Besides, information about non-processing trading firms arises from FranceAgriMer's updated fish trading firms database (notably following the French National Institute for Statistics and Economic Studies' firm lists, sanitary approvals, financial databases and professional sources).
Consumption French consumption may be measured in two ways :• firstly, by calculating supply balance or apparent consumption (production + imports - exports),• secondly by using consumer and restaurant panels.
Apparent consumption is measured in live weight equivalent and includes the overseas territories (French Caribbean Islands, Reunion Island and French Guyana). In contrast, consumer and restaurant data are expressed in net weight, meaning the weight as purchased by the final consumer (consumer panel) or by restaurants (restaurant panel), and exclude consumption in the overseas territories (and in Corsica for consumer panels). Panel data is based on declarations made by consumers and restaurant buyers and is thus non-exhaustive. Coverage varies according to the product in question, and the overall rate of coverage is approximately 80%.
To find out more information, especially about prices at all levels of the sector (production, trade, consumption), and their trends :• Bilan annuel FranceAgriMer 2014 des ventes déclarées en halles à marée*• Bilan annuel FranceAgriMer 2014 du commerce extérieur des produits de la pêche et de
l’aquaculture*• Bilan annuel FranceAgriMer 2014 de la consommation des produits de la pêche et de
l’aqua culture*
* coming 2015
Ric Réseau inter criées MEDDE Ministère de l'Écologie, du Développement durable et de l'Énergie DPMA Direction des Pêches Maritimes et de l'AquacultureBSPA Bureau des statistiques de la Pêche et de l'AquacultureDAM Direction des Affaires MaritimesSDSIM Sous Direction des Systèmes d'information maritimesIfremer Institut français de recherche pour l'exploitation de la mer

MINISTÈREDE L’AGRICULTURE
DE L'AGROALIMENTAIREET DE LA FORÊT
MINISTÈRE DE L'ÉCOLOGIEDU DÉVELOPPEMENT
DURABLEET DE L’ÉNERGIE
www.franceagrimer.fr / www.agriculture.gouv.fr