the fishing industry in quebec - fisheries and oceans canada
TRANSCRIPT

QUEBEC REGION
The Fishing Industry in QuebecMaritime areas profi le 2009
Policy and Economics Branch

QUEBEC REGION
The Fishing Industry in QuebecMaritime areas profi le 2009
Policy and Economics Branch

The Fishing Industry in Quebec - Maritime areas profi le 2009ii
Published by:Policy and Economics BranchFisheries and Oceans CanadaQuébec, QuebecG1K 7Y7
©Her Majesty the Queen in Right of Canada
Catalogue Number Fs 66-5/179FISSN 1923-2225
March 2010
Cette publication est également disponible en français.

iii
PRODUCTION TEAM
EDITORIAL STAFF
Ali Magassouba, PEB, DFO, Quebec RegionFrancis Bilodeau, PEB, DFO, Quebec RegionMarie-Ève Gosselin, PEB, DFO, Quebec Region
CONTRIBUTORS
Sarah Arnold, PEB, DFO, Quebec RegionChristina Haché, PEB, DFO, Quebec RegionFrédéric Lessard, PEB, DFO, Quebec Region
ACRONYMS
PEB: Policy and Economics BranchDFO: Fisheries and Oceans Canada FHAMIS: Fish Habitat Management Information SystemRCM: Regional County MunicipalitySLD: Statistics and Licences Division
SYMBOLS AND ABBREVIATIONS
$M: millions of dollarsp: preliminaryt: tonnes (metric tons)

The Fishing Industry in Quebec - Maritime areas profi le 2009iv
CONTENTS
CONTENTS iv
GRAPHS v
TABLES viii
MAPS viii
INTRODUCTION ix
1. Gaspe-Lower St. Lawrence 1
1.1. SOCIO-ECONOMIC PROFILE 1
1.2. THE FISHING INDUSTRY 3 1.2.1. Evolution of landings 3 1.2.2. Landings by RCM and by fi shing port 5 1.2.3. Workforce 7 1.2.4. Fishing fl eets 9
1.3. PROCESSING OF MARINE RESOURCES 10 1.3.1. Production value and number of jobs 10 1.3.2. Types of processing 11 1.3.3. Businesses 12
2. North Shore 13
2.1. SOCIO-ECONOMIC PROFILE 13
2.2. FISHING INDUSTRY 15 2.2.1. Evolution of landings 15 2.2.2. Landings by RCM and by fi shing port 16 2.2.3. Workforce 18 2.2.4. Fishing fl eets 20
2.3. PROCESSING OF MARINE RESOURCES 21 2.3.1. Production value and number of jobs 21 2.3.2. Types of processing 23 2.3.3. Businesses 24
3. Magdalen Islands 25
3.1. SOCIO-ECONOMIC PROFILE 25
3.2. FISHING INDUSTRY 26 3.2.1. Evolution of landings 26 3.2.2. Landings by fi shing port 27 3.2.3. Workforce 28
3.3. PROCESSING OF MARINE RESOURCES 30 3.3.1. Production value and number of jobs 30 3.3.2. Businesses 32
Appendix – Maps of catches by Quebec fi shers in NAFO zones 33
v
GRAPHS
GRAPH 1: Distribution of the population in maritime Quebec and Gaspe-Lower St. Lawrence area, 2006 1
GRAPH 2: Evolution of the population of the Gaspe-Lower St. Lawrence area, 1986-2006 1 (thousands of residents)
GRAPH 3: Value of landings in maritime Quebec and the Gaspe-Lower St. Lawrence area, 2008 3
GRAPH 4: Value of landings in the Gaspe-Lower St. Lawrence area, by species and sub-area, 2008 3
GRAPH 5: Value of landings in Gaspe-Lower St. Lawrence, by species, 1999-2009 4
GRAPH 6: Quantities landed in Gaspe-Lower St. Lawrence, by species, 1999-2009 4
GRAPH 7: Value of landings in Gaspe-Lower St. Lawrence RCMs by species, 2008 5
GRAPH 8: Value of landing at the 10 principal fi shing ports in the Gaspe-Lower St. Lawrence, 6 by species, 2008
GRAPH 9: Number of active fi shing businesses, by principal species landed, Gaspe-Lower St. Lawrence, 7 1988-2008
GRAPH 10: Number of fi shing businesses, by main species landed and RCM, 7 Gaspe-Lower St. Lawrence, 2008
GRAPH 11: Number of active licences by species, Gaspe-Lower St. Lawrence, 2008 8
GRAPH 12: Number of active licences, by species and RCM, Gaspe-Lower St. Lawrence, 2008 8
GRAPH 13: Number of active fi shing boats by length, Gaspe-Lower St. Lawrence, 2008 8
GRAPH 14: Number of active fi shing boats, by length and RCM, Gaspe-Lower St. Lawrence, 2008 8
GRAPH 15: Average characteristics of the main fi shing fl eets in the Gaspe-Lower St. Lawrence area, 9 by main species landed, 2008
GRAPH 16: Production by marine resources processing businesses in maritime Quebec and 10 the Gaspe-Lower St. Lawrence area, 2007
GRAPH 17: Production by marine resources processing businesses in the Gaspe-Lower St. Lawrence area, 10 by species and sub-area, 2007
GRAPH 18: Production by marine resources processing businesses in Gaspe-Lower St. Lawrence, 11 by species and RCM, 2007
GRAPH 19: Number of jobs in the marine resources processing industry in Gaspe-Lower St. Lawrence, 11 by species and sub-area, 2007
GRAPH 20: Value and composition of production in Gaspe-Lower St. Lawrence, 2007 11
The Fishing Industry in Quebec - Maritime areas profi le 2009vi
GRAPHS
GRAPH 21: Distribution of the population in maritime Quebec and the North Shore, 2006 13
GRAPH 22: Evolution of the population on the North Shore, 1986-2006 (thousands of residents) 13
GRAPH 23: Value of landings in maritime Quebec and the North Shore, 2008 15
GRAPH 24: Value of landings on the North Shore, by RCM, 2008 15
GRAPH 25: Value of landings in North Shore, by species, 1999-2009 16
GRAPH 26: Quantities landed in North Shore, by species, 1999-2009 16
GRAPH 27: Value of landings in North Shore RCMs, by species, 2008 16
GRAPH 28: Value of landings at the 10 principal fi shing ports on the North Shore, by species, 2008 17
GRAPH 29: Number of active fi shing businesses, by principal species landed, North Shore, 1988-2008 18
GRAPH 30: Number of fi shing businesses, by main species landed and RCM, North Shore, 2008 18
GRAPH 31: Number of active licences by species, North Shore, 2008 19
GRAPH 32: Number of active licences, by species and RCM, North Shore, 2008 19
GRAPH 33: Number of active fi shing boats by length, North Shore, 2008 19
GRAPH 34: Number of active fi shing boats, by length and RCM, North Shore, 2008 19
GRAPH 35: Average characteristics of the main fi shing fl eets on the North Shore, by main species landed, 20 2008
GRAPH 36: Production by marine resources processing businesses in maritime Quebec and 21 on the North Shore, 2007
GRAPH 37: Production by marine resources processing businesses on the North Shore, by species and 21 sub-area, 2007
GRAPH 38: Production by marine resources processing businesses on the North Shore, by species 22 and RCM, 2007
GRAPH 39: Number of jobs in the marine resources processing industry on the North Shore, 22 by species and sub-area, 2007
GRAPH 40: Value and composition of production on the North Shore, 2007 23
GRAPH 41: Distribution of the population in maritime Quebec, 2006 25
GRAPH 42: Evolution of the population of the Magdalen Islands, 1986-2006 (thousands of residents) 25
GRAPH 43: Value of landings in maritime Quebec and the Magdalen Islands, 2008 26
GRAPH 44: Breakdown of landed species by value, Magdalen Islands, 2008 26

vii
GRAPHS
GRAPH 45: Value of landings in the Magdalen Islands, by species, 1999-2009 26
GRAPH 46: Quantities landed in the Magdalen Islands, by species, 1999-2009 26
GRAPH 47: Value of landings at the 10 Magdalen Islands fi shing ports, by species, 2008 27
GRAPH 48: Number of active fi shing businesses, by principal landed species, Magdalen Islands, 1988-2008 29
GRAPH 49: Number of active licences by species, Magdalen Islands, 2008 29
GRAPH 50: Number of active fi shing boats, by length, Magdalen Islands, 2008 29
GRAPH 51: Average characteristics of the main fi shing fl eets in the Magdalen Islands, 29 by main species landed, 2008
GRAPH 52: Production by marine resources processing businesses in maritime Quebec and 30 the Magdalen Islands, 2007
GRAPH 53: Number of jobs in the marine resources processing industry in the Magdalen Islands, by species, 2007 30
GRAPH 54: Value and composition of production in the Magdalen Islands, 2007 31
The Fishing Industry in Quebec - Maritime areas profi le 2009viii
TABLES
TABLE 1: Socio-economic data of the Gaspe-Lower St. Lawrence area, by RCM 2
TABLE 2: Main marine resources processing businesses of the Gaspe-Lower St. Lawrence area in 2007 12
TABLE 3: Socio-economic data for the North Shore by RCM 14
TABLE 4: Principal marine resources processing businesses of the North Shore, 2007 24
TABLE 5: Socio-economic data for the Magdalen Islands 25
TABLE 6: Major marine resources processing businesses in the Magdalen Islands in 2007 32
MAPS
MAP 1: The Gaspe-Lower St. Lawrence area, showing sub-area and RCM limits 3
MAP 2: The 10 principal fi shing ports in the Gaspe-Lower St. Lawrence area and value of landings 6 by municipality, 2008
MAP 3: The North Shore area, sub-area and RCM limits 14
MAP 4: The 10 principal fi shing ports on the North Shore and value of landings by municipality, 2008 17
MAP 5: The 10 fi shing ports in the Magdalen Islands, 2008 28
MAP 6: Catches by Gaspe-Lower St-Lawrence area fi shers, by NAFO zone 33
MAP 7: Catches by North Shore fi shers, by NAFO zone 34
MAP 8: Catches by Magdalen Islands fi shers, by NAFO zone 34
ix
INTRODUCTION
This document presents a portrait of the fi shing industry in the three maritime areas of Quebec: the Gaspe-Lower St. Lawrence, the North Shore and the Magdalen Islands. Each of these maritime areas is described in its own section.
The fi rst part of each section provides a brief look at the socio-economic and demographic context of the maritime area in question. The second part is devoted to the primary fi sheries sector. Detailed information is provided on the evolution of captures, species landed (by regional county municipality (RCM), and fi shing port), and the workforce (fi shers, licences, boats, and fl eets). Finally, the third part deals with marine resources processing, describing data on processing methods, the value of production, the number of jobs, and business profi les.

The Fishing Industry in Quebec - Maritime areas profi le 2009x

1
1 GASPE-LOWER ST. LAWRENCE
1.1. SOCIO-ECONOMIC PROFILE
With a population of 282,000 in 2006, the Gaspe-Lower St. Lawrence area1 accounted for 73% of the total population of maritime Quebec. Like the other maritime areas, but contrary to Quebec as a whole2, the Gaspe-Lower St. Lawrence exhibited an 8.7% decrease in population between 1986 and 2006. The demographic weight of this maritime area, in relation to Quebec as a whole, decreased from 4.7% to 3.8% over the last twenty years.
The Gaspe sub-area showed the greatest decrease in population, going from 97,923 citizens in 1986 to 80,200 in 2006, a decline of 18.1%. During the same period, the population decrease in the Lower St. Lawrence was only 4.3%. In both Gaspe and the Lower St. Lawrence, the Institut de la statistique du Québec expects a population decrease of 1.3% over the next twenty-fi ve years, a rate signifi cantly slower than that observed over the last two decades.
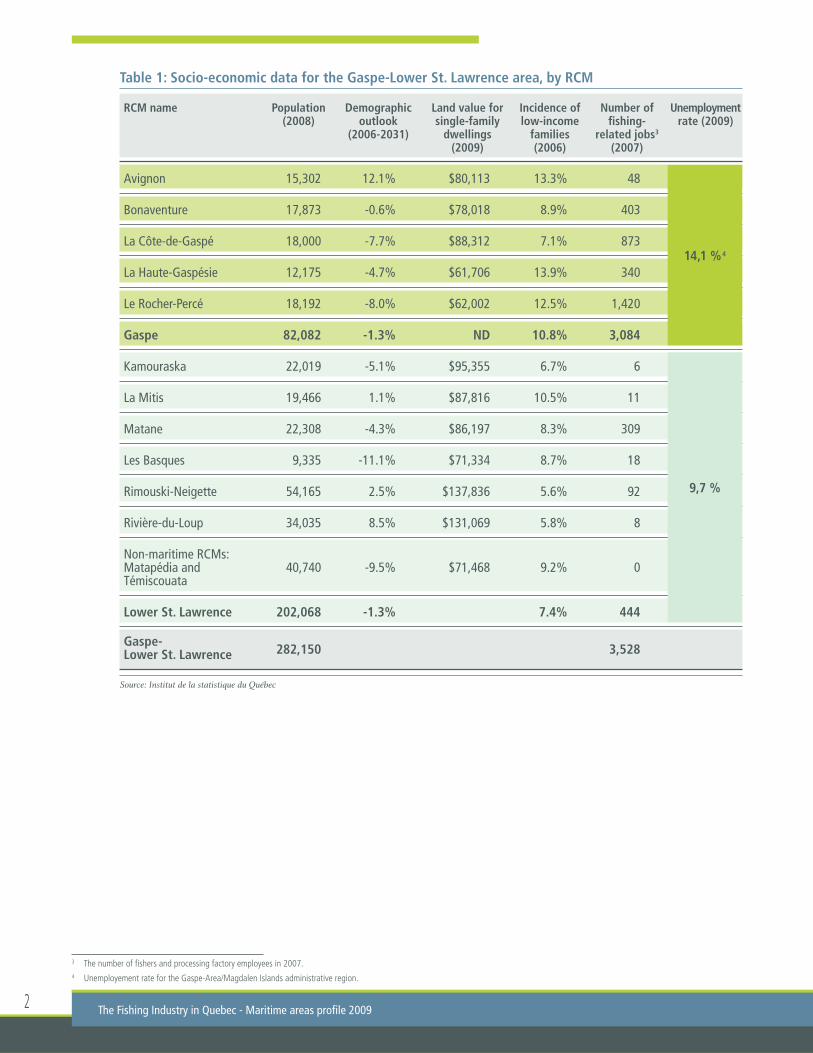
Table 1 provides socio-economic data for the Gaspe-Lower St. Lawrence, by RCM. It shows that, despite its smaller population, Gaspe accounts for many more fi shing-related jobs than the Lower St. Lawrence area (3,084 vs. 444). However, the socio-economic statistics for Gaspe are generally less positive. For example, the unemployment rate in Gaspe was 14.1% in 2009, compared to 9.7% in the Lower St. Lawrence area. The incidence of low-income families was also signifi cantly higher, at 10.8% compared to 7.4%.
1 The Gaspe-Lower St. Lawrence area corresponds to the administrative region of the Lower St. Lawrence joined with the Gaspe section of the Gaspe/Magdalen Islands administrative region.2 The population of Quebec increased by 13% between 1986 and 2006 from 6.5 to 7.4 million citizens.
GRAPH 1: Distribution of the population in maritime Quebec and the Gaspe-Lower St. Lawrence area, 2006
Source: Statistics Canada
GRAPH 2: Evolution of the population of the Gaspe-Lower St. Lawrence area, 1986-2006 (thousands of residents)
Source: Institut de la statistique du Québec
Gaspe Lower St. Lawrence
( )
98 93 93 86 80
211 210 209 205 202
309 302 301 290 282
1986 1991 1996 2001 2006
North Shore 23.6%
Magdalen Islands 3.4%
Lower St. Lawrence
52.3%
Gaspe 20.8%
Gaspe- Lower
St. Lawrence 73.1%
Maritime Quebec: 385,717 inhabitants
Gaspe-Lower St. Lawrence: 281,892 inhabitants
80,200 res.
201,692 res.
The Fishing Industry in Quebec - Maritime areas profi le 20092
Table 1: Socio-economic data for the Gaspe-Lower St. Lawrence area, by RCM
RCM name Population Demographic Land value for Incidence of Number of Unemployment (2008) outlook single-family low-income fi shing- rate (2009) (2006-2031) dwellings families related jobs3 (2009) (2006) (2007)
Avignon 15,302 12.1% $80,113 13.3% 48
Bonaventure 17,873 -0.6% $78,018 8.9% 403
La Côte-de-Gaspé 18,000 -7.7% $88,312 7.1% 873
La Haute-Gaspésie 12,175 -4.7% $61,706 13.9% 340
Le Rocher-Percé 18,192 -8.0% $62,002 12.5% 1,420
Gaspe 82,082 -1.3% ND 10.8% 3,084
Kamouraska 22,019 -5.1% $95,355 6.7% 6
La Mitis 19,466 1.1% $87,816 10.5% 11
Matane 22,308 -4.3% $86,197 8.3% 309
Les Basques 9,335 -11.1% $71,334 8.7% 18
Rimouski-Neigette 54,165 2.5% $137,836 5.6% 92
Rivière-du-Loup 34,035 8.5% $131,069 5.8% 8
Non-maritime RCMs: Matapédia and 40,740 -9.5% $71,468 9.2% 0Témiscouata
Lower St. Lawrence 202,068 -1.3% 7.4% 444
Gaspe- 282,150 3,528
Lower St. Lawrence
Source: Institut de la statistique du Québec
3 The number of fi shers and processing factory employees in 2007. 4 Unemployement rate for the Gaspe-Area/Magdalen Islands administrative region.
14,1 %4
9,7 %
31- Gaspe-Lower St. Lawrence
MAP 1: The Gaspe-Lower St. Lawrence area, showing sub-area and RCM limits
1.2. THE FISHING INDUSTRY
1.2.1. Evolution of landings
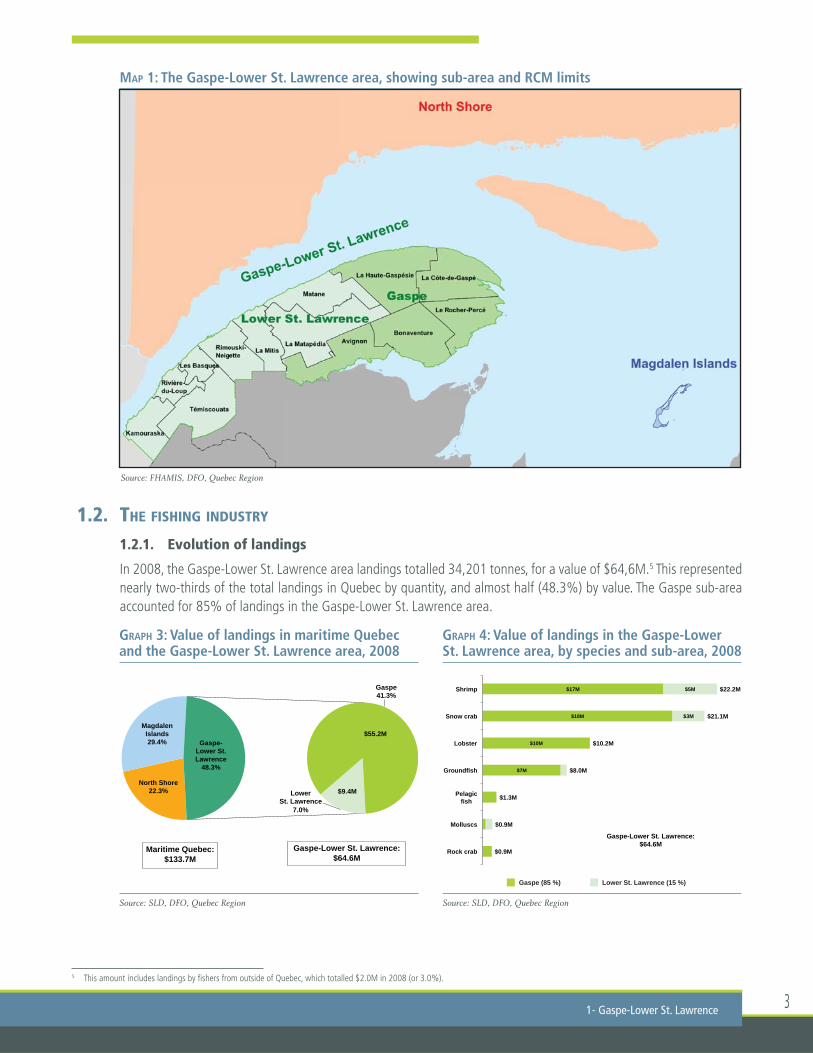
In 2008, the Gaspe-Lower St. Lawrence area landings totalled 34,201 tonnes, for a value of $64,6M.5 This represented nearly two-thirds of the total landings in Quebec by quantity, and almost half (48.3%) by value. The Gaspe sub-area accounted for 85% of landings in the Gaspe-Lower St. Lawrence area.
Source: FHAMIS, DFO, Quebec Region
5 This amount includes landings by fi shers from outside of Quebec, which totalled $2.0M in 2008 (or 3.0%).
GRAPH 3: Value of landings in maritime Quebec and the Gaspe-Lower St. Lawrence area, 2008
Source: SLD, DFO, Quebec Region
GRAPH 4: Value of landings in the Gaspe-Lower St. Lawrence area, by species and sub-area, 2008
Source: SLD, DFO, Quebec Region
Gaspe (85 %) Lower St. Lawrence (15 %)
North Shore 22.3%
Magdalen Islands 29.4%
Lower St. Lawrence
7.0%
Gaspe 41.3%
Gaspe- Lower St. Lawrence
48.3%
Maritime Quebec: $133.7M
Gaspe-Lower St. Lawrence: $64.6M
$55.2M
$9.4M
$7M
$10M
$18M
$17M
$3M
$5M
$0.9M
$0.9M
$1.3M
$8.0M
$10.2M
$21.1M
$22.2M
Rock crab
Molluscs
Pelagic fish
Groundfish
Lobster
Snow crab
Shrimp
Gaspe-Lower St. Lawrence: $64.6M
The Fishing Industry in Quebec - Maritime areas profi le 20094
As in the other Quebec maritime areas, shrimp, snow crab, and lobster accounted for a large part (83%) of the Gaspe-Lower St. Lawrence landings. In 2008, shrimp was the most landed species in the area, with a value of $22.2M (87.7% of the total value for Quebec). This was slightly higher than the $21.1M total value for snow crab. Lobster was the third most important species landed, with a value of $10.2M. Unlike shrimp and snow crab, some of which are offl oaded in the Lower St. Lawrence ports, lobster is landed exclusively in the Gaspe. Groundfi sh accounted for 12.4% of the total value, with landings totalling $8M. Lastly, pelagic fi sh, molluscs and rock crab represented less than 5% of the landing values, at $3.1M.
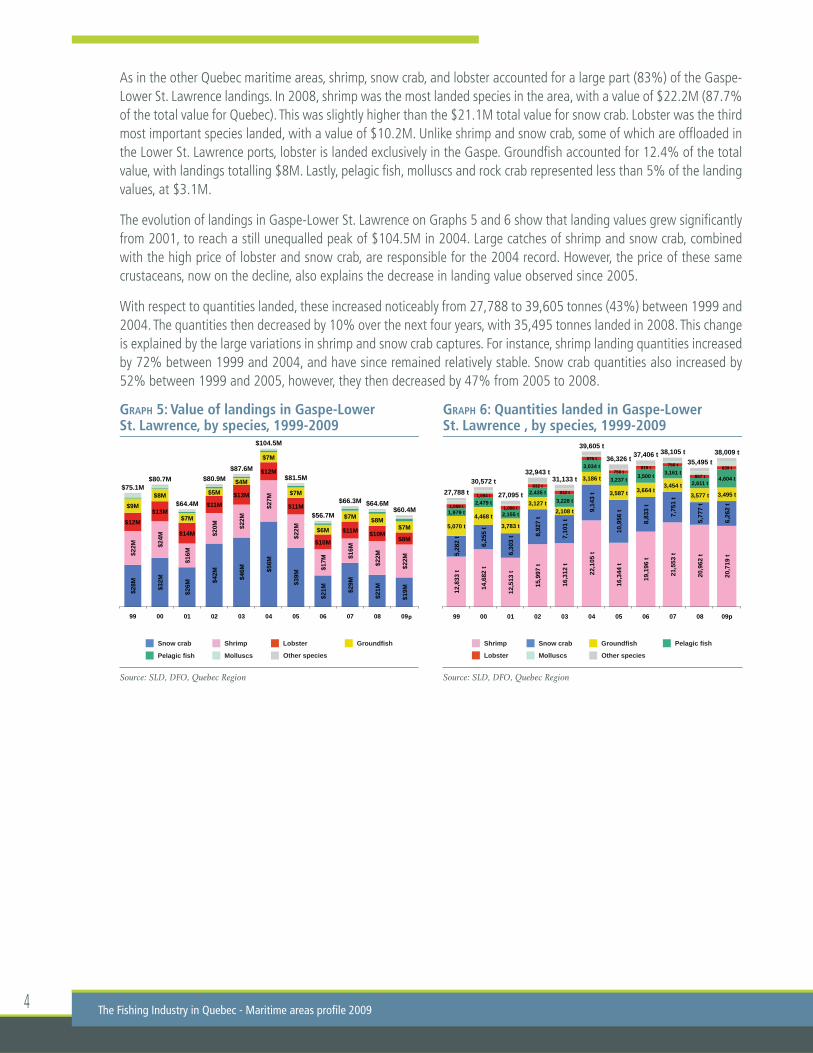
The evolution of landings in Gaspe-Lower St. Lawrence on Graphs 5 and 6 show that landing values grew signifi cantly from 2001, to reach a still unequalled peak of $104.5M in 2004. Large catches of shrimp and snow crab, combined with the high price of lobster and snow crab, are responsible for the 2004 record. However, the price of these same crustaceans, now on the decline, also explains the decrease in landing value observed since 2005.
With respect to quantities landed, these increased noticeably from 27,788 to 39,605 tonnes (43%) between 1999 and 2004. The quantities then decreased by 10% over the next four years, with 35,495 tonnes landed in 2008. This change is explained by the large variations in shrimp and snow crab captures. For instance, shrimp landing quantities increased by 72% between 1999 and 2004, and have since remained relatively stable. Snow crab quantities also increased by 52% between 1999 and 2005, however, they then decreased by 47% from 2005 to 2008.
GRAPH 5: Value of landings in Gaspe-Lower St. Lawrence, by species, 1999-2009
Source: SLD, DFO, Quebec Region
GRAPH 6: Quantities landed in Gaspe-Lower St. Lawrence , by species, 1999-2009
Source: SLD, DFO, Quebec Region
LobsterShrimp Groundfi shSnow crab
MolluscsPelagic fi sh Other species Lobster
Shrimp Groundfi shSnow crab
Molluscs
Pelagic fi sh
Other species
St. Lawrence, by species, 1999 2009
$28M
$32M
$26M
$42M
$46M
$56M
$39M
$21M
$29M
$21M
$19M
$22M
$24M
$16M
$20M
$22M
$27M
$22M
$17M
$16M
$22M
$22M
$12M $13M
$14M
$11M $13M
$12M
$11M
$10M
$11M $10M $8M
$9M $8M
$7M
$5M $4M
$7M
$7M
$6M
$7M $8M $7M
$75.1M $80.7M
$64.4M
$80.9M $87.6M
$104.5M
$81.5M
$56.7M
$66.3M $64.6M $60.4M
99 00 01 02 03 04 05 06 07 08 09
St. Lawrence , by species, 1999 2009
12,8
33 t
14,6
82 t
12,5
13 t
15,9
97 t
16,3
12 t
22,1
05 t
16,3
44 t
19,1
96 t
21,5
53 t
20,9
62 t
20,7
19 t 5,
282
t
6,25
5 t
6,30
3 t 8,
927
t
7,10
1 t
9,14
3 t
10,9
56 t
8,83
3 t
7,75
1 t
5,77
7 t
6,26
2 t
5,070 t 4,468 t
3,783 t
3,127 t 2,108 t
3,186 t
3,587 t 3,664 t 3,454 t
3,577 t 3,495 t
1,979 t
2,479 t
2,155 t
2,435 t 3,228 t
3,034 t
3,237 t 3,500 t 3,161 t
2,611 t 4,604 t
1,059 t
1,094 t
1,006 t
832 t 932 t
875 t
750 t 819 t 756 t
857 t
839 t
27,788 t 30,572 t
27,095 t
32,943 t 31,133 t
39,605 t
36,326 t 37,406 t 38,105 t 35,495 t
38,009 t
99 00 01 02 03 04 05 06 07 08 09p
5
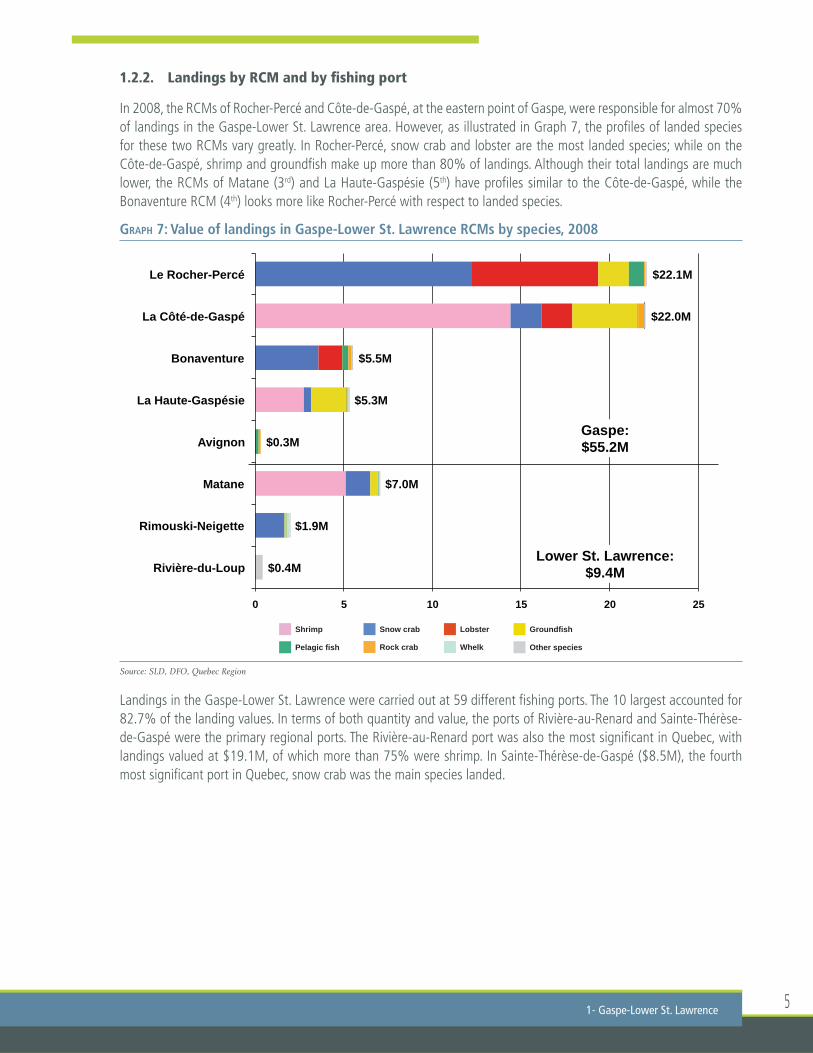
1.2.2. Landings by RCM and by fi shing port
In 2008, the RCMs of Rocher-Percé and Côte-de-Gaspé, at the eastern point of Gaspe, were responsible for almost 70% of landings in the Gaspe-Lower St. Lawrence area. However, as illustrated in Graph 7, the profi les of landed species for these two RCMs vary greatly. In Rocher-Percé, snow crab and lobster are the most landed species; while on the Côte-de-Gaspé, shrimp and groundfi sh make up more than 80% of landings. Although their total landings are much lower, the RCMs of Matane (3rd) and La Haute-Gaspésie (5th) have profi les similar to the Côte-de-Gaspé, while the Bonaventure RCM (4th) looks more like Rocher-Percé with respect to landed species.
GRAPH 7: Value of landings in Gaspe-Lower St. Lawrence RCMs by species, 2008
Source: SLD, DFO, Quebec Region
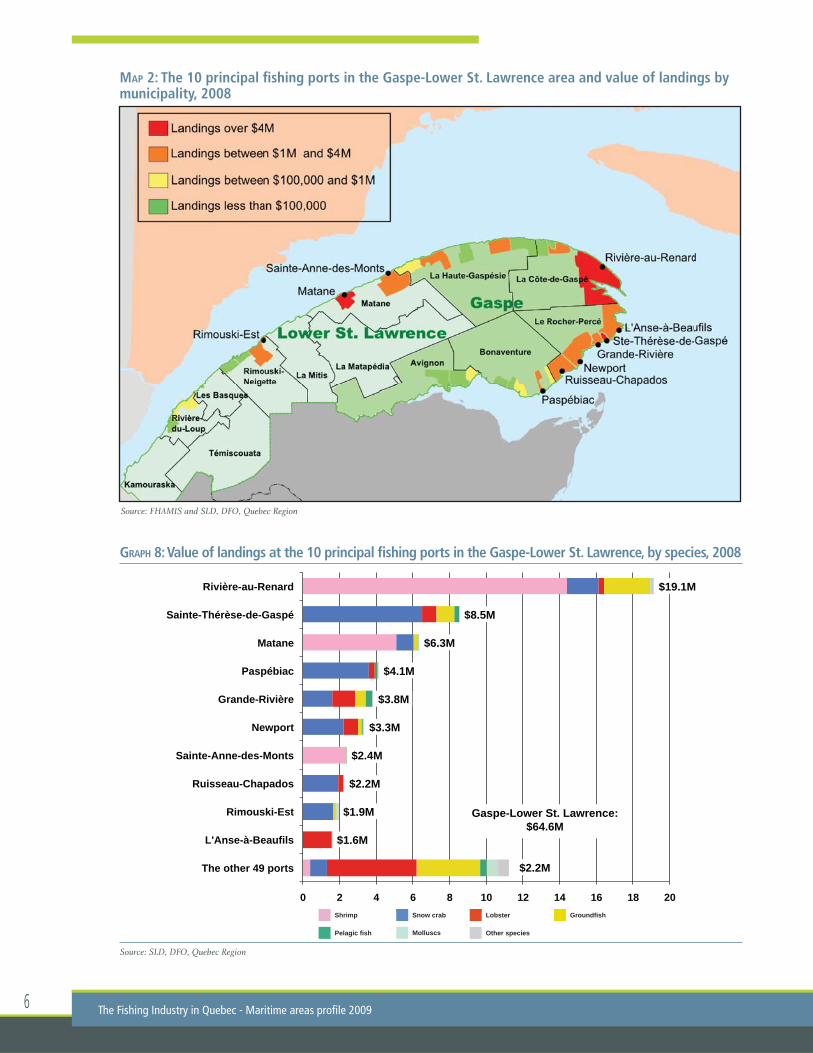
Landings in the Gaspe-Lower St. Lawrence were carried out at 59 different fi shing ports. The 10 largest accounted for 82.7% of the landing values. In terms of both quantity and value, the ports of Rivière-au-Renard and Sainte-Thérèse-de-Gaspé were the primary regional ports. The Rivière-au-Renard port was also the most signifi cant in Quebec, with landings valued at $19.1M, of which more than 75% were shrimp. In Sainte-Thérèse-de-Gaspé ($8.5M), the fourth most signifi cant port in Quebec, snow crab was the main species landed.
1- Gaspe-Lower St. Lawrence
Shrimp Snow crab Lobster Groundfi sh
Rock crabPelagic fi sh Whelk Other species
$0.4M
$1.9M
$7.0M
$0.3M
$5.3M
$5.5M
$22.0M
$22.1M
0 5 10 15 20 25
Rivière-du-Loup
Rimouski-Neigette
Matane
Avignon
La Haute-Gaspésie
Bonaventure
La Côté-de-Gaspé
Le Rocher-Percé
Lower St. Lawrence: $9.4M
Gaspe: $55.2M
The Fishing Industry in Quebec - Maritime areas profi le 20096
MAP 2: The 10 principal fi shing ports in the Gaspe-Lower St. Lawrence area and value of landings by municipality, 2008
GRAPH 8: Value of landings at the 10 principal fi shing ports in the Gaspe-Lower St. Lawrence, by species, 2008
Source: SLD, DFO, Quebec Region
Source: FHAMIS and SLD, DFO, Quebec Region
Shrimp Snow crab Lobster Groundfi sh
MolluscsPelagic fi sh Other species
$2.2M
$1.6M
$1.9M
$2.2M
$2.4M
$3.3M
$3.8M
$4.1M
$6.3M
$8.5M
$19.1M
0 2 4 6 8 10 12 14 16 18 20
The other 49 ports
L'Anse-à-Beaufils
Rimouski-Est
Ruisseau-Chapados
Sainte-Anne-des-Monts
Newport
Grande-Rivière
Paspébiac
Matane
Sainte-Thérèse-de-Gaspé
Rivière-au-Renard
Gaspe-Lower St. Lawrence: $64.6M
7
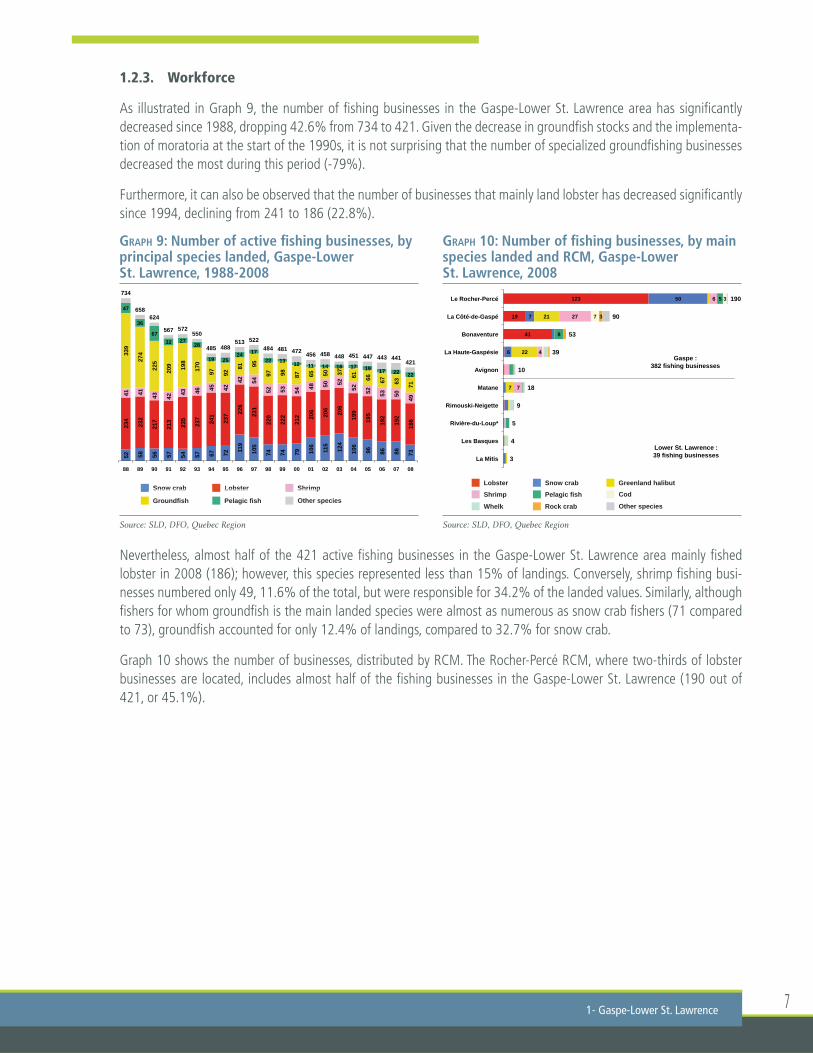
1.2.3. Workforce
As illustrated in Graph 9, the number of fi shing businesses in the Gaspe-Lower St. Lawrence area has signifi cantly decreased since 1988, dropping 42.6% from 734 to 421. Given the decrease in groundfi sh stocks and the implementa-tion of moratoria at the start of the 1990s, it is not surprising that the number of specialized groundfi shing businesses decreased the most during this period (-79%).
Furthermore, it can also be observed that the number of businesses that mainly land lobster has decreased signifi cantly since 1994, declining from 241 to 186 (22.8%).
Nevertheless, almost half of the 421 active fi shing businesses in the Gaspe-Lower St. Lawrence area mainly fi shed lobster in 2008 (186); however, this species represented less than 15% of landings. Conversely, shrimp fi shing busi-nesses numbered only 49, 11.6% of the total, but were responsible for 34.2% of the landed values. Similarly, although fi shers for whom groundfi sh is the main landed species were almost as numerous as snow crab fi shers (71 compared to 73), groundfi sh accounted for only 12.4% of landings, compared to 32.7% for snow crab.
Graph 10 shows the number of businesses, distributed by RCM. The Rocher-Percé RCM, where two-thirds of lobster businesses are located, includes almost half of the fi shing businesses in the Gaspe-Lower St. Lawrence (190 out of 421, or 45.1%).
1- Gaspe-Lower St. Lawrence
GRAPH 9: Number of active fi shing businesses, by principal species landed, Gaspe-Lower St. Lawrence, 1988-2008
Source: SLD, DFO, Quebec Region
GRAPH 10: Number of fi shing businesses, by main species landed and RCM, Gaspe-Lower St. Lawrence, 2008
Source: SLD, DFO, Quebec Region
Lobster Shrimp
Groundfi sh
Snow crab
Pelagic fi sh Other species
Lobster
Shrimp
Greenland halibut
Whelk
Snow crab
Pelagic fi sh
Rock crab
Cod
Other species
Lobster ShrimpSnow crab
52
58
56
57
54
57
67
72 11
9
105
74
74
79
106
115
124
106
96
86
86
73
234
232
217
213
235
237 241
237 22
6
231
220
222
212 20
6
206
206
199
195
192
192
186
41
41
43
42 43
46 45
42 42
54
52
53
54 48
50
52
52
52
53
50
49
339
274
225
209 198
170
97
92 81
95
97
98
87
65
50
37
61
66
67
63
71
47
36
67 32 27
28
19 25 24 17
22 13 12 11 14 16 17 19 17 22 22
734
658 624
567 572 550
485 488 513 522
484 481 472 456 458 448 451 447 443 441 421
88 89 90 91 92 93 94 95 96 97 98 99 00 01 02 03 04 05 06 07 08
41
19
123
6
7
50
7
22
21
7
4
27
6
8
5
7
3
3
3
4
5
9
18
10
39
53
90
190
La Mitis
Les Basques
Rivière-du-Loup*
Rimouski-Neigette
Matane
Avignon
La Haute-Gaspésie
Bonaventure
La Côté-de-Gaspé
Le Rocher-Percé
Gaspe : 382 fishing businesses
Lower St. Lawrence : 39 fishing businesses
The Fishing Industry in Quebec - Maritime areas profi le 20098
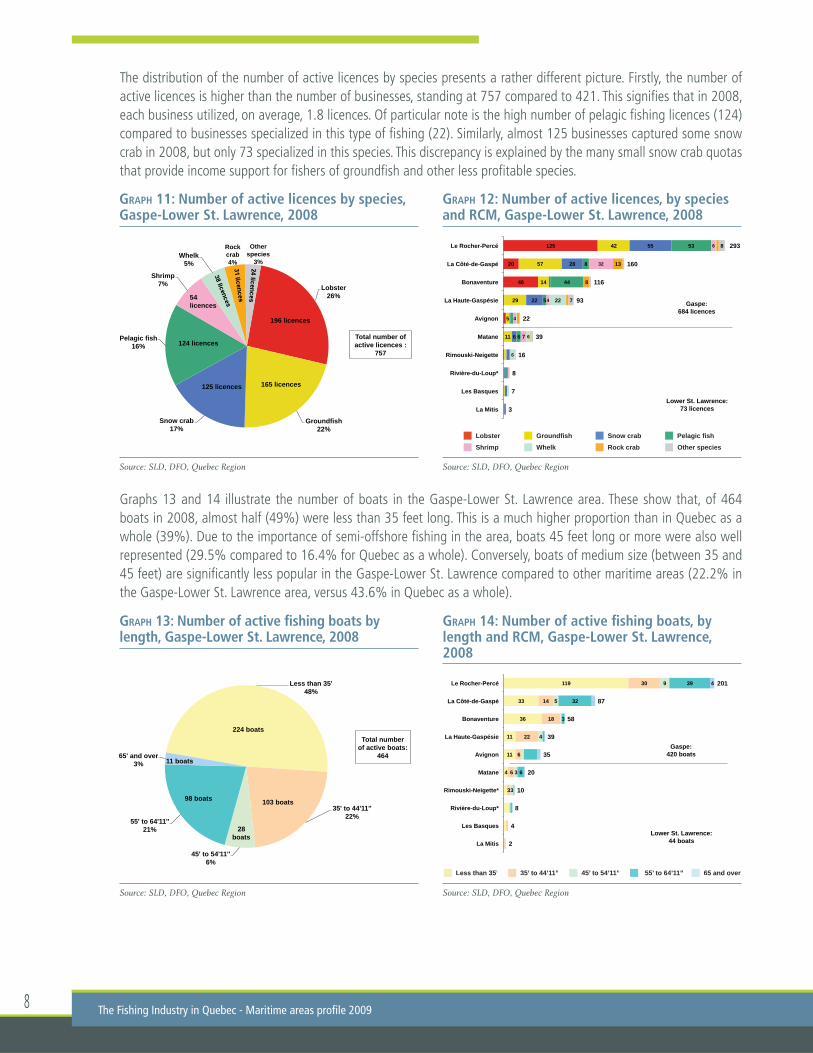
The distribution of the number of active licences by species presents a rather different picture. Firstly, the number of active licences is higher than the number of businesses, standing at 757 compared to 421. This signifi es that in 2008, each business utilized, on average, 1.8 licences. Of particular note is the high number of pelagic fi shing licences (124) compared to businesses specialized in this type of fi shing (22). Similarly, almost 125 businesses captured some snow crab in 2008, but only 73 specialized in this species. This discrepancy is explained by the many small snow crab quotas that provide income support for fi shers of groundfi sh and other less profi table species.
Graphs 13 and 14 illustrate the number of boats in the Gaspe-Lower St. Lawrence area. These show that, of 464 boats in 2008, almost half (49%) were less than 35 feet long. This is a much higher proportion than in Quebec as a whole (39%). Due to the importance of semi-offshore fi shing in the area, boats 45 feet long or more were also well represented (29.5% compared to 16.4% for Quebec as a whole). Conversely, boats of medium size (between 35 and 45 feet) are signifi cantly less popular in the Gaspe-Lower St. Lawrence compared to other maritime areas (22.2% in the Gaspe-Lower St. Lawrence area, versus 43.6% in Quebec as a whole).
GRAPH 13: Number of active fi shing boats by length, Gaspe-Lower St. Lawrence, 2008
Source: SLD, DFO, Quebec Region
GRAPH 14: Number of active fi shing boats, by length and RCM, Gaspe-Lower St. Lawrence, 2008
Source: SLD, DFO, Quebec Region
Less than 35’ 65 and over35’ to 44’11” 45’ to 54’11” 55’ to 64’11”Less than 35’ 65 and over35’ to 44’11” 45’ to 54’11” 55’ to 64’11”
4
11
11
36
33
119
3
6
6
22
18
14
30
3
3
4
5
9
6
3
32
39 4
2
4
8
10
20
35
39
58
87
201
La Mitis
Les Basques
Rivière-du-Loup*
Rimouski-Neigette*
Matane
Avignon
La Haute-Gaspésie
Bonaventure
La Côté-de-Gaspé
Le Rocher-Percé
Gaspe: 420 boats
Lower St. Lawrence: 44 boats
Less than 35' 48%
35' to 44'11'' 22%
45' to 54'11'' 6%
55' to 64'11'' 21%
65' and over 3%
Total number of active boats:
464
224 boats
98 boats
11 boats
103 boats
28 boats
GRAPH 11: Number of active licences by species, Gaspe-Lower St. Lawrence, 2008
Source: SLD, DFO, Quebec Region
GRAPH 12: Number of active licences, by species and RCM, Gaspe-Lower St. Lawrence, 2008
Source: SLD, DFO, Quebec Region
Lobster
Shrimp
Groundfi sh
Whelk
Snow crab Pelagic fi sh
Rock crab Other species
46
20
125
11
5
29
14
57
42
6
22
28
55
6
5
44
8
53
7
4
4
32
6
6
6
22
8
13
7
8
3
7
8
16
39
22
93
116
160
293
La Mitis
Les Basques
Rivière-du-Loup*
Rimouski-Neigette
Matane
Avignon
La Haute-Gaspésie
Bonaventure
La Côté-de-Gaspé
Le Rocher-Percé
Gaspe: 684 licences
Lower St. Lawrence: 73 licences
Lobster 26%
Groundfish 22%
Snow crab 17%
Pelagic fish 16%
Shrimp 7%
Whelk 5%
Rock crab 4%
Other species
3%
Total number of active licences :
757
196 licences
165 licences 125 licences
124 licences
54 licences
9
1.2.4. Fishing fl eets
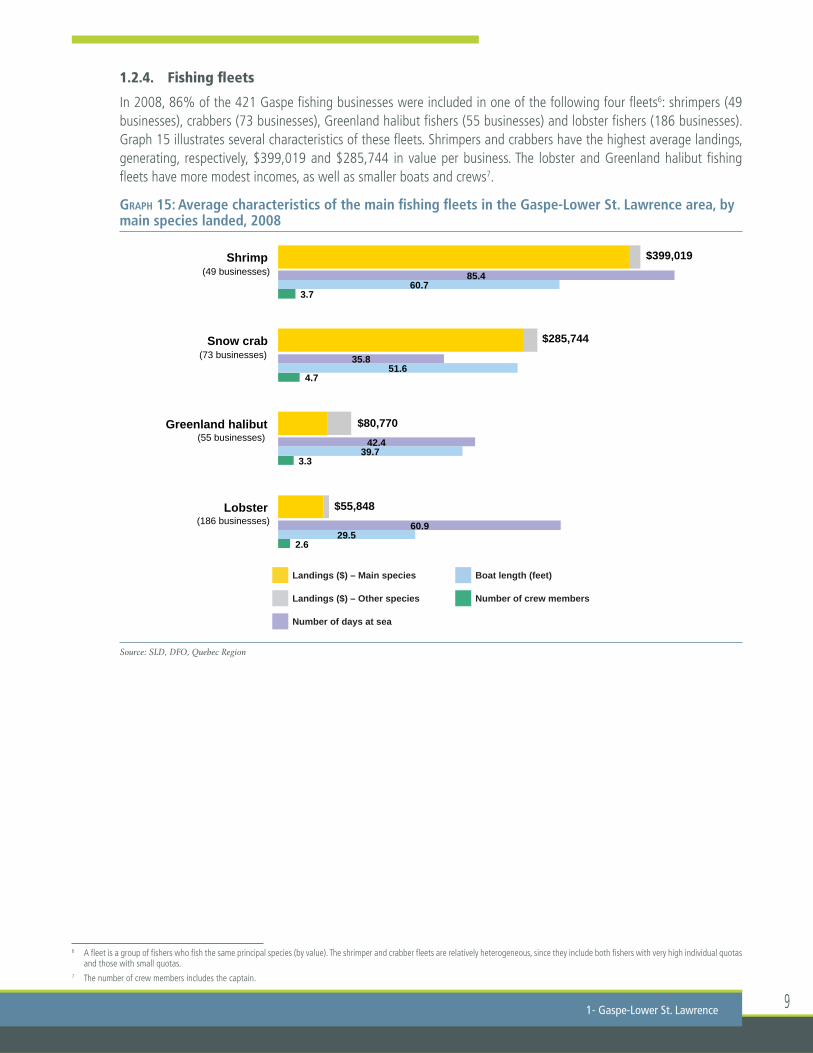
In 2008, 86% of the 421 Gaspe fi shing businesses were included in one of the following four fl eets6: shrimpers (49 businesses), crabbers (73 businesses), Greenland halibut fi shers (55 businesses) and lobster fi shers (186 businesses). Graph 15 illustrates several characteristics of these fl eets. Shrimpers and crabbers have the highest average landings, generating, respectively, $399,019 and $285,744 in value per business. The lobster and Greenland halibut fi shing fl eets have more modest incomes, as well as smaller boats and crews7.
GRAPH 15: Average characteristics of the main fi shing fl eets in the Gaspe-Lower St. Lawrence area, by main species landed, 2008
Source: SLD, DFO, Quebec Region
1- Gaspe-Lower St. Lawrence
6 A fl eet is a group of fi shers who fi sh the same principal species (by value). The shrimper and crabber fl eets are relatively heterogeneous, since they include both fi shers with very high individual quotas and those with small quotas.
7 The number of crew members includes the captain.
Number of crew members
Number of days at sea
Landings ($) – Other species
Boat length (feet)Landings ($) – Main species
2.6
3.3
4.7
3.7
29.5
39.7
51.6
60.7
60.9
42.4
35.8
85.4
$285,744
$399,019
$55,848
$80,770
Lobster
Greenland halibut
Snow crab
Shrimp
(55 businesses)
(186 businesses)
(49 businesses)
(73 businesses)

The Fishing Industry in Quebec - Maritime areas profi le 200910
1.3. PROCESSING OF MARINE RESOURCES
1.3.1. Production value and number of jobs
The marine resources processing industry in the Gaspe-Lower St. Lawrence area comprises approximately fi fty businesses, which generally buy seafood directly from the fi shers and then export or sell these products on the local, national or world market. Usually, these businesses carry out initial processing (freezing, marinating, cooking, packaging, etc.) before sale. In 2007, fi sh and seafood purchases by these businesses reached $66.3M, while their production was calculated at $126.2M, 52.6% of that for maritime Quebec. Their added value was thus estimated at $59.9M, the dif-ference between the production and purchase values8.
The main species in terms of production value was shrimp, which was sold for a total of $43.5M in 2007. For this species, the added value of processing was very high, at 169%, which signifi es that the value of shrimp leaving the factory ($43.5M) was almost three times higher than on entry. For snow crab, the second most signifi cant species with a total production of $43.4M, the added value of processing was far lower, at only 50%. Ranked third, groundfi sh had a production value reaching $15.9M, due to an added value of almost 100%. Lobster, the third most signifi cant species in terms of landings, was the fourth most valuable after production ($15.7M), a result of the low added value of processing (40.2%).
In 2007, there were approximately 2,203 workers in the marine product processing industry in the Gaspe-Lower St. Lawrence area. Of this number it is estimated that 793 jobs were related to the processing and sale of snow crab, 596 to shrimp, 294 to groundfi sh, 215 to herring, 112 to lobster, and 96 to rock crab.
8 To simplify analysis, we assumed that inputs are limited to seafood purchases, the value of which is generally equivalent to the value of landings.
GRAPH 16: Production by marine resources processing businesses in maritime Quebec and the Gaspe-Lower St. Lawrence area, 2007
Source: SLD, DFO, Quebec Region
GRAPH 17: Production by marine resources processing businesses in the Gaspe-Lower St. Lawrence area, by species and sub-area, 2007
Source: SLD, DFO, Quebec Region
Gaspe (83 %) Lower St. Lawrence (17 %)
North Shore 22.3%
Magdalen Islands 28.3%
Gaspe 40.3%
Lower St. Lawrence
9.1%
Gaspe- Lower St. Lawrence
49.4%
$102.9M
$23.3M
Maritime Quebec: $255.1M
Gaspe-Lower St. Lawrence: $126.2M
$15.5M
$38.5M
$26.1M
$4.9M
$17.4M
$0.8M
$0.8M
$1.6M
$4.5M
$15.7M
$15.9M
$43.4M
$43.5M
Molluscs
Mackerel
Rock crab
Herring
Lobster
Groundfish
Snow crab
Shrimp
Gaspe-Lower St. Lawrence: $126.2M

11
1.3.2. Types of processing
In 2007, the processing industry in the Gaspe-Lower St. Lawrence area produced shrimp to a total value of $43.5M, and snow crab products valued at $43.4M. These two species together accounted for almost 87% of production. As illustrated in Graph 20, most of the marine products were sold cooked and frozen (58.4%), or fresh (22.6%). Cooked dishes and canned goods, as well as smoked, salted, or marinated products represented only 6.8% of production.
GRAPH 20: Value and composition of production in Gaspe-Lower St. Lawrence, 2007
Source: SLD, DFO, Quebec Region
1- Gaspe-Lower St. Lawrence
GRAPH 18: Production by marine resources processing businesses in Gaspe-Lower St. Lawrence, by species and RCM, 2007
Source: SLD, DFO, Quebec Region
GRAPH 19: Number of jobs in the marine resources processing industry in Gaspe-Lower St. Lawrence, by species and sub-area, 2007
Source: SLD, DFO, Quebec Region
LobsterShrimp Groundfi sh
Molluscs
Snow crab
HerringRock crab MackerelWhelk Other species
Lobster
Shrimp Greenland halibut
Cod
Snow crab Herring
Rock crab Mackerel
$0.9M
$1.3M
$2.9M
$18.2M
$0.2M
$8.4M
$18.0M
$33.5M
$42.8M
0 10 20 30 40 50
Les Basques
La Mitis
Rimouski-Neigette
Matane
Avignon
La Haute-Gaspésie
Bonaventure
La Côté-de-Gaspe
Le Rocher-Percé
Gaspe: $102.9M
Lower St. Lawrence: $23.3M
Shrimp Greenland halibutSnow crab Herring
117
676
141
455 215 146 112 96 89 54
319 jobs
1884 jobs
Lower St. Lawrence
Gaspe
Gaspe-Lower St. Lawrence: 2203 jobs
Cooked and frozen Cooked
Smoked
Fresh
Salted
Canned
Frozen, in blocks or other Bait
Prepared meals
$0.1M
$0.8M
$0.8M
$1.6M
$4.5M
$15.7M
$15.9M
$43.4M
$43.5M
0 10 20 30 40 50
Other species
Molluscs
Mackerel
Rock crab
Herring
Lobster
Groundfish
Snow crab
Shrimp
Gaspe-Lower St. Lawrence: $126.2M

The Fishing Industry in Quebec - Maritime areas profi le 200912
1.3.3. Businesses
Of the 56 businesses in the Gaspe-Lower St. Lawrence processing sector, the twelve principal businesses accounted for 81% of production and for approximately 79% of jobs in the industry. The following table provides basic information on these businesses.
TABLE 2: Principal marine resources processing businesses in the Gaspe-Lower St. Lawrence area in 2007
Name of buyer Community RCM Sales Number fi gures of jobs
E. Gagnon & Fils Sainte-Thérèse-de-Gaspé Le Rocher-Percé $15M+ 200-300
Les Fruits de Mer Matane Matane $15M + 200-300de l’Est du Québec
Unipêche M.D.M. Paspébiac Bonaventure $15M + 300+
Les Pêcheries Marinard Rivière-au-Renard La Côte-de-Gaspé $10M-$15M 200-300
Crevettes du Nord Atlantique L’Anse-au-Griffon La Côte-de-Gaspé $5M-$10M 100-200
Les Pêcheries Gaspésiennes Rivière-au-Renard La Côte-de-Gaspé $5M-$10M 50-100
Crustacés de Malbaie Saint-Georges-de-Malbaie Le Rocher-Percé $1M-$5M 10-50
Poissonnerie Cloridorme Cloridorme La Côte-de-Gaspé $1M-$5M 10-50
Crustacés des Monts Sainte-Anne-des-Monts La Haute-Gaspésie $1M-$5M 10-50
Poisson Salé Gaspésien Grande-Rivière-Ouest Le Rocher-Percé $1M-$5M 100-200
Lelièvre, Lelièvre et Lemoignan Sainte-Thérèse-de-Gaspé Le Rocher-Percé $1M-$5M 100-200
Le Marché Blais Pabos Mills Le Rocher-Percé $1M-$5M 50-100
The other 44 $23.9M 479businesses
TOTAL $126.2M 2,261
Source: SLD, DFO, Quebec Region
13
2NORTH SHORE
2.1. SOCIO-ECONOMIC PROFILE
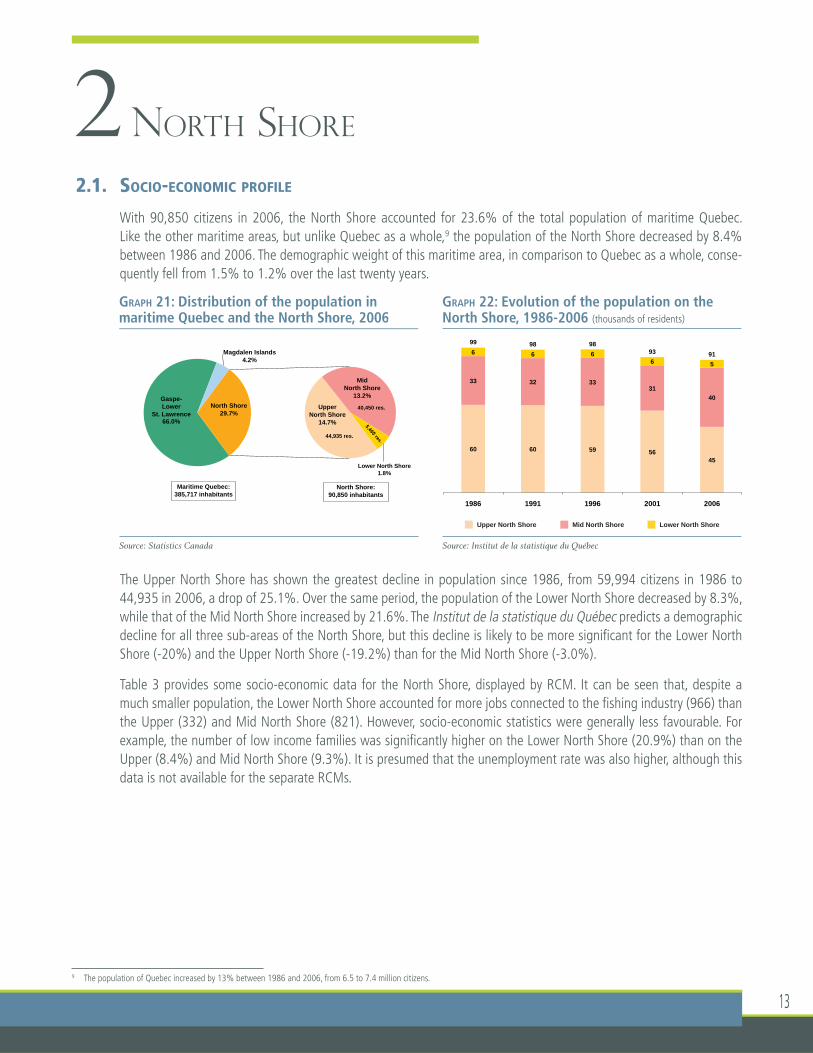
With 90,850 citizens in 2006, the North Shore accounted for 23.6% of the total population of maritime Quebec. Like the other maritime areas, but unlike Quebec as a whole,9 the population of the North Shore decreased by 8.4% between 1986 and 2006. The demographic weight of this maritime area, in comparison to Quebec as a whole, conse-quently fell from 1.5% to 1.2% over the last twenty years.
The Upper North Shore has shown the greatest decline in population since 1986, from 59,994 citizens in 1986 to 44,935 in 2006, a drop of 25.1%. Over the same period, the population of the Lower North Shore decreased by 8.3%, while that of the Mid North Shore increased by 21.6%. The Institut de la statistique du Québec predicts a demographic decline for all three sub-areas of the North Shore, but this decline is likely to be more signifi cant for the Lower North Shore (-20%) and the Upper North Shore (-19.2%) than for the Mid North Shore (-3.0%).
Table 3 provides some socio-economic data for the North Shore, displayed by RCM. It can be seen that, despite a much smaller population, the Lower North Shore accounted for more jobs connected to the fi shing industry (966) than the Upper (332) and Mid North Shore (821). However, socio-economic statistics were generally less favourable. For example, the number of low income families was signifi cantly higher on the Lower North Shore (20.9%) than on the Upper (8.4%) and Mid North Shore (9.3%). It is presumed that the unemployment rate was also higher, although this data is not available for the separate RCMs.
9 The population of Quebec increased by 13% between 1986 and 2006, from 6.5 to 7.4 million citizens.
GRAPH 21: Distribution of the population in maritime Quebec and the North Shore, 2006
Source: Statistics Canada
GRAPH 22: Evolution of the population on the North Shore, 1986-2006 (thousands of residents)
Source: Institut de la statistique du Québec
Mid North ShoreUpper North Shore Lower North Shore
60 60 59 56 45
33 32 33 31
40
6 6 6 6 5
99 98 98 93 91
1986 1991 1996 2001 2006
maritime Quebec and the North Shore, 2006
Gaspe- Lower
St. Lawrence 66.0%
Magdalen Islands 4.2%
Upper North Shore
14.7%
Mid North Shore
13.2%
Lower North Shore 1.8%
North Shore 29.7%
Maritime Quebec: 385,717 inhabitants
North Shore: 90,850 inhabitants
44,935 res.
40,450 res.

The Fishing Industry in Quebec - Maritime areas profi le 200914
TABLE 3: Socio-economic data for the North Shore, by RCM
RCM name Population Demographic Land value of Incidence of Number of Unemployment (2009) outlook single-family low-income fi shing- rate (2006-2031) dwellings families related jobs10 (December (2009) (2006) (2007) 2009)
Haute-Côte-Nord 11,885 -18.4% $75,464 7.2% 146
Manicouagan 32,379 -19.5% $110,335 8.8% 186
Upper North Shore 44,264 -19.2% 8.4% 332
Sept-Rivières 35,488 -3.4% $148,730 8.9% 252
Minganie 6,398 -0.5% $84,340 11.7% 569
Mid North Shore 41,886 -3.0% 9.3% 821
Lower North Shore 5,412 -20.0% $53,420 20.9% 966
North Shore 91,562 -11.8% 9.5% 2,118
Source: Institut de la statistique du Québec
MAP 3 : The North Shore area, showing sub-area and RCM limits
8,3 %
8,3 %
10 The number of fi shers and processing factory employees in 2007.
Source: FHAMIS, DFO, Quebec Region
152-North Shore
2.2. THE FISHING INDUSTRY
2.2.1. Evolution of landings
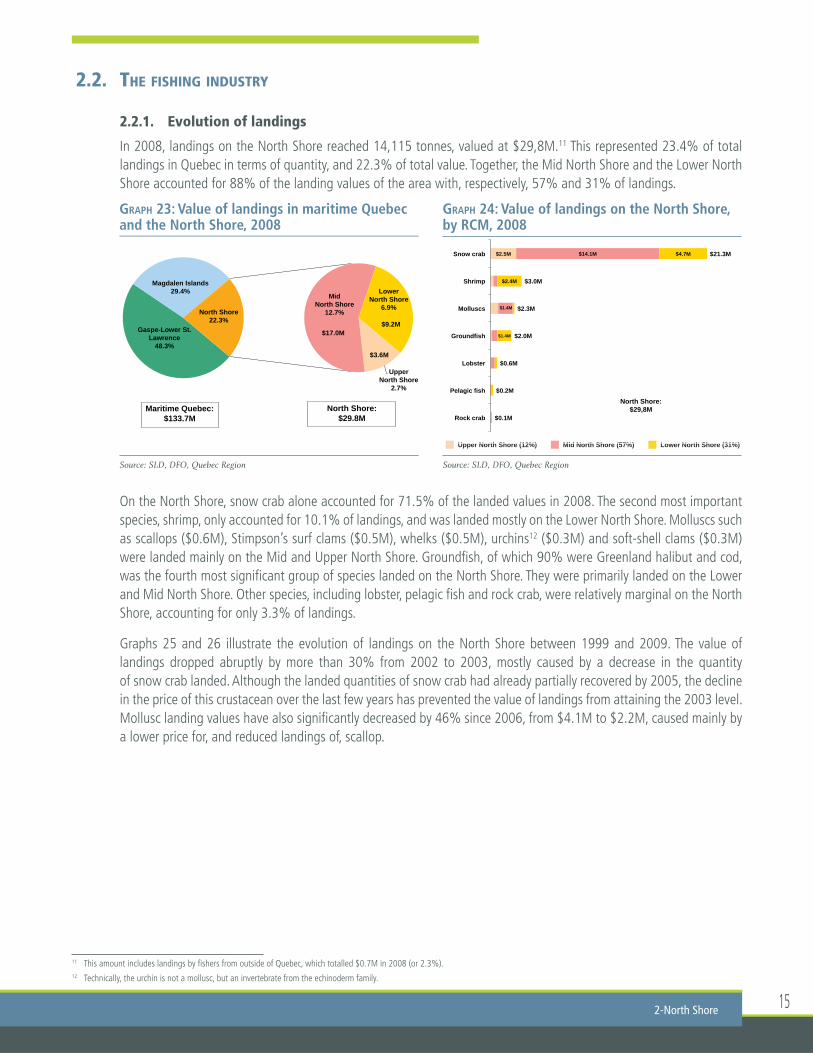
In 2008, landings on the North Shore reached 14,115 tonnes, valued at $29,8M.11 This represented 23.4% of total landings in Quebec in terms of quantity, and 22.3% of total value. Together, the Mid North Shore and the Lower North Shore accounted for 88% of the landing values of the area with, respectively, 57% and 31% of landings.
On the North Shore, snow crab alone accounted for 71.5% of the landed values in 2008. The second most important species, shrimp, only accounted for 10.1% of landings, and was landed mostly on the Lower North Shore. Molluscs such as scallops ($0.6M), Stimpson’s surf clams ($0.5M), whelks ($0.5M), urchins12 ($0.3M) and soft-shell clams ($0.3M) were landed mainly on the Mid and Upper North Shore. Groundfi sh, of which 90% were Greenland halibut and cod, was the fourth most signifi cant group of species landed on the North Shore. They were primarily landed on the Lower and Mid North Shore. Other species, including lobster, pelagic fi sh and rock crab, were relatively marginal on the North Shore, accounting for only 3.3% of landings.
Graphs 25 and 26 illustrate the evolution of landings on the North Shore between 1999 and 2009. The value of landings dropped abruptly by more than 30% from 2002 to 2003, mostly caused by a decrease in the quantity of snow crab landed. Although the landed quantities of snow crab had already partially recovered by 2005, the decline in the price of this crustacean over the last few years has prevented the value of landings from attaining the 2003 level. Mollusc landing values have also signifi cantly decreased by 46% since 2006, from $4.1M to $2.2M, caused mainly by a lower price for, and reduced landings of, scallop.
11 This amount includes landings by fi shers from outside of Quebec, which totalled $0.7M in 2008 (or 2.3%). 12 Technically, the urchin is not a mollusc, but an invertebrate from the echinoderm family.
GRAPH 23: Value of landings in maritime Quebec and the North Shore, 2008
Source: SLD, DFO, Quebec Region
GRAPH 24: Value of landings on the North Shore, by RCM, 2008
Source: SLD, DFO, Quebec Region
Mid North Shore (57%)Upper North Shore (12%) Lower North Shore (31%)
and the North Shore, 2008
Gaspe-Lower St. Lawrence
48.3%
Magdalen Islands 29.4%
Upper North Shore
2.7%
Mid North Shore
12.7%
Lower North Shore
6.9% North Shore 22.3%
Maritime Quebec: $133.7M
North Shore: $29.8M
$9.2M $17.0M
$3.6M
Mid N th Sh (57%)U N th Sh (12%) L N th Sh (31%)
$2.5M
$1.4M
$14.1M
$1.4M
$2.4M
$4.7M
$0.1M
$0.2M
$0.6M
$2.0M
$2.3M
$3.0M
$21.3M
Rock crab
Pelagic fish
Lobster
Groundfish
Molluscs
Shrimp
Snow crab
North Shore: $29,8M
The Fishing Industry in Quebec - Maritime areas profi le 200916
2.2.2. Landings by RCM and by fi shing port
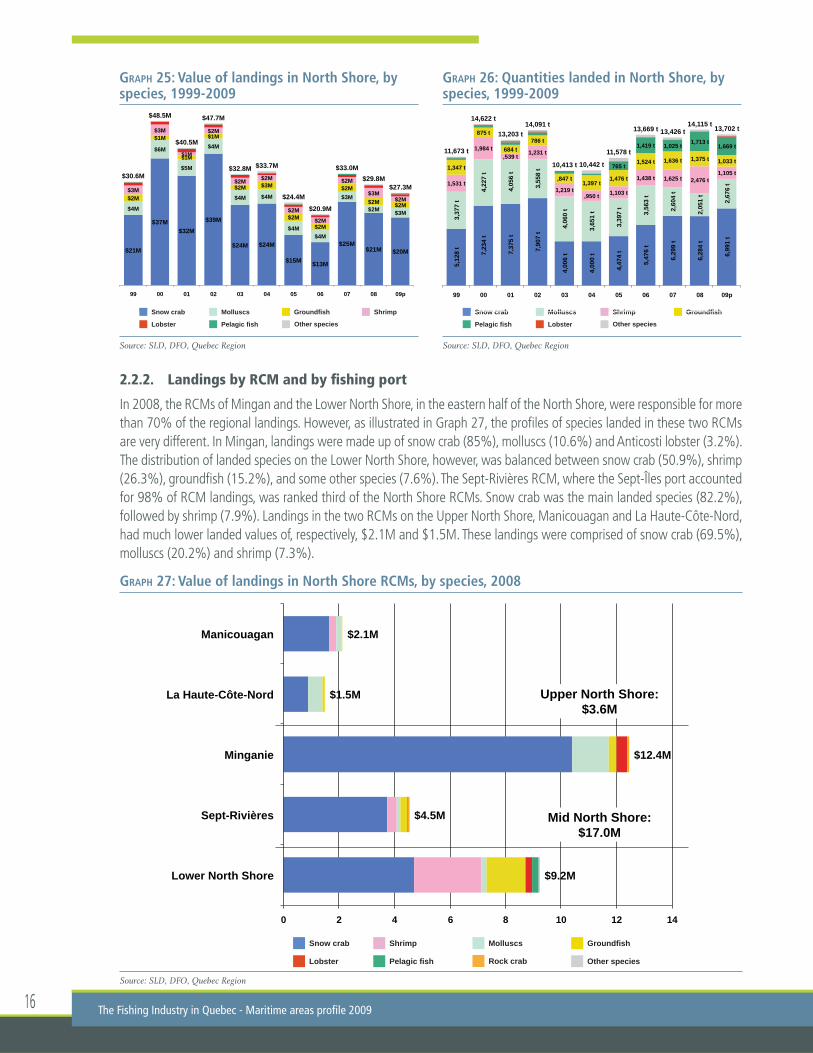
In 2008, the RCMs of Mingan and the Lower North Shore, in the eastern half of the North Shore, were responsible for more than 70% of the regional landings. However, as illustrated in Graph 27, the profi les of species landed in these two RCMs are very different. In Mingan, landings were made up of snow crab (85%), molluscs (10.6%) and Anticosti lobster (3.2%). The distribution of landed species on the Lower North Shore, however, was balanced between snow crab (50.9%), shrimp (26.3%), groundfi sh (15.2%), and some other species (7.6%). The Sept-Rivières RCM, where the Sept-Îles port accounted for 98% of RCM landings, was ranked third of the North Shore RCMs. Snow crab was the main landed species (82.2%), followed by shrimp (7.9%). Landings in the two RCMs on the Upper North Shore, Manicouagan and La Haute-Côte-Nord, had much lower landed values of, respectively, $2.1M and $1.5M. These landings were comprised of snow crab (69.5%), molluscs (20.2%) and shrimp (7.3%).
GRAPH 27: Value of landings in North Shore RCMs, by species, 2008
Source: SLD, DFO, Quebec Region
ShrimpSnow crab
Lobster
Groundfi sh
Rock crabPelagic fi sh
Molluscs
Other species
$9.2M
$4.5M
$12.4M
$1.5M
$2.1M
0 2 4 6 8 10 12 14
Lower North Shore
Sept-Rivières
Minganie
La Haute-Côte-Nord
Manicouagan
Mid North Shore: $17.0M
Upper North Shore: $3.6M
GRAPH 25: Value of landings in North Shore, by species, 1999-2009
Source: SLD, DFO, Quebec Region
GRAPH 26: Quantities landed in North Shore, by species, 1999-2009
Source: SLD, DFO, Quebec Region
Lobster
ShrimpGroundfi shSnow crab Molluscs
Pelagic fi sh Other species Lobster
Shrimp Groundfi shSnow crab Molluscs
Pelagic fi sh Other species
ShrimpGroundfishSnow crab Molluscs
$21M
$37M $32M
$39M
$24M $24M
$15M $13M
$25M $21M $20M
$4M
$6M
$5M
$4M
$4M $4M
$4M $4M
$3M
$2M $3M
$2M
$1M
$1M
$1M
$2M $3M
$2M $2M
$2M
$2M $2M
$3M
$3M
$1M
$2M
$2M $2M
$2M
$2M
$2M
$3M $2M
$30.6M
$48.5M
$40.5M
$47.7M
$32.8M $33.7M
$24.4M
$20.9M
$33.0M $29.8M
$27.3M
99 00 01 02 03 04 05 06 07 08 09p
Shrimp GroundfishSnow crab Molluscs
5,12
8 t
7,23
4 t
7,37
5 t
7,90
7 t
4,00
6 t
4,00
0 t
4,47
4 t
5,47
6 t
6,29
9 t
6,28
4 t
6,99
1 t
3,37
7 t
4,22
7 t
4,05
6 t
3,55
8 t
4,06
0 t
3,65
1 t
3,39
7 t
3,56
3 t
2,60
4 t
2,05
1 t
2,67
6 t 1,531 t
1,984 t ,539 t
1,231 t
1,219 t ,950 t 1,103 t
1,438 t 1,625 t 2,476 t 1,105 t
1,347 t
875 t
684 t 786 t
,847 t 1,397 t
1,476 t
1,524 t 1,636 t 1,375 t 1,033 t 765 t
1,419 t 1,025 t 1,713 t 1,669 t
11,673 t
14,622 t
13,203 t 14,091 t
10,413 t 10,442 t
11,578 t
13,669 t 13,426 t 14,115 t 13,702 t
99 00 01 02 03 04 05 06 07 08 09p
17
MAP 4: The 10 principal fi shing ports on the North Shore and value of landings by municipality, 2008
GRAPH 28: Value of landings at the 10 principal fi shing ports on the North Shore, by species, 2008
Source: SLD and FHAMIS, DFO, Quebec Region
2-North Shore
Source: SLD and FHAMIS, DFO, Quebec Region
ShrimpSnow crab
Lobster
Groundfi sh
Rock crabPelagic fi sh
Molluscs
Other species
$3.7M
$0.7M
$1.0M
$1.3M
$1.7M
$2.0M
$3.1M
$3.7M
$4.1M
$4.4M
$4.6M
0 1 2 3 4 5
The other 29 ports
Baie-Comeau
Baie-Trinité
Harrington Harbour
Mingan
Rivière-au-Tonnerre
Kegaska
La Tabatière
Havre-Saint-Pierre
Sept-Îles
Natashquan
North Shore: $29.8M
The Fishing Industry in Quebec - Maritime areas profi le 200918
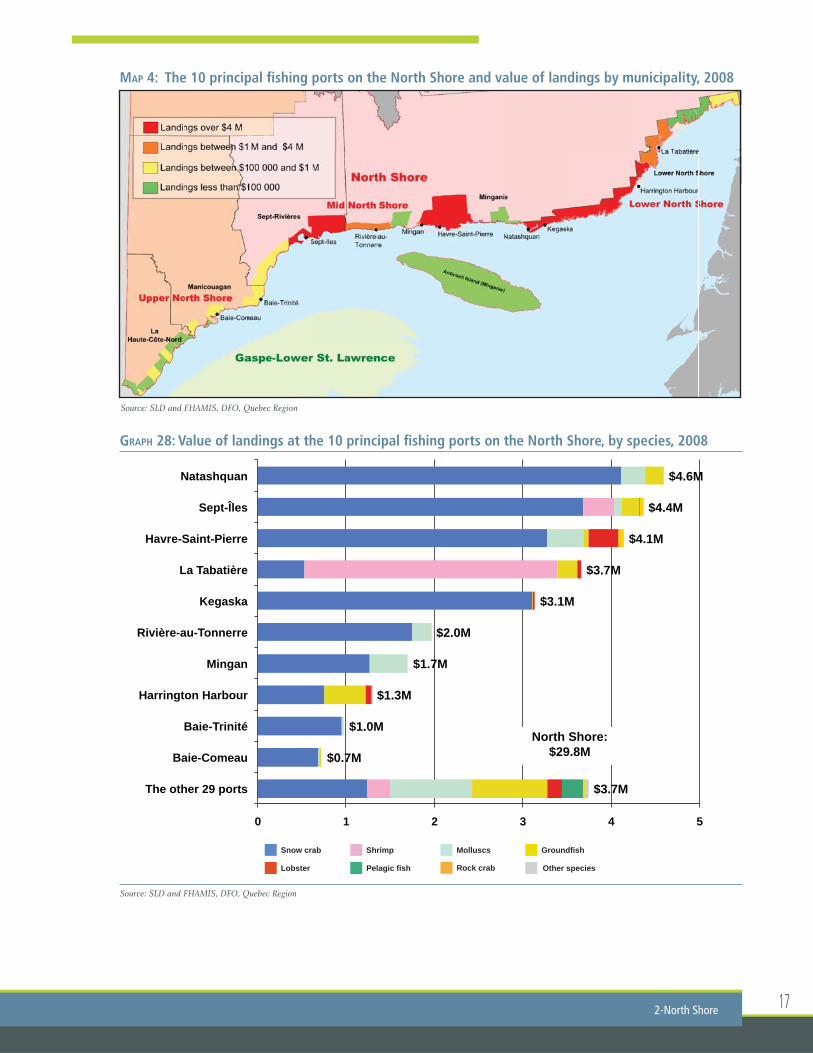
Landings on the North Shore were carried out in 39 fi shing ports, the ten most signifi cant of which accounted for 87% of the landing values. The four principal ports were those of Natashquan ($4.6M), Sept-Îles ($4.4M), Havre-Saint-Pierre ($4.1M) and La Tabatière ($3.7M).
In the ports of Natashquan, Sept-Îles and Havre-Saint-Pierre - which are ranked, respectively, sixth, seventh and eighth in importance at the provincial level - snow crab made up most of the landings; however in La Tabatière (thirteenth in Quebec), the major species landed was shrimp. More than 80% of shrimp landings in the North Shore were carried out in La Tabatière.
2.2.3. Workforce
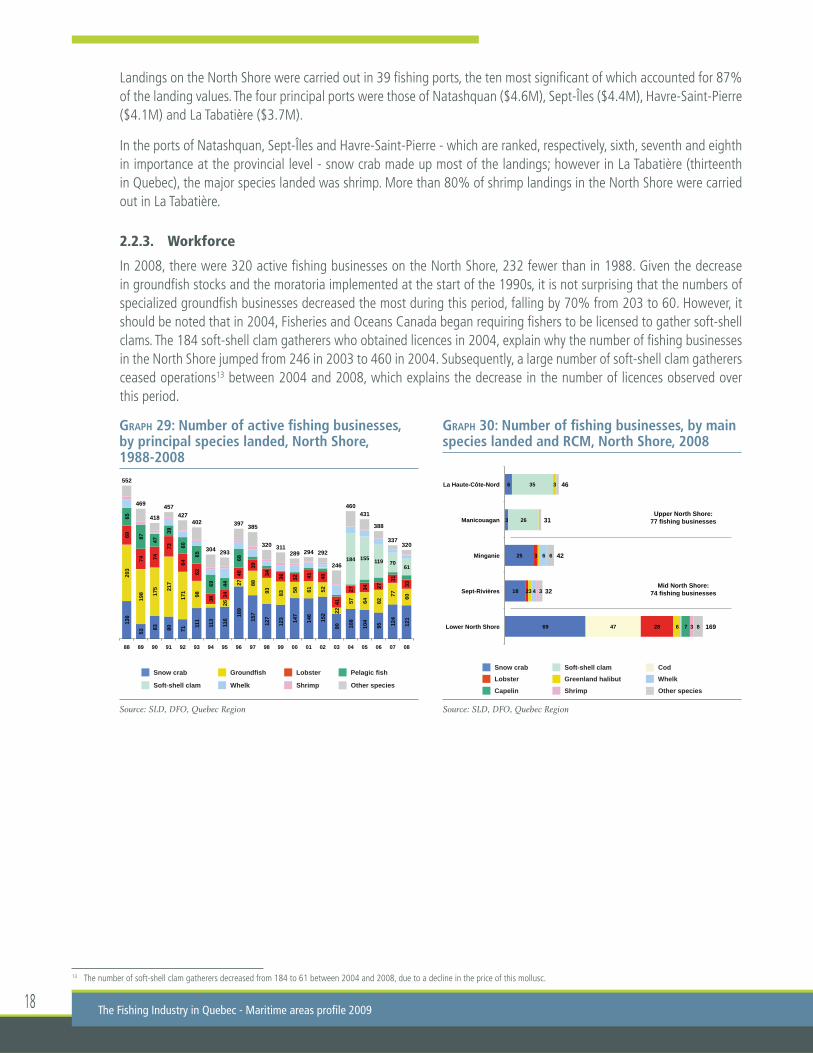
In 2008, there were 320 active fi shing businesses on the North Shore, 232 fewer than in 1988. Given the decrease in groundfi sh stocks and the moratoria implemented at the start of the 1990s, it is not surprising that the numbers of specialized groundfi sh businesses decreased the most during this period, falling by 70% from 203 to 60. However, it should be noted that in 2004, Fisheries and Oceans Canada began requiring fi shers to be licensed to gather soft-shell clams. The 184 soft-shell clam gatherers who obtained licences in 2004, explain why the number of fi shing businesses in the North Shore jumped from 246 in 2003 to 460 in 2004. Subsequently, a large number of soft-shell clam gatherers ceased operations13 between 2004 and 2008, which explains the decrease in the number of licences observed over this period.
13 The number of soft-shell clam gatherers decreased from 184 to 61 between 2004 and 2008, due to a decline in the price of this mollusc.
GRAPH 29: Number of active fi shing businesses, by principal species landed, North Shore, 1988-2008
Source: SLD, DFO, Quebec Region
GRAPH 30: Number of fi shing businesses, by main species landed and RCM, North Shore, 2008
Source: SLD, DFO, Quebec Region
Lobster
Shrimp
Groundfi sh
Whelk
Snow crab
Soft-shell clam
Pelagic fi sh
Other speciesLobster
Shrimp
Greenland halibut Whelk
Snow crab
Capelin
Soft-shell clam Cod
Other species
136
53 83
80
71 11
1
113
116
189
157
127
123 14
7
146
152
90
108
104
95 124
121
203
198 17
5 217
171 98
26
27
88
93
83 58
61
52
22
57
64
82 77
60
69
74
74
73
64
62
38 34
40 39
34
36
32
41
40
41
27
34
27 31
33
65
87
47 39
60
65
69
44
68
184 155 119 70 61
552
469
418
457 427
402
304 293
397 385
320 311 289 294 292
246
460 431
388
337 320
88 89 90 91 92 93 94 95 96 97 98 99 00 01 02 03 04 05 06 07 08
69
18
25
3
6
26
35
47 28
2
3
6
3
3
4
6
7 3 8
3
6
169
32
42
31
46
Lower North Shore
Sept-Rivières
Minganie
Manicouagan
La Haute-Côte-Nord
Upper North Shore: 77 fishing businesses
Mid North Shore: 74 fishing businesses
192-North Shore
Soft-shell clam gatherers (61) were the second most numerous group of fi shers after snow crab fi shers (121), and were just ahead of groundfi sh fi shers (60). The 33 lobster fi shers were ranked fourth.
Although landing value was highest in Mid North Shore in 2008, the Lower North Shore had the largest number of fi shing businesses, 169. Thus, 53% of the North Shore fi shing businesses were located in the Lower North Shore, even though this sub-area only accounted for 31% of landing values.
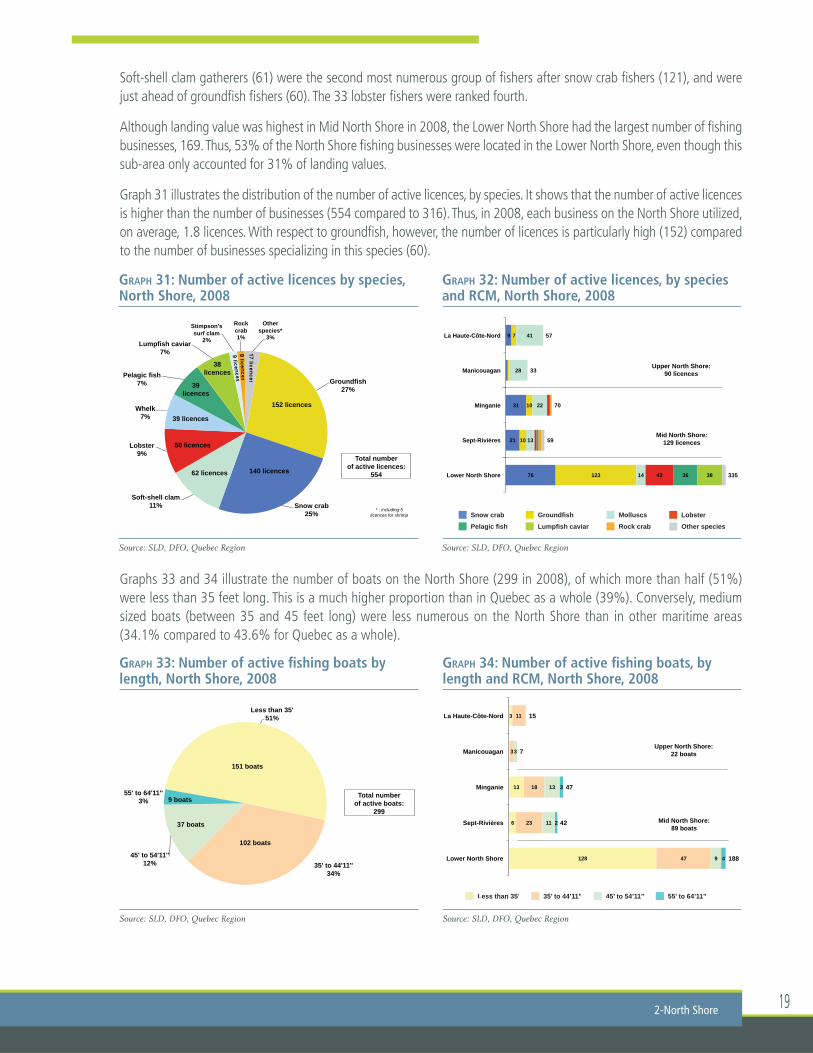
Graph 31 illustrates the distribution of the number of active licences, by species. It shows that the number of active licences is higher than the number of businesses (554 compared to 316). Thus, in 2008, each business on the North Shore utilized, on average, 1.8 licences. With respect to groundfi sh, however, the number of licences is particularly high (152) compared to the number of businesses specializing in this species (60).
Graphs 33 and 34 illustrate the number of boats on the North Shore (299 in 2008), of which more than half (51%) were less than 35 feet long. This is a much higher proportion than in Quebec as a whole (39%). Conversely, medium sized boats (between 35 and 45 feet long) were less numerous on the North Shore than in other maritime areas (34.1% compared to 43.6% for Quebec as a whole).
GRAPH 31: Number of active licences by species, North Shore, 2008
Source: SLD, DFO, Quebec Region
GRAPH 32: Number of active licences, by species and RCM, North Shore, 2008
Source: SLD, DFO, Quebec Region
Lobster
Lumpfi sh caviar
Groundfi sh MolluscsSnow crab
Pelagic fi sh Rock crab Other species
76
21
31
9
123
10
10
7
14
13
22
28
41
43 36 38 335
59
70
33
57
Lower North Shore
Sept-Rivières
Minganie
Manicouagan
La Haute-Côte-Nord
Upper North Shore: 90 licences
Mid North Shore: 129 licences
Groundfish 27%
Snow crab 25%
Soft-shell clam 11%
Lobster 9%
Whelk 7%
Pelagic fish 7%
Lumpfish caviar 7%
Stimpson's surf clam
2%
Rock crab 1%
Other species*
3%
Total number of active licences:
554
152 licences
140 licences 62 licences
50 licences
39 licences
39 licences
38 licences
* : including 5
licences for shrimp
GRAPH 33: Number of active fi shing boats by length, North Shore, 2008
Source: SLD, DFO, Quebec Region
GRAPH 34: Number of active fi shing boats, by length and RCM, North Shore, 2008
Source: SLD, DFO, Quebec Region
Less than 35’ 35’ to 44’11” 45’ to 54’11” 55’ to 64’11”
Less than 35' 51%
35' to 44'11'' 34%
45' to 54'11'' 12%
55' to 64'11'' 3%
Total number of active boats:
299
151 boats
37 boats
9 boats
102 boats
Less than 35’ 35’ to 44’11” 45’ to 54’11” 55’ to 64’11”
128
6
13
3
47
23
18
3
11
9
11
13
3
4
2
3
188
42
47
7
15
Lower North Shore
Sept-Rivières
Minganie
Manicouagan
La Haute-Côte-Nord
Upper North Shore: 22 boats
Mid North Shore: 89 boats

The Fishing Industry in Quebec - Maritime areas profi le 200920
2.2.4. Fishing fl eets
In 2008, almost 76% of the 320 fi shing businesses on the North Shore were included in one of the following four fl eets14: crabbers (121 businesses), Greenland halibut fi shers (15 businesses), cod fi shers (47 businesses) and soft-shell clam gatherers (61 businesses). Graph 35 illustrates the major characteristics of these fl eets. Crabbers and Greenland halibut fi shers have the highest average landing values of, respectively, $152,962 and $71,979. Cod fi shers, with much lower incomes ($11,548), also have smaller boats and crews15. Soft-shell clam gatherers, however, did not use boats or crews. Their average income was calculated at $2,455 for 21.3 days of gathering, an average of $114 per day.
GRAPH 35 : Average characteristics of the main fi shing fl eets on the North Shore, by main species landed, 2008
Source: SLD, DFO, Quebec Region
14 A fl eet is a group of fi shers who fi sh the same principal species (by value). Certain fl eets, such as crabbers, are relatively heterogeneous. 15 The number of crew members includes the captain.
1.0
2.3
3.3
3.5
0.0
25.9
37.9
40.0
21.3
34.4
42.3
38.1
Soft-shell clam
Cod
Greenland halibut
Snow crab
(47 businesses)
(61 businesses)
(121 businesses)
(15 businesses)
$152,962
$71,979
$11,538
$2,455
Number of crew members
Number of days at sea
Landings ($) – Other species
Boat length (feet)Landings ($) – Main species

21
2.3. PROCESSING OF MARINE RESOURCES
2.3.1. Production value and number of jobs
The marine resources processing industry on the North Shore consists of thirty businesses that generally buy fi sh and seafood directly from fi shers, then export or sell these products on the local market. Most of the time, these businesses carry out initial processing (freezing, marinating, cooking, packaging, etc.) before sale. In 2007, fi sh and seafood purchases were $33.0M, while the value of production was calculated at $56.8M, 22.3% of the total for maritime Quebec. The added value was thus $23.8M, the difference between the production and purchase values.16
16 To simplify analysis, we assumed that inputs are limited to seafood purchases, the value of which is generally equivalent to the value of landings.
2-North Shore
GRAPH 36: Production by marine resourcesprocessing businesses in maritime Quebec and on the North Shore, 2007
Source: SLD, DFO, Quebec Region
GRAPH 37: Production by marine resources processing businesses on the North Shore, by species and sub-area, 2007
Source: SLD, DFO, Quebec Region
Mid North ShoreUpper North Shore Lower North Shore
$14.0M $23.9M
$1.2M
$0.7M
$0.9M
$0.9M
$1.0M
$1.2M
$1.6M
$1.9M
$2.9M
$4.3M
$40.2M
Other species
Stimpson's surf clam
Rock crab
Scallop
Lobster
Soft-shell clam
Whelk
Greenland Halibut
Cod
Shrimp
Snow crab
North Shore: $56.8M
Gaspe-Lower St. Lawrence
49.4%
Magdalen Islands; 28.3%
Upper North Shore
7.4%
Mid North Shore
10.8%
Lower North Shore
4.0%
$27.5M
$19.0M
Maritime Quebec: $255.1M
North Shore: $56.8M
North Shore 22.3%
$10.3M
The Fishing Industry in Quebec - Maritime areas profi le 200922
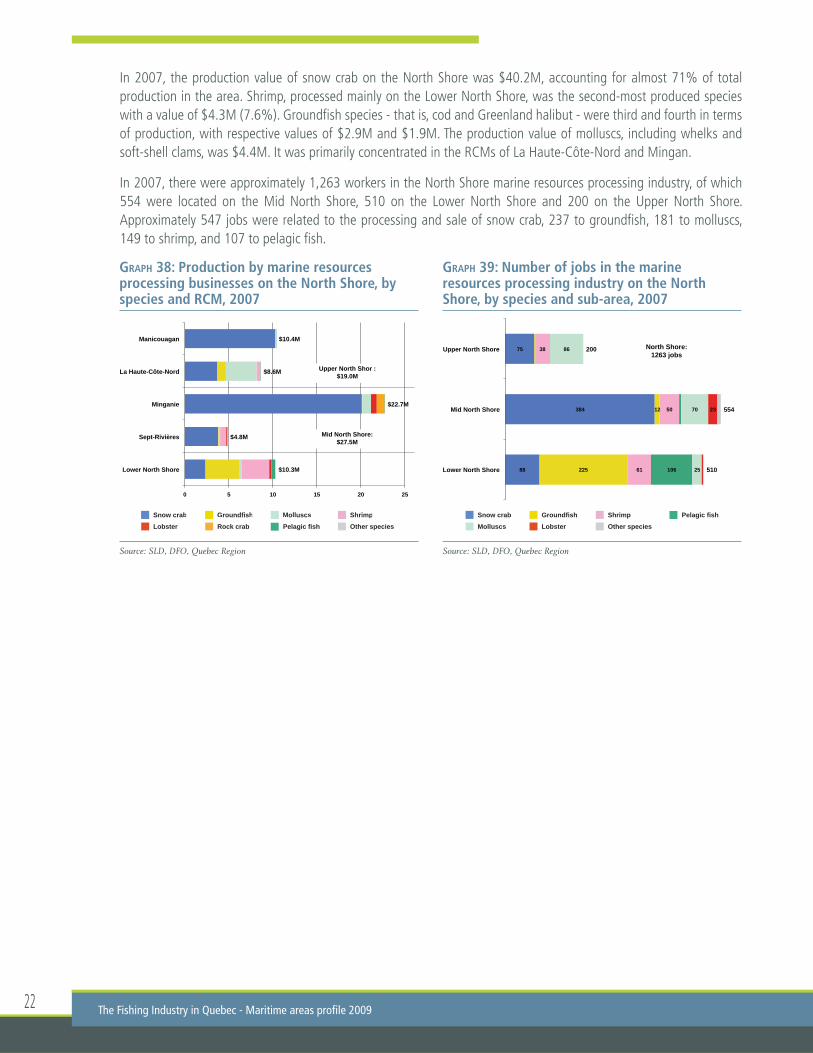
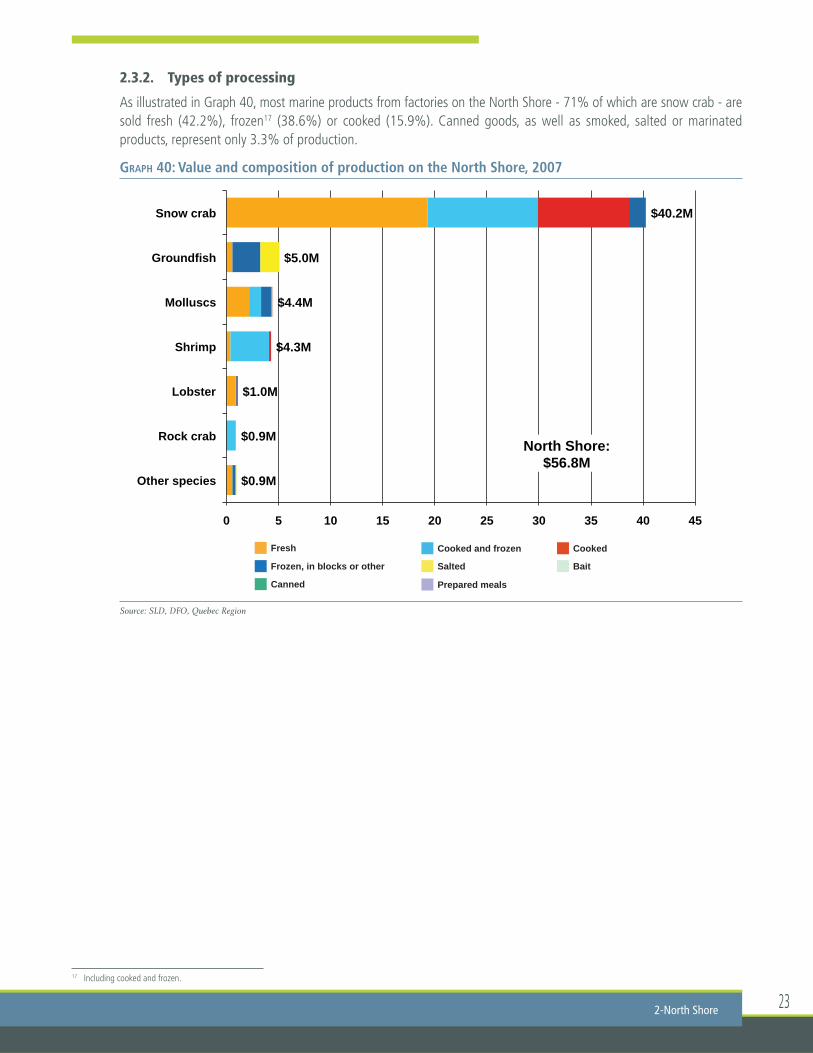
In 2007, the production value of snow crab on the North Shore was $40.2M, accounting for almost 71% of total production in the area. Shrimp, processed mainly on the Lower North Shore, was the second-most produced species with a value of $4.3M (7.6%). Groundfi sh species - that is, cod and Greenland halibut - were third and fourth in terms of production, with respective values of $2.9M and $1.9M. The production value of molluscs, including whelks and soft-shell clams, was $4.4M. It was primarily concentrated in the RCMs of La Haute-Côte-Nord and Mingan.
In 2007, there were approximately 1,263 workers in the North Shore marine resources processing industry, of which 554 were located on the Mid North Shore, 510 on the Lower North Shore and 200 on the Upper North Shore. Approximately 547 jobs were related to the processing and sale of snow crab, 237 to groundfi sh, 181 to molluscs, 149 to shrimp, and 107 to pelagic fi sh.
GRAPH 38: Production by marine resources processing businesses on the North Shore, by species and RCM, 2007
Source: SLD, DFO, Quebec Region
GRAPH 39: Number of jobs in the marine resources processing industry on the North Shore, by species and sub-area, 2007
Source: SLD, DFO, Quebec Region
Lobster
ShrimpGroundfi sh
Molluscs
Snow crab
Other species
Pelagic fi sh
Lobster
ShrimpGroundfi sh
Rock crab
MolluscsSnow crab
Other speciesPelagic fi sh
88
384
75
225
12
61
50
38
106 25
70
86
23
510
554
200
Lower North Shore
Mid North Shore
Upper North Shore North Shore: 1263 jobs
ShrimpGroundfi sh MolluscsSnow crab
$10.3M
$4.8M
$22.7M
$8.6M
$10.4M
0 5 10 15 20 25
Lower North Shore
Sept-Rivières
Minganie
La Haute-Côte-Nord
Manicouagan
Upper North Shor : $19.0M
Mid North Shore: $27.5M
23
2.3.2. Types of processing
As illustrated in Graph 40, most marine products from factories on the North Shore - 71% of which are snow crab - are sold fresh (42.2%), frozen17 (38.6%) or cooked (15.9%). Canned goods, as well as smoked, salted or marinated products, represent only 3.3% of production.
GRAPH 40: Value and composition of production on the North Shore, 2007
Source: SLD, DFO, Quebec Region
2-North Shore
17 Including cooked and frozen.
Cooked and frozen CookedFresh
Salted
Canned
Frozen, in blocks or other Bait
Prepared meals
$0.9M
$0.9M
$1.0M
$4.3M
$4.4M
$5.0M
$40.2M
0 5 10 15 20 25 30 35 40 45
Other species
Rock crab
Lobster
Shrimp
Molluscs
Groundfish
Snow crab
North Shore: $56.8M

The Fishing Industry in Quebec - Maritime areas profi le 200924
2.3.3. Businesses
Of the thirty processing businesses on the North Shore, the ten principal businesses accounted for 92% of production and for 77% of jobs in the industry. The following table provides basic information on these businesses.
TABLE 4: Principal marine resources processing businesses on the North Shore, 2007
Name of buyer Community RCM Sales Number fi gures of jobs
Poissonnerie du Havre Havre-Saint-Pierre Minganie $10M-$15M 100-200
Poséidon Longue-Pointe-de-Mingan Minganie $5M-$10M 50-100
Crustacés Baie-Trinité Baie-Trinité Manicouagan $5M-$10M 100-200
Les Crabiers du Nord Sainte-Anne-de-Portneuf Haute-Côte-Nord $5M-$10M 50-100
La Tabatière Seafood La Tabatière Lower North Shore $5M-$10M 50-100
Groupe Umek Sept-Îles Sept-Rivières $1M-$5M 50-100
LNS Community Seafood Harrington Harbour Lower North Shore $1M-$5M 10-50Coop
Poissonnerie Laprise Chute-aux-Outardes Manicouagan $1M-$5M 10-50
Blanc Sablon Seafood Blanc-Sablon Lower North Shore $1M-$5M 200-300
Coquillages Nordiques Forestville Haute-Côte-Nord $1M-$5M 1-50
The other 20 $4.6M 289businesses
TOTAL $56.8M 1,263
Source: SLD, DFO, Quebec Region
25
3MAGDALEN ISLANDS
3.1. SOCIO-ECONOMIC PROFILE
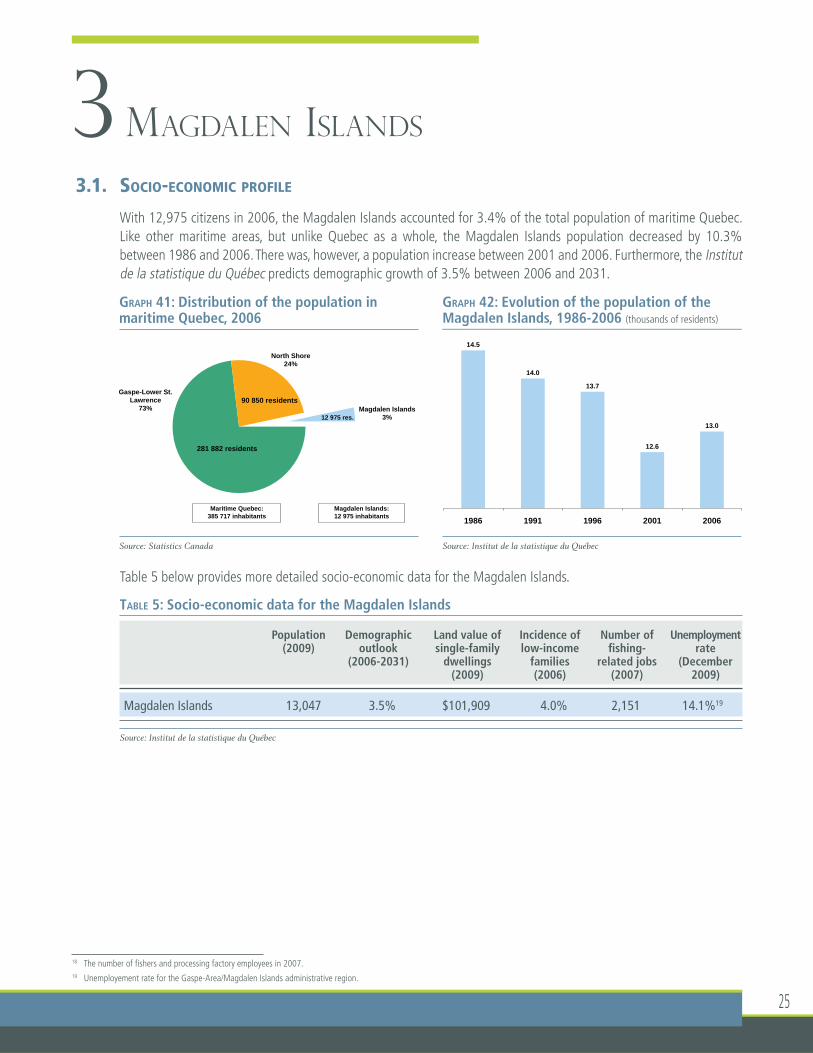
With 12,975 citizens in 2006, the Magdalen Islands accounted for 3.4% of the total population of maritime Quebec. Like other maritime areas, but unlike Quebec as a whole, the Magdalen Islands population decreased by 10.3% between 1986 and 2006. There was, however, a population increase between 2001 and 2006. Furthermore, the Institut de la statistique du Québec predicts demographic growth of 3.5% between 2006 and 2031.
Table 5 below provides more detailed socio-economic data for the Magdalen Islands.
TABLE 5: Socio-economic data for the Magdalen Islands
Population Demographic Land value of Incidence of Number of Unemployment (2009) outlook single-family low-income fi shing- rate (2006-2031) dwellings families related jobs (December (2009) (2006) (2007) 2009)
Magdalen Islands 13,047 3.5% $101,909 4.0% 2,151 14.1%19
Source: Institut de la statistique du Québec
18 The number of fi shers and processing factory employees in 2007.19 Unemployement rate for the Gaspe-Area/Magdalen Islands administrative region.
GRAPH 41: Distribution of the population in maritime Quebec, 2006
Source: Statistics Canada
GRAPH 42: Evolution of the population of the Magdalen Islands, 1986-2006 (thousands of residents)
Source: Institut de la statistique du Québec
Gaspe-Lower St. Lawrence
73%
North Shore 24%
Magdalen Islands 3%
281 882 residents
12 975 res.
90 850 residents
Maritime Quebec: 385 717 inhabitants
Magdalen Islands: 12 975 inhabitants
agda e s a ds, 986 006 (t ousa ds o es de ts)
14.5
14.0
13.7
12.6
13.0
1986 1991 1996 2001 2006
The Fishing Industry in Quebec - Maritime areas profi le 200926
3.2. THE FISHING INDUSTRY
3.2.1. Evolution of landings
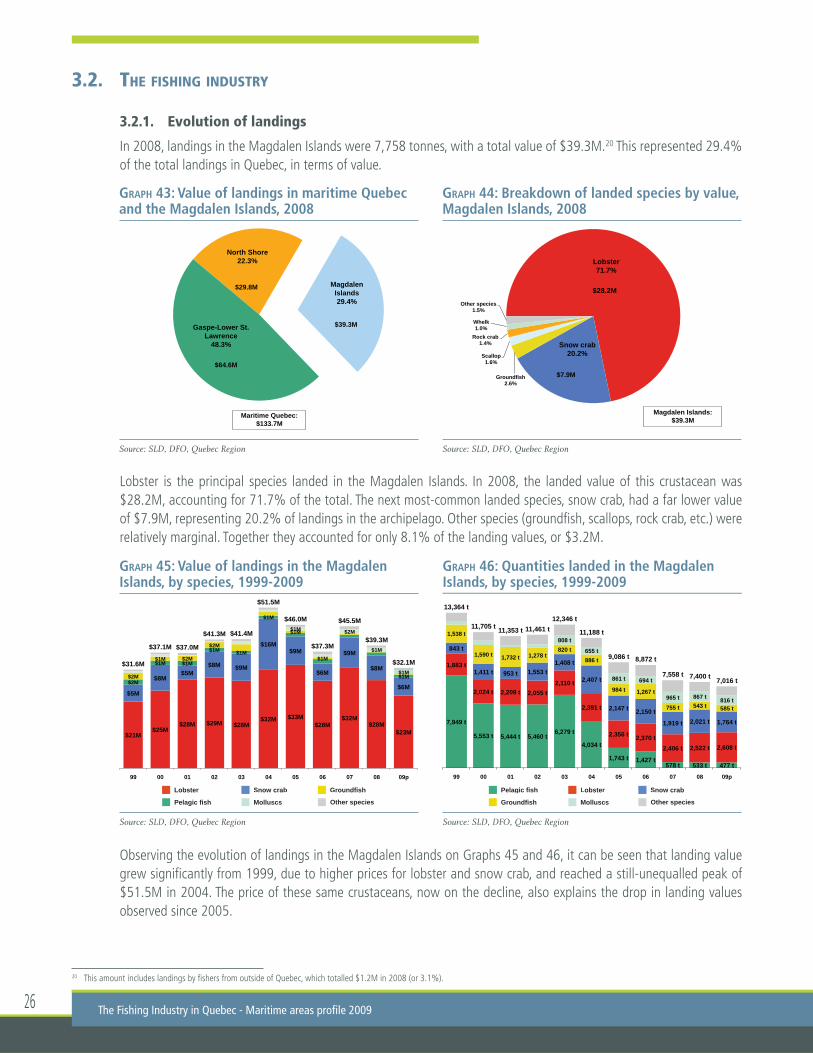
In 2008, landings in the Magdalen Islands were 7,758 tonnes, with a total value of $39.3M.20 This represented 29.4% of the total landings in Quebec, in terms of value.
Lobster is the principal species landed in the Magdalen Islands. In 2008, the landed value of this crustacean was $28.2M, accounting for 71.7% of the total. The next most-common landed species, snow crab, had a far lower value of $7.9M, representing 20.2% of landings in the archipelago. Other species (groundfi sh, scallops, rock crab, etc.) were relatively marginal. Together they accounted for only 8.1% of the landing values, or $3.2M.
Observing the evolution of landings in the Magdalen Islands on Graphs 45 and 46, it can be seen that landing value grew signifi cantly from 1999, due to higher prices for lobster and snow crab, and reached a still-unequalled peak of $51.5M in 2004. The price of these same crustaceans, now on the decline, also explains the drop in landing values observed since 2005.
20 This amount includes landings by fi shers from outside of Quebec, which totalled $1.2M in 2008 (or 3.1%).
GRAPH 43: Value of landings in maritime Quebec and the Magdalen Islands, 2008
Source: SLD, DFO, Quebec Region
GRAPH 44: Breakdown of landed species by value, Magdalen Islands, 2008
Source: SLD, DFO, Quebec Region
North Shore 22.3%
Magdalen Islands 29.4%
Gaspe-Lower St. Lawrence
48.3%
Maritime Quebec: $133.7M
$29.8M
$39.3M
$64.6M
Lobster 71.7%
Snow crab 20.2%
Groundfish 2.6%
Scallop 1.6%
Rock crab 1.4%
Whelk 1.0%
Other species 1.5%
Magdalen Islands: $39.3M
$28.2M
$7.9M
GRAPH 45: Value of landings in the Magdalen Islands, by species, 1999-2009
Source: SLD, DFO, Quebec Region
GRAPH 46: Quantities landed in the Magdalen Islands, by species, 1999-2009
Source: SLD, DFO, Quebec Region
Lobster Groundfi shSnow crab
MolluscsPelagic fi sh Other species
Lobster
Groundfi sh
Snow crab
Molluscs
Pelagic fi sh
Other species
Lobster Groundfi shSnow crab
$21M $25M
$28M $29M $28M $32M $33M
$28M $32M
$28M $23M
$5M
$8M $5M
$8M $9M
$16M $9M
$6M
$9M
$8M
$6M $2M
$1M $1M
$1M $1M
$1M
$1M $2M
$1M $2M
$2M
$1M
$1M
$1M $2M
$1M
$1M $31.6M
$37.1M $37.0M
$41.3M $41.4M
$51.5M
$46.0M
$37.3M
$45.5M
$39.3M
$32.1M
99 00 01 02 03 04 05 06 07 08 09p
Lobster Snow crabPelagic fi sh
7,949 t
5,553 t 5,444 t 5,460 t 6,279 t
4,034 t
1,743 t 1,427 t 578 t 533 t 477 t
1,883 t
2,024 t 2,209 t 2,055 t 2,110 t
2,391 t
2,356 t 2,370 t 2,406 t 2,522 t 2,608 t
843 t
1,411 t 953 t 1,553 t 1,408 t
2,407 t
2,147 t 2,150 t
1,919 t 2,021 t 1,764 t
1,538 t
1,590 t 1,732 t 1,278 t 820 t
886 t
984 t 1,267 t
755 t 543 t 585 t
808 t
655 t
861 t 694 t
965 t 867 t 816 t
13,364 t
11,705 t 11,353 t 11,461 t 12,346 t
11,188 t
9,086 t 8,872 t
7,558 t 7,400 t 7,016 t
99 00 01 02 03 04 05 06 07 08 09p

27
3.2.2. Landings by fi shing port
Landings in the Magdalen Islands were carried out at ten different fi shing ports. Several of these were among the most signifi cant ports in Quebec, in particular Grande-Entrée (second in Quebec) and Cap-aux-Meules (third in Quebec). The Cap-aux-Meules port received most of the landings of snow crab (69.0%), groundfi sh (48.9%) and molluscs (45.5%) in the Magdalen Islands. With this exception, lobster was the main landed species at all Magdalen Islands fi shing ports; including at Grande-Entrée, which was the most signifi cant port in Quebec in terms of lobster landings.
GRAPH 47: Value of landings at the 10 Magdalen Islands fi shing ports, by species, 2008
Source: SLD, DFO, Quebec Region
3- Magdalen Islands
Lobster
Groundfi sh
Snow crab Molluscs
Pelagic fi sh Other species
0.1M$
0.6M$
1.2M$
1.6M$
2.4M$
3.2M$
3.9M$
4.0M$
10.3M$
12.0M$
0 2 4 6 8 10 12 14
Havre-aux-Maisons
Pointe-aux-Loups
L'Île d'entrée
Havre-Aubert
Millerand
Pointe-Basse
Grosse-Île
L'Étang-du-Nord
Cap-aux-Meules
Grande-Entrée
Magdalen Islands: $39.3M

The Fishing Industry in Quebec - Maritime areas profi le 200928
MAP 5 : The 10 fi shing ports in the Magdalen Islands, 2008
3.2.3. Workforce and fi shing fl eet
In 2008, there were 409 active fi shing businesses in the Magdalen Islands. Not surprisingly, businesses specializing in lobster were by far the most numerous (325), accounting for almost 80% of all fi shing businesses in the archipelago. Among the 84 other businesses, 40 landed mainly snow crab, 25 captured Atlantic surf clam, and 8 fi shed groundfi sh.
Graph 50 lists the number of boats in the Magdalen Islands by length. Of the 379 boats that were active in 2007, more than three quarters (76%) were between 35 and 45 feet in length, a much higher proportion than in Quebec as a whole (43.6%). Conversely, boats less than 35 feet long (18%), and more than 45 feet long (6%), were far less numerous than in Quebec as a whole.
Source: SLD and FHAMIS, DFO, Quebec Region

29
In 2008, almost 90% of the 409 Magdalen Islands fi shing businesses principally landed lobster (325 businesses) or snow crab (40 businesses). Graph 51 illustrates several characteristics of these two fl eets. The average fi shing income for crabbers was noticeably higher than that of the lobster fi shers ($156,381 vs. $91,469). Crabbers boats were also longer (45.7 feet vs. 39.0 feet), and supported on average more crew members21 per business (3.9 vs. 2.7). Lobster fi shers, however, spent, on average, more days at sea than crabbers (55 vs. 41).
3- Magdalen Islands
21 The number of crew members includes the captain.
GRAPH 48: Number of active fi shing businesses, by principal landed species, Magdalen Islands, 1988-2008
Source: SLD, DFO, Quebec Region
GRAPH 49: Number of active licences by species, Magdalen Islands, 2008
Source: SLD, DFO, Quebec Region
Lobster Groundfi shSnow crab
Atlantic surf clamPelagic fi sh Other species
321
324
324
327
328
328
328
328
328
327
326
329
327
328
329
325
324
326
328
324
325
7 11 27 26 17 16 22 25 32 42 47 40 36 42 40 49 59 56 44 40 23 9 12 13
8
39 18 11 22 28 43
47 40 29 28 23 14 11 27 37 39 26
424 417 410 403 410 412 400 394 397 405
392 384 379 375 382 383 383 408
420 418 409
88 89 90 91 92 93 94 95 96 97 98 99 00 01 02 03 04 05 06 07 08
Lobster 50%
Groundfish 15%
Pelagic fish 10%
Snow crab 7%
Atlantic surf clam
5%
Rock crab 5%
Scallop 3%
Other species
2%
Total number of active licences:
660
327 licences
98 licences
65 licences
34 licences
34 licences
47 licences
GRAPH 50: Number of active fi shing boats, by length, Magdalen Islands, 2008
Source: SLD, DFO, Quebec Region
GRAPH 51: Average characteristics of the main fi shing fl eets in the Magdalen Islands, by main species landed, 2008
Source: SLD, DFO, Quebec Region
Number of crew members
Number of days at seaLandings ($) – Other species Boat length (feet)Landings ($) – Main species
2.7
3.9
39.0
45.7
55.2
41.3
Lobster
Snow crab
(325 businesses)
(40 businesses)
$156,381
$91,469
Less than 35' 18%
35' to 44'11'' 76%
45' to 54'11'' 3%
55' to 64'11'' 3% Total number
of active boats: 379
67 boats
10 boats
289 boats
The Fishing Industry in Quebec - Maritime areas profi le 200930
3.3. PROCESSING OF MARINE RESOURCES
3.3.1. Production value and number of jobs
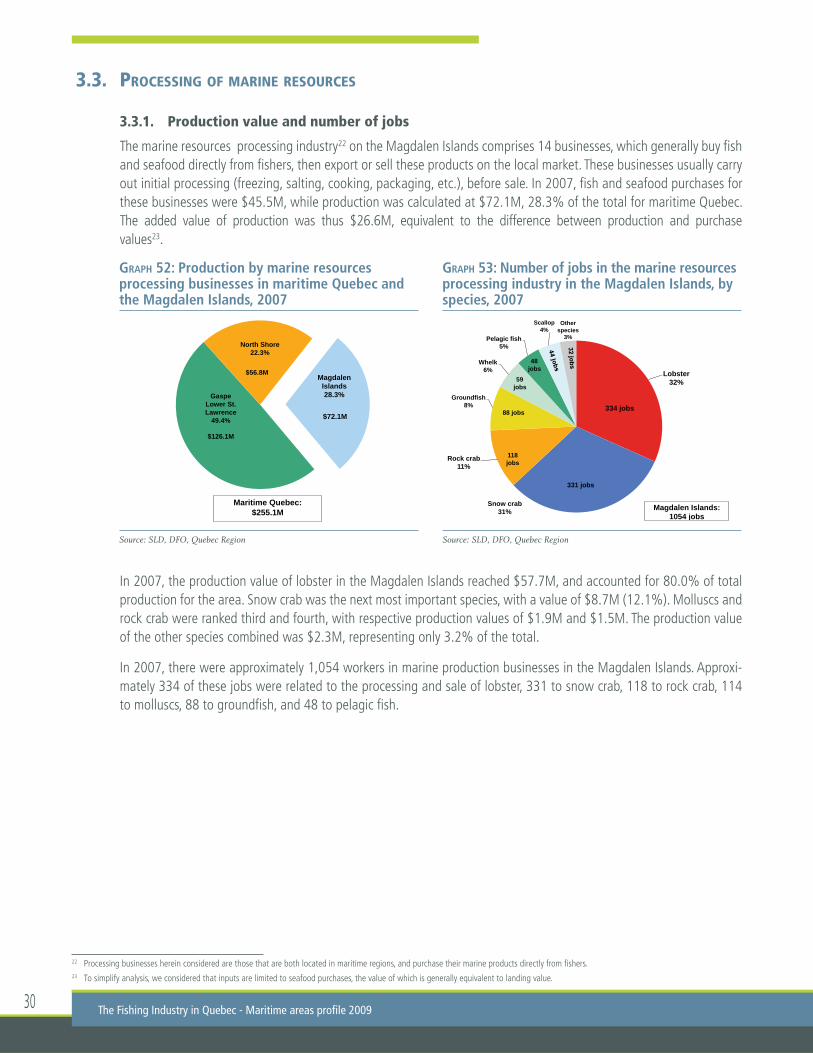
The marine resources processing industry22 on the Magdalen Islands comprises 14 businesses, which generally buy fi sh and seafood directly from fi shers, then export or sell these products on the local market. These businesses usually carry out initial processing (freezing, salting, cooking, packaging, etc.), before sale. In 2007, fi sh and seafood purchases for these businesses were $45.5M, while production was calculated at $72.1M, 28.3% of the total for maritime Quebec. The added value of production was thus $26.6M, equivalent to the difference between production and purchase values23.
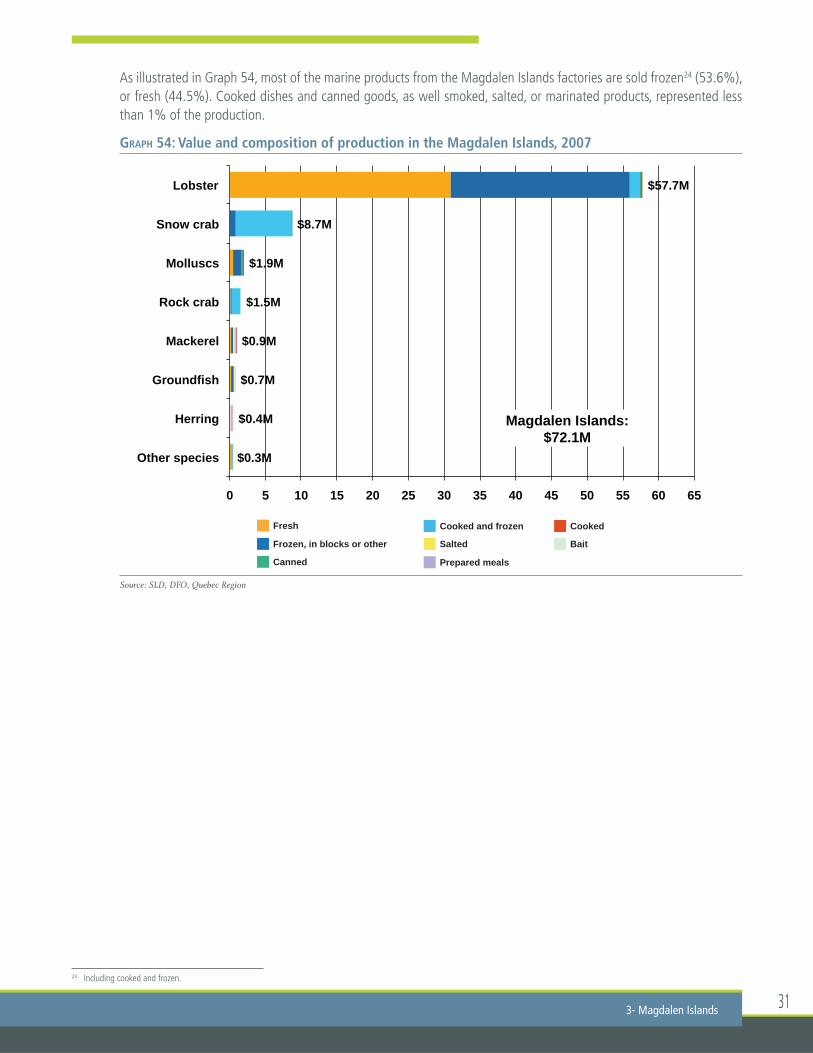
In 2007, the production value of lobster in the Magdalen Islands reached $57.7M, and accounted for 80.0% of total production for the area. Snow crab was the next most important species, with a value of $8.7M (12.1%). Molluscs and rock crab were ranked third and fourth, with respective production values of $1.9M and $1.5M. The production value of the other species combined was $2.3M, representing only 3.2% of the total.
In 2007, there were approximately 1,054 workers in marine production businesses in the Magdalen Islands. Approxi-mately 334 of these jobs were related to the processing and sale of lobster, 331 to snow crab, 118 to rock crab, 114 to molluscs, 88 to groundfi sh, and 48 to pelagic fi sh.
22 Processing businesses herein considered are those that are both located in maritime regions, and purchase their marine products directly from fi shers. 23 To simplify analysis, we considered that inputs are limited to seafood purchases, the value of which is generally equivalent to landing value.
GRAPH 52: Production by marine resources processing businesses in maritime Quebec and the Magdalen Islands, 2007
Source: SLD, DFO, Quebec Region
GRAPH 53: Number of jobs in the marine resources processing industry in the Magdalen Islands, by species, 2007
Source: SLD, DFO, Quebec Region
Lobster 32%
Snow crab 31%
Rock crab 11%
Groundfish 8%
Whelk 6%
Pelagic fish 5%
Scallop 4%
Other species
3%
334 jobs
331 jobs
118 jobs
88 jobs
59 jobs
48 jobs
Magdalen Islands: 1054 jobs
Gaspe Lower St. Lawrence
49.4%
North Shore 22.3%
Magdalen Islands 28.3%
$56.8M
$126.1M
Maritime Quebec: $255.1M
$72.1M
31
As illustrated in Graph 54, most of the marine products from the Magdalen Islands factories are sold frozen24 (53.6%), or fresh (44.5%). Cooked dishes and canned goods, as well smoked, salted, or marinated products, represented less than 1% of the production.
GRAPH 54: Value and composition of production in the Magdalen Islands, 2007
Source: SLD, DFO, Quebec Region
24 Including cooked and frozen.
3- Magdalen Islands
Cooked and frozen CookedFresh
Salted
Canned
Frozen, in blocks or other Bait
Prepared meals
$0.3M
$0.4M
$0.7M
$0.9M
$1.5M
$1.9M
$8.7M
$57.7M
0 5 10 15 20 25 30 35 40 45 50 55 60 65
Other species
Herring
Groundfish
Mackerel
Rock crab
Molluscs
Snow crab
Lobster
Magdalen Islands: $72.1M
The Fishing Industry in Quebec - Maritime areas profi le 200932
3.3.2. Businesses
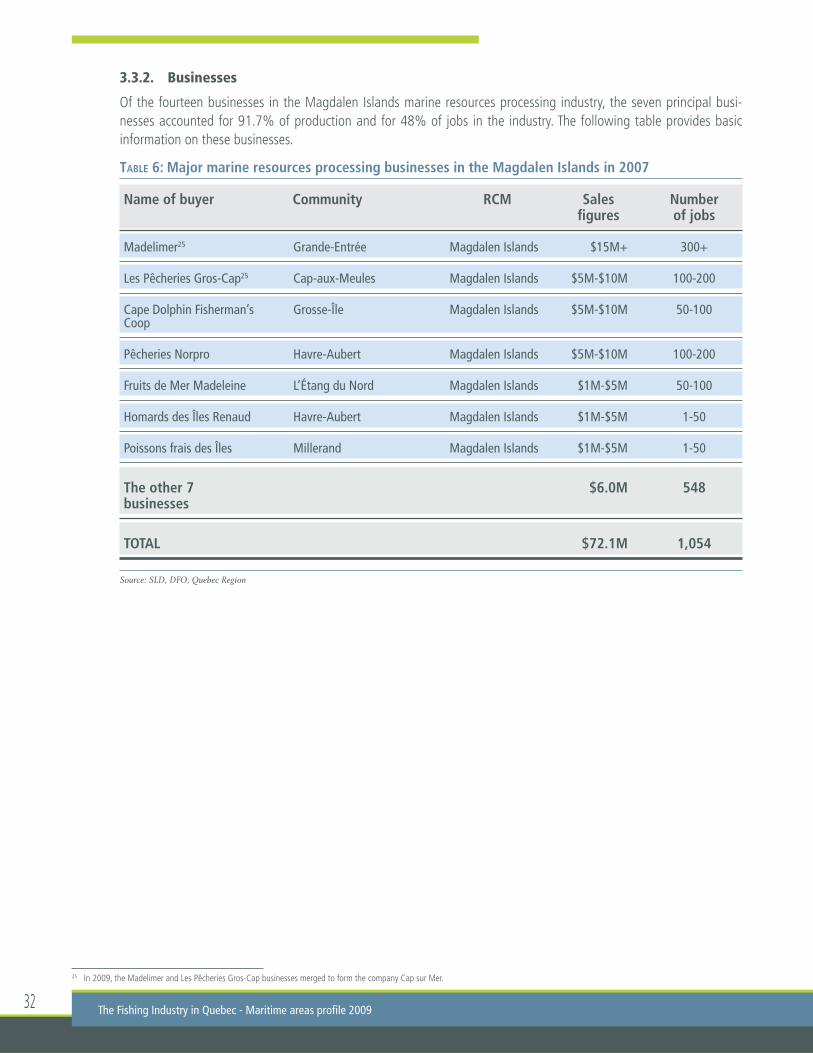
Of the fourteen businesses in the Magdalen Islands marine resources processing industry, the seven principal busi-nesses accounted for 91.7% of production and for 48% of jobs in the industry. The following table provides basic information on these businesses.
TABLE 6: Major marine resources processing businesses in the Magdalen Islands in 2007
Name of buyer Community RCM Sales Number fi gures of jobs
Madelimer25 Grande-Entrée Magdalen Islands $15M+ 300+
Les Pêcheries Gros-Cap25 Cap-aux-Meules Magdalen Islands $5M-$10M 100-200
Cape Dolphin Fisherman’s Grosse-Île Magdalen Islands $5M-$10M 50-100Coop
Pêcheries Norpro Havre-Aubert Magdalen Islands $5M-$10M 100-200
Fruits de Mer Madeleine L’Étang du Nord Magdalen Islands $1M-$5M 50-100
Homards des Îles Renaud Havre-Aubert Magdalen Islands $1M-$5M 1-50
Poissons frais des Îles Millerand Magdalen Islands $1M-$5M 1-50
The other 7 $6.0M 548businesses
TOTAL $72.1M 1,054
Source: SLD, DFO, Quebec Region
25 In 2009, the Madelimer and Les Pêcheries Gros-Cap businesses merged to form the company Cap sur Mer.
33
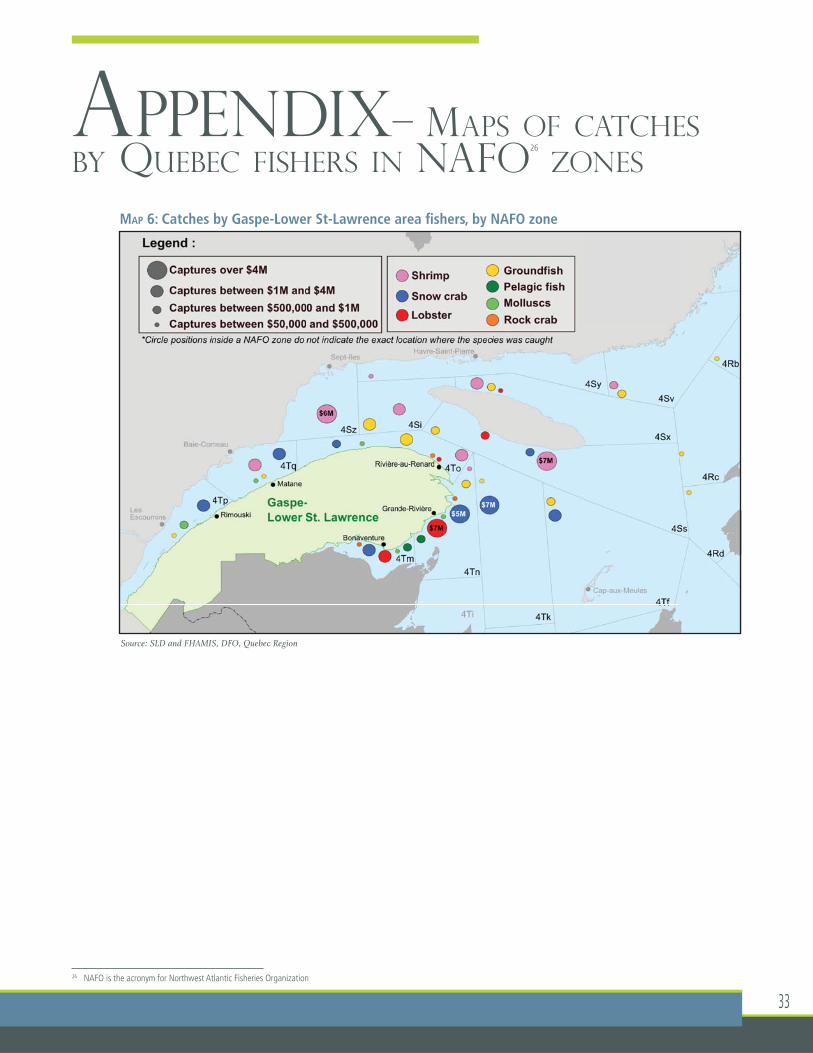
APPENDIX – MAPS OF CATCHES BY QUEBEC FISHERS IN NAFO
26
ZONES
MAP 6: Catches by Gaspe-Lower St-Lawrence area fi shers, by NAFO zone
Source: SLD and FHAMIS, DFO, Quebec Region
26 NAFO is the acronym for Northwest Atlantic Fisheries Organization
The Fishing Industry in Quebec - Maritime areas profi le 200934
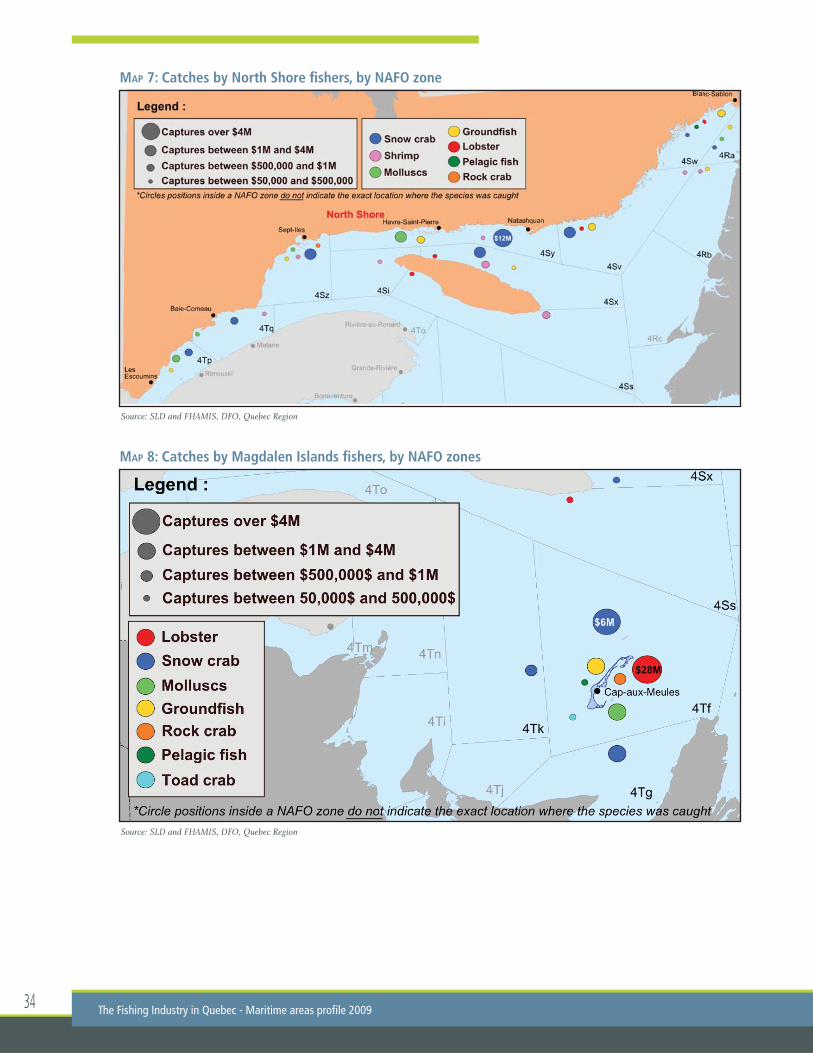
MAP 7: Catches by North Shore fi shers, by NAFO zone
MAP 8: Catches by Magdalen Islands fi shers, by NAFO zones
Source: SLD and FHAMIS, DFO, Quebec Region
Source: SLD and FHAMIS, DFO, Quebec Region

