the five basic institutions five basic tasks church family school government market instrumental...
TRANSCRIPT
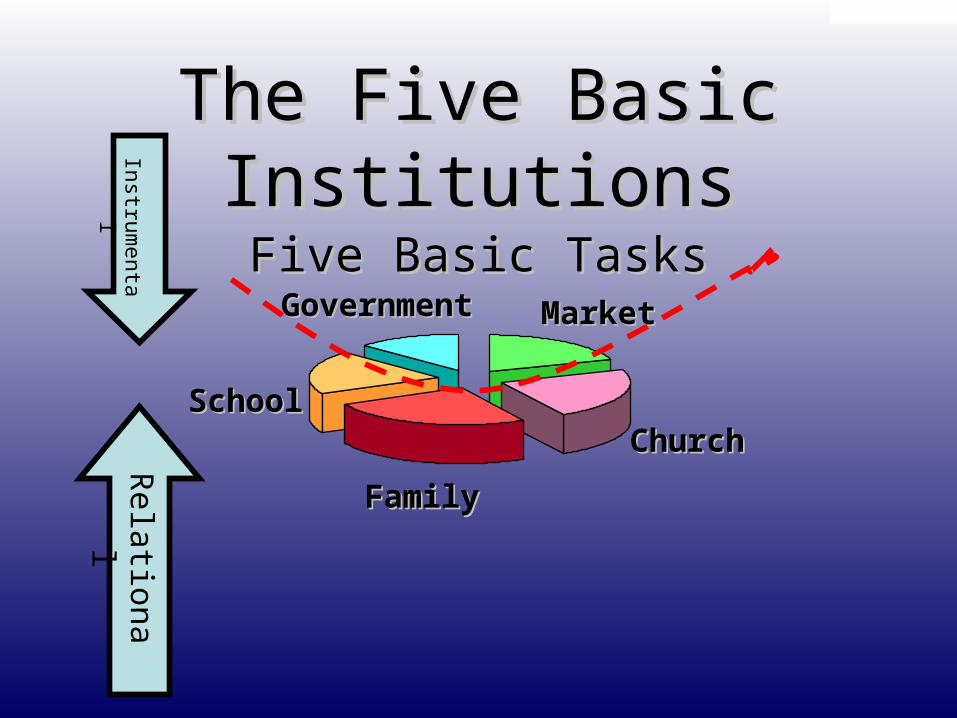
The Five Basic InstitutionsThe Five Basic InstitutionsFive Basic TasksFive Basic Tasks
ChurchChurch
FamilyFamily
SchoolSchool
GovernmentGovernment MarketMarket
Instru
menta
lR
ela
tion
al

Buildings ReflectBuildings ReflectSociety’s Fundamental TasksSociety’s Fundamental Tasks
ChurchChurch
FamilyFamily
SchoolSchool
GovernmentGovernment MarketMarket
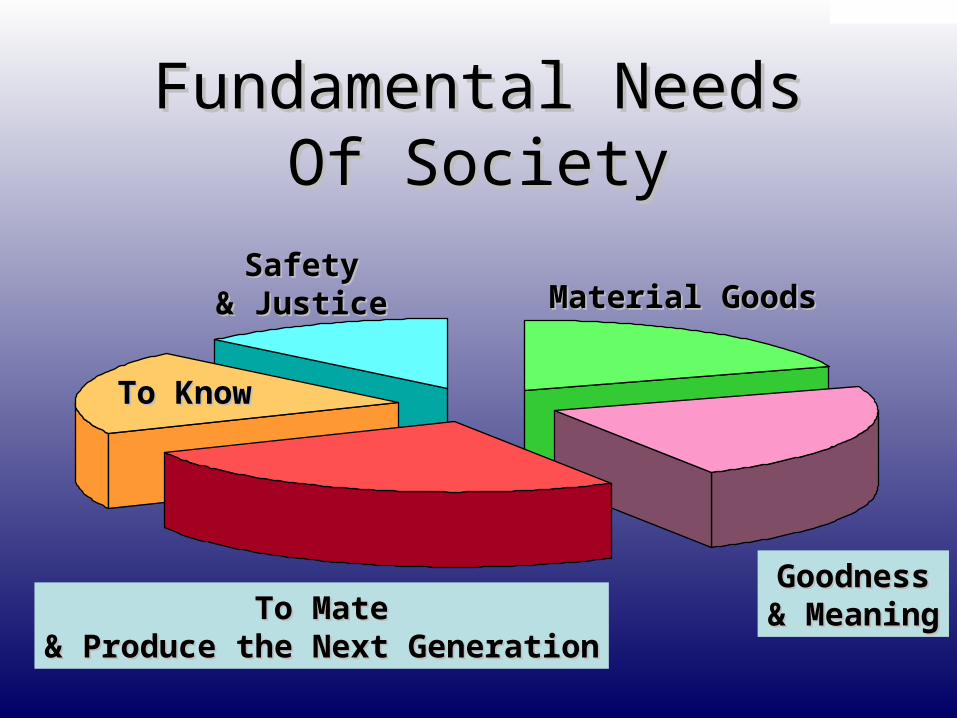
Fundamental NeedsFundamental NeedsOf SocietyOf Society
GoodnessGoodness& Meaning& MeaningTo MateTo Mate
& Produce the Next Generation& Produce the Next Generation
To KnowTo Know
SafetySafety& Justice& Justice Material GoodsMaterial Goods

Fundamental CapacitiesFundamental Capacities
ReflectionReflectionSexualitySexuality
IntelligenceIntelligence
Force / Force / BenevolenceBenevolence
WorkWork

Fundamental TasksFundamental TasksOf the IndividualOf the Individual
ChurchChurchFamilyFamily
SchoolSchool
GovGov MarketMarket
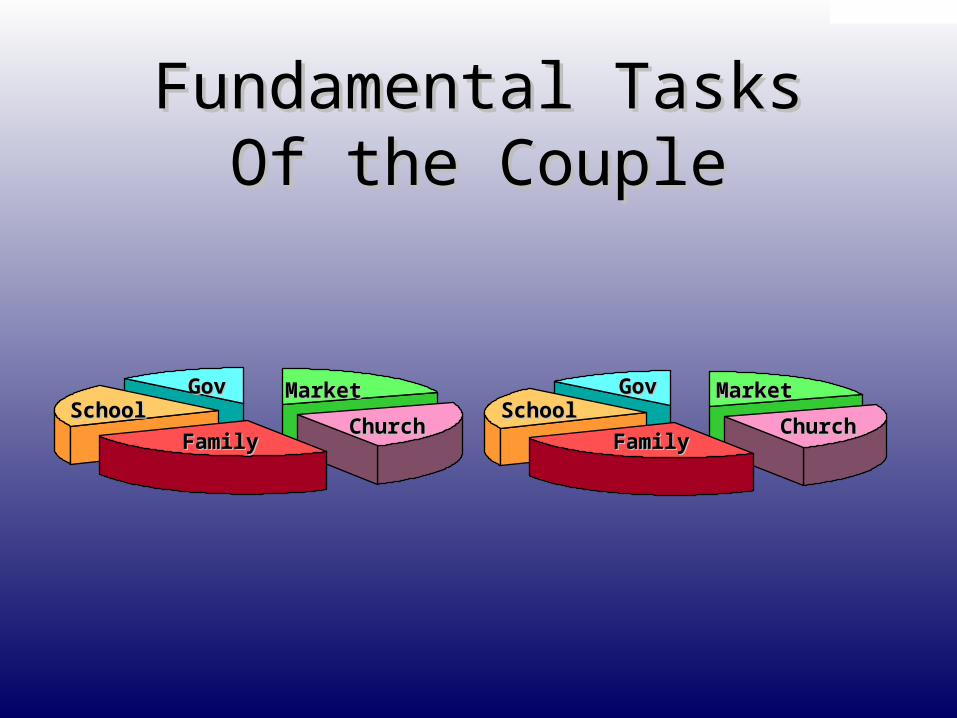
Fundamental TasksFundamental TasksOf the CoupleOf the Couple
ChurchChurchFamilyFamily
SchoolSchoolGovGov MarketMarket
ChurchChurchFamilyFamily
SchoolSchoolGovGov MarketMarket

Fundamental TasksFundamental TasksOf the FamilyOf the Family
ChurchChurchFamilyFamily
SchoolSchoolGovGov MarketMarket
ChurchChurchFamilyFamily
SchoolSchoolGovGov MarketMarket
ChurchChurchFamilyFamily
SchoolSchoolGovGov MarketMarket
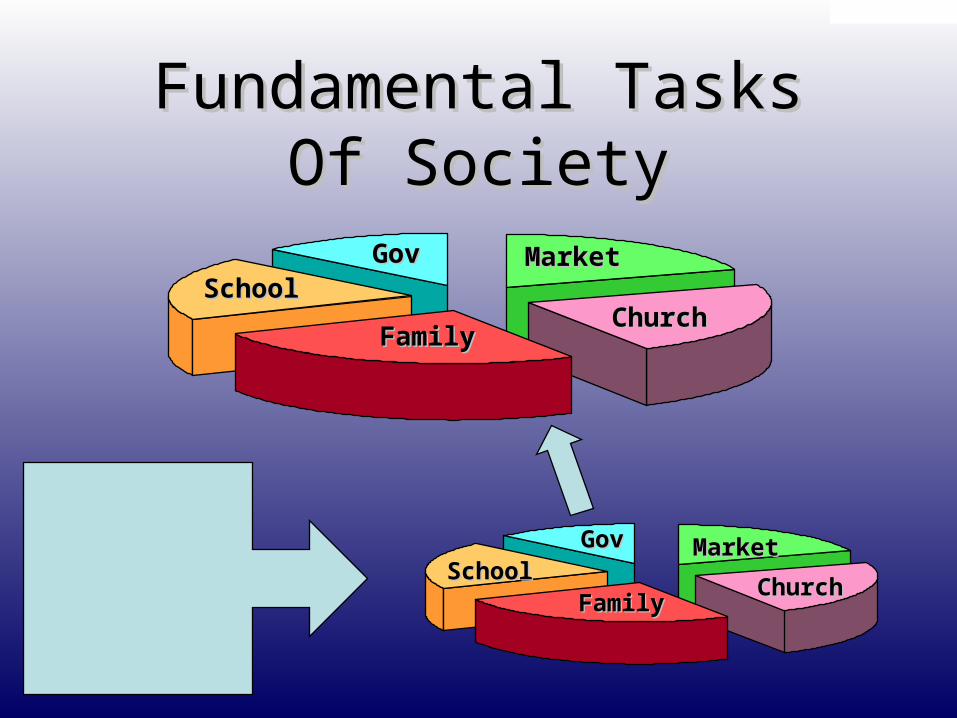
Fundamental TasksFundamental TasksOf SocietyOf Society
ChurchChurchFamilyFamily
SchoolSchoolGovGov MarketMarket
ChurchChurchFamilyFamily
SchoolSchoolGovGov MarketMarket
ChurchChurchFamilyFamily
SchoolSchoolGovGov MarketMarket
ChurchChurchFamilyFamily
SchoolSchoolGovGov MarketMarket

Belonging: Male + Female Belonging: Male + Female
FamilyFamily
Child / AdultChild / Adult
Father Father MotherMother
Society At LargeSociety At Large
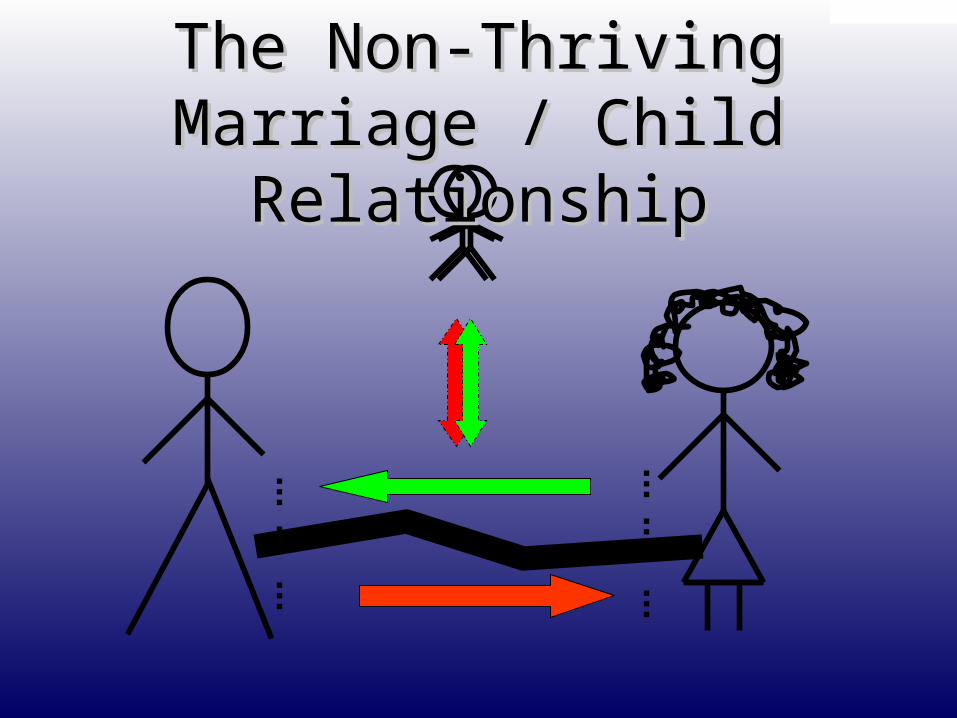
The Non-ThrivingThe Non-ThrivingMarriage / Child RelationshipMarriage / Child Relationship

Society’s Foundational RelationshipSociety’s Foundational Relationship
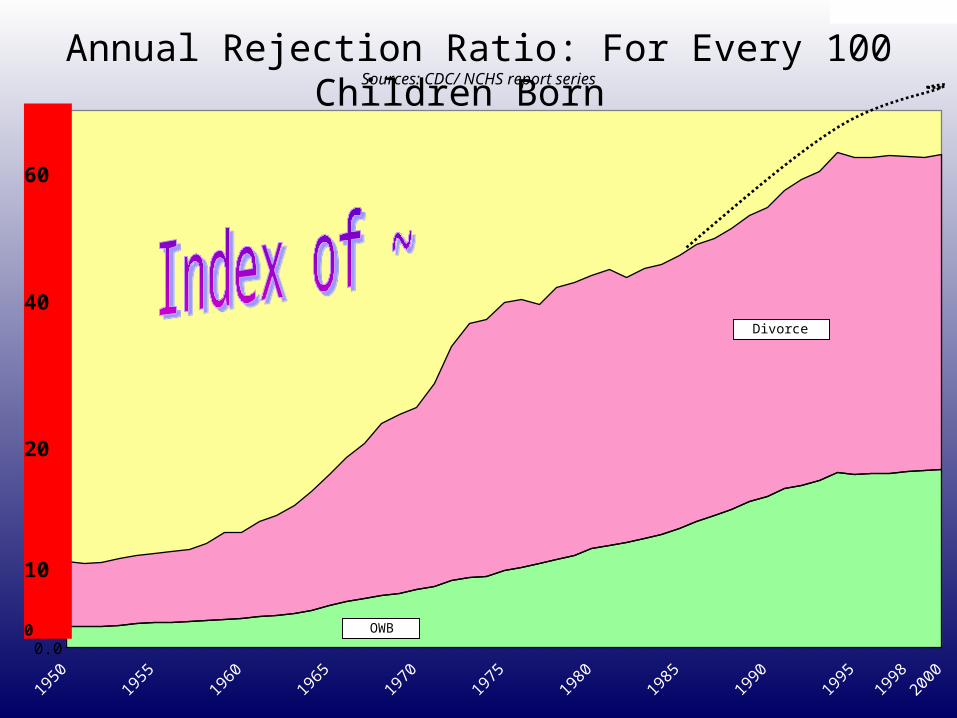
Annual Rejection Ratio: For Every 100 Children Born Sources: CDC/ NCHS report series
0.0
10.0
20.0
30.0
40.0
50.0
60.0
70.0
80.0
90.060
40
20
10
0
1950
1955
1960
1965
1970
1975
1980
1985
1990
1995
1998
2000
Divorce
OWB

Belonging and Rejection Ratio for the US, 2008 Source: Am. Comm Survey 2008
45.4
54.6
0
10
20
30
40
50
60
BELONGING REJECTION

Index of Belonging, Ethnic GroupsSource: American Community Survey 2008
23.8%
40.2%
53.8%
62.0%
17.4%
45.4%
0.0%
10.0%
20.0%
30.0%
40.0%
50.0%
60.0%
70.0%
U.S. Black American Indian &Alaskan Native
Hispanic White Asian

Index of Belonging for the StatesSource: American Community Survey 2008
0.0
10.0
20.0
30.0
40.0
50.0
60.0
70.0
16 32 34 37 37 38 39 39 40 40 40 41 42 42 42 42 42 42 43 43 43 44 45 45 45 45 45 46 46 47 47 47 47 48 48 48 49 49 49 49 49 50 52 52 53 54 54 55 55 57 58 59
DC
MS
LA
AR
AL
GA
SC
TN
NM
OK
FL
NV
AZ
KY
WV
MO
NC
DE
SD
MD
IN
OR
AK
MI
RI
TX
US
HI
CA
WA
VA
OH
WY
ME
KS
VT
CT
IL
NY
CO
PA
WI
MT
ID
ND
MA
IA
NE
NJ
MN
NH
UT

International Rejection Ratio
0
10
20
30
40
50
60
70
80
90
100
Taiwan
Taiwan
China
China
Mac
edon
ia
Mac
edon
ia
Croati
a
Croati
a
Japa
nJa
pan
New Z
ealan
d
New Z
ealan
d
Serbia
and M
onten
egro
Serbia
and M
onten
egro
Switzerl
and
Switzerl
and
Slova
kia
Slova
kia
Portu
gal
Portu
gal
Netherl
ands
Netherl
ands
Georg
ia
Georg
ia
Lithua
nia
Lithua
nia
Slove
nia
Slove
nia
Czech
Rep
ublic
Czech
Rep
ublic
Canad
a
Canad
a
United
Stat
es
United
Stat
es
Finlan
d
Finlan
d
France
France
New C
alced
onia
New C
alced
onia
Denmark
Denmark
Sweden
Sweden
El Salv
ador
El Salv
ador
Urugu
ay
Urugu
ay
Jamaic
a
Jamaic
a
U
S
A

Belonging: Male + Female Belonging: Male + Female
FamilyFamily
Child / AdultChild / Adult
Father Father MotherMother
Society At LargeSociety At Large
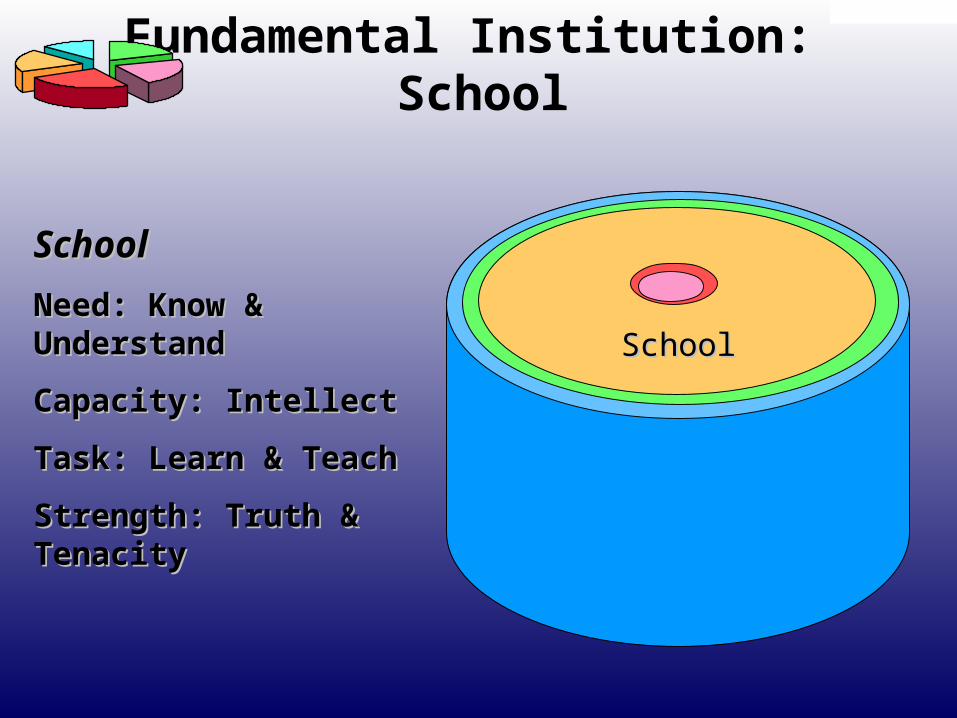
Fundamental Institution: School
SchoolSchool
Need: Know & UnderstandNeed: Know & Understand
Capacity: IntellectCapacity: Intellect
Task: Learn & Teach Task: Learn & Teach
Strength: Truth & TenacityStrength: Truth & Tenacity
SchoolSchool
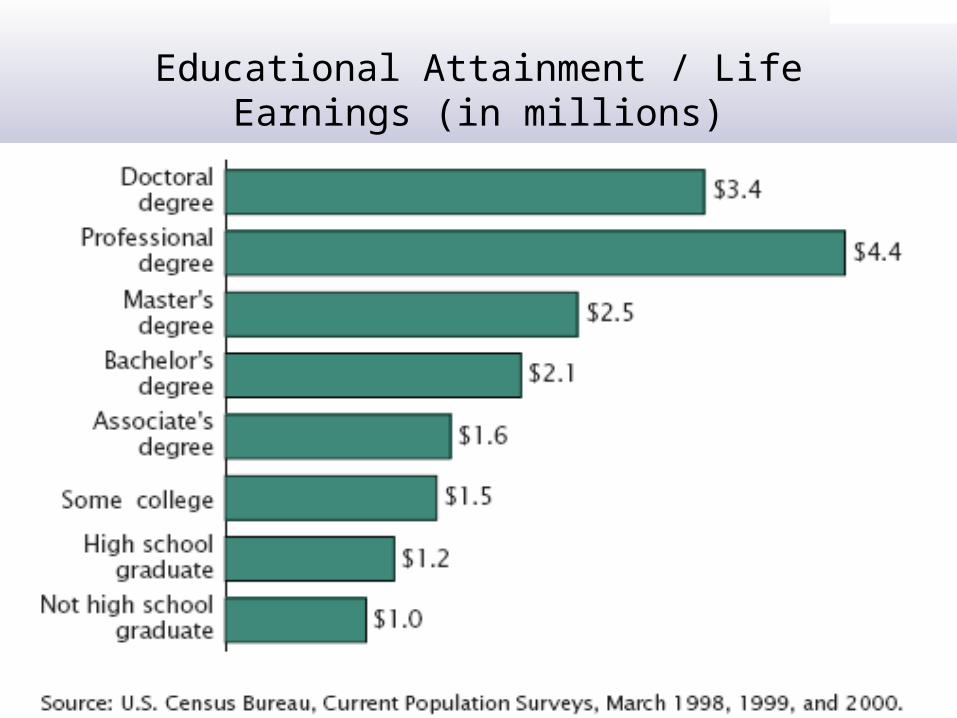
Educational Attainment / Life Earnings (in millions)

2.9
2.62.6
2.5
2.6
2.5
2.30
2.40
2.50
2.60
2.70
2.80
2.90
Ave
rag
e G
PA
Enl
igsh
/Mat
h C
ombi
ned
INTACT STEP COHABIT (BOTHNATURAL)
COHABIT (ONENATURAL)
DIVORCED NEVER MARRIED
GPA English/Math by Family StructureSource: Adolescent Health Survey, Wave I. Adolescents grade 7-12.

School Expulsion Source Add Health Wave II 1996

Educational AttainmentEducational AttainmentIdealIdeal

Educational AttainmentEducational Attainment
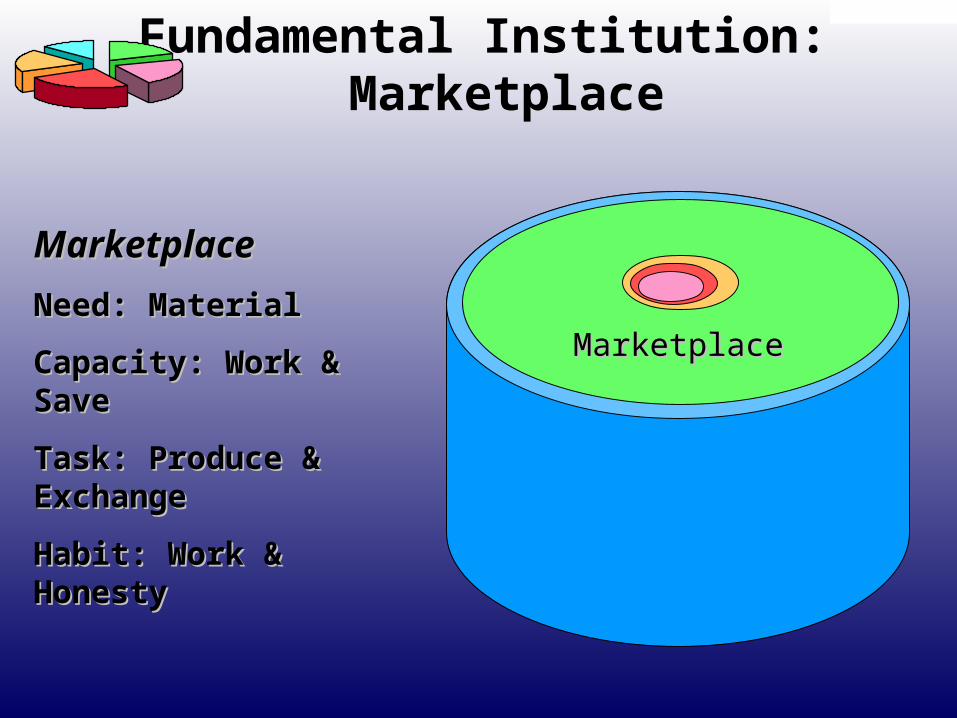
Fundamental Institution: Marketplace
MarketplaceMarketplace
Need: MaterialNeed: Material
Capacity: Work & Save Capacity: Work & Save
Task: Produce & Exchange Task: Produce & Exchange
Habit: Work & HonestyHabit: Work & Honesty
MarketplaceMarketplace
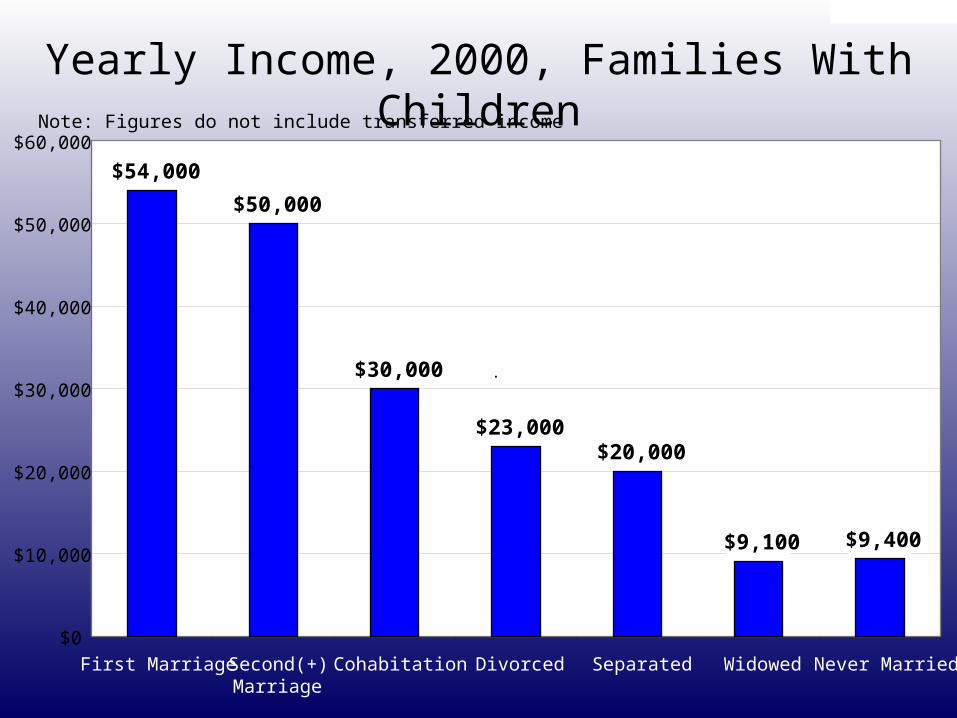
Yearly Income, 2000, Families With Children
$54,000
$50,000
$30,000
$23,000$20,000
$9,100 $9,400
$0
$10,000
$20,000
$30,000
$40,000
$50,000
$60,000
First Marriage Second(+)Marriage
Cohabitation Divorced Separated Widowed Never Married
.
Note: Figures do not include transferred income

Average Hrs. Worked Per Yr.Source : Survey of Consumer Finance 2000
18352135 2213
13911384 1199
1891
1620
12791128
0
500
1000
1500
2000
2500
3000
3500
4000
WIDOWED NEVER MARRIED SEPERATED DIVORCED LIVING W/PARTNER SECOND(+) MARRIAGE FIRST MARRIAGE
Tota
l Hou
rs W
orke
d Pe
r Yr
34123519
3227
Spouse; Partner
Head of Household


Median Net Worth of Families With Children Under 18, 2000Source: Survey of Consumer Finance, 2001
$120,250
$105,360
$27,800$20,540
$16,540 $14,850
$350$0
$20,000
$40,000
$60,000
$80,000
$100,000
$120,000
$140,000
First Marriage Second(+)Marriage
Divorced Widowed Cohabitation Separated Never Married

Children in Poverty, 2000
12 13
31
39 41
67
0
10
20
30
40
50
60
70
80
FIRST MARRIAGE SECOND(+) MARRIAGE DIVORCED COHABITATION SEPARATED NEVER MARRIED
Per
cent
In P
over
ty

3.93 Million Children 3.17 Million Children
0.75 Million Children
Unmarried Parents Same Parents Married
Source R Rector: Analysis of CPS 2001
Children in Poverty
In Poverty
Out of Poverty

$100
$27
$127
0
20
40
60
80
100
120
140
Co
mp
ara
tiv
e I
nco
me
%
Average Unmarried Male Premium Average Married Male
Marriage Premium in Male Income Source Antovics, K. & Town, R. Am Econ Review V 94, (2004) pp 317-321
+ =
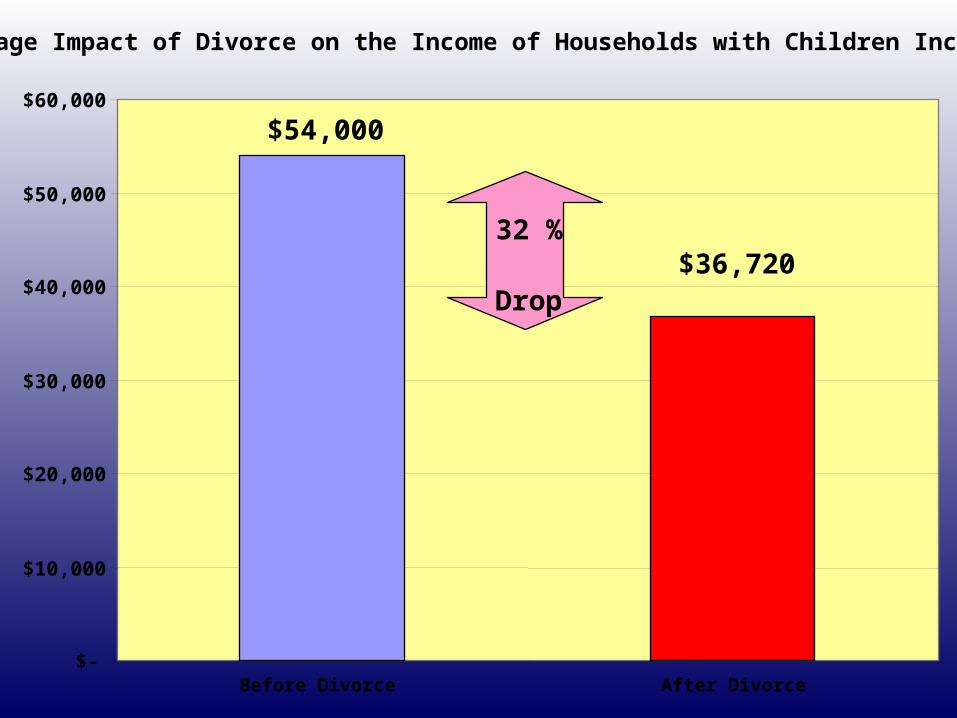
Average Impact of Divorce on the Income of Households with Children Income
$54,000
$36,720
$-
$10,000
$20,000
$30,000
$40,000
$50,000
$60,000
Before Divorce After Divorce
32 %
Drop

Income: EconomyIncome: Economy
$$$

Income WithoutIncome WithoutFamily EconomyFamily Economy
GovernmentGovernment
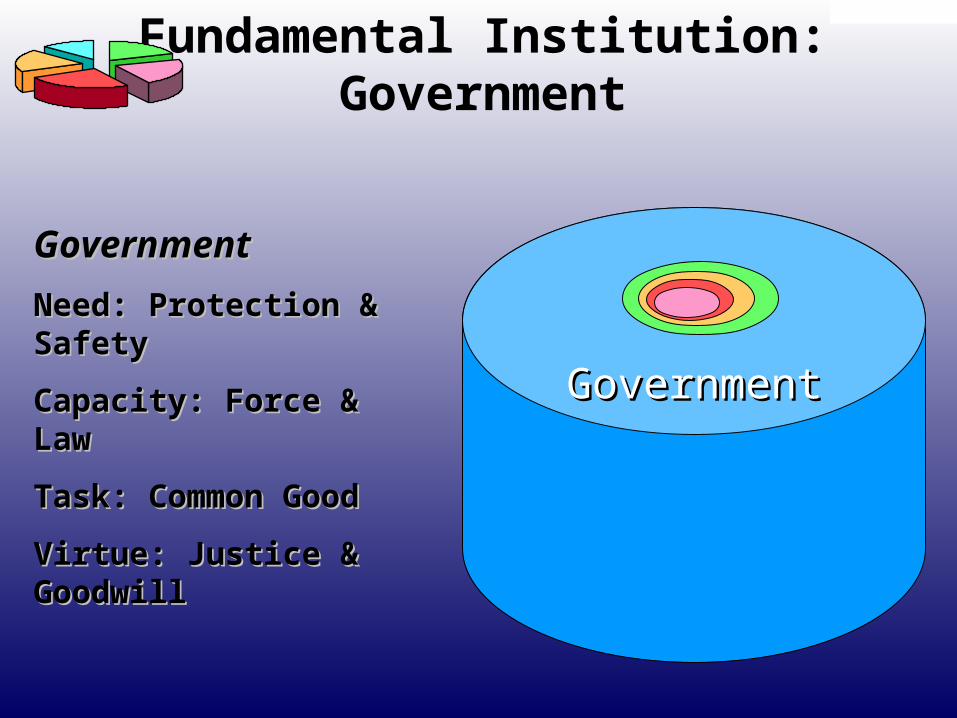
Fundamental Institution:Government
GovernmentGovernment
Need: Protection & SafetyNeed: Protection & Safety
Capacity: Force & Law Capacity: Force & Law
Task: Common Good Task: Common Good
Virtue: Justice & GoodwillVirtue: Justice & Goodwill
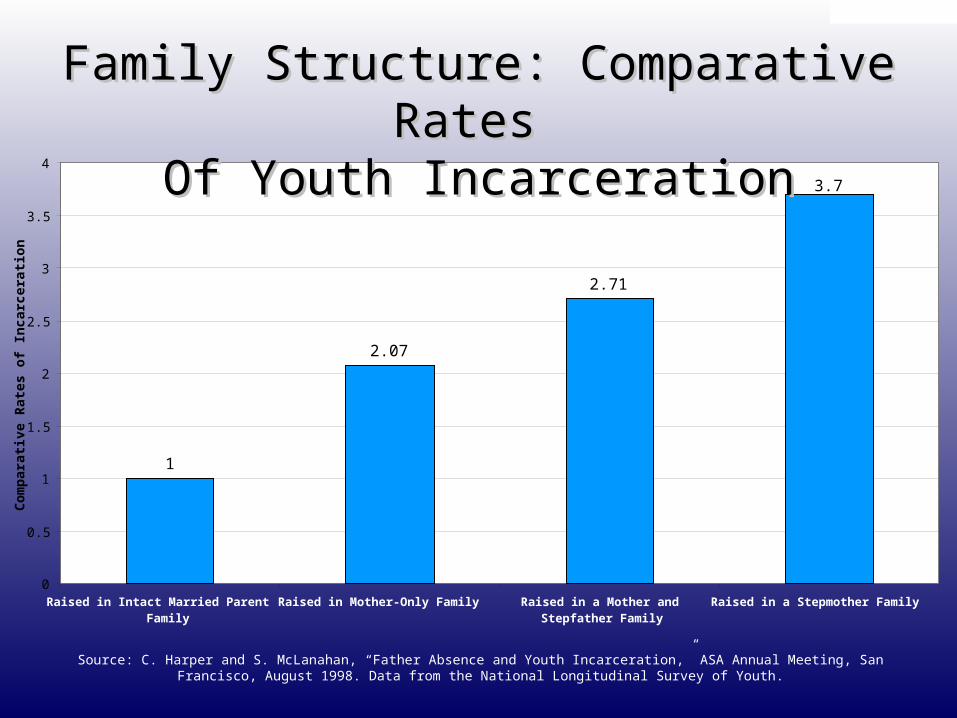
Source: C. Harper and S. McLanahan, “Father Absence and Youth Incarceration,” ASA Annual Meeting, San Francisco, August 1998. Data from the National Longitudinal Survey of Youth.
Family Structure: Comparative Rates Family Structure: Comparative Rates Of Youth IncarcerationOf Youth Incarceration
1
2.07
2.71
3.7
0
0.5
1
1.5
2
2.5
3
3.5
4
Raised in Intact Married ParentFamily
Raised in Mother-Only Family Raised in a Mother andStepfather Family
Raised in a Stepmother Family
Co
mp
arat
ive
Rat
es o
f In
carc
erat
ion

Adolescent Cocaine Use By Family Structure Source Add Health Wave II 1996

Runaway Children in UK
0%
Step-Families
One-Parent Families
Two-parent Families
Percentage of children running away overnight before the age of 16
10%5% 15% 20% 25%
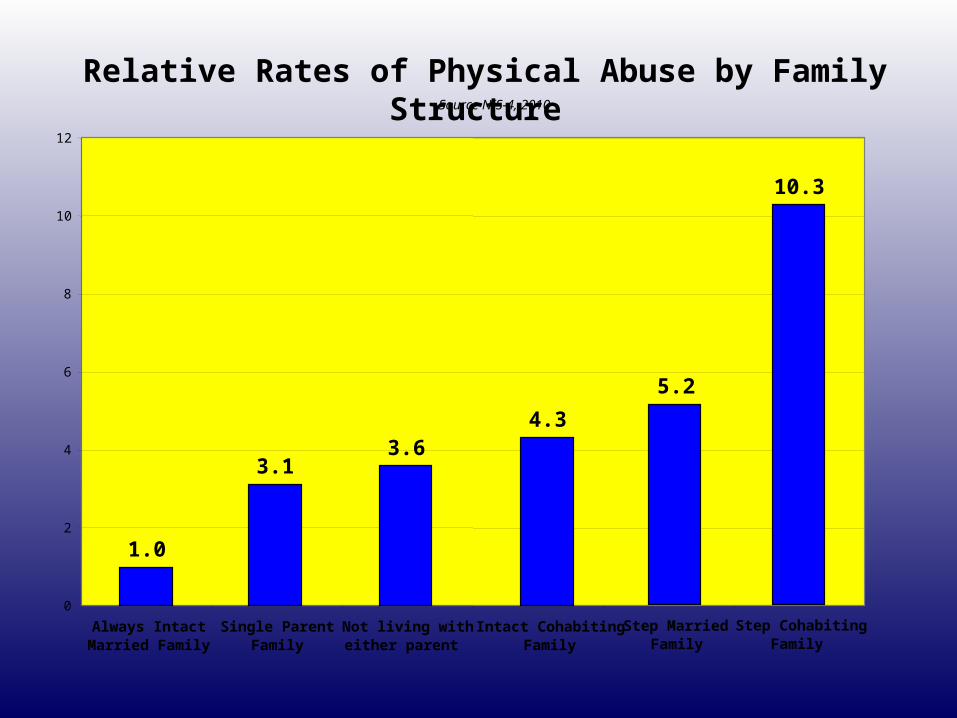
Relative Rates of Physical Abuse by Family Structure Source NIS-4, 2010
1.0
5.2
4.3
10.3
3.13.6
0
2
4
6
8
10
12
Always IntactMarried Family
Step MarriedFamily
Intact CohabitingFamily
Step CohabitingFamily
Single ParentFamily
Not living witheither parent

Relative Rates of Sexual Abuse by Family Structure Source NIS-4, 2010
1
5
19.8
4.8
10.68.6
0
5
10
15
20
25
Always IntactMarried Family
Step MarriedFamily
Intact CohabitingFamily
Step CohabitingFamily
Single ParentFamily
Not living witheither parent

U.S: Partner / Spouse Violence Against Mothers Over 20 With Children under 12
Source DOJ Nat Crime Victimization Survey 1999
46
15
33
0
5
10
15
20
25
30
35
Married Widowed Married+Div+SepCombined
Never Married
Ra
te P
er
1,0
00

Good Law and OrderGood Law and Order

Diminished Law and OrderDiminished Law and Order

Fundamental Institution: Church
ChurchChurch
Need: Good vs. Evil, & GodNeed: Good vs. Evil, & God
Capacity: ReflectionCapacity: Reflection
Task: Worship & PrayerTask: Worship & Prayer
Habit: Piety & RepentanceHabit: Piety & Repentance
ChurchChurch

2.9
2.8
2.7
2.6
2.45
2.50
2.55
2.60
2.65
2.70
2.75
2.80
2.85
2.90
Av
era
ge
GP
A E
nli
gs
h/M
ath
Co
mb
ine
d
WEEKLY+ MONTHLY+ <MONTHLY NEVER
GPA (English & Math) by Religious PracticeGPA (English & Math) by Religious PracticeSource: Adolescent Health Survey, Wave I. Adolescents grade 7-12.

6.4%
7.3%
10.3%
11.5%
0.0%
2.0%
4.0%
6.0%
8.0%
10.0%
12.0%
Per
cen
t W
ho
Had
Eve
r R
un
Aw
ay
WEEKLY+ MONTHLY+ <MONTHLY NEVER
Running Away by Church AttendanceRunning Away by Church AttendanceSource: Adolescent Health Survey, Wave I. Adolescents grade 7-12.

19.1%
31.9%
39.3%
35.2%
0.0%
5.0%
10.0%
15.0%
20.0%
25.0%
30.0%
35.0%
40.0%
WEEKLY+ MONTHLY+ <MONTHLY NEVER
Times Drunk / Church AttendanceSource: Adolescent Health Survey, Wave I. Adolescents grade 7-12.

7. 72%
11. 22%
16. 22%
17. 99%
0%
2%
4%
6%
8%
10%
12%
14%
16%
18%
Perc
ent W
ho H
ave
Used H
ard
Dru
gs
WEEKLY+ MONTHLY+ <MONTHLY NEVER
Hard Drugs / Church AttendanceSource: Adolescent Health Survey, Wave I. Adolescents grade 7-12.

0.61
0.92
1.41
1.55
0.00
0.20
0.40
0.60
0.80
1.00
1.20
1.40
1.60
Num
ber o
f Sex
Par
tner
s
WEEKLY+ MONTHLY+ <MONTHLY NEVER
Girls: Number of Sex Partners / Church AttendanceSource: Adolescent Health Survey, Wave I. Adolescents grade 7-12.

Ideal Impact of WorshipIdeal Impact of Worship
Impact of Lessened WorshipImpact of Lessened Worship
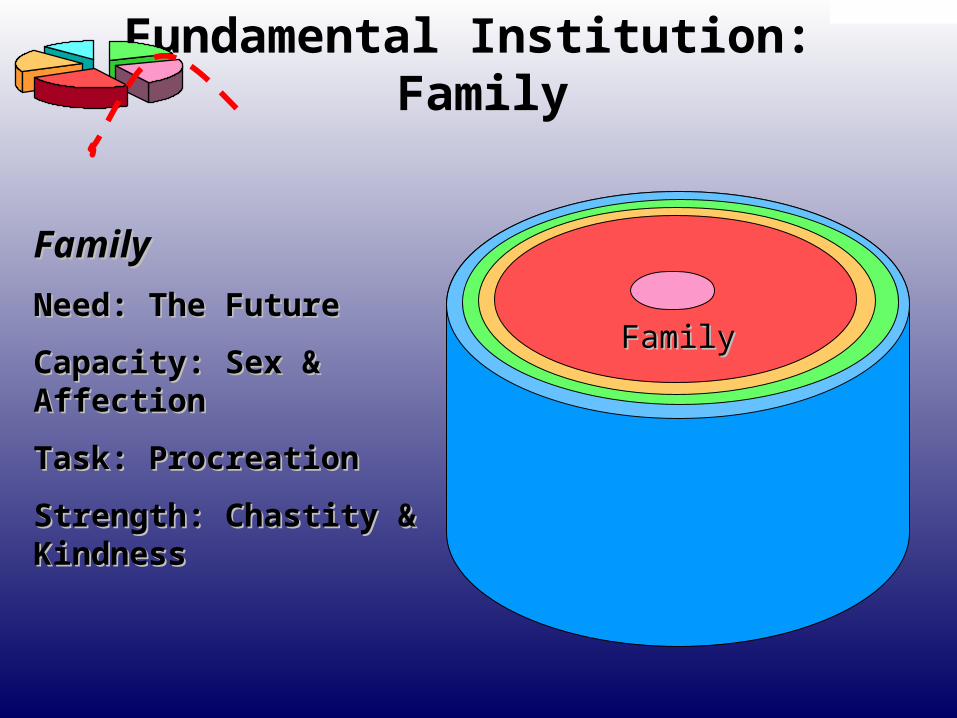
Fundamental Institution: Family
FamilyFamily
Need: The FutureNeed: The Future
Capacity: Sex & AffectionCapacity: Sex & Affection
Task: Procreation Task: Procreation
Strength: Chastity & Strength: Chastity & KindnessKindness
FamilyFamily
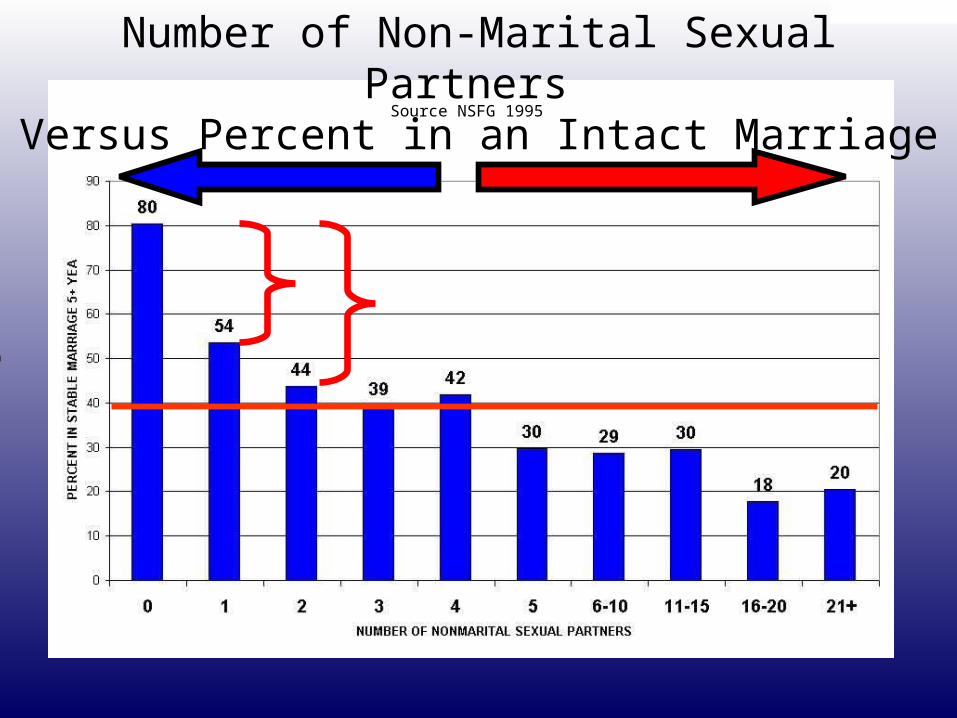
Number of Non-Marital Sexual Partners Versus Percent in an Intact Marriage
Source NSFG 1995

The More Sexual Partners the More Likely to Abort Source NSFG 1995
8
12
1819
25
3134
3943
52
0
10
20
30
40
50
60
0 1 2 3 4 5 6-10 11-15 16-20 21+NUMBER OF NON MARITAL SEXUAL PARTNERS IN LIFETIME
Pe
rce
nt
wh
o h
av
e a
bo
rtio
ns
la
ter

Non-Marital Sexual Partners and Out-of-Wedlock BirthsSource: CDC, National Center for Health Statistics, National Survey of Family Growth, 1995
1.71%
16.29%
32.89%
40.02%
44.02% 42.66%
49.45% 49.99%47.55%
55.21%
49.89%
0%
10%
20%
30%
40%
50%
60%
Virgin atTime of
FirstMarriage
Had Pre-Marital Sexwith FirstHusband
1 2 3 4 5 6-10. 11-15. 16-20 21+
Number of Lifetime Voluntary Non-Marital Sexual Partners
Pe
rce
nt
of
Se
xu
all
y A
cti
ve
Wo
me
n A
ge
d 1
5-4
4 w
ith
Ch
ild
ren

Non-Marital Sexual Partners And Single MotherhoodSource: CDC, National Center for Health Statistics, National Survey of Family Growth, 1995
7.09%
30.21%
36.48%38.81%
44.16%
53.07%
48.13% 47.03%
50.30%
56.98%
0%
10%
20%
30%
40%
50%
60%
0 1 2 3 4 5 6-10. 11-15. 16-20 21+
Number of Lifetime Non-Marital Sexual Partners
Pe
rce
nt
of
Se
xu
all
y A
cti
ve
wo
me
n A
ge
d 1
5-4
4 w
ith
Ch
ild
ren

78%
75%
59% 58% 55% 55%50%
42%
29%
0%
10%
20%
30%
40%
50%
60%
70%
80%
90%
% V
irgin
sVirginity By Family Structure
Source Add Health, 1996

41.2%
25.8%
14.6%
6.3%
3.3%
0.0%
5.0%
10.0%
15.0%
20.0%
25.0%
30.0%
35.0%
40.0%
45.0%
Intact Step Cohabit Divorced Single
% R
atin
g Da
d W
arm
and
Lov
ing
Father Rated Warm and Loving Source: National Longitudinal Survey of Adolescent Health Wave 2, 1996
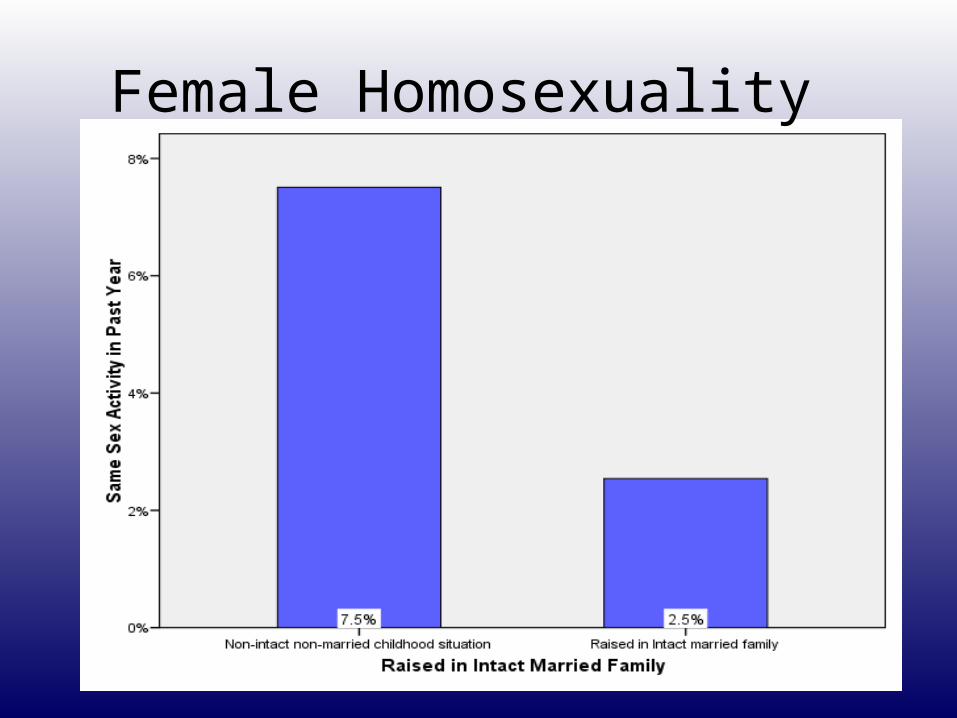
Female Homosexuality

Ideal Of FamilyIdeal Of Family

Reality Of FamilyReality Of Family
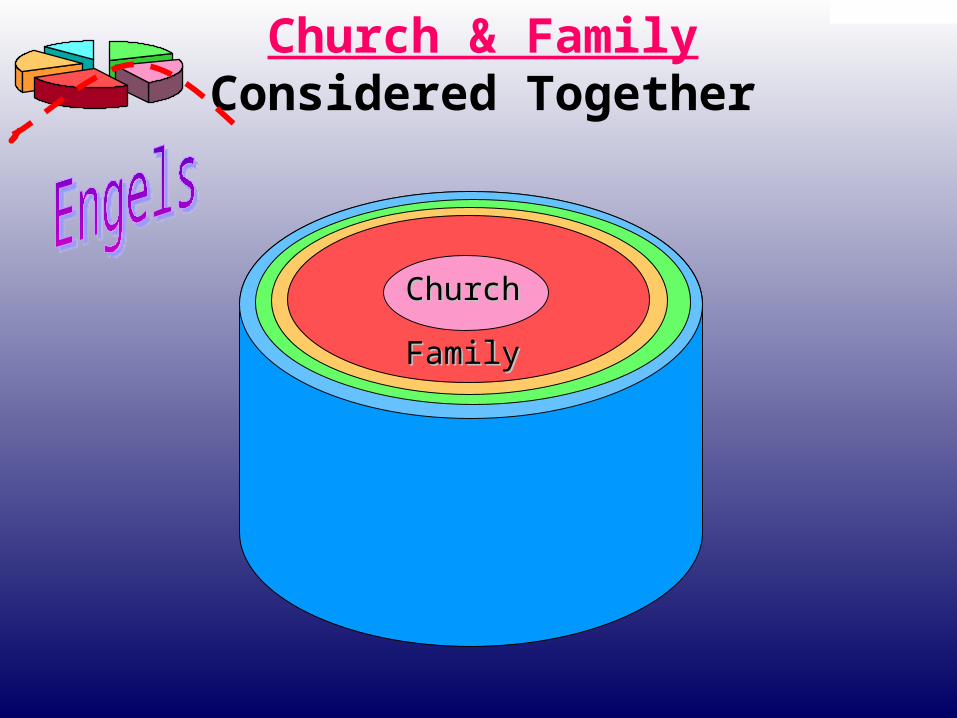
ChurchChurch
FamilyFamily
Church & FamilyConsidered Together
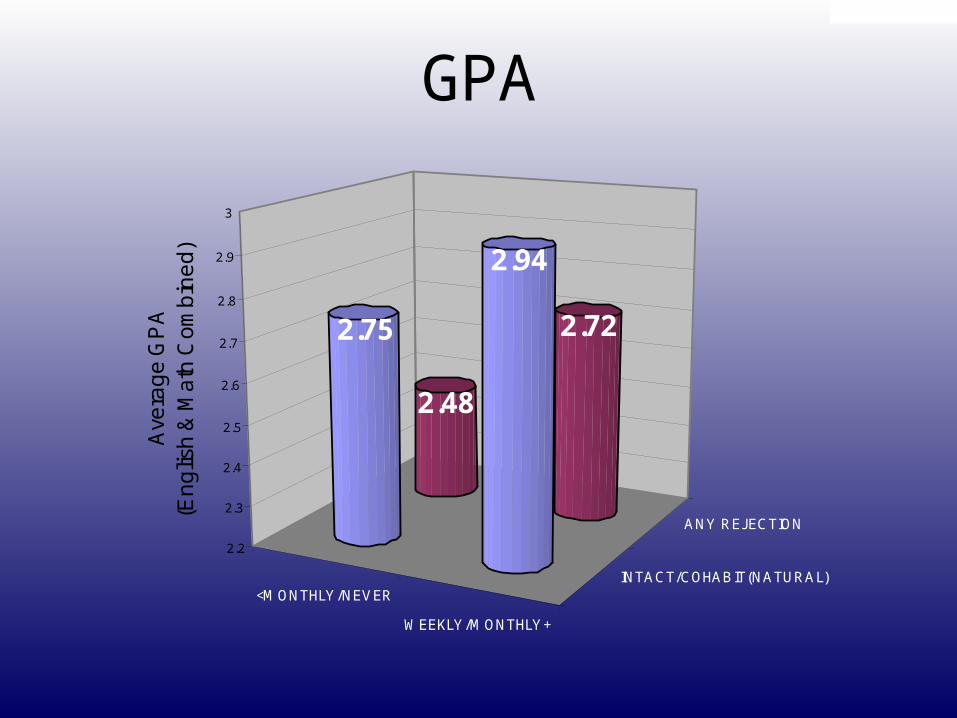
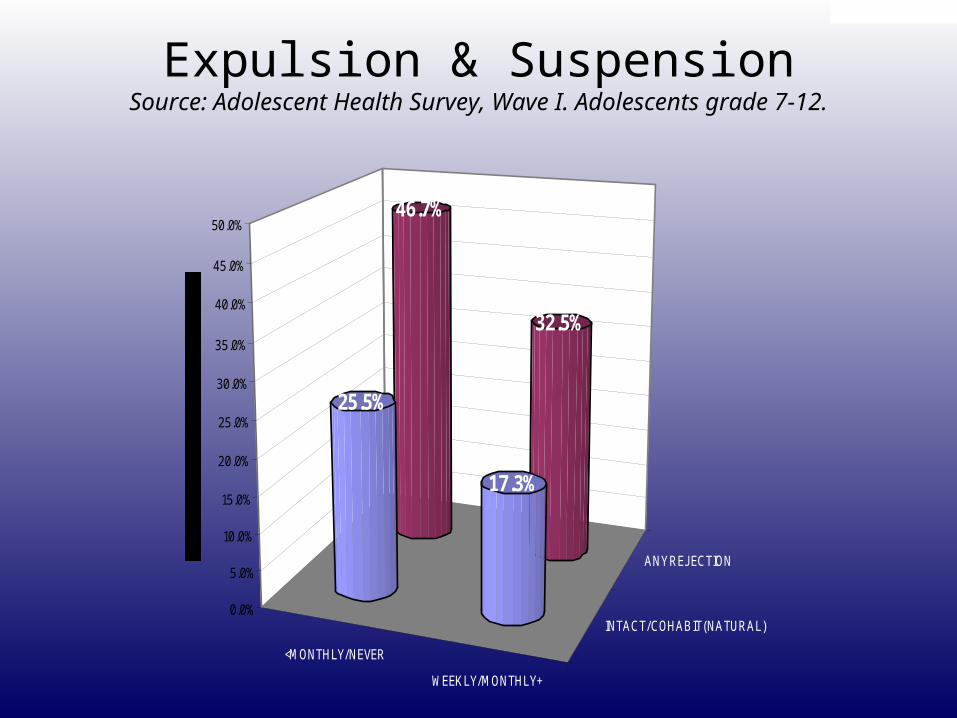
<MONTHLY/NEVER
WEEKLY/MONTHLY+
INTACT/COHABIT(NATURAL)
ANY REJ ECTION
2.48
2.722.75
2.94
2.2
2.3
2.4
2.5
2.6
2.7
2.8
2.9
3
Ave
rag
e G
PA
(E
ng
lish
& M
ath
Co
mb
ine
d)
GPA
<MONTHLY/NEVER
WEEKLY/MONTHLY+
INTACT/COHABIT(NATURAL)
ANY REJ ECTION
46.7%
32.5%
25.5%
17.3%
0.0%
5.0%
10.0%
15.0%
20.0%
25.0%
30.0%
35.0%
40.0%
45.0%
50.0%
Expulsion & SuspensionSource: Adolescent Health Survey, Wave I. Adolescents grade 7-12.

Number of Sex Partners for GirlsNumber of Sex Partners for Girls
<MONTHLY/NEVER
WEEKLY/MONTHLY+
INTACT/COHABIT(NATURAL)
ANY REJECTION
1.55
0.93
1.14
0.47
0.00
0.20
0.40
0.60
0.80
1.00
1.20
1.40
1.60

<MONTHLY/NEVER
WEEKLY/MONTHLY+
INTACT/COHABIT(NATURAL)
ANY REJECTION
13.1%
8.5%
8.1%
5.2%
0.0%
2.0%
4.0%
6.0%
8.0%
10.0%
12.0%
14.0%
Pe
rce
nt
Wh
o H
ad
Ev
er
Ru
n A
wa
y
Running AwayBy Family Structure and Religious Practice
Source: Adolescent Health Survey, Wave I. Adolescents grade 7-12.
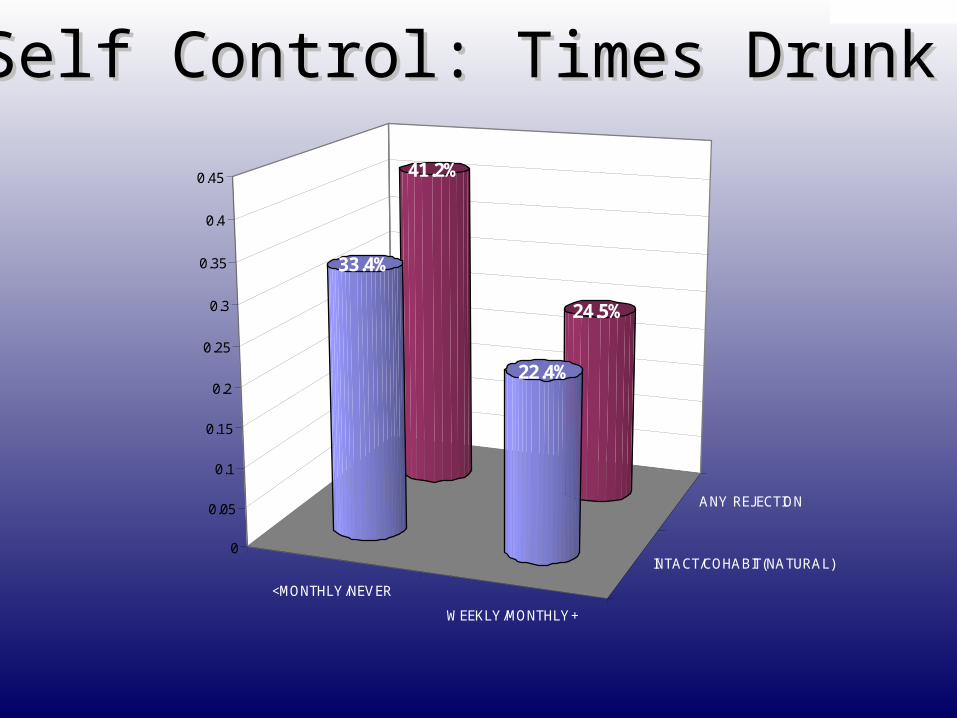
<MONTHLY/NEVER
WEEKLY/MONTHLY+
INTACT/COHABIT(NATURAL)
ANY REJECTION
41.2%
24.5%
33.4%
22.4%
0
0.05
0.1
0.15
0.2
0.25
0.3
0.35
0.4
0.45
Self Control: Times DrunkSelf Control: Times Drunk

<MONTHLY/ NEVER
WEEKLY/ MONTHLY+
INT ACT / COHABIT (NAT URAL)
ANY RE J E CT ION
20.1%
9.5%
14.6%
8.5%
0
0.05
0.1
0.15
0.2
0.25
Per
cent
Who
Hav
e U
sed
Har
d D
rugs
Self Control: Hard Drug UseSource: Adolescent Health Survey, Wave I. Adolescents grade 7-12.

<MONTHLY/NEVER
WEEKLY/MONTHLY+
INTACT/COHABIT(NATURAL)
ANY REJECTION
23.5%
15.8%
15.3%
11.7%
0
0.05
0.1
0.15
0.2
0.25P
erc
en
t W
ho
Co
mm
itte
d G
ran
d T
he
ft
Grand TheftBy Family Structure and Religious Practice
Source: Adolescent Health Survey, Wave I. Adolescents grade 7-12.

5 Institutions: 5 Institutions: 5 Tasks5 Tasks
Family: Next GenerationReligion: Moral Universals, WorshipSchool: LearningGovernment: Protection, BenevolenceMarketplace: Income, Property

Within all the 5 Institutions: Within all the 5 Institutions: The single most important virtue The single most important virtue nownow??
Church:Church: piety piety School:School: hard work hard work
Government: justiceGovernment: justice Marketplace: honestyMarketplace: honesty Family: chastity
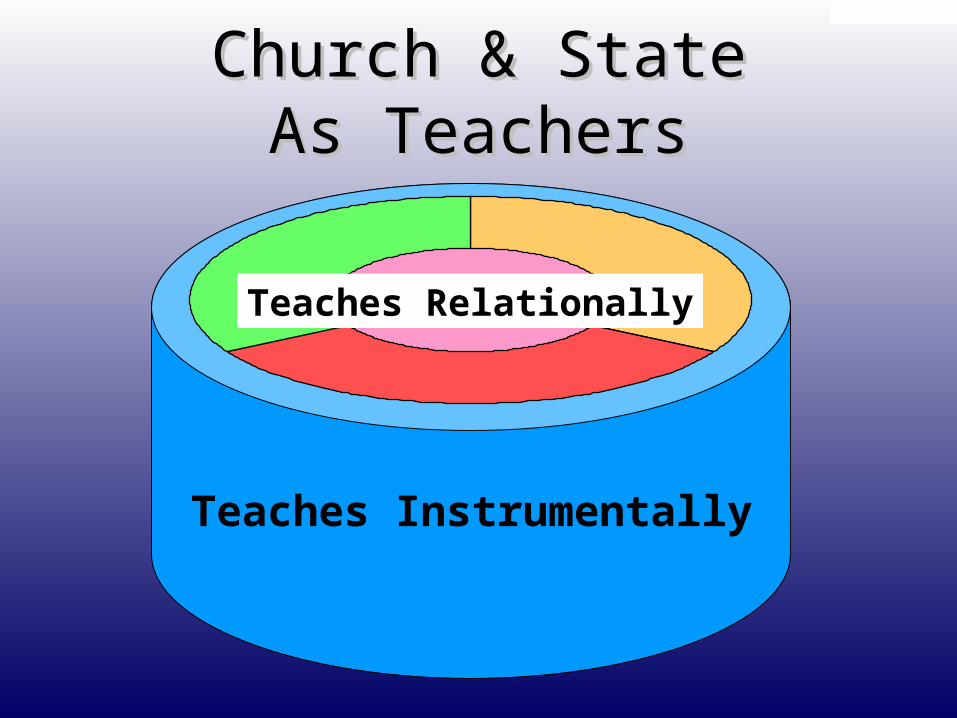
Teaches Instrumentally
Teaches Relationally
Church & StateChurch & StateAs TeachersAs Teachers

Protects GoodAnd Punishes Evil
Inspires To Do GoodAnd Repent of Evil
Different Modes of TeachingDifferent Modes of Teaching
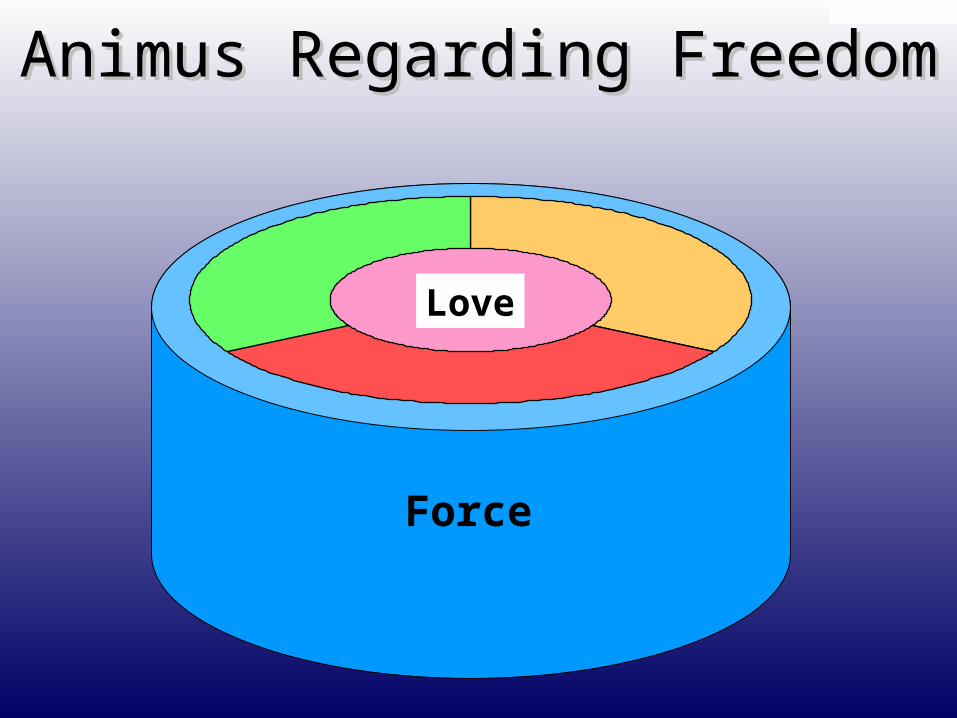
Force
Love
Animus Regarding FreedomAnimus Regarding Freedom
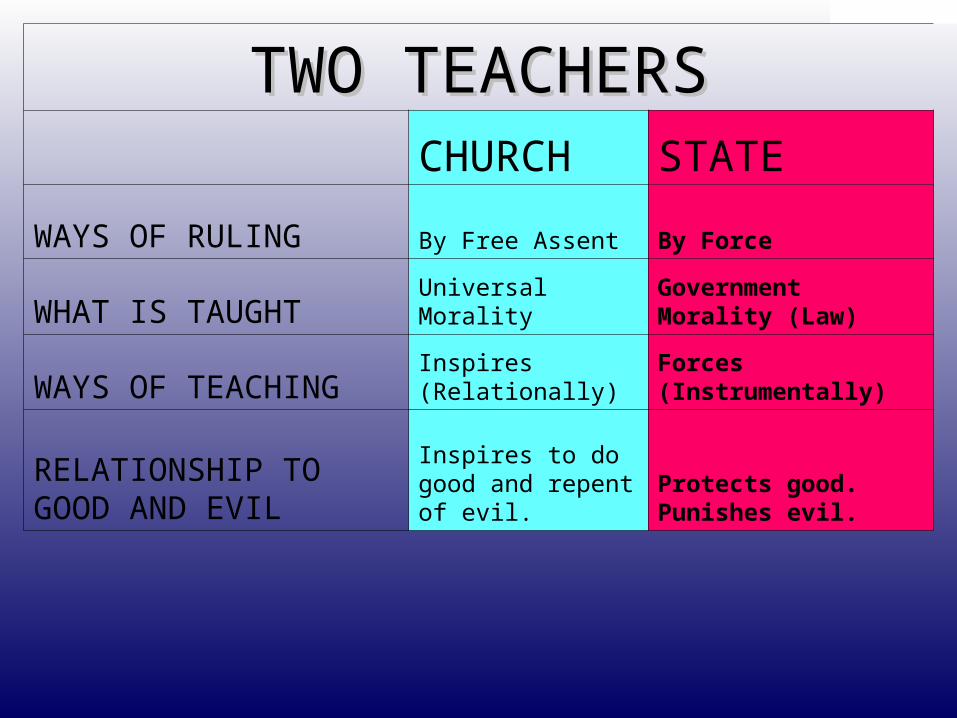
TWO TEACHERSTWO TEACHERS CHURCH STATE
WAYS OF RULING By Free Assent By Force
WHAT IS TAUGHT Universal MoralityGovernment Morality (Law)
WAYS OF TEACHINGInspires (Relationally) Forces (Instrumentally)
RELATIONSHIP TO GOOD AND EVIL
Inspires to do good and repent of evil.
Protects good. Punishes evil.

Society’s Foundational RelationshipSociety’s Foundational Relationship

www.marri.frc.org

Some of the studies available
• MAPPING AMERICA
• STUDIES– INDEX OF BELONGING / REJECTION – PORNOGRAPHY– EFFECT OF THE PILL ON ENVIRONMENT– RELIGIOUS WORSHIP / EDUC ATTAINMNT– EFFECTS OF EARLY ADOPTION– EFFECTS OF DIVORCE