the for-profit postsecondary school sector: nimble critters or agile
TRANSCRIPT
Journal of Economic Perspectives—Volume 26, Number 1—Winter 2012—Pages 139–164
P rivate for-profit institutions have become an increasingly visible part of the U.S. higher education sector. Within that sector, they are today the most diverse institutions by program and size, have been the fastest growing, have
the highest fraction of nontraditional students, and obtain the greatest proportion of their total revenue from federal student aid (loan and grant) programs. They are, as well, the subjects of high-profile investigations and are facing major regula-tory changes.
Today’s for-profit postsecondary schools were preceded a century ago by a group of proprietary schools that were also responding to an explosion in demand for technical, vocational, and applied subjects. Business, managerial, and secretarial skills were in great demand in the late nineteenth and early twentieth centuries, and a multitude of proprietary institutions emerged that taught accounting, management, real estate, stenography, and typing. The numbers and enrollments of these institutions were greatly reduced when public high schools expanded and increased their offerings in the business and vocational areas. But many survived and morphed into some of the current for-profits, such as Blair College (estab-lished 1897; now part of Everest College), Bryant and Stratton College (1854),
The For-Profit Postsecondary School Sector: Nimble Critters or Agile Predators?†
■ David J. Deming is Assistant Professor of Education and Economics, Graduate School of Education, Claudia Goldin is the Henry Lee Professor of Economics, and Lawrence F. Katz is the Elisabeth Allison Professor of Economics, all at Harvard University, Cambridge, Massachusetts. Goldin is Director of the Development of the American Economy program and Katz is a Research Associate at the National Bureau of Economic Research, Cambridge, Massachusetts. Their e-mail addresses are ⟨[email protected]⟩, ⟨cgoldin @harvard.edu⟩, and ⟨[email protected]⟩.† To access the Appendix, visit http://dx.doi.org/10.1257/jep.26.1.139.doi=10.1257/jep.26.1.139
David J. Deming, Claudia Goldin, and Lawrence F. Katz
ContentsThe For-Profit Postsecondary School Sector: Nimble Critters or Agile Predators?
† 139
What is the For-Profit Postsecondary School Sector? 143What is Title IV Eligibility? 145For-Profit Programs 145Who Are the Students? 146The Business Model of the For-Profit Sector 148Client Base and Recruiting 148Responsiveness to Markets 149Online Education 150Federal Student Financial Aid 150Default Rates 152Student Outcomes 153Nimble Critters or Agile Predators? 160References 162
140 Journal of Economic Perspectives
Gibbs College (1911), Globe University (1885), Rasmussen College (1900), and Gibbs College (1911), Globe University (1885), Rasmussen College (1900), and Strayer University (1892).Strayer University (1892).
Distance learning, known today as online education, also has an interesting Distance learning, known today as online education, also has an interesting past in “correspondence courses” that were offered by many universities begin-past in “correspondence courses” that were offered by many universities begin-ning in the late nineteenth century including some of the most prestigious, such ning in the late nineteenth century including some of the most prestigious, such as the University of Chicago and the University of Wisconsin (Watkins 1991). as the University of Chicago and the University of Wisconsin (Watkins 1991). Online education is today’s most rapidly growing part of higher education. Online education is today’s most rapidly growing part of higher education. Walden University, founded in 1970 and today one the largest for-profi t online Walden University, founded in 1970 and today one the largest for-profi t online institutions, pioneered online studies to allow working professionals to earn institutions, pioneered online studies to allow working professionals to earn further degrees.further degrees.
In this article, we describe the schools, students, and programs in the for-profi t In this article, we describe the schools, students, and programs in the for-profi t higher education sector, its phenomenal recent growth, and its relationship to the higher education sector, its phenomenal recent growth, and its relationship to the federal and state governments. As a starting point, for-profi t postsecondary enroll-federal and state governments. As a starting point, for-profi t postsecondary enroll-ments have grown considerably during the past several decades, particularly in ments have grown considerably during the past several decades, particularly in degree programs and at large national providers with substantial online offerings. degree programs and at large national providers with substantial online offerings. Fall enrollment in for-profi t degree-granting institutions grew by more than 100-fold Fall enrollment in for-profi t degree-granting institutions grew by more than 100-fold from 18,333 in 1970 to 1.85 million in 2009. During that same time period, total fall from 18,333 in 1970 to 1.85 million in 2009. During that same time period, total fall enrollment in all degree-granting institutions increased 2.4-fold from 8.58 million enrollment in all degree-granting institutions increased 2.4-fold from 8.58 million in 1970 to 20.43 million in 2009 (U.S. Department of Education, NECS, 2010, in 1970 to 20.43 million in 2009 (U.S. Department of Education, NECS, 2010, Digest, , table 197). Thus, for-profi t enrollment increased from 0.2 percent to 9.1 percent table 197). Thus, for-profi t enrollment increased from 0.2 percent to 9.1 percent of total enrollment in degree-granting schools from 1970 to 2009. For-profi t institu-of total enrollment in degree-granting schools from 1970 to 2009. For-profi t institu-tions for many decades also have accounted for the vast majority of enrollments tions for many decades also have accounted for the vast majority of enrollments in non-degree-granting postsecondary schools (those offering shorter certifi cate in non-degree-granting postsecondary schools (those offering shorter certifi cate programs), both overall and among such schools eligible for federal (Title IV) programs), both overall and among such schools eligible for federal (Title IV) student fi nancial aid.student fi nancial aid.
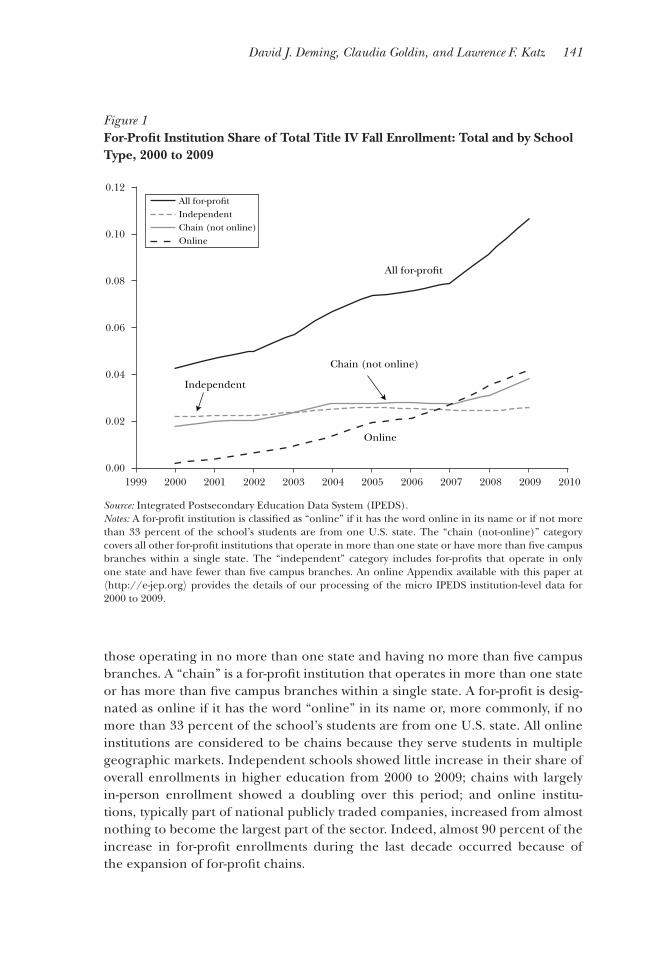
Figure 1 highlights the rise of for-profi ts in the enrollments of Title IV–eligible Figure 1 highlights the rise of for-profi ts in the enrollments of Title IV–eligible (degree and non-degree-granting) higher education institutions since 2000, a (degree and non-degree-granting) higher education institutions since 2000, a period when enrollment in the for-profi t sector tripled while enrollment for the period when enrollment in the for-profi t sector tripled while enrollment for the rest of higher education increased by just 22 percent. The solid dark line shows rest of higher education increased by just 22 percent. The solid dark line shows that the fraction of fall enrollments accounted for by the for-profi ts increased from that the fraction of fall enrollments accounted for by the for-profi ts increased from 4.3 percent in 2000 to 10.7 percent in 2009. For the descriptive data presented 4.3 percent in 2000 to 10.7 percent in 2009. For the descriptive data presented here, we rely extensively on the Integrated Postsecondary Education Data System here, we rely extensively on the Integrated Postsecondary Education Data System (IPEDS) of the U.S. Department of Education, which is an annual survey of (IPEDS) of the U.S. Department of Education, which is an annual survey of all postsecondary institutions that participate in the federal student fi nancial all postsecondary institutions that participate in the federal student fi nancial aid programs.aid programs.11
Under the solid dark line in Figure 1, the growth of the for-profi t sector Under the solid dark line in Figure 1, the growth of the for-profi t sector is broken down into “independent” schools, online institutions, and for-profi t is broken down into “independent” schools, online institutions, and for-profi t “chains.” We must fi rst defi ne these terms, because these categories are not “chains.” We must fi rst defi ne these terms, because these categories are not designated in the offi cial IPEDS data. “Independent” schools are defi ned here as designated in the offi cial IPEDS data. “Independent” schools are defi ned here as
1 An online Appendix available with this paper at 〈http://e-jep.org⟩ provides the details of our processing of the micro IPEDS data, linkage of the IPEDS institution-year data to fi nancial aid to data from the National Student Loan Data System, and construction of an institution-level panel data set for 2000 to 2009.
David J. Deming, Claudia Goldin, and Lawrence F. Katz 141
those operating in no more than one state and having no more than fi ve campus those operating in no more than one state and having no more than fi ve campus branches. A “chain” is a for-profi t institution that operates in more than one state branches. A “chain” is a for-profi t institution that operates in more than one state or has more than fi ve campus branches within a single state. A for-profi t is desig-or has more than fi ve campus branches within a single state. A for-profi t is desig-nated as online if it has the word “online” in its name or, more commonly, if no nated as online if it has the word “online” in its name or, more commonly, if no more than 33 percent of the school’s students are from one U.S. state. All online more than 33 percent of the school’s students are from one U.S. state. All online institutions are considered to be chains because they serve students in multiple institutions are considered to be chains because they serve students in multiple geographic markets. Independent schools showed little increase in their share of geographic markets. Independent schools showed little increase in their share of overall enrollments in higher education from 2000 to 2009; chains with largely overall enrollments in higher education from 2000 to 2009; chains with largely in-person enrollment showed a doubling over this period; and online institu-in-person enrollment showed a doubling over this period; and online institu-tions, typically part of national publicly traded companies, increased from almost tions, typically part of national publicly traded companies, increased from almost nothing to become the largest part of the sector. Indeed, almost 90 percent of the nothing to become the largest part of the sector. Indeed, almost 90 percent of the increase in for-profi t enrollments during the last decade occurred because of increase in for-profi t enrollments during the last decade occurred because of the expansion of for-profi t chains.the expansion of for-profi t chains.
Figure 1For-Profi t Institution Share of Total Title IV Fall Enrollment: Total and by School Type, 2000 to 2009
Source: Integrated Postsecondary Education Data System (IPEDS).Notes: A for-profi t institution is classifi ed as “online” if it has the word online in its name or if not more than 33 percent of the school’s students are from one U.S. state. The “chain (not-online)” category covers all other for-profi t institutions that operate in more than one state or have more than fi ve campus branches within a single state. The “independent” category includes for-profi ts that operate in only one state and have fewer than fi ve campus branches. An online Appendix available with this paper at 〈http://e-jep.org⟩ provides the details of our processing of the micro IPEDS institution-level data for 2000 to 2009.
0.12
0.10
0.08
0.06
0.04
0.02
0.0020101999 2000 2001 2002 2003 2004 2005 2006 2007 2008 2009
Independent
Chain (not online)
Online
All for-profit
All for-profitIndependentChain (not online)Online

142 Journal of Economic Perspectives
The rapid growth of the for-profi ts from 2000 to 2009 is illustrated in various The rapid growth of the for-profi ts from 2000 to 2009 is illustrated in various ways in Figure 2. The for-profi t share of enrollments (unduplicated headcount) over ways in Figure 2. The for-profi t share of enrollments (unduplicated headcount) over a 12-month period increased from 5 percent in 2001 to 13 percent in 2009. The a 12-month period increased from 5 percent in 2001 to 13 percent in 2009. The 12-month enrollment measure better captures enrollments in for-profi ts than the 12-month enrollment measure better captures enrollments in for-profi ts than the standard fall enrollment measure because it includes students in less-conventional standard fall enrollment measure because it includes students in less-conventional and short programs entered throughout the year.and short programs entered throughout the year.
For-profi ts have expanded their enrollment share more rapidly for women than For-profi ts have expanded their enrollment share more rapidly for women than for men, and they play an increasingly large role in the higher education of older for men, and they play an increasingly large role in the higher education of older students. The for-profi t enrollment share of students 25 years and older expanded students. The for-profi t enrollment share of students 25 years and older expanded from around 6 percent in 2001 to 18 percent in 2009. Undergraduate completions from around 6 percent in 2001 to 18 percent in 2009. Undergraduate completions from for-profi t institutions grew from 13 percent of the total in 2000 to almost from for-profi t institutions grew from 13 percent of the total in 2000 to almost 18 percent in 2008. The fraction of completions is considerably larger than that for 18 percent in 2008. The fraction of completions is considerably larger than that for enrollments because more than half of for-profi t completions are certifi cates and enrollments because more than half of for-profi t completions are certifi cates and most certifi cate programs are no more than one year.most certifi cate programs are no more than one year.
For-profi t enrollments and completions in recent years have been growing For-profi t enrollments and completions in recent years have been growing most rapidly in longer degree programs. In the last decade, the for-profi ts increased most rapidly in longer degree programs. In the last decade, the for-profi ts increased their share of completers in all types of undergraduate programs, but more so for their share of completers in all types of undergraduate programs, but more so for
Figure 2For-Profi t Share of Enrollments and Undergraduate Completions: 2000 to 2009
Source: Integrated Postsecondary Education Data System (IPEDS).Notes: “All for-profi t” is fall enrollment, that is enrollment at the beginning of the academic year; “12-month enrollment” = unduplicated enrollment during the entire year; “25 years and older” = fall enrollment of those 25 years and older; “women” = female fall enrollment; “undergraduate completions” = all undergraduate completions (certifi cates + associate’s degrees + bachelor’s degrees). The series for “25 years and older” is for the odd-numbered years and the even-numbered years are interpolated from those.
0.20
0.18
0.16
0.14
0.12
0.10
0.08
0.06
0.04
0.02
0.0020101999 2000 2001 2002 2003 2004 2005 2006 2007 2008 2009
All for-profit
12-month enrollment
Women
Undergraduate completions
25 years and older
All for-profit25 years and older12-month enrollmentUndergraduate completionsWomen
The For-Profi t Postsecondary School Sector: Nimble Critters or Agile Predators? 143
AAs (associates’ degrees) and BAs (bachelor’s degrees) than for certifi cates. They AAs (associates’ degrees) and BAs (bachelor’s degrees) than for certifi cates. They produced about 39 percent of certifi cates in 2000 and 42 percent in 2008. For-profi t produced about 39 percent of certifi cates in 2000 and 42 percent in 2008. For-profi t AAs were 13 percent of all AAs in 2000 but 18 percent in 2008; BAs were less than AAs were 13 percent of all AAs in 2000 but 18 percent in 2008; BAs were less than 2 percent of all in 2000 but were 5 percent of all BAs in 2008 (U.S. Department of 2 percent of all in 2000 but were 5 percent of all BAs in 2008 (U.S. Department of Education, NECS, 2010, Education, NECS, 2010, Digest, table 195)., table 195).
The current incarnation of the for-profi t sector is big business; its largest The current incarnation of the for-profi t sector is big business; its largest providers are major, profi table, publicly traded corporations (Bennett, Lucchesi, providers are major, profi table, publicly traded corporations (Bennett, Lucchesi, and Vedder 2010). They appear to be nimble critters that train nontraditional and Vedder 2010). They appear to be nimble critters that train nontraditional learners for jobs in fast-growing areas, such as health care and information tech-learners for jobs in fast-growing areas, such as health care and information tech-nology. On the other side, most of them depend on U.S. government student aid for nology. On the other side, most of them depend on U.S. government student aid for the vast bulk of their revenues. Default rates on the loans taken out by their students the vast bulk of their revenues. Default rates on the loans taken out by their students vastly exceed those of other institutions of higher education, and audit studies have vastly exceed those of other institutions of higher education, and audit studies have shown that some for-profi ts have engaged in highly aggressive and even borderline shown that some for-profi ts have engaged in highly aggressive and even borderline fraudulent recruiting techniques (U.S. Government Accountability Offi ce 2010).fraudulent recruiting techniques (U.S. Government Accountability Offi ce 2010).
Are the for-profi ts nimble critters or agile predators? Using the 2004 to 2009 Are the for-profi ts nimble critters or agile predators? Using the 2004 to 2009 Beginning Postsecondary Students (BPS) Longitudinal Study, we assess outcomes Beginning Postsecondary Students (BPS) Longitudinal Study, we assess outcomes of a recent cohort of fi rst-time undergraduates who attended for-profi ts relative to of a recent cohort of fi rst-time undergraduates who attended for-profi ts relative to comparable students who attended community colleges or other public or private comparable students who attended community colleges or other public or private nonprofi t institutions. We fi nd that relative to community colleges and other public nonprofi t institutions. We fi nd that relative to community colleges and other public and private nonprofi ts, for-profi ts educate a larger fraction of minority, disad-and private nonprofi ts, for-profi ts educate a larger fraction of minority, disad-vantaged, and older students, and they have greater success at retaining students vantaged, and older students, and they have greater success at retaining students in their fi rst year and getting them to complete shorter degree and nondegree in their fi rst year and getting them to complete shorter degree and nondegree programs at the certifi cate and AA levels. But we also fi nd that for-profi ts leave programs at the certifi cate and AA levels. But we also fi nd that for-profi ts leave students with far larger student loan debt burdens. For-profi t students end up with students with far larger student loan debt burdens. For-profi t students end up with higher unemployment and “idleness” rates and lower earnings from employment higher unemployment and “idleness” rates and lower earnings from employment six years after entering programs than do comparable students from other schools. six years after entering programs than do comparable students from other schools. Not surprisingly, for-profi t students have trouble paying off their student loans and Not surprisingly, for-profi t students have trouble paying off their student loans and have far greater default rates. And for-profi t students self-report lower satisfaction have far greater default rates. And for-profi t students self-report lower satisfaction with their courses of study and are less likely to consider their education and loans with their courses of study and are less likely to consider their education and loans worth the price-tag relative to similarly-situated students who went to public and worth the price-tag relative to similarly-situated students who went to public and private nonprofi t institutions.private nonprofi t institutions.
What is the For-Profi t Postsecondary School Sector?
Apollo and the Lesser For-Profi t Deities: A Diverse SectorThe for-profi t postsecondary school sector, at its simplest level, is a group of The for-profi t postsecondary school sector, at its simplest level, is a group of
institutions that give post-high school degrees or credentials and for which some institutions that give post-high school degrees or credentials and for which some of the legal “nondistribution requirements” that potentially constrain private of the legal “nondistribution requirements” that potentially constrain private nonprofi t schools do not bind. For example, for-profi t institutions can enter the nonprofi t schools do not bind. For example, for-profi t institutions can enter the equity market and have few constraints on the amounts they can legally pay their top equity market and have few constraints on the amounts they can legally pay their top managers. In practice, only the largest players in this market raise substantial capital managers. In practice, only the largest players in this market raise substantial capital in organized equity markets, and they tend to pay their top executives mega-salaries in organized equity markets, and they tend to pay their top executives mega-salaries that exceed those of presidents at the public and nonprofi t private universities. that exceed those of presidents at the public and nonprofi t private universities.
144 Journal of Economic Perspectives
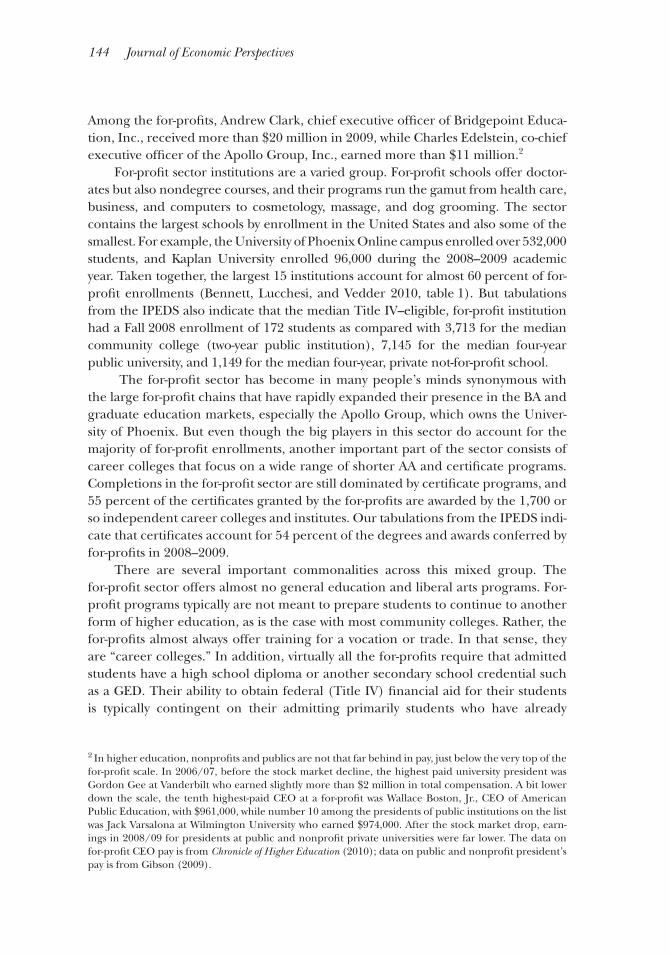
Among the for-profi ts, Andrew Clark, chief executive offi cer of Bridgepoint Educa-Among the for-profi ts, Andrew Clark, chief executive offi cer of Bridgepoint Educa-tion, Inc., received more than $20 million in 2009, while Charles Edelstein, co-chief tion, Inc., received more than $20 million in 2009, while Charles Edelstein, co-chief executive offi cer of the Apollo Group, Inc., earned more than $11 million.executive offi cer of the Apollo Group, Inc., earned more than $11 million.22
For-profi t sector institutions are a varied group. For-profi t schools offer doctor-For-profi t sector institutions are a varied group. For-profi t schools offer doctor-ates but also nondegree courses, and their programs run the gamut from health care, ates but also nondegree courses, and their programs run the gamut from health care, business, and computers to cosmetology, massage, and dog grooming. The sector business, and computers to cosmetology, massage, and dog grooming. The sector contains the largest schools by enrollment in the United States and also some of the contains the largest schools by enrollment in the United States and also some of the smallest. For example, the University of Phoenix Online campus enrolled over 532,000 smallest. For example, the University of Phoenix Online campus enrolled over 532,000 students, and Kaplan University enrolled 96,000 during the 2008–2009 academic students, and Kaplan University enrolled 96,000 during the 2008–2009 academic year. Taken together, the largest 15 institutions account for almost 60 percent of for-year. Taken together, the largest 15 institutions account for almost 60 percent of for-profi t enrollments (Bennett, Lucchesi, and Vedder 2010, table 1). But tabulations profi t enrollments (Bennett, Lucchesi, and Vedder 2010, table 1). But tabulations from the IPEDS also indicate that the median Title IV–eligible, for-profi t institution from the IPEDS also indicate that the median Title IV–eligible, for-profi t institution had a Fall 2008 enrollment of 172 students as compared with 3,713 for the median had a Fall 2008 enrollment of 172 students as compared with 3,713 for the median community college (two-year public institution), 7,145 for the median four-year community college (two-year public institution), 7,145 for the median four-year public university, and 1,149 for the median four-year, private not-for-profi t school.public university, and 1,149 for the median four-year, private not-for-profi t school.
The for-profi t sector has become in many people’s minds synonymous with The for-profi t sector has become in many people’s minds synonymous with the large for-profi t chains that have rapidly expanded their presence in the BA and the large for-profi t chains that have rapidly expanded their presence in the BA and graduate education markets, especially the Apollo Group, which owns the Univer-graduate education markets, especially the Apollo Group, which owns the Univer-sity of Phoenix. But even though the big players in this sector do account for the sity of Phoenix. But even though the big players in this sector do account for the majority of for-profi t enrollments, another important part of the sector consists of majority of for-profi t enrollments, another important part of the sector consists of career colleges that focus on a wide range of shorter AA and certifi cate programs. career colleges that focus on a wide range of shorter AA and certifi cate programs. Completions in the for-profi t sector are still dominated by certifi cate programs, and Completions in the for-profi t sector are still dominated by certifi cate programs, and 55 percent of the certifi cates granted by the for-profi ts are awarded by the 1,700 or 55 percent of the certifi cates granted by the for-profi ts are awarded by the 1,700 or so independent career colleges and institutes. Our tabulations from the IPEDS indi-so independent career colleges and institutes. Our tabulations from the IPEDS indi-cate that certifi cates account for 54 percent of the degrees and awards conferred by cate that certifi cates account for 54 percent of the degrees and awards conferred by for-profi ts in 2008–2009.for-profi ts in 2008–2009.
There are several important commonalities across this mixed group. The There are several important commonalities across this mixed group. The for-profi t sector offers almost no general education and liberal arts programs. For-for-profi t sector offers almost no general education and liberal arts programs. For-profi t programs typically are not meant to prepare students to continue to another profi t programs typically are not meant to prepare students to continue to another form of higher education, as is the case with most community colleges. Rather, the form of higher education, as is the case with most community colleges. Rather, the for-profi ts almost always offer training for a vocation or trade. In that sense, they for-profi ts almost always offer training for a vocation or trade. In that sense, they are “career colleges.” In addition, virtually all the for-profi ts require that admitted are “career colleges.” In addition, virtually all the for-profi ts require that admitted students have a high school diploma or another secondary school credential such students have a high school diploma or another secondary school credential such as a GED. Their ability to obtain federal (Title IV) fi nancial aid for their students as a GED. Their ability to obtain federal (Title IV) fi nancial aid for their students is typically contingent on their admitting primarily students who have already is typically contingent on their admitting primarily students who have already
2 In higher education, nonprofi ts and publics are not that far behind in pay, just below the very top of the for-profi t scale. In 2006/07, before the stock market decline, the highest paid university president was Gordon Gee at Vanderbilt who earned slightly more than $2 million in total compensation. A bit lower down the scale, the tenth highest-paid CEO at a for-profi t was Wallace Boston, Jr., CEO of American Public Education, with $961,000, while number 10 among the presidents of public institutions on the list was Jack Varsalona at Wilmington University who earned $974,000. After the stock market drop, earn-ings in 2008/09 for presidents at public and nonprofi t private universities were far lower. The data on for-profi t CEO pay is from Chronicle of Higher Education (2010); data on public and nonprofi t president’s pay is from Gibson (2009).

David J. Deming, Claudia Goldin, and Lawrence F. Katz 145
completed secondary school. However, beyond requiring a high school degree, for-completed secondary school. However, beyond requiring a high school degree, for-profi t institutions are almost always nonselective and open admissions.profi t institutions are almost always nonselective and open admissions.
For-profi t higher education is more likely to fl ourish in providing vocational For-profi t higher education is more likely to fl ourish in providing vocational programs that lead to certifi cation and early job placement—programs that have clear programs that lead to certifi cation and early job placement—programs that have clear short-run outcomes that can serve to build institutional reputation in the labor market. short-run outcomes that can serve to build institutional reputation in the labor market. But the for-profi ts are likely to be in a far less advantageous position where external But the for-profi ts are likely to be in a far less advantageous position where external benefi ts (and subsidies from donors and government) are important and where the benefi ts (and subsidies from donors and government) are important and where the qualities of inputs and outputs are diffi cult to verify (Winston 1999). For-profi ts also qualities of inputs and outputs are diffi cult to verify (Winston 1999). For-profi ts also have been successful at designing programs to attract nontraditional students who may have been successful at designing programs to attract nontraditional students who may not be well-served by public institutions (Breneman, Pusser, and Turner 2006).not be well-served by public institutions (Breneman, Pusser, and Turner 2006).
What is Title IV Eligibility?The for-profi t sector that we analyze here includes almost exclusively those The for-profi t sector that we analyze here includes almost exclusively those
that are termed “Title IV eligible.” Because for-profi ts often cater to independent that are termed “Title IV eligible.” Because for-profi ts often cater to independent students and those from low-income families who fi nance college through Pell students and those from low-income families who fi nance college through Pell grants and federal student loans, they have an intricate relationship with the federal grants and federal student loans, they have an intricate relationship with the federal government to ensure they maintain eligibility to receive Title IV federal student aid. government to ensure they maintain eligibility to receive Title IV federal student aid. The for-profi ts, like public institutions of higher education, receive an extremely The for-profi ts, like public institutions of higher education, receive an extremely large fraction of their revenues from government sources.large fraction of their revenues from government sources.
Title IV eligibility is granted by the U.S. Department of Education and requires Title IV eligibility is granted by the U.S. Department of Education and requires that the institution be accredited by at least one of their approved accrediting agen-that the institution be accredited by at least one of their approved accrediting agen-cies, be registered by one of the states, and meet other standards on a continued cies, be registered by one of the states, and meet other standards on a continued basis. Some of these standards concern the length of programs and some concern basis. Some of these standards concern the length of programs and some concern students and their federal loan repayment activity. A Title IV–eligible, private for-students and their federal loan repayment activity. A Title IV–eligible, private for-profi t school must either provide training for gainful employment in a recognized profi t school must either provide training for gainful employment in a recognized occupation or provide a program leading to a baccalaureate degree in the liberal occupation or provide a program leading to a baccalaureate degree in the liberal arts (U.S. Department of Education 2011a). Our discussion excludes non–Title IV, arts (U.S. Department of Education 2011a). Our discussion excludes non–Title IV, for-profi t schools, about which little has been known because the U.S. Department for-profi t schools, about which little has been known because the U.S. Department of Education does not track them. Virtually all degrees are granted by Title IV–of Education does not track them. Virtually all degrees are granted by Title IV–eligible institutions, but programs that are less than two years in length that grant eligible institutions, but programs that are less than two years in length that grant certifi cates (also diplomas) often are found at non–Title IV institutions. For an certifi cates (also diplomas) often are found at non–Title IV institutions. For an analysis of the importance of the non–Title IV group of for-profi t schools using analysis of the importance of the non–Title IV group of for-profi t schools using state registration data, see Cellini and Goldin (forthcoming). Because virtually all state registration data, see Cellini and Goldin (forthcoming). Because virtually all degree-granting institutions are Title IV–eligible, the undercount from limiting degree-granting institutions are Title IV–eligible, the undercount from limiting the analysis to Title IV schools impacts only the nondegree (typically certifi cate) the analysis to Title IV schools impacts only the nondegree (typically certifi cate) programs in institutions without any degree program.programs in institutions without any degree program.
For-Profi t ProgramsThe for-profi ts loom large in the production of degrees and certifi cates in certain The for-profi ts loom large in the production of degrees and certifi cates in certain
programs. For-profi ts produce 18 percent of all associate’s degrees, but they produce programs. For-profi ts produce 18 percent of all associate’s degrees, but they produce 33 percent of the AAs granted in business, management, and marketing, 51 percent 33 percent of the AAs granted in business, management, and marketing, 51 percent in computer and information sciences, 23 percent in the health professions, and in computer and information sciences, 23 percent in the health professions, and 34 percent in security and protective services. In the public and nonprofi t private 34 percent in security and protective services. In the public and nonprofi t private sectors, an AA degree is often the gateway to a four-year college and, in consequence, sectors, an AA degree is often the gateway to a four-year college and, in consequence,
146 Journal of Economic Perspectives
38 percent of these AA programs are in general studies and liberal arts programs. In 38 percent of these AA programs are in general studies and liberal arts programs. In the for-profi ts, a mere 2.4 percent are in general studies and liberal arts.the for-profi ts, a mere 2.4 percent are in general studies and liberal arts.
Although 5 percent of all BAs are granted by for-profi t institutions, 12 percent Although 5 percent of all BAs are granted by for-profi t institutions, 12 percent of all BAs in business, management, and marketing are. Other large for-profi t of all BAs in business, management, and marketing are. Other large for-profi t BA programs are in communications (52 percent of all BAs in communications BA programs are in communications (52 percent of all BAs in communications are granted by for-profi ts), computer and information sciences (27 percent), and are granted by for-profi ts), computer and information sciences (27 percent), and personal and culinary services (42 percent).personal and culinary services (42 percent).
Certain programs are highly concentrated in the for-profi t degree categories. Certain programs are highly concentrated in the for-profi t degree categories. Among AA degrees just two program groups—business, management, and marketing, Among AA degrees just two program groups—business, management, and marketing, and the health professions—account for 52 percent of all degrees. In the BA group, and the health professions—account for 52 percent of all degrees. In the BA group, the business program produces almost 50 percent of the total. Among certifi cates the business program produces almost 50 percent of the total. Among certifi cates granted in the Title IV for-profi t sector, health professions and personal and culinary granted in the Title IV for-profi t sector, health professions and personal and culinary services account for 78 percent of certifi cate completers (U.S. Department of Educa-services account for 78 percent of certifi cate completers (U.S. Department of Educa-tion, NCES, 2009, tables 37 and 40; authors’ tabulations from the IPEDS).tion, NCES, 2009, tables 37 and 40; authors’ tabulations from the IPEDS).
Who Are the Students?The for-profi t sector disproportionately serves older students, women, African-The for-profi t sector disproportionately serves older students, women, African-
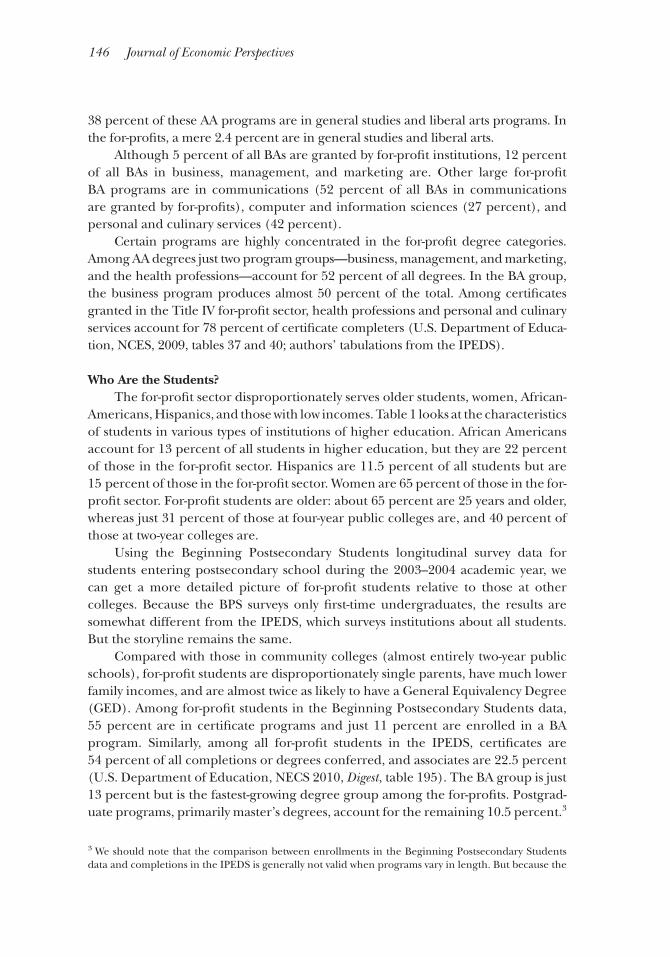
Americans, Hispanics, and those with low incomes. Table 1 looks at the characteristics Americans, Hispanics, and those with low incomes. Table 1 looks at the characteristics of students in various types of institutions of higher education. African Americans of students in various types of institutions of higher education. African Americans account for 13 percent of all students in higher education, but they are 22 percent account for 13 percent of all students in higher education, but they are 22 percent of those in the for-profi t sector. Hispanics are 11.5 percent of all students but are of those in the for-profi t sector. Hispanics are 11.5 percent of all students but are 15 percent of those in the for-profi t sector. Women are 65 percent of those in the for-15 percent of those in the for-profi t sector. Women are 65 percent of those in the for-profi t sector. For-profi t students are older: about 65 percent are 25 years and older, profi t sector. For-profi t students are older: about 65 percent are 25 years and older, whereas just 31 percent of those at four-year public colleges are, and 40 percent of whereas just 31 percent of those at four-year public colleges are, and 40 percent of those at two-year colleges are.those at two-year colleges are.
Using the Beginning Postsecondary Students longitudinal survey data for Using the Beginning Postsecondary Students longitudinal survey data for students entering postsecondary school during the 2003–2004 academic year, we students entering postsecondary school during the 2003–2004 academic year, we can get a more detailed picture of for-profi t students relative to those at other can get a more detailed picture of for-profi t students relative to those at other colleges. Because the BPS surveys only fi rst-time undergraduates, the results are colleges. Because the BPS surveys only fi rst-time undergraduates, the results are somewhat different from the IPEDS, which surveys institutions about all students. somewhat different from the IPEDS, which surveys institutions about all students. But the storyline remains the same.But the storyline remains the same.
Compared with those in community colleges (almost entirely two-year public Compared with those in community colleges (almost entirely two-year public schools), for-profi t students are disproportionately single parents, have much lower schools), for-profi t students are disproportionately single parents, have much lower family incomes, and are almost twice as likely to have a General Equivalency Degree family incomes, and are almost twice as likely to have a General Equivalency Degree (GED). Among for-profi t students in the Beginning Postsecondary Students data, (GED). Among for-profi t students in the Beginning Postsecondary Students data, 55 percent are in certifi cate programs and just 11 percent are enrolled in a BA 55 percent are in certifi cate programs and just 11 percent are enrolled in a BA program. Similarly, among all for-profi t students in the IPEDS, certifi cates are program. Similarly, among all for-profi t students in the IPEDS, certifi cates are 54 percent of all completions or degrees conferred, and associates are 22.5 percent 54 percent of all completions or degrees conferred, and associates are 22.5 percent (U.S. Department of Education, NECS 2010, (U.S. Department of Education, NECS 2010, Digest, table 195). The BA group is just , table 195). The BA group is just 13 percent but is the fastest-growing degree group among the for-profi ts. Postgrad-13 percent but is the fastest-growing degree group among the for-profi ts. Postgrad-uate programs, primarily master’s degrees, account for the remaining 10.5 percent.uate programs, primarily master’s degrees, account for the remaining 10.5 percent.33
3 We should note that the comparison between enrollments in the Beginning Postsecondary Students data and completions in the IPEDS is generally not valid when programs vary in length. But because the
The For-Profi t Postsecondary School Sector: Nimble Critters or Agile Predators? 147
BPS surveys a cohort, the comparison has greater validity.
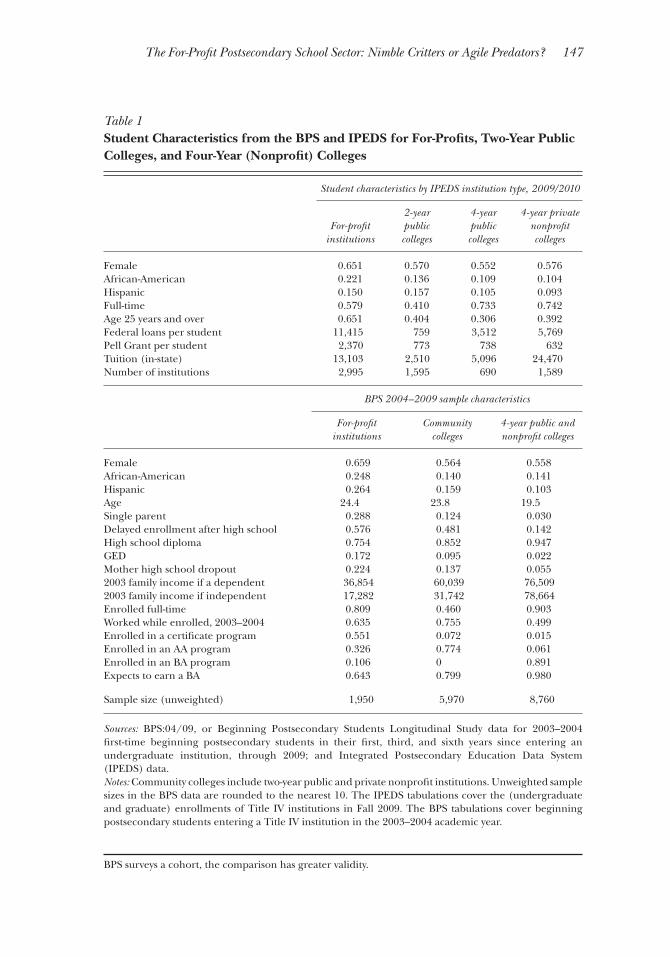
Table 1Student Characteristics from the BPS and IPEDS for For-Profi ts, Two-Year Public Colleges, and Four-Year (Nonprofi t) Colleges
Student characteristics by IPEDS institution type, 2009/2010
For-profi t institutions
2-year public colleges
4-year public colleges
4-year private nonprofi t colleges
Female 0.651 0.570 0.552 0.576African-American 0.221 0.136 0.109 0.104Hispanic 0.150 0.157 0.105 0.093Full-time 0.579 0.410 0.733 0.742Age 25 years and over 0.651 0.404 0.306 0.392Federal loans per student 11,415 759 3,512 5,769Pell Grant per student 2,370 773 738 632Tuition (in-state) 13,103 2,510 5,096 24,470Number of institutions 2,995 1,595 690 1,589
BPS 2004–2009 sample characteristics
For-profi t institutions
Communitycolleges
4-year public and nonprofi t colleges
Female 0.659 0.564 0.558African-American 0.248 0.140 0.141Hispanic 0.264 0.159 0.103Age 24.4 23.8 19.5Single parent 0.288 0.124 0.030Delayed enrollment after high school 0.576 0.481 0.142High school diploma 0.754 0.852 0.947GED 0.172 0.095 0.022Mother high school dropout 0.224 0.137 0.0552003 family income if a dependent 36,854 60,039 76,5092003 family income if independent 17,282 31,742 78,664Enrolled full-time 0.809 0.460 0.903Worked while enrolled, 2003–2004 0.635 0.755 0.499Enrolled in a certifi cate program 0.551 0.072 0.015Enrolled in an AA program 0.326 0.774 0.061Enrolled in an BA program 0.106 0 0.891Expects to earn a BA 0.643 0.799 0.980
Sample size (unweighted) 1,950 5,970 8,760
Sources: BPS:04/09, or Beginning Postsecondary Students Longitudinal Study data for 2003–2004 fi rst-time beginning postsecondary students in their fi rst, third, and sixth years since entering an undergraduate institution, through 2009; and Integrated Postsecondary Education Data System (IPEDS) data.Notes: Community colleges include two-year public and private nonprofi t institutions. Unweighted sample sizes in the BPS data are rounded to the nearest 10. The IPEDS tabulations cover the (undergraduate and graduate) enrollments of Title IV institutions in Fall 2009. The BPS tabulations cover beginning postsecondary students entering a Title IV institution in the 2003–2004 academic year.
148 Journal of Economic Perspectives
The Business Model of the For-Profi t Sector
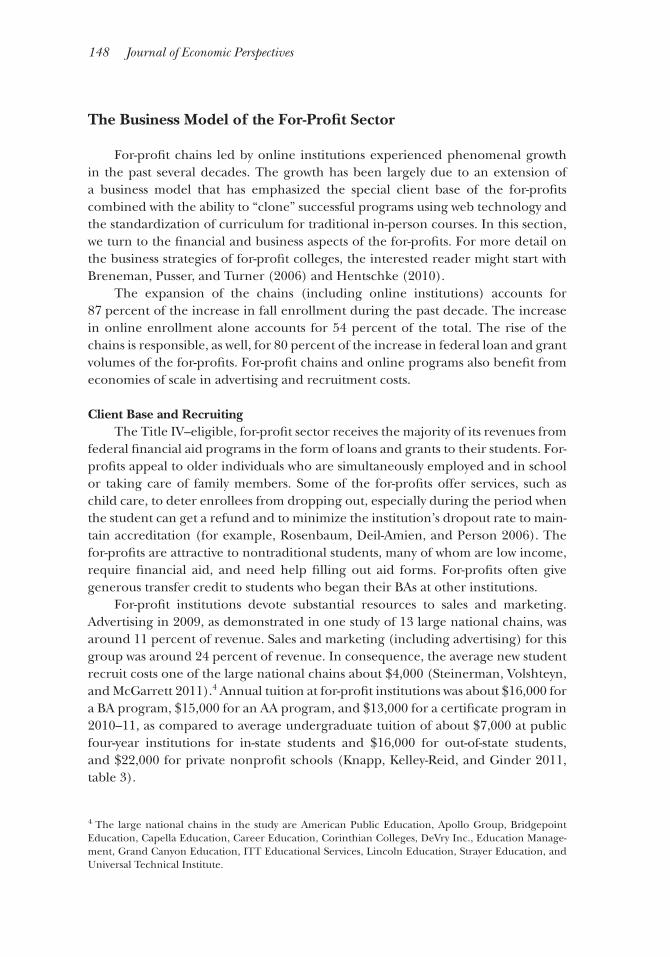
For-profi t chains led by online institutions experienced phenomenal growth For-profi t chains led by online institutions experienced phenomenal growth in the past several decades. The growth has been largely due to an extension of in the past several decades. The growth has been largely due to an extension of a business model that has emphasized the special client base of the for-profi ts a business model that has emphasized the special client base of the for-profi ts combined with the ability to “clone” successful programs using web technology and combined with the ability to “clone” successful programs using web technology and the standardization of curriculum for traditional in-person courses. In this section, the standardization of curriculum for traditional in-person courses. In this section, we turn to the fi nancial and business aspects of the for-profi ts. For more detail on we turn to the fi nancial and business aspects of the for-profi ts. For more detail on the business strategies of for-profi t colleges, the interested reader might start with the business strategies of for-profi t colleges, the interested reader might start with Breneman, Pusser, and Turner (2006) and Hentschke (2010).Breneman, Pusser, and Turner (2006) and Hentschke (2010).
The expansion of the chains (including online institutions) accounts for The expansion of the chains (including online institutions) accounts for 87 percent of the increase in fall enrollment during the past decade. The increase 87 percent of the increase in fall enrollment during the past decade. The increase in online enrollment alone accounts for 54 percent of the total. The rise of the in online enrollment alone accounts for 54 percent of the total. The rise of the chains is responsible, as well, for 80 percent of the increase in federal loan and grant chains is responsible, as well, for 80 percent of the increase in federal loan and grant volumes of the for-profi ts. For-profi t chains and online programs also benefi t from volumes of the for-profi ts. For-profi t chains and online programs also benefi t from economies of scale in advertising and recruitment costs.economies of scale in advertising and recruitment costs.
Client Base and RecruitingThe Title IV–eligible, for-profi t sector receives the majority of its revenues from The Title IV–eligible, for-profi t sector receives the majority of its revenues from
federal fi nancial aid programs in the form of loans and grants to their students. For-federal fi nancial aid programs in the form of loans and grants to their students. For-profi ts appeal to older individuals who are simultaneously employed and in school profi ts appeal to older individuals who are simultaneously employed and in school or taking care of family members. Some of the for-profi ts offer services, such as or taking care of family members. Some of the for-profi ts offer services, such as child care, to deter enrollees from dropping out, especially during the period when child care, to deter enrollees from dropping out, especially during the period when the student can get a refund and to minimize the institution’s dropout rate to main-the student can get a refund and to minimize the institution’s dropout rate to main-tain accreditation (for example, Rosenbaum, Deil-Amien, and Person 2006). The tain accreditation (for example, Rosenbaum, Deil-Amien, and Person 2006). The for-profi ts are attractive to nontraditional students, many of whom are low income, for-profi ts are attractive to nontraditional students, many of whom are low income, require fi nancial aid, and need help fi lling out aid forms. For-profi ts often give require fi nancial aid, and need help fi lling out aid forms. For-profi ts often give generous transfer credit to students who began their BAs at other institutions.generous transfer credit to students who began their BAs at other institutions.
For-profi t institutions devote substantial resources to sales and marketing. For-profi t institutions devote substantial resources to sales and marketing. Advertising in 2009, as demonstrated in one study of 13 large national chains, was Advertising in 2009, as demonstrated in one study of 13 large national chains, was around 11 percent of revenue. Sales and marketing (including advertising) for this around 11 percent of revenue. Sales and marketing (including advertising) for this group was around 24 percent of revenue. In consequence, the average new student group was around 24 percent of revenue. In consequence, the average new student recruit costs one of the large national chains about $4,000 (Steinerman, Volshteyn, recruit costs one of the large national chains about $4,000 (Steinerman, Volshteyn, and McGarrett 2011).and McGarrett 2011).44 Annual tuition at for-profi t institutions was about $16,000 for Annual tuition at for-profi t institutions was about $16,000 for a BA program, $15,000 for an AA program, and $13,000 for a certifi cate program in a BA program, $15,000 for an AA program, and $13,000 for a certifi cate program in 2010–11, as compared to average undergraduate tuition of about $7,000 at public 2010–11, as compared to average undergraduate tuition of about $7,000 at public four-year institutions for in-state students and $16,000 for out-of-state students, four-year institutions for in-state students and $16,000 for out-of-state students, and $22,000 for private nonprofi t schools (Knapp, Kelley-Reid, and Ginder 2011, and $22,000 for private nonprofi t schools (Knapp, Kelley-Reid, and Ginder 2011, table 3).table 3).
4 The large national chains in the study are American Public Education, Apollo Group, Bridgepoint Education, Capella Education, Career Education, Corinthian Colleges, DeVry Inc., Education Manage-ment, Grand Canyon Education, ITT Educational Services, Lincoln Education, Strayer Education, and Universal Technical Institute.
David J. Deming, Claudia Goldin, and Lawrence F. Katz 149
Responsiveness to MarketsFor-profi ts cater to the expanding market of nontraditional students, develop For-profi ts cater to the expanding market of nontraditional students, develop
curriculum and teaching practices to be able to provide identical programs at curriculum and teaching practices to be able to provide identical programs at multiple locations and at convenient times, and offer highly-structured programs multiple locations and at convenient times, and offer highly-structured programs to make timely completion feasible (Hentschke 2010). For-profi ts are attuned to to make timely completion feasible (Hentschke 2010). For-profi ts are attuned to the marketplace and are quick to open new schools, hire faculty, and add programs the marketplace and are quick to open new schools, hire faculty, and add programs in growing fi elds and localities. For example, Turner (2006) fi nds that change in in growing fi elds and localities. For example, Turner (2006) fi nds that change in for-profi t college enrollments are more positively correlated with changes in state for-profi t college enrollments are more positively correlated with changes in state college-age populations than are changes in public sector college enrollments.college-age populations than are changes in public sector college enrollments.
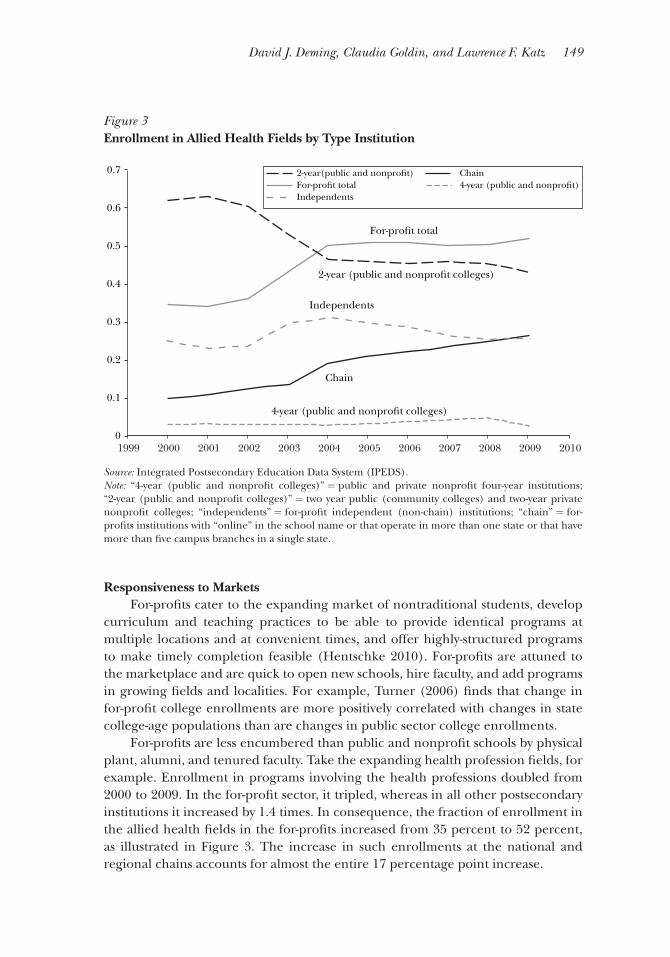
For-profi ts are less encumbered than public and nonprofi t schools by physical For-profi ts are less encumbered than public and nonprofi t schools by physical plant, alumni, and tenured faculty. Take the expanding health profession fi elds, for plant, alumni, and tenured faculty. Take the expanding health profession fi elds, for example. Enrollment in programs involving the health professions doubled from example. Enrollment in programs involving the health professions doubled from 2000 to 2009. In the for-profi t sector, it tripled, whereas in all other postsecondary 2000 to 2009. In the for-profi t sector, it tripled, whereas in all other postsecondary institutions it increased by 1.4 times. In consequence, the fraction of enrollment in institutions it increased by 1.4 times. In consequence, the fraction of enrollment in the allied health fi elds in the for-profi ts increased from 35 percent to 52 percent, the allied health fi elds in the for-profi ts increased from 35 percent to 52 percent, as illustrated in Figure 3. The increase in such enrollments at the national and as illustrated in Figure 3. The increase in such enrollments at the national and regional chains accounts for almost the entire 17 percentage point increase.regional chains accounts for almost the entire 17 percentage point increase.
Figure 3Enrollment in Allied Health Fields by Type Institution
Source: Integrated Postsecondary Education Data System (IPEDS).Note: “4-year (public and nonprofi t colleges)” = public and private nonprofi t four-year institutions; “2-year (public and nonprofi t colleges)” = two year public (community colleges) and two-year private nonprofi t colleges; “independents” = for-profi t independent (non-chain) institutions; “chain” = for-profi ts institutions with “online” in the school name or that operate in more than one state or that have more than fi ve campus branches in a single state.
20101999 2000 2001 2002 2003 2004 2005 2006 2007 2008 2009
0.7
0.6
0.5
0.4
0.3
0.2
0.1
0
For-profit total
2-year (public and nonprofit colleges)
Independents
Chain
4-year (public and nonprofit colleges)
2-year(public and nonprofit)For-profit totalIndependents
Chain4-year (public and nonprofit)
150 Journal of Economic Perspectives
Looking more closely at these programs, the for-profi ts have rapidly entered Looking more closely at these programs, the for-profi ts have rapidly entered the growing fi elds of medical assisting, phlebotomy, x-ray and ultrasound tech-the growing fi elds of medical assisting, phlebotomy, x-ray and ultrasound tech-nicians, practical nursing, and even registered nursing. The total number of nicians, practical nursing, and even registered nursing. The total number of AA degrees in the health professions doubled during the past decade, but degrees AA degrees in the health professions doubled during the past decade, but degrees in this area from for-profi ts quadrupled, with degrees from the large for-profi t in this area from for-profi ts quadrupled, with degrees from the large for-profi t chains rising by a multiple of six. A similar pattern arises for certifi cates in the chains rising by a multiple of six. A similar pattern arises for certifi cates in the health professions, where for-profi t national and regional chains more than health professions, where for-profi t national and regional chains more than tripled their awards from 2000 to 2009 at a time when the public sector only more tripled their awards from 2000 to 2009 at a time when the public sector only more than doubled theirs.than doubled theirs.
Online EducationOnline education fi ts many of the features of the for-profi t business model. For Online education fi ts many of the features of the for-profi t business model. For
example, it attracts older students who need to combine work with schooling and example, it attracts older students who need to combine work with schooling and appeals to students who do not want to learn on the academic calendar. (There is appeals to students who do not want to learn on the academic calendar. (There is even a popular advertisement: “Earn your college degree in your pajamas.”) Much even a popular advertisement: “Earn your college degree in your pajamas.”) Much of the growth of for-profi ts during the last decade has been in schools emphasizing of the growth of for-profi ts during the last decade has been in schools emphasizing online programs, as seen in Figure 1.online programs, as seen in Figure 1.
Some of this increase was due to U.S. Department of Education regulatory Some of this increase was due to U.S. Department of Education regulatory changes. Prior to 1998, a Title IV–eligible institution could not have more than changes. Prior to 1998, a Title IV–eligible institution could not have more than half of its enrollment in distance education. Then in 1998, the Higher Education half of its enrollment in distance education. Then in 1998, the Higher Education Act authorized the U.S. Department of Education to grant waivers to promote new Act authorized the U.S. Department of Education to grant waivers to promote new advances in distance education. By the early 2000s many of the larger chains were advances in distance education. By the early 2000s many of the larger chains were granted waivers, and the limit on share of enrollment in distance education was granted waivers, and the limit on share of enrollment in distance education was dropped. The regulatory change in 2005 spurred the growth of dedicated online dropped. The regulatory change in 2005 spurred the growth of dedicated online institutions. By 2007–2008, 12 percent of undergraduates and 25 percent of grad-institutions. By 2007–2008, 12 percent of undergraduates and 25 percent of grad-uate students at for-profi ts took their entire program through distance education as uate students at for-profi ts took their entire program through distance education as compared with less than 3 percent for undergraduates and 8 percent for graduate compared with less than 3 percent for undergraduates and 8 percent for graduate students at public and private nonprofi t institutions combined (U.S. Department of students at public and private nonprofi t institutions combined (U.S. Department of Education, NCES, 2011, tables A-43-1 and A-43-2).Education, NCES, 2011, tables A-43-1 and A-43-2).
Federal Student Financial AidFederal student fi nancial aid is the lifeblood of for-profi t higher education. Federal student fi nancial aid is the lifeblood of for-profi t higher education.
Federal grants and loans received under Title IV of the Higher Education Act Federal grants and loans received under Title IV of the Higher Education Act accounted for 73.7 percent of the revenues of Title IV–eligible, private for-profi t accounted for 73.7 percent of the revenues of Title IV–eligible, private for-profi t higher education institutions in 2008-09 (based on data in U.S. Department of Educa-higher education institutions in 2008-09 (based on data in U.S. Department of Educa-tion, Federal Student Aid Data Center 2011). Under current regulations, for-profi t tion, Federal Student Aid Data Center 2011). Under current regulations, for-profi t schools can derive no more than 90 percent of their revenue from Title IV fi nancial schools can derive no more than 90 percent of their revenue from Title IV fi nancial aid sources to maintain Title IV eligibility, and the constraint comes close to binding aid sources to maintain Title IV eligibility, and the constraint comes close to binding for many for-profi ts. In fact, 30 percent of for-profi t institutions, including many of for many for-profi ts. In fact, 30 percent of for-profi t institutions, including many of the largest national chains such as the University of Phoenix and Kaplan University, the largest national chains such as the University of Phoenix and Kaplan University, received more than 80 percent of their revenues from federal Title IV student aid received more than 80 percent of their revenues from federal Title IV student aid in 2008–2009. These Title IV revenue fi gures actually understate the importance of in 2008–2009. These Title IV revenue fi gures actually understate the importance of federal student aid to for-profi t institutions since they do not include military educa-federal student aid to for-profi t institutions since they do not include military educa-tional benefi ts provided to veterans and active service members, which do not count tional benefi ts provided to veterans and active service members, which do not count
The For-Profi t Postsecondary School Sector: Nimble Critters or Agile Predators? 151
towards the limit of 90 percent federal Title IV student aid revenues. The for-profi ts towards the limit of 90 percent federal Title IV student aid revenues. The for-profi ts have, in consequence, actively recruited military benefi t recipients—veterans, have, in consequence, actively recruited military benefi t recipients—veterans, service members, and their family members—especially under the Post–9/11 GI service members, and their family members—especially under the Post–9/11 GI Bill of 2008. For-profi ts accounted for 36.5 percent of the benefi ts paid under the Bill of 2008. For-profi ts accounted for 36.5 percent of the benefi ts paid under the Post–9/11 GI Bill during the fi rst year of the program (Health, Education, Labor Post–9/11 GI Bill during the fi rst year of the program (Health, Education, Labor and Pensions Committee 2010, p. 4).and Pensions Committee 2010, p. 4).
For-profi t institutions receive a disproportionate share of federal Title IV student For-profi t institutions receive a disproportionate share of federal Title IV student fi nancial aid both because they have higher tuition and fees than public institutions fi nancial aid both because they have higher tuition and fees than public institutions and because they attract large numbers of students who are fi nancially indepen-and because they attract large numbers of students who are fi nancially indepen-dent or come from low-income families. For-profi ts accounted for 24 percent of dent or come from low-income families. For-profi ts accounted for 24 percent of Pell grant disbursements and 26 percent of federal student loan disbursements in Pell grant disbursements and 26 percent of federal student loan disbursements in 2008–2009 even though they enrolled 12 percent of the students (authors’ tabula-2008–2009 even though they enrolled 12 percent of the students (authors’ tabula-tions from the IPEDS and NSLDS). Half of undergraduates at for-profi t schools tions from the IPEDS and NSLDS). Half of undergraduates at for-profi t schools received Pell grants, as compared with 25 percent at public and private nonprofi t received Pell grants, as compared with 25 percent at public and private nonprofi t institutions combined.institutions combined.
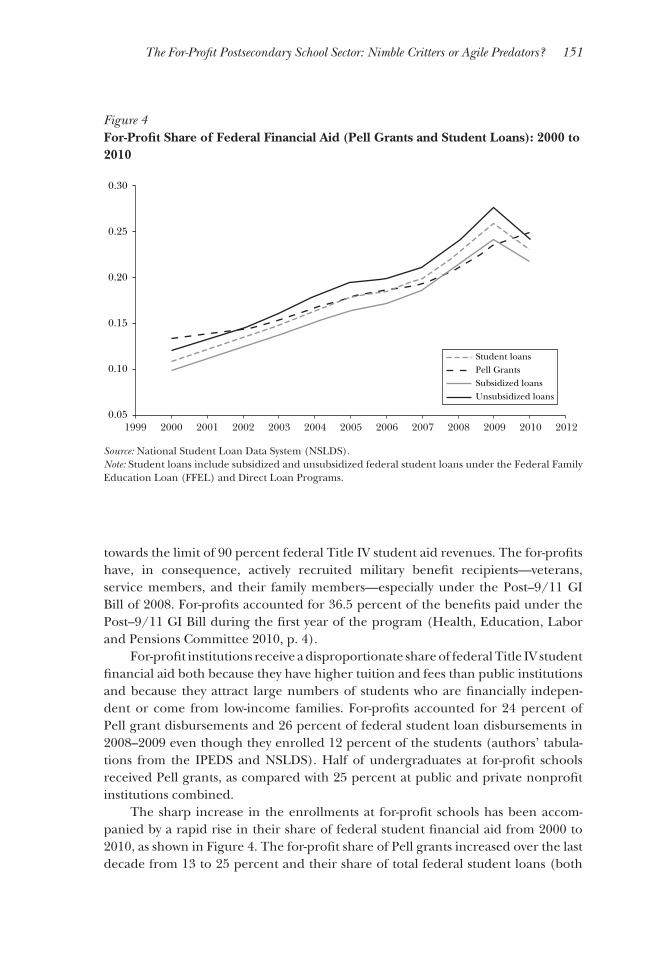
The sharp increase in the enrollments at for-profi t schools has been accom-The sharp increase in the enrollments at for-profi t schools has been accom-panied by a rapid rise in their share of federal student fi nancial aid from 2000 to panied by a rapid rise in their share of federal student fi nancial aid from 2000 to 2010, as shown in Figure 4. The for-profi t share of Pell grants increased over the last 2010, as shown in Figure 4. The for-profi t share of Pell grants increased over the last decade from 13 to 25 percent and their share of total federal student loans (both decade from 13 to 25 percent and their share of total federal student loans (both
Figure 4For-Profi t Share of Federal Financial Aid (Pell Grants and Student Loans): 2000 to 2010
Source: National Student Loan Data System (NSLDS).Note: Student loans include subsidized and unsubsidized federal student loans under the Federal Family Education Loan (FFEL) and Direct Loan Programs.
20101999 2000 2001 2002 2003 2004 2005 2006 2007 2008 2009 2012
0.30
0.25
0.20
0.15
0.10
0.05
Student loansPell GrantsSubsidized loansUnsubsidized loans
152 Journal of Economic Perspectives
subsidized and unsubsidized loans) increased from 11 percent in 2000 to 26 percent subsidized and unsubsidized loans) increased from 11 percent in 2000 to 26 percent in 2009 before dipping to 23 percent in 2010.in 2009 before dipping to 23 percent in 2010.55
Of course, public sector institutions receive direct taxpayer support largely Of course, public sector institutions receive direct taxpayer support largely from state government appropriations, enabling tuition and fees to be lower than from state government appropriations, enabling tuition and fees to be lower than they otherwise would be. If federal student loans to students at for-profi ts are repaid, they otherwise would be. If federal student loans to students at for-profi ts are repaid, taxpayer costs are actually lower to fi nance education in for-profi ts than in public taxpayer costs are actually lower to fi nance education in for-profi ts than in public sector institutions. But the comparison is not quite apples-to-apples. The rationale sector institutions. But the comparison is not quite apples-to-apples. The rationale for subsidies to public institutions and private nonprofi t schools is that they produce for subsidies to public institutions and private nonprofi t schools is that they produce research with potentially large spillover benefi ts and that they educate students in research with potentially large spillover benefi ts and that they educate students in the liberal arts and other fi elds that may improve civil society and generate external the liberal arts and other fi elds that may improve civil society and generate external benefi ts. Also, loans to students attending for-profi ts often do not get repaid.benefi ts. Also, loans to students attending for-profi ts often do not get repaid.
Default RatesStudents from for-profi t institutions have higher default rates on federal Students from for-profi t institutions have higher default rates on federal
student loans than students in other sectors. And the default rates of for-profi ts student loans than students in other sectors. And the default rates of for-profi ts have risen substantially during the last fi ve years.have risen substantially during the last fi ve years.66
The two-year “cohort default rate” measures the percentage of borrowers who The two-year “cohort default rate” measures the percentage of borrowers who enter repayment of federal student loans (by leaving a program through graduation enter repayment of federal student loans (by leaving a program through graduation or dropping out) during a fi scal year and default prior to the end of the next fi scal or dropping out) during a fi scal year and default prior to the end of the next fi scal year. An institution loses Title IV eligibility if its two-year cohort default rate exceeds year. An institution loses Title IV eligibility if its two-year cohort default rate exceeds 25 percent for three consecutive years or is 40 percent in any one year. The two-year 25 percent for three consecutive years or is 40 percent in any one year. The two-year cohort default rate of for-profi t institutions was 11.6 percent for fi scal year 2008 as cohort default rate of for-profi t institutions was 11.6 percent for fi scal year 2008 as compared with 6 percent for public institutions and 4 percent for private nonprofi ts. compared with 6 percent for public institutions and 4 percent for private nonprofi ts. The U.S. Department of Education is moving to a three-year cohort default rate The U.S. Department of Education is moving to a three-year cohort default rate standard for maintaining Title IV eligibility in fi scal year 2012. Three-year cohort standard for maintaining Title IV eligibility in fi scal year 2012. Three-year cohort default rates for fi scal year 2008 were 24.9 percent for for-profi ts, 7.6 percent for default rates for fi scal year 2008 were 24.9 percent for for-profi ts, 7.6 percent for private nonprofi ts, and 10.8 percent for public institutions (Steinerman, Volshteyn, private nonprofi ts, and 10.8 percent for public institutions (Steinerman, Volshteyn, and McGarrett 2011). The sharp increase in default rates from a two- to a three-year and McGarrett 2011). The sharp increase in default rates from a two- to a three-year window may, to some extent, refl ect incentives for institutions to minimize defaults window may, to some extent, refl ect incentives for institutions to minimize defaults within the current two-year regulatory window. Thus, three-year default rates also within the current two-year regulatory window. Thus, three-year default rates also are likely to provide a more realistic indicator of long-run loan repayment rates than are likely to provide a more realistic indicator of long-run loan repayment rates than the two-year default rates.the two-year default rates.77
We examine the role of student demographics, fi nancial aid take-up, and insti-We examine the role of student demographics, fi nancial aid take-up, and insti-tutional characteristics (degree types, distance education, remedial course offerings, tutional characteristics (degree types, distance education, remedial course offerings, and student services) in explaining the higher federal student loan default rates of and student services) in explaining the higher federal student loan default rates of
5 The slight decline in the for-profi t share of loans in 2010 may refl ect the shift from the Federal Family Education Loan program with bank lending under federal guarantees to the Direct Loan program where the federal government makes the loans directly to students. 6 Current default rates at for-profi ts, however, remain lower than in the late 1980s and early 1990s before the 1992 amendments to the Higher Education Act that tightened institutional eligibility for Title IV funds and removed many nondegree proprietary schools with very high default rates from the Title IV fi nancial aid programs (Bennett, Lucchesi, and Vedder 2010). 7 Furthermore, since federal Stafford loans have an initial 6-month grace period and can be up to 360 days delinquent before being considered in default, the two-year default rates typically cover a much shorter window in which a recorded default is possible.

David J. Deming, Claudia Goldin, and Lawrence F. Katz 153
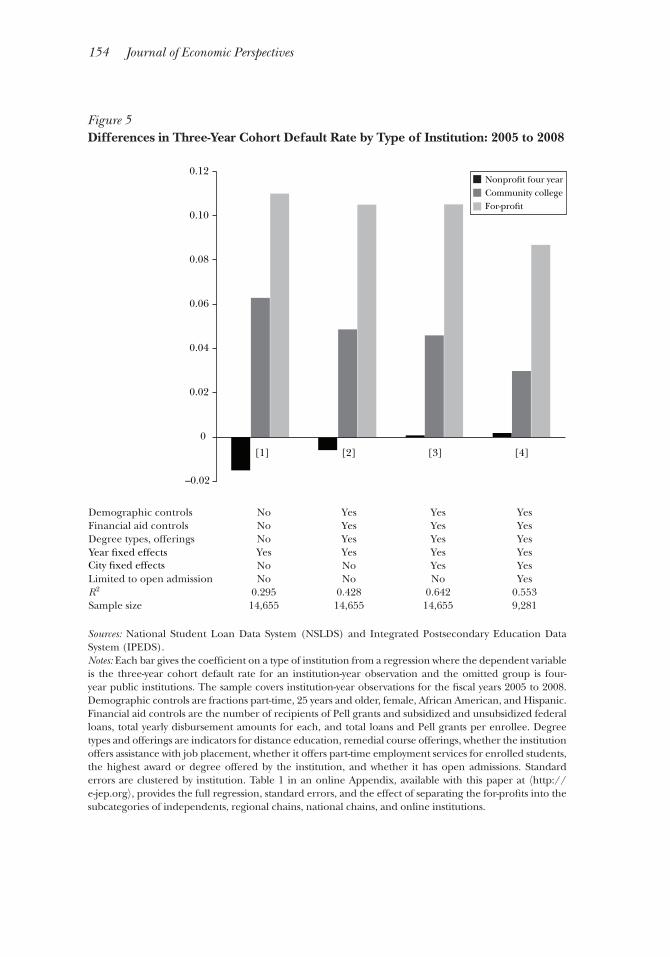
for-profi t institutions. Figure 5 graphs (regression-adjusted) differences in three-for-profi t institutions. Figure 5 graphs (regression-adjusted) differences in three-year cohort default rates by type of institution. The differences are computed from year cohort default rates by type of institution. The differences are computed from regressions of default rates on institution type (with public four-year institutions as regressions of default rates on institution type (with public four-year institutions as the base group) including year dummies plus successive additions of controls for the base group) including year dummies plus successive additions of controls for student and institution characteristics, geography, and school selectivity for pooled student and institution characteristics, geography, and school selectivity for pooled institution-year data covering the 2005 to 2008 fi scal years.institution-year data covering the 2005 to 2008 fi scal years.
The raw default rates and those regression-adjusted for institutional and student The raw default rates and those regression-adjusted for institutional and student characteristics are highest for the for-profi t schools, followed by community colleges characteristics are highest for the for-profi t schools, followed by community colleges and then four-year public and nonprofi t institutions. The unadjusted 11 percentage and then four-year public and nonprofi t institutions. The unadjusted 11 percentage point higher three-year cohort default rates for for-profi ts (column 1) relative to point higher three-year cohort default rates for for-profi ts (column 1) relative to the base group of four-year public institutions is reduced slightly to 10.5 percentage the base group of four-year public institutions is reduced slightly to 10.5 percentage points with the addition of detailed controls for student demographics, institutional points with the addition of detailed controls for student demographics, institutional characteristics, and city fi xed effects (columns 2 and 3) despite the fact that these characteristics, and city fi xed effects (columns 2 and 3) despite the fact that these controls explain a substantial fraction of the cross-institution variation in default controls explain a substantial fraction of the cross-institution variation in default rates. The addition of the covariates modestly expands the for-profi t default rate rates. The addition of the covariates modestly expands the for-profi t default rate gap relative to community colleges.gap relative to community colleges.
The for-profi t default rate is 8.7 percentage points higher than that for four-The for-profi t default rate is 8.7 percentage points higher than that for four-year publics and nonprofi ts and 5.7 percentage points higher than for community year publics and nonprofi ts and 5.7 percentage points higher than for community colleges even when the sample is limited to nonselective (open admission) insti-colleges even when the sample is limited to nonselective (open admission) insti-tutions (column 4). Higher three-year cohort default rates are apparent for all tutions (column 4). Higher three-year cohort default rates are apparent for all segments of the for-profi t sector, including independent schools, regional chains, segments of the for-profi t sector, including independent schools, regional chains, national chains, and largely online institutions (see Appendix Table 1, available national chains, and largely online institutions (see Appendix Table 1, available online with this paper at online with this paper at 〈〈http://e-jep.orghttp://e-jep.org⟩⟩). National chains have higher default ). National chains have higher default rates and online institutions lower default rates relative to all for-profi ts.rates and online institutions lower default rates relative to all for-profi ts.
For-profi t institutions account for a large and rising share of federal fi nan-For-profi t institutions account for a large and rising share of federal fi nan-cial aid. For-profi t students have much higher default rates than those at other cial aid. For-profi t students have much higher default rates than those at other schools even adjusting for differences in student characteristics. In the most schools even adjusting for differences in student characteristics. In the most recent data, they account for 47 percent of deafults. In addition, default rates recent data, they account for 47 percent of deafults. In addition, default rates have been rising particularly for the for-profi t chains.have been rising particularly for the for-profi t chains.
Student Outcomes
The large increase in federal student aid dollars fl owing to for-profi ts has The large increase in federal student aid dollars fl owing to for-profi ts has attracted substantial scrutiny about the quality of their programs and whether attracted substantial scrutiny about the quality of their programs and whether they provide students with suffi cient skills to enable them to thrive in the labor they provide students with suffi cient skills to enable them to thrive in the labor market and be able to pay off their student debts (for example, Baum 2011). Simple market and be able to pay off their student debts (for example, Baum 2011). Simple comparisons of student outcomes between the for-profi ts and other institutions may comparisons of student outcomes between the for-profi ts and other institutions may be misleading: after all, the for-profi ts disproportionately attract minority, older, be misleading: after all, the for-profi ts disproportionately attract minority, older, independent, and disadvantaged students. Thus, we assess student outcomes of the independent, and disadvantaged students. Thus, we assess student outcomes of the for-profi ts relative to other higher education institutions after adjusting for observ-for-profi ts relative to other higher education institutions after adjusting for observ-able differences in students who have attended different types of schools.able differences in students who have attended different types of schools.
The recent and rapid growth of for-profi t colleges means that most of the The recent and rapid growth of for-profi t colleges means that most of the standard individual-level longitudinal data sets do not identify those who went to standard individual-level longitudinal data sets do not identify those who went to
154 Journal of Economic Perspectives
Figure 5Differences in Three-Year Cohort Default Rate by Type of Institution: 2005 to 2008
Sources: National Student Loan Data System (NSLDS) and Integrated Postsecondary Education Data System (IPEDS).Notes: Each bar gives the coeffi cient on a type of institution from a regression where the dependent variable is the three-year cohort default rate for an institution-year observation and the omitted group is four-year public institutions. The sample covers institution-year observations for the fi scal years 2005 to 2008. Demographic controls are fractions part-time, 25 years and older, female, African American, and Hispanic. Financial aid controls are the number of recipients of Pell grants and subsidized and unsubsidized federal loans, total yearly disbursement amounts for each, and total loans and Pell grants per enrollee. Degree types and offerings are indicators for distance education, remedial course offerings, whether the institution offers assistance with job placement, whether it offers part-time employment services for enrolled students, the highest award or degree offered by the institution, and whether it has open admissions. Standard errors are clustered by institution. Table 1 in an online Appendix, available with this paper at 〈http://e-jep.org⟩, provides the full regression, standard errors, and the effect of separating the for-profi ts into the subcategories of independents, regional chains, national chains, and online institutions.
0.12
0.10
0.08
0.06
0.04
0.02
0
–0.02
[1] [2] [3] [4]
Nonprofit four yearCommunity collegeFor-profit
Demographic controls No Yes Yes YesFinancial aid controls No Yes Yes YesDegree types, offerings No Yes Yes Yes
Yes Yes Yes YesNo No Yes Yes
Limited to open admission No No No YesR2 0.295 0.428 0.642 0.553Sample size 14,655 14,655 14,655 9,281
Year fixed effectsCity fixed effects
The For-Profi t Postsecondary School Sector: Nimble Critters or Agile Predators? 155
for-profi t institutions or do not have large enough samples of for-profi t students for for-profi t institutions or do not have large enough samples of for-profi t students for a meaningful analysis. To overcome these constraints we use the most recent cohort a meaningful analysis. To overcome these constraints we use the most recent cohort of the Beginning Postsecondary Students Longitudinal Study, known as BPS:04/09. of the Beginning Postsecondary Students Longitudinal Study, known as BPS:04/09. A sample of 2003–2004 fi rst-time beginning postsecondary students are followed, A sample of 2003–2004 fi rst-time beginning postsecondary students are followed, in their fi rst, third, and sixth years since entering an undergraduate institution, in their fi rst, third, and sixth years since entering an undergraduate institution, up through 2009. Because it covers a recent cohort, a signifi cant fraction of the up through 2009. Because it covers a recent cohort, a signifi cant fraction of the sample initially enrolled in a for-profi t institution. The BPS has detailed student sample initially enrolled in a for-profi t institution. The BPS has detailed student background variables, low attrition rates, and an oversample of students at for-profi t background variables, low attrition rates, and an oversample of students at for-profi t institutions yielding approximately 1,950 students starting at for-profi ts out of a total institutions yielding approximately 1,950 students starting at for-profi ts out of a total of about 16,680 students in our main sample.of about 16,680 students in our main sample.88
The Beginning Postsecondary Students data is representative of fi rst-time The Beginning Postsecondary Students data is representative of fi rst-time postsecondary students (those starting an undergraduate program with no previous postsecondary students (those starting an undergraduate program with no previous postsecondary schooling). But because a large fraction of students in for-profi t insti-postsecondary schooling). But because a large fraction of students in for-profi t insti-tutions are older, nontraditional students returning to higher-education, they will tutions are older, nontraditional students returning to higher-education, they will not be picked up in this sample. Thus, our analysis estimates the for-profi t school not be picked up in this sample. Thus, our analysis estimates the for-profi t school treatment effect (relative to other types of institutions) for fi rst-time postsecondary treatment effect (relative to other types of institutions) for fi rst-time postsecondary students but not for the large group of returning students.students but not for the large group of returning students.
The outcome variables in the Beginning Postsecondary Students data are The outcome variables in the Beginning Postsecondary Students data are divided into two major groups. Those concerning college costs and fi nancial aid divided into two major groups. Those concerning college costs and fi nancial aid are given in Table 2, and those regarding student persistence, educational attain-are given in Table 2, and those regarding student persistence, educational attain-ment, employment, earnings, and satisfaction with the program are in Table 3. The ment, employment, earnings, and satisfaction with the program are in Table 3. The raw data, given in columns 1–3 of Tables 2 and 3, reveal that beginning postsecondary raw data, given in columns 1–3 of Tables 2 and 3, reveal that beginning postsecondary students at for-profi ts accumulate larger student debt burdens, are more likely to students at for-profi ts accumulate larger student debt burdens, are more likely to default on their student loans, have poorer employment outcomes fi ve years after default on their student loans, have poorer employment outcomes fi ve years after entering postsecondary school, and are less likely to be satisfi ed with their course entering postsecondary school, and are less likely to be satisfi ed with their course of study than students starting at public or private nonprofi t schools. The short-run of study than students starting at public or private nonprofi t schools. The short-run (one-year) dropout rate is slightly lower for starting for-profi t students than those (one-year) dropout rate is slightly lower for starting for-profi t students than those starting in a community college. For-profi t students in certifi cate and AA programs starting in a community college. For-profi t students in certifi cate and AA programs have higher completion rates than community college students. In contrast, BA have higher completion rates than community college students. In contrast, BA completion rates of for-profi t students are much lower than of those starting in completion rates of for-profi t students are much lower than of those starting in four-year public and nonprofi t schools.four-year public and nonprofi t schools.
Using the Beginning Postsecondary Students data, we assess whether the raw Using the Beginning Postsecondary Students data, we assess whether the raw mean student outcome differences have been overstated because for-profi t students mean student outcome differences have been overstated because for-profi t students differ from those in the public and the private nonprofi t sectors (as was demon-differ from those in the public and the private nonprofi t sectors (as was demon-strated in the bottom panel of Table 1). To do this, we adjust the raw outcomes strated in the bottom panel of Table 1). To do this, we adjust the raw outcomes for differences in baseline observables between for-profi t students and others using for differences in baseline observables between for-profi t students and others using two methods.two methods.
8 We use the sampling weights from the Beginning Postsecondary Students data in all our analyses to account for the variation in sampling rates among different student subgroups. The attrition rates from the BPS:04/09 by the fi nal 2009 survey round are relatively balanced by starting institution at 6.4 percent for students from for-profi ts, 10.9 percent for community college students, and 10.7 percent for students from four-year public and nonprofi t schools. The differences in attrition rate by starting institution type are small and not statistically signifi cant after conditioning on baseline covariates. Unweighted sample sizes are rounded to the nearest 10.
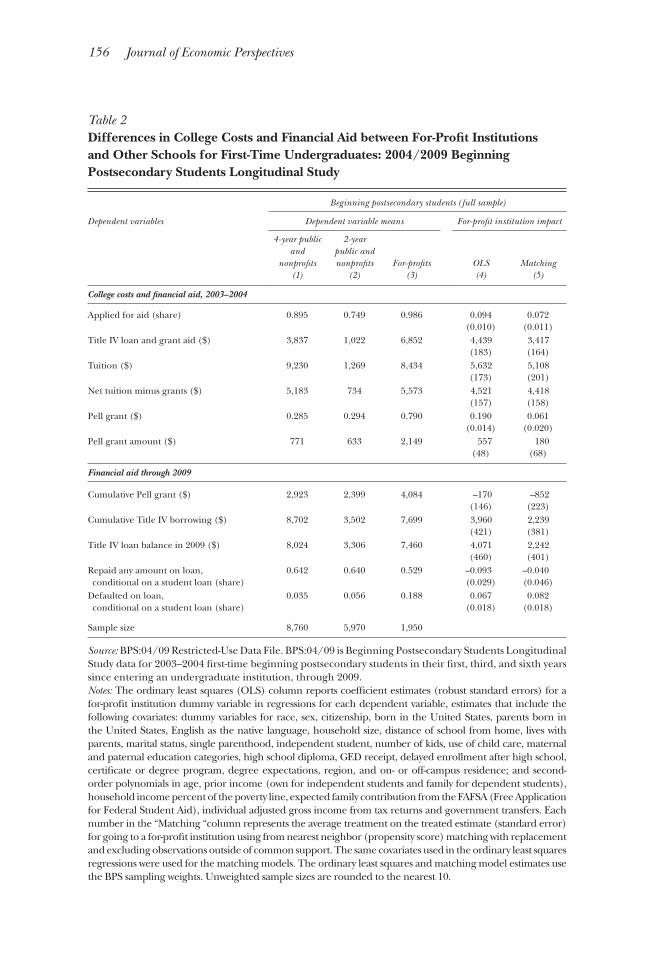
156 Journal of Economic Perspectives
Table 2Differences in College Costs and Financial Aid between For-Profi t Institutions and Other Schools for First-Time Undergraduates: 2004/2009 Beginning Postsecondary Students Longitudinal Study
Beginning postsecondary students (full sample)
Dependent variables Dependent variable means For-profi t institution impact
4-year public and
nonprofi ts(1)
2-yearpublic and nonprofi ts
(2)For-profi ts
(3)OLS(4)
Matching(5)
College costs and fi nancial aid, 2003–2004
Applied for aid (share) 0.895 0.749 0.986 0.094 0.072(0.010) (0.011)
Title IV loan and grant aid ($) 3,837 1,022 6,852 4,439 3,417(183) (164)
Tuition ($) 9,230 1,269 8,434 5,632 5,108(173) (201)
Net tuition minus grants ($) 5,183 734 5,573 4,521 4,418(157) (158)
Pell grant ($) 0.285 0.294 0.790 0.190 0.061(0.014) (0.020)
Pell grant amount ($) 771 633 2,149 557 180(48) (68)
Financial aid through 2009
Cumulative Pell grant ($) 2,923 2,399 4,084 –170 –852(146) (223)
Cumulative Title IV borrowing ($) 8,702 3,502 7,699 3,960 2,239(421) (381)
Title IV loan balance in 2009 ($) 8,024 3,306 7,460 4,071 2,242(460) (401)
Repaid any amount on loan, 0.642 0.640 0.529 –0.093 –0.040 conditional on a student loan (share) (0.029) (0.046)Defaulted on loan, 0.035 0.056 0.188 0.067 0.082 conditional on a student loan (share) (0.018) (0.018)
Sample size 8,760 5,970 1,950
Source: BPS:04/09 Restricted-Use Data File. BPS:04/09 is Beginning Postsecondary Students Longitudinal Study data for 2003–2004 fi rst-time beginning postsecondary students in their fi rst, third, and sixth years since entering an undergraduate institution, through 2009.Notes: The ordinary least squares (OLS) column reports coeffi cient estimates (robust standard errors) for a for-profi t institution dummy variable in regressions for each dependent variable, estimates that include the following covariates: dummy variables for race, sex, citizenship, born in the United States, parents born in the United States, English as the native language, household size, distance of school from home, lives with parents, marital status, single parenthood, independent student, number of kids, use of child care, maternal and paternal education categories, high school diploma, GED receipt, delayed enrollment after high school, certifi cate or degree program, degree expectations, region, and on- or off-campus residence; and second-order polynomials in age, prior income (own for independent students and family for dependent students), household income percent of the poverty line, expected family contribution from the FAFSA (Free Application for Federal Student Aid), individual adjusted gross income from tax returns and government transfers. Each number in the “Matching “column represents the average treatment on the treated estimate (standard error) for going to a for-profi t institution using from nearest neighbor (propensity score) matching with replacement and excluding observations outside of common support. The same covariates used in the ordinary least squares regressions were used for the matching models. The ordinary least squares and matching model estimates use the BPS sampling weights. Unweighted sample sizes are rounded to the nearest 10.
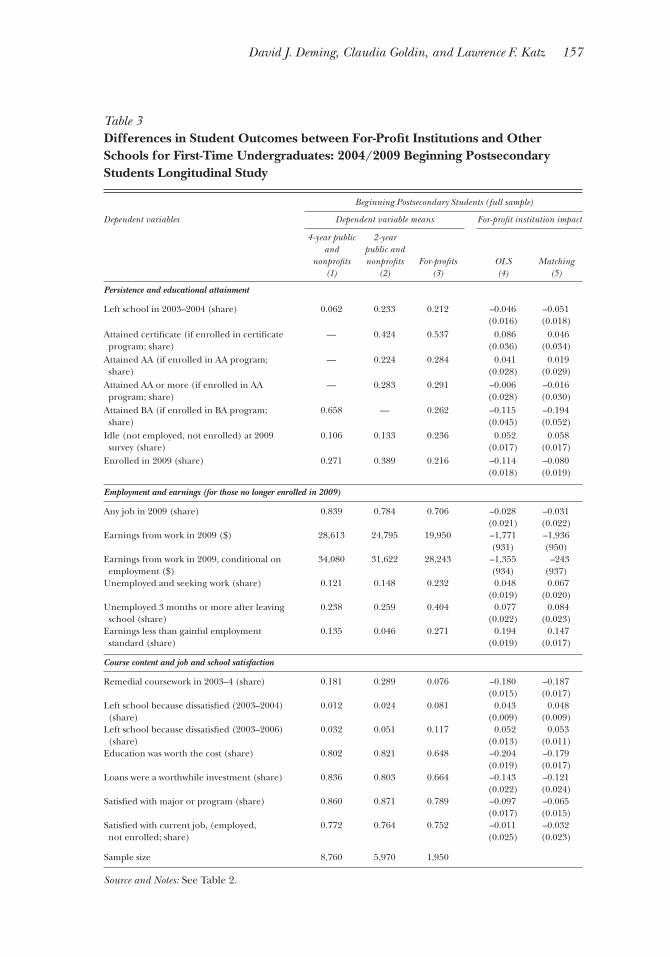
David J. Deming, Claudia Goldin, and Lawrence F. Katz 157
Table 3Differences in Student Outcomes between For-Profi t Institutions and Other Schools for First-Time Undergraduates: 2004/2009 Beginning Postsecondary Students Longitudinal Study
Beginning Postsecondary Students (full sample)
Dependent variables Dependent variable means For-profi t institution impact
4-year public and
nonprofi ts(1)
2-yearpublic and nonprofi ts
(2)For-profi ts
(3)OLS(4)
Matching(5)
Persistence and educational attainment
Left school in 2003–2004 (share) 0.062 0.233 0.212 –0.046 –0.051(0.016) (0.018)
Attained certifi cate (if enrolled in certifi cate — 0.424 0.537 0.086 0.046 program; share) (0.036) (0.034)Attained AA (if enrolled in AA program; — 0.224 0.284 0.041 0.019 share) (0.028) (0.029)Attained AA or more (if enrolled in AA — 0.283 0.291 –0.006 –0.016 program; share) (0.028) (0.030)Attained BA (if enrolled in BA program; 0.658 — 0.262 –0.115 –0.194 share) (0.045) (0.052)Idle (not employed, not enrolled) at 2009 0.106 0.133 0.236 0.052 0.058 survey (share) (0.017) (0.017)Enrolled in 2009 (share) 0.271 0.389 0.216 –0.114 –0.080
(0.018) (0.019)
Employment and earnings (for those no longer enrolled in 2009)
Any job in 2009 (share) 0.839 0.784 0.706 –0.028 –0.031(0.021) (0.022)
Earnings from work in 2009 ($) 28,613 24,795 19,950 –1,771 –1,936(931) (950)
Earnings from work in 2009, conditional on 34,080 31,622 28,243 –1,355 –243 employment ($) (934) (937)Unemployed and seeking work (share) 0.121 0.148 0.232 0.048 0.067
(0.019) (0.020)Unemployed 3 months or more after leaving 0.238 0.259 0.404 0.077 0.084 school (share) (0.022) (0.023)Earnings less than gainful employment 0.135 0.046 0.271 0.194 0.147 standard (share) (0.019) (0.017)
Course content and job and school satisfaction
Remedial coursework in 2003–4 (share) 0.181 0.289 0.076 –0.180 –0.187(0.015) (0.017)
Left school because dissatisfi ed (2003–2004) 0.012 0.024 0.081 0.043 0.048 (share) (0.009) (0.009)Left school because dissatisfi ed (2003–2006) 0.032 0.051 0.117 0.052 0.053 (share) (0.013) (0.011)Education was worth the cost (share) 0.802 0.821 0.648 –0.204 –0.179
(0.019) (0.017)Loans were a worthwhile investment (share) 0.836 0.803 0.664 –0.143 –0.121
(0.022) (0.024)Satisfi ed with major or program (share) 0.860 0.871 0.789 –0.097 –0.065
(0.017) (0.015)Satisfi ed with current job, (employed, 0.772 0.764 0.752 –0.011 –0.032 not enrolled; share) (0.025) (0.023)
Sample size 8,760 5,970 1,950
Source and Notes: See Table 2.
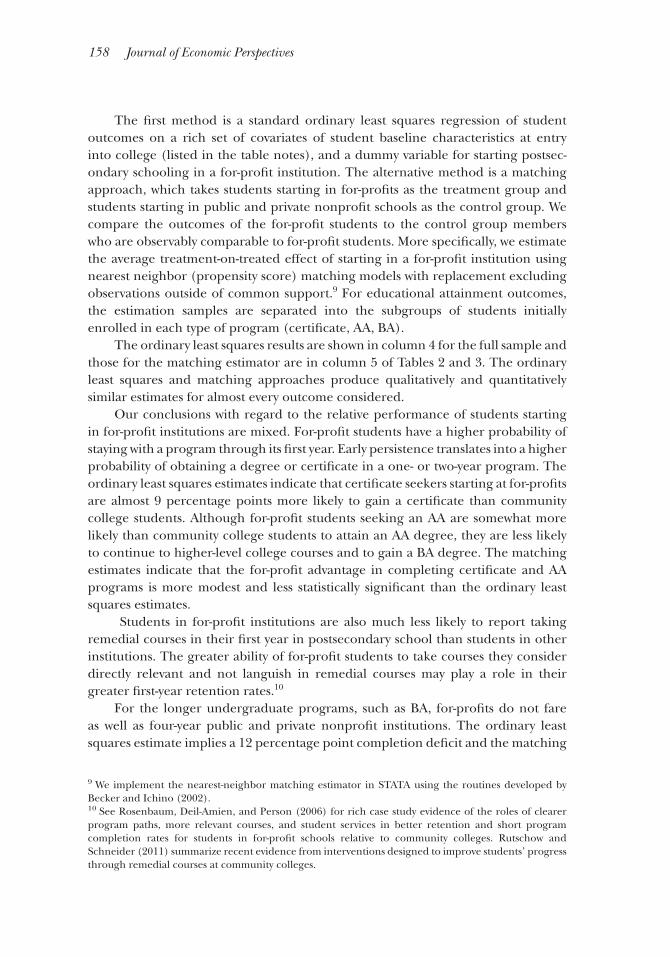
158 Journal of Economic Perspectives
The fi rst method is a standard ordinary least squares regression of student The fi rst method is a standard ordinary least squares regression of student outcomes on a rich set of covariates of student baseline characteristics at entry outcomes on a rich set of covariates of student baseline characteristics at entry into college (listed in the table notes), and a dummy variable for starting postsec-into college (listed in the table notes), and a dummy variable for starting postsec-ondary schooling in a for-profi t institution. The alternative method is a matching ondary schooling in a for-profi t institution. The alternative method is a matching approach, which takes students starting in for-profi ts as the treatment group and approach, which takes students starting in for-profi ts as the treatment group and students starting in public and private nonprofi t schools as the control group. We students starting in public and private nonprofi t schools as the control group. We compare the outcomes of the for-profi t students to the control group members compare the outcomes of the for-profi t students to the control group members who are observably comparable to for-profi t students. More specifi cally, we estimate who are observably comparable to for-profi t students. More specifi cally, we estimate the average treatment-on-treated effect of starting in a for-profi t institution using the average treatment-on-treated effect of starting in a for-profi t institution using nearest neighbor (propensity score) matching models with replacement excluding nearest neighbor (propensity score) matching models with replacement excluding observations outside of common support.observations outside of common support.99 For educational attainment outcomes, For educational attainment outcomes, the estimation samples are separated into the subgroups of students initially the estimation samples are separated into the subgroups of students initially enrolled in each type of program (certifi cate, AA, BA).enrolled in each type of program (certifi cate, AA, BA).
The ordinary least squares results are shown in column 4 for the full sample and The ordinary least squares results are shown in column 4 for the full sample and those for the matching estimator are in column 5 of Tables 2 and 3. The ordinary those for the matching estimator are in column 5 of Tables 2 and 3. The ordinary least squares and matching approaches produce qualitatively and quantitatively least squares and matching approaches produce qualitatively and quantitatively similar estimates for almost every outcome considered.similar estimates for almost every outcome considered.
Our conclusions with regard to the relative performance of students starting Our conclusions with regard to the relative performance of students starting in for-profi t institutions are mixed. For-profi t students have a higher probability of in for-profi t institutions are mixed. For-profi t students have a higher probability of staying with a program through its fi rst year. Early persistence translates into a higher staying with a program through its fi rst year. Early persistence translates into a higher probability of obtaining a degree or certifi cate in a one- or two-year program. The probability of obtaining a degree or certifi cate in a one- or two-year program. The ordinary least squares estimates indicate that certifi cate seekers starting at for-profi ts ordinary least squares estimates indicate that certifi cate seekers starting at for-profi ts are almost 9 percentage points more likely to gain a certifi cate than community are almost 9 percentage points more likely to gain a certifi cate than community college students. Although for-profi t students seeking an AA are somewhat more college students. Although for-profi t students seeking an AA are somewhat more likely than community college students to attain an AA degree, they are less likely likely than community college students to attain an AA degree, they are less likely to continue to higher-level college courses and to gain a BA degree. The matching to continue to higher-level college courses and to gain a BA degree. The matching estimates indicate that the for-profi t advantage in completing certifi cate and AA estimates indicate that the for-profi t advantage in completing certifi cate and AA programs is more modest and less statistically signifi cant than the ordinary least programs is more modest and less statistically signifi cant than the ordinary least squares estimates.squares estimates.
Students in for-profi t institutions are also much less likely to report taking Students in for-profi t institutions are also much less likely to report taking remedial courses in their fi rst year in postsecondary school than students in other remedial courses in their fi rst year in postsecondary school than students in other institutions. The greater ability of for-profi t students to take courses they consider institutions. The greater ability of for-profi t students to take courses they consider directly relevant and not languish in remedial courses may play a role in their directly relevant and not languish in remedial courses may play a role in their greater fi rst-year retention rates.greater fi rst-year retention rates.1010
For the longer undergraduate programs, such as BA, for-profi ts do not fare For the longer undergraduate programs, such as BA, for-profi ts do not fare as well as four-year public and private nonprofi t institutions. The ordinary least as well as four-year public and private nonprofi t institutions. The ordinary least squares estimate implies a 12 percentage point completion defi cit and the matching squares estimate implies a 12 percentage point completion defi cit and the matching
9 We implement the nearest-neighbor matching estimator in STATA using the routines developed by Becker and Ichino (2002). 10 See Rosenbaum, Deil-Amien, and Person (2006) for rich case study evidence of the roles of clearer program paths, more relevant courses, and student services in better retention and short program completion rates for students in for-profi t schools relative to community colleges. Rutschow and Schneider (2011) summarize recent evidence from interventions designed to improve students’ progress through remedial courses at community colleges.
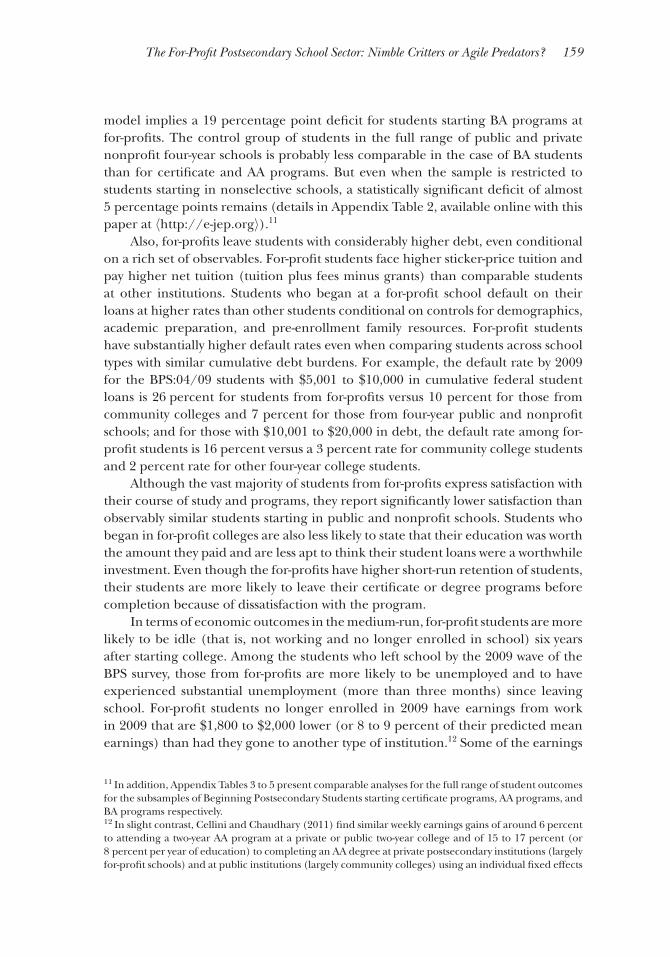
The For-Profi t Postsecondary School Sector: Nimble Critters or Agile Predators? 159
model implies a 19 percentage point defi cit for students starting BA programs at model implies a 19 percentage point defi cit for students starting BA programs at for-profi ts. The control group of students in the full range of public and private for-profi ts. The control group of students in the full range of public and private nonprofi t four-year schools is probably less comparable in the case of BA students nonprofi t four-year schools is probably less comparable in the case of BA students than for certifi cate and AA programs. But even when the sample is restricted to than for certifi cate and AA programs. But even when the sample is restricted to students starting in nonselective schools, a statistically signifi cant defi cit of almost students starting in nonselective schools, a statistically signifi cant defi cit of almost 5 percentage points remains (details in Appendix Table 2, available online with this 5 percentage points remains (details in Appendix Table 2, available online with this paper at paper at 〈〈http://e-jep.orghttp://e-jep.org⟩⟩).).1111
Also, for-profi ts leave students with considerably higher debt, even conditional Also, for-profi ts leave students with considerably higher debt, even conditional on a rich set of observables. For-profi t students face higher sticker-price tuition and on a rich set of observables. For-profi t students face higher sticker-price tuition and pay higher net tuition (tuition plus fees minus grants) than comparable students pay higher net tuition (tuition plus fees minus grants) than comparable students at other institutions. Students who began at a for-profi t school default on their at other institutions. Students who began at a for-profi t school default on their loans at higher rates than other students conditional on controls for demographics, loans at higher rates than other students conditional on controls for demographics, academic preparation, and pre-enrollment family resources. For-profi t students academic preparation, and pre-enrollment family resources. For-profi t students have substantially higher default rates even when comparing students across school have substantially higher default rates even when comparing students across school types with similar cumulative debt burdens. For example, the default rate by 2009 types with similar cumulative debt burdens. For example, the default rate by 2009 for the BPS:04/09 students with $5,001 to $10,000 in cumulative federal student for the BPS:04/09 students with $5,001 to $10,000 in cumulative federal student loans is 26 percent for students from for-profi ts versus 10 percent for those from loans is 26 percent for students from for-profi ts versus 10 percent for those from community colleges and 7 percent for those from four-year public and nonprofi t community colleges and 7 percent for those from four-year public and nonprofi t schools; and for those with $10,001 to $20,000 in debt, the default rate among for-schools; and for those with $10,001 to $20,000 in debt, the default rate among for-profi t students is 16 percent versus a 3 percent rate for community college students profi t students is 16 percent versus a 3 percent rate for community college students and 2 percent rate for other four-year college students.and 2 percent rate for other four-year college students.
Although the vast majority of students from for-profi ts express satisfaction with Although the vast majority of students from for-profi ts express satisfaction with their course of study and programs, they report signifi cantly lower satisfaction than their course of study and programs, they report signifi cantly lower satisfaction than observably similar students starting in public and nonprofi t schools. Students who observably similar students starting in public and nonprofi t schools. Students who began in for-profi t colleges are also less likely to state that their education was worth began in for-profi t colleges are also less likely to state that their education was worth the amount they paid and are less apt to think their student loans were a worthwhile the amount they paid and are less apt to think their student loans were a worthwhile investment. Even though the for-profi ts have higher short-run retention of students, investment. Even though the for-profi ts have higher short-run retention of students, their students are more likely to leave their certifi cate or degree programs before their students are more likely to leave their certifi cate or degree programs before completion because of dissatisfaction with the program.completion because of dissatisfaction with the program.
In terms of economic outcomes in the medium-run, for-profi t students are more In terms of economic outcomes in the medium-run, for-profi t students are more likely to be idle (that is, not working and no longer enrolled in school) six years likely to be idle (that is, not working and no longer enrolled in school) six years after starting college. Among the students who left school by the 2009 wave of the after starting college. Among the students who left school by the 2009 wave of the BPS survey, those from for-profi ts are more likely to be unemployed and to have BPS survey, those from for-profi ts are more likely to be unemployed and to have experienced substantial unemployment (more than three months) since leaving experienced substantial unemployment (more than three months) since leaving school. For-profi t students no longer enrolled in 2009 have earnings from work school. For-profi t students no longer enrolled in 2009 have earnings from work in 2009 that are $1,800 to $2,000 lower (or 8 to 9 percent of their predicted mean in 2009 that are $1,800 to $2,000 lower (or 8 to 9 percent of their predicted mean earnings) than had they gone to another type of institution.earnings) than had they gone to another type of institution.1212 Some of the earnings Some of the earnings
11 In addition, Appendix Tables 3 to 5 present comparable analyses for the full range of student outcomes for the subsamples of Beginning Postsecondary Students starting certifi cate programs, AA programs, and BA programs respectively. 12 In slight contrast, Cellini and Chaudhary (2011) fi nd similar weekly earnings gains of around 6 percent to attending a two-year AA program at a private or public two-year college and of 15 to 17 percent (or 8 percent per year of education) to completing an AA degree at private postsecondary institutions (largely for-profi t schools) and at public institutions (largely community colleges) using an individual fi xed effects
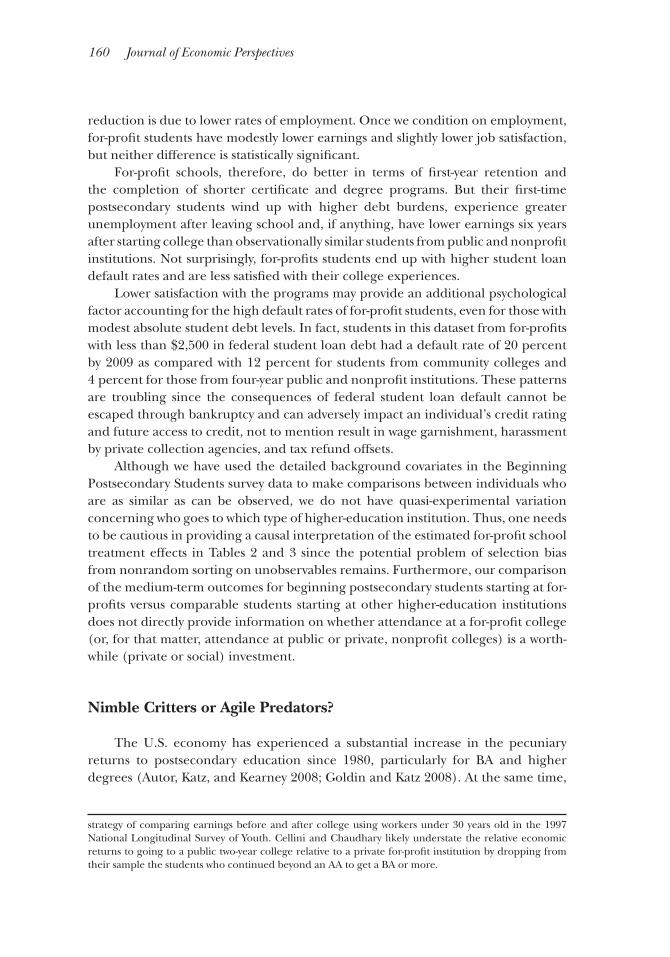
160 Journal of Economic Perspectives
reduction is due to lower rates of employment. Once we condition on employment, reduction is due to lower rates of employment. Once we condition on employment, for-profi t students have modestly lower earnings and slightly lower job satisfaction, for-profi t students have modestly lower earnings and slightly lower job satisfaction, but neither difference is statistically signifi cant.but neither difference is statistically signifi cant.
For-profi t schools, therefore, do better in terms of fi rst-year retention and For-profi t schools, therefore, do better in terms of fi rst-year retention and the completion of shorter certifi cate and degree programs. But their fi rst-time the completion of shorter certifi cate and degree programs. But their fi rst-time postsecondary students wind up with higher debt burdens, experience greater postsecondary students wind up with higher debt burdens, experience greater unemployment after leaving school and, if anything, have lower earnings six years unemployment after leaving school and, if anything, have lower earnings six years after starting college than observationally similar students from public and nonprofi t after starting college than observationally similar students from public and nonprofi t institutions. Not surprisingly, for-profi ts students end up with higher student loan institutions. Not surprisingly, for-profi ts students end up with higher student loan default rates and are less satisfi ed with their college experiences.default rates and are less satisfi ed with their college experiences.
Lower satisfaction with the programs may provide an additional psychological Lower satisfaction with the programs may provide an additional psychological factor accounting for the high default rates of for-profi t students, even for those with factor accounting for the high default rates of for-profi t students, even for those with modest absolute student debt levels. In fact, students in this dataset from for-profi ts modest absolute student debt levels. In fact, students in this dataset from for-profi ts with less than $2,500 in federal student loan debt had a default rate of 20 percent with less than $2,500 in federal student loan debt had a default rate of 20 percent by 2009 as compared with 12 percent for students from community colleges and by 2009 as compared with 12 percent for students from community colleges and 4 percent for those from four-year public and nonprofi t institutions. These patterns 4 percent for those from four-year public and nonprofi t institutions. These patterns are troubling since the consequences of federal student loan default cannot be are troubling since the consequences of federal student loan default cannot be escaped through bankruptcy and can adversely impact an individual’s credit rating escaped through bankruptcy and can adversely impact an individual’s credit rating and future access to credit, not to mention result in wage garnishment, harassment and future access to credit, not to mention result in wage garnishment, harassment by private collection agencies, and tax refund offsets.by private collection agencies, and tax refund offsets.
Although we have used the detailed background covariates in the Beginning Although we have used the detailed background covariates in the Beginning Postsecondary Students survey data to make comparisons between individuals who Postsecondary Students survey data to make comparisons between individuals who are as similar as can be observed, we do not have quasi-experimental variation are as similar as can be observed, we do not have quasi-experimental variation concerning who goes to which type of higher-education institution. Thus, one needs concerning who goes to which type of higher-education institution. Thus, one needs to be cautious in providing a causal interpretation of the estimated for-profi t school to be cautious in providing a causal interpretation of the estimated for-profi t school treatment effects in Tables 2 and 3 since the potential problem of selection bias treatment effects in Tables 2 and 3 since the potential problem of selection bias from nonrandom sorting on unobservables remains. Furthermore, our comparison from nonrandom sorting on unobservables remains. Furthermore, our comparison of the medium-term outcomes for beginning postsecondary students starting at for-of the medium-term outcomes for beginning postsecondary students starting at for-profi ts versus comparable students starting at other higher-education institutions profi ts versus comparable students starting at other higher-education institutions does not directly provide information on whether attendance at a for-profi t college does not directly provide information on whether attendance at a for-profi t college (or, for that matter, attendance at public or private, nonprofi t colleges) is a worth-(or, for that matter, attendance at public or private, nonprofi t colleges) is a worth-while (private or social) investment.while (private or social) investment.
Nimble Critters or Agile Predators?
The U.S. economy has experienced a substantial increase in the pecuniary The U.S. economy has experienced a substantial increase in the pecuniary returns to postsecondary education since 1980, particularly for BA and higher returns to postsecondary education since 1980, particularly for BA and higher degrees (Autor, Katz, and Kearney 2008; Goldin and Katz 2008). At the same time, degrees (Autor, Katz, and Kearney 2008; Goldin and Katz 2008). At the same time,
strategy of comparing earnings before and after college using workers under 30 years old in the 1997 National Longitudinal Survey of Youth. Cellini and Chaudhary likely understate the relative economic returns to going to a public two-year college relative to a private for-profi t institution by dropping from their sample the students who continued beyond an AA to get a BA or more.
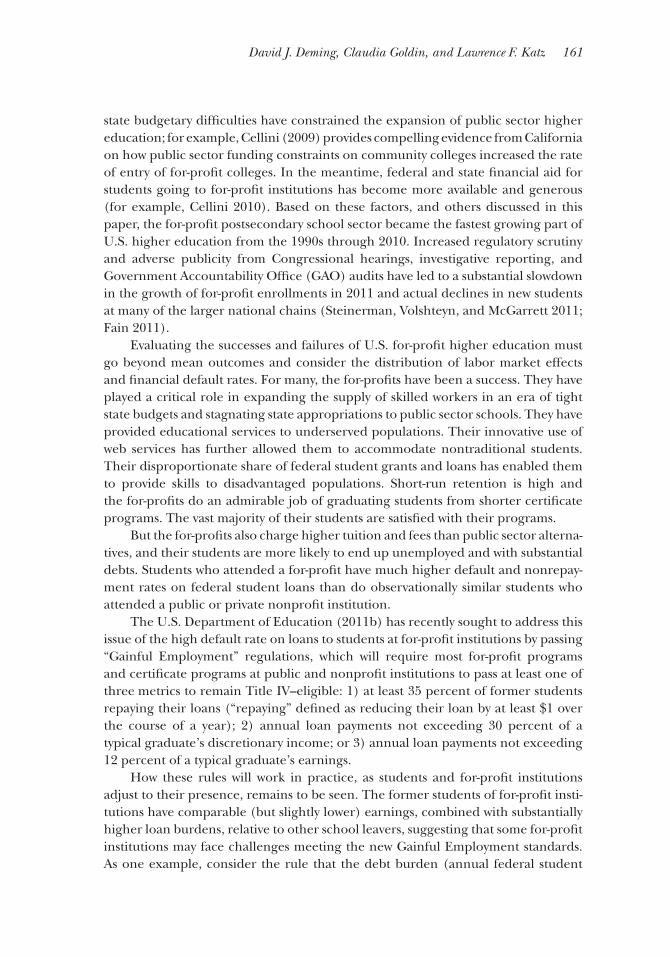
David J. Deming, Claudia Goldin, and Lawrence F. Katz 161
state budgetary diffi culties have constrained the expansion of public sector higher state budgetary diffi culties have constrained the expansion of public sector higher education; for example, Cellini (2009) provides compelling evidence from California education; for example, Cellini (2009) provides compelling evidence from California on how public sector funding constraints on community colleges increased the rate on how public sector funding constraints on community colleges increased the rate of entry of for-profi t colleges. In the meantime, federal and state fi nancial aid for of entry of for-profi t colleges. In the meantime, federal and state fi nancial aid for students going to for-profi t institutions has become more available and generous students going to for-profi t institutions has become more available and generous (for example, Cellini 2010). Based on these factors, and others discussed in this (for example, Cellini 2010). Based on these factors, and others discussed in this paper, the for-profi t postsecondary school sector became the fastest growing part of paper, the for-profi t postsecondary school sector became the fastest growing part of U.S. higher education from the 1990s through 2010. Increased regulatory scrutiny U.S. higher education from the 1990s through 2010. Increased regulatory scrutiny and adverse publicity from Congressional hearings, investigative reporting, and and adverse publicity from Congressional hearings, investigative reporting, and Government Accountability Offi ce (GAO) audits have led to a substantial slowdown Government Accountability Offi ce (GAO) audits have led to a substantial slowdown in the growth of for-profi t enrollments in 2011 and actual declines in new students in the growth of for-profi t enrollments in 2011 and actual declines in new students at many of the larger national chains (Steinerman, Volshteyn, and McGarrett 2011; at many of the larger national chains (Steinerman, Volshteyn, and McGarrett 2011; Fain 2011).Fain 2011).
Evaluating the successes and failures of U.S. for-profi t higher education must Evaluating the successes and failures of U.S. for-profi t higher education must go beyond mean outcomes and consider the distribution of labor market effects go beyond mean outcomes and consider the distribution of labor market effects and fi nancial default rates. For many, the for-profi ts have been a success. They have and fi nancial default rates. For many, the for-profi ts have been a success. They have played a critical role in expanding the supply of skilled workers in an era of tight played a critical role in expanding the supply of skilled workers in an era of tight state budgets and stagnating state appropriations to public sector schools. They have state budgets and stagnating state appropriations to public sector schools. They have provided educational services to underserved populations. Their innovative use of provided educational services to underserved populations. Their innovative use of web services has further allowed them to accommodate nontraditional students. web services has further allowed them to accommodate nontraditional students. Their disproportionate share of federal student grants and loans has enabled them Their disproportionate share of federal student grants and loans has enabled them to provide skills to disadvantaged populations. Short-run retention is high and to provide skills to disadvantaged populations. Short-run retention is high and the for-profi ts do an admirable job of graduating students from shorter certifi cate the for-profi ts do an admirable job of graduating students from shorter certifi cate programs. The vast majority of their students are satisfi ed with their programs.programs. The vast majority of their students are satisfi ed with their programs.
But the for-profi ts also charge higher tuition and fees than public sector alterna-But the for-profi ts also charge higher tuition and fees than public sector alterna-tives, and their students are more likely to end up unemployed and with substantial tives, and their students are more likely to end up unemployed and with substantial debts. Students who attended a for-profi t have much higher default and nonrepay-debts. Students who attended a for-profi t have much higher default and nonrepay-ment rates on federal student loans than do observationally similar students who ment rates on federal student loans than do observationally similar students who attended a public or private nonprofi t institution.attended a public or private nonprofi t institution.
The U.S. Department of Education (2011b) has recently sought to address this The U.S. Department of Education (2011b) has recently sought to address this issue of the high default rate on loans to students at for-profi t institutions by passing issue of the high default rate on loans to students at for-profi t institutions by passing “Gainful Employment” regulations, which will require most for-profi t programs “Gainful Employment” regulations, which will require most for-profi t programs and certifi cate programs at public and nonprofi t institutions to pass at least one of and certifi cate programs at public and nonprofi t institutions to pass at least one of three metrics to remain Title IV–eligible: 1) at least 35 percent of former students three metrics to remain Title IV–eligible: 1) at least 35 percent of former students repaying their loans (“repaying” defi ned as reducing their loan by at least $1 over repaying their loans (“repaying” defi ned as reducing their loan by at least $1 over the course of a year); 2) annual loan payments not exceeding 30 percent of a the course of a year); 2) annual loan payments not exceeding 30 percent of a typical graduate’s discretionary income; or 3) annual loan payments not exceeding typical graduate’s discretionary income; or 3) annual loan payments not exceeding 12 percent of a typical graduate’s earnings.12 percent of a typical graduate’s earnings.
How these rules will work in practice, as students and for-profi t institutions How these rules will work in practice, as students and for-profi t institutions adjust to their presence, remains to be seen. The former students of for-profi t insti-adjust to their presence, remains to be seen. The former students of for-profi t insti-tutions have comparable (but slightly lower) earnings, combined with substantially tutions have comparable (but slightly lower) earnings, combined with substantially higher loan burdens, relative to other school leavers, suggesting that some for-profi t higher loan burdens, relative to other school leavers, suggesting that some for-profi t institutions may face challenges meeting the new Gainful Employment standards. institutions may face challenges meeting the new Gainful Employment standards. As one example, consider the rule that the debt burden (annual federal student As one example, consider the rule that the debt burden (annual federal student
162 Journal of Economic Perspectives
loan yearly payments) should not exceed 12 percent of annual earnings for a typical loan yearly payments) should not exceed 12 percent of annual earnings for a typical graduate. In fact we fi nd (conditional on observables), in Table 3 for the Begin-graduate. In fact we fi nd (conditional on observables), in Table 3 for the Begin-ning Postsecondary Students data, that for-profi t students would have had a 15 to ning Postsecondary Students data, that for-profi t students would have had a 15 to 19 percentage point lower rate of meeting the recently enacted Gainful Employ-19 percentage point lower rate of meeting the recently enacted Gainful Employ-ment earnings threshold in 2008 (four to fi ve years after starting) than would ment earnings threshold in 2008 (four to fi ve years after starting) than would students from other types of institutions.students from other types of institutions.
In effect, the Gainful Employment rule seeks to hold the for-profi ts more In effect, the Gainful Employment rule seeks to hold the for-profi ts more accountable and put a greater burden on the schools, rather than only on the accountable and put a greater burden on the schools, rather than only on the students who have diffi culties in repaying their loans. The new regulations will also students who have diffi culties in repaying their loans. The new regulations will also require institutions to disclose their program costs, as well as completion, place-require institutions to disclose their program costs, as well as completion, place-ment, and loan repayment rates. These regulations will increase transparency but ment, and loan repayment rates. These regulations will increase transparency but may be insuffi cient to contain an agile predator. A reality check by a third party may be insuffi cient to contain an agile predator. A reality check by a third party might be needed before a student is allowed to take out a loan.might be needed before a student is allowed to take out a loan.
The for-profi ts have taken a large burden of increased enrollment in higher The for-profi ts have taken a large burden of increased enrollment in higher education off the public sector. The high default rates of their students on federal education off the public sector. The high default rates of their students on federal loans, however, increase their cost to the taxpayer. Regulating for-profi t colleges is loans, however, increase their cost to the taxpayer. Regulating for-profi t colleges is tricky business. The challenge is to rein in the agile predators while not stifl ing the tricky business. The challenge is to rein in the agile predators while not stifl ing the innovation of these nimble critters.innovation of these nimble critters.
■ We gratefully acknowledge the superb research assistance of Tanya Avilova, Jason Poulos, and Bernie Ziprich. We are grateful to Stephanie Cellini and the Editors for helpful comments. The research reported here was supported by the Institute of Education Sciences, U.S. Department of Education, through Grant R305C110011 to Teachers College, Columbia University. The opinions expressed are those of the authors and do not represent views of the Institute or the U.S. Department of Education.
References
Autor, David H., Lawrence F. Katz, and Melissa S. Kearney. 2008. “Trends in U.S. Wage Inequality: Revising the Revisionists.” Review of Economics and Statistics 90(2): 300–323.
Baum, Sandy. 2011. “Drowning in Debt: Finan-cial Outcomes of Students in For-Profi t Colleges.” Testimony to the U.S. Senate Committee on Health, Education, Labor and Pensions, June 7.
Becker, Sascha O., and Andrea Ichino. 2002. “Estimation of Average Treatment Effects based on Propensity Scores.” STATA Journal 2(4): 358–77.
Bennett, Daniel L., Adam R. Lucchesi, and
Richard K. Vedder. 2010. “For-Profi t Higher Educa-tion: Growth, Innovation, and Regulation.” A Policy Paper from the Center for College Affordability and Productivity, July. http://heartland.org/sites/all/modules/custom/heartland_migration/fi les/pdfs/29010.pdf.
Breneman, David W., Brian Pusser, and Sarah E. Turner, eds. 2006. Earnings from Learning: The Rise of For-Profi t Universities. Albany, NY: State University of New York Press.
Cellini, Stephanie Riegg. 2009. “Crowded Colleges and College Crowd-Out: The Impact of
The For-Profi t Postsecondary School Sector: Nimble Critters or Agile Predators? 163
Public Subsidies on the Two-Year College Market.” American Economic Journal: Economic Policy 1(2): 1–30.
Cellini, Stephanie Riegg. 2010. “Financial Aid and For-Profi t Colleges: Does Aid Encourage Entry?” Journal of Policy Analysis and Management 29(3): 526–52.
Cellini, Stephanie Riegg, and Latika Chaud-hary. 2011. “The Labor Market Returns to a Private Two-Year College Education.” http://home.gwu.edu/~scellini/Index/Research_files/Cellini%26Chaudhary_Returns_April11.pdf.
Cellini, Stephanie Riegg, and Claudia Goldin. Forthcoming. “Does Federal Student Aid Raise Tuition?: New Evidence on For-Profi t Colleges” NBER Working Paper.
Chronicle of Higher Education. 2010. “CEO Compensation at Publicly Traded Higher-Education Companies.” June. 23. http://chronicle.com/article/Graphic-CEO-Compensation-at/66017/.
Fain, Paul. 2011. “Enrollments Tumble at For-Profi t Colleges.” Inside Higher Ed, November 11. http://www.insidehighered.com/news/2011/11/11/enrollments-tumble-profi t-colleges.
Gibson, Ellen. 2009. “College Campuses Debate Administrators’ Lofty Pay.” Bloomberg Business Week, February 16. http://www.businessweek.com/bwdaily/dnflash/content/feb2009/db20090216_614557.htm?chan=top+news_top+news+index+-+temp_news+%2B+analysis.
Goldin, Claudia, and Lawrence F. Katz. 2008. The Race between Education and Technology. Cambridge, MA: Belknap Press, Harvard University Press.
Health, Education, Labor and Pensions Committee, U.S. Senate. 2010. “Benefi ting Whom? For-Profi t Education Companies and the Growth of Military Educational Benefi ts.” December 8. http://harkin.senate.gov/documents/pdf/4eb02b5a4610f.pdf.
Hentschke, Guilbert C. 2010. “Innovations in Business Models and Organizational Cultures: The For-Profi t Sector.” Unpublished paper, USC Rossier School of Education, June.
Knapp, Laura G., Janice Kelley-Reid, and Scott A. Ginder. 2011. Postsecondary Institutions and Price of Attendance in the United States: 2010–11: Degrees and Other Awards Conferred: 2009–10, and 12-Month Enrollment: 2009–10. First Look. NCES 2011–250. Washington, D.C: U.S. Department of Education. http://nces.ed.gov/pubs2011/2011250.pdf.
Rosenbaum, James E., Regina Deil-Amien, and Ann E. Person. 2006. After Admission: From College Access to College Success. New York: Russell Sage Foundation Press.
Rutschow, Elizabeth Zachry, and Emily Schneider. 2011. Unlocking the Gate: What We
Know About Improving Developmental Education. New York: Manpower Demonstration Research Corporation.
Steinerman, Andrew, Jeffrey Volshteyn, and Molly McGarrett. 2011. Education Services Data Book. September. J.P. Morgan, North American Equity Research, Business and Education Services.
Turner, Sarah E. 2006. “For-Profi t Colleges in the Context of the Market for Higher Education.” In Earnings from Learning: The Rise of For-Profi t Universities, edited by D. Breneman, B. Pusser, and S. Turner, 51–68. Albany: State University of New York Press.
U.S. Department of Education. 2011a. 2011–2 Federal Student Aid Handbook, Vol. 2, School Eligibility and Operations. http://ifap.ed.gov/fsahandbook/1112FSAHbkVo2.html.
U.S. Department of Education. 2011b. “Addi-tional Background on the Gainful Employment Regulations.” Go to: http://www.ed.gov/news/press-releases/gainful-employment-regulations, click on “Supplemental Information.”
U.S. Department of Education, Federal Student Aid Data Center. 2011. Proprietary School 90/10 Revenue Percentages, Report for 2009–2010 Award Year. Available at http://federalstudentaid.ed.gov/datacenter/proprietary.html.
U.S. Department of Education, National Center for Education Statistics (NCES). 2010. Digest of Education Statistics: 2010. http://nces.ed.gov/programs/digest/.
U.S. Department of Education. National Center for Education Statistics (NCES). 2011. The Condition of Education 2011. http://nces.ed.gov/programs/coe/.
U.S. Department of Education, National Center for Education Statistics (NCES), Integrated Post-secondary Education Data System (IPEDS). 2009. IPEDS Fall 2009 Compendium Tables. http://nces.ed.gov/das/library/tables_listings/fall2009.asp.
U.S. Government Accountability Offi ce. 2010. “For-Profi t Colleges: Undercover Testing Finds Colleges Encouraged Fraud and Engaged in Deceptive and Questionable Marketing Practices.” GAO-10-948T, August 4. http://www.gao.gov/products/GAO-10-948T.
Watkins, Barbara L. 1991. “A Quite Radical Idea: The Invention and Elaboration of Collegiate Correspondence Study.” In The Foundations of American Distance Education: A Century of Collegiate Correspondence Study, edited by Barbara L. Watkins and Stephen J. Wright, 1–35. Dubuque, IA: Kendall/Hunt.
Winston, Gordon C. 1999. “For-Profi t Higher Education: Godzilla or Chicken Little?” Change 31(1): 12–19.

164 Journal of Economic Perspectives
Appendix Data, Methods, and Additional Background
IPEDS and student financial aid
We have constructed a consistent institution-year panel data set using the 2000 to 2009 micro data from the Integrated Postsecondary Education Data System (IPEDS) collected and maintained by the National Center for Education Statistics of the U.S. Department of Education. We use the IPEDS data on enrollments (fall, 12 month, and full-time equivalent), degrees and awards, tuition, revenues and expenditures, and other institutional characteristics. The IPEDS data are available from and documented at http://nces.ed.gov/ipeds/.
We match the IPEDS data to institution-level data on Pell grants, student loans volumes and cohort default rates from the National Student Loan Data System (NSLDS). For the financial data, see: http://federalstudentaid.ed.gov/datacenter/index.html.
Student loan volumes by institution come from the Direct Loan program (where the federal government gives loans directly to students) and the Federal Family Education Loan (FFEL) Program, and includes both subsidized (where the government pays interest while students are still enrolled in school) and unsubsidized loan programs. Under FFELP, private lenders provided capital for loans that were subsidized and guaranteed against default by the federal government. The FFEL program was terminated in 2009.
Institutions in IPEDS are assigned a unique “unitid” that is constant across years. Unitids are assigned to physical branches of an institution, and a single school will have one unitid for each branch. However, each school is also assigned an Office of Postsecondary Education ID (known as “opeid”) that is constant across branches. The NSLDS data are linked to the opeid and are not broken out separately by branch. For example, IPEDS has enrollment and degree information separated by campus branch (i.e., by unitid), but information from NSLDS on student loan and Pell grant volumes is only available for the overall institution (i.e., the opeid).
Match rate between IPEDS and NSLDS
We are able to match about 94 percent of the unitids in IPEDS to an opeid from NSLDS. Around 67 percent of the schools are classified in IPEDS as for-profit institutions. The unmatched 6 percent of schools (722 of 11,889) contain 1.4 percent of total enrollment in 2009 and less in earlier years.
We were unable to match about 5.6 percent of the opeids in NSLDS to any IPEDS unitid. About 61 percent (405 of 661) of those institutions were classified by NSLDS as “proprietary” schools, or for-profits. Schools without unitids are about 1 percent of subsidized and
Nimble Critters or Predators? 2/17/2012
-1-
Nimble Critters or Predators? 2/17/2012
-2-
unsubsidized loan volumes in 2009 and about 2.4 percent of Pell Grants. Among proprietary schools, those that were not successfully matched to IPEDS represent less than 1 percent of loans and about 1 percent of Pell grants.
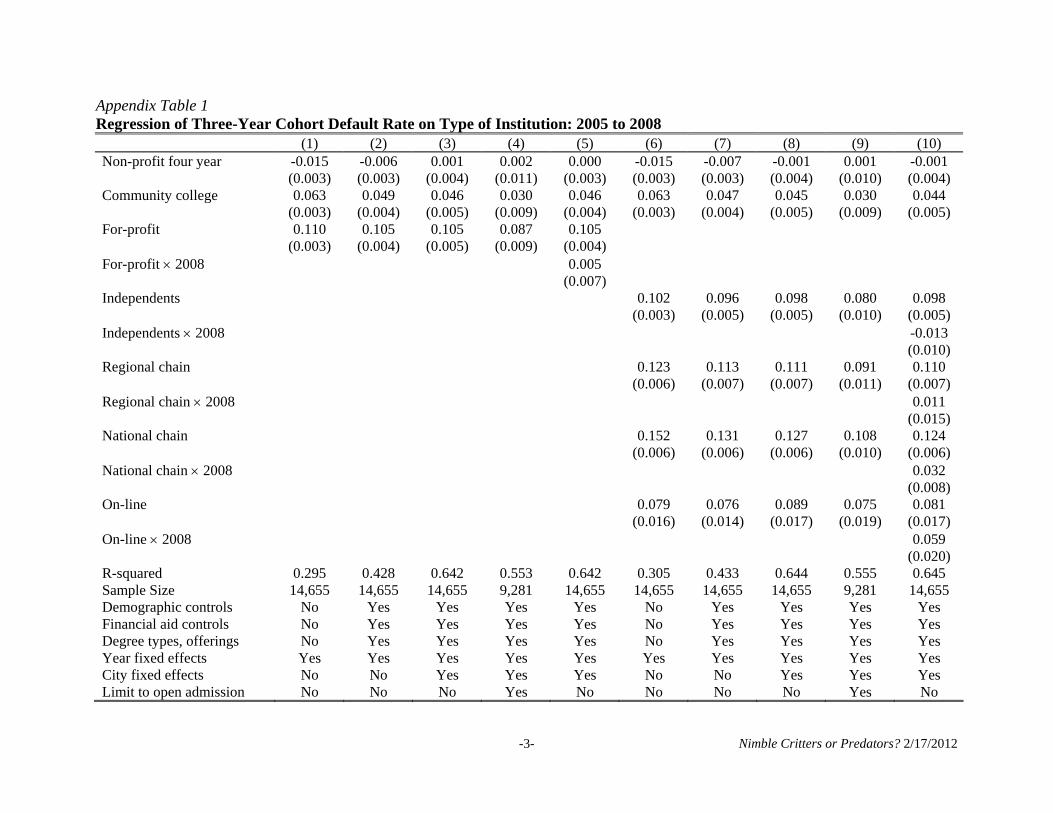
Appendix Table 1 Regression of Three-Year Cohort Default Rate on Type of Institution: 2005 to 2008 (1) (2) (3) (4) (5) (6) (7) (8) (9) (10) Non-profit four year -0.015 -0.006 0.001 0.002 0.000 -0.015 -0.007 -0.001 0.001 -0.001 (0.003) (0.003) (0.004) (0.011) (0.003) (0.003) (0.003) (0.004) (0.010) (0.004) Community college 0.063 0.049 0.046 0.030 0.046 0.063 0.047 0.045 0.030 0.044 (0.003) (0.004) (0.005) (0.009) (0.004) (0.003) (0.004) (0.005) (0.009) (0.005) For-profit 0.110 0.105 0.105 0.087 0.105 (0.003) (0.004) (0.005) (0.009) (0.004) For-profit 2008 0.005 (0.007) Independents 0.102 0.096 0.098 0.080 0.098 (0.003) (0.005) (0.005) (0.010) (0.005) Independents 2008 -0.013 (0.010) Regional chain 0.123 0.113 0.111 0.091 0.110 (0.006) (0.007) (0.007) (0.011) (0.007) Regional chain 2008 0.011 (0.015) National chain 0.152 0.131 0.127 0.108 0.124 (0.006) (0.006) (0.006) (0.010) (0.006) National chain 2008 0.032 (0.008) On-line 0.079 0.076 0.089 0.075 0.081 (0.016) (0.014) (0.017) (0.019) (0.017) On-line 2008 0.059 (0.020) R-squared 0.295 0.428 0.642 0.553 0.642 0.305 0.433 0.644 0.555 0.645 Sample Size 14,655 14,655 14,655 9,281 14,655 14,655 14,655 14,655 9,281 14,655 Demographic controls No Yes Yes Yes Yes No Yes Yes Yes Yes Financial aid controls No Yes Yes Yes Yes No Yes Yes Yes Yes Degree types, offerings No Yes Yes Yes Yes No Yes Yes Yes Yes Year fixed effects Yes Yes Yes Yes Yes Yes Yes Yes Yes Yes City fixed effects No No Yes Yes Yes No No Yes Yes Yes Limit to open admission No No No Yes No No No No Yes No
Nimble Critters or Predators? 2/17/2012
-3-

Nimble Critters or Predators? 2/17/2012
-4-
Source: National Student Loan Data System and IPEDS. Notes: The dependent variable is the three-year cohort default rate for an institution-year observation. The sample covers institution-year observations for the fiscal years 2005 to 2008. “Independents” are for-profit schools that operate in only one state and have no more than five branches. A “regional chain” is a for-profit institution that operates in more than one state, or has more than five campus branches within a single state, but operates in no more than two census divisions. A “national chain” is a for-profit institution that operates in at least three separate census divisions. A for-profit institution is “online” if it either has the word “online” in the school’s name, or if no more than 33 percent of its students come from any single U.S. state. Demographic controls are fractions part-time, 25 years and over, female, African American, and Hispanic. Financial aid controls are the number of recipients of Pell grants and subsidized and unsubsidized federal loans, total yearly disbursement amounts for each, and total loans and Pell grants per enrollee. Degree types and offerings are indicators for distance education, remedial course offerings, whether the institution offers assistance with job placement, whether it offers part-time employment services for enrolled students, the highest award or degree offered by the institution, and whether it has open admissions. Standard errors are clustered by institution and are in parentheses. Omitted category is four-year public.
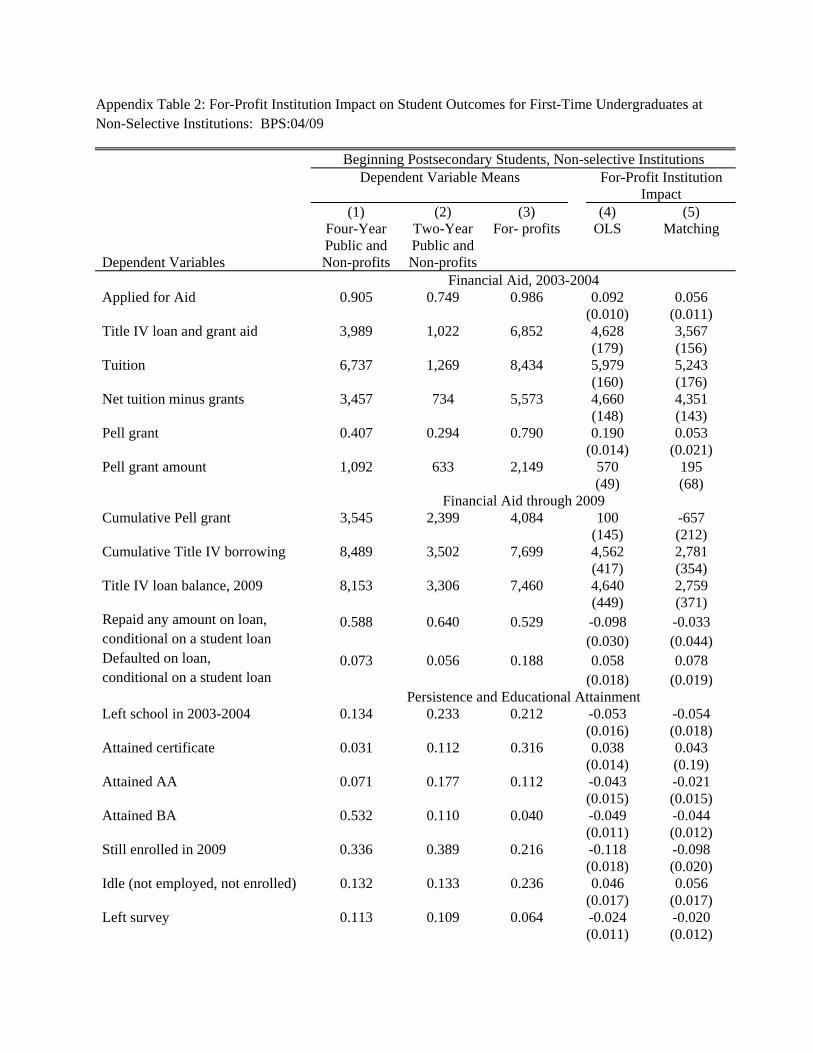
Appendix Table 2: For-Profit Institution Impact on Student Outcomes for First-Time Undergraduates at Non-Selective Institutions: BPS:04/09
Beginning Postsecondary Students, Non-selective Institutions
Dependent Variable Means For-Profit Institution
Impact
Dependent Variables
(1) Four-Year Public and Non-profits
(2) Two-Year Public and Non-profits
(3) For- profits
(4) OLS
(5) Matching
Financial Aid, 2003-2004 Applied for Aid 0.905 0.749 0.986 0.092 0.056 (0.010) (0.011) Title IV loan and grant aid 3,989 1,022 6,852 4,628 3,567 (179) (156) Tuition 6,737 1,269 8,434 5,979 5,243 (160) (176) Net tuition minus grants 3,457 734 5,573 4,660 4,351 (148) (143) Pell grant 0.407 0.294 0.790 0.190 0.053 (0.014) (0.021) Pell grant amount 1,092 633 2,149 570 195 (49) (68) Financial Aid through 2009 Cumulative Pell grant 3,545 2,399 4,084 100 -657 (145) (212) Cumulative Title IV borrowing 8,489 3,502 7,699 4,562 2,781 (417) (354) Title IV loan balance, 2009 8,153 3,306 7,460 4,640 2,759 (449) (371) Repaid any amount on loan, 0.588 0.640 0.529 -0.098 -0.033 conditional on a student loan (0.030) (0.044) Defaulted on loan, 0.073 0.056 0.188 0.058 0.078 conditional on a student loan (0.018) (0.019) Persistence and Educational Attainment Left school in 2003-2004 0.134 0.233 0.212 -0.053 -0.054 (0.016) (0.018) Attained certificate 0.031 0.112 0.316 0.038 0.043 (0.014) (0.19) Attained AA 0.071 0.177 0.112 -0.043 -0.021 (0.015) (0.015) Attained BA 0.532 0.110 0.040 -0.049 -0.044 (0.011) (0.012) Still enrolled in 2009 0.336 0.389 0.216 -0.118 -0.098 (0.018) (0.020) Idle (not employed, not enrolled) 0.132 0.133 0.236 0.046 0.056 (0.017) (0.017) Left survey 0.113 0.109 0.064 -0.024 -0.020 (0.011) (0.012)
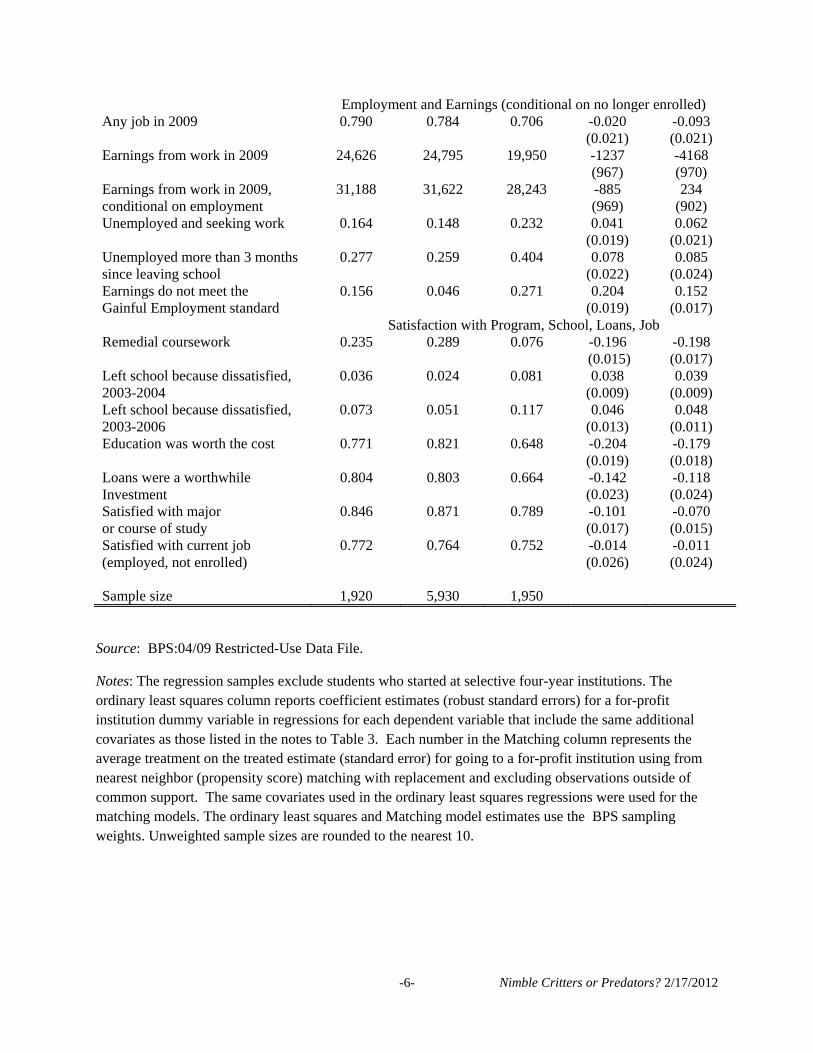
Employment and Earnings (conditional on no longer enrolled) Any job in 2009 0.790 0.784 0.706 -0.020 -0.093 (0.021) (0.021) Earnings from work in 2009 24,626 24,795 19,950 -1237 -4168 (967) (970) Earnings from work in 2009, 31,188 31,622 28,243 -885 234 conditional on employment (969) (902) Unemployed and seeking work 0.164 0.148 0.232 0.041 0.062 (0.019) (0.021) Unemployed more than 3 months 0.277 0.259 0.404 0.078 0.085 since leaving school (0.022) (0.024) Earnings do not meet the 0.156 0.046 0.271 0.204 0.152 Gainful Employment standard (0.019) (0.017) Satisfaction with Program, School, Loans, Job Remedial coursework 0.235 0.289 0.076 -0.196 -0.198 (0.015) (0.017) Left school because dissatisfied, 0.036 0.024 0.081 0.038 0.039 2003-2004 (0.009) (0.009) Left school because dissatisfied, 0.073 0.051 0.117 0.046 0.048 2003-2006 (0.013) (0.011) Education was worth the cost 0.771 0.821 0.648 -0.204 -0.179 (0.019) (0.018) Loans were a worthwhile 0.804 0.803 0.664 -0.142 -0.118 Investment (0.023) (0.024) Satisfied with major 0.846 0.871 0.789 -0.101 -0.070 or course of study (0.017) (0.015) Satisfied with current job 0.772 0.764 0.752 -0.014 -0.011 (employed, not enrolled) (0.026) (0.024) Sample size 1,920 5,930 1,950
Source: BPS:04/09 Restricted-Use Data File.
Notes: The regression samples exclude students who started at selective four-year institutions. The ordinary least squares column reports coefficient estimates (robust standard errors) for a for-profit institution dummy variable in regressions for each dependent variable that include the same additional covariates as those listed in the notes to Table 3. Each number in the Matching column represents the average treatment on the treated estimate (standard error) for going to a for-profit institution using from nearest neighbor (propensity score) matching with replacement and excluding observations outside of common support. The same covariates used in the ordinary least squares regressions were used for the matching models. The ordinary least squares and Matching model estimates use the BPS sampling weights. Unweighted sample sizes are rounded to the nearest 10.
Nimble Critters or Predators? 2/17/2012
-6-
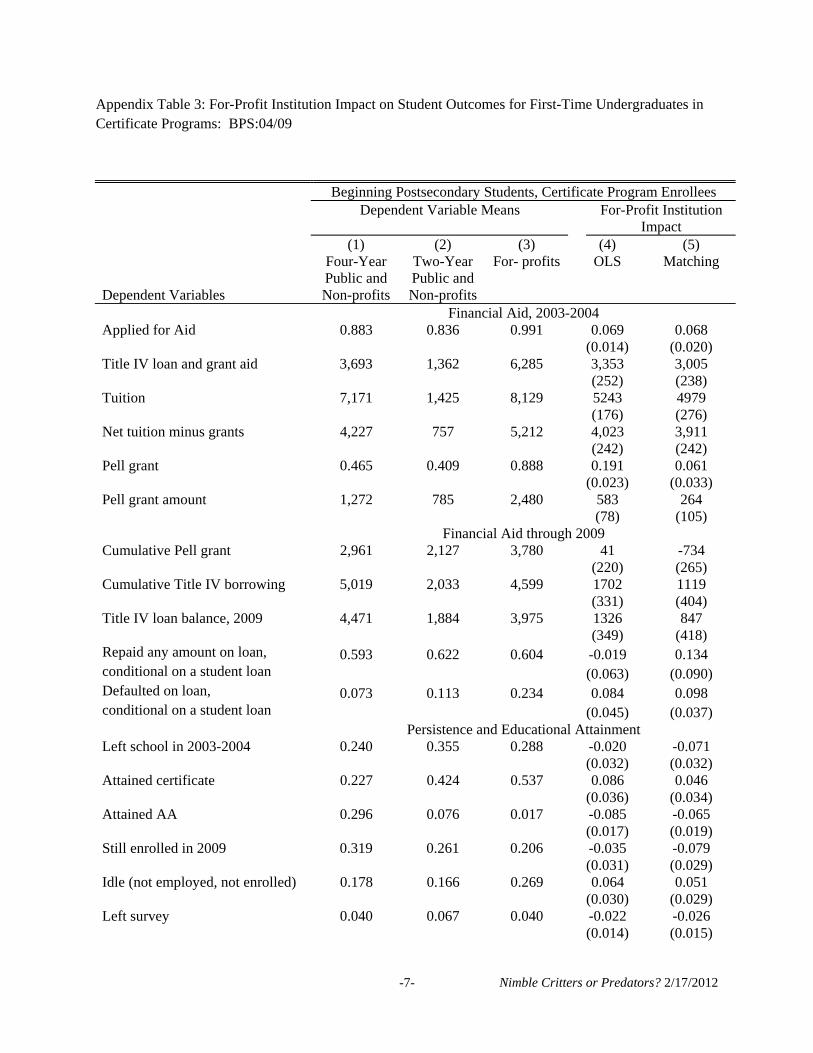
Appendix Table 3: For-Profit Institution Impact on Student Outcomes for First-Time Undergraduates in Certificate Programs: BPS:04/09
Beginning Postsecondary Students, Certificate Program Enrollees
Dependent Variable Means For-Profit Institution
Impact
Dependent Variables
(1) Four-Year Public and Non-profits
(2) Two-Year Public and Non-profits
(3) For- profits
(4) OLS
(5) Matching
Financial Aid, 2003-2004 Applied for Aid 0.883 0.836 0.991 0.069 0.068 (0.014) (0.020) Title IV loan and grant aid 3,693 1,362 6,285 3,353 3,005 (252) (238) Tuition 7,171 1,425 8,129 5243 4979 (176) (276) Net tuition minus grants 4,227 757 5,212 4,023 3,911 (242) (242) Pell grant 0.465 0.409 0.888 0.191 0.061 (0.023) (0.033) Pell grant amount 1,272 785 2,480 583 264 (78) (105) Financial Aid through 2009 Cumulative Pell grant 2,961 2,127 3,780 41 -734 (220) (265) Cumulative Title IV borrowing 5,019 2,033 4,599 1702 1119 (331) (404) Title IV loan balance, 2009 4,471 1,884 3,975 1326 847 (349) (418) Repaid any amount on loan, 0.593 0.622 0.604 -0.019 0.134 conditional on a student loan (0.063) (0.090) Defaulted on loan, 0.073 0.113 0.234 0.084 0.098 conditional on a student loan (0.045) (0.037) Persistence and Educational Attainment Left school in 2003-2004 0.240 0.355 0.288 -0.020 -0.071 (0.032) (0.032) Attained certificate 0.227 0.424 0.537 0.086 0.046 (0.036) (0.034) Attained AA 0.296 0.076 0.017 -0.085 -0.065 (0.017) (0.019) Still enrolled in 2009 0.319 0.261 0.206 -0.035 -0.079 (0.031) (0.029) Idle (not employed, not enrolled) 0.178 0.166 0.269 0.064 0.051 (0.030) (0.029) Left survey 0.040 0.067 0.040 -0.022 -0.026 (0.014) (0.015)
Nimble Critters or Predators? 2/17/2012
-7-
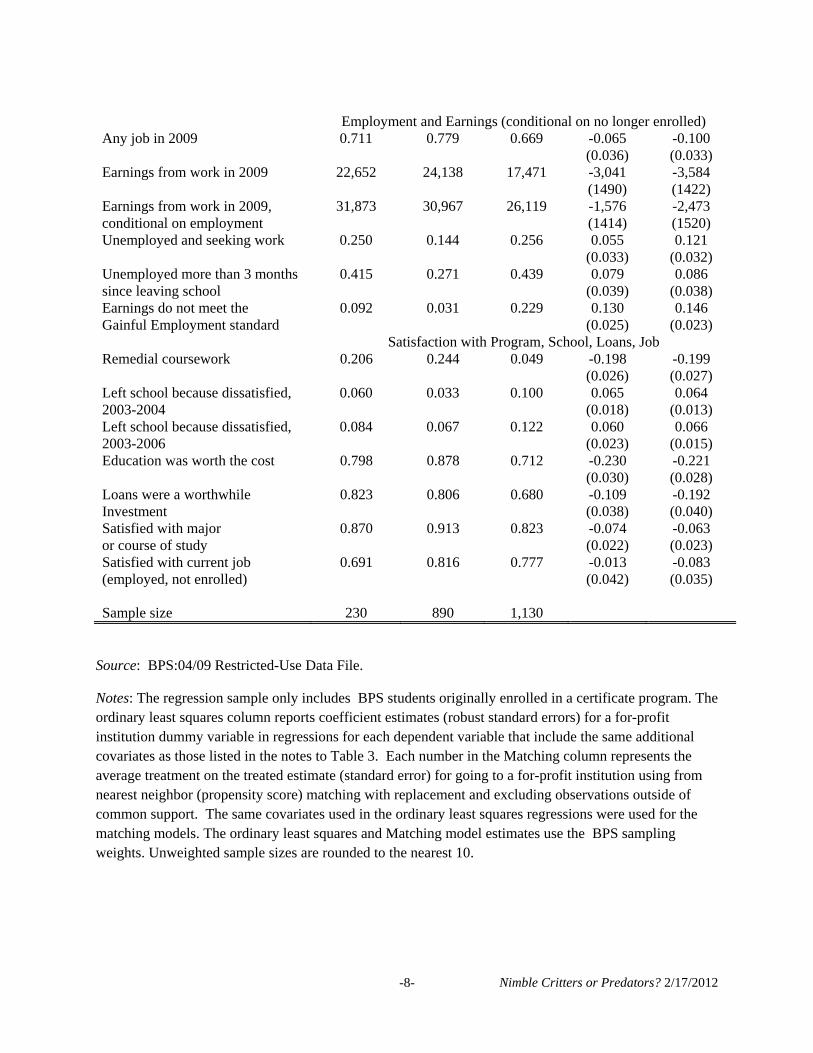
Employment and Earnings (conditional on no longer enrolled) Any job in 2009 0.711 0.779 0.669 -0.065 -0.100 (0.036) (0.033) Earnings from work in 2009 22,652 24,138 17,471 -3,041 -3,584 (1490) (1422) Earnings from work in 2009, 31,873 30,967 26,119 -1,576 -2,473 conditional on employment (1414) (1520) Unemployed and seeking work 0.250 0.144 0.256 0.055 0.121 (0.033) (0.032) Unemployed more than 3 months 0.415 0.271 0.439 0.079 0.086 since leaving school (0.039) (0.038) Earnings do not meet the 0.092 0.031 0.229 0.130 0.146 Gainful Employment standard (0.025) (0.023) Satisfaction with Program, School, Loans, Job Remedial coursework 0.206 0.244 0.049 -0.198 -0.199 (0.026) (0.027) Left school because dissatisfied, 0.060 0.033 0.100 0.065 0.064 2003-2004 (0.018) (0.013) Left school because dissatisfied, 0.084 0.067 0.122 0.060 0.066 2003-2006 (0.023) (0.015) Education was worth the cost 0.798 0.878 0.712 -0.230 -0.221 (0.030) (0.028) Loans were a worthwhile 0.823 0.806 0.680 -0.109 -0.192 Investment (0.038) (0.040) Satisfied with major 0.870 0.913 0.823 -0.074 -0.063 or course of study (0.022) (0.023) Satisfied with current job 0.691 0.816 0.777 -0.013 -0.083 (employed, not enrolled) (0.042) (0.035) Sample size 230 890 1,130
Source: BPS:04/09 Restricted-Use Data File.
Notes: The regression sample only includes BPS students originally enrolled in a certificate program. The ordinary least squares column reports coefficient estimates (robust standard errors) for a for-profit institution dummy variable in regressions for each dependent variable that include the same additional covariates as those listed in the notes to Table 3. Each number in the Matching column represents the average treatment on the treated estimate (standard error) for going to a for-profit institution using from nearest neighbor (propensity score) matching with replacement and excluding observations outside of common support. The same covariates used in the ordinary least squares regressions were used for the matching models. The ordinary least squares and Matching model estimates use the BPS sampling weights. Unweighted sample sizes are rounded to the nearest 10.
Nimble Critters or Predators? 2/17/2012
-8-
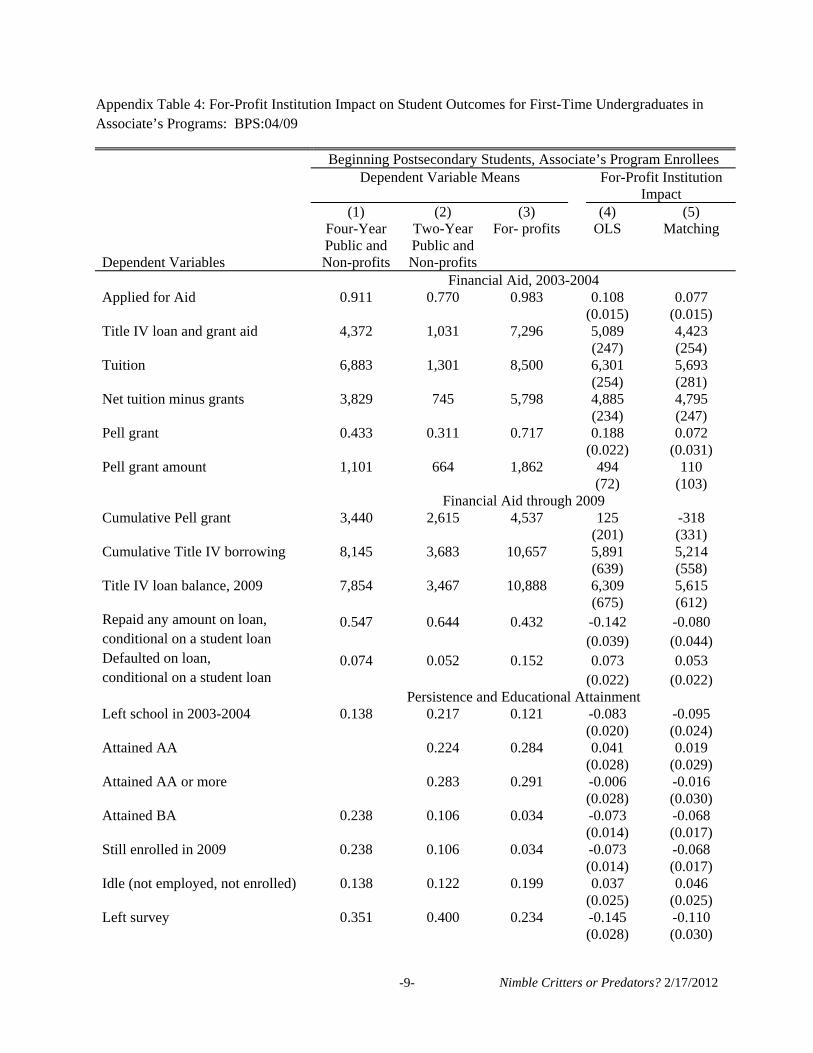
Appendix Table 4: For-Profit Institution Impact on Student Outcomes for First-Time Undergraduates in Associate’s Programs: BPS:04/09
Beginning Postsecondary Students, Associate’s Program Enrollees
Dependent Variable Means For-Profit Institution
Impact
Dependent Variables
(1) Four-Year Public and Non-profits
(2) Two-Year Public and Non-profits
(3) For- profits
(4) OLS
(5) Matching
Financial Aid, 2003-2004 Applied for Aid 0.911 0.770 0.983 0.108 0.077 (0.015) (0.015) Title IV loan and grant aid 4,372 1,031 7,296 5,089 4,423 (247) (254) Tuition 6,883 1,301 8,500 6,301 5,693 (254) (281) Net tuition minus grants 3,829 745 5,798 4,885 4,795 (234) (247) Pell grant 0.433 0.311 0.717 0.188 0.072 (0.022) (0.031) Pell grant amount 1,101 664 1,862 494 110 (72) (103) Financial Aid through 2009 Cumulative Pell grant 3,440 2,615 4,537 125 -318 (201) (331) Cumulative Title IV borrowing 8,145 3,683 10,657 5,891 5,214 (639) (558) Title IV loan balance, 2009 7,854 3,467 10,888 6,309 5,615 (675) (612) Repaid any amount on loan, 0.547 0.644 0.432 -0.142 -0.080 conditional on a student loan (0.039) (0.044) Defaulted on loan, 0.074 0.052 0.152 0.073 0.053 conditional on a student loan (0.022) (0.022) Persistence and Educational Attainment Left school in 2003-2004 0.138 0.217 0.121 -0.083 -0.095 (0.020) (0.024) Attained AA 0.224 0.284 0.041 0.019 (0.028) (0.029) Attained AA or more 0.283 0.291 -0.006 -0.016 (0.028) (0.030) Attained BA 0.238 0.106 0.034 -0.073 -0.068 (0.014) (0.017) Still enrolled in 2009 0.238 0.106 0.034 -0.073 -0.068 (0.014) (0.017) Idle (not employed, not enrolled) 0.138 0.122 0.199 0.037 0.046 (0.025) (0.025) Left survey 0.351 0.400 0.234 -0.145 -0.110 (0.028) (0.030)
Nimble Critters or Predators? 2/17/2012
-9-
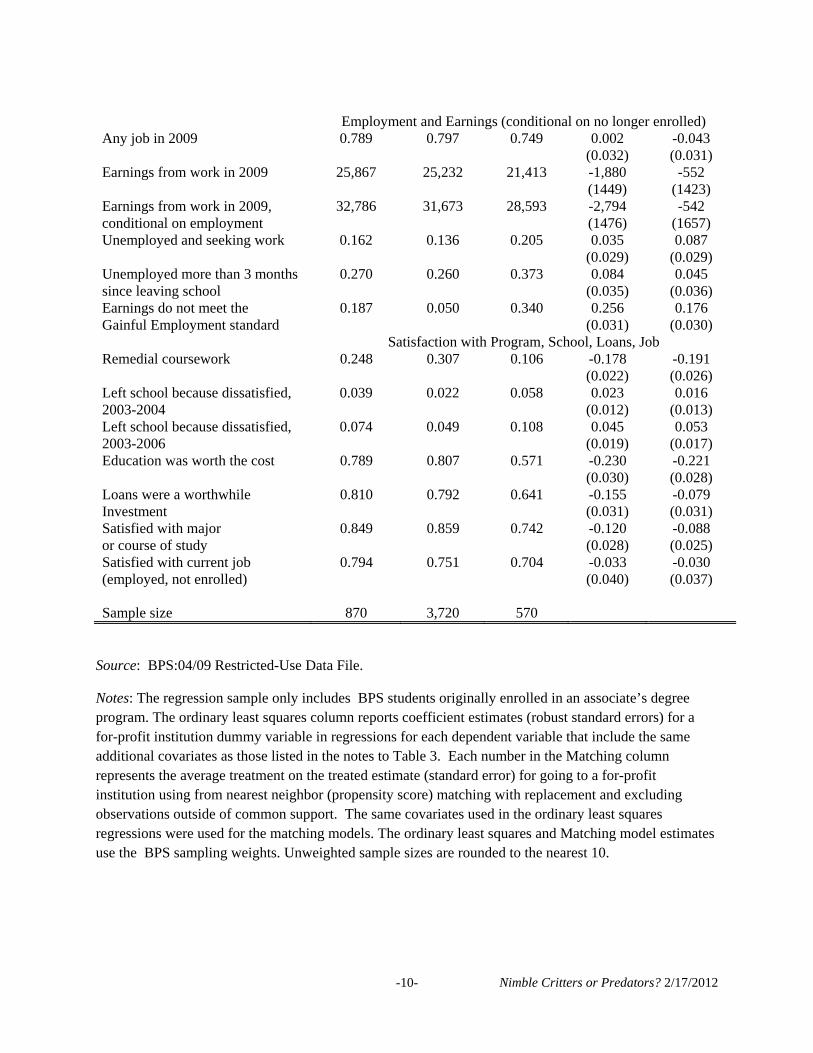
Employment and Earnings (conditional on no longer enrolled) Any job in 2009 0.789 0.797 0.749 0.002 -0.043 (0.032) (0.031) Earnings from work in 2009 25,867 25,232 21,413 -1,880 -552 (1449) (1423) Earnings from work in 2009, 32,786 31,673 28,593 -2,794 -542 conditional on employment (1476) (1657) Unemployed and seeking work 0.162 0.136 0.205 0.035 0.087 (0.029) (0.029) Unemployed more than 3 months 0.270 0.260 0.373 0.084 0.045 since leaving school (0.035) (0.036) Earnings do not meet the 0.187 0.050 0.340 0.256 0.176 Gainful Employment standard (0.031) (0.030) Satisfaction with Program, School, Loans, Job Remedial coursework 0.248 0.307 0.106 -0.178 -0.191 (0.022) (0.026) Left school because dissatisfied, 0.039 0.022 0.058 0.023 0.016 2003-2004 (0.012) (0.013) Left school because dissatisfied, 0.074 0.049 0.108 0.045 0.053 2003-2006 (0.019) (0.017) Education was worth the cost 0.789 0.807 0.571 -0.230 -0.221 (0.030) (0.028) Loans were a worthwhile 0.810 0.792 0.641 -0.155 -0.079 Investment (0.031) (0.031) Satisfied with major 0.849 0.859 0.742 -0.120 -0.088 or course of study (0.028) (0.025) Satisfied with current job 0.794 0.751 0.704 -0.033 -0.030 (employed, not enrolled) (0.040) (0.037) Sample size 870 3,720 570
Source: BPS:04/09 Restricted-Use Data File.
Notes: The regression sample only includes BPS students originally enrolled in an associate’s degree program. The ordinary least squares column reports coefficient estimates (robust standard errors) for a for-profit institution dummy variable in regressions for each dependent variable that include the same additional covariates as those listed in the notes to Table 3. Each number in the Matching column represents the average treatment on the treated estimate (standard error) for going to a for-profit institution using from nearest neighbor (propensity score) matching with replacement and excluding observations outside of common support. The same covariates used in the ordinary least squares regressions were used for the matching models. The ordinary least squares and Matching model estimates use the BPS sampling weights. Unweighted sample sizes are rounded to the nearest 10.
Nimble Critters or Predators? 2/17/2012
-10-
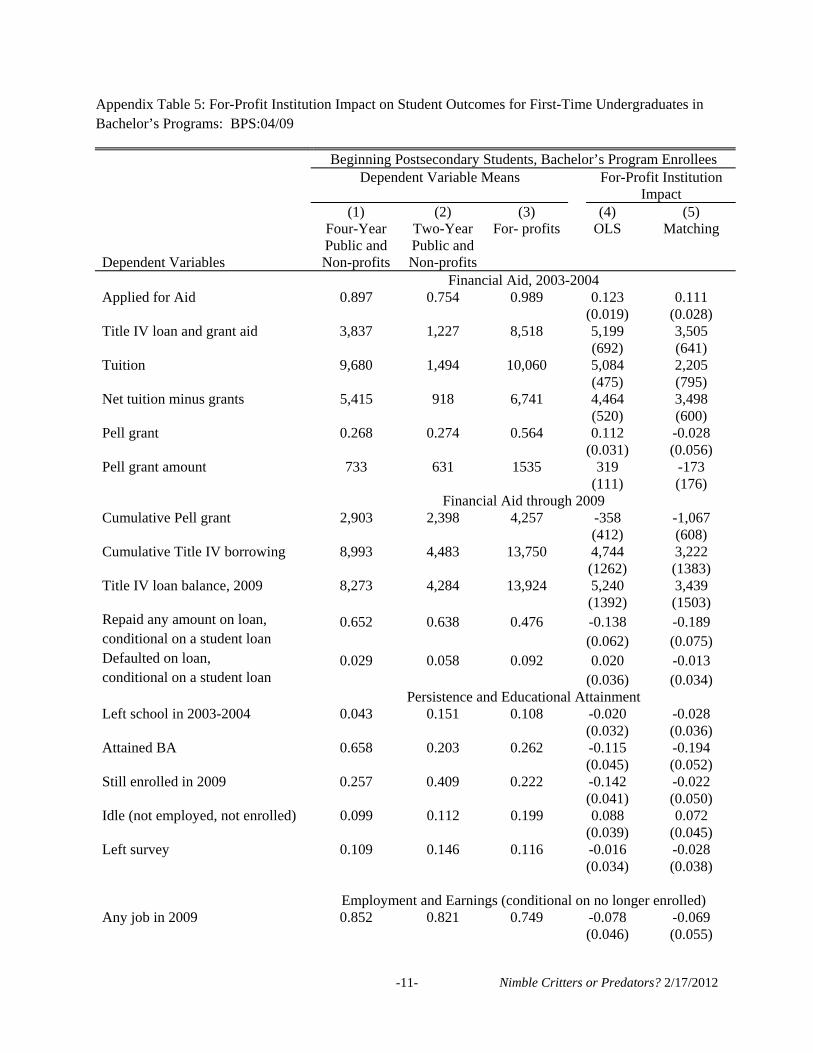
Appendix Table 5: For-Profit Institution Impact on Student Outcomes for First-Time Undergraduates in Bachelor’s Programs: BPS:04/09
Beginning Postsecondary Students, Bachelor’s Program Enrollees
Dependent Variable Means For-Profit Institution
Impact
Dependent Variables
(1) Four-Year Public and Non-profits
(2) Two-Year Public and Non-profits
(3) For- profits
(4) OLS
(5) Matching
Financial Aid, 2003-2004 Applied for Aid 0.897 0.754 0.989 0.123 0.111 (0.019) (0.028) Title IV loan and grant aid 3,837 1,227 8,518 5,199 3,505 (692) (641) Tuition 9,680 1,494 10,060 5,084 2,205 (475) (795) Net tuition minus grants 5,415 918 6,741 4,464 3,498 (520) (600) Pell grant 0.268 0.274 0.564 0.112 -0.028 (0.031) (0.056) Pell grant amount 733 631 1535 319 -173 (111) (176) Financial Aid through 2009 Cumulative Pell grant 2,903 2,398 4,257 -358 -1,067 (412) (608) Cumulative Title IV borrowing 8,993 4,483 13,750 4,744 3,222 (1262) (1383) Title IV loan balance, 2009 8,273 4,284 13,924 5,240 3,439 (1392) (1503) Repaid any amount on loan, 0.652 0.638 0.476 -0.138 -0.189 conditional on a student loan (0.062) (0.075) Defaulted on loan, 0.029 0.058 0.092 0.020 -0.013 conditional on a student loan (0.036) (0.034) Persistence and Educational Attainment Left school in 2003-2004 0.043 0.151 0.108 -0.020 -0.028 (0.032) (0.036) Attained BA 0.658 0.203 0.262 -0.115 -0.194 (0.045) (0.052) Still enrolled in 2009 0.257 0.409 0.222 -0.142 -0.022 (0.041) (0.050) Idle (not employed, not enrolled) 0.099 0.112 0.199 0.088 0.072 (0.039) (0.045) Left survey 0.109 0.146 0.116 -0.016 -0.028 (0.034) (0.038) Employment and Earnings (conditional on no longer enrolled) Any job in 2009 0.852 0.821 0.749 -0.078 -0.069 (0.046) (0.055)
Nimble Critters or Predators? 2/17/2012
-11-
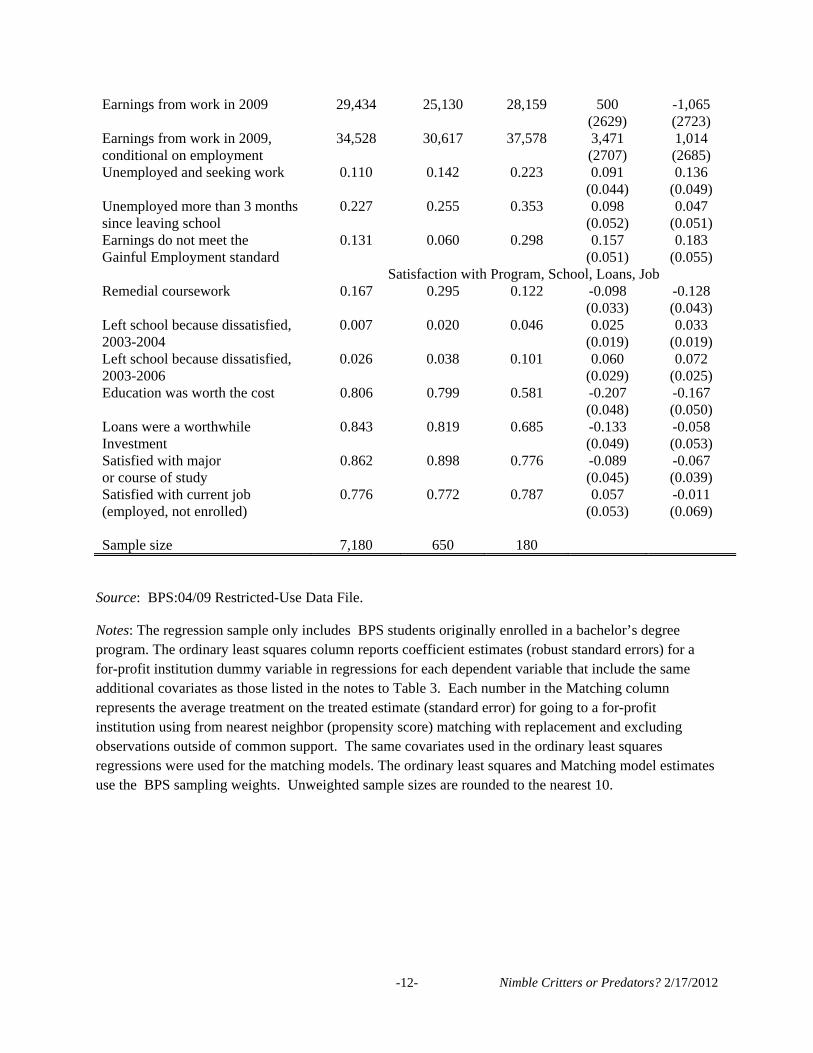
Nimble Critters or Predators? 2/17/2012
-12-
Earnings from work in 2009 29,434 25,130 28,159 500 -1,065 (2629) (2723) Earnings from work in 2009, 34,528 30,617 37,578 3,471 1,014 conditional on employment (2707) (2685) Unemployed and seeking work 0.110 0.142 0.223 0.091 0.136 (0.044) (0.049) Unemployed more than 3 months 0.227 0.255 0.353 0.098 0.047 since leaving school (0.052) (0.051) Earnings do not meet the 0.131 0.060 0.298 0.157 0.183 Gainful Employment standard (0.051) (0.055) Satisfaction with Program, School, Loans, Job Remedial coursework 0.167 0.295 0.122 -0.098 -0.128 (0.033) (0.043) Left school because dissatisfied, 0.007 0.020 0.046 0.025 0.033 2003-2004 (0.019) (0.019) Left school because dissatisfied, 0.026 0.038 0.101 0.060 0.072 2003-2006 (0.029) (0.025) Education was worth the cost 0.806 0.799 0.581 -0.207 -0.167 (0.048) (0.050) Loans were a worthwhile 0.843 0.819 0.685 -0.133 -0.058 Investment (0.049) (0.053) Satisfied with major 0.862 0.898 0.776 -0.089 -0.067 or course of study (0.045) (0.039) Satisfied with current job 0.776 0.772 0.787 0.057 -0.011 (employed, not enrolled) (0.053) (0.069) Sample size 7,180 650 180
Source: BPS:04/09 Restricted-Use Data File.
Notes: The regression sample only includes BPS students originally enrolled in a bachelor’s degree program. The ordinary least squares column reports coefficient estimates (robust standard errors) for a for-profit institution dummy variable in regressions for each dependent variable that include the same additional covariates as those listed in the notes to Table 3. Each number in the Matching column represents the average treatment on the treated estimate (standard error) for going to a for-profit institution using from nearest neighbor (propensity score) matching with replacement and excluding observations outside of common support. The same covariates used in the ordinary least squares regressions were used for the matching models. The ordinary least squares and Matching model estimates use the BPS sampling weights. Unweighted sample sizes are rounded to the nearest 10.