the framework for determining statistical capacity ... · pdf filestatistical capacity...
TRANSCRIPT

PARIS21 Task Team on
Statistical Capacity Building Indicators
Seminar on
The Framework for Statistical Capacity Building Indicators
Statistics Department International Monetary Fund
Washington, D.C. April 29�30, 2002
__________________________________________________
The Framework for Determining Statistical Capacity Building Indicators
Lucie Laliberté, Makiko Harrison, Sarmad Khawaja, Jan Van Tongeren, David Allen, Candida Andrade and Beverley Carlson
The PARIS21 Consortium is a partnership of national, regional, and international statisticians, policymakers, development professionals, and other users of statistics. Launched in November 1999, it is a global forum and network whose purpose is to promote, influence, and facilitate statistical capacity-building activities and the better use of statistics. Its founding organizers are the UN, OECD, World Bank, IMF, and EC. The Task Team on Statistical Capacity Building Indicators is chaired by the IMF. Its main purpose is to identify, validate and test indicators of statistical capacity building.
April 1, 2002
Table of contents Executive Summary.................................................................................................................. 3
A. Introduction...................................................................................................................... 4 Approach of the Task Team.............................................................................................. 4
B. Identifying a Methodology............................................................................................... 5 Requirements for the statistical capacity indicators.......................................................... 5 The IMF Data Quality Assessment Framework (DQAF)................................................. 6
C. Statistical Operations According to the Six-Part DQAF Structure .................................. 7 0. Prerequisites.................................................................................................................. 8 1. Integrity....................................................................................................................... 15 2. Methodological soundness.......................................................................................... 18 3. Accuracy and reliability.............................................................................................. 19 4. Serviceability .............................................................................................................. 23 5. Accessibility................................................................................................................ 26
D. Identifying Statistical Capacity Indicators ..................................................................... 28 E. Strategic Planning of Statistical Activities ..................................................................... 29
Demand management...................................................................................................... 29 Supply management........................................................................................................ 30 Sustainable capacity........................................................................................................ 32
F. Summary......................................................................................................................... 33 Annex 1: Candidates SCB indicators, De Vries and Felligi statistical identifiers/activities presented according to the DQAF structure........................................................................ 34 Annex 2: Illustration of Monitoring of Indicators .............................................................. 50 Selected Reference Documents........................................................................................... 51
- 3 -
EXECUTIVE SUMMARY
The paper explains the strategy adopted in developing the Statistical Capacity Building (SCB) indicators, provides a description of the main characteristics of statistical operations from which the SCB indicators are to be derived (using the structure of the Data Quality Assessment Framework, DQAF, introduced by the IMF), and explores how the results from applying the SCB indicators could be used for strategic planning in building statistical capacity.
The scope of the SCB indicators is set to measure the statistical capacity to meet a goal that is to be determined by countries. As such, the indicators are being designed as tools to be applied to a country�s specific goal: producing specific statistics, or strengthening a data producing agency.
The SCB indicators are viewed as ways to track in a systematic and consistent manner how the capacity evolves in time in meeting the goal. As such, they are not intended as providing for an absolute measure of statistical capacity in terms of levels, but rather as changes through time in the levels of such capacity.
The SCB indicators are intended to provide a self-checking mechanism to be applied by the managers of statistical operations toward meeting goals set, and to be applied at periodic intervals to track changes in meeting the goals in question.
The results from applying the SCB indicators can help countries in planning strategically toward sustainable statistical operations. This entails meeting national needs with the cooperation of both national authorities and external providers.
The paper, which serves as background document for the SCB indicators (to be developed by October 2002), will be discussed at the April 29-30, 2002 Seminar on Statistical Capacity Building Indicators hosted by the IMF for the PARIS21 Task Team on Statistical Capacity Building Indicators.

- 4 -
A. Introduction
1. The mandate of the PARIS21 Task Team on Statistical Capacity Building (SCB) Indicators1 is to develop by October 2002 indicators that will facilitate tracking progress in building statistical capacity.
2. Within the broader context of ongoing initiatives on capacity building for development and poverty reduction, the Task Team focused on statistical capacity building by making extensive use of the results of research efforts and existing practices. It views its role as an effort to gather in a systematic format the characteristics identified in other forums as important to statistical operations, and use them as platform from which to derive the statistical capacity building (SCB) indicators.
3. The SCB indicators could be of special interest to countries2 that
• have major deficiencies in available statistics and require sizeable statistical capacity building and fundamental changes to improve statistical operations; and
• cannot develop their statistical capacity without external assistance because of limited domestic resources.
4. By providing common measuring rods to apprehend the statistical operations in countries, it is also hoped that the results obtained from applying the SCB indicators would help the donor community toward developing a common view of countries� statistical capacity needs. Working toward a more common understanding of countries� current status on statistical requirements could facilitate the communication and coordination among organizations that provide technical assistance, and could help the way toward a more systematic approach to accounting for such assistance.
Approach of the Task Team
5. The Task Team opted for a four-step approach to derive the SCB indicators:
• First, building upon existing literature and experience, identify a frame of reference that provides an overview of statistical operations and is suitable to develop indicators that track progress made toward specific goals; [done]
• Second, on the basis of the frame of reference, describe the statistical operations, validating them though a consultative process with countries, especially those that
1 Set up in May 2001.
2 Such as the Highly Indebted Poor Countries (HPIC), Poverty Reduction Strategy (PRS) countries, and others that require concessional loans and other forms of external assistance.

- 5 -
could make use of the SCB indicators. The objective is to identify potential candidates for SCB indicators; [in process]
• Third, review and validate the candidates for SCB indicators against the indicators used by donors involved in statistical capacity building. The objective is to identify SCB indicators; [in process]
• Fourth, test the indicators in a small sample of countries and fine-tune them accordingly. [to be done]
6. This paper is the result of the activities under the first and second steps, and leading to the third step.
7. Section B briefly explains the rationale for basing the Team�s work on the methodology that underlies the Data Quality Assessment Framework (DQAF) introduced by the IMF (first step). Section C describes the statistical operations using the six-part DQAF structure of prerequisites and dimensions of integrity, methodological soundness, accuracy and reliability, serviceability, and accessibility (second step).3 Section D explains how the SCB indicators will be arrived at from this description (third and fourth steps). Looking beyond the Task Team mandate, section E explores how the SCB results could be used for strategic planning in describing, planning and monitoring the statistical operations. Section F concludes.
8. In preparation toward the third step (identification of SCB indicators), Annex 1 contains a list of potential candidates for SCB indicators that are presented against the characteristics derived from two other approaches that have been used to capture the essence of statistical operations. Annex 2 illustrates how the SCB indicators could be used for describing, planning and monitoring purposes.
B. Identifying a Methodology
Requirements for the statistical capacity indicators
9. The methodology underlying the SCB indicators needed to encompass the diversity in terms of scale and operations of data producing agencies and to provide for the following requirements in terms of the SCB indicators.
10. First, the SCB indicators should cover a sufficiently broad range to apply to a variety of circumstances, in preference to a narrower one that could provide solutions for specific circumstances (e.g., management, infrastructure, training of staff, survey methodology, etc.) but would not be applicable elsewhere. But a more general approach needs to be carefully
3 The paper is to serve as the background document to the April 29-30, 2002, PARIS21 Task Team Seminar hosted by the IMF where some 20 developing countries are being invited as part of the country consultative process.

- 6 -
applied as too wide of a range could create expectations that cannot be fulfilled, given the complexity and length of the statistical capacity building process. Thus the indicators are being designed to address questions such as What facts are relevant to finding solutions? What are the symptoms, and what are the causes? How can an organization take better advantage of its current strengths and make use of its weaknesses?
11. Second, in line with one of the PARIS21 goals�to generate better user-producer dialogue�the SCB indicators should be demand-driven, that is they should be geared toward statistical outputs that meet users� needs. The Task Team did not attempt to identify the statistical products in demand, but rather relied on work conducted in other forums, such as the UN summit meetings by the Friends of the Chair4 and the GDDS where statistical frameworks and products indicative of statistical capacity are identified. Some of the demand aspects of the statistical systems are briefly reviewed in the Strategic Planning (section E).
12. Third, the SCB indicators should be applicable directly to the statistical products themselves, or indirectly to the agencies producing such statistical products. As such, while the SCB indicators can be applied to the full range of operations leading to a specific statistical output, a subset thereof should also be applicable to agencies (central statistical agencies, the statistical units of central banks and line ministries) that produce the statistical outputs in question.
13. Finally, the SCB indicators have to be amenable to some kind of measurement or comparison against best practices. They have to be easy to understand by those inside (staff and managers) and outside (resources providers and users). Recognizing that the exercise is in a pilot phase, at this time the parsimony of indicators can be only a secondary consideration with the SCB indicators initially to comprise more rather than less detailed measures of inputs, activities, outputs, etc. It is hoped that the information overload of too many indicators will gradually be reduced as the most representative indicators of capacity building and its main facets will emerge through usage.
The IMF Data Quality Assessment Framework (DQAF)
14. Since it fulfilled the criteria of being comprehensive, demand-driven, applicable to statistics as well as to data producing agencies, and also amenable to some measurement against best practices, the DQAF methodology was used as the foundation on which to build the work leading to SCB indicators.
15. In a nutshell, the DQAF is designed to assess the characteristics of relevant statistical outputs, systematically reviewing sources, processes, and institutional aspects, using to do so a set of prerequisites (institutional preconditions) and five dimensions (or key characteristics)
4 Report of the Friends of the Chair of the Statistical Commission�An assessment of the statisticalindicators derived from United Nations summit meetings (E/CN.3/2002/26), presented at the 33rd Session of the U.N. Statistical Commission, March 2002.

- 7 -
to conduct the review. The DQAF framework provides a systematic approach to describe the statistical operations.
16. By their very nature, some of the capacity building will be very similar to quality indicators, but there will be aslo differences between the two sets of indicators. For instance, both sets of indicators are likely to be similar for certain aspects, such as legislative arrangements, but to differ in other, such for as resources requirements: a statistical output entirely financed and executed through external financing sources may be of high quality, but may reflect a poor measure of statistical capacity building in terms of domestic expertise and sustainability. (Once the SCB indicators have been identified and applied to a number of situations, a study of their relationship to the DQAF quality indicators could constitute the object of subsequent research).
C. Statistical Operations According to the Six-Part DQAF Structure
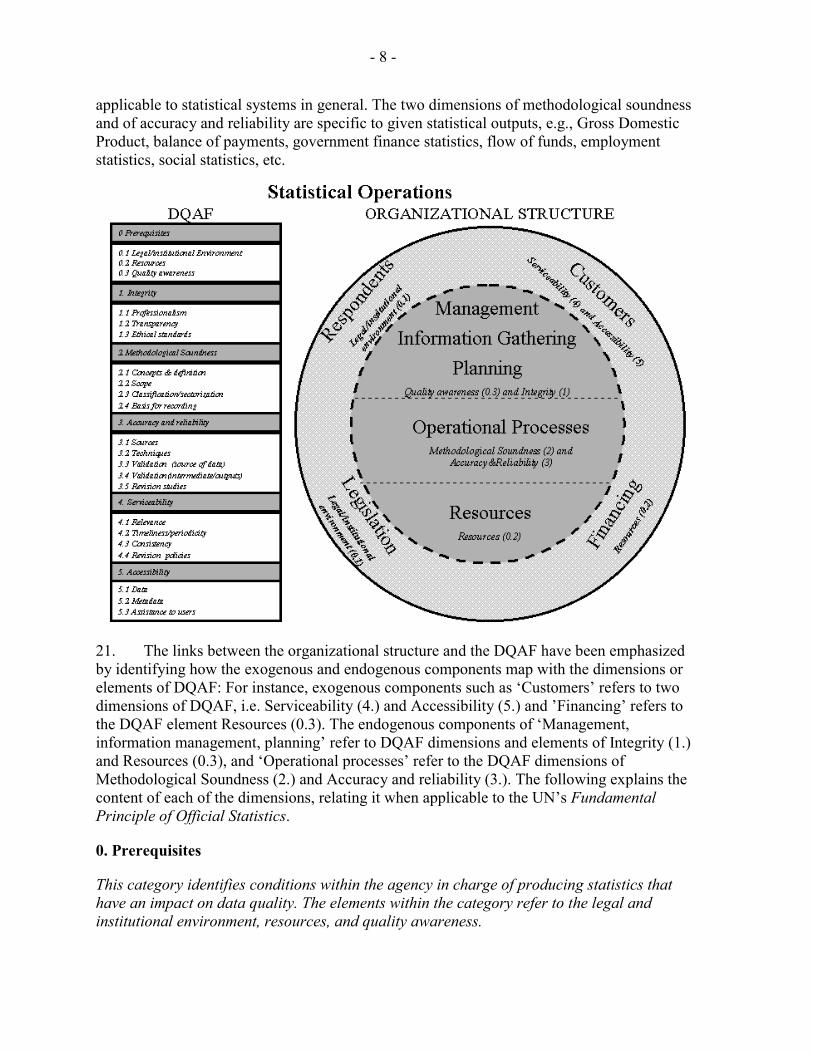
17. Understanding the needs that statistical products are designed to meet, as well as the processes and characteristics of data producing agencies, makes it possible to focus on the essential components of statistical operations. These can be divided into exogenous and endogenous components that shape the operations of data producing agencies. 18. Four major exogenous components are critical: • users of statistical products (customers). • financing (from domestic sources such as budgets, and/or external sources such as
technical assistance from donor organizations). • legislation that gives legitimacy to the statistical operations. • data providers (respondents). Three major endogenous components are at play: • management, which provides overall vision, direction, and planning. • operational processes whereby data sources are transformed into statistical outputs. • the human and other resources that underpin the processes. 19. The essential exogenous and endogenous components are part of an organizational structure, e.g., a unit environment/infrastructure, its inputs, throughputs in terms of processes and policies, and outputs. The diagram below illustrates how the organizational structure (circles on the right hand side) of statistical operations can be related to the DQAF structure (on the left hand side of the diagram).
20. The DQAF is organized in a cascading structure of five levels that progresses from the general to the specific levels. The first level defines the institutional preconditions required for quality and five dimensions of data quality: integrity, methodological soundness, accuracy and reliability, serviceability, and accessibility; these are further subdivided into elements and so on.5 The prerequisites and three of the dimensions are common and 5 Carson and Liuksila, 2001; Carson 2000.
- 8 -
applicable to statistical systems in general. The two dimensions of methodological soundness and of accuracy and reliability are specific to given statistical outputs, e.g., Gross Domestic Product, balance of payments, government finance statistics, flow of funds, employment statistics, social statistics, etc.
21. The links between the organizational structure and the DQAF have been emphasized by identifying how the exogenous and endogenous components map with the dimensions or elements of DQAF: For instance, exogenous components such as �Customers� refers to two dimensions of DQAF, i.e. Serviceability (4.) and Accessibility (5.) and �Financing� refers to the DQAF element Resources (0.3). The endogenous components of �Management, information management, planning� refer to DQAF dimensions and elements of Integrity (1.) and Resources (0.3), and �Operational processes� refer to the DQAF dimensions of Methodological Soundness (2.) and Accuracy and reliability (3.). The following explains the content of each of the dimensions, relating it when applicable to the UN�s Fundamental Principle of Official Statistics.
0. Prerequisites
This category identifies conditions within the agency in charge of producing statistics that have an impact on data quality. The elements within the category refer to the legal and institutional environment, resources, and quality awareness.
- 9 -
0.1 Legal and institutional environment
22. According to the UN principle 7 for official statistics, what is expected from the statistical system, the position of data producing agencies, including statutory rights, obligations, and enforcement provisions, should be codified in legislation. Countries have enacted statistical legislations that vary depending on the form of government, the kind of administrative arrangements in force, and legislative and administrative conventions. The following reviews the various areas generally covered by laws, regulations, or conventions.
• Largely as a result of history and administrative tradition, there may be various agencies involved in the statistical system (e.g., central statistical agency, central bank, and line ministries). The legal framework and protocols of a country should specify the main players within the statistical system, their mandates, legal enforcement powers, and obligations.
• Assignment of major areas of responsibility and arrangements for coordination of statistical activities among the different agencies (UN principle 12 on official statistics) is clear. While not necessarily required by law, where there is no central agency, arrangements for coordinating statistical activities of government could be devolved to a major data producing agency. On the other hand, the legal framework may allow data producing agencies to enter into agreements to jointly collect and share data, designating the main players, their mandate, and the legal enforcement powers in the statistical system.
• Other aspects of the legislation serve to ensure the integrity of the data, for example, by safeguarding the confidentiality of the information collected and the privacy of suppliers (UN principle 6 of official statistics). Maintaining confidentiality, in particular, precludes the use of individually identifiable information for any administrative, regulatory, or enforcement purposes, except in cases where a respondent has consented to its release. By ensuring appropriate confidentiality, the data producing agency also achieves more credibility with its providers. In surveys and other statistical inquiries, respondents are informed of their rights and obligations with regard to the provision of information, and they are informed that the information they provide will be used for statistical purposes only.
• Statistical legislation often has a compulsory aspect, which authorizes the data producing agencies to collect the relevant data. This helps the statistical legislation to be effective, that is enforceable (through penalties of staff providing confidential data, limiting access to selected staff, limited access to premises by outsiders, establishing data aggregation rules, etc.). Nevertheless, there are major advantages in treating data providers, either survey respondents or administrative ministries, especially those from whom information is regularly required, as partners. Establishing partner relationships (through regular meetings and workshops) entails ensuring that processes are in place to protect confidentiality, manage respondent burden, and
- 10 -
inform providers of the uses to which the data are put. Such partnerships may also include involving users in reviews of data collections and plans for new collections.
• Provisions can also be made for guarantee of independence from political interference through a clear listing of the agencies� functions, and of the nomination of higher level of management. Since the agency is generally dependent on discretionary funds, such independence may be better protected by law, a situation that may be even more critical where the statistical functions are carried out within a ministry. Statistical operations, from the selection of the population to be covered, the survey content, the questionnaire, the processing methods, through to the production and dissemination of the data, should be completely controlled by the data producing agency. The method of appointing and removing the highest level of managers should be transparent, with their role and authority well established, and widely recognized, especially in government circles. (To the extent that it affects professionalism, the independence of the data producing agency is also covered under the dimension Integrity (1.)).
• The data producing agency should have the responsibility and the authority to disseminate the information collected, which implies that the results of data that have been collected are to be published. The agency produces public goods; this means ensuring that the goods are made available to all users at the same time.
• The agency should also take responsibility for meeting major users� needs. A useful starting point can be users� advisory bodies. Such bodies might assist in providing an overview of major data needs and in setting priorities. While this requirement may not be provided under legislation, the data producing agencies should take various steps to ensure they have a good current understanding of major needs and then strive to satisfy those needs to the extent possible.
• The data producing agency has to be held accountable for its operations and activities. While the law may guarantee the independence of statistical operations, it could also require the organization to report on its activities and use of resources. The data producing agency may be required to make annual reports to parliament, or to an independent statistical commission or board. Adequate accounting will assist in costing specific activities, facilitating the planning and budgeting of strategic operations.
0.2 Resources
23. The capacity of a statistical system is determined to a large extent by the level and stability of the resources at its disposal. The resources used, as well as the sources of the financing of such resources, are important determinants of statistical capacity. The resources cover human resources and infrastructure defined here to cover basic infrastructure (buildings, power, etc.), information technology resources (availability of computers, communication network, databases) and other material resources, and they can be financed both domestically and externally. While benchmarking measures are not readily available,

- 11 -
assessment of the adequacy and the efficient use of resources should be carried out through various means. For instance, comparative inter-country measures such as numbers of statistical staff per thousand of population may be useful as a rough guide to the adequacy of funding.
24. An overall approximation of the budgeted financed resources, especially when compared over time, and to other measures, such as to the total statistical budget or to other countries in roughly the same situation, would be very useful in providing an idea of the adequacy of the resources. The share of total resources that are externally financed would help to evaluate the dependency of the system, and would provide some assessment of the efforts required for self-financing. External financing is difficult to measure, especially when it is provided in kind (e.g., technical assistance) and costing from both the statistical organization and the donors may provide a better approximation of the amounts involved.
Staff resources and other resources, and their financing
Staff 25. While the employees constitute by far the largest cost, they also represent the most valuable asset of any data producing agency. This makes it very important to understand how to attract and retain suitable employees and how employees may be encouraged in performing their work. This is heavily dependent on effective management, leadership and vision. The management of the organization must have the flexibility to deploy people according to overall statistical needs, and ideally should have flexibility in allocating funds across the organization. Only the quantifiable aspects of human resources are reviewed here under resources; motivational aspects, professional values, and culture are reviewed later under quality awareness, and also under integrity.
26. The statistical expertise of staff needs to be measured in terms of methodological capacity defined here to cover survey design, questionnaire design, survey operations, familiarity with methodological guidelines, analytical capacity, and the range and volume of dissemination. Such capacity is developed through a mixture of experience and training, which can be measured through quantitative measures such as years of experience, and types of training.
27. The number of staff and the levels of salaries, as measures of statistical capacity, need to be further identified between permanent and temporary staff, and between base salaries and honoraria/subsidies. Temporary staff and honoraria likely result from externally financed operations, e.g., a special one-off survey, and are not as important to statistical capacity as domestically-financed staff, because of the temporary nature of such activities.
28. The qualification and experience of staff largely reflect salary levels (which are often largely outside the control of the higher level of management), and human resources management practices, such as hiring, promoting, firing, rotation, training and career development. For instance, experience may reveal problems of staff retention, such as non-competitive salaries, or too aggressive rotation practices. All efforts should be made to alter

- 12 -
these practices, so that a core contingent of highly trained staff can be retained and maintained through regular recruitment and training.
Other resources 29. Statistical staff should be provided with facilities that enable them to perform their operations and that lead to productivity gains. The basic infrastructure in terms of buildings and other accommodation should be comparable to those used in other government agencies. Computing facilities include the availability, maintenance and updating of information technology infrastructure such as main computers, servers, communication network and personal computers, and of databases such as business and household registers (including access to administrative data sources, vital registration, etc.). The number of software applications and their updates are also measures of statistical capacity, along with the expertise in the use of the computing facilities (acquired through experience and/or formal training). The hardware and software assigned to staff should be commensurate with the task.
30. Another measure of adequate facilities is the share of funding allocated to capital investment as important aspect of sustainability. Since available facilities result not only from current past expenditures (financed either through national or external sources), a more representative picture of capacity would be provided by a physical inventory, such as the number of workstations and servers in operation, as well as an inventory of software. Account also needs to be taken of levels of computer expertise (both operators and computer support staff) and telecommunication and network equipment.
31. Other resources to perform statistical operations will include transportation and communication systems equipment, inclusive of operational support, printing equipment and material, office supplies and sundries, and other aspects of the office environment. The measurement of such resources may involve a mixture of physical and monetary measurements. This may be difficult to measure but rough approximations can be made.
32. Finally, if the objective is to strengthen the statistical capacity of a data producing agency, crude measures of volume activities can be monitored. The following could give rough measures of survey activities: number of surveys conducted in a year (broken down by household and business surveyed units) and by frequency; new or substantially redesigned questionnaires. The number of staff could provide rough measures along with person-days of development and training investment in human resources by. Statistical outputs could be measured by timeliness, number of publications and press releases over the last year. While these are very rough measures of activities that do not link inputs to outputs (efficiency), they shed light on critical mass of general statistical expertise.
Financing of statistical activities
33. The capacity of the statistical system, its flexibility and independence, are determined to a large extent by the level and stability of its sources of financing which, in turn, depends partly on the organization�s ability to demonstrate wise and careful management of existing funds through various means.
- 13 -
34. Access to regular funding is a major factor in providing some guarantees of continuity that is so vital to statistical operations. Such continuity is generally assumed when statistics are viewed as public goods and, as such, are largely financed from the government budget. Continuity is also supported when forward plans are made to allocate budgetary resources to future statistical development based upon identified statistical needs for compiling the statistical series. Continuity is not necessarily guaranteed when a significant proportion of financing comes from external sources, which is often the case for countries that are in greater need of continuity for developing, monitoring and disseminating statistical information.
35. External financing is challenging on at least two counts: it needs to be balanced with other forms of budgetary funding, and it often entails needs that compete with the national ones. For instance, external financing may be provided for specific surveys, whose timing and coverage may not correspond to domestic policy requirements, and/or which would need to be conducted at shorter and more regular intervals to be truly useful. In the longer run, improvements to data for national policy decisions should tend to be largely financed nationally to ensure continuity and sustainability, and external financing should be mainly used for technical assistance in capacity building (such as strengthening the human resource), to conduct large survey or census, or to conduct specialized studies that are part of a national statistical development plans.
36. When a critical statistical mass of statistical activities has been established, budget-based financing is the preferred way to achieve and maintain sustainability. This can only be achieved if the capacity building provided by external financing assists some form of evidence-based policy as a basis for good governance and public administration. Such strategies are essential if external financing is to be gradually replaced with national governmental financial support.
Efficient use of resources
37. Processes and procedures are in place to ensure that resources are used efficiently. These would include the following. Managers in the data producing agency promote a vision and a direction that are shared with the staff. Efficiencies are sought e. g., by encouraging consistency in concepts and methodologies across the different units within the data producing agency. Data compilation procedures are managed to minimize processing errors such as coding, editing, and tabulation errors. Internal processes exist within the data producing agency to measure resources used to compile the statistical series and to compare the resource usage of the statistical program vis-à-vis other statistical programs. Periodic reviews of working processes are undertaken to ensure that they are improved upon. Periodic reviews of budgeting procedures are undertaken to ensure that scarce resources are best employed in addressing major data problems or meeting new data priorities. The data producing agency strives to make the best use of newly emerging opportunities, such as computing technology for data processing/dissemination, to effect resource savings. When necessary, the data producing agency seeks outside expert assistance to evaluate statistical methodologies and compilation systems.

- 14 -
0.3 Quality awareness
38. While the tendency is often to measure the capacity in terms of statistical products, a key element in the success of statistical operations is the way components leading to end products are managed and, as importantly, how such products are perceived by users. Statistical products will be used only if users have confidence in their quality, hence the importance of quality in managing the statistical process.
39. Quality awareness concerns the extent to which managers give attention to quality by providing a vision with a clear orientation in meeting users� needs and in directing the statistical operations accordingly. Such leadership, or lack of it, affects how the organization learns and grows (human resource management), how it manages its finance and results (management accounting), the extent of efficiency in conducting the statistical operations (operations management), and the dealing with external stakeholders, notably data users and data suppliers (marketing management). Leadership is critical in explaining how these various management aspects are integrated and carried out with a sense of direction. Leadership can take various forms (task oriented, relationship oriented, etc.), and the impact on data quality will depend on the specific situations, that is the staff, the tasks and the organization. Which works the best depends oN the personal characteristics of the staff and the environmental factors, such as the formal authority system in the organization and the extent to which group dynamics allow staff to receive desired rewards.
40. Management is reviewed here under three headings: focus on quality issues, monitoring the evolution of such issues, and dealing with quality issues, including periodic evaluation. These aspects apply equally to central statistical office and statistical units in ministries, though there may be variations in the scope of their mandatory statutes and in the way processes are organized for human resources, financial management, and in technical areas such as survey management, statistical analysis and dissemination practices and channels.
Focus on quality issues
41. A first aspect of quality awareness is that management needs to clearly communicate to staff a strong focus on the need for quality information to be produced. This can be done in various ways including: introduction and training courses; policy manuals; operational manuals; and subject analyses. A vision needs to be provided, goals set, and resources made available to ensure that the goals can be met. The vision should take account of users' needs so that it promotes users� confidence in the trustworthiness and relevance of the statistical products. Organization goals that have users as the main driving force promote a culture and values amenable to delivering products that meet users' requirements.
Monitoring quality issues
42. A second aspect of quality awareness is for management to put in place processes to monitor the quality of the collection, processing, and dissemination of statistics. At a broad level there are various ways this can be done. Some data producing agencies adopt a system of Total Quality Management; others aim at certification along the lines of the ISO-9000

- 15 -
system. Whichever broad approach is used, it is necessary for line managers to document a range of procedures that are to be undertaken to ensure the quality of collection, processing, and dissemination. These would include, for example, sampling procedures, access to framework lists, detailed editing procedures, estimation of non-response, imputation of missing information, etc. Periodic surveys with users should be carried out, in order to determine their perception of data quality. These and other activities of monitoring data quality should be carried out by a unit in the data producing agency that is distinct from the data producing units.
Dealing with quality issues
43. A third aspect of quality awareness is for management to establish processes that enable judgments to be made about tradeoffs within quality, and processes that facilitate evaluation of statistical programs. In terms of tradeoffs a number of fine judgments are often required. For instance, in a central statistical organization, the leaders may put emphasis on the dissemination aspects of the statistics, which may leave little time for checking the accuracy and reliability of the data. In a ministry, the leaders may put emphasis in getting the statistics for their own use, caring less about the data being disseminated to the public at large. In other instances, there may be tradeoffs between accuracy and timeliness; if it is determined that particular survey results need to be finalized within two weeks of the end of the month it will be necessary to impose tight deadlines for collection, editing and processing of data. This may require acceptance of a lower response rate and/or less rigorous editing. To extend this example further, there may need to be a tradeoff between cost (or cost-effectiveness) and relevance. If the budget for the survey has to be reduced by say 20 percent to allow for additional statistical work, it may be necessary to reduce sample size or restrict the scope of the survey in some way. These kinds of judgments may be required at short notice in response to changes in user requirements, or because of reduced availability of funds. The same kinds of principles are involved in a more formal evaluation of a statistical program.
44. The existence of development plans/programs constitutes a measure of the priorities setting of the organization. They need to be part of the whole statistical operations with the goals clearly defined in terms of feasible targets that are well delineated inclusive of resources requirements and a timetable for future work on data quality improvement. The goals and targets should include measures of performance that provide signals, both qualitative and quantitative, that are easy to understand and that are accessible. The performance measures should encompass various viewpoints such as those of users, funding agencies, respondents as well as employees. Finally, the monitoring measures should be known, shared and well understood by both management and the staff since they should provide the facts on which to assess the extent to which the objectives and targets are achieved.
1. Integrity
This dimension identifies features that support firm adherence to objectivity in the collection, compilation, and dissemination of statistics so as to maintain users� confidence. Elements

- 16 -
refer to the professionalism and ethical standards that should guide policies and practices, which should be reinforced by their transparency. 45. Integrity6 refers to the extent that the culture and values promoted in the statistical system embody the principle of objectivity in the collection, processing, and dissemination of statistics. It requires concern for both the reality and appearance of impartiality, and of independence from political influence. It is essential that the statistical system maintains complete integrity of its processes and products.
46. This is greatly facilitated if the independence of the statistical system is provided for by legislation (see Legal and institutional environment, 0.1). A widely acknowledged position of independence is necessary for the statistical system to have credibility and to carry out its function of providing an unhindered flow of useful, high-quality information for the users. Without such assurance, users may lose trust in the objectivity of the products of the statistical system, as they are often not in a position to verify the completeness and accuracy of statistical information. In the same way, data providers also may become less willing to cooperate with requests for the provision of data. In other words, not only integrity but also a widely held perception that the statistical system/agency is free of political interference and policy advocacy are essential conditions for an adequate working of a statistical system.
1.1 Professionalism
47. Professionalism requires impartiality in the choice of statistical �inputs� (such as definitions or methodology) and �outputs� (such as release of data). According to the UN principle 2 of official statistics, a data producing agency must be impartial and avoid even the appearance that its collection, analysis, and reporting processes might be manipulated for political purposes or that individually identifiable data might be turned over for administrative or other purposes. Choices about data sources and statistical methodology must be made solely on the basis of statistical considerations and those statistical considerations should be made public through published documents and other means.
48. The circumstances of different agencies may govern the form that independence takes. In some cases, as noted earlier, legislation may establish specific rules for the appointment of the higher level of management. In other cases, additional safeguards may be required such as giving authority to the data producing agencies for professional decisions over the scope, content, and frequency of data compiled and disseminated.
49. Professionalism requires involving competent and motivated people as vital elements of the statistical process. Professionalism should be promoted in the data producing agencies through appropriate training, analytical work, preparation and dissemination of 6 Also important for integrity are dissemination practices, provision of metadata, commitment to quality and fair treatment of data providers. These issues are addressed separately in other dimensions.

- 17 -
methodological papers and organization of conferences, seminars, meetings with other professional groups, etc. By increasing their competency, knowledge and experience, and by sharing their know-how and experience in such activities through internal reviews, statistical staff is in a better position to review and improve statistical processes. Professionalism underlines the organization�s responsibility to ensure that statistical knowledge is acquired/accumulated both through formal training and practical experience.
50. Professionalism also requires that the data producing agency follows closely the use of statistics in the financial press and other media, in order to detect misuses of statistics (UN principle 4 of official statistics). The agency is free to make comment on any erroneous interpretation and misuse of statistics. These situations are often unintentional and can arise through an incomplete understanding of the data or of the underlying statistical methodologies. Comment by the statisticians can assist in preserving an image of professionalism and integrity, and at the same time play a role in user education. Extensive use of explanatory material and briefings may avoid some of the misuses of statistics.
1.2 Transparency
51. Transparency requires that the terms and conditions under which the statistical processes are conducted are available to the public. This is achieved through a variety of means. They include the wide dissemination through agency publications and/or websites of materials about the terms and conditions under which official statistics are compiled and disseminated (e.g., the statistical law, the Fundamental Principles of Official Statistics, mission statements, and codes of conduct under which official statistics are compiled and disseminated) or references to where such information can be found. Other means are the extensive use of explanatory notes on questionnaires (for the benefit of respondents) and the publication of manuals on concepts, sources and methods (for the benefit of users). Internal access by governments prior to the release should also be publicly identified. Furthermore, products of data producing agencies should be clearly identified as originating from such agencies. Finally, advance notice should be given about major changes in methodology, data sources, and statistical techniques so that users can make contingency plans when the data become available.
1.3 Ethical standards
52. In order to develop a culture that respects ethical standards, guidelines for staff behavior are in place and are well known to the staff. They include clear guidelines outlining correct behavior when the agency or its staff is confronted with potential conflict of interest situations, or establish the connection between ethics and staff work (e.g., with respect to guarding against misuse and misrepresentation of statistics) These guidelines need to be given appropriate emphasis in induction and training courses and, where necessary, by managers in the course of day-to-day operations. Furthermore, management acknowledges its status as role model and is vigilant in following the guidelines. It also assures autonomy from political interference.

- 18 -
2. Methodological soundness
This dimension refers to the application of international standards, guidelines, and agreed practices. Application of such standards, which are specific to the dataset, is indicative of the soundness of the data and fosters international comparability. Elements refer to the basic building blocks of concepts and definitions, scope, classification and sectorization, and basis for recording. 2.1 Concepts and definitions
53. A number of reasons call for adopting internationally accepted methodologies (UN principle 9 of official statistics). First, as countries are increasingly integrated to other economies, the use of common methodologies enhances the international comparability of statistics given the interdependence of economies, and the universality of many social and economic problems. Second, by providing venues and platforms for comparisons, international guidelines are more likely to influence the behavior of government. Third, they facilitate a greater coordination of statistics across different fields by providing incentives for standardization of concepts and definitions; this is equally relevant where data, e.g., socio-demographic and economic are compiled by the same agency as when the responsibility is shared among different agencies within the same country.
54. However, international guidelines are not always achievable in the socio-demographic field as they may mean changing definitions and methods, creating a dilemma between maintaining consistency with countries� own data or enhancing comparability with other countries� data. In practice, it may be possible to meet both national and international user needs through, for example, the adoption of classifications and lists of data items that are constructed in such a way that dual purposes are met without providing outcomes that are mutually exclusive. Moreover, it should be noted that even where definitions are the same, collecting the same information from different sources may give different results; for example, employment estimates obtained from data provided by employers are likely to differ from those obtained from households. While the ideal may be to maintain both methodologies, limited resources often force a choice which means in the long run keeping under continuous deviations from international standards.
55. The following provides examples of datasets where international guidelines exist and are consistent with one another, and these are examined under scope, classification, and basis for recording.
2.2 Scope
56. It is important that the scope of data collections accords with that prescribed in internationally accepted standards, guidelines, and good practices. For example, the System of National Accounts 1993 (1993 SNA) specifies a production boundary in terms of goods and services production, to which the scope of GDP should adhere. Similarly, the BOP specifies what should be included in imports and exports of goods and services. Countries may not only adhere to conceptual international guidelines, but also adopt international

- 19 -
compilation practices. For instance, in the field of national accounting, priorities have been assigned to the compilation of GDP and related concepts.
2.3 Classification/sectorization
57. Similarly, it is important that internationally accepted classifications are used as far as possible. This means that international comparisons of statistics of exports of automobiles, or gross product of chemicals industries, to take some examples, are not affected by differences in classifications. While the use of international classifications is highly desirable, it is quite common for countries to use adaptations (national versions) of international classifications. For example, national versions of the International Standard Industrial Classification (ISIC) or Central Product Classification (CPC) would take account of particularly important economic activities/ products that exist in that country; for example a more detailed dissection of the clothing industry. This enables more useful national data to be compiled while still facilitating comparisons between countries.
2.4 Basis for recording
58. A specific kind of conceptual consideration relates to the basis for recording particular items. For example, in the most recent international guidelines of the 1993 SNA, the 5th edition of the BOP Manual (BPM5) and the latest revision of the GFS, it is required that production of goods and services, consumption and capital outlays, taxes, as well as exports and imports of goods and services be recorded on an accrual basis rather than on a cash basis. Similarly, valuations of production in the 1993 SNA would not include specified product taxes, nor would imports valued cif include import duties in line with the 1993 SNA or the BPM5. Significant differences can occur if cash basis is used in the valuation of some of the above flows, if product taxes or import duties would be included in the value of output respectively imports, or would be caused by non-adherence to other international standards, not only on economic but also social and environmental statistics. It is therefore important that internationally accepted recording bases be used as far as possible.
3. Accuracy and reliability
This dimension identifies features that contribute to the goal that data portray reality. Elements refer to identified features of the source data, statistical techniques, and supporting assessments and validation. 59. The tasks of collecting data, processing them (applying techniques to adjust and estimate) and analyzing statistical data (assessing and validation) may be organized in different ways (or processes) in each data producing agency. The organization of the processes will have an impact on the approaches to strengthen capacity.
60. The various tasks of collecting data sources, applying statistical techniques and assessment and validation of data can be spread across various units, that may or not be undertaken by the same data producing agency. If the data producing agency is a statistical organization with sufficient resources, the work is likely to be spread across units organized along functional lines where the tasks are grouped into specialized functions, with jobs

- 20 -
organized by skills (e.g., survey interviewer, editor) or processes (e.g., survey collection). The more spread are the tasks the more importance is to be given to integration and coordination functions within the statistical process. However, the possibilities of specialization may be very limited in the statistical units of poorer countries, with the staff conducting all the statistical operations from data collection up to data dissemination. This would be also the case where the data producing agency is a ministry involved in administrative and policy functions; the tasks related to accuracy and reliability would be generally integrated in a single unit (divisional organization) organized on the basis of the statistical outputs.
61. Whatever the form of organization, there is no a priori reason for several data producing agencies to be involved in the collection and processing of the same data; legal and/or administrative arrangements may have to be amended to prevent such a duplication in responsibilities. This being said, the fact is that the statistical unit in a line ministry may have to produce financial accounting of the work of the ministry, not just in terms of expenditures but also in terms of inputs and outputs. For example, in a Ministry of education, the statistical unit may collect data on enrollment by age, grade, sex, school, etc., to be included in the annual statistical report of the ministry. At the same time, the central statistical office will also ask data about school enrollment, often along with other variables such as income. The result of these arrangements is often a set of national enrollment estimates that probably will produce different results.
3.1 Source data
62. The availability of soundly-based source data is of critical importance in the quest for accurate and reliable statistics. There are two basic kinds of source data: directly collected statistics and data obtained from administrative sources (e.g. data on government records, or data on enterprises obtained from taxation authorities, or data on exports and imports of merchandise obtained from customs authorities). Directly collected statistics normally have certain advantages, such as the statistician's ability to control the scope of the collection, use questionnaires that specify the desired statistical concepts, and so on. Administrative data are usually much less expensive than directly collected statistics, and for this reason are important data source for data producing agencies with limited resources despite the data�s limit in terms of units definitions, concepts, classifications, etc. Investing in a better administrative data collection mechanism is, therefore, critical for those agencies, especially in poorer countries where the survey resources are very limited, but where also there are incomplete, often uncomputerized, untimely record systems that need significant investment to be useful.
63. Directly collected data can be divided in turn into censuses and sample surveys, using scientifically selected samples to represent the whole population. Examples of censuses are: population and housing censuses, and agricultural censuses. These are often very large-scale operations with the capability of obtaining detailed statistics. Examples of sample surveys are: economic or establishment surveys, household budget surveys, labor force surveys , and surveys of retail prices paid by households. Some sample surveys concentrate on a small number of data items, while others are very detailed. Another approach is to conduct a

- 21 -
programmed of multiple surveys, each addressing different or overlapping sub samples of entities. Most surveys are periodic, i.e., each year, quarter or month, others are carried out during longer intervals (censuses are generally conducted each 5 or 10 years), while some other surveys are conducted ad hoc, in order to fill data gaps. Unlike economic and financial statistics that need to be produced at frequent intervals as they describe rapidly changing situations, social statistics describe more slowly changing phenomena, and the need for greater frequency may be unjustified.
64. A national statistical organization produces a wide range of statistical outputs involving the collection and processing of a huge volume of data. Some basic source data serve a wide variety of purposes. For example, population census data may be used in poverty studies, assessment of demand for public facilities, and estimates of elements of the GDP, to name just a few examples. Important source data may not only originate in data producing agencies, but may also come from specific line agencies such as the central bank that is concerned with BOP statistics, or specialized ministries that are for instance concerned with health and education.
65. Data included in surveys and administrative data sources should satisfy the detail that is required for particular type of statistics. Thus, household surveys should satisfy the needs of measuring prices for a detailed basket of goods and services, and at the same time satisfy the needs of SNA compilation in covering the household sector accounts. Similarly, direct foreign investment surveys conducted by the central bank should satisfy the BOP and SNA requirements for the rest of the world account. Surveys and administrative data sources should also have a scope (in terms of units covered) that is sufficient to support detailed analysis for a large number sub-groups of economic agents that are required by the classifications used. Finally, data sources should have the required frequency, which depends on the type of statistical output. For example, quarterly and even monthly compilation of statistics could be supported for economics and financial statistics, and less frequency would be more appropriate for social statistics, which tend to capture more slowly changing situations.
66. Some countries make extensive use of administrative records. While legislation can provide for access by data producing agencies to administrative data sources, it is also important that custodians have a positive attitude towards statistical requirements, agreeing to modify and supplement the data, and to provide data on a timely basis. Close cooperation between the statistician and the custodian of administrative data can result in continuing improvements to the data base and may well lead to concepts and classifications that are brought into closer accord with national and international standards.
3.2 Statistical techniques
67. Statistical techniques are used to correct data and to transform source data into intermediate and output data.
68. A range of techniques can be employed to correct data. An example is the editing of data reported by each respondent to ensure internal comparability, historical comparability and comparability with data obtained from other data sources. This type of editing is usually
- 22 -
conducted using the computer to calculate a number of ratios (e.g., purchases to value added, price per unit) and to identify outlier observations that need to be queried back to the respondent for confirmation or correction, or estimated on the basis of alternative data sources. This requires skills, in-depth knowledge and critical judgment. Statistical techniques may involve the use of counterpart data to derive measures such as for final consumption which may be estimated with help of data on production and imports of consumption goods. Similarly, the payment of taxes by households and enterprises may be derived from government tax records. Furthermore use may be made of ratios from benchmark data for earlier periods to arrive at breakdowns of information not available in the present period, growth rates of e.g. production of selected goods and services to extrapolate production of all goods and services and deflation of aggregates at current prices to derive estimates at constant prices, through to complex synthetic estimations using modeling such as the derivation of investments and depreciation from production data. Some statistical techniques may involve the adjustment of measures based on concepts in administrative and survey data to arrive at the estimation of data relating to specific statistical concepts. Benchmarking and seasonal adjustment techniques may be used to make quarterly data compatible with annual estimates. In all cases this dimension of quality requires that sound statistical techniques are employed..
3.3 Assessment and validation of source data
69. Assessment and validation studies aim at ensuring that the source data are adequate in terms of coverage, sampling and non-sampling errors, response rate, etc. Assessments are made of the correctness and adequacy of coverage (e.g., in the light of new developments in the economy), the reliability of the register of units used to conduct the collection, the adequacy of the sample design and sample estimation procedures, the adequacy of the procedures for estimating non-response cases, etc. The extent of data revisions in the past may also be taken into account when validating the source data (see below under 3.5). Similar assessments and validations of administrative source data need to be conducted. The development of a research and analytical capability within the statistical organization contributes to improving the capability for assessment and validation of source data. Findings in the data assessment and validation may be used to adjust data collection procedures, for instance when non-sampling errors become too large.
3.4 Assessment and validation of intermediate data and statistical outputs7
70. This dimension involves assessing the adequacy and reliability of both the statistical outputs (whether disseminated or simply used internally) and the intermediate data (which will usually be treated akin to �work in progress� and not released outside the statistical organization). In many cases the initial focus will be on the outputs and then, where necessary, on the intermediate data. Using a �top down� approach it may be that a reasonable proportion of the output data appear reliable but some components (e.g., some commodities within a dataset on exports) require further examination and validation. In such cases it 7 Laliberté and Carson, 2002, p. 6.

- 23 -
would be necessary to examine the relevant intermediate data. Assessment and validation may include comparison of data from different data sources, comparing data from the same source in different periods or comparing statistical outputs for official release with unofficial estimates made elsewhere. For instance, to ensure consistency between quarterly and annual data a common practice is to reconcile the two sources (at aggregate levels and ideally, as a first stage, at individual record level) and then revise quarterly data where necessary. When inconsistencies arise, there may be opportunities to take corrective action with one or more of the data sources, or, alternatively, discrepancies may be explicitly presented when publishing the official statistical outputs. As with 3.3 above, the development of a research and analytical capability will assist in this dimension.
3.5 Revision studies8
71. The existence of revision studies is indicative of the continuous improvement process that should permeate the statistical work. Revisions occur when previously published observations are modified for various reasons: the response on which the estimates are based has increased since the last estimates were published, the respondent has provided more accurate data following finalization of annual accounts, the data producing agency has discovered an error at some stage of the collection and processing of data that was previously not detected, or the data producing agency has made improvements in the estimation techniques. Revision studies should identify the causes of errors, and differences from earlier series, with a view to explaining the differences and identifying opportunities for improvement of intermediate data and final statistical outputs. The outcomes of such an assessment may include, for example, adjusting the timetables for submission of statistics questionnaires, clarifying concepts and requirements on questionnaires, modifying the editing system and or the statistical techniques, and reviewing estimations procedures of intermediate outputs. Revision studies effectively provide information after the statistical process is completed and consist in using lessons learned for continuous improvements in processes.
4. Serviceability
This dimension focuses on practical aspects of how well a dataset meet users� needs. Elements refer to the extent to which data are relevant, produced and disseminated in a timely fashion with appropriate periodicity, are consistent internally and with other datasets, and follow a predictable revisions policy. 4.1 Relevance
72. Relevance concerns whether or not the statistics cover information relevant to major user needs for current decision making, program monitoring, analysis, etc. as well as attempting to anticipate future data needs. This is a vital requirement of the UN principle 1 of official statistics. The statistical system must have processes that encourage and enable 8 Idem.

- 24 -
statisticians to be knowledgeable about the issues and concerns of users, and to determine statistical implications and the consequent user requirements (where these have not been clearly articulated by the users). This entails, among other things, analysis of results, interpreting the statistical outputs and presenting them in an easily comprehensible form for the benefits of data users. This would help pave the way for statisticians to remain abreast of new developments and to be in a better position to develop and provide objective, relevant information in response to major user requirements.
73. Relevance requires determining whether the statistics produced are useful for diverse types of users. Determining the current and potential needs of users and translating them into information needs can be achieved through some form of national statistical advisory board of statistical producers and users. However, the main issue is whether the statistical offices make sufficient effort to find out what their users need and whether they are flexible enough to adapt their statistical programs to address emerging demands. In establishing priorities for statistical programs for this purpose, the data producing agencies must work closely with the users of such information in the government and interested non-government parties.
74. Data producing agencies, unlike commercial units, do not have the price mechanism to help them monitor the demand of statistical products. While prices may be charged for many of the statistical products and services they are generally nominal prices rather than market prices. However, analysis of demand for statistical products and services is a good indication of relevance. Data producing agencies have to establish processes to determine how users evaluate and select statistical products, and to measure clients� current and expected needs. National policy makers, users generally, and, ultimately, the public must have confidence in the data producing agency, and they must perceive that the statistical products are useful and meet their expectations. Apart from advisory committees and analyses of user demand, other ways of assessing relevance include formal surveys of users to ascertain their views on aspects of statistical products and data dissemination; and the simple logging of comments received by statistical staff throughout the organization, in order to identify improvement opportunities. Participation in international and regional meetings may also help statistical staff to become more aware of user�s needs and the ways statisticians in other countries respond to particular needs.
4.2 Timeliness and periodicity
75. Users usually require up to date information, either from benchmark surveys or from repeated surveys, in order to carry out analyses or to track specific developments. Timeliness, or the time between the reference date to which the data relate and their availability to users, is therefore an important aspect of quality. Users often have a need for frequent (e.g., monthly or quarterly) observations in order to effectively monitor trends in a characteristic. The frequency with which the survey is conducted and the processing time taken to finalize the survey results may need to be modified to meet users� requirements in terms of timeliness. Akin to this is the periodicity, or frequency, of data collection and production. (Announcing the release dates well in advance, covered in 5.1 below, should help among other things to provide for internal operational discipline.). Timeliness and periodicity can be
- 25 -
compared to international guidelines as provided in the GDDS and the SDDS to identify instances of tardiness.
4.3 Consistency
76. Consistency encompasses consistency within the dataset, over time, and with other major datasets.
77. An example of consistency within datasets is the requirement that totals are compatible with the sum of the details, or that other accounting identities are observed. In the national accounts, for example, it is necessary to ensure that GDP according to the production approach is equal to GDP according to the expenditure approach. These two measures are conceptually identical but in practice they usually generate different results. The convention followed by some countries is to publish both aggregates and express the difference as a statistical discrepancy, while other countries eliminate the discrepancy in the data reconciliation. Other examples are the identity between balancing items such as current external surplus, government deficits, saving or net lending in the GFS, BOP or SNA and component resource and use items that define these balancing items (external surplus of goods and services = exports less imports; government surplus = government taxes less government current expenditures; or household saving = household disposable income less consumption). Another example of consistency within datasets is the need for quarterly and annual data to be consistent, since quarterly data may be compiled from source data different from, and less reliable than, the annual data.
78. Consistency over time requires that users are in a position to make valid comparisons over time. This means that the statisticians would have attempted to build a comparability bridge when there has been some need to introduce a change to a definition, collection system, etc (e.g., to meet new demands of users). An example of such bridge is to publish data on both the �old� and �new� bases for a particular period so that users can empirically compare the effects of the changes for each year, quarter or month within the period of overlap.
79. Consistency, or reconcilability, with other data sources means to ensure that data from different sources are comparable. One example is a comparison of net lending from national accounts and the equivalent concept in the balance of payments, or between the national accounts and flow-of-funds statistics. Another example, perhaps less conclusive, is the comparison of unemployment data from a labor force survey with unemployment as measured by registrations for benefits, or the difference between employment as measured in a labor force survey and employment as measured in censuses/ surveys of enterprises, government and non-profit institutions.
4.4 Revision policy and practice
80. It is vital that the data producing agency has a regular, well established, and well-publicized schedule for issuing revised data as statistics often undergo a cycle of preliminary/revised/final releases. In business statistics, for example, quarterly data may be based on broadly based surveys that collect a small number of data items from a limited

- 26 -
number of enterprises, whereas annual data are compiled with help of detailed annual questionnaires that are sent to a much larger number of enterprises. As noted earlier, it is quite usual to revise the short-term data in the light of experience with the longer-term data. In the national accounts, depending as they do on a large number of data sources, it is quite usual to issue first preliminary, second preliminary and final data, so that initial data may be revised at least twice.
81. A well publicized revision policy assists users to take proper account of the various �editions� of statistics released and to make effective use of all data released. The revised data should furthermore be published in the same detail as the previously published data, so that users can identify the elements where major revisions took place. Transparency in publicizing revision practices helps users to understand the reasons why revisions occur and assists in maintaining the credibility of the statistical service.
82. The publication of revision studies further assists in achieving these objectives. While the responsibility to use all kinds of methods to validate the data rests upon the statisticians (as covered in dimension �Accuracy and reliability�, 3.), the results obtained from validating data are also useful to users as they seek to understand the data and their limitations. For this reason, a transparent approach for statisticians in publishing the results of their validation methods and revision studies is relevant to users. It is also important that preliminary data are clearly identified in publications, etc. so that users are aware that revised data may well be released at a later date.
5. Accessibility
This dimension deals with the availability of information to users. Elements refer to the extent to which data and metadata are clear and easily available and to which assistance to the user is adequate to help them find and use the data. 5.1 Data accessibility
83. The statistical system should strive for the widest possible dissemination of the data it compiles. Data dissemination should be clear and understandable. Measures should be taken to ensure that historical data series are maintained and accessible to users at any time. It is also important that a variety of data dissemination avenues should be exploited to reach as broad an audience as reasonably possible, and to recognize that users have varying facilities, skills, and needs.
84. Data dissemination possibilities include: publications, data on diskettes and CD-ROM, websites, government depository libraries and news releases (allowing the media to regularly publish statistical data and to make comment based on data released). It is important to maintain good relations with the media, provide free access to basic information in libraries and provide information by telephone or by electronic means. Regardless of which dissemination format is used, clear tables, charts and text are vital.
85. Equally important for accessibility is the release of statistics according to a pre-announced schedule. An essential element of an effective dissemination program is an

- 27 -
established publications policy and a comprehensive catalog that describes the data products and services available, and the frequency of release. While this information is useful to users it also ensures the integrity of statistics by preventing external manipulation of data releases, through political interference for example. However, it is a custom in several countries to give pre-release access to ministers and certain officials, which may be an hour to several days and the list of recipients of pre-release statistics may be extensive. It is good practice to restrict both the list and the amount of time in advance of the normal release, and to inform users about this practice.
86. Good practice in accessibility is based on the general principle of ensuring that all users are treated equally. This means not only that access to new statistics is provided at the same time to all users but also that all users pay the same prices for the same statistical products. The speed at which data may be located and obtained is a vital element of quality
87. There are many potential audiences for data dissemination, each with different needs and priorities. Policy makers constitute an important class of user; statistics can help them in making informed decisions, in assessing the effectiveness of their policies, as well as in helping reorient their actions if the policies are not leading to the desired outcomes. Other users include: business organizations; political and labor organizations; interest groups in fields such as welfare, education, and the environment; and the general public. It is important that the data producing agency is proactive in its relations with users, ensuring that they are fully aware of relevant data available, the most suitable dissemination formats, the strengths and weaknesses of the data, and the relevant metadata (see 5.2 below).
88. Finally, there may well be data that is unpublished but not confidential. The availability of such data needs to be publicized so that users are in a position to make use of relevant data.
5.2 Metadata accessibility
89. The UN Principle of Official Statistics emphasizes the presentation of information about the concepts, sources, and methods used to produce the statistics; i.e., metadata. Data producing agencies should ensure that users have access to metadata so that they have a proper understanding of what the statistics represent. The extent to which the description of the underlying structure of the data is made available to the public will enable users to understand and interpret the data m properly. Descriptions of methodology should be provided for all statistical products and should be presented in user-friendly form. For some general users short non-technical descriptions are sufficient and appropriate. For other users a more detailed technical description is warranted. For major series, for example the consumer price index, both �short� and �long� descriptions are produced in many countries. Metadata provide useful insights about the quality of statistical products and in some cases need to include information about sampling errors, non-response and its treatment, the nature of imputations, etc.
90. The statistical system should be transparent about the products that it releases to the public. The metadata should include comment on the main strengths and weaknesses of the statistical techniques employed. It is not sufficient simply to promote access to data; it is also

- 28 -
necessary to encourage a greater knowledge and understanding of statistical information among users. For this purpose it is important to prepare and regularly update documentation (e.g., brochures) and extensive sources and methods documents, to inform analysts and other users, produce comprehensive metadata and to make it accessible to as wide an audience as possible.
5.3 Assistance to users
91. The data producing agency should publicize its contact officers for the various products and services and ensure that catalogs of products and services and related information are widely available and should be regularly updated. The prices of the statistical products and services are clearly disclosed and assistance is provided in placing orders. Catalogs should be placed in libraries and made readily available at special briefings for data users, notably to journalists and others in the media. Assistance to users is monitored through periodic surveys of users.
92. To the extent that the above steps are taken, they will help in dealing with concerns such as: What are the selling and ordering processes? Are they simple and user-friendly and what are clients� preferences? Are catalogs and sales literature easy to understand? Are the products affordable? Is there a single point of access for statistical information, whatever the clients� needs are?
D. Identifying Statistical Capacity Indicators
93. The DQAF structure proved useful to describe the statistical operations for several reasons:
• The structure is well grounded both conceptually and pragmatically, since it conforms to the official principles of data producing agencies, takes countries� best practices into account, and embodies the extensive experience of the IMF and other international organizations in providing technical assistance.
• It tests users� confidence in the quality of statistics, a factor that can determine how effective are the statistics.
• The structure is robust, having been successfully tested in a number of countries, with statistical systems at various stages of development, and with various organizational arrangements.
• It gives guidance on sequencing the statistical tasks by taking into account the interdependencies of the statistical operations and the actual circumstances of the data producing agencies.
94. From the description of the statistical operations, candidate indicators of statistical capacity building have been identified. These candidates are presented in the first column of Annex 1 along with indicators that have been culled from the work of Willem. De Vries in an exercise to link statistical operations to the UN principles (second column), and that of

- 29 -
Ivan Fellegi in discussing performance measurements of data producing agencies (third column).
95. Parallel work is also underway to compare and supplement the candidate indicators with indicators that are used by other international donors, such as the World Bank, the United Nations Statistical Division (UNSD), the UN Economic Commission for Europe (UNECE), the OECD and Eurostat. The intent of these comparative exercises is to ensure that the essential characteristics of statistical operations are covered.
96. The next challenge is to distill these candidates into SCB indicators which can be subject to very specific and concrete measurements (step three). Arriving at specific measurable yardsticks may entail grouping some of the candidates and/or devising proxies when direct measures are not readily available. In other words, as rough as they may be, the SCB indicators need to be measurable instruments to monitor changes. Tthe testing phase (step 4) should help to assess the measures in terms of ease or difficulty of measurement and of the usefulness of responses. Taking all of these considerations into account, the list could then be refined and reduced. In the longer run, it is expected that this first series of SCB indicators will evolve, through usage, into fewer but still salient SCB indicators representative of statistical capacity building.
E. Strategic Planning of Statistical Activities
97. The wide range and number of desirable features that will emerge from applying the SCB indicators to a given objective are likely to be daunting. Setting priorities as to where to put the greatest and earliest efforts will be required as it will be inefficient to attempt to move forward along all fronts at the same time. The priority setting process will need to take into account the longer term requirements of the statistical managers as well as those of the other major stakeholders who have a vested interest in statistical capacity building. Data users, both national and international users, have numerous and diverse statistical needs, with their needs evolving over time as the reality under measurement and their concerns change. However, statistical resources are scarce, especially the nationally funded resources in developing countries, and they often need to be supplemented by external funding, extending the scope of stakeholders to external assistance providers.
98. Coordinated efforts between producers, users, and other stakeholders will be critical to planning strategically, that is to ensure that the statistical capacity being built is fit for the purposes, fit for the means available, and fit for the longer term sustainability of statistical operations. Fit for the purposes entails determining the specific concerns to be addressed, which means managing the demand. Fit for the means available entails managing the supply. Fit for the longer-term sustainability of statistical operations includes managing for the external funding to be gradually superseded with national funding.
Demand management
99. Applying the indicators to statistics that are considered relevant helps to focus on building statistical capacity in specific areas. The need to produce relevant statistics has increased in recent years with the growing emphasis on policy-making based on concrete

- 30 -
facts and policy monitoring based on measurable results. This in turn has enhanced the importance of producing quality statistical outputs.
100. As part of this growing awareness for evidence-based decision taking and monitoring, questions to be addressed are: What are the criteria that are used for selecting the data? Are they relevant to major current issues? Which products to choose and why? What results are expected and why? Are these products within the manageable limits of countries� circumstances? These questions have been dealt with in other forums, more particularly the �Friends of the Chair� of the UN Statistical Commission and through statistics recommended in the GDDS as introduced by the IMF.
101. The �Friends of the Chair� identified economic and social statistics that can represent a core set of relevant statistics, while recognizing that countries need to establish their own national needs. The framework that has been developed is intended to enable countries to assess their statistical priorities and to reconcile the statistics that are needed for national purposes with the global requirements. It groups the statistics in seven domains, with each domain comprising statistics classified according to three levels of priority. The first level covers statistics for all countries to compile with the highest priority, either immediately or with statistical assistance, since they are viewed as sufficiently suitable for a broad monitoring purpose. It was also proposed that countries carried out a systematic inquiry of the availability of the second and third levels to obtain a progressively more coherent and comprehensive statistical picture of any domain or policy area that had sufficient depth to support national policy initiatives or more extensive needs of international agencies.
102. The GDDS also identified a number of macroeconomic and socio-demographic statistics that can be indicative of statistical capacity.
103. Also, as part of the international effort to promote common guidelines, the IMF has undertaken over the last few years an initiative in which the DQAF is being used to assess the capacity of countries to produce macroeconomic datasets of quality.9 The results for countries assessed are reported in the data module on the Report on Observance of Standards and Codes (ROSC). The data module assesses the characteristics of serviceability and accessibility that users can relate to, as found in the GDDS and SDDS, as well as other aspects of data quality, such as the characteristics of the producing agencies, the methodological soundness of the statistics, as well as their accuracy and reliability.
Supply management
104. Fit for the means available (current capacity) entails that the development of statistical capacity should start and build gradually from the existing circumstances of 9 To date, data specific DQAF have been developed for national accounts, balance of payments, consumer price index, producer price index, government statistics, monetary statistics, merchandise trade and household revenues and expenditures statistics for poverty purposes. Other in prospect include the education statistics.

- 31 -
countries. The experience reflects that attempting to do too much and too rapidly may often exceed the absorbing capacity of countries, especially as statistical activities span over the long term.
105. The application of the SCB indicators should satisfy three interrelated functions: (i) providing a snapshot reading of the current status of statistical operations (describing); (ii) providing a framework for planning statistical development (planning); and (iii) providing a framework for monitoring capacity building (monitoring) and evaluation. How the SCB indicators can be applied to fulfill these three functions is illustrated here using the IMF experience in monitoring the DQAF quality indicators.10
106. The combination and interrelationship of these three functions are presented in a summary form in Table Statistical Capacity Matrix of Annex 2, applied here for illustrative purposes to national accounts. The first column lists areas of activities (to be filled by the SCB indicators when available). The second column �status at start� shows the current conditions by using here a 4-level scale: practice not observed (NO), largely not observed (LNO), largely observed (LO), and observed (O), work under progress (U), and non applicability or non availability of the information (NA).
107. With this reading of the current situation on the capacity to produce the national accounts, the measures required to improve the situation along with their sequencing (prioritization) are much easier to establish. For instance, there would be little point in trying to improve the accessibility of statistics until the situation improves in regard to the availability of resources to process the statistics. The second and third columns provide a synopsis of milestones along with target dates to reach these milestones. Underpinning these milestones would be an action plan that could be developed with the authorities when external assistance is involved. The priorities obviously will vary from country to country. For instance, meeting some of the prerequisite statistical conditions may take precedence over, say methodological soundness, in countries that face acutely insufficient material resources. For some countries the initial emphasis may be on establishing more suitable statistical legislation or stronger staffing and organizational structure. In other countries the focus may be on developing an improved classification or aligning statistical concepts more closely with international standards.
108. The plans having been developed with the same framework as that used for describing the statistical system makes it much easier to assess the outcomes achieved; a second reading of the situation constitutes effectively a monitoring on how the plans proceeded. For the example used here, a new reading of the situation shows that by 1999 there was some improvements, although they were not numerous or, on the face of it, striking (column 5). The reading shows marked improvements in two areas, serviceability and methodological soundness, where the country was by then �largely observing� good practices. Some improvements were noted in some aspects of accuracy and reliability. Where 10 Paragraphs 106 to 109 are extracted from Carson, Laliberté and Khawaja, 2001; Morrison and Khawaja 2001.

- 32 -
targets were set, they were not met. However, it is also noted that there is some deterioration in one aspect of accuracy and reliability. A snapshot reading in 2002 (column 6) will show to what extent the country is still lagging not only in the areas where technical assistance was provided but also elsewhere in the statistical system.
109. For each goal, the data producing agencies could decide the resources required, the time frame, the responsible party, and the evaluation method (how will they know they have accomplished a particular step?). The plans could take a results-oriented or tasks-oriented approach and take full account of relevant factors such as costs, human resources, the financing sources.
Sustainable capacity
110. Statistics constitute an important part of the information system for national governments and the data producing agencies need to respond to both national and international needs for data. Countries whose statistical systems are not sustainable, as evidenced by them relying extensively on external assistance, need to work toward developing a core statistical infrastructure and a critical mass of professional and technical skills, so that they are in a better position to meet both national and international needs. Some of the challenges toward sustainability are as follows.
111. First, the path to sustainable statistical development can be facilitated by priorities being set to meet national needs. The priority setting should be done in a way that promotes a climate where the statistical information becomes an essential support for national policies and good governance. To the extent that national authorities view statistics as part of their best interests, they are more likely to increase the funding to statistical activities
112. Second, such priorities should provide the goals upon which the statistical development plans of countries are made. Communication with external providers will be greatly facilitated if the plans are devised in a systematic format. The six-part format provided by the capacity indicators can provide such a format as it covers the full gamut of statistical operations.
113. Third, coordination of the various external assistance efforts will be enhanced by posting the national plans where they can also be shared with external providers such as the GDDS platform for countries that participate to that system. A more coordinated approach to technical assistance is in line with the PARIS21 initiatives.
114. The realization of these three steps should help to pave the way toward building the core statistical capacity referred to by the �Friends of the Chair.�
Without this core capacity and the ongoing resources to support it, neither the statistical needs of the country itself nor those of the international community will be reliably served. Where this core capacity is fragile the sporadic provision of additional funds to satisfy a particular statistical need will be much less effective and is no substitute for what one might term �statistical sustainability.�

- 33 -
F. Summary
115. The role of the statistical capacity indicators is to improve the availability of relevant statistical products by helping to better discern:
• the legal, environmental and resource conditions needed to perform statistical operations, obtain cooperation of respondents and administrative authorities, and manage statistical operations;
• the professional environment in which the statistical operations are conducted;
• the methodological expertise for establishing data sources and their links to the statistical products;
• the population to be covered, and the surveys, survey questionnaires, and administrative data sources;
• the skills and techniques to assess and transform data sources into statistical products, and to validate them;
• the relevance of the statistics to social and economic concerns, including the analytical capability to confirm certain issues and to identify those that need probing;
• the periodicity, timing, and consistency of the statistics;
• the methods and channels used to ensure wide and relevant dissemination of the statistical products.
116. The application of the SCB indicators to relevant statistics, or data producing agencies, will provide for an assessment of the current statistical capacity to produce such statistics (or reinforce the agency) according to a six-part reading of the statistical operations. By identifying the strengths and weaknesses of each part, such assessment should facilitate planning of the activities required to strengthen the statistical operations. Planning the activities strategically entails establishing priorities that need to meet national needs with the cooperation of both national authorities and external providers, thereby ensuring that the domestic and international needs are met; detailed plans could be prepared with specific targets, and resource requirements, and monitoring milestones. Plans organized according to the statistical capacity indicator framework should facilitate communication with external providers, and enhance the coordination of efforts among the various stakeholders. The indicators should help promoting sustainability in capacity building. It is expected that, by being applicable to any data producing agencies, they will encourage the development of measures that would lead to building a critical statistical mass self-financed by national authorities.

- 34 -
Ann
ex 1
: Can
dida
tes S
CB
indi
cato
rs, D
e V
ries
and
Fel
ligi s
tatis
tical
iden
tifie
rs/a
ctiv
ities
pre
sent
ed a
ccor
ding
to th
e D
QA
F st
ruct
ure
0. P
rere
quisi
tes o
f qua
lity
0.1
Lega
l and
inst
itutio
nal e
nvir
onm
ent �
The
env
ironm
ent i
s sup
porti
ve o
f sta
tistic
s 0.
1.1
The
resp
onsi
bilit
y of
col
lect
ing,
pro
cess
ing,
and
dis
sem
inat
ing
stat
istic
s is c
lear
ly sp
ecifi
ed
Can
dida
te S
CB
Indi
cato
rs
De
Vri
es In
dica
tors
Fe
llegi
Indi
cato
rs
• Le
gal f
ram
ewor
k re
quire
s pub
licat
ion
of
info
rmat
ion
colle
cted
, and
no
colle
ctio
n of
in
form
atio
n fo
r spe
cific
clie
nts o
n a
priv
ilege
d ba
sis.
• Le
gal f
ram
ewor
k an
d pr
otoc
ols s
peci
fy th
e m
ain
play
ers w
ithin
the
stat
istic
al sy
stem
, the
ir m
anda
tes,
lega
l enf
orce
men
t pow
ers,
and
oblig
atio
ns.
• Th
e le
gal f
ram
ewor
k is
impl
emen
ted
effe
ctiv
ely.
•
Off
icia
l sta
tistic
s are
acc
orde
d ap
prop
riate
re
cogn
ition
, vis
ibili
ty a
nd su
ppor
t with
in
gove
rnm
ent,
and
thei
r im
porta
nce
is a
ctiv
ely
prom
oted
. •
Ther
e is
a b
ody
(suc
h as
a n
atio
nal
stat
istic
s co
unci
l) th
at p
rovi
des h
igh-
leve
l pol
icy
guid
ance
to
the
stat
istic
al s
yste
m a
nd se
rves
as a
furth
er
prot
ectio
n ag
ains
t pol
itici
zatio
n •
All
elec
ted
repr
esen
tativ
es a
re se
rved
with
out
pref
eren
ce o
r priv
ilege
. •
The
surv
ey c
onte
nt a
nd q
uest
ionn
aire
des
ign
mus
t re
mai
n un
der t
he c
ontro
l of t
he d
ata
prod
ucin
g ag
enci
es.
• H
ow g
ood
is th
e st
atis
tical
legi
slat
ion
in a
co
untry
, in
term
s of c
lear
ly se
tting
out
the
mis
sion
and
the
com
pete
ncie
s of s
tatis
tical
ag
enci
es, l
egal
obl
igat
ions
to p
rovi
de
info
rmat
ion
for s
tatis
tical
pur
pose
s?
• Le
gal f
ram
ewor
k re
quire
s the
pub
licat
ion
of
the
info
rmat
ion
colle
cted
, whi
ch im
plie
s the
ru
ling
out o
f the
col
lect
ion
of in
form
atio
n fo
r sp
ecifi
c cl
ient
s on
a pr
ivile
ged
basi
s. •
The
surv
ey c
onte
nt a
nd q
uest
ionn
aire
des
ign
mus
t rem
ain
unde
r the
stat
istic
al a
genc
y�s
(age
ncie
s�) c
ontro
l.
• Le
gal f
ram
ewor
k sp
ecifi
es w
ho a
re d
esig
nate
d as
the
mai
n pl
ayer
s with
in th
e st
atis
tical
sy
stem
, wha
t the
ir m
anda
tes a
re, w
hat l
egal
en
forc
emen
t pow
ers t
hey
have
. •
Ther
e is
a b
ody
(suc
h as
a N
atio
nal S
tatis
tics
Cou
ncil)
who
se p
urpo
se is
to p
rovi
de h
igh-
leve
l pol
icy
guid
ance
to th
e st
atis
tical
sys
tem
an
d to
serv
e as
yet
ano
ther
pro
tect
ion
agai
nst
polit
iciz
atio
n.
0.1.
2 D
ata
shar
ing
and
coor
dina
tion
amon
g da
ta p
rodu
cing
age
ncie
s are
ade
quat
e •
Lega
l and
inst
itutio
nal e
nviro
nmen
t per
mits
dat
a pr
oduc
ing
agen
cies
to e
nter
into
agr
eem
ents
to
join
tly c
olle
ct a
nd sh
are
data
. •
Hig
her m
anag
emen
t's ro
le a
nd a
utho
rity,
ba
ckgr
ound
, met
hod
of a
ppoi
ntm
ent a
nd re
mov
al,
stan
ding
in th
e go
vern
men
t hie
rarc
hy, p
oliti
cal
inde
pend
ence
, and
pub
lic p
rofil
e ar
e ap
prop
riate
for
him
/her
to p
rovi
de st
atis
tical
pol
icy
advi
ce to
the
gove
rnm
ent,
coor
dina
te th
e st
atis
tical
syst
em, a
nd
• H
ow w
ell d
evel
oped
are
nat
iona
l sta
tistic
al
coor
dina
tion
mec
hani
sms a
nd to
wha
t ext
ent
do th
ey p
rodu
ce th
e en
visa
ged
resu
lts?
• H
ow w
ell c
onsi
dere
d is
the
�dat
a so
urce
s mix
� us
ed b
y st
atis
tical
off
ices
, and
is a
chie
ving
the
best
pos
sibl
e m
ix (a
lso
taki
ng c
ost-
effe
ctiv
enes
s int
o ac
coun
t) a
subj
ect o
f sy
stem
atic
impr
ovem
ent e
ffort?
• Le
gal a
nd in
stitu
tiona
l env
ironm
ent p
erm
its
stat
istic
al a
genc
ies t
o en
ter i
nto
agre
emen
ts to
jo
intly
col
lect
and
shar
e da
ta.
• C
hief
Sta
tistic
ian�
s rol
e an
d au
thor
ity,
back
grou
nd, m
etho
d of
app
oint
men
t and
re
mov
al, s
tand
ing
in th
e go
vern
men
t hi
erar
chy,
pol
itica
l ind
epen
denc
e, a
nd p
ublic
pr
ofile
are
app
ropr
iate
for h
im/h
er to
co
ordi
nate
and
pos
sibl
y be
in c
harg
e of
the
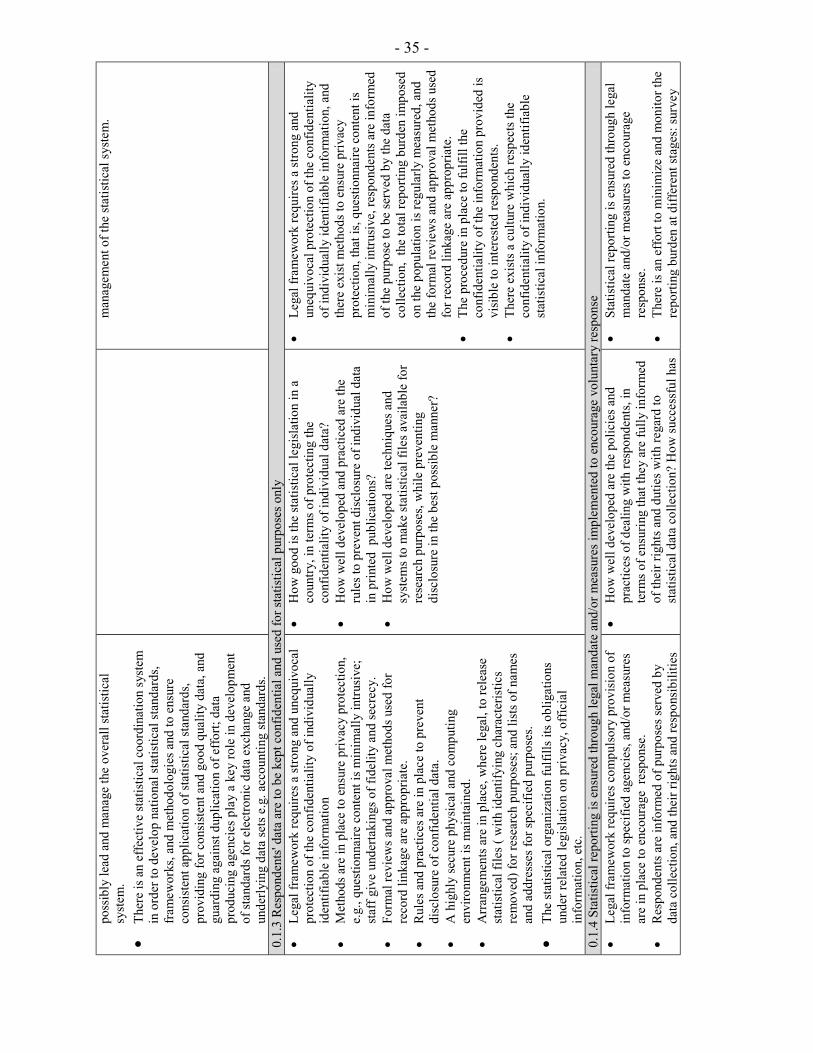
- 35 -
poss
ibly
lead
and
man
age
the
over
all s
tatis
tical
sy
stem
. •
Ther
e is
an
effe
ctiv
e st
atis
tical
coo
rdin
atio
n sy
stem
in
ord
er to
dev
elop
nat
iona
l sta
tistic
al st
anda
rds,
fram
ewor
ks, a
nd m
etho
dolo
gies
and
to e
nsur
e co
nsis
tent
app
licat
ion
of st
atis
tical
stan
dard
s, pr
ovid
ing
for c
onsi
sten
t and
goo
d qu
ality
dat
a, a
nd
guar
ding
aga
inst
dup
licat
ion
of e
ffor
t; da
ta
prod
ucin
g ag
enci
es p
lay
a ke
y ro
le in
dev
elop
men
t of
stan
dard
s for
ele
ctro
nic
data
exc
hang
e an
d un
derly
ing
data
sets
e.g
. acc
ount
ing
stan
dard
s.
man
agem
ent o
f the
stat
istic
al s
yste
m.
0.1.
3 R
espo
nden
ts' d
ata
are
to b
e ke
pt c
onfid
entia
l and
use
d fo
r sta
tistic
al p
urpo
ses o
nly
• Le
gal f
ram
ewor
k re
quire
s a st
rong
and
une
quiv
ocal
pr
otec
tion
of th
e co
nfid
entia
lity
of in
divi
dual
ly
iden
tifia
ble
info
rmat
ion
• M
etho
ds a
re in
pla
ce to
ens
ure
priv
acy
prot
ectio
n,
e.g.
, que
stio
nnai
re c
onte
nt is
min
imal
ly in
trusi
ve;
staf
f giv
e un
derta
king
s of f
idel
ity a
nd se
crec
y.
• Fo
rmal
revi
ews a
nd a
ppro
val m
etho
ds u
sed
for
reco
rd li
nkag
e ar
e ap
prop
riate
. •
Rul
es a
nd p
ract
ices
are
in p
lace
to p
reve
nt
disc
losu
re o
f con
fiden
tial d
ata.
•
A h
ighl
y se
cure
phy
sica
l and
com
putin
g en
viro
nmen
t is m
aint
aine
d.
• A
rran
gem
ents
are
in p
lace
, whe
re le
gal,
to re
leas
e st
atis
tical
file
s ( w
ith id
entif
ying
cha
ract
eris
tics
rem
oved
) for
rese
arch
pur
pose
s; a
nd li
sts o
f nam
es
and
addr
esse
s for
spec
ified
pur
pose
s. •
The
stat
istic
al o
rgan
izat
ion
fulfi
lls it
s obl
igat
ions
un
der r
elat
ed le
gisl
atio
n on
priv
acy,
off
icia
l in
form
atio
n, e
tc.
• H
ow g
ood
is th
e st
atis
tical
legi
slat
ion
in a
co
untry
, in
term
s of p
rote
ctin
g th
e co
nfid
entia
lity
of in
divi
dual
dat
a?
• H
ow w
ell d
evel
oped
and
pra
ctic
ed a
re th
e ru
les t
o pr
even
t dis
clos
ure
of in
divi
dual
dat
a in
prin
ted
pub
licat
ions
? •
How
wel
l dev
elop
ed a
re te
chni
ques
and
sy
stem
s to
mak
e st
atis
tical
file
s ava
ilabl
e fo
r re
sear
ch p
urpo
ses,
whi
le p
reve
ntin
g di
sclo
sure
in th
e be
st p
ossi
ble
man
ner?
• Le
gal f
ram
ewor
k re
quire
s a st
rong
and
un
equi
voca
l pro
tect
ion
of th
e co
nfid
entia
lity
of in
divi
dual
ly id
entif
iabl
e in
form
atio
n, a
nd
ther
e ex
ist m
etho
ds to
ens
ure
priv
acy
prot
ectio
n, th
at is
, que
stio
nnai
re c
onte
nt is
m
inim
ally
intru
sive
, res
pond
ents
are
info
rmed
of
the
purp
ose
to b
e se
rved
by
the
data
co
llect
ion,
the
tota
l rep
ortin
g bu
rden
impo
sed
on th
e po
pula
tion
is re
gula
rly m
easu
red,
and
th
e fo
rmal
revi
ews a
nd a
ppro
val m
etho
ds u
sed
for r
ecor
d lin
kage
are
app
ropr
iate
. •
The
proc
edur
e in
pla
ce to
fulfi
ll th
e co
nfid
entia
lity
of th
e in
form
atio
n pr
ovid
ed is
vi
sibl
e to
inte
rest
ed re
spon
dent
s. •
Ther
e ex
ists
a c
ultu
re w
hich
resp
ects
the
conf
iden
tialit
y of
indi
vidu
ally
iden
tifia
ble
stat
istic
al in
form
atio
n.
0.1.
4 St
atis
tical
repo
rting
is e
nsur
ed th
roug
h le
gal m
anda
te a
nd/o
r mea
sure
s im
plem
ente
d to
enc
oura
ge v
olun
tary
resp
onse
•
Lega
l fra
mew
ork
requ
ires c
ompu
lsor
y pr
ovis
ion
of
info
rmat
ion
to sp
ecifi
ed a
genc
ies,
and/
or m
easu
res
are
in p
lace
to e
ncou
rage
res
pons
e.
• R
espo
nden
ts a
re in
form
ed o
f pur
pose
s ser
ved
by
data
col
lect
ion,
and
thei
r rig
hts a
nd re
spon
sibi
litie
s
• H
ow w
ell d
evel
oped
are
the
polic
ies a
nd
prac
tices
of d
ealin
g w
ith re
spon
dent
s, in
te
rms o
f ens
urin
g th
at th
ey a
re fu
lly in
form
ed
of th
eir r
ight
s and
dut
ies w
ith re
gard
to
stat
istic
al d
ata
colle
ctio
n? H
ow su
cces
sful
has
• St
atis
tical
repo
rting
is e
nsur
ed th
roug
h le
gal
man
date
and
/or m
easu
res t
o en
cour
age
re
spon
se.
• Th
ere
is a
n ef
fort
to m
inim
ize
and
mon
itor t
he
repo
rting
bur
den
at d
iffer
ent s
tage
s: su
rvey

- 36 -
• Th
e to
tal r
epor
ting
burd
en im
pose
d on
the
popu
latio
n is
regu
larly
mea
sure
d an
d ef
forts
mad
e to
re
duce
it to
a m
inim
um th
roug
h sa
mpl
ing,
impr
oved
qu
estio
nnai
re d
esig
n, sh
ort f
orm
s, da
ta im
puta
tion,
us
e of
adm
inis
trativ
e da
ta a
nd o
ther
mea
ns;
resp
onde
nt ro
tatio
n is
use
d to
spre
ad b
urde
n.
• Pr
oced
ures
for m
aint
aini
ng c
onfid
entia
lity
of
info
rmat
ion
prov
ided
are
vis
ible
to in
tere
sted
re
spon
dent
s and
to th
e ge
nera
l pub
lic
• Ef
forts
are
mad
e to
min
imiz
e an
d m
onito
r rep
ortin
g bu
rden
at d
iffer
ent s
tage
s, e.
g., s
urve
y de
sign
; qu
estio
nnai
re d
esig
n/ te
stin
g; d
ecid
ing
colle
ctio
n pr
oced
ures
; and
act
ual i
mpo
sing
of r
espo
nse
on
resp
onde
nts.
•
Effo
rts a
re m
ade
to c
omm
unic
ate
with
resp
onde
nts
on tr
ends
in re
spon
se, a
nd to
neg
otia
te w
ith
gove
rnm
ent o
rgan
izat
ions
, ins
titut
ions
and
larg
e bu
sine
sses
on
resp
onse
arr
ange
men
ts.
• St
atis
tical
syst
em p
rovi
des s
uffic
ient
ly c
ompe
titiv
e sa
larie
s and
con
ditio
ns to
allo
w re
tent
ion
of
com
pete
nt, e
xper
ienc
ed st
aff.
• St
atis
tical
syst
em h
as so
me
guar
ante
e of
con
tinui
ty
of fu
ndin
g fo
r cor
e st
atis
tics a
nd lo
nger
term
de
velo
pmen
t wor
k.
a st
atis
tical
off
ice
been
in sy
stem
atic
ally
re
duci
ng th
e re
spon
se b
urde
n it
impo
ses o
n da
ta p
rovi
ders
?
desi
gnin
g; d
ecid
ing
on c
olle
ctio
n pr
oced
ure;
an
d ac
tual
impo
sing
of r
espo
nse
on
resp
onde
nts.
Ther
e is
als
o an
eff
ort t
o co
mm
unic
ate
with
the
resp
onde
nts o
n th
e tre
nds i
n th
e re
spon
se, a
nd to
neg
otia
te w
ith
gove
rnm
ent o
rgan
izat
ions
, ins
titut
ions
and
la
rge
busi
ness
es o
n re
spon
se a
rran
gem
ents
.
0.2
Res
ourc
es �
Res
ourc
es a
re c
omm
ensu
rate
with
nee
ds o
f sta
tistic
al p
rogr
ams.
0.2.
1 St
aff,
finan
cial
, and
com
putin
g re
sour
ces a
re c
omm
ensu
rate
with
inst
itutio
nal p
rogr
ams.
• St
atis
tical
syst
em h
as a
dequ
ate
staf
f, fi
nanc
ial
reso
urce
s, te
chno
logy
reso
urce
s and
stat
istic
al
syst
ems t
o co
pe w
ith m
ajor
stat
istic
al n
eeds
•
Stat
istic
al sy
stem
has
flex
ibili
ty to
dep
loy
ap
prop
riate
staf
f num
bers
on
each
stat
istic
al
prog
ram
•
Stat
istic
al sy
stem
has
flex
ibili
ty to
allo
cate
fund
s to
prog
ram
s with
in a
n ov
eral
l bud
get
• W
ise
and
care
ful m
anag
emen
t of e
xist
ing
fund
s th
roug
h m
acro
-fin
anci
al re
porti
ng a
nd a
dher
ence
to
finan
cial
pol
icie
s and
pro
cedu
res
• Tr
acki
n g o
f cos
ts, w
orkl
oads
, pro
duct
sale
s, an
d co
st
•
Stat
istic
al sy
stem
can
dep
loy
peop
le a
ccor
ding
to
ove
rall
need
s, an
d ha
s the
full
allo
catio
n au
thor
ity w
ithin
an
over
all b
udge
t to
mee
t br
oad
prio
ritie
s. •
Effo
rt is
mad
e to
mai
ntai
n a
stro
ng c
apac
ity
for c
lient
-spo
nsor
ed a
nd c
lient
-pai
d su
rvey
s.

- 37 -
reco
very
, and
per
form
ance
mea
sure
s •
Stro
ng c
apac
ity m
aint
aine
d fo
r clie
nt-s
pons
ored
and
cl
ient
- pai
d su
rvey
s 0.
2.2
Mea
sure
s to
ensu
re e
ffic
ient
use
of r
esou
rces
are
impl
emen
ted.
•
Effe
ctiv
e hu
man
reso
urce
man
agem
ent a
nd
deve
lopm
ent t
hrou
gh p
artic
ipat
ive
man
agem
ent
prac
tices
; eff
ectiv
e st
aff d
evel
opm
ent,
com
mun
icat
ion
and
info
rmat
ion
shar
ing;
en
cour
agem
ent o
f lea
rnin
g, in
nova
tion,
exc
elle
nce,
an
d a
perf
orm
ance
cul
ture
; and
qua
ntita
tive
track
ing
of k
ey h
uman
reso
urce
stat
istic
s •
Tigh
tly m
anag
ed re
sour
ce m
anag
emen
t sys
tem
in
orde
r to:
avo
id d
uplic
atio
n of
effo
rt, p
rofit
from
sy
nerg
ies,
bene
fit fr
om a
vaila
ble
and
emer
ging
te
chno
logi
es a
nd d
ata
infr
astru
ctur
e (e
.g.,
busi
ness
re
gist
ers)
, and
iden
tify
poss
ible
out
sour
cing
op
portu
nitie
s. •
Age
ncy-
wid
e w
ork
prog
ram
s are
est
ablis
hed
and
regu
larly
mon
itore
d to
ens
ure
reso
urce
s are
al
loca
ted
optim
ally
•
Ana
lysi
s of b
ench
mar
king
mea
sure
s suc
h as
num
ber
of st
atis
ticia
ns p
er 1
0,00
0 of
pop
ulat
ion,
val
ue o
f st
atis
tical
bud
get p
er h
ead
of p
opul
atio
n, c
ost o
f pr
oces
sing
a st
atis
tical
retu
rn (t
rend
s ove
r tim
e,
inte
rnal
and
inte
r-co
untry
com
paris
ons)
. •
Form
al re
view
s of e
ffici
ency
and
eff
ectiv
enes
s of
spec
ific
proc
esse
s and
pro
duct
s are
con
duct
ed fr
om
time
to ti
me
• M
easu
res t
o en
sure
eff
icie
nt u
se o
f res
ourc
es
are
impl
emen
ted.
• M
easu
res t
o en
sure
eff
icie
nt u
se o
f res
ourc
es
are
impl
emen
ted.
0.3
Qua
lity
awar
enes
s � Q
ualit
y is
a c
orne
rsto
ne o
f sta
tistic
al w
ork.
0.
3.1
Proc
esse
s are
in p
lace
to fo
cus o
n qu
ality
. •
Man
agem
ent p
rovi
des a
cle
ar a
nd st
rong
focu
s on
qual
ity a
nd p
rom
otes
wel
l doc
umen
ted
qual
ity
man
agem
ent g
uide
lines
•
A re
ason
able
leve
l of f
undi
ng fo
r met
hodo
logy
re
sear
ch is
ava
ilabl
e, fi
ndin
gs a
re p
ublis
hed,
and
re
sear
ch is
inte
grat
ed w
ith m
etho
dolo
gica
l pra
ctic
e •
Reg
ular
pro
visi
on o
f ana
lytic
al o
utpu
t, es
peci
ally
re
late
d to
pol
icy
issu
es, r
einf
orce
s pub
lic im
age
of
• Is
stat
istic
al q
ualit
y m
anag
emen
t a re
al p
olic
y is
sue
and
are
real
and
syst
emat
ic e
ffor
ts
(incl
udin
g th
e pr
omot
ion
of w
ell d
ocum
ente
d qu
ality
man
agem
ent g
uide
lines
) mad
e to
en
hanc
e th
e qu
ality
of s
tatis
tics?
•
How
act
ivel
y is
a st
atis
tical
age
ncy
invo
lved
in
inte
rnat
iona
l tec
hnic
al a
ssis
tanc
e?
• H
ow w
ell i
s pro
fess
iona
lism
sys
tem
atic
ally
• Ef
fort
is m
ade
by th
e st
atis
tical
syst
em to
m
aint
ain
a ba
lanc
ed a
nd o
pen
appr
oach
to th
e m
easu
rem
ent o
f its
ow
n pe
rfor
man
ce.
• Th
ere
is a
n ef
fect
ive
publ
ic in
form
atio
n ap
proa
ch (w
hich
cou
ld b
e cu
stom
er-s
peci
fic)
to g
uara
ntee
that
the
publ
ic is
aw
are
of th
e im
porta
nce
of th
e st
atis
tical
info
rmat
ion,
and
co
nseq
uent
ly su
ppor
tive
of th
e st
atis
tical
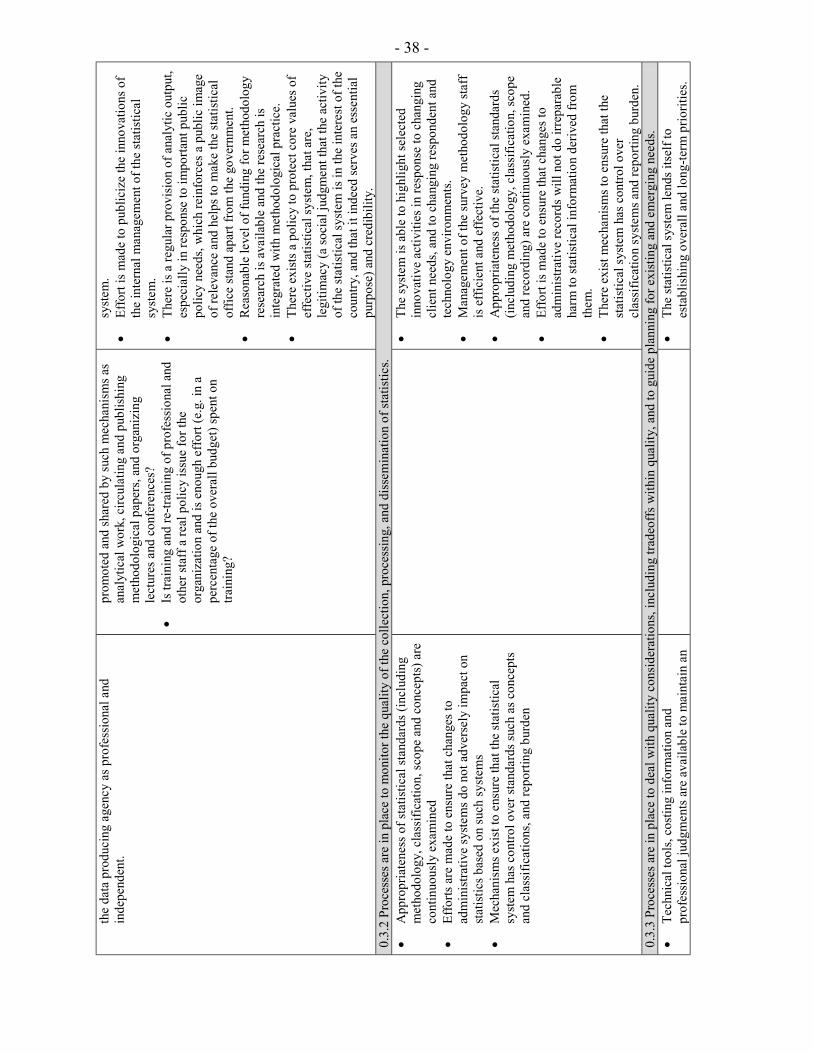
- 38 -
the
data
pro
duci
ng a
genc
y as
pro
fess
iona
l and
in
depe
nden
t.
prom
oted
and
shar
ed b
y su
ch m
echa
nism
s as
anal
ytic
al w
ork,
circ
ulat
ing
and
publ
ishi
ng
met
hodo
logi
cal p
aper
s, an
d or
gani
zing
le
ctur
es a
nd c
onfe
renc
es?
• Is
trai
ning
and
re-tr
aini
ng o
f pro
fess
iona
l and
ot
her s
taff
a re
al p
olic
y is
sue
for t
he
orga
niza
tion
and
is e
noug
h ef
fort
(e.g
. in
a pe
rcen
tage
of t
he o
vera
ll bu
dget
) spe
nt o
n tra
inin
g?
syst
em.
• Ef
fort
is m
ade
to p
ublic
ize
the
inno
vatio
ns o
f th
e in
tern
al m
anag
emen
t of t
he st
atis
tical
sy
stem
. •
Ther
e is
a re
gula
r pro
visi
on o
f ana
lytic
out
put,
espe
cial
ly in
resp
onse
to im
porta
nt p
ublic
po
licy
need
s, w
hich
rein
forc
es a
pub
lic im
age
of re
leva
nce
and
help
s to
mak
e th
e st
atis
tical
of
fice
stan
d ap
art f
rom
the
gove
rnm
ent.
• R
easo
nabl
e le
vel o
f fun
ding
for m
etho
dolo
gy
rese
arch
is a
vaila
ble
and
the
rese
arch
is
inte
grat
ed w
ith m
etho
dolo
gica
l pra
ctic
e.
• Th
ere
exis
ts a
pol
icy
to p
rote
ct c
ore
valu
es o
f ef
fect
ive
stat
istic
al sy
stem
, tha
t are
, le
gitim
acy
(a so
cial
judg
men
t tha
t the
act
ivity
of
the
stat
istic
al sy
stem
is in
the
inte
rest
of t
he
coun
try, a
nd th
at it
inde
ed se
rves
an
esse
ntia
l pu
rpos
e) a
nd c
redi
bilit
y.
0.3.
2 Pr
oces
ses a
re in
pla
ce to
mon
itor t
he q
ualit
y of
the
colle
ctio
n, p
roce
ssin
g, a
nd d
isse
min
atio
n of
stat
istic
s. •
App
ropr
iate
ness
of s
tatis
tical
stan
dard
s (in
clud
ing
met
hodo
logy
, cla
ssifi
catio
n, sc
ope
and
conc
epts
) are
co
ntin
uous
ly e
xam
ined
•
Effo
rts a
re m
ade
to e
nsur
e th
at c
hang
es to
ad
min
istra
tive
syst
ems d
o no
t adv
erse
ly im
pact
on
stat
istic
s bas
ed o
n su
ch s
yste
ms
• M
echa
nism
s exi
st to
ens
ure
that
the
stat
istic
al
syst
em h
as c
ontro
l ove
r sta
ndar
ds su
ch a
s con
cept
s an
d cl
assi
ficat
ions
, and
repo
rting
bur
den
•
The
syst
em is
abl
e to
hig
hlig
ht se
lect
ed
inno
vativ
e ac
tiviti
es in
resp
onse
to c
hang
ing
clie
nt n
eeds
, and
to c
hang
ing
resp
onde
nt a
nd
tech
nolo
gy e
nviro
nmen
ts.
• M
anag
emen
t of t
he su
rvey
met
hodo
logy
staf
f is
eff
icie
nt a
nd e
ffec
tive.
•
App
ropr
iate
ness
of t
he st
atis
tical
stan
dard
s (in
clud
ing
met
hodo
logy
, cla
ssifi
catio
n, sc
ope
and
reco
rdin
g) a
re c
ontin
uous
ly e
xam
ined
. •
Effo
rt is
mad
e to
ens
ure
that
cha
nges
to
adm
inis
trativ
e re
cord
s will
not
do
irrep
arab
le
harm
to st
atis
tical
info
rmat
ion
deriv
ed fr
om
them
. •
Ther
e ex
ist m
echa
nism
s to
ensu
re th
at th
e st
atis
tical
syst
em h
as c
ontro
l ove
r cl
assi
ficat
ion
syst
ems a
nd re
porti
ng b
urde
n.
0.3.
3 Pr
oces
ses a
re in
pla
ce to
dea
l with
qua
lity
cons
ider
atio
ns, i
nclu
ding
trad
eoff
s with
in q
ualit
y, a
nd to
gui
de p
lann
ing
for e
xist
ing
and
emer
ging
nee
ds.
• Te
chni
cal t
ools
, cos
ting
info
rmat
ion
and
prof
essi
onal
judg
men
ts a
re a
vaila
ble
to m
aint
ain
an
•
The
stat
istic
al sy
stem
lend
s its
elf t
o es
tabl
ishi
ng o
vera
ll an
d lo
ng-te
rm p
riorit
ies.

- 39 -
optim
al b
alan
ce b
etw
een
cost
, qua
lity,
and
tim
elin
ess o
f sur
veys
• Te
chni
cal t
ools
and
pro
fess
iona
l jud
gmen
ts
are
avai
labl
e to
mai
ntai
n an
opt
imal
bal
ance
be
twee
n co
st, q
ualit
y an
d tim
elin
ess o
f su
rvey
s. •
Goo
d in
form
atio
n on
pro
ject
cos
ts is
av
aila
ble.
•
A p
lann
ing
syst
em e
xist
s to
brin
g to
geth
er fo
r co
nsid
erat
ion
the
rele
vant
ext
erna
l sig
nals
and
pr
opos
ed in
tern
al re
spon
ses t
o th
em, c
onve
rt th
em in
to in
itiat
ives
that
will
add
ress
the
mos
t im
porta
nt g
aps o
r wea
knes
ses,
and
put
forw
ard
prop
osal
s to
inve
st fo
r im
prov
emen
t. •
Stat
istic
al sy
stem
exp
loits
pos
sibl
e sy
nerg
ies
with
in th
e sy
stem
for a
n ef
ficie
nt u
sage
of
info
rmat
ion.
The
pla
nnin
g de
cisi
ons f
avor
s in
nova
tions
. 1.
Inte
grity
�Th
e pr
inci
ple
of o
bjec
tivity
in th
e co
llect
ion,
pro
cess
ing,
and
diss
emin
atio
n of
stat
istic
s is f
irm
ly a
dher
ed to
. 1.
1 Pr
ofes
siona
lism
� S
tatis
tical
pol
icie
s and
pra
ctic
es a
re g
uide
d by
pro
fess
iona
l prin
cipl
es.
1.1.
1 St
atis
tics a
re c
ompi
led
on a
n im
parti
al b
asis
C
andi
date
SC
B In
dica
tors
D
e V
ries
Indi
cato
rs
Felle
gi In
dica
tors
•
Ther
e ar
e fo
rmal
, wel
l-man
aged
inst
itutio
nal
revi
ews a
nd p
eer r
evie
ws d
esig
ned
to e
nsur
e ob
ject
ivity
, exp
lorin
g al
tern
ativ
es a
nd h
ighl
ight
ing
maj
or fi
ndin
gs w
ithou
t pol
itica
l fea
r or f
avor
. •
Ther
e ex
ists
a p
olic
y to
pro
mot
e an
d pr
otec
t cor
e va
lues
such
as l
egiti
mac
y (th
e st
atis
tical
syst
em a
cts
in th
e co
untry
's be
st in
tere
sts)
and
cre
dibi
lity.
• H
ow w
ell d
o na
tiona
l sta
tistic
al o
ffice
s adh
ere
to th
eir o
blig
atio
n of
impa
rtial
ity?
• H
ow w
ell a
re st
atis
tical
off
ices
shie
lded
from
po
litic
al in
terv
entio
n as
to th
e co
nten
t and
the
rele
ase
of st
atis
tical
resu
lts?
• Th
ere
are
form
al a
nd w
ell-m
anag
ed p
eer
revi
ews a
nd in
stitu
tiona
l rev
iew
s des
igne
d to
en
sure
obj
ectiv
ity, w
hich
invo
lves
exp
lorin
g al
l sid
es o
f an
issu
e, a
void
ing
polic
y ad
voca
cy, s
tatin
g as
sum
ptio
ns, a
nd
high
light
ing
maj
or fi
ndin
gs w
heth
er o
r not
th
ese
refle
ct w
ell o
n th
e cu
rren
t or t
he
prec
edin
g go
vern
men
t.
1.1.
2 C
hoic
es o
f sou
rces
and
stat
istic
al te
chni
ques
are
info
rmed
sole
ly b
y st
atis
tical
con
side
ratio
ns.

- 40 -
• D
ecis
ions
abo
ut su
rvey
des
ign,
surv
ey m
etho
ds,
proc
essi
ng, d
isse
min
atio
n m
etho
ds, a
nd c
omm
enta
ry
abou
t dat
a ar
e m
ade
on th
e ba
sis o
f pro
fess
iona
l ju
dgm
ents
. •
Stat
istic
al m
etho
ds a
re w
ell d
ocum
ente
d an
d m
etho
dolo
gica
l cha
nges
are
mad
e on
the
basi
s of
scie
ntifi
c cr
iteria
. •
A c
ultu
re o
f pro
fess
iona
lism
is sy
stem
atic
ally
pr
omot
ed a
nd sh
ared
thro
ugh
anal
ytic
al w
ork,
ci
rcul
atin
g an
d pu
blis
hing
met
hodo
logy
pap
ers,
orga
nizi
ng le
ctur
es a
nd se
min
ars,
staf
f dev
elop
men
t (in
tern
al a
nd e
xter
nal),
con
tribu
tions
to in
tern
atio
nal
stat
istic
al d
evel
opm
ents
, sha
ring
expe
rienc
es in
st
atis
tical
dev
elop
men
ts w
ith o
ther
cou
ntrie
s, et
c.
• A
re d
ecis
ions
abo
ut su
rvey
des
ign,
surv
ey
met
hods
and
tech
niqu
es e
tc. m
ade
on th
e ba
sis o
f pro
fess
iona
l con
side
ratio
ns (o
r do
othe
r � e
.g. p
oliti
cal �
con
side
ratio
ns p
lay
a ro
le)?
•
Are
met
hodo
logi
cal i
mpr
ovem
ents
mad
e on
th
e ba
sis o
f sci
entif
ic c
riter
ia?
1.1.
3 Th
e ap
prop
riate
stat
istic
al e
ntity
is e
ntitl
ed to
com
men
t on
erro
neou
s int
erpr
etat
ion
and
mis
use
of st
atis
tics.
• Th
e or
gani
zatio
n re
spon
ds in
a p
rofe
ssio
nal,
obje
ctiv
e an
d po
sitiv
e m
anne
r to
info
rmed
crit
icis
m
of st
atis
tics a
nd c
ases
of m
isus
e of
stat
istic
s.
• H
ow w
ell a
nd sy
stem
atic
ally
do
stat
istic
al
offic
es e
duca
te th
eir k
ey u
sers
in o
rder
to
prom
ote
prop
er u
se o
f sta
tistic
s and
to p
reve
nt
mis
use?
1.2
Tran
spar
ency
� S
tatis
tical
pol
icie
s and
pra
ctic
es a
re tr
ansp
aren
t. 1.
2.1
The
term
s and
con
ditio
ns u
nder
whi
ch st
atis
tics a
re c
olle
cted
, pro
cess
ed, a
nd d
isse
min
ated
are
ava
ilabl
e to
the
publ
ic.
• Th
ere
is a
cle
ar st
atem
ent o
f rol
es a
nd fu
nctio
ns o
f da
ta p
rodu
cing
age
ncie
s, bo
th in
legi
slat
ion
and
in
othe
r pub
licly
ava
ilabl
e do
cum
ents
. •
The
stat
istic
al p
lann
ing
proc
ess i
s tra
nspa
rent
. •
Effe
ctiv
e pu
blic
info
rmat
ion
prog
ram
s enc
oura
ge
publ
ic a
war
enes
s of t
he im
porta
nce
of st
atis
tical
in
form
atio
n, a
nd su
ppor
t for
the
stat
istic
al s
yste
m.
•
Stat
istic
al p
lann
ing
proc
ess i
s tra
nspa
rent
.
1.2.
2 In
tern
al g
over
nmen
tal a
cces
s to
stat
istic
s prio
r to
thei
r rel
ease
is p
ublic
ly id
entif
ied.
•
Any
arr
ange
men
ts fo
r ear
ly in
tern
al g
over
nmen
t ac
cess
are
tran
spar
ent.
1.2.
3 Pr
oduc
ts o
f sta
tistic
al a
genc
ies/
units
are
cle
arly
iden
tifie
d as
such
. •
The
sour
ce o
f all
offic
ial s
tatis
tical
pro
duct
s is
clea
rly id
entif
ied.
1.2.
4. A
dvan
ce n
otic
e is
giv
en o
f maj
or c
hang
es in
met
hodo
logy
, sou
rce
data
, and
stat
istic
al te
chni
ques
.

- 41 -
• M
ajor
cha
nges
in m
etho
ds a
nd so
urce
s are
not
ified
to
use
rs a
nd th
e ge
nera
l pub
lic w
ith a
dequ
ate
adva
nce
notic
e.
1.3
Ethi
cal s
tand
ards
� P
olic
ies a
nd p
ract
ices
are
gui
ded
by e
thic
al st
anda
rds.
1.3.
1 G
uide
lines
for s
taff
beh
avio
r are
in p
lace
and
are
wel
l kno
wn
to th
e st
aff.
•
Com
preh
ensi
ve g
uide
lines
for s
taff
beh
avio
r are
ac
tivel
y pr
omot
ed in
staf
f ind
uctio
n an
d tra
inin
g co
urse
s and
in st
aff m
anua
ls
• Th
ere
exis
ts a
cul
ture
that
resp
ects
and
abs
olut
ely
guar
ante
es th
e co
nfid
entia
lity
of in
divi
dual
id
entif
iabl
e st
atis
tical
info
rmat
ion
•
Ther
e is
an
activ
e pr
ogra
m o
f tra
inin
g fo
r in
terv
iew
ers a
nd st
aff w
ith si
gnifi
cant
con
tact
with
th
e pu
blic
, to
help
fost
er g
ood
rela
tions
with
re
spon
dent
s and
mai
ntai
n th
eir t
rust
and
co
oper
atio
n.
•
Ther
e is
an
activ
e pr
ogra
m o
f tra
inin
g in
terv
iew
ers f
or �d
oors
tep
dipl
omac
y,� w
hich
he
lps t
o m
aint
ain
good
rela
tions
hip
with
the
resp
onde
nts.
2. M
etho
dolo
gica
l sou
ndne
ss �
The
met
hodo
logi
cal b
asis
for t
he st
atist
ics f
ollo
ws in
tern
atio
nally
acc
epte
d sta
ndar
ds, g
uide
lines
, or g
ood
prac
tices
. 2.
1 C
once
pts a
nd d
efin
ition
s � C
once
pts a
nd d
efin
ition
s are
in a
ccor
d wi
th in
tern
atio
nally
acc
epte
d sta
tistic
al fr
amew
orks
. 2.
1.1
The
over
all s
truct
ure
in te
rms o
f con
cept
s and
def
initi
ons f
ollo
ws i
nter
natio
nally
acc
epte
d st
anda
rds,
guid
elin
es, o
r goo
d pr
actic
es.
Can
dida
te S
CB
Indi
cato
rs
De
Vri
es In
dica
tors
Fe
llegi
Indi
cato
rs
• In
tern
atio
nal s
tatis
tical
con
cept
s and
def
initi
ons (
or
conc
epts
clo
sely
link
ed to
inte
rnat
iona
l sta
ndar
ds)
are
used
thro
ugho
ut th
e st
atis
tical
syst
em a
nd a
re
activ
ely
prom
oted
•
Com
mon
con
cept
ual f
ram
ewor
ks a
re u
sed
as fa
r as
poss
ible
, and
eff
orts
are
mad
e to
cre
ate
such
fr
amew
orks
whe
re th
ey d
o no
t exi
st.
• H
ow w
ell d
oes a
stat
istic
al s
yste
m a
dher
e to
ag
reed
inte
rnat
iona
l sta
ndar
ds a
nd d
oes i
t co
ntrib
ute
to th
e be
st o
f its
abi
litie
s to
the
furth
er d
evel
opm
ent a
nd p
rom
ulga
tion
of b
est
stat
istic
al p
ract
ices
?
• C
omm
on c
once
ptua
l fra
mew
orks
are
use
d w
here
they
exi
st, a
nd th
ere
are
effo
rts to
cr
eate
such
fram
ewor
ks if
they
do
not e
xist
.
2.2
Scop
e �
The
scop
e is
in a
ccor
d wi
th in
tern
atio
nally
acc
epte
d sta
ndar
ds, g
uide
lines
, or g
ood
prac
tices
. 2.
2.1
The
scop
e is
bro
adly
con
sist
ent w
ith in
tern
atio
nally
acc
epte
d st
anda
rds,
guid
elin
es, o
r goo
d pr
actic
es.
• Th
e sc
ope
of su
rvey
s/ce
nsus
es a
dopt
s int
erna
tiona
l st
anda
rds w
here
they
exi
st, o
r int
erna
tiona
l gu
idel
ines
and
goo
d pr
actic
es.
2.3
Cla
ssifi
catio
n/se
ctor
izat
ion
� Cl
assi
ficat
ion
and
sect
oriz
atio
n sy
stem
s are
in a
ccor
d wi
th in
tern
atio
nally
acc
epte
d sta
ndar
ds, g
uide
lines
, or g
ood
prac
tices
. 2.
3.1
Cla
ssifi
catio
n/se
ctor
izat
ion
syst
ems u
sed
are
broa
dly
cons
iste
nt w
ith in
tern
atio
nally
acc
epte
d

- 42 -
• In
tern
atio
nal c
lass
ifica
tions
and
sect
oriz
atio
n sy
stem
s (or
syst
ems a
nd g
uide
lines
clo
sely
link
ed to
in
tern
atio
nal c
lass
ifica
tions
) are
use
d th
roug
hout
the
stat
istic
al sy
stem
and
are
act
ivel
y pr
omot
ed.
•
Stan
dard
var
iabl
es a
nd c
lass
ifica
tion
syst
ems
are
used
.
2.4
Basis
for
reco
rdin
g �
Flow
s and
stoc
ks a
re v
alue
d an
d re
cord
ed a
ccor
ding
to in
tern
atio
nally
acc
epte
d sta
ndar
ds, g
uide
lines
, or g
ood
prac
tices
. 2.
4.1.
Mar
ket p
rices
are
use
d to
val
ue fl
ows a
nd st
ocks
.
2.4.
2. R
ecor
ding
is d
one
on a
n ac
crua
l bas
is.
2.
4.3.
Gro
ssin
g/ne
tting
pro
cedu
res a
re b
road
ly c
onsi
sten
t with
inte
rnat
iona
lly a
ccep
ted
stan
dard
s, gu
idel
ines
, or g
ood
prac
tices
.
3. A
ccur
acy
and
relia
bilit
y �
Sour
ce d
ata
and
statis
tical
tech
niqu
es a
re so
und
and
statis
tical
out
puts
suffi
cien
tly p
ortr
ay re
ality
. 3.
1 So
urce
dat
a �
Sour
ce d
ata
avai
labl
e pr
ovid
e an
ade
quat
e ba
sis to
com
pile
stat
istic
s. 3.
1.1
Sour
ce d
ata
are
colle
cted
from
com
preh
ensi
ve d
ata
colle
ctio
n pr
ogra
ms t
hat t
ake
into
acc
ount
cou
ntry
-spe
cific
con
ditio
ns.
Can
dida
te S
CB
Indi
cato
rs
De
Vri
es In
dica
tors
Fe
llegi
Indi
cato
rs
• A
wid
e ra
nge
of a
ppro
pria
te a
nd re
leva
nt so
urce
da
ta a
re a
vaila
ble
from
cen
suse
s, su
rvey
s and
ad
min
istra
tive
reco
rds,
and
thes
e da
ta a
nd th
eir
unde
rlyin
g sy
stem
s tak
e ac
coun
t of c
ount
ry-s
peci
fic
cond
ition
s. •
Ther
e is
an
appr
opria
te m
ix o
f dat
a so
urce
s so
that
th
ere
is a
n ev
en d
evel
opm
ent a
cros
s-th
e -b
oard
of
data
sour
ces.
• A
ppro
pria
te u
se is
mad
e of
adm
inis
trativ
e da
ta ,
with
nec
essa
ry a
djus
tmen
ts fo
r diff
ere n
ces i
n co
ncep
ts e
tc.
3.1.
2 So
urce
dat
a re
ason
ably
app
roxi
mat
e th
e de
finiti
ons,
scop
e, c
lass
ifica
tions
, val
uatio
n, a
nd ti
me
of re
cord
ing
requ
ired.
•
The
sour
ce d
ata
are
com
pile
d ac
cord
ing
to
inte
rnat
iona
l sta
ndar
ds, o
r sta
ndar
ds th
at a
re c
lose
ly
linke
d to
inte
rnat
iona
l sta
ndar
ds, o
r acc
epta
ble
guid
elin
es; s
ourc
e da
ta a
re c
onsi
sten
t with
ove
rall
fram
ewor
ks, e
.g.,
the
Syste
m o
f Nat
iona
l Acc
ount
s 19
93; u
sers
are
invo
lved
in m
ajor
met
hodo
logi
cal
and
conc
eptu
al c
hang
es.
3.1.
3 So
urce
dat
a ar
e tim
ely.

- 43 -
• So
urce
dat
a ar
e av
aila
ble
in a
suff
icie
ntly
tim
ely
fash
ion
to m
eet n
eeds
or e
xter
nal u
sers
(and
inte
rnal
us
ers w
here
dat
a fo
rm p
art o
f an
over
all f
ram
ewor
k).
3.2
Stat
istic
al te
chni
ques
� S
tatis
tical
tech
niqu
es e
mpl
oyed
con
form
to so
und
statis
tical
pro
cedu
res.
3.2.
1 D
ata
com
pila
tion
empl
oys s
ound
stat
istic
al te
chni
ques
. •
Com
mon
, sta
ndar
dize
d co
llect
ion
and
proc
essi
ng
met
hods
are
use
d as
far a
s pos
sibl
e.
• Ef
ficie
nt a
nd e
ffec
tive
stat
istic
al a
nd d
ata
man
agem
ent p
ract
ices
are
use
d at
all
stag
es,
incl
udin
g ef
fect
ive
use
of re
leva
nt e
xist
ing
and
emer
ging
tech
nolo
gies
•
A ra
nge
of c
ompa
rabi
lity
(ove
r tim
e) a
nd in
tern
al
cons
iste
ncy
edits
are
app
lied.
•
Com
mon
col
lect
ion
and
proc
essi
ng
met
hodo
logi
es a
re u
sed.
3.2.
2 O
ther
stat
istic
al p
roce
dure
s (e.
g., d
ata
adju
stm
ents
and
tran
sfor
mat
ions
, and
stat
istic
al a
naly
sis)
em
ploy
soun
d st
atis
tical
tech
niqu
es.
• St
atis
tical
ly v
alid
met
hods
are
use
d to
adj
ust d
ata
from
alte
rnat
ive
sour
ces,
and/
or to
impu
te d
ata
com
pile
d on
alte
rnat
ive
base
s. •
Dat
a an
alys
is le
ads t
o de
velo
pmen
t of n
ew m
easu
res
from
exi
stin
g da
ta, a
dded
val
ue a
nd im
prov
ed
qual
ity.
3.3
Ass
essm
ent a
nd v
alid
atio
n of
sour
ce d
ata
� So
urce
dat
a ar
e re
gula
rly a
sses
sed
and
valid
ated
. 3.
3.1
Sour
ce d
ata�
incl
udin
g ce
nsus
es, s
ampl
e su
rvey
s and
adm
inis
trativ
e re
cord
s�ar
e ro
utin
ely
asse
ssed
, e.g
., fo
r cov
erag
e, sa
mpl
e er
ror,
resp
onse
err
ors,
and
non-
sam
plin
g er
ror;
the
resu
lts o
f the
ass
essm
ents
are
mon
itore
d an
d m
ade
avai
labl
e to
gui
de p
lann
ing.
•
Sour
ce d
ata
are
regu
larly
val
idat
ed to
ens
ure
acce
ptab
le c
over
age,
con
cept
s, an
d ac
cura
cy (e
.g.,
in
term
s of e
rror
s fro
m sa
mpl
ing,
resp
onse
and
oth
er
non-
sam
plin
g er
ror)
. •
Effe
ctiv
e co
ntin
uing
con
tact
is m
ade
with
age
ncie
s fr
om w
hich
adm
inis
trativ
e da
ta a
re o
btai
ned,
to
ensu
re c
ontin
uing
relia
bilit
y of
dat
a an
d to
exp
lore
po
ssib
le fu
rther
use
of a
dmin
istra
tive
data
. •
Res
ults
of a
sses
smen
ts a
re a
vaila
ble
to u
sers
and
to
guid
e pl
anni
ng o
f fut
ure
surv
eys.
•
In o
rder
to m
aint
ain
accu
racy
in st
atis
tical
in
form
atio
n, so
urce
dat
a�in
clud
ing
cens
uses
, sa
mpl
e su
rvey
s and
adm
inis
trativ
e re
cord
s�ar
e ro
utin
ely
asse
ssed
, e.g
., fo
r cov
erag
e,
sam
ple
erro
r, re
spon
se e
rror
, and
non
-sa
mpl
ing
erro
r; th
e re
sults
of t
he a
sses
smen
ts
are
mon
itore
d an
d m
ade
avai
labl
e to
gui
de
plan
ning
.
3.4
Ass
essm
ent a
nd v
alid
atio
n of
inte
rmed
iate
dat
a an
d st
atist
ical
out
puts
� In
term
edia
te re
sults
and
stat
istic
al o
utpu
ts ar
e re
gula
rly a
sses
sed
and
valid
ated
. 3.
4.1
Mai
n in
term
edia
te d
ata
are
valid
ated
aga
inst
oth
er in
form
atio
n w
here
app
licab
le.
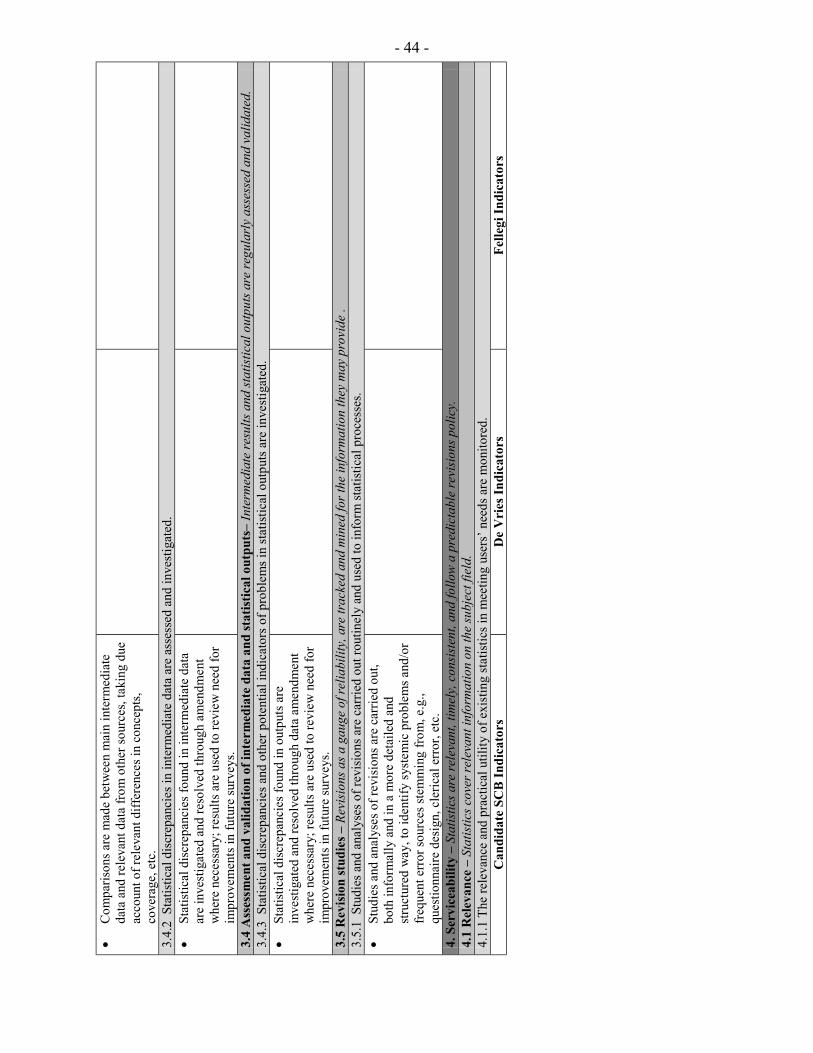
- 44 -
• C
ompa
rison
s are
mad
e be
twee
n m
ain
inte
rmed
iate
da
ta a
nd re
leva
nt d
ata
from
oth
er so
urce
s, ta
king
due
ac
coun
t of r
elev
ant d
iffer
ence
s in
conc
epts
, co
vera
ge, e
tc.
3.4.
2 S
tatis
tical
dis
crep
anci
es in
inte
rmed
iate
dat
a ar
e as
sess
ed a
nd in
vest
igat
ed.
• St
atis
tical
dis
crep
anci
es fo
und
in in
term
edia
te d
ata
are
inve
stig
ated
and
reso
lved
thro
ugh
amen
dmen
t w
here
nec
essa
ry; r
esul
ts a
re u
sed
to re
view
nee
d fo
r im
prov
emen
ts in
futu
re su
rvey
s.
3.4
Ass
essm
ent a
nd v
alid
atio
n of
inte
rmed
iate
dat
a an
d st
atist
ical
out
puts
� In
term
edia
te re
sults
and
stat
istic
al o
utpu
ts ar
e re
gula
rly a
sses
sed
and
valid
ated
. 3.
4.3
Sta
tistic
al d
iscr
epan
cies
and
oth
er p
oten
tial i
ndic
ator
s of p
robl
ems i
n st
atis
tical
out
puts
are
inve
stig
ated
. •
Stat
istic
al d
iscr
epan
cies
foun
d in
out
puts
are
in
vest
igat
ed a
nd re
solv
ed th
roug
h da
ta a
men
dmen
t w
here
nec
essa
ry; r
esul
ts a
re u
sed
to re
view
nee
d fo
r im
prov
emen
ts in
futu
re su
rvey
s.
3.5
Rev
ision
stud
ies �
Rev
isio
ns a
s a g
auge
of r
elia
bilit
y, a
re tr
acke
d an
d m
ined
for t
he in
form
atio
n th
ey m
ay p
rovi
de .
3.5.
1 S
tudi
es a
nd a
naly
ses o
f rev
isio
ns a
re c
arrie
d ou
t rou
tinel
y an
d us
ed to
info
rm st
atis
tical
pro
cess
es.
• St
udie
s and
ana
lyse
s of r
evis
ions
are
car
ried
out,
both
info
rmal
ly a
nd in
a m
ore
deta
iled
and
stru
ctur
ed w
ay, t
o id
entif
y sy
stem
ic p
robl
ems a
nd/o
r fr
eque
nt e
rror
sour
ces s
tem
min
g fr
om, e
.g.,
ques
tionn
aire
des
ign,
cle
rical
err
or, e
tc.
4. S
ervi
ceab
ility
� S
tatis
tics a
re re
leva
nt, t
imel
y, c
onsis
tent
, and
follo
w a
pred
icta
ble
revi
sions
pol
icy.
4.
1 R
elev
ance
� S
tatis
tics c
over
rele
vant
info
rmat
ion
on th
e su
bjec
t fie
ld.
4.1.
1 Th
e re
leva
nce
and
prac
tical
util
ity o
f exi
stin
g st
atis
tics i
n m
eetin
g us
ers�
nee
ds a
re m
onito
red.
C
andi
date
SC
B In
dica
tors
D
e V
ries
Indi
cato
rs
Felle
gi In
dica
tors
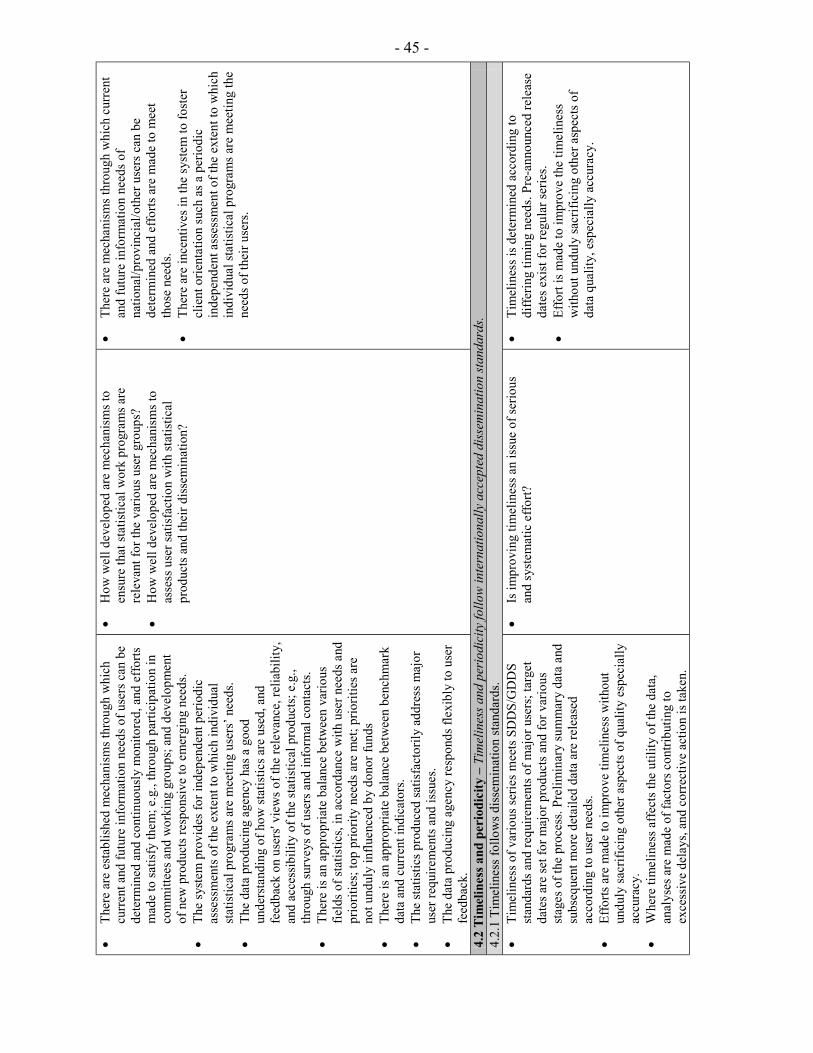
- 45 -
• Th
ere
are
esta
blis
hed
mec
hani
sms t
hrou
gh w
hich
cu
rren
t and
futu
re in
form
atio
n ne
eds o
f use
rs c
an b
e de
term
ined
and
con
tinuo
usly
mon
itore
d, a
nd e
ffor
ts
mad
e to
satis
fy th
em; e
.g.,
thro
ugh
parti
cipa
tion
in
com
mitt
ees a
nd w
orki
ng g
roup
s; a
nd d
evel
opm
ent
of n
ew p
rodu
cts r
espo
nsiv
e to
em
ergi
ng n
eeds
. •
The
syst
em p
rovi
des f
or in
depe
nden
t per
iodi
c as
sess
men
ts o
f the
ext
ent t
o w
hich
indi
vidu
al
stat
istic
al p
rogr
ams a
re m
eetin
g us
ers�
nee
ds.
• Th
e da
ta p
rodu
cing
age
ncy
has a
goo
d un
ders
tand
ing
of h
ow st
atis
tics a
re u
sed,
and
fe
edba
ck o
n us
ers'
view
s of t
he re
leva
nce,
relia
bilit
y,
and
acce
ssib
ility
of t
he st
atis
tical
pro
duct
s; e
.g.,
thro
ugh
surv
eys o
f use
rs a
nd in
form
al c
onta
cts.
• Th
ere
is a
n ap
prop
riate
bal
ance
bet
wee
n va
rious
fie
lds o
f sta
tistic
s, in
acc
orda
nce
with
use
r nee
ds a
nd
prio
ritie
s; to
p pr
iorit
y ne
eds a
re m
et; p
riorit
ies a
re
not u
ndul
y in
fluen
ced
by d
onor
fund
s •
Ther
e is
an
appr
opria
te b
alan
ce b
etw
een
benc
hmar
k da
ta a
nd c
urre
nt in
dica
tors
. •
The
stat
istic
s pro
duce
d sa
tisfa
ctor
ily a
ddre
ss m
ajor
us
er re
quire
men
ts a
nd is
sues
. •
The
data
pro
duci
ng a
genc
y re
spon
ds fl
exib
ly to
use
r fe
edba
ck.
• H
ow w
ell d
evel
oped
are
mec
hani
sms t
o en
sure
that
stat
istic
al w
ork
prog
ram
s are
re
leva
nt fo
r the
var
ious
use
r gro
ups?
•
How
wel
l dev
elop
ed a
re m
echa
nism
s to
asse
ss u
ser s
atis
fact
ion
with
stat
istic
al
prod
ucts
and
thei
r dis
sem
inat
ion?
• Th
ere
are
mec
hani
sms t
hrou
gh w
hich
cur
rent
an
d fu
ture
info
rmat
ion
need
s of
natio
nal/p
rovi
ncia
l/oth
er u
sers
can
be
dete
rmin
ed a
nd e
fforts
are
mad
e to
mee
t th
ose
need
s. •
Ther
e ar
e in
cent
ives
in th
e sy
stem
to fo
ster
cl
ient
orie
ntat
ion
such
as a
per
iodi
c in
depe
nden
t ass
essm
ent o
f the
ext
ent t
o w
hich
in
divi
dual
stat
istic
al p
rogr
ams a
re m
eetin
g th
e ne
eds o
f the
ir us
ers.
4.2
Tim
elin
ess a
nd p
erio
dici
ty �
Tim
elin
ess a
nd p
erio
dici
ty fo
llow
inte
rnat
iona
lly a
ccep
ted
diss
emin
atio
n sta
ndar
ds.
4.2.
1 Ti
mel
ines
s fol
low
s dis
sem
inat
ion
stan
dard
s. •
Tim
elin
ess o
f var
ious
serie
s mee
ts S
DD
S/G
DD
S st
anda
rds a
nd re
quire
men
ts o
f maj
or u
sers
; tar
get
date
s are
set f
or m
ajor
pro
duct
s and
for v
ario
us
stag
es o
f the
pro
cess
. Pre
limin
ary
sum
mar
y da
ta a
nd
subs
eque
nt m
ore
deta
iled
data
are
rele
ased
ac
cord
ing
to u
ser n
eeds
. •
Effo
rts a
re m
ade
to im
prov
e tim
elin
ess w
ithou
t un
duly
sacr
ifici
ng o
ther
asp
ects
of q
ualit
y es
peci
ally
ac
cura
cy.
• W
here
tim
elin
ess a
ffec
ts th
e ut
ility
of t
he d
ata,
an
alys
es a
re m
ade
of fa
ctor
s con
tribu
ting
to
exce
ssiv
e de
lays
, and
cor
rect
ive
actio
n is
take
n.
• Is
impr
ovin
g tim
elin
ess a
n is
sue
of se
rious
an
d sy
stem
atic
effo
rt?
• Ti
mel
ines
s is d
eter
min
ed a
ccor
ding
to
diffe
ring
timin
g ne
eds.
Pre-
anno
unce
d re
leas
e da
tes e
xist
for r
egul
ar se
ries.
•
Effo
rt is
mad
e to
impr
ove
the
timel
ines
s w
ithou
t und
uly
sacr
ifici
ng o
ther
asp
ects
of
data
qua
lity,
esp
ecia
lly a
ccur
acy.
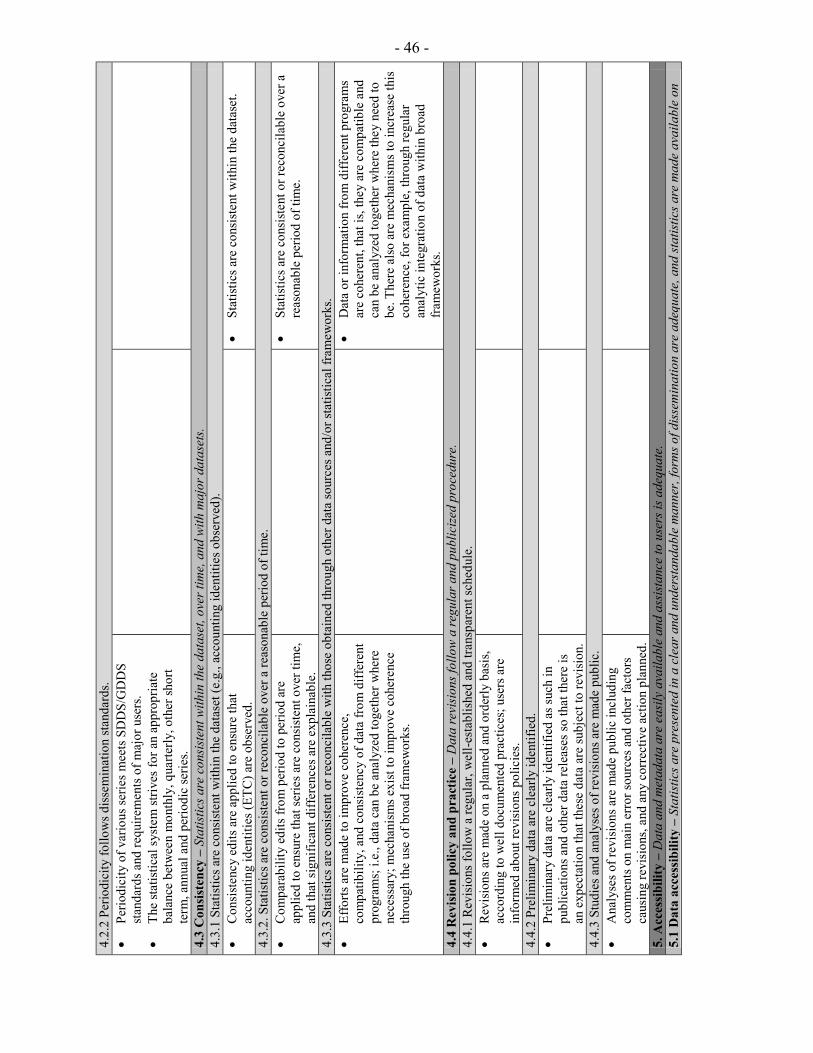
- 46 -
4.2.
2 Pe
riodi
city
follo
ws d
isse
min
atio
n st
anda
rds.
• Pe
riodi
city
of v
ario
us se
ries m
eets
SD
DS/
GD
DS
stan
dard
s and
requ
irem
ents
of m
ajor
use
rs.
• Th
e st
atis
tical
syst
em st
rives
for a
n ap
prop
riate
ba
lanc
e be
twee
n m
onth
ly, q
uarte
rly, o
ther
shor
t te
rm, a
nnua
l and
per
iodi
c se
ries.
4.3
Con
siste
ncy
� St
atist
ics a
re c
onsis
tent
with
in th
e da
tase
t, ov
er ti
me,
and
with
maj
or d
atas
ets.
4.3.
1 St
atis
tics a
re c
onsi
sten
t with
in th
e da
tase
t (e.
g., a
ccou
ntin
g id
entit
ies o
bser
ved)
. •
Con
sist
ency
edi
ts a
re a
pplie
d to
ens
ure
that
ac
coun
ting
iden
titie
s (ET
C) a
re o
bser
ved.
• St
atis
tics a
re c
onsi
sten
t with
in th
e da
tase
t.
4.3.
2. S
tatis
tics a
re c
onsi
sten
t or r
econ
cila
ble
over
a re
ason
able
per
iod
of ti
me.
•
Com
para
bilit
y ed
its fr
om p
erio
d to
per
iod
are
appl
ied
to e
nsur
e th
at se
ries a
re c
onsi
sten
t ove
r tim
e,
and
that
sign
ifica
nt d
iffer
ence
s are
exp
lain
able
.
•
Stat
istic
s are
con
sist
ent o
r rec
onci
labl
e ov
er a
re
ason
able
per
iod
of ti
me.
4.3.
3 St
atis
tics a
re c
onsi
sten
t or r
econ
cila
ble
with
thos
e ob
tain
ed th
roug
h ot
her d
ata
sour
ces a
nd/o
r sta
tistic
al fr
amew
orks
. •
Effo
rts a
re m
ade
to im
prov
e co
here
nce,
co
mpa
tibili
ty, a
nd c
onsi
sten
cy o
f dat
a fr
om d
iffer
ent
prog
ram
s; i.
e., d
ata
can
be a
naly
zed
toge
ther
whe
re
nece
ssar
y; m
echa
nism
s exi
st to
impr
ove
cohe
renc
e th
roug
h th
e us
e of
bro
ad fr
amew
orks
.
•
Dat
a or
info
rmat
ion
from
diff
eren
t pro
gram
s ar
e co
here
nt, t
hat i
s, th
ey a
re c
ompa
tible
and
ca
n be
ana
lyze
d to
geth
er w
here
they
nee
d to
be
. The
re a
lso
are
mec
hani
sms t
o in
crea
se th
is
cohe
renc
e, fo
r exa
mpl
e, th
roug
h re
gula
r an
alyt
ic in
tegr
atio
n of
dat
a w
ithin
bro
ad
fram
ewor
ks.
4.4
Rev
ision
pol
icy
and
prac
tice
� D
ata
revi
sions
follo
w a
regu
lar a
nd p
ublic
ized
proc
edur
e.
4.4.
1 R
evis
ions
follo
w a
regu
lar,
wel
l-est
ablis
hed
and
trans
pare
nt sc
hedu
le.
• R
evis
ions
are
mad
e on
a p
lann
ed a
nd o
rder
ly b
asis
, ac
cord
ing
to w
ell d
ocum
ente
d pr
actic
es; u
sers
are
in
form
ed a
bout
revi
sion
s pol
icie
s.
4.4.
2 Pr
elim
inar
y da
ta a
re c
lear
ly id
entif
ied.
•
Prel
imin
ary
data
are
cle
arly
iden
tifie
d as
such
in
publ
icat
ions
and
oth
er d
ata
rele
ases
so th
at th
ere
is
an e
xpec
tatio
n th
at th
ese
data
are
subj
ect t
o re
visi
on.
4.4.
3 St
udie
s and
ana
lyse
s of r
evis
ions
are
mad
e pu
blic
. •
Ana
lyse
s of r
evis
ions
are
mad
e pu
blic
incl
udin
g co
mm
ents
on
mai
n er
ror s
ourc
es a
nd o
ther
fact
ors
caus
ing
revi
sion
s, an
d an
y co
rrec
tive
actio
n pl
anne
d.
5. A
cces
sibi
lity
� D
ata
and
met
adat
a ar
e ea
sily
avai
labl
e an
d as
sista
nce
to u
sers
is a
dequ
ate.
5.
1 D
ata
acce
ssib
ility
� S
tatis
tics a
re p
rese
nted
in a
cle
ar a
nd u
nder
stand
able
man
ner,
form
s of d
issem
inat
ion
are
adeq
uate
, and
stat
istic
s are
mad
e av
aila
ble
on

- 47 -
an im
parti
al b
asis.
5.
1.1
Stat
istic
s are
pre
sent
ed in
a w
ay th
at fa
cilit
ates
pro
per i
nter
pret
atio
n an
d m
eani
ngfu
l com
paris
ons (
layo
ut a
nd c
larit
y of
text
, tab
les,
and
char
ts).
Can
dida
te S
CB
Indi
cato
rs
De
Vri
es In
dica
tors
Fe
llegi
Indi
cato
rs
• D
isse
min
ated
dat
a ar
e pr
ofes
sion
ally
pre
sent
ed,
incl
udin
g cl
ear t
able
s, ch
arts
, tex
t mat
eria
l, cr
oss
refe
renc
e to
rela
ted
data
, etc
. •
Suita
ble
anal
ytic
al to
ols a
re p
rovi
ded
whe
re
appr
opria
te (e
.g.,
data
bas
e m
anag
emen
t and
m
appi
ng to
ols)
•
Dat
a an
alys
is a
nd in
terp
reta
tion
is o
bjec
tive
and
non-
polit
ical
.
•
Ther
e ar
e m
echa
nism
s to
mee
t clie
nt-s
peci
fic
diss
emin
atio
n re
quire
men
ts fo
r the
go
vern
men
t, ge
nera
l pub
lic (g
ener
alis
t with
a
broa
d in
tere
st, a
cade
mic
rese
arch
ers,
stud
ents
, an
d sp
ecia
l int
eres
t gro
ups)
and
bus
ines
s cl
ient
s.
5.1.
2 D
isse
min
atio
n m
edia
and
form
ats a
re a
dequ
ate.
•
Dat
a an
d m
etad
ata
are
avai
labl
e on
a ra
nge
of
diss
emin
atio
n m
edia
incl
udin
g pu
blic
atio
ns, C
D-
RO
M, d
iske
ttes,
web
site
s, em
ail,
tele
phon
e, m
ail,
med
ia re
leas
es, l
ibra
ries,
and,
whe
re a
ppro
pria
te,
emer
ging
tech
nolo
gies
. •
Acc
ess p
oint
s for
clie
nts a
re w
ell a
dver
tised
and
in
clud
e ce
ntra
l and
regi
onal
off
ices
of d
ata
prod
ucin
g ag
enci
es, a
nd li
brar
ies
• Pr
ovis
ion
of a
cces
s is a
ffor
dabl
e an
d co
nven
ient
to
diffe
rent
use
r gro
ups,
taki
ng a
ccou
nt o
f var
ying
fa
cilit
ies a
vaila
ble.
•
In g
ener
al, u
sers
are
cha
rged
the
sam
e pr
ice
for
spec
ific
stat
istic
al p
rodu
cts;
exc
eptio
ns a
re li
mite
d to
def
ined
cla
sses
of u
sers
(e.g
., go
vern
men
t ag
enci
es, m
edia
, lib
rarie
s) u
nder
cle
arly
spec
ified
cr
iteria
. •
The
impo
rtanc
e of
the
med
ia in
dat
a di
ssem
inat
ion
is re
cogn
ized
thro
ugh
med
ia c
onfe
renc
es, m
edia
re
leas
es, e
tc. ;
wid
espr
ead
med
ia c
over
age
of d
ata
rele
ases
is a
ctiv
ely
enco
urag
ed.
•
Clie
nts h
ave
a si
ngle
poi
nt o
f acc
ess a
s wel
l as
effe
ctiv
e to
ols a
nd m
otiv
atio
n to
car
ry o
ut th
e ta
sk, w
hate
ver t
heir
stat
istic
al in
form
atio
n ne
eds a
re.
• Pr
ovis
ion
of a
cces
s is a
ffor
dabl
e an
d co
nven
ient
to d
iffer
ent u
ser g
roup
s. •
Ther
e is
an
effo
rt to
focu
s on
med
ia, w
hich
is
the
sour
ce o
f sta
tistic
al in
form
atio
n fo
r the
va
st m
ajor
ity o
f the
pop
ulat
ion.
5.1.
3 St
atis
tics a
re re
leas
ed o
n th
e pr
e-an
noun
ced
sche
dule
. •
Dat
a re
leas
es a
re m
ade
in a
ccor
d w
ith sc
hedu
les
anno
unce
d in
adv
ance
.
• Ti
mel
ines
s in
diss
emin
atio
n is
obs
erve
d.
5.1.
4 St
atis
tics a
re m
ade
avai
labl
e to
all
user
s at t
he sa
me
time.
•
Nor
mal
pra
ctic
e is
to re
leas
e da
ta to
all
user
s si
mul
tane
ousl
y; e
xcep
tions
are
cle
arly
iden
tifie
d,
• H
ow w
ell i
s the
prin
cipl
e of
�equ
al a
cces
s un
der e
qual
con
ditio
ns� a
dher
ed to
? •
All
elec
ted
repr
esen
tativ
es a
re se
rved
with
out
pref
eren
ce o
r priv
ilege
.

- 48 -
mad
e pu
blic
, and
tim
e re
leas
ed in
adv
ance
is k
ept t
o a
min
imum
. (in
clud
ing
equa
l acc
ess i
n te
rms o
f the
pric
e of
stat
istic
al p
rodu
cts)
.
5.1.
5 N
on-p
ublis
hed
(but
non
-con
fiden
tial)
sub-
aggr
egat
es a
re m
ade
avai
labl
e up
on re
ques
t. •
Use
rs a
re e
ntitl
ed to
non
-pub
lishe
d bu
t non
-co
nfid
entia
l agg
rega
tes (
e.g.
, det
aile
d di
ssec
tions
an
d re
gion
al d
ata)
.
5.2
Met
adat
a ac
cess
ibili
ty �
Up-
to-d
ate
and
perti
nent
met
adat
a ar
e m
ade
avai
labl
e.
5.2.
1 D
ocum
enta
tion
on c
once
pts,
scop
e, c
lass
ifica
tions
, bas
is o
f rec
ordi
ng, d
ata
sour
ces,
and
stat
istic
al te
chni
ques
is a
vaila
ble,
and
diff
eren
ces f
rom
inte
rnat
iona
lly
acce
pted
stan
dard
s, gu
idel
ines
or g
ood
prac
tices
are
ann
otat
ed.
• In
form
atio
n on
und
erly
ing
conc
epts
, def
initi
ons,
clas
sific
atio
ns, m
etho
dolo
gy, a
ccur
acy,
etc
. is e
asily
ob
tain
able
by
user
s. •
Met
adat
a w
ith se
arch
ing
tool
s are
ava
ilabl
e; e
.g.,
keyw
ord
data
em
bedd
ed in
CD
-RO
M fo
rmat
and
in
hype
r-lin
ks.
• D
iffer
ence
s fro
m in
tern
atio
nal s
tand
ards
and
gu
idel
ines
are
exp
lain
ed, i
nclu
ding
the
ratio
nale
for
such
dep
artu
res.
• M
etad
ata
prov
ide
expl
icit
stat
emen
ts a
bout
dat
a qu
ality
to e
nabl
e us
er a
sses
smen
t of t
he v
ario
us
dim
ensi
ons o
f qua
lity
of th
e da
ta.
• H
ow w
ell d
oes a
stat
istic
al o
ffic
e pr
ovid
e th
e us
ers w
ith in
form
atio
n ab
out w
hat t
he d
ata
real
ly m
ean
and
abou
t the
met
hodo
logy
use
d to
col
lect
and
pro
cess
them
? •
How
wel
l dev
elop
ed a
nd a
pplie
d is
the
pres
enta
tion
of th
e qu
ality
of s
tatis
tics?
•
Are
stat
istic
al m
etho
ds w
ell d
ocum
ente
d?
• In
form
atio
n ab
out t
he u
nder
lyin
g co
ncep
ts
and
defin
ition
s use
d, th
e m
etho
dolo
gy u
sed
in
com
plyi
ng d
ata,
and
the
accu
racy
of t
he d
ata
is e
asy
to o
btai
n.
5.2.
2 Le
vels
of d
etai
l are
ada
pted
to th
e ne
eds o
f the
inte
nded
aud
ienc
e.
• D
ata
are
rele
ased
with
var
ying
leve
ls o
f det
ail t
o ap
prop
riate
ly sa
tisfy
nee
ds o
f diff
eren
t use
r gro
ups.
5. 3
Ass
istan
ce to
use
rs �
Pro
mpt
and
kno
wled
geab
le su
ppor
t ser
vice
is a
vaila
ble.
5.
3.1
Con
tact
per
son
for e
ach
subj
ect f
ield
is p
ublic
ized
. •
Con
tact
det
ails
(tel
epho
ne, a
ddre
ss, e
mai
l add
ress
, et
c.) a
re p
rovi
ded
for a
ll st
atis
tical
serie
s;
info
rmat
ion
offic
ers a
re w
ell t
rain
ed, e
xpec
ted
serv
ice
leve
ls a
re p
ublic
ized
, and
act
ual s
ervi
ce
leve
ls a
re m
onito
red.
•
Serv
ice
leve
ls to
be
expe
cted
from
in
form
atio
n en
quiry
off
icer
s are
pub
liciz
ed
and
serv
ice
leve
ls a
chie
ved
are
mon
itore
d.
5.3.
2 C
atal
ogue
s of p
ublic
atio
ns, d
ocum
ents
, and
oth
er se
rvic
es, i
nclu
ding
info
rmat
ion
on a
ny c
harg
es, a
re w
idel
y av
aila
ble.
•
Com
preh
ensi
ve c
atal
ogs a
re w
idel
y av
aila
ble,
list
ing
all d
ata
prod
ucts
and
serv
ices
ava
ilabl
e, w
ith b
rief
desc
riptio
ns a
nd a
ny c
harg
es a
pplic
able
. •
Pric
ing
polic
ies a
re u
nder
stoo
d by
clie
nts a
nd
•
Cat
alog
ues o
r sea
rchi
ng to
ols t
hat a
llow
use
rs
to k
now
wha
t is a
vaila
ble
and
how
to o
btai
n it
are
avai
labl
e.

- 49 -
cons
iste
ntly
app
lied.
•
Dat
a pr
oduc
ing
agen
cies
pro
vide
use
r edu
catio
n to
: in
crea
se p
ublic
aw
aren
ess o
f the
val
ue o
f sta
tistic
s, pr
omot
e aw
aren
ess o
f dat
a av
aila
ble,
info
rm u
sers
ab
out d
ata
stre
ngth
s and
lim
itatio
ns, p
rom
ote
mor
e ef
fect
ive
use
of d
ata,
and
min
imiz
e m
isus
e.
• N
ew p
rodu
cts a
nd se
rvic
es a
re a
ctiv
ely
prom
oted
to
rele
vant
targ
et a
udie
nces
. So
urce
: Thi
s tab
le is
pro
duce
d ba
sed
on th
e IM
F�s D
ata
Qua
lity
Ass
essm
ent F
ram
ewor
k: G
ener
ic F
ram
ewor
k (J
uly
2001
Vin
tage
) an
d H
ow a
re w
e do
ing?
Per
form
ance
indi
cato
rs fo
r nat
iona
l sta
tistic
al sy
stem
s (19
98) b
y W
illem
F. M
. de
Vrie
s; a
nd
�Cha
ract
eris
tics o
f an
effe
ctiv
e st
atis
tical
syst
em�
in th
e In
tern
atio
nal S
tatis
tical
Rev
iew
64,
2 (A
ugus
t 199
6), p
p. 1
65-1
97
and
on th
e St
atis
tics C
anad
a In
trane
t. (1
999)
, and
�M
onito
ring
the
Perf
orm
ance
of a
Nat
iona
l Sta
tistic
al In
stitu
te,�
pre
sent
ed
to th
e C
ES C
onfe
renc
e, b
oth
artic
les b
y Iv
an P
. Fel
legi
. N
ote:
C
andi
date
SC
B In
dica
tors
hav
e be
en c
ompi
led
with
refe
renc
e to
a la
rge
num
ber o
f doc
umen
ts in
clud
ing:
this
pap
er (T
he
Fram
ewor
k fo
r Det
erm
inin
g St
atis
tical
Cap
acity
Bui
ldin
g In
dica
tors
); th
e D
e V
ries I
ndic
ator
s, th
e Fe
lligi
Indi
cato
rs, a
nd
mat
eria
l fro
m th
e A
ustra
lian
Bur
eau
of S
tatis
tics a
nd S
tatis
tics N
ew Z
eala
nd.

- 50 -
Annex 2: Illustration of Monitoring of Indicators
Table: Statistical Capacity Matrix
Country: XXX Statistics: National Accounts
Status as of
Milestone by
Achievement as of
Activity Dec
1998 Dec 1999
Aug 2002
Dec 1999
Aug 2002
(1) (2) (3) (4) (5) (6)
Prerequisites of quality O O
NO LO O NO Environment is supportive of statistics Resources are commensurate with statistical program Quality awareness is cornerstone of work NO LO O NO
Integrity O O O O
Policies are guided by professional principles Policies and practices are transparent Practices are guided by ethical standards O O Methodological soundness
NO U LO NO NO U O NO NO LO O LO
Concepts definitions follow international frameworks Scope is in accord with international standards Classification systems are in accord with int. standards Flows/stocks are valued according to international standards NO LNO LO NO
Accuracy and reliability O LO
NO LNO LO NO NO LNO LO NO NO LNO LO LNO
Source data are adequate Statistical techniques conform with sound procedures Source data are assessed and validated Intermediate results are assessed and validated Revisions are tracked NO LNO LO LNO
Serviceability NO LO O LO NO LO O LO NO LNO LO NO
Statistics cover relevant information on the subject Timeliness, periodicity follow dissemination standards Statistics are consistent Data revisions follow regular, publicized procedures NO LNO LO NO
Accessibility LO LO LO LO
Presentation is clear and data are available Up-to-date pertinent metadata are available Prompt, knowledgeable support is available LO LO Note: Assessment follows the following scale: O � Practice observed; LO � Practice largely observed; LNO � Practice largely not observed; NO � Not observed; U- Work under progress; NA - Information not available.

- 51 -
Selected Reference Documents
AFRISTAT (2001) �AFRISTAT Contribution to Statistical Capacity Building in Member States During the 1996-2000 Period� presented at the seminar on the launching of the study �AFRISTAT AFTER 2005� May 2001, Bamako.
Achikbache, B., Belkindas, M., Dinc, M., Eele, G. and Swanson, E. (2001) �Strengthening
Statistical System for Poverty Reduction Strategies� in Poverty Reduction Strategy Sourcebook, Chapter 1, Section 5.
Carson, S. Carol, (2000), �Toward a Framework for Assessing Data Quality,� available on
the IMF�s Data Quality Reference Site (http://dsbb.imf.org/dqrsindex.htm).
Carson, S. Carol and Liuksila Claire (2001), �Further Steps Toward a Framework for Assessing Data Quality,� paper presented at the International Conference on Quality in Official Statistics, May 14�15, 2001, Stockholm (Sweden).
Carson, Carol, S., Laliberté, Lucie and Khawaja, Sarmad (2001) �Some Challenges of Statistical Capacity Building,� paper prepared for the 53rd Session of the International Statistical Institute (ISI), Seoul, August 2001.
Carson, S Carol, Laliberté Lucie and Khawaja Sarmad, (2001) �New Directions in Planning,
Monitoring and Evaluation of Statistical Capacity,�
Carson, S. Carol and Laliberte, Lucie (2002), �Assessing Accuracy and Reliability: a Note Based on Approaches Used in National Accounts and Balance of Payments Statistics,� IMF Working Paper, 02/24.
David, Isidoro P. (2001) Why Statistical Capacity Building Technical Assistance Projects Fail.
De Vries, Willem F. M. (1998) �Performance indicators for national statistical system� in
Netherlands Official Statistics, Vol. 13, Spring 1998, pp.5-13. De Vries, Willem F. M, and Van Brakel, Richard (1998) �Quality system and statistical
auditing: A pragmatic approach to statistical quality management,� prepared for May 1998 DGINS, Stockholm.
De Vries, Willem F. M (1998) How are we doing?: Performance indicators for national
statistical systems Fellegi, Ivan P. (1996) �Characteristics of an effective statistical system� in the International
Statistical Review 64, 2 (August 1996), pp. 165-97 and on the Statistics Canada Intranet.
Fellegi, Ivan P. (1999) �Monitoring the Performance of a National Statistical Institute,� paper
presented to the CES Conference.

- 52 -
Fellegi, Ivan P. and Ryten, Jacob (2001) A Peer Review of the Hungarian Statistical System,
Budapest and Ottawa. Friends of the Chair of the United Nations Statistical Commission for the 2002 UNSC
Meeting (2001) An Assessment of the Statistical Indicators Derived from United Nations Summit Meetings (Draft).
International Monetary Fund (2001) Data Quality Assessment Framework for National
Accounts Estimates, Statistics Department, Real Sector Division, the IMF. Kell, Michael (2001) �An Assessment of Fiscal Rules in the United Kingdom,� IMF
Working Paper 01/91, July. Morrison, Thomas K. and Khawaja, Sarmad (2001), �IMF�s Project Management System for
Planning and Monitoring Technical Assistance in Statistics�Experience and Future Directions� prepared for the PARIS21 Task Team Meeting in Washington, September 2001.
Morrison, Thomas K. and Khawaja, Sarmad (2001), �Measuring Statistical Capacity
Building: A Logical Framework Approach,� IMF Working Paper, November.
Pacific Financial Technical Assistance Centre (2001) Statistical Assessment Tool for Pacific Island Countries (SATPIC).
Statistics Canada (1999) �Monitoring the Performance of a National Statistical Institute
(NSI)� submitted to the United Nations Economic and Social Council, Statistical Commission and Economic Commission for Europe, Conference of European Statistics, Forty-seventh plenary session in Switzerland, June 1999 (CES/1999/17).
Statistics Canada (2001) 2000-2001 Estimates: A Report on Plans and Priorities by John
Manley, Minister of Industry. United Nations Economic and Social Council (2001) �Report by the Steering Committee of
Partnership in Statistics for Development in the Twenty-first Century (PARIS21)� prepared for the Statistical Commission, Thirty-third session, March 2002.
United Nations Economic and Social Council (2001) �Statistical capacity-building: Report of
the Secretary-General� prepared for the Statistical Commission, Thirty-Third Session, March 2002.
United Nations Economic and Social Council (2001) �The Special Data Dissemination
Standard and the General Data Dissemination System � A Report by the International Monetary Fund� prepared for the Statistical Commission, Thirty-Third Session, March 2002.

- 53 -
United Nations Statistics Division (2001) Handbook on the Operation and Organization of a Statistical Agency (Revised Edition)
World Bank (2001) A Framework for Assessing the Quality of Income Poverty Statistics,
Development Data Group, the World Bank.