the free high school science texts: textbooks for high school...
TRANSCRIPT
FHSST Authors
The Free High School Science Texts:Textbooks for High School StudentsStudying the SciencesPhysicsGrades 10 - 12
Version 0November 9, 2008

ii
Copyright 2007 “Free High School Science Texts”Permission is granted to copy, distribute and/or modify this document under theterms of the GNU Free Documentation License, Version 1.2 or any later versionpublished by the Free Software Foundation; with no Invariant Sections, no Front-Cover Texts, and no Back-Cover Texts. A copy of the license is included in thesection entitled “GNU Free Documentation License”.
STOP!!!!
Did you notice the FREEDOMS we’ve granted you?
Our copyright license is different! It grants freedoms
rather than just imposing restrictions like all those other
textbooks you probably own or use.
• We know people copy textbooks illegally but we would LOVE it if you copied
our’s - go ahead copy to your hearts content, legally!
• Publishers’ revenue is generated by controlling the market, we don’t want any
money, go ahead, distribute our books far and wide - we DARE you!
• Ever wanted to change your textbook? Of course you have! Go ahead, change
ours, make your own version, get your friends together, rip it apart and put
it back together the way you like it. That’s what we really want!
• Copy, modify, adapt, enhance, share, critique, adore, and contextualise. Do
it all, do it with your colleagues, your friends, or alone but get involved!
Together we can overcome the challenges our complex and diverse country
presents.
• So what is the catch? The only thing you can’t do is take this book, make
a few changes and then tell others that they can’t do the same with your
changes. It’s share and share-alike and we know you’ll agree that is only fair.
• These books were written by volunteers who want to help support education,
who want the facts to be freely available for teachers to copy, adapt and
re-use. Thousands of hours went into making them and they are a gift to
everyone in the education community.

FHSST Core Team
Mark Horner ; Samuel Halliday ; Sarah Blyth ; Rory Adams ; Spencer Wheaton
FHSST Editors
Jaynie Padayachee ; Joanne Boulle ; Diana Mulcahy ; Annette Nell ; Rene Toerien ; Donovan
Whitfield
FHSST Contributors
Rory Adams ; Prashant Arora ; Richard Baxter ; Dr. Sarah Blyth ; Sebastian Bodenstein ;
Graeme Broster ; Richard Case ; Brett Cocks ; Tim Crombie ; Dr. Anne Dabrowski ; Laura
Daniels ; Sean Dobbs ; Fernando Durrell ; Dr. Dan Dwyer ; Frans van Eeden ; Giovanni
Franzoni ; Ingrid von Glehn ; Tamara von Glehn ; Lindsay Glesener ; Dr. Vanessa Godfrey ; Dr.
Johan Gonzalez ; Hemant Gopal ; Umeshree Govender ; Heather Gray ; Lynn Greeff ; Dr. Tom
Gutierrez ; Brooke Haag ; Kate Hadley ; Dr. Sam Halliday ; Asheena Hanuman ; Neil Hart ;
Nicholas Hatcher ; Dr. Mark Horner ; Robert Hovden ; Mfandaidza Hove ; Jennifer Hsieh ;
Clare Johnson ; Luke Jordan ; Tana Joseph ; Dr. Jennifer Klay ; Lara Kruger ; Sihle Kubheka ;
Andrew Kubik ; Dr. Marco van Leeuwen ; Dr. Anton Machacek ; Dr. Komal Maheshwari ;
Kosma von Maltitz ; Nicole Masureik ; John Mathew ; JoEllen McBride ; Nikolai Meures ;
Riana Meyer ; Jenny Miller ; Abdul Mirza ; Asogan Moodaly ; Jothi Moodley ; Nolene Naidu ;
Tyrone Negus ; Thomas O’Donnell ; Dr. Markus Oldenburg ; Dr. Jaynie Padayachee ;
Nicolette Pekeur ; Sirika Pillay ; Jacques Plaut ; Andrea Prinsloo ; Joseph Raimondo ; Sanya
Rajani ; Prof. Sergey Rakityansky ; Alastair Ramlakan ; Razvan Remsing ; Max Richter ; Sean
Riddle ; Evan Robinson ; Dr. Andrew Rose ; Bianca Ruddy ; Katie Russell ; Duncan Scott ;
Helen Seals ; Ian Sherratt ; Roger Sieloff ; Bradley Smith ; Greg Solomon ; Mike Stringer ;
Shen Tian ; Robert Torregrosa ; Jimmy Tseng ; Helen Waugh ; Dr. Dawn Webber ; Michelle
Wen ; Dr. Alexander Wetzler ; Dr. Spencer Wheaton ; Vivian White ; Dr. Gerald Wigger ;
Harry Wiggins ; Wendy Williams ; Julie Wilson ; Andrew Wood ; Emma Wormauld ; Sahal
Yacoob ; Jean Youssef
Contributors and editors have made a sincere effort to produce an accurate and useful resource.Should you have suggestions, find mistakes or be prepared to donate material for inclusion,please don’t hesitate to contact us. We intend to work with all who are willing to help make
this a continuously evolving resource!
www.fhsst.org
iii

iv

Contents
I Introduction 1
1 What is Physics? 3
II Grade 10 - Physics 5
2 Units 9
2.1 Introduction . . . . . . . . . . . . . . . . . . . . . . . . . . . . . . . . . . . . . 9
2.2 Unit Systems . . . . . . . . . . . . . . . . . . . . . . . . . . . . . . . . . . . . . 9
2.2.1 SI Units . . . . . . . . . . . . . . . . . . . . . . . . . . . . . . . . . . . 9
2.2.2 The Other Systems of Units . . . . . . . . . . . . . . . . . . . . . . . . 10
2.3 Writing Units as Words or Symbols . . . . . . . . . . . . . . . . . . . . . . . . . 10
2.4 Combinations of SI Base Units . . . . . . . . . . . . . . . . . . . . . . . . . . . 12
2.5 Rounding, Scientific Notation and Significant Figures . . . . . . . . . . . . . . . 12
2.5.1 Rounding Off . . . . . . . . . . . . . . . . . . . . . . . . . . . . . . . . 12
2.5.2 Error Margins . . . . . . . . . . . . . . . . . . . . . . . . . . . . . . . . 13
2.5.3 Scientific Notation . . . . . . . . . . . . . . . . . . . . . . . . . . . . . 13
2.5.4 Significant Figures . . . . . . . . . . . . . . . . . . . . . . . . . . . . . . 15
2.6 Prefixes of Base Units . . . . . . . . . . . . . . . . . . . . . . . . . . . . . . . . 15
2.7 The Importance of Units . . . . . . . . . . . . . . . . . . . . . . . . . . . . . . 17
2.8 How to Change Units . . . . . . . . . . . . . . . . . . . . . . . . . . . . . . . . 17
2.8.1 Two other useful conversions . . . . . . . . . . . . . . . . . . . . . . . . 19
2.9 A sanity test . . . . . . . . . . . . . . . . . . . . . . . . . . . . . . . . . . . . . 19
2.10 Summary . . . . . . . . . . . . . . . . . . . . . . . . . . . . . . . . . . . . . . . 19
2.11 End of Chapter Exercises . . . . . . . . . . . . . . . . . . . . . . . . . . . . . . 21
3 Motion in One Dimension - Grade 10 23
3.1 Introduction . . . . . . . . . . . . . . . . . . . . . . . . . . . . . . . . . . . . . 23
3.2 Reference Point, Frame of Reference and Position . . . . . . . . . . . . . . . . . 23
3.2.1 Frames of Reference . . . . . . . . . . . . . . . . . . . . . . . . . . . . . 23
3.2.2 Position . . . . . . . . . . . . . . . . . . . . . . . . . . . . . . . . . . . 25
3.3 Displacement and Distance . . . . . . . . . . . . . . . . . . . . . . . . . . . . . 28
3.3.1 Interpreting Direction . . . . . . . . . . . . . . . . . . . . . . . . . . . . 29
3.3.2 Differences between Distance and Displacement . . . . . . . . . . . . . . 29
3.4 Speed, Average Velocity and Instantaneous Velocity . . . . . . . . . . . . . . . . 31
v

CONTENTS CONTENTS
3.4.1 Differences between Speed and Velocity . . . . . . . . . . . . . . . . . . 35
3.5 Acceleration . . . . . . . . . . . . . . . . . . . . . . . . . . . . . . . . . . . . . 38
3.6 Description of Motion . . . . . . . . . . . . . . . . . . . . . . . . . . . . . . . . 39
3.6.1 Stationary Object . . . . . . . . . . . . . . . . . . . . . . . . . . . . . . 40
3.6.2 Motion at Constant Velocity . . . . . . . . . . . . . . . . . . . . . . . . 41
3.6.3 Motion at Constant Acceleration . . . . . . . . . . . . . . . . . . . . . . 46
3.7 Summary of Graphs . . . . . . . . . . . . . . . . . . . . . . . . . . . . . . . . . 48
3.8 Worked Examples . . . . . . . . . . . . . . . . . . . . . . . . . . . . . . . . . . 49
3.9 Equations of Motion . . . . . . . . . . . . . . . . . . . . . . . . . . . . . . . . . 54
3.9.1 Finding the Equations of Motion . . . . . . . . . . . . . . . . . . . . . . 54
3.10 Applications in the Real-World . . . . . . . . . . . . . . . . . . . . . . . . . . . 59
3.11 Summary . . . . . . . . . . . . . . . . . . . . . . . . . . . . . . . . . . . . . . . 61
3.12 End of Chapter Exercises: Motion in One Dimension . . . . . . . . . . . . . . . 62
4 Gravity and Mechanical Energy - Grade 10 67
4.1 Weight . . . . . . . . . . . . . . . . . . . . . . . . . . . . . . . . . . . . . . . . 67
4.1.1 Differences between Mass and Weight . . . . . . . . . . . . . . . . . . . 68
4.2 Acceleration due to Gravity . . . . . . . . . . . . . . . . . . . . . . . . . . . . . 69
4.2.1 Gravitational Fields . . . . . . . . . . . . . . . . . . . . . . . . . . . . . 69
4.2.2 Free fall . . . . . . . . . . . . . . . . . . . . . . . . . . . . . . . . . . . 69
4.3 Potential Energy . . . . . . . . . . . . . . . . . . . . . . . . . . . . . . . . . . . 73
4.4 Kinetic Energy . . . . . . . . . . . . . . . . . . . . . . . . . . . . . . . . . . . . 75
4.4.1 Checking units . . . . . . . . . . . . . . . . . . . . . . . . . . . . . . . . 77
4.5 Mechanical Energy . . . . . . . . . . . . . . . . . . . . . . . . . . . . . . . . . 78
4.5.1 Conservation of Mechanical Energy . . . . . . . . . . . . . . . . . . . . . 78
4.5.2 Using the Law of Conservation of Energy . . . . . . . . . . . . . . . . . 79
4.6 Energy graphs . . . . . . . . . . . . . . . . . . . . . . . . . . . . . . . . . . . . 82
4.7 Summary . . . . . . . . . . . . . . . . . . . . . . . . . . . . . . . . . . . . . . . 83
4.8 End of Chapter Exercises: Gravity and Mechanical Energy . . . . . . . . . . . . 84
5 Transverse Pulses - Grade 10 87
5.1 Introduction . . . . . . . . . . . . . . . . . . . . . . . . . . . . . . . . . . . . . 87
5.2 What is a medium? . . . . . . . . . . . . . . . . . . . . . . . . . . . . . . . . . 87
5.3 What is a pulse? . . . . . . . . . . . . . . . . . . . . . . . . . . . . . . . . . . . 87
5.3.1 Pulse Length and Amplitude . . . . . . . . . . . . . . . . . . . . . . . . 88
5.3.2 Pulse Speed . . . . . . . . . . . . . . . . . . . . . . . . . . . . . . . . . 89
5.4 Graphs of Position and Velocity . . . . . . . . . . . . . . . . . . . . . . . . . . . 90
5.4.1 Motion of a Particle of the Medium . . . . . . . . . . . . . . . . . . . . 90
5.4.2 Motion of the Pulse . . . . . . . . . . . . . . . . . . . . . . . . . . . . . 92
5.5 Transmission and Reflection of a Pulse at a Boundary . . . . . . . . . . . . . . . 96
5.6 Reflection of a Pulse from Fixed and Free Ends . . . . . . . . . . . . . . . . . . 97
5.6.1 Reflection of a Pulse from a Fixed End . . . . . . . . . . . . . . . . . . . 97
vi
CONTENTS CONTENTS
5.6.2 Reflection of a Pulse from a Free End . . . . . . . . . . . . . . . . . . . 98
5.7 Superposition of Pulses . . . . . . . . . . . . . . . . . . . . . . . . . . . . . . . 99
5.8 Exercises - Transverse Pulses . . . . . . . . . . . . . . . . . . . . . . . . . . . . 102
6 Transverse Waves - Grade 10 105
6.1 Introduction . . . . . . . . . . . . . . . . . . . . . . . . . . . . . . . . . . . . . 105
6.2 What is a transverse wave? . . . . . . . . . . . . . . . . . . . . . . . . . . . . . 105
6.2.1 Peaks and Troughs . . . . . . . . . . . . . . . . . . . . . . . . . . . . . 106
6.2.2 Amplitude and Wavelength . . . . . . . . . . . . . . . . . . . . . . . . . 107
6.2.3 Points in Phase . . . . . . . . . . . . . . . . . . . . . . . . . . . . . . . 109
6.2.4 Period and Frequency . . . . . . . . . . . . . . . . . . . . . . . . . . . . 110
6.2.5 Speed of a Transverse Wave . . . . . . . . . . . . . . . . . . . . . . . . 111
6.3 Graphs of Particle Motion . . . . . . . . . . . . . . . . . . . . . . . . . . . . . . 115
6.4 Standing Waves and Boundary Conditions . . . . . . . . . . . . . . . . . . . . . 118
6.4.1 Reflection of a Transverse Wave from a Fixed End . . . . . . . . . . . . 118
6.4.2 Reflection of a Transverse Wave from a Free End . . . . . . . . . . . . . 118
6.4.3 Standing Waves . . . . . . . . . . . . . . . . . . . . . . . . . . . . . . . 118
6.4.4 Nodes and anti-nodes . . . . . . . . . . . . . . . . . . . . . . . . . . . . 122
6.4.5 Wavelengths of Standing Waves with Fixed and Free Ends . . . . . . . . 122
6.4.6 Superposition and Interference . . . . . . . . . . . . . . . . . . . . . . . 125
6.5 Summary . . . . . . . . . . . . . . . . . . . . . . . . . . . . . . . . . . . . . . . 127
6.6 Exercises . . . . . . . . . . . . . . . . . . . . . . . . . . . . . . . . . . . . . . . 127
7 Geometrical Optics - Grade 10 129
7.1 Introduction . . . . . . . . . . . . . . . . . . . . . . . . . . . . . . . . . . . . . 129
7.2 Light Rays . . . . . . . . . . . . . . . . . . . . . . . . . . . . . . . . . . . . . . 129
7.2.1 Shadows . . . . . . . . . . . . . . . . . . . . . . . . . . . . . . . . . . . 132
7.2.2 Ray Diagrams . . . . . . . . . . . . . . . . . . . . . . . . . . . . . . . . 132
7.3 Reflection . . . . . . . . . . . . . . . . . . . . . . . . . . . . . . . . . . . . . . 132
7.3.1 Terminology . . . . . . . . . . . . . . . . . . . . . . . . . . . . . . . . . 133
7.3.2 Law of Reflection . . . . . . . . . . . . . . . . . . . . . . . . . . . . . . 133
7.3.3 Types of Reflection . . . . . . . . . . . . . . . . . . . . . . . . . . . . . 135
7.4 Refraction . . . . . . . . . . . . . . . . . . . . . . . . . . . . . . . . . . . . . . 137
7.4.1 Refractive Index . . . . . . . . . . . . . . . . . . . . . . . . . . . . . . . 139
7.4.2 Snell’s Law . . . . . . . . . . . . . . . . . . . . . . . . . . . . . . . . . 139
7.4.3 Apparent Depth . . . . . . . . . . . . . . . . . . . . . . . . . . . . . . . 143
7.5 Mirrors . . . . . . . . . . . . . . . . . . . . . . . . . . . . . . . . . . . . . . . . 146
7.5.1 Image Formation . . . . . . . . . . . . . . . . . . . . . . . . . . . . . . 146
7.5.2 Plane Mirrors . . . . . . . . . . . . . . . . . . . . . . . . . . . . . . . . 147
7.5.3 Ray Diagrams . . . . . . . . . . . . . . . . . . . . . . . . . . . . . . . . 148
7.5.4 Spherical Mirrors . . . . . . . . . . . . . . . . . . . . . . . . . . . . . . 150
7.5.5 Concave Mirrors . . . . . . . . . . . . . . . . . . . . . . . . . . . . . . . 150
vii

CONTENTS CONTENTS
7.5.6 Convex Mirrors . . . . . . . . . . . . . . . . . . . . . . . . . . . . . . . 153
7.5.7 Summary of Properties of Mirrors . . . . . . . . . . . . . . . . . . . . . 154
7.5.8 Magnification . . . . . . . . . . . . . . . . . . . . . . . . . . . . . . . . 154
7.6 Total Internal Reflection and Fibre Optics . . . . . . . . . . . . . . . . . . . . . 156
7.6.1 Total Internal Reflection . . . . . . . . . . . . . . . . . . . . . . . . . . 156
7.6.2 Fibre Optics . . . . . . . . . . . . . . . . . . . . . . . . . . . . . . . . . 161
7.7 Summary . . . . . . . . . . . . . . . . . . . . . . . . . . . . . . . . . . . . . . . 163
7.8 Exercises . . . . . . . . . . . . . . . . . . . . . . . . . . . . . . . . . . . . . . . 164
8 Magnetism - Grade 10 167
8.1 Introduction . . . . . . . . . . . . . . . . . . . . . . . . . . . . . . . . . . . . . 167
8.2 Magnetic fields . . . . . . . . . . . . . . . . . . . . . . . . . . . . . . . . . . . 167
8.3 Permanent magnets . . . . . . . . . . . . . . . . . . . . . . . . . . . . . . . . . 169
8.3.1 The poles of permanent magnets . . . . . . . . . . . . . . . . . . . . . . 169
8.3.2 Magnetic attraction and repulsion . . . . . . . . . . . . . . . . . . . . . 169
8.3.3 Representing magnetic fields . . . . . . . . . . . . . . . . . . . . . . . . 170
8.4 The compass and the earth’s magnetic field . . . . . . . . . . . . . . . . . . . . 173
8.4.1 The earth’s magnetic field . . . . . . . . . . . . . . . . . . . . . . . . . 175
8.5 Summary . . . . . . . . . . . . . . . . . . . . . . . . . . . . . . . . . . . . . . . 175
8.6 End of chapter exercises . . . . . . . . . . . . . . . . . . . . . . . . . . . . . . . 176
9 Electrostatics - Grade 10 177
9.1 Introduction . . . . . . . . . . . . . . . . . . . . . . . . . . . . . . . . . . . . . 177
9.2 Two kinds of charge . . . . . . . . . . . . . . . . . . . . . . . . . . . . . . . . . 177
9.3 Unit of charge . . . . . . . . . . . . . . . . . . . . . . . . . . . . . . . . . . . . 177
9.4 Conservation of charge . . . . . . . . . . . . . . . . . . . . . . . . . . . . . . . 177
9.5 Force between Charges . . . . . . . . . . . . . . . . . . . . . . . . . . . . . . . 178
9.6 Conductors and insulators . . . . . . . . . . . . . . . . . . . . . . . . . . . . . . 181
9.6.1 The electroscope . . . . . . . . . . . . . . . . . . . . . . . . . . . . . . 182
9.7 Attraction between charged and uncharged objects . . . . . . . . . . . . . . . . 183
9.7.1 Polarisation of Insulators . . . . . . . . . . . . . . . . . . . . . . . . . . 183
9.8 Summary . . . . . . . . . . . . . . . . . . . . . . . . . . . . . . . . . . . . . . . 184
9.9 End of chapter exercise . . . . . . . . . . . . . . . . . . . . . . . . . . . . . . . 184
10 Electric Circuits - Grade 10 187
10.1 Electric Circuits . . . . . . . . . . . . . . . . . . . . . . . . . . . . . . . . . . . 187
10.1.1 Closed circuits . . . . . . . . . . . . . . . . . . . . . . . . . . . . . . . . 187
10.1.2 Representing electric circuits . . . . . . . . . . . . . . . . . . . . . . . . 188
10.2 Potential Difference . . . . . . . . . . . . . . . . . . . . . . . . . . . . . . . . . 192
10.2.1 Potential Difference . . . . . . . . . . . . . . . . . . . . . . . . . . . . . 192
10.2.2 Potential Difference and Parallel Resistors . . . . . . . . . . . . . . . . . 193
10.2.3 Potential Difference and Series Resistors . . . . . . . . . . . . . . . . . . 194
10.2.4 Ohm’s Law . . . . . . . . . . . . . . . . . . . . . . . . . . . . . . . . . 194
viii
CONTENTS CONTENTS
10.2.5 EMF . . . . . . . . . . . . . . . . . . . . . . . . . . . . . . . . . . . . . 195
10.3 Current . . . . . . . . . . . . . . . . . . . . . . . . . . . . . . . . . . . . . . . . 198
10.3.1 Flow of Charge . . . . . . . . . . . . . . . . . . . . . . . . . . . . . . . 198
10.3.2 Current . . . . . . . . . . . . . . . . . . . . . . . . . . . . . . . . . . . 198
10.3.3 Series Circuits . . . . . . . . . . . . . . . . . . . . . . . . . . . . . . . . 199
10.3.4 Parallel Circuits . . . . . . . . . . . . . . . . . . . . . . . . . . . . . . . 200
10.4 Resistance . . . . . . . . . . . . . . . . . . . . . . . . . . . . . . . . . . . . . . 202
10.4.1 What causes resistance? . . . . . . . . . . . . . . . . . . . . . . . . . . 202
10.4.2 Resistors in electric circuits . . . . . . . . . . . . . . . . . . . . . . . . . 202
10.5 Instruments to Measure voltage, current and resistance . . . . . . . . . . . . . . 204
10.5.1 Voltmeter . . . . . . . . . . . . . . . . . . . . . . . . . . . . . . . . . . 204
10.5.2 Ammeter . . . . . . . . . . . . . . . . . . . . . . . . . . . . . . . . . . . 204
10.5.3 Ohmmeter . . . . . . . . . . . . . . . . . . . . . . . . . . . . . . . . . . 204
10.5.4 Meters Impact on Circuit . . . . . . . . . . . . . . . . . . . . . . . . . . 205
10.6 Exercises - Electric circuits . . . . . . . . . . . . . . . . . . . . . . . . . . . . . 205
III Grade 11 - Physics 209
11 Vectors 211
11.1 Introduction . . . . . . . . . . . . . . . . . . . . . . . . . . . . . . . . . . . . . 211
11.2 Scalars and Vectors . . . . . . . . . . . . . . . . . . . . . . . . . . . . . . . . . 211
11.3 Notation . . . . . . . . . . . . . . . . . . . . . . . . . . . . . . . . . . . . . . . 211
11.3.1 Mathematical Representation . . . . . . . . . . . . . . . . . . . . . . . . 212
11.3.2 Graphical Representation . . . . . . . . . . . . . . . . . . . . . . . . . . 212
11.4 Directions . . . . . . . . . . . . . . . . . . . . . . . . . . . . . . . . . . . . . . 212
11.4.1 Relative Directions . . . . . . . . . . . . . . . . . . . . . . . . . . . . . 212
11.4.2 Compass Directions . . . . . . . . . . . . . . . . . . . . . . . . . . . . . 213
11.4.3 Bearing . . . . . . . . . . . . . . . . . . . . . . . . . . . . . . . . . . . 213
11.5 Drawing Vectors . . . . . . . . . . . . . . . . . . . . . . . . . . . . . . . . . . . 214
11.6 Mathematical Properties of Vectors . . . . . . . . . . . . . . . . . . . . . . . . . 215
11.6.1 Adding Vectors . . . . . . . . . . . . . . . . . . . . . . . . . . . . . . . 215
11.6.2 Subtracting Vectors . . . . . . . . . . . . . . . . . . . . . . . . . . . . . 217
11.6.3 Scalar Multiplication . . . . . . . . . . . . . . . . . . . . . . . . . . . . 218
11.7 Techniques of Vector Addition . . . . . . . . . . . . . . . . . . . . . . . . . . . 218
11.7.1 Graphical Techniques . . . . . . . . . . . . . . . . . . . . . . . . . . . . 218
11.7.2 Algebraic Addition and Subtraction of Vectors . . . . . . . . . . . . . . . 223
11.8 Components of Vectors . . . . . . . . . . . . . . . . . . . . . . . . . . . . . . . 228
11.8.1 Vector addition using components . . . . . . . . . . . . . . . . . . . . . 231
11.8.2 Summary . . . . . . . . . . . . . . . . . . . . . . . . . . . . . . . . . . 235
11.8.3 End of chapter exercises: Vectors . . . . . . . . . . . . . . . . . . . . . . 236
11.8.4 End of chapter exercises: Vectors - Long questions . . . . . . . . . . . . 237
ix
CONTENTS CONTENTS
12 Force, Momentum and Impulse - Grade 11 239
12.1 Introduction . . . . . . . . . . . . . . . . . . . . . . . . . . . . . . . . . . . . . 239
12.2 Force . . . . . . . . . . . . . . . . . . . . . . . . . . . . . . . . . . . . . . . . . 239
12.2.1 What is a force? . . . . . . . . . . . . . . . . . . . . . . . . . . . . . . . 239
12.2.2 Examples of Forces in Physics . . . . . . . . . . . . . . . . . . . . . . . 240
12.2.3 Systems and External Forces . . . . . . . . . . . . . . . . . . . . . . . . 241
12.2.4 Force Diagrams . . . . . . . . . . . . . . . . . . . . . . . . . . . . . . . 242
12.2.5 Free Body Diagrams . . . . . . . . . . . . . . . . . . . . . . . . . . . . . 243
12.2.6 Finding the Resultant Force . . . . . . . . . . . . . . . . . . . . . . . . . 244
12.2.7 Exercise . . . . . . . . . . . . . . . . . . . . . . . . . . . . . . . . . . . 246
12.3 Newton’s Laws . . . . . . . . . . . . . . . . . . . . . . . . . . . . . . . . . . . . 246
12.3.1 Newton’s First Law . . . . . . . . . . . . . . . . . . . . . . . . . . . . . 247
12.3.2 Newton’s Second Law of Motion . . . . . . . . . . . . . . . . . . . . . . 249
12.3.3 Exercise . . . . . . . . . . . . . . . . . . . . . . . . . . . . . . . . . . . 261
12.3.4 Newton’s Third Law of Motion . . . . . . . . . . . . . . . . . . . . . . . 263
12.3.5 Exercise . . . . . . . . . . . . . . . . . . . . . . . . . . . . . . . . . . . 267
12.3.6 Different types of forces . . . . . . . . . . . . . . . . . . . . . . . . . . . 268
12.3.7 Exercise . . . . . . . . . . . . . . . . . . . . . . . . . . . . . . . . . . . 275
12.3.8 Forces in equilibrium . . . . . . . . . . . . . . . . . . . . . . . . . . . . 276
12.3.9 Exercise . . . . . . . . . . . . . . . . . . . . . . . . . . . . . . . . . . . 279
12.4 Forces between Masses . . . . . . . . . . . . . . . . . . . . . . . . . . . . . . . 282
12.4.1 Newton’s Law of Universal Gravitation . . . . . . . . . . . . . . . . . . . 282
12.4.2 Comparative Problems . . . . . . . . . . . . . . . . . . . . . . . . . . . 284
12.4.3 Exercise . . . . . . . . . . . . . . . . . . . . . . . . . . . . . . . . . . . 286
12.5 Momentum and Impulse . . . . . . . . . . . . . . . . . . . . . . . . . . . . . . . 287
12.5.1 Vector Nature of Momentum . . . . . . . . . . . . . . . . . . . . . . . . 290
12.5.2 Exercise . . . . . . . . . . . . . . . . . . . . . . . . . . . . . . . . . . . 291
12.5.3 Change in Momentum . . . . . . . . . . . . . . . . . . . . . . . . . . . . 291
12.5.4 Exercise . . . . . . . . . . . . . . . . . . . . . . . . . . . . . . . . . . . 293
12.5.5 Newton’s Second Law revisited . . . . . . . . . . . . . . . . . . . . . . . 293
12.5.6 Impulse . . . . . . . . . . . . . . . . . . . . . . . . . . . . . . . . . . . 294
12.5.7 Exercise . . . . . . . . . . . . . . . . . . . . . . . . . . . . . . . . . . . 296
12.5.8 Conservation of Momentum . . . . . . . . . . . . . . . . . . . . . . . . . 297
12.5.9 Physics in Action: Impulse . . . . . . . . . . . . . . . . . . . . . . . . . 300
12.5.10Exercise . . . . . . . . . . . . . . . . . . . . . . . . . . . . . . . . . . . 301
12.6 Torque and Levers . . . . . . . . . . . . . . . . . . . . . . . . . . . . . . . . . . 302
12.6.1 Torque . . . . . . . . . . . . . . . . . . . . . . . . . . . . . . . . . . . . 302
12.6.2 Mechanical Advantage and Levers . . . . . . . . . . . . . . . . . . . . . 305
12.6.3 Classes of levers . . . . . . . . . . . . . . . . . . . . . . . . . . . . . . . 307
12.6.4 Exercise . . . . . . . . . . . . . . . . . . . . . . . . . . . . . . . . . . . 308
12.7 Summary . . . . . . . . . . . . . . . . . . . . . . . . . . . . . . . . . . . . . . . 309
12.8 End of Chapter exercises . . . . . . . . . . . . . . . . . . . . . . . . . . . . . . 310
x

CONTENTS CONTENTS
13 Geometrical Optics - Grade 11 327
13.1 Introduction . . . . . . . . . . . . . . . . . . . . . . . . . . . . . . . . . . . . . 327
13.2 Lenses . . . . . . . . . . . . . . . . . . . . . . . . . . . . . . . . . . . . . . . . 327
13.2.1 Converging Lenses . . . . . . . . . . . . . . . . . . . . . . . . . . . . . . 329
13.2.2 Diverging Lenses . . . . . . . . . . . . . . . . . . . . . . . . . . . . . . 340
13.2.3 Summary of Image Properties . . . . . . . . . . . . . . . . . . . . . . . 343
13.3 The Human Eye . . . . . . . . . . . . . . . . . . . . . . . . . . . . . . . . . . . 344
13.3.1 Structure of the Eye . . . . . . . . . . . . . . . . . . . . . . . . . . . . . 345
13.3.2 Defects of Vision . . . . . . . . . . . . . . . . . . . . . . . . . . . . . . 346
13.4 Gravitational Lenses . . . . . . . . . . . . . . . . . . . . . . . . . . . . . . . . . 347
13.5 Telescopes . . . . . . . . . . . . . . . . . . . . . . . . . . . . . . . . . . . . . . 347
13.5.1 Refracting Telescopes . . . . . . . . . . . . . . . . . . . . . . . . . . . . 347
13.5.2 Reflecting Telescopes . . . . . . . . . . . . . . . . . . . . . . . . . . . . 348
13.5.3 Southern African Large Telescope . . . . . . . . . . . . . . . . . . . . . 348
13.6 Microscopes . . . . . . . . . . . . . . . . . . . . . . . . . . . . . . . . . . . . . 349
13.7 Summary . . . . . . . . . . . . . . . . . . . . . . . . . . . . . . . . . . . . . . . 351
13.8 Exercises . . . . . . . . . . . . . . . . . . . . . . . . . . . . . . . . . . . . . . . 352
14 Longitudinal Waves - Grade 11 355
14.1 Introduction . . . . . . . . . . . . . . . . . . . . . . . . . . . . . . . . . . . . . 355
14.2 What is a longitudinal wave? . . . . . . . . . . . . . . . . . . . . . . . . . . . . 355
14.3 Characteristics of Longitudinal Waves . . . . . . . . . . . . . . . . . . . . . . . 356
14.3.1 Compression and Rarefaction . . . . . . . . . . . . . . . . . . . . . . . . 356
14.3.2 Wavelength and Amplitude . . . . . . . . . . . . . . . . . . . . . . . . . 357
14.3.3 Period and Frequency . . . . . . . . . . . . . . . . . . . . . . . . . . . . 357
14.3.4 Speed of a Longitudinal Wave . . . . . . . . . . . . . . . . . . . . . . . 358
14.4 Graphs of Particle Position, Displacement, Velocity and Acceleration . . . . . . . 359
14.5 Sound Waves . . . . . . . . . . . . . . . . . . . . . . . . . . . . . . . . . . . . 360
14.6 Seismic Waves . . . . . . . . . . . . . . . . . . . . . . . . . . . . . . . . . . . . 361
14.7 Summary - Longitudinal Waves . . . . . . . . . . . . . . . . . . . . . . . . . . . 361
14.8 Exercises - Longitudinal Waves . . . . . . . . . . . . . . . . . . . . . . . . . . . 362
15 Sound - Grade 11 363
15.1 Introduction . . . . . . . . . . . . . . . . . . . . . . . . . . . . . . . . . . . . . 363
15.2 Characteristics of a Sound Wave . . . . . . . . . . . . . . . . . . . . . . . . . . 363
15.2.1 Pitch . . . . . . . . . . . . . . . . . . . . . . . . . . . . . . . . . . . . . 364
15.2.2 Loudness . . . . . . . . . . . . . . . . . . . . . . . . . . . . . . . . . . . 364
15.2.3 Tone . . . . . . . . . . . . . . . . . . . . . . . . . . . . . . . . . . . . . 364
15.3 Speed of Sound . . . . . . . . . . . . . . . . . . . . . . . . . . . . . . . . . . . 365
15.4 Physics of the Ear and Hearing . . . . . . . . . . . . . . . . . . . . . . . . . . . 365
15.4.1 Intensity of Sound . . . . . . . . . . . . . . . . . . . . . . . . . . . . . . 366
15.5 Ultrasound . . . . . . . . . . . . . . . . . . . . . . . . . . . . . . . . . . . . . . 367
xi

CONTENTS CONTENTS
15.6 SONAR . . . . . . . . . . . . . . . . . . . . . . . . . . . . . . . . . . . . . . . 368
15.6.1 Echolocation . . . . . . . . . . . . . . . . . . . . . . . . . . . . . . . . . 368
15.7 Summary . . . . . . . . . . . . . . . . . . . . . . . . . . . . . . . . . . . . . . . 369
15.8 Exercises . . . . . . . . . . . . . . . . . . . . . . . . . . . . . . . . . . . . . . . 369
16 The Physics of Music - Grade 11 373
16.1 Introduction . . . . . . . . . . . . . . . . . . . . . . . . . . . . . . . . . . . . . 373
16.2 Standing Waves in String Instruments . . . . . . . . . . . . . . . . . . . . . . . 373
16.3 Standing Waves in Wind Instruments . . . . . . . . . . . . . . . . . . . . . . . . 377
16.4 Resonance . . . . . . . . . . . . . . . . . . . . . . . . . . . . . . . . . . . . . . 382
16.5 Music and Sound Quality . . . . . . . . . . . . . . . . . . . . . . . . . . . . . . 384
16.6 Summary - The Physics of Music . . . . . . . . . . . . . . . . . . . . . . . . . . 385
16.7 End of Chapter Exercises . . . . . . . . . . . . . . . . . . . . . . . . . . . . . . 386
17 Electrostatics - Grade 11 387
17.1 Introduction . . . . . . . . . . . . . . . . . . . . . . . . . . . . . . . . . . . . . 387
17.2 Forces between charges - Coulomb’s Law . . . . . . . . . . . . . . . . . . . . . . 387
17.3 Electric field around charges . . . . . . . . . . . . . . . . . . . . . . . . . . . . 392
17.3.1 Electric field lines . . . . . . . . . . . . . . . . . . . . . . . . . . . . . . 393
17.3.2 Positive charge acting on a test charge . . . . . . . . . . . . . . . . . . . 393
17.3.3 Combined charge distributions . . . . . . . . . . . . . . . . . . . . . . . 394
17.3.4 Parallel plates . . . . . . . . . . . . . . . . . . . . . . . . . . . . . . . . 397
17.4 Electrical potential energy and potential . . . . . . . . . . . . . . . . . . . . . . 400
17.4.1 Electrical potential . . . . . . . . . . . . . . . . . . . . . . . . . . . . . 400
17.4.2 Real-world application: lightning . . . . . . . . . . . . . . . . . . . . . . 402
17.5 Capacitance and the parallel plate capacitor . . . . . . . . . . . . . . . . . . . . 403
17.5.1 Capacitors and capacitance . . . . . . . . . . . . . . . . . . . . . . . . . 403
17.5.2 Dielectrics . . . . . . . . . . . . . . . . . . . . . . . . . . . . . . . . . . 404
17.5.3 Physical properties of the capacitor and capacitance . . . . . . . . . . . . 404
17.5.4 Electric field in a capacitor . . . . . . . . . . . . . . . . . . . . . . . . . 405
17.6 Capacitor as a circuit device . . . . . . . . . . . . . . . . . . . . . . . . . . . . 406
17.6.1 A capacitor in a circuit . . . . . . . . . . . . . . . . . . . . . . . . . . . 406
17.6.2 Real-world applications: capacitors . . . . . . . . . . . . . . . . . . . . . 407
17.7 Summary . . . . . . . . . . . . . . . . . . . . . . . . . . . . . . . . . . . . . . . 407
17.8 Exercises - Electrostatics . . . . . . . . . . . . . . . . . . . . . . . . . . . . . . 407
18 Electromagnetism - Grade 11 413
18.1 Introduction . . . . . . . . . . . . . . . . . . . . . . . . . . . . . . . . . . . . . 413
18.2 Magnetic field associated with a current . . . . . . . . . . . . . . . . . . . . . . 413
18.2.1 Real-world applications . . . . . . . . . . . . . . . . . . . . . . . . . . . 418
18.3 Current induced by a changing magnetic field . . . . . . . . . . . . . . . . . . . 420
18.3.1 Real-life applications . . . . . . . . . . . . . . . . . . . . . . . . . . . . 422
18.4 Transformers . . . . . . . . . . . . . . . . . . . . . . . . . . . . . . . . . . . . . 423
xii

CONTENTS CONTENTS
18.4.1 Real-world applications . . . . . . . . . . . . . . . . . . . . . . . . . . . 425
18.5 Motion of a charged particle in a magnetic field . . . . . . . . . . . . . . . . . . 425
18.5.1 Real-world applications . . . . . . . . . . . . . . . . . . . . . . . . . . . 426
18.6 Summary . . . . . . . . . . . . . . . . . . . . . . . . . . . . . . . . . . . . . . . 427
18.7 End of chapter exercises . . . . . . . . . . . . . . . . . . . . . . . . . . . . . . . 427
19 Electric Circuits - Grade 11 429
19.1 Introduction . . . . . . . . . . . . . . . . . . . . . . . . . . . . . . . . . . . . . 429
19.2 Ohm’s Law . . . . . . . . . . . . . . . . . . . . . . . . . . . . . . . . . . . . . . 429
19.2.1 Definition of Ohm’s Law . . . . . . . . . . . . . . . . . . . . . . . . . . 429
19.2.2 Ohmic and non-ohmic conductors . . . . . . . . . . . . . . . . . . . . . 431
19.2.3 Using Ohm’s Law . . . . . . . . . . . . . . . . . . . . . . . . . . . . . . 432
19.3 Resistance . . . . . . . . . . . . . . . . . . . . . . . . . . . . . . . . . . . . . . 433
19.3.1 Equivalent resistance . . . . . . . . . . . . . . . . . . . . . . . . . . . . 433
19.3.2 Use of Ohm’s Law in series and parallel Circuits . . . . . . . . . . . . . . 438
19.3.3 Batteries and internal resistance . . . . . . . . . . . . . . . . . . . . . . 440
19.4 Series and parallel networks of resistors . . . . . . . . . . . . . . . . . . . . . . . 442
19.5 Wheatstone bridge . . . . . . . . . . . . . . . . . . . . . . . . . . . . . . . . . . 445
19.6 Summary . . . . . . . . . . . . . . . . . . . . . . . . . . . . . . . . . . . . . . . 447
19.7 End of chapter exercise . . . . . . . . . . . . . . . . . . . . . . . . . . . . . . . 447
20 Electronic Properties of Matter - Grade 11 451
20.1 Introduction . . . . . . . . . . . . . . . . . . . . . . . . . . . . . . . . . . . . . 451
20.2 Conduction . . . . . . . . . . . . . . . . . . . . . . . . . . . . . . . . . . . . . . 451
20.2.1 Metals . . . . . . . . . . . . . . . . . . . . . . . . . . . . . . . . . . . . 453
20.2.2 Insulator . . . . . . . . . . . . . . . . . . . . . . . . . . . . . . . . . . . 453
20.2.3 Semi-conductors . . . . . . . . . . . . . . . . . . . . . . . . . . . . . . . 454
20.3 Intrinsic Properties and Doping . . . . . . . . . . . . . . . . . . . . . . . . . . . 454
20.3.1 Surplus . . . . . . . . . . . . . . . . . . . . . . . . . . . . . . . . . . . . 455
20.3.2 Deficiency . . . . . . . . . . . . . . . . . . . . . . . . . . . . . . . . . . 455
20.4 The p-n junction . . . . . . . . . . . . . . . . . . . . . . . . . . . . . . . . . . . 457
20.4.1 Differences between p- and n-type semi-conductors . . . . . . . . . . . . 457
20.4.2 The p-n Junction . . . . . . . . . . . . . . . . . . . . . . . . . . . . . . 457
20.4.3 Unbiased . . . . . . . . . . . . . . . . . . . . . . . . . . . . . . . . . . . 457
20.4.4 Forward biased . . . . . . . . . . . . . . . . . . . . . . . . . . . . . . . 457
20.4.5 Reverse biased . . . . . . . . . . . . . . . . . . . . . . . . . . . . . . . . 458
20.4.6 Real-World Applications of Semiconductors . . . . . . . . . . . . . . . . 458
20.5 End of Chapter Exercises . . . . . . . . . . . . . . . . . . . . . . . . . . . . . . 459
IV Grade 12 - Physics 461
21 Motion in Two Dimensions - Grade 12 463
21.1 Introduction . . . . . . . . . . . . . . . . . . . . . . . . . . . . . . . . . . . . . 463
xiii

CONTENTS CONTENTS
21.2 Vertical Projectile Motion . . . . . . . . . . . . . . . . . . . . . . . . . . . . . . 463
21.2.1 Motion in a Gravitational Field . . . . . . . . . . . . . . . . . . . . . . . 463
21.2.2 Equations of Motion . . . . . . . . . . . . . . . . . . . . . . . . . . . . 464
21.2.3 Graphs of Vertical Projectile Motion . . . . . . . . . . . . . . . . . . . . 467
21.3 Conservation of Momentum in Two Dimensions . . . . . . . . . . . . . . . . . . 475
21.4 Types of Collisions . . . . . . . . . . . . . . . . . . . . . . . . . . . . . . . . . . 480
21.4.1 Elastic Collisions . . . . . . . . . . . . . . . . . . . . . . . . . . . . . . . 480
21.4.2 Inelastic Collisions . . . . . . . . . . . . . . . . . . . . . . . . . . . . . . 485
21.5 Frames of Reference . . . . . . . . . . . . . . . . . . . . . . . . . . . . . . . . . 490
21.5.1 Introduction . . . . . . . . . . . . . . . . . . . . . . . . . . . . . . . . . 490
21.5.2 What is a frame of reference? . . . . . . . . . . . . . . . . . . . . . . . 491
21.5.3 Why are frames of reference important? . . . . . . . . . . . . . . . . . . 491
21.5.4 Relative Velocity . . . . . . . . . . . . . . . . . . . . . . . . . . . . . . . 491
21.6 Summary . . . . . . . . . . . . . . . . . . . . . . . . . . . . . . . . . . . . . . . 494
21.7 End of chapter exercises . . . . . . . . . . . . . . . . . . . . . . . . . . . . . . . 495
22 Mechanical Properties of Matter - Grade 12 503
22.1 Introduction . . . . . . . . . . . . . . . . . . . . . . . . . . . . . . . . . . . . . 503
22.2 Deformation of materials . . . . . . . . . . . . . . . . . . . . . . . . . . . . . . 503
22.2.1 Hooke’s Law . . . . . . . . . . . . . . . . . . . . . . . . . . . . . . . . . 503
22.2.2 Deviation from Hooke’s Law . . . . . . . . . . . . . . . . . . . . . . . . 506
22.3 Elasticity, plasticity, fracture, creep . . . . . . . . . . . . . . . . . . . . . . . . . 508
22.3.1 Elasticity and plasticity . . . . . . . . . . . . . . . . . . . . . . . . . . . 508
22.3.2 Fracture, creep and fatigue . . . . . . . . . . . . . . . . . . . . . . . . . 508
22.4 Failure and strength of materials . . . . . . . . . . . . . . . . . . . . . . . . . . 509
22.4.1 The properties of matter . . . . . . . . . . . . . . . . . . . . . . . . . . 509
22.4.2 Structure and failure of materials . . . . . . . . . . . . . . . . . . . . . . 509
22.4.3 Controlling the properties of materials . . . . . . . . . . . . . . . . . . . 509
22.4.4 Steps of Roman Swordsmithing . . . . . . . . . . . . . . . . . . . . . . . 510
22.5 Summary . . . . . . . . . . . . . . . . . . . . . . . . . . . . . . . . . . . . . . . 511
22.6 End of chapter exercise . . . . . . . . . . . . . . . . . . . . . . . . . . . . . . . 511
23 Work, Energy and Power - Grade 12 513
23.1 Introduction . . . . . . . . . . . . . . . . . . . . . . . . . . . . . . . . . . . . . 513
23.2 Work . . . . . . . . . . . . . . . . . . . . . . . . . . . . . . . . . . . . . . . . . 513
23.3 Energy . . . . . . . . . . . . . . . . . . . . . . . . . . . . . . . . . . . . . . . . 519
23.3.1 External and Internal Forces . . . . . . . . . . . . . . . . . . . . . . . . 519
23.3.2 Capacity to do Work . . . . . . . . . . . . . . . . . . . . . . . . . . . . 520
23.4 Power . . . . . . . . . . . . . . . . . . . . . . . . . . . . . . . . . . . . . . . . 525
23.5 Important Equations and Quantities . . . . . . . . . . . . . . . . . . . . . . . . 529
23.6 End of Chapter Exercises . . . . . . . . . . . . . . . . . . . . . . . . . . . . . . 529
xiv

CONTENTS CONTENTS
24 Doppler Effect - Grade 12 533
24.1 Introduction . . . . . . . . . . . . . . . . . . . . . . . . . . . . . . . . . . . . . 533
24.2 The Doppler Effect with Sound and Ultrasound . . . . . . . . . . . . . . . . . . 533
24.2.1 Ultrasound and the Doppler Effect . . . . . . . . . . . . . . . . . . . . . 537
24.3 The Doppler Effect with Light . . . . . . . . . . . . . . . . . . . . . . . . . . . 537
24.3.1 The Expanding Universe . . . . . . . . . . . . . . . . . . . . . . . . . . 538
24.4 Summary . . . . . . . . . . . . . . . . . . . . . . . . . . . . . . . . . . . . . . . 539
24.5 End of Chapter Exercises . . . . . . . . . . . . . . . . . . . . . . . . . . . . . . 539
25 Colour - Grade 12 541
25.1 Introduction . . . . . . . . . . . . . . . . . . . . . . . . . . . . . . . . . . . . . 541
25.2 Colour and Light . . . . . . . . . . . . . . . . . . . . . . . . . . . . . . . . . . . 541
25.2.1 Dispersion of white light . . . . . . . . . . . . . . . . . . . . . . . . . . 544
25.3 Addition and Subtraction of Light . . . . . . . . . . . . . . . . . . . . . . . . . 544
25.3.1 Additive Primary Colours . . . . . . . . . . . . . . . . . . . . . . . . . . 544
25.3.2 Subtractive Primary Colours . . . . . . . . . . . . . . . . . . . . . . . . 545
25.3.3 Complementary Colours . . . . . . . . . . . . . . . . . . . . . . . . . . . 546
25.3.4 Perception of Colour . . . . . . . . . . . . . . . . . . . . . . . . . . . . 546
25.3.5 Colours on a Television Screen . . . . . . . . . . . . . . . . . . . . . . . 547
25.4 Pigments and Paints . . . . . . . . . . . . . . . . . . . . . . . . . . . . . . . . 548
25.4.1 Colour of opaque objects . . . . . . . . . . . . . . . . . . . . . . . . . . 548
25.4.2 Colour of transparent objects . . . . . . . . . . . . . . . . . . . . . . . . 548
25.4.3 Pigment primary colours . . . . . . . . . . . . . . . . . . . . . . . . . . 549
25.5 End of Chapter Exercises . . . . . . . . . . . . . . . . . . . . . . . . . . . . . . 550
26 2D and 3D Wavefronts - Grade 12 553
26.1 Introduction . . . . . . . . . . . . . . . . . . . . . . . . . . . . . . . . . . . . . 553
26.2 Wavefronts . . . . . . . . . . . . . . . . . . . . . . . . . . . . . . . . . . . . . . 553
26.3 The Huygens Principle . . . . . . . . . . . . . . . . . . . . . . . . . . . . . . . 554
26.4 Interference . . . . . . . . . . . . . . . . . . . . . . . . . . . . . . . . . . . . . 556
26.5 Diffraction . . . . . . . . . . . . . . . . . . . . . . . . . . . . . . . . . . . . . . 557
26.5.1 Diffraction through a Slit . . . . . . . . . . . . . . . . . . . . . . . . . . 558
26.6 Shock Waves and Sonic Booms . . . . . . . . . . . . . . . . . . . . . . . . . . . 562
26.6.1 Subsonic Flight . . . . . . . . . . . . . . . . . . . . . . . . . . . . . . . 563
26.6.2 Supersonic Flight . . . . . . . . . . . . . . . . . . . . . . . . . . . . . . 563
26.6.3 Mach Cone . . . . . . . . . . . . . . . . . . . . . . . . . . . . . . . . . 566
26.7 End of Chapter Exercises . . . . . . . . . . . . . . . . . . . . . . . . . . . . . . 568
27 Wave Nature of Matter - Grade 12 571
27.1 Introduction . . . . . . . . . . . . . . . . . . . . . . . . . . . . . . . . . . . . . 571
27.2 de Broglie Wavelength . . . . . . . . . . . . . . . . . . . . . . . . . . . . . . . 571
27.3 The Electron Microscope . . . . . . . . . . . . . . . . . . . . . . . . . . . . . . 574
27.3.1 Disadvantages of an Electron Microscope . . . . . . . . . . . . . . . . . 577
xv
CONTENTS CONTENTS
27.3.2 Uses of Electron Microscopes . . . . . . . . . . . . . . . . . . . . . . . . 577
27.4 End of Chapter Exercises . . . . . . . . . . . . . . . . . . . . . . . . . . . . . . 578
28 Electrodynamics - Grade 12 579
28.1 Introduction . . . . . . . . . . . . . . . . . . . . . . . . . . . . . . . . . . . . . 579
28.2 Electrical machines - generators and motors . . . . . . . . . . . . . . . . . . . . 579
28.2.1 Electrical generators . . . . . . . . . . . . . . . . . . . . . . . . . . . . . 580
28.2.2 Electric motors . . . . . . . . . . . . . . . . . . . . . . . . . . . . . . . 582
28.2.3 Real-life applications . . . . . . . . . . . . . . . . . . . . . . . . . . . . 582
28.2.4 Exercise - generators and motors . . . . . . . . . . . . . . . . . . . . . . 584
28.3 Alternating Current . . . . . . . . . . . . . . . . . . . . . . . . . . . . . . . . . 585
28.3.1 Exercise - alternating current . . . . . . . . . . . . . . . . . . . . . . . . 586
28.4 Capacitance and inductance . . . . . . . . . . . . . . . . . . . . . . . . . . . . . 586
28.4.1 Capacitance . . . . . . . . . . . . . . . . . . . . . . . . . . . . . . . . . 586
28.4.2 Inductance . . . . . . . . . . . . . . . . . . . . . . . . . . . . . . . . . . 586
28.4.3 Exercise - capacitance and inductance . . . . . . . . . . . . . . . . . . . 588
28.5 Summary . . . . . . . . . . . . . . . . . . . . . . . . . . . . . . . . . . . . . . . 588
28.6 End of chapter exercise . . . . . . . . . . . . . . . . . . . . . . . . . . . . . . . 589
29 Electronics - Grade 12 591
29.1 Introduction . . . . . . . . . . . . . . . . . . . . . . . . . . . . . . . . . . . . . 591
29.2 Capacitive and Inductive Circuits . . . . . . . . . . . . . . . . . . . . . . . . . . 591
29.3 Filters and Signal Tuning . . . . . . . . . . . . . . . . . . . . . . . . . . . . . . 596
29.3.1 Capacitors and Inductors as Filters . . . . . . . . . . . . . . . . . . . . . 596
29.3.2 LRC Circuits, Resonance and Signal Tuning . . . . . . . . . . . . . . . . 596
29.4 Active Circuit Elements . . . . . . . . . . . . . . . . . . . . . . . . . . . . . . . 599
29.4.1 The Diode . . . . . . . . . . . . . . . . . . . . . . . . . . . . . . . . . . 599
29.4.2 The Light Emitting Diode (LED) . . . . . . . . . . . . . . . . . . . . . . 601
29.4.3 Transistor . . . . . . . . . . . . . . . . . . . . . . . . . . . . . . . . . . 603
29.4.4 The Operational Amplifier . . . . . . . . . . . . . . . . . . . . . . . . . 607
29.5 The Principles of Digital Electronics . . . . . . . . . . . . . . . . . . . . . . . . 609
29.5.1 Logic Gates . . . . . . . . . . . . . . . . . . . . . . . . . . . . . . . . . 610
29.6 Using and Storing Binary Numbers . . . . . . . . . . . . . . . . . . . . . . . . . 616
29.6.1 Binary numbers . . . . . . . . . . . . . . . . . . . . . . . . . . . . . . . 616
29.6.2 Counting circuits . . . . . . . . . . . . . . . . . . . . . . . . . . . . . . 617
29.6.3 Storing binary numbers . . . . . . . . . . . . . . . . . . . . . . . . . . . 619
30 EM Radiation 625
30.1 Introduction . . . . . . . . . . . . . . . . . . . . . . . . . . . . . . . . . . . . . 625
30.2 Particle/wave nature of electromagnetic radiation . . . . . . . . . . . . . . . . . 625
30.3 The wave nature of electromagnetic radiation . . . . . . . . . . . . . . . . . . . 626
30.4 Electromagnetic spectrum . . . . . . . . . . . . . . . . . . . . . . . . . . . . . . 626
30.5 The particle nature of electromagnetic radiation . . . . . . . . . . . . . . . . . . 629
xvi

CONTENTS CONTENTS
30.5.1 Exercise - particle nature of EM waves . . . . . . . . . . . . . . . . . . . 630
30.6 Penetrating ability of electromagnetic radiation . . . . . . . . . . . . . . . . . . 631
30.6.1 Ultraviolet(UV) radiation and the skin . . . . . . . . . . . . . . . . . . . 631
30.6.2 Ultraviolet radiation and the eyes . . . . . . . . . . . . . . . . . . . . . . 632
30.6.3 X-rays . . . . . . . . . . . . . . . . . . . . . . . . . . . . . . . . . . . . 632
30.6.4 Gamma-rays . . . . . . . . . . . . . . . . . . . . . . . . . . . . . . . . . 632
30.6.5 Exercise - Penetrating ability of EM radiation . . . . . . . . . . . . . . . 633
30.7 Summary . . . . . . . . . . . . . . . . . . . . . . . . . . . . . . . . . . . . . . . 633
30.8 End of chapter exercise . . . . . . . . . . . . . . . . . . . . . . . . . . . . . . . 633
31 Optical Phenomena and Properties of Matter - Grade 12 635
31.1 Introduction . . . . . . . . . . . . . . . . . . . . . . . . . . . . . . . . . . . . . 635
31.2 The transmission and scattering of light . . . . . . . . . . . . . . . . . . . . . . 635
31.2.1 Energy levels of an electron . . . . . . . . . . . . . . . . . . . . . . . . . 635
31.2.2 Interaction of light with metals . . . . . . . . . . . . . . . . . . . . . . . 636
31.2.3 Why is the sky blue? . . . . . . . . . . . . . . . . . . . . . . . . . . . . 637
31.3 The photoelectric effect . . . . . . . . . . . . . . . . . . . . . . . . . . . . . . . 638
31.3.1 Applications of the photoelectric effect . . . . . . . . . . . . . . . . . . . 640
31.3.2 Real-life applications . . . . . . . . . . . . . . . . . . . . . . . . . . . . 642
31.4 Emission and absorption spectra . . . . . . . . . . . . . . . . . . . . . . . . . . 643
31.4.1 Emission Spectra . . . . . . . . . . . . . . . . . . . . . . . . . . . . . . 643
31.4.2 Absorption spectra . . . . . . . . . . . . . . . . . . . . . . . . . . . . . 644
31.4.3 Colours and energies of electromagnetic radiation . . . . . . . . . . . . . 646
31.4.4 Applications of emission and absorption spectra . . . . . . . . . . . . . . 648
31.5 Lasers . . . . . . . . . . . . . . . . . . . . . . . . . . . . . . . . . . . . . . . . 650
31.5.1 How a laser works . . . . . . . . . . . . . . . . . . . . . . . . . . . . . . 652
31.5.2 A simple laser . . . . . . . . . . . . . . . . . . . . . . . . . . . . . . . . 654
31.5.3 Laser applications and safety . . . . . . . . . . . . . . . . . . . . . . . . 655
31.6 Summary . . . . . . . . . . . . . . . . . . . . . . . . . . . . . . . . . . . . . . . 656
31.7 End of chapter exercise . . . . . . . . . . . . . . . . . . . . . . . . . . . . . . . 657
V Exercises 659
32 Exercises 661
VI Essays 663
Essay 1: Energy and electricity. Why the fuss? 665
33 Essay: How a cell phone works 671
34 Essay: How a Physiotherapist uses the Concept of Levers 673
35 Essay: How a Pilot Uses Vectors 675
xvii

CONTENTS CONTENTS
A GNU Free Documentation License 677
xviii

Part II
Grade 10 - Physics
5


here we go ... again and again....
7

8

Chapter 2
Units
2.1 Introduction
Imagine you had to make curtains and needed to buy fabric. The shop assistant would needto know how much fabric you needed. Telling her you need fabric 2 wide and 6 long would beinsufficient — you have to specify the unit (i.e. 2 metres wide and 6 metres long). Withoutthe unit the information is incomplete and the shop assistant would have to guess. If you weremaking curtains for a doll’s house the dimensions might be 2 centimetres wide and 6 centimetreslong!
It is not just lengths that have units, all physical quantities have units (e.g. time, temperature,distance, etc.).
Definition: Physical QuantityA physical quantity is anything that you can measure. For example, length, temperature,distance and time are physical quantities.
2.2 Unit Systems
2.2.1 SI Units
We will be using the SI units in this course. SI units are the internationally agreed upon units.Historically these units are based on the metric system which was developed in France at thetime of the French Revolution.
Definition: SI UnitsThe name SI units comes from the French Systeme International d’Unites, which meansinternational system of units.
There are seven base SI units. These are listed in Table 2.1. All physical quantities have unitswhich can be built from these seven base units. These seven units were defined to be the baseunits. So, it is possible to create a different set of units by defining a different set of base units.
These seven units are called base units because none of them can be expressed as combinationsof the other six. This is identical to bricks and concrete being the base units of a building. Youcan build different things using different combinations of bricks and concrete. The 26 letters ofthe alphabet are the base units for a language like English. Many different words can be formedby using these letters.
9

2.3 CHAPTER 2. UNITS
Base quantity Name Symbollength metre mmass kilogram kgtime second s
electric current ampere Atemperature kelvin K
amount of substance mole molluminous intensity candela cd
Table 2.1: SI Base Units
2.2.2 The Other Systems of Units
The SI Units are not the only units available, but they are most widely used. In Science thereare three other sets of units that can also be used. These are mentioned here for interest only.
c.g.s Units
In the c.g.s. system, the metre is replaced by the centimetre and the kilogram is replaced by thegram. This is a simple change but it means that all units derived from these two are changed.For example, the units of force and work are different. These units are used most often inastrophysics and atomic physics.
Imperial Units
Imperial units arose when kings and queens decided the measures that were to be used in theland. All the imperial base units, except for the measure of time, are different to those of SIunits. This is the unit system you are most likely to encounter if SI units are not used. Examplesof imperial units are pounds, miles, gallons and yards. These units are used by the Americansand British. As you can imagine, having different units in use from place to place makes scientificcommunication very difficult. This was the motivation for adopting a set of internationally agreedupon units.
Natural Units
This is the most sophisticated choice of units. Here the most fundamental discovered quantities(such as the speed of light) are set equal to 1. The argument for this choice is that all otherquantities should be built from these fundamental units. This system of units is used in highenergy physics and quantum mechanics.
2.3 Writing Units as Words or Symbols
Unit names are always written with a lowercase first letter, for example, we write metre and litre.The symbols or abbreviations of units are also written with lowercase initials, for example m formetre and ℓ for litre. The exception to this rule is if the unit is named after a person, then thesymbol is a capital letter. For example, the kelvin was named after Lord Kelvin and its symbol isK. If the abbreviation of the unit that is named after a person has two letters, the second letteris lowercase, for example Hz for hertz.
Exercise: Naming of UnitsFor the following symbols of units that you will come across later in this book,
write whether you think the unit is named after a person or not.
10

CHAPTER 2. UNITS 2.3
1. J (joule)
2. ℓ (litre)
3. N (newton)
4. mol (mole)
5. C (coulomb)
6. lm (lumen)
7. m (metre)
8. bar (bar)
11

2.4 CHAPTER 2. UNITS
2.4 Combinations of SI Base Units
To make working with units easier, some combinations of the base units are given special names,but it is always correct to reduce everything to the base units. Table 2.2 lists some examplesof combinations of SI base units that are assigned special names. Do not be concerned if theformulae look unfamiliar at this stage - we will deal with each in detail in the chapters ahead (aswell as many others)!
It is very important that you are able to recognise the units correctly. For instance, the new-ton (N) is another name for the kilogram metre per second squared (kg·m·s−2), while thekilogram metre squared per second squared (kg·m2 ·s−2) is called the joule (J).
Quantity FormulaUnit Expressed in Name of
Base Units CombinationForce ma kg·m·s−2 N (newton)
Frequency 1T
s−1 Hz (hertz)Work F.s kg·m2 ·s−2 J (joule)
Table 2.2: Some examples of combinations of SI base units assigned special names
Important: When writing combinations of base SI units, place a dot (·) between the unitsto indicate that different base units are used. For example, the symbol for metres per secondis correctly written as m·s−1, and not as ms−1 or m/s.
2.5 Rounding, Scientific Notation and Significant Figures
2.5.1 Rounding Off
Certain numbers may take an infinite amount of paper and ink to write out. Not only isthat impossible, but writing numbers out to a high accuracy (many decimal places) is veryinconvenient and rarely gives better answers. For this reason we often estimate the number to acertain number of decimal places. Rounding off or approximating a decimal number to a givennumber of decimal places is the quickest way to approximate a number. For example, if youwanted to round-off 2,6525272 to three decimal places then you would first count three placesafter the decimal.
2,652|5272
All numbers to the right of | are ignored after you determine whether the number in the thirddecimal place must be rounded up or rounded down. You round up the final digit (make thedigit one more) if the first digit after the | was greater or equal to 5 and round down (leave thedigit alone) otherwise. So, since the first digit after the | is a 5, we must round up the digit inthe third decimal place to a 3 and the final answer of 2,6525272 rounded to three decimal placesis 2,653.
Worked Example 1: Rounding-off
Question: Round-off π = 3,141592654 . . . to 4 decimal places.AnswerStep 1 : Determine the last digit that is kept and mark the cut-off with |.π = 3,1415|92654 . . .Step 2 : Determine whether the last digit is rounded up or down.The last digit of π = 3,1415|92654 . . . must be rounded up because there is a 9 afterthe |.Step 3 : Write the final answer.π = 3,1416 rounded to 4 decimal places.
12

CHAPTER 2. UNITS 2.5
Worked Example 2: Rounding-off
Question: Round-off 9,191919 . . . to 2 decimal placesAnswerStep 1 : Determine the last digit that is kept and mark the cut-off with |.9,19|1919 . . .Step 2 : Determine whether the last digit is rounded up or down.The last digit of 9,19|1919 . . . must be rounded down because there is a 1 afterthe |.Step 3 : Write the final answer.Answer = 9,19 rounded to 2 decimal places.
2.5.2 Error Margins
In a calculation that has many steps, it is best to leave the rounding off right until the end. Forexample, Jack and Jill walks to school. They walk 0,9 kilometers to get to school and it takesthem 17 minutes. We can calculate their speed in the following two ways.
Method 1 Method 2Change 17 minutes to hours: Change 17 minutes to hours:
time = 1760 time = 17
60= 0,283333333 km = 0,28 km
Speed =DistanceTime
Speed =DistanceTime
= 0,90,28333333 = 0,9
0,28
= 3,176470588 = 3,2142857143,18 km·hr−1 3,21 km·hr−1
Table 2.3: Rounding numbers
You will see that we get two different answers. In Method 1 no rounding was done, but in Method2, the time was rounded to 2 decimal places. This made a big difference to the answer. Theanswer in Method 1 is more accurate because rounded numbers were not used in the calculation.Always only round off your final answer.
2.5.3 Scientific Notation
In Science one often needs to work with very large or very small numbers. These can be writtenmore easily in scientific notation, in the general form
d × 10e
where d is a decimal number between 0 and 10 that is rounded off to a few decimal places. e isknown as the exponent and is an integer. If e > 0 it represents how many times the decimalplace in d should be moved to the right. If e < 0, then it represents how many times the decimalplace in d should be moved to the left. For example 3,24 × 10³ represents 3240 (the decimalmoved three places to the right) and 3,24× 10⁻³ represents 0,00324 (the decimal moved threeplaces to the left).
If a number must be converted into scientific notation, we need to work out how many timesthe number must be multiplied or divided by 10 to make it into a number between 1 and 10(i.e. the value of e) and what this number between 1 and 10 is (the value of d). We do this bycounting the number of decimal places the decimal comma must move.
For example, write the speed of light in scientific notation, to two decimal places. The speed oflight is 299 792 458 m·s−1. First, find where the decimal comma must go for two decimal places(to find d) and then count how many places there are after the decimal comma to determine e.
13

2.5 CHAPTER 2. UNITS
In this example, the decimal comma must go after the first 2, but since the number after the 9is 7, d = 3,00. e = 8 because there are 8 digits left after the decimal comma. So the speed oflight in scientific notation, to two decimal places is 3,00 × 10⁸ m·s−1.
14

CHAPTER 2. UNITS 2.6
2.5.4 Significant Figures
In a number, each non-zero digit is a significant figure. Zeroes are only counted if they arebetween two non-zero digits or are at the end of the decimal part. For example, the number2000 has 1 significant figure (the 2), but 2000,0 has 5 significant figures. You estimate a numberlike this by removing significant figures from the number (starting from the right) until you havethe desired number of significant figures, rounding as you go. For example 6,827 has 4 significantfigures, but if you wish to write it to 3 significant figures it would mean removing the 7 androunding up, so it would be 6,83.
Exercise: Using Significant Figures
1. Round the following numbers:
(a) 123,517 ℓ to 2 decimal places
(b) 14,328 km·h−1 to one decimal place
(c) 0,00954 m to 3 decimal places
2. Write the following quantities in scientific notation:
(a) 10130 Pa to 2 decimal places
(b) 978,15 m·s−2 to one decimal place
(c) 0,000001256 A to 3 decimal places
3. Count how many significant figures each of the quantities below has:
(a) 2,590 km
(b) 12,305 mℓ
(c) 7800 kg
2.6 Prefixes of Base Units
Now that you know how to write numbers in scientific notation, another important aspect ofunits is the prefixes that are used with the units.
Definition: PrefixA prefix is a group of letters that are placed in front of a word. The effect of the prefix is tochange meaning of the word. For example, the prefix un is often added to a word to meannot, as in unnecessary which means not necessary.
In the case of units, the prefixes have a special use. The kilogram (kg) is a simple example.1 kg is equal to 1 000 g or 1 × 10³ g. Grouping the 103 and the g together we can replace the103 with the prefix k (kilo). Therefore the k takes the place of the 103.The kilogram is unique in that it is the only SI base unit containing a prefix.
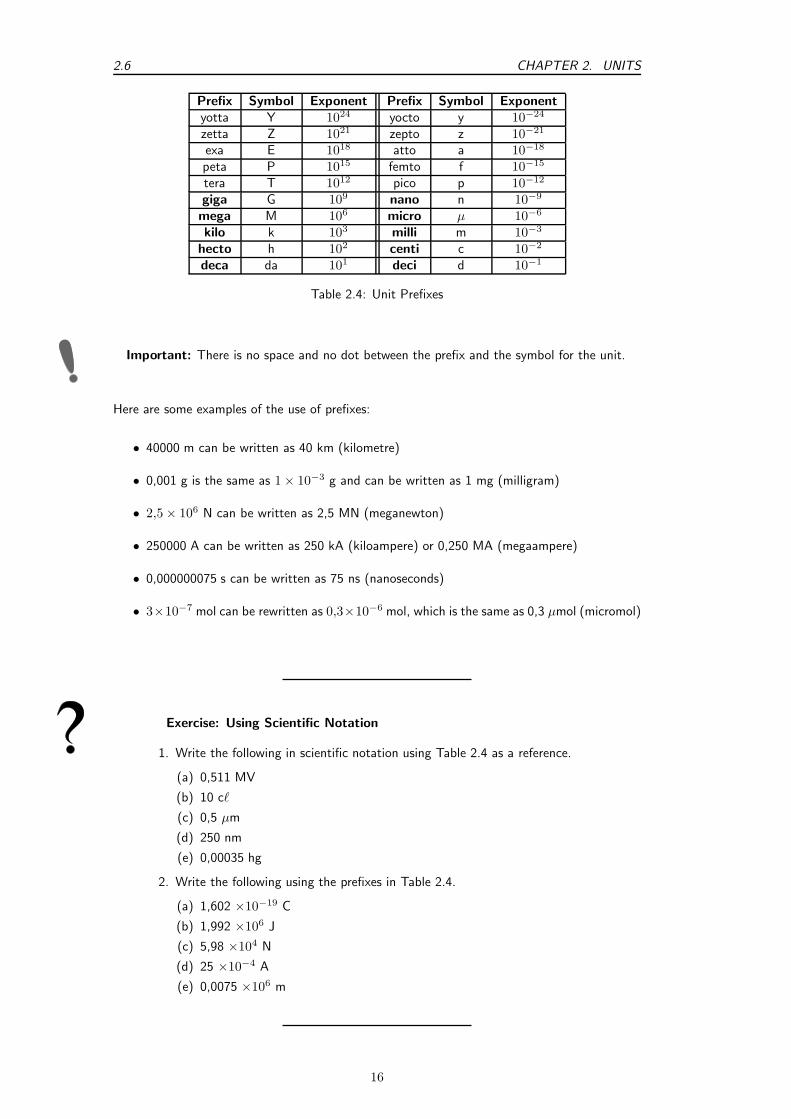
In Science, all the prefixes used with units are some power of 10. Table 2.4 lists some ofthese prefixes. You will not use most of these prefixes, but those prefixes listed in bold shouldbe learnt. The case of the prefix symbol is very important. Where a letter features twice in thetable, it is written in uppercase for exponents bigger than one and in lowercase for exponentsless than one. For example M means mega (106) and m means milli (10−3).
15
2.6 CHAPTER 2. UNITS
Prefix Symbol Exponent Prefix Symbol Exponentyotta Y 1024 yocto y 10−24
zetta Z 1021 zepto z 10−21
exa E 1018 atto a 10−18
peta P 1015 femto f 10−15
tera T 1012 pico p 10−12
giga G 109 nano n 10−9
mega M 106 micro µ 10−6
kilo k 103 milli m 10−3
hecto h 102 centi c 10−2
deca da 101 deci d 10−1
Table 2.4: Unit Prefixes
Important: There is no space and no dot between the prefix and the symbol for the unit.
Here are some examples of the use of prefixes:
• 40000 m can be written as 40 km (kilometre)
• 0,001 g is the same as 1 × 10⁻³ g and can be written as 1 mg (milligram)
• 2,5 × 10⁶ N can be written as 2,5 MN (meganewton)
• 250000 A can be written as 250 kA (kiloampere) or 0,250 MA (megaampere)
• 0,000000075 s can be written as 75 ns (nanoseconds)
• 3×10⁻⁷ mol can be rewritten as 0,3×10⁻⁶ mol, which is the same as 0,3 µmol (micromol)
Exercise: Using Scientific Notation
1. Write the following in scientific notation using Table 2.4 as a reference.
(a) 0,511 MV
(b) 10 cℓ
(c) 0,5 µm
(d) 250 nm
(e) 0,00035 hg
2. Write the following using the prefixes in Table 2.4.
(a) 1,602 ×10−19 C
(b) 1,992 ×106 J
(c) 5,98 ×10⁴ N
(d) 25 ×10−4 A
(e) 0,0075 ×10⁶ m
16

CHAPTER 2. UNITS 2.7
2.7 The Importance of Units
Without units much of our work as scientists would be meaningless. We need to express ourthoughts clearly and units give meaning to the numbers we measure and calculate. Dependingon which units we use, the numbers are different. For example if you have 12 water, it meansnothing. You could have 12 ml of water, 12 litres of water, or even 12 bottles of water. Unitsare an essential part of the language we use. Units must be specified when expressing physicalquantities. Imagine that you are baking a cake, but the units, like grams and millilitres, for theflour, milk, sugar and baking powder are not specified!
Activity :: Investigation : Importance of UnitsWork in groups of 5 to discuss other possible situations where using the incorrect
set of units can be to your disadvantage or even dangerous. Look for examples athome, at school, at a hospital, when travelling and in a shop.
Activity :: Case Study : The importance of unitsRead the following extract from CNN News 30 September 1999 and answer the
questions below.NASA: Human error caused loss of Mars orbiter November 10, 1999Failure to convert English measures to metric values caused the loss of the Mars
Climate Orbiter, a spacecraft that smashed into the planet instead of reaching a safeorbit, a NASA investigation concluded Wednesday.
The Mars Climate Orbiter, a key craft in the space agency’s exploration of thered planet, vanished on 23 September after a 10 month journey. It is believed thatthe craft came dangerously close to the atmosphere of Mars, where it presumablyburned and broke into pieces.
An investigation board concluded that NASA engineers failed to convert Englishmeasures of rocket thrusts to newton, a metric system measuring rocket force. OneEnglish pound of force equals 4,45 newtons. A small difference between the twovalues caused the spacecraft to approach Mars at too low an altitude and the craftis thought to have smashed into the planet’s atmosphere and was destroyed.
The spacecraft was to be a key part of the exploration of the planet. From itsstation about the red planet, the Mars Climate Orbiter was to relay signals from theMars Polar Lander, which is scheduled to touch down on Mars next month.
“The root cause of the loss of the spacecraft was a failed translation of Englishunits into metric units and a segment of ground-based, navigation-related missionsoftware,” said Arthus Stephenson, chairman of the investigation board.
Questions:
1. Why did the Mars Climate Orbiter crash? Answer in your own words.
2. How could this have been avoided?
3. Why was the Mars Orbiter sent to Mars?
4. Do you think space exploration is important? Explain your answer.
2.8 How to Change Units
It is very important that you are aware that different systems of units exist. Furthermore, youmust be able to convert between units. Being able to change between units (for example,converting from millimetres to metres) is a useful skill in Science.
17

2.8 CHAPTER 2. UNITS
The following conversion diagrams will help you change from one unit to another.
mm m km
÷1000 ÷1000
×1000 ×1000
Figure 2.1: The distance conversion table
If you want to change millimetre to metre, you divide by 1000 (follow the arrow from mm to m);or if you want to change kilometre to millimetre, you multiply by 1000×1000.
The same method can be used to change millilitre to litre or kilolitre. Use figure 2.2 to changevolumes:
mℓ ℓ kℓ
÷1000 ÷1000
×1000 ×1000
cm3 dm3 m3
Figure 2.2: The volume conversion table
Worked Example 3: Conversion 1
Question: Express 3 800 mm in metres.AnswerStep 1 : Find the two units on the conversion diagram.Use Figure 2.1 . Millimetre is on the left and metre in the middle.
Step 2 : Decide whether you are moving to the left or to the right.You need to go from mm to m, so you are moving from left to right.
Step 3 : Read from the diagram what you must do and find the answer.3 800 mm ÷ 1000 = 3,8 m
Worked Example 4: Conversion 2
Question: Convert 4,56 kg to g.AnswerStep 1 : Find the two units on the conversion diagram.Use Figure 2.1. Kilogram is the same as kilometre and gram the same as metre.
Step 2 : Decide whether you are moving to the left or to the right.You need to go from kg to g, so it is from right to left.
Step 3 : Read from the diagram what you must do and find the answer.4,56 kg × 1000 = 4560 g
18

CHAPTER 2. UNITS 2.9
2.8.1 Two other useful conversions
Very often in Science you need to convert speed and temperature. The following two rules willhelp you do this:
Converting speedWhen converting km·h−1 to m·s−1you divide by 3,6. For example 72 km·h−1 ÷ 3,6 = 20 m·s−1.
When converting m·s−1to km·h−1, you multiply by 3,6. For example 30 m·s−1×3,6 = 108 km·h−1.
Converting temperatureConverting between the kelvin and celsius temperature scales is easy. To convert from celsiusto kelvin add 273. To convert from kelvin to celsius subtract 273. Representing the kelvintemperature by TK and the celsius temperature by ToC ,
TK = ToC + 273
2.9 A sanity test
A sanity test is a method of checking whether an answer makes sense. All we have to do is totake a careful look at our answer and ask the question Does the answer make sense?
Imagine you were calculating the number of people in a classroom. If the answer you got was1 000 000 people you would know it was wrong — it is not possible to have that many peoplein a classroom. That is all a sanity test is — is your answer insane or not?
It is useful to have an idea of some numbers before we start. For example, let us consider masses.An average person has a mass around 70 kg, while the heaviest person in medical history had amass of 635 kg. If you ever have to calculate a person’s mass and you get 7 000 kg, this shouldfail your sanity check — your answer is insane and you must have made a mistake somewhere.In the same way an answer of 0.01 kg should fail your sanity test.
The only problem with a sanity check is that you must know what typical values for things are.For example, finding the number of learners in a classroom you need to know that there areusually 20–50 people in a classroom. If you get and answer of 2500, you should realise that it iswrong.
Activity :: The scale of the matter... : Try to get an idea of the typicalvalues for the following physical quantities and write your answers into thetable:
Category Quantity Minimum Maximum
Peoplemassheight
Transport
speed of cars on freewaysspeed of trainsspeed of aeroplanesdistance between home and school
Generalthickness of a sheet of paperheight of a doorway
2.10 Summary
1. You need to know the seven base SI Units as listed in table 2.1. Combinations of SI Unitscan have different names.
19

2.10 CHAPTER 2. UNITS
2. Unit names and abbreviations are written with lowercase letter unless it is named after aperson.
3. Rounding numbers and using scientific notation is important.
4. Table 2.4 summarises the prefixes used in Science.
5. Use figures 2.1 and 2.2 to convert between units.
20

CHAPTER 2. UNITS 2.11
2.11 End of Chapter Exercises
1. Write down the SI unit for the each of the following quantities:
(a) length
(b) time
(c) mass
(d) quantity of matter
(4)
2. For each of the following units, write down the symbol and what power of 10 it represents:
(a) millimetre
(b) centimetre
(c) metre
(d) kilometre
(4)
3. For each of the following symbols, write out the unit in full and write what power of 10 itrepresents:
(a) µg
(b) mg
(c) kg
(d) Mg
(4)
4. Write each of the following in scientific notation, correct to 2 decimal places:
(a) 0,00000123 N
(b) 417 000 000 kg
(c) 246800 A
(d) 0,00088 mm
(4)
5. Rewrite each of the following, using the correct prefix uisng 2 decimal places where appli-cable:
(a) 0,00000123 N
(b) 417 000 000 kg
(c) 246800 A
(d) 0,00088 mm
(4)
6. For each of the following, write the measurement using the correct symbol for the prefixand the base unit:
(a) 1,01 microseconds
(b) 1 000 milligrams
(c) 7,2 megameters
(d) 11 nanolitre
(4)
7. The Concorde is a type of aeroplane that flies very fast. The top speed of the Concorde is844 km·hr−1. Convert the Concorde’s top speed to m·s−1.
(3)
8. The boiling point of water is 100 C. What is the boiling point of water in kelvin?
(3)
Total = 30
21

2.11 CHAPTER 2. UNITS
22

Chapter 3
Motion in One Dimension - Grade10
3.1 Introduction
This chapter is about how things move in a straight line or more scientifically how things move in
one dimension. This is useful for learning how to describe the movement of cars along a straightroad or of trains along straight railway tracks. If you want to understand how any object moves,for example a car on the freeway, a soccer ball being kicked towards the goal or your dog chasingthe neighbour’s cat, then you have to understand three basic ideas about what it means whensomething is moving. These three ideas describe different parts of exactly how an object moves.They are:
1. position or displacement which tells us exactly where the object is,
2. speed or velocity which tells us exactly how fast the object’s position is changing or morefamiliarly, how fast the object is moving, and
3. acceleration which tells us exactly how fast the object’s velocity is changing.
You will also learn how to use position, displacement, speed, velocity and acceleration to describethe motion of simple objects. You will learn how to read and draw graphs that summarise themotion of a moving object. You will also learn about the equations that can be used to describemotion and how to apply these equations to objects moving in one dimension.
3.2 Reference Point, Frame of Reference and Position
The most important idea when studying motion, is you have to know where you are. Theword position describes your location (where you are). However, saying that you are here ismeaningless, and you have to specify your position relative to a known reference point. Forexample, if you are 2 m from the doorway, inside your classroom then your reference point isthe doorway. This defines your position inside the classroom. Notice that you need a referencepoint (the doorway) and a direction (inside) to define your location.
3.2.1 Frames of Reference
Definition: Frame of ReferenceA frame of reference is a reference point combined with a set of directions.
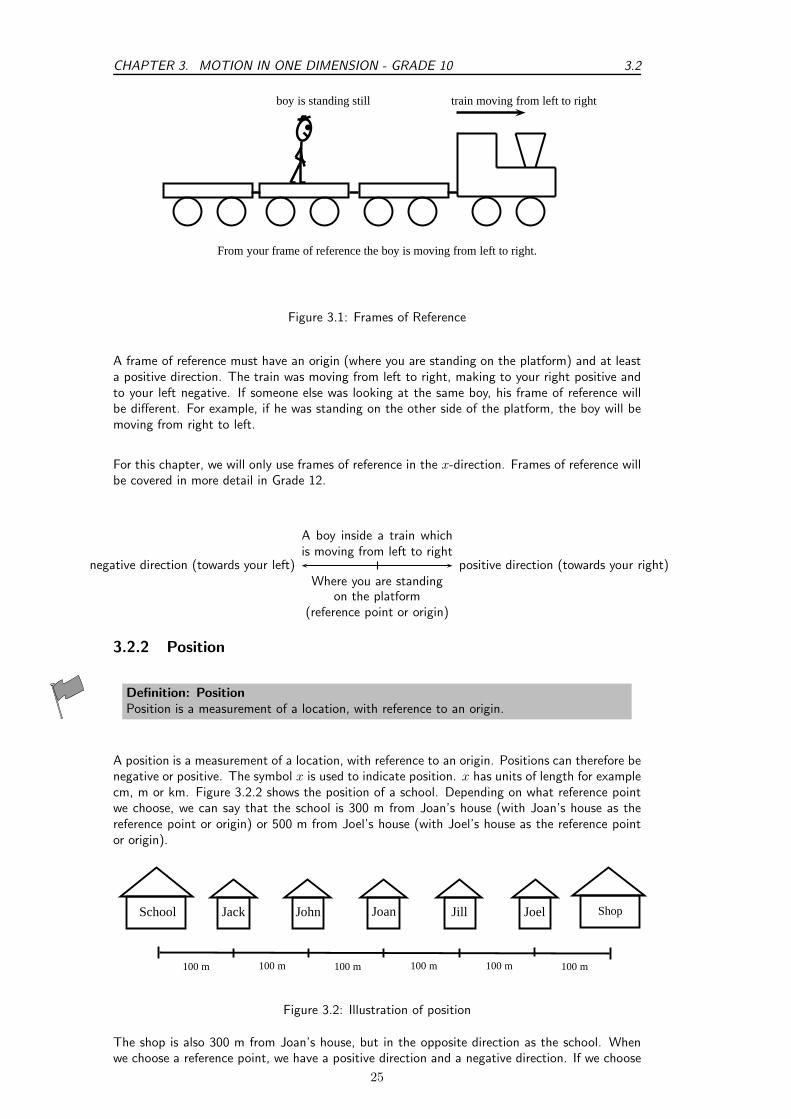
A frame of reference is similar to the idea of a reference point. A frame of reference is definedas a reference point combined with a set of directions. For example, a boy is standing still inside
23
3.2 CHAPTER 3. MOTION IN ONE DIMENSION - GRADE 10
a train as it pulls out of a station. You are standing on the platform watching the train movefrom left to right. To you it looks as if the boy is moving from left to right, because relativeto where you are standing (the platform), he is moving. According to the boy, and his frame of
reference (the train), he is not moving.
24
CHAPTER 3. MOTION IN ONE DIMENSION - GRADE 10 3.2
b
train moving from left to rightboy is standing still
From your frame of reference the boy is moving from left to right.
Figure 3.1: Frames of Reference
A frame of reference must have an origin (where you are standing on the platform) and at leasta positive direction. The train was moving from left to right, making to your right positive andto your left negative. If someone else was looking at the same boy, his frame of reference willbe different. For example, if he was standing on the other side of the platform, the boy will bemoving from right to left.
For this chapter, we will only use frames of reference in the x-direction. Frames of reference willbe covered in more detail in Grade 12.
A boy inside a train whichis moving from left to right
Where you are standingon the platform
(reference point or origin)
positive direction (towards your right)negative direction (towards your left)
3.2.2 Position
Definition: PositionPosition is a measurement of a location, with reference to an origin.
A position is a measurement of a location, with reference to an origin. Positions can therefore benegative or positive. The symbol x is used to indicate position. x has units of length for examplecm, m or km. Figure 3.2.2 shows the position of a school. Depending on what reference pointwe choose, we can say that the school is 300 m from Joan’s house (with Joan’s house as thereference point or origin) or 500 m from Joel’s house (with Joel’s house as the reference pointor origin).
100 m 100 m 100 m 100 m 100 m 100 m
ShopSchool Jack John Joan Jill Joel
Figure 3.2: Illustration of position
The shop is also 300 m from Joan’s house, but in the opposite direction as the school. Whenwe choose a reference point, we have a positive direction and a negative direction. If we choose
25
3.2 CHAPTER 3. MOTION IN ONE DIMENSION - GRADE 10
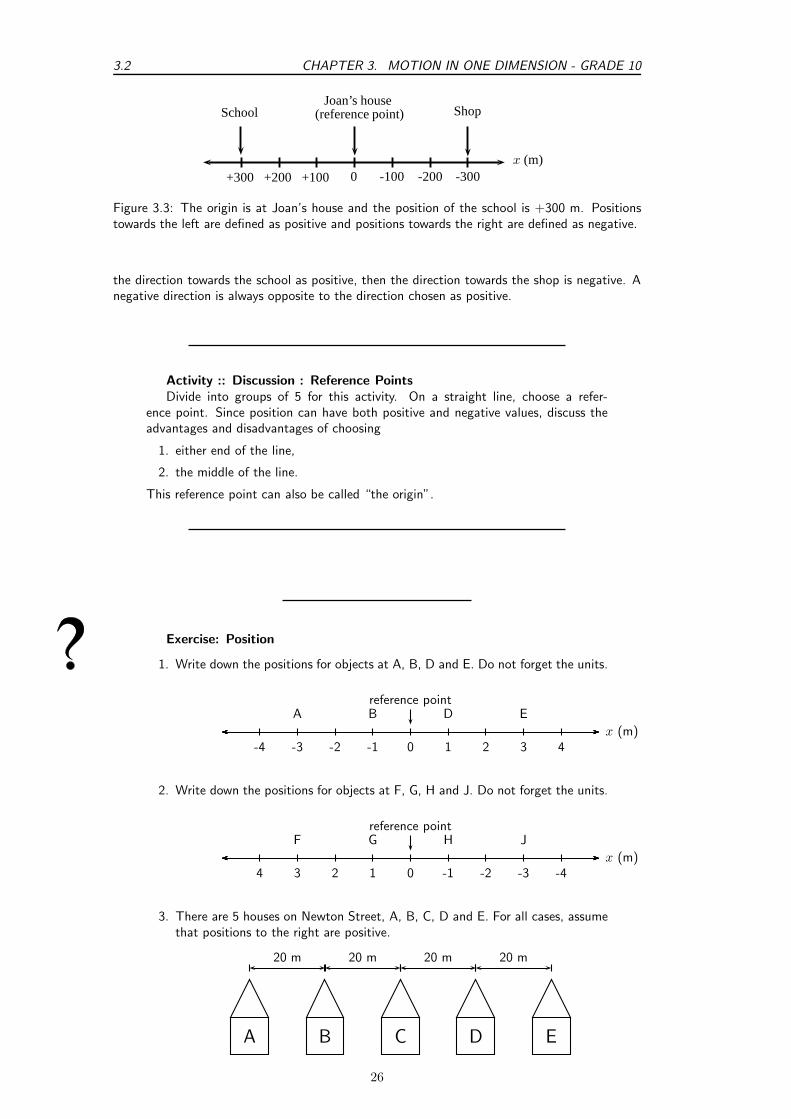
+300 +200 +100 0 -100 -200 -300
SchoolJoan’s house
(reference point) Shop
x (m)
Figure 3.3: The origin is at Joan’s house and the position of the school is +300 m. Positionstowards the left are defined as positive and positions towards the right are defined as negative.
the direction towards the school as positive, then the direction towards the shop is negative. Anegative direction is always opposite to the direction chosen as positive.
Activity :: Discussion : Reference PointsDivide into groups of 5 for this activity. On a straight line, choose a refer-
ence point. Since position can have both positive and negative values, discuss theadvantages and disadvantages of choosing
1. either end of the line,
2. the middle of the line.
This reference point can also be called “the origin”.
Exercise: Position
1. Write down the positions for objects at A, B, D and E. Do not forget the units.
-4 -3 -2 -1 0 1 2 3 4x (m)
reference pointA B D E
2. Write down the positions for objects at F, G, H and J. Do not forget the units.
-4-3-2-101234x (m)
reference pointF G H J
3. There are 5 houses on Newton Street, A, B, C, D and E. For all cases, assumethat positions to the right are positive.
20 m 20 m 20 m 20 m
A B C D E
26

CHAPTER 3. MOTION IN ONE DIMENSION - GRADE 10 3.2
(a) Draw a frame of reference with house A as the origin and write down thepositions of houses B, C, D and E.
(b) You live in house C. What is your position relative to house E?
(c) What are the positions of houses A, B and D, if house B is taken as thereference point?
27

3.3 CHAPTER 3. MOTION IN ONE DIMENSION - GRADE 10
3.3 Displacement and Distance
Definition: DisplacementDisplacement is the change in an object’s position.
The displacement of an object is defined as its change in position (final position minus initialposition). Displacement has a magnitude and direction and is therefore a vector. For example,if the initial position of a car is xi and it moves to a final position of xf , then the displacementis:
xf − xi
However, subtracting an initial quantity from a final quantity happens often in Physics, so weuse the shortcut ∆ to mean final - initial. Therefore, displacement can be written:
∆x = xf − xi
Important: The symbol ∆ is read out as delta. ∆ is a letter of the Greek alphabet and isused in Mathematics and Science to indicate a change in a certain quantity, or a final valueminus an initial value. For example, ∆x means change in x while ∆t means change in t.
Important: The words initial and final will be used very often in Physics. Initial will alwaysrefer to something that happened earlier in time and final will always refer to somethingthat happened later in time. It will often happen that the final value is smaller than theinitial value, such that the difference is negative. This is ok!
b
b
Start(School)
Finish(Shop)
Displac
emen
t
Figure 3.4: Illustration of displacement
Displacement does not depend on the path travelled, but only on the initial and final positions(Figure 3.4). We use the word distance to describe how far an object travels along a particularpath. Distance is the actual distance that was covered. Distance (symbol d) does not have adirection, so it is a scalar. Displacement is the shortest distance from the starting point to theendpoint – from the school to the shop in the figure. Displacement has direction and is thereforea vector.
Figure 3.2.2 shows the five houses we discussed earlier. Jack walks to school, but instead ofwalking straight to school, he decided to walk to his friend Joel’s house first to fetch him so thatthey can walk to school together. Jack covers a distance of 400 m to Joel’s house and another500 m to school. He covers a distance of 900 m. His displacement, however, is only 100 mtowards the school. This is because displacement only looks at the starting position (his house)and the end position (the school). It does not depend on the path he travelled.
28

CHAPTER 3. MOTION IN ONE DIMENSION - GRADE 10 3.3
To calculate his distance and displacement, we need to choose a reference point and a direction.Let’s choose Jack’s house as the reference point, and towards Joel’s house as the positive direc-tion (which means that towards the school is negative). We would do the calculations as follows:
Distance(d) = path travelled
= 400 m + 500 m
= 900 m
Displacement(∆x) = xf − xi
= −100 m + 0 m
= −100 m
Joel walks to school with Jack and after school walks back home. What is Joel’s displacementand what distance did he cover? For this calculation we use Joel’s house as the reference point.Let’s take towards the school as the positive direction.
Distance(d) = path travelled
= 500 m + 500 m
= 1000 m
Displacement(∆x) = xf − xi
= 0 m + 0 m
= 0 m
It is possible to have a displacement of 0 m and a distance that is not 0 m. This happenswhen an object completes a round trip back to its original position, like an athlete runningaround a track.
3.3.1 Interpreting Direction
Very often in calculations you will get a negative answer. For example, Jack’s displacement inthe example above, is calculated as -100 m. The minus sign in front of the answer means thathis displacement is 100 m in the opposite direction (opposite to the direction chosen as positivein the beginning of the question). When we start a calculation we choose a frame of referenceand a positive direction. In the first example above, the reference point is Jack’s house and thepositive direction is towards Joel’s house. Therefore Jack’s displacement is 100 m towards theschool. Notice that distance has no direction, but displacement has.
3.3.2 Differences between Distance and Displacement
Definition: Vectors and ScalarsA vector is a physical quantity with magnitude (size) and direction. A scalar is a physicalquantity with magnitude (size) only.
The differences between distance and displacement can be summarised as:
Distance Displacement1. depends on the path 1. independent of path taken2. always positive 2. can be positive or negative3. is a scalar 3. is a vector
Exercise: Point of Reference
1. Use Figure 3.2.2 to answer the following questions.
(a) Jill walks to Joan’s house and then to school, what is her distance anddisplacement?
(b) John walks to Joan’s house and then to school, what is his distance anddisplacement?
29
3.3 CHAPTER 3. MOTION IN ONE DIMENSION - GRADE 10
(c) Jack walks to the shop and then to school, what is his distance and dis-placement?
(d) What reference point did you use for each of the above questions?
2. You stand at the front door of your house (displacement, ∆x = 0 m). Thestreet is 10 m away from the front door. You walk to the street and back again.
(a) What is the distance you have walked?
(b) What is your final displacement?
(c) Is displacement a vector or a scalar? Give a reason for your answer.
30

CHAPTER 3. MOTION IN ONE DIMENSION - GRADE 10 3.4
3.4 Speed, Average Velocity and Instantaneous Velocity
Definition: VelocityVelocity is the rate of change of position.
Definition: Instantaneous velocityInstantaneous velocity is the velocity of an accelerating body at a specific instant in time.
Definition: Average velocityAverage velocity is the total displacement of a body over a time interval.
Velocity is the rate of change of position. It tells us how much an object’s position changes intime. This is the same as the displacement divided by the time taken. Since displacement is avector and time taken is a scalar, velocity is also a vector. We use the symbol v for velocity. Ifwe have a displacement of ∆x and a time taken of ∆t, v is then defined as:
velocity (in m · s−1) =change in displacement (in m)
change in time (in s)
v =∆x
∆t
Velocity can be positive or negative. Positive values of velocity mean that the object is movingaway from the reference point or origin and negative values mean that the object is movingtowards the reference point or origin.
Important: An instant in time is different from the time taken or the time interval. Itis therefore useful to use the symbol t for an instant in time (for example during the 4th
second) and the symbol ∆t for the time taken (for example during the first 5 seconds ofthe motion).
Average velocity (symbol v) is the displacement for the whole motion divided by the time takenfor the whole motion. Instantaneous velocity is the velocity at a specific instant in time.
(Average) Speed (symbol s) is the distance travelled (d) divided by the time taken (∆t) forthe journey. Distance and time are scalars and therefore speed will also be a scalar. Speed iscalculated as follows:
speed (in m · s−1) =distance (in m)
time (in s)
s =d
∆t
Instantaneous speed is the magnitude of instantaneous velocity. It has the same value, but nodirection.
Worked Example 5: Average speed and average velocity
31

3.4 CHAPTER 3. MOTION IN ONE DIMENSION - GRADE 10
Question: James walks 2 km away from home in 30 minutes. He then turns aroundand walks back home along the same path, also in 30 minutes. Calculate James’average speed and average velocity.
2 km
AnswerStep 1 : Identify what information is given and what is asked forThe question explicitly gives
• the distance and time out (2 km in 30 minutes)
• the distance and time back (2 km in 30 minutes)
Step 2 : Check that all units are SI units.The information is not in SI units and must therefore be converted.To convert km to m, we know that:
1 km = 1 000 m
∴ 2 km = 2 000 m (multiply both sides by 2, because we want to convert 2 km to m.)
Similarly, to convert 30 minutes to seconds,
1 min = 60s
∴ 30 min = 1 800 s (multiply both sides by 30)
Step 3 : Determine James’ displacement and distance.James started at home and returned home, so his displacement is 0 m.
∆x = 0 m
James walked a total distance of 4 000 m (2 000 m out and 2 000 m back).
d = 4 000 m
Step 4 : Determine his total time.James took 1 800 s to walk out and 1 800 s to walk back.
∆t = 3 600 s
Step 5 : Determine his average speed
s =d
∆t
=4 000 m
3 600 s
= 1,11 m · s−1
Step 6 : Determine his average velocity
v =∆x
∆t
=0 m
3 600 s
= 0 m · s−1
Worked Example 6: Instantaneous Speed and Velocity
32

CHAPTER 3. MOTION IN ONE DIMENSION - GRADE 10 3.4
Question: A man runs around a circular track of radius 100 m. It takes him 120 sto complete a revolution of the track. If he runs at constant speed, calculate:
1. his speed,
2. his instantaneous velocity at point A,
3. his instantaneous velocity at point B,
4. his average velocity between points A and B,
5. his average speed during a revolution.
6. his average velocity during a revolution.
N
S
W E
100 mDirection the man runs
b
A
bB
Answer
Step 1 : Decide how to approach the problem
To determine the man’s speed we need to know the distance he travels and howlong it takes. We know it takes 120 s to complete one revolution of the track.(Arevolution is to go around the track once.)
33

3.4 CHAPTER 3. MOTION IN ONE DIMENSION - GRADE 10
Step 2 : Determine the distance travelled
What distance is one revolution of the track? We know the track is a circle and weknow its radius, so we can determine the distance around the circle. We start withthe equation for the circumference of a circle
C = 2πr
= 2π(100 m)
= 628,32 m
Therefore, the distance the man covers in one revolution is 628,32 m.
Step 3 : Determine the speed
We know that speed is distance covered per unittime. So if we divide the distance covered by thetime it took we will know how much distance wascovered for every unit of time. No direction isused here because speed is a scalar.
s =d
∆t
=628,32 m
120 s
= 5,24 m · s−1
Step 4 : Determine the instantaneous velocity at A
Consider the point A in the diagram.We know which way the man is running aroundthe track and we know his speed. His velocityat point A will be his speed (the magnitude ofthe velocity) plus his direction of motion (thedirection of his velocity). The instant that hearrives at A he is moving as indicated in thediagram.
His velocity will be 5,24 m·s−1West.
Direction the man runs
b
A
b
A
Step 5 : Determine the instantaneous velocity at B
Consider the point B in the diagram.We know which way the man is running aroundthe track and we know his speed. His velocityat point B will be his speed (the magnitude ofthe velocity) plus his direction of motion (thedirection of his velocity). The instant that hearrives at B he is moving as indicated in thediagram.
His velocity will be 5,24 m·s−1South.
Direction the man runsbB
bB
34

CHAPTER 3. MOTION IN ONE DIMENSION - GRADE 10 3.4
Step 6 : Determine the average velocity between A and BTo determine the average velocity between A and B, we need the change in displace-ment between A and B and the change in time between A and B. The displacementfrom A and B can be calculated by using the Theorem of Pythagoras:
(∆x)2 = 1002 + 1002
= 20000
∆x = 141,42135... m
The time for a full revolution is 120 s, thereforethe time for a 1
4 of a revolution is 30 s.
vAB =∆x
∆t
=141,42...
30 s
= 4.71 m · s−1
100 m
100 m
A
B O
∆x
Velocity is a vector and needs a direction.Triangle AOB is isosceles and therefore angle BAO = 45.The direction is between west and south and is therefore southwest.The final answer is: v = 4.71 m·s−1, southwest.
Step 7 : Determine his average speed during a revolutionBecause he runs at a constant rate, we know that his speed anywhere around thetrack will be the same. His average speed is 5,24 m·s−1.
Step 8 : Determine his average velocity over a complete revolution
Important: Remember - displacement can be zero even when distance travelled is not!
To calculate average velocity we need his total displacement and his total time. Hisdisplacement is zero because he ends up where he started. His time is 120 s. Usingthese we can calculate his average velocity:
v =∆x
∆t
=0 m
120 s= 0 s
3.4.1 Differences between Speed and Velocity
The differences between speed and velocity can be summarised as:
Speed Velocity1. depends on the path taken 1. independent of path taken2. always positive 2. can be positive or negative3. is a scalar 3. is a vector4. no dependence on direction andso is only positive
4. direction can be guessed fromthe sign (i.e. positive or negative)
Additionally, an object that makes a round trip, i.e. travels away from its starting point and thenreturns to the same point has zero velocity but travels a non-zero speed.
35

3.4 CHAPTER 3. MOTION IN ONE DIMENSION - GRADE 10
Exercise: Displacement and related quantities
1. Theresa has to walk to the shop to buy some milk. After walking 100 m, sherealises that she does not have enough money, and goes back home. If it tookher two minutes to leave and come back, calculate the following:
(a) How long was she out of the house (the time interval ∆t in seconds)?
(b) How far did she walk (distance (d))?
(c) What was her displacement (∆x)?
(d) What was her average velocity (in m·s−1)?
(e) What was her average speed (in m·s−1)?
b
100 m
2 minute there and back100 m
homeshop
2. Desmond is watching a straight stretch of road from his classroom window.He can see two poles which he earlier measured to be 50 m apart. Using hisstopwatch, Desmond notices that it takes 3 s for most cars to travel from theone pole to the other.
(a) Using the equation for velocity (v = ∆x∆t
), show all the working needed tocalculate the velocity of a car travelling from the left to the right.
(b) If Desmond measures the velocity of a red Golf to be -16,67 m·s−1, inwhich direction was the Gold travelling?Desmond leaves his stopwatch running, and notices that at t = 5,0 s, ataxi passes the left pole at the same time as a bus passes the right pole.At time t = 7,5 s the taxi passes the right pole. At time t = 9,0 s, thebus passes the left pole.
(c) How long did it take the taxi and the bus to travel the distance betweenthe poles? (Calculate the time interval (∆t) for both the taxi and the bus).
(d) What was the velocity of the taxi and the bus?
(e) What was the speed of the taxi and the bus?
(f) What was the speed of taxi and the bus in km·h−1?
50 m
3 s
t = 5 s t = 7,5 s
t = 9 s t = 5 s
3. After a long day, a tired man decides not to use the pedestrian bridge to crossover a freeway, and decides instead to run across. He sees a car 100 m awaytravelling towards him, and is confident that he can cross in time.
36

CHAPTER 3. MOTION IN ONE DIMENSION - GRADE 10 3.4
(a) If the car is travelling at 120 km·h−1, what is the car’s speed in m·s−1.
(b) How long will it take the a car to travel 100 m?
(c) If the man is running at 10 km·h−1, what is his speed in m·s−1?
(d) If the freeway has 3 lanes, and each lane is 3 m wide, how long will it takefor the man to cross all three lanes?
(e) If the car is travelling in the furthermost lane from the man, will he be ableto cross all 3 lanes of the freeway safely?
car3 m
3 m
3 m
100 m
Activity :: Investigation : An Exercise in SafetyDivide into groups of 4 and perform the following investigation. Each group will
be performing the same investigation, but the aim for each group will be different.
1. Choose an aim for your investigation from the following list and formulate ahypothesis:
• Do cars travel at the correct speed limit?
• Is is safe to cross the road outside of a pedestrian crossing?
• Does the colour of your car determine the speed you are travelling at?
• Any other relevant question that you would like to investigate.
2. On a road that you often cross, measure out 50 m along a straight section, faraway from traffic lights or intersections.
3. Use a stopwatch to record the time each of 20 cars take to travel the 50 msection you measured.
4. Design a table to represent your results. Use the results to answer the ques-tion posed in the aim of the investigation. You might need to do some moremeasurements for your investigation. Plan in your group what else needs to bedone.
5. Complete any additional measurements and write up your investigation underthe following headings:
• Aim and Hypothesis
• Apparatus
• Method
• Results
• Discussion
• Conclusion
6. Answer the following questions:
(a) How many cars took less than 3 seconds to travel 50 m?
(b) What was the shortest time a car took to travel 50 m?
(c) What was the average time taken by the 20 cars?
(d) What was the average speed of the 20 cars?
(e) Convert the average speed to km·h−1.
37
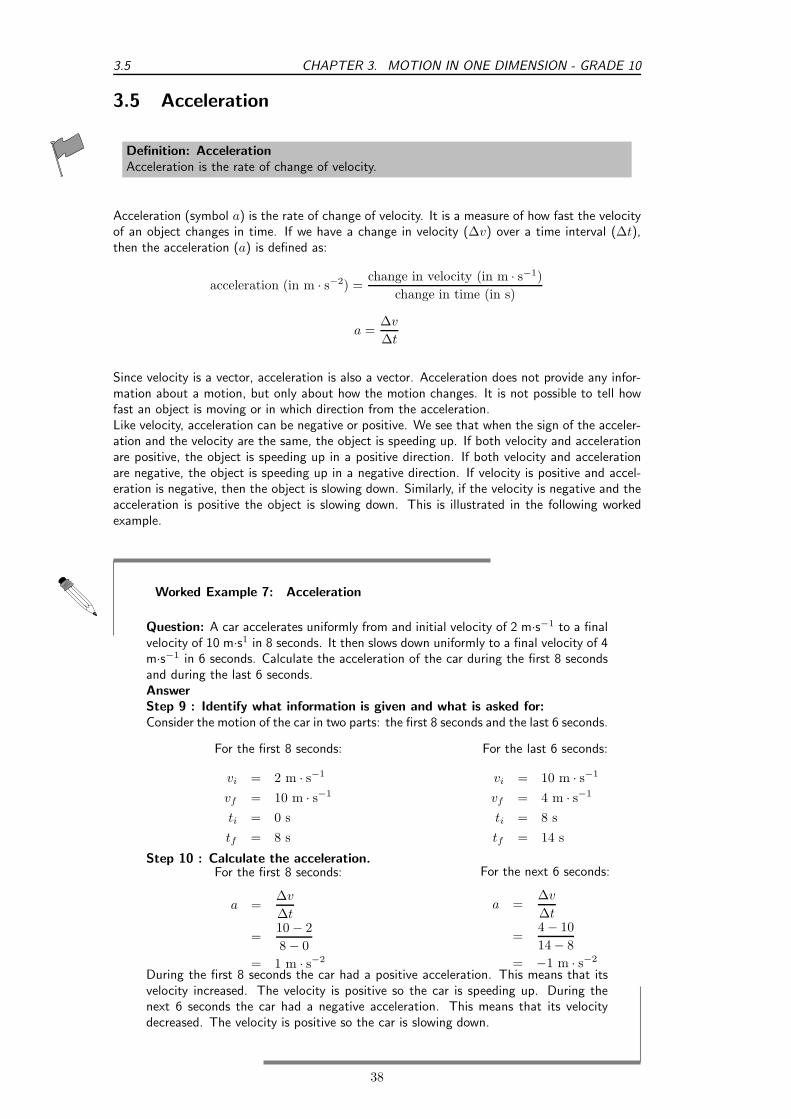
3.5 CHAPTER 3. MOTION IN ONE DIMENSION - GRADE 10
3.5 Acceleration
Definition: AccelerationAcceleration is the rate of change of velocity.
Acceleration (symbol a) is the rate of change of velocity. It is a measure of how fast the velocityof an object changes in time. If we have a change in velocity (∆v) over a time interval (∆t),then the acceleration (a) is defined as:
acceleration (in m · s−2) =change in velocity (in m · s−1)
change in time (in s)
a =∆v
∆t
Since velocity is a vector, acceleration is also a vector. Acceleration does not provide any infor-mation about a motion, but only about how the motion changes. It is not possible to tell howfast an object is moving or in which direction from the acceleration.Like velocity, acceleration can be negative or positive. We see that when the sign of the acceler-ation and the velocity are the same, the object is speeding up. If both velocity and accelerationare positive, the object is speeding up in a positive direction. If both velocity and accelerationare negative, the object is speeding up in a negative direction. If velocity is positive and accel-eration is negative, then the object is slowing down. Similarly, if the velocity is negative and theacceleration is positive the object is slowing down. This is illustrated in the following workedexample.
Worked Example 7: Acceleration
Question: A car accelerates uniformly from and initial velocity of 2 m·s−1 to a finalvelocity of 10 m·s1 in 8 seconds. It then slows down uniformly to a final velocity of 4m·s−1 in 6 seconds. Calculate the acceleration of the car during the first 8 secondsand during the last 6 seconds.AnswerStep 9 : Identify what information is given and what is asked for:Consider the motion of the car in two parts: the first 8 seconds and the last 6 seconds.
For the first 8 seconds:
vi = 2 m · s−1
vf = 10 m · s−1
ti = 0 s
tf = 8 s
For the last 6 seconds:
vi = 10 m · s−1
vf = 4 m · s−1
ti = 8 s
tf = 14 s
Step 10 : Calculate the acceleration.For the first 8 seconds:
a =∆v
∆t
=10 − 2
8 − 0
= 1 m · s−2
For the next 6 seconds:
a =∆v
∆t
=4 − 10
14 − 8
= −1 m · s−2
During the first 8 seconds the car had a positive acceleration. This means that itsvelocity increased. The velocity is positive so the car is speeding up. During thenext 6 seconds the car had a negative acceleration. This means that its velocitydecreased. The velocity is positive so the car is slowing down.
38

CHAPTER 3. MOTION IN ONE DIMENSION - GRADE 10 3.6
Important: Acceleration does not tell us about the direction of the motion. Accelerationonly tells us how the velocity changes.
Important: Deceleration
Avoid the use of the word deceleration to refer to a negative acceleration. This word usuallymeans slowing down and it is possible for an object to slow down with both a positive andnegative acceleration, because the sign of the velocity of the object must also be taken intoaccount to determine whether the body is slowing down or not.
Exercise: Acceleration
1. An athlete is accelerating uniformly from an initial velocity of 0 m·s−1to a finalvelocity of 4 m·s−1in 2 seconds. Calculate his acceleration. Let the directionthat the athlete is running in be the positive direction.
2. A bus accelerates uniformly from an initial velocity of 15 m·s−1to a final velocityof 7 m·s−1in 4 seconds. Calculate the acceleration of the bus. Let the directionof motion of the bus be the positive direction.
3. An aeroplane accelerates uniformly from an initial velocity of 200 m·s−1to avelocity of 100 m·s−1in 10 seconds. It then accelerates uniformly to a finalvelocity of 240 m·s−1in 20 seconds. Let the direction of motion of the aeroplanebe the positive direction.
(a) Calculate the acceleration of the aeroplane during the first 10 seconds ofthe motion.
(b) Calculate the acceleration of the aeroplane during the next 14 seconds ofits motion.
(c) Calculate the acceleration of the aeroplane during the whole 24 seconds ofits motion.
3.6 Description of Motion
The purpose of this chapter is to describe motion, and now that we understand the definitions ofdisplacement, distance, velocity, speed and acceleration, we are ready to start using these ideasto describe how an object is moving. There are many ways of describing motion:
1. words
2. diagrams
3. graphs
These methods will be described in this section.
We will consider three types of motion: when the object is not moving (stationary object), whenthe object is moving at a constant velocity (uniform motion) and when the object is moving ata constant acceleration (motion at constant acceleration).
39

3.6 CHAPTER 3. MOTION IN ONE DIMENSION - GRADE 10
3.6.1 Stationary Object
The simplest motion that we can come across is that of a stationary object. A stationary objectdoes not move and so its position does not change, for as long as it is standing still. An exampleof this situation is when someone is waiting for something without moving. The person remainsin the same position.
Lesedi is waiting for a taxi. He is standing two metres from a stop street at t = 0 s. Afterone minute, at t = 60 s, he is still 2 metres from the stop street and after two minutes, att = 120 s, also 2 metres from the stop street. His position has not changed. His displacementis zero (because his position is the same), his velocity is zero (because his displacement is zero)and his acceleration is also zero (because his velocity is not changing).
STOP
2 m
t = 0 st = 60 st = 120 s
bbb
displacement = 0 m
velocity = 0 m·s−1
acceleration = 0 m·s−2
We can now draw graphs of position vs.time (x vs. t), velocity vs.time (v vs. t) and accelerationvs.time (a vs. t) for a stationary object. The graphs are shown in Figure 3.5. Lesedi’s positionis 2 metres from the stop street. If the stop street is taken as the reference point, his positionremains at 2 metres for 120 seconds. The graph is a horisontal line at 2 m. The velocity andacceleration graphs are also shown. They are both horisontal lines on the x-axis. Since hisposition is not changing, his velocity is 0 m·s−1and since velocity is not changing acceleration is0 m·s−2.
60 120
2
1
0120 120
time (s) time (s) time (s)
po
sitio
nx
(m)
velo
city
v(m
·s−
1)
acce
lera
tiona
(m·s−
2)
0 060 60
(a) (b) (c)
Figure 3.5: Graphs for a stationary object (a) position vs. time (b) velocity vs. time (c)acceleration vs. time.
Definition: GradientThe gradient of a line can be calculated by dividing the change in the y-value by the changein the x-value.m = ∆y
∆x
Since we know that velocity is the rate of change of position, we can confirm the value for thevelocity vs. time graph, by calculating the gradient of the x vs. t graph.
Important: The gradient of a position vs. time graph gives the velocity.
40

CHAPTER 3. MOTION IN ONE DIMENSION - GRADE 10 3.6
If we calculate the gradient of the x vs. t graph for a stationary object we get:
v =∆x
∆t
=xf − xi
tf − ti
=2 m − 2 m
120 s − 60 s(initial position = final position)
= 0 m · s−1 (for the time that Lesedi is stationary)
Similarly, we can confirm the value of the acceleration by calculating the gradient of the velocityvs. time graph.
Important: The gradient of a velocity vs. time graph gives the acceleration.
If we calculate the gradient of the v vs. t graph for a stationary object we get:
a =∆v
∆t
=vf − vi
tf − ti
=0 m · s−1 − 0 m · s−1
120 s − 60 s
= 0 m · s−2
Additionally, because the velocity vs. time graph is related to the position vs. time graph, wecan use the area under the velocity vs. time graph to calculate the displacement of an object.
Important: The area under the velocity vs. time graph gives the displacement.
The displacement of the object is given by the area under the graph, which is 0 m. This isobvious, because the object is not moving.
3.6.2 Motion at Constant Velocity
Motion at a constant velocity or uniform motion means that the position of the object is changingat the same rate.
Assume that Lesedi takes 100 s to walk the 100 m to the taxi-stop every morning. If we assumethat Lesedi’s house is the origin, then Lesedi’s velocity is:
v =∆x
∆t
=xf − xi
tf − ti
=100 m − 0 m
100 s − 0 s
= 1 m · s−1
Lesedi’s velocity is 1 m·s−1. This means that he walked 1 m in the first second, another metrein the second second, and another in the third second, and so on. For example, after 50 s hewill be 50 m from home. His position increases by 1 m every 1 s. A diagram of Lesedi’s positionis shown in Figure 3.6.
We can now draw graphs of position vs.time (x vs. t), velocity vs.time (v vs. t) and accelerationvs.time (a vs. t) for Lesedi moving at a constant velocity. The graphs are shown in Figure 3.7.
41

3.6 CHAPTER 3. MOTION IN ONE DIMENSION - GRADE 10
b
x = 100 mt = 0 s t = 50 s t = 100 s
x = 50 mx = 0 m
bb
v = 1m·s−1 v = 1m·s−1
Figure 3.6: Diagram showing Lesedi’s motion at a constant velocity of 1 m·s−1
50 100
100
50
0100 100
time (s) time (s) time (s)
po
sitio
nx
(m)
velo
city
v(m
·s−
1)
acce
lera
tiona
(m·s−
2)
0 050 50
(a) (b) (c)
1∆x
∆t
Figure 3.7: Graphs for motion at constant velocity (a) position vs. time (b) velocity vs. time(c) acceleration vs. time. The area of the shaded portion in the v vs. t graph corresponds tothe object’s displacement.
In the evening Lesedi walks 100 m from the bus stop to his house in 100 s. Assume that Lesedi’shouse is the origin. The following graphs can be drawn to describe the motion.
50 100
100
50
0
100
100time (s)
time (s)
time (s)
po
sitio
nx
(m)
velo
city
v(m
·s−
1)
acce
lera
tiona
(m·s−
2)
0
0
50
50
(a) (b) (c)
-1∆x
∆t
Figure 3.8: Graphs for motion with a constant negative velocity (a) position vs. time (b) velocityvs. time (c) acceleration vs. time. The area of the shaded portion in the v vs.t graph correspondsto the object’s displacement.
We see that the v vs. t graph is a horisontal line. If the velocity vs. time graph is a horisontalline, it means that the velocity is constant (not changing). Motion at a constant velocity isknown as uniform motion.
We can use the x vs. t to calculate the velocity by finding the gradient of the line.
v =∆x
∆t
=xf − xi
tf − ti
=0 m − 100 m
100 s − 0 s
= −1 m · s−1
42

CHAPTER 3. MOTION IN ONE DIMENSION - GRADE 10 3.6
Lesedi has a velocity of -1 m·s−1, or 1 m·s−1towards his house. You will notice that the v vs. tgraph is a horisontal line corresponding to a velocity of -1 m·s−1. The horisontal line means thatthe velocity stays the same (remains constant) during the motion. This is uniform velocity.
We can use the v vs. t to calculate the acceleration by finding the gradient of the line.
a =∆v
∆t
=vf − vi
tf − ti
=1 m · s−1 − 1 m · s−1
100 s − 0 s
= 0 m · s−2
Lesedi has an acceleration of 0 m·s−2. You will notice that the graph of a vs.t is a horisontal linecorresponding to an acceleration value of 0 m·s−2. There is no acceleration during the motionbecause his velocity does not change.
We can use the v vs. t to calculate the displacement by finding the area under the graph.
v = Area under graph
= ℓ × b
= 100 × (−1)
= −100 m
This means that Lesedi has a displacement of 100 m towards his house.
43

3.6 CHAPTER 3. MOTION IN ONE DIMENSION - GRADE 10
Exercise: Velocity and acceleration
1. Use the graphs in Figure 3.7 to calculate each of the following:
(a) Calculate Lesedi’s velocity between 50 s and 100 s using the x vs. t graph.Hint: Find the gradient of the line.
(b) Calculate Lesedi’s acceleration during the whole motion using the v vs. tgraph.
(c) Calculate Lesedi’s displacement during the whole motion using the v vs. tgraph.
2. Thandi takes 200 s to walk 100 m to the bus stop every morning. Draw a graphof Thandi’s position as a function of time (assuming that Thandi’s home is thereference point). Use the gradient of the x vs. t graph to draw the graph ofvelocity vs. time. Use the gradient of the v vs. t graph to draw the graph ofacceleration vs. time.
3. In the evening Thandi takes 200 s to walk 100 m from the bus stop to herhome. Draw a graph of Thandi’s position as a function of time (assuming thatThandi’s home is the origin). Use the gradient of the x vs. t graph to drawthe graph of velocity vs. time. Use the gradient of the v vs. t graph to drawthe graph of acceleration vs. time.
4. Discuss the differences between the two sets of graphs in questions 2 and 3.
Activity :: Experiment : Motion at constant velocityAim:To measure the position and time during motion at constant velocity and determinethe average velocity as the gradient of a “Position vs. Time” graph.Apparatus:A battery operated toy car, stopwatch, meter stick or measuring tape.Method:
1. Work with a friend. Copy the table below into your workbook.
2. Complete the table by timing the car as it travels each distance.
3. Time the car twice for each distance and take the average value as your acceptedtime.
4. Use the distance and average time values to plot a graph of “Distance vs. Time”onto graph paper. Stick the graph paper into your workbook. (Rememberthat “A vs. B” always means “y vs. x”).
5. Insert all axis labels and units onto your graph.
6. Draw the best straight line through your data points.
7. Find the gradient of the straight line. This is the average velocity.
Results:
Distance (m)Time (s)
1 2 Ave.0
0,51,01,52,02,53,0
44

CHAPTER 3. MOTION IN ONE DIMENSION - GRADE 10 3.6
Conclusions:
Answer the following questions in your workbook.Questions:
1. Did the car travel with a constant velocity?
2. How can you tell by looking at the “Distance vs. Time” graph if the velocityis constant?
3. How would the “Distance vs. Time” look for a car with a faster velocity?
4. How would the “Distance vs. Time” look for a car with a slower velocity?
45

3.6 CHAPTER 3. MOTION IN ONE DIMENSION - GRADE 10
3.6.3 Motion at Constant Acceleration
The final situation we will be studying is motion at constant acceleration. We know thatacceleration is the rate of change of velocity. So, if we have a constant acceleration, thismeans that the velocity changes at a constant rate.
Let’s look at our first example of Lesedi waiting at the taxi stop again. A taxi arrived and Lesedigot in. The taxi stopped at the stop street and then accelerated as follows: After 1 s the taxicovered a distance of 2,5 m, after 2 s it covered 10 m, after 3 seconds it covered 22,5 m andafter 4 s it covered 40 m. The taxi is covering a larger distance every second. This means thatit is accelerating.
10 m 40 m2,5 m 22,5 mt = 1 s t = 2 s t = 3 s t = 4 s
STOP
To calculate the velocity of the taxi you need to calculate the gradient of the line at each second:
v1s =∆x
∆t
=xf − xi
tf − ti
=5m − 0m
1,5s − 0,5s
= 5 m · s−1
v2s =∆x
∆t
=xf − xi
tf − ti
=15m− 5m
2,5s − 1,5s
= 10 m · s−1
v3s =∆x
∆t
=xf − xi
tf − ti
=30m− 15m
3,5s− 2,5s
= 15 m · s−1
From these velocities, we can draw the velocity-time graph which forms a straight line.
The acceleration is the gradient of the v vs. t graph and can be calculated as follows:
a =∆v
∆t
=vf − vi
tf − ti
=15m · s−1 − 5m · s−1
3s − 1s
= 5 m · s−2
The acceleration does not change during the motion (the gradient stays constant). This ismotion at constant or uniform acceleration.
The graphs for this situation are shown in Figure 3.9.
Velocity from Acceleration vs. Time Graphs
Just as we used velocity vs. time graphs to find displacement, we can use acceleration vs. timegraphs to find the velocity of an object at a given moment in time. We simply calculate thearea under the acceleration vs. time graph, at a given time. In the graph below, showing anobject at a constant positive acceleration, the increase in velocity of the object after 2 secondscorresponds to the shaded portion.
v = area of rectangle = a × ∆t
= 5 m · s−2 × 2 s
= 10 m · s−1
46
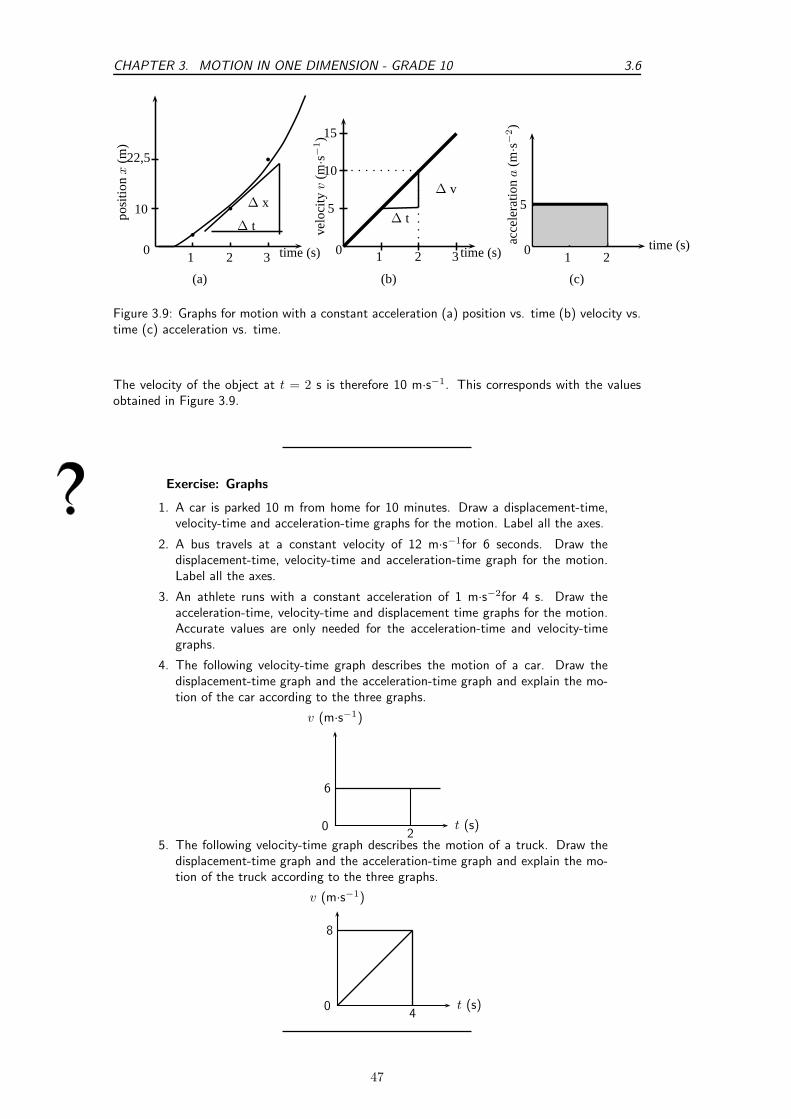
CHAPTER 3. MOTION IN ONE DIMENSION - GRADE 10 3.6
1 2
22,5
10
0 2 2time (s) time (s)time (s)
po
sitio
nx
(m)
velo
city
v(m
·s−
1)
acce
lera
tiona
(m·s−
2)
0 01 1
(a) (b) (c)
∆ x∆ v
∆ t∆ t
10
55
15
33
b
b
b
Figure 3.9: Graphs for motion with a constant acceleration (a) position vs. time (b) velocity vs.time (c) acceleration vs. time.
The velocity of the object at t = 2 s is therefore 10 m·s−1. This corresponds with the valuesobtained in Figure 3.9.
Exercise: Graphs
1. A car is parked 10 m from home for 10 minutes. Draw a displacement-time,velocity-time and acceleration-time graphs for the motion. Label all the axes.
2. A bus travels at a constant velocity of 12 m·s−1for 6 seconds. Draw thedisplacement-time, velocity-time and acceleration-time graph for the motion.Label all the axes.
3. An athlete runs with a constant acceleration of 1 m·s−2for 4 s. Draw theacceleration-time, velocity-time and displacement time graphs for the motion.Accurate values are only needed for the acceleration-time and velocity-timegraphs.
4. The following velocity-time graph describes the motion of a car. Draw thedisplacement-time graph and the acceleration-time graph and explain the mo-tion of the car according to the three graphs.
6
20
v (m·s−1)
t (s)
5. The following velocity-time graph describes the motion of a truck. Draw thedisplacement-time graph and the acceleration-time graph and explain the mo-tion of the truck according to the three graphs.
8
40
v (m·s−1)
t (s)
47

3.7 CHAPTER 3. MOTION IN ONE DIMENSION - GRADE 10
3.7 Summary of Graphs
The relation between graphs of position, velocity and acceleration as functions of time is sum-marised in Figure 3.10.
StationaryObject
x (m)
t (s)
v (m·s−1)
t (s)
a (m·s−2)
t (s)
Uniform Mo-tion
x (m)
t (s)
v (m·s−1)
t (s)
a (m·s−2)
t (s)
Motion withconstant ac-celeration
x (m)
t (s)
v (m·s−1)
t (s)
a (m·s−2)
t (s)
Figure 3.10: Position-time, velocity-time and acceleration-time graphs.
Important: Often you will be required to describe the motion of an object that is presentedas a graph of either position, velocity or acceleration as functions of time. The descriptionof the motion represented by a graph should include the following (where possible):
1. whether the object is moving in the positive or negative direction
2. whether the object is at rest, moving at constant velocity or moving at constantpositive acceleration (speeding up) or constant negative acceleration (slowing down)
You will also often be required to draw graphs based on a description of the motion in wordsor from a diagram. Remember that these are just different methods of presenting the sameinformation. If you keep in mind the general shapes of the graphs for the different types ofmotion, there should not be any difficulty with explaining what is happening.
48

CHAPTER 3. MOTION IN ONE DIMENSION - GRADE 10 3.8
3.8 Worked Examples
The worked examples in this section demonstrate the types of questions that can be asked aboutgraphs.
Worked Example 8: Description of motion based on a position-time graph
Question: The position vs. time graph for the motion of a car is given below.Draw the corresponding velocity vs. time and acceleration vs. time graphs, and thendescribe the motion of the car.
0 1 2 3 4 5 60
1
2
3
4
5
x (m)
t (s)
AnswerStep 1 : Identify what information is given and what is asked forThe question gives a position vs. time graph and the following three things arerequired:
1. Draw a v vs. t graph.
2. Draw an a vs. t graph.
3. Describe the motion of the car.
To answer these questions, break the motion up into three sections: 0 - 2 seconds,2 - 4 seconds and 4 - 6 seconds.
Step 2 : Velocity vs. time graph for 0-2 secondsFor the first 2 seconds we can see that the displacement remains constant - so theobject is not moving, thus it has zero velocity during this time. We can reach thisconclusion by another path too: remember that the gradient of a displacement vs.time graph is the velocity. For the first 2 seconds we can see that the displacementvs. time graph is a horizontal line, ie. it has a gradient of zero. Thus the velocityduring this time is zero and the object is stationary.
Step 3 : Velocity vs. time graph for 2-4 secondsFor the next 2 seconds, displacement is increasing with time so the object is mov-ing. Looking at the gradient of the displacement graph we can see that it is notconstant. In fact, the slope is getting steeper (the gradient is increasing) as timegoes on. Thus, remembering that the gradient of a displacement vs. time graph isthe velocity, the velocity must be increasing with time during this phase.
Step 4 : Velocity vs. time graph for 4-6 secondsFor the final 2 seconds we see that displacement is still increasing with time, butthis time the gradient is constant, so we know that the object is now travelling ata constant velocity, thus the velocity vs. time graph will be a horizontal line duringthis stage. We can now draw the graphs:
49

3.8 CHAPTER 3. MOTION IN ONE DIMENSION - GRADE 10
So our velocity vs. time graph looks like this one below. Because we haven’t beengiven any values on the vertical axis of the displacement vs. time graph, we cannotfigure out what the exact gradients are and therefore what the values of the velocitiesare. In this type of question it is just important to show whether velocities are positiveor negative, increasing, decreasing or constant.
0 1 2 3 4 5 6
v (m·s−1)
t (s)
Once we have the velocity vs. time graph its much easier to get the acceleration vs.time graph as we know that the gradient of a velocity vs. time graph is the just theacceleration.
Step 5 : Acceleration vs. time graph for 0-2 seconds
For the first 2 seconds the velocity vs. time graph is horisontal and has a value ofzero, thus it has a gradient of zero and there is no acceleration during this time.(This makes sense because we know from the displacement time graph that the ob-ject is stationary during this time, so it can’t be accelerating).
Step 6 : Acceleration vs. time graph for 2-4 seconds
For the next 2 seconds the velocity vs. time graph has a positive gradient. Thisgradient is not changing (i.e. its constant) throughout these 2 seconds so there mustbe a constant positive acceleration.
Step 7 : Acceleration vs. time graph for 4-6 seconds
For the final 2 seconds the object is traveling with a constant velocity. During thistime the gradient of the velocity vs. time graph is once again zero, and thus theobject is not accelerating. The acceleration vs. time graph looks like this:
a (m·s−2)
t (s)0 2 4 6
Step 8 : A description of the object’s motion
A brief description of the motion of the object could read something like this: Att = 0 s and object is stationary at some position and remains stationary until t = 2 swhen it begins accelerating. It accelerates in a positive direction for 2 seconds untilt = 4 s and then travels at a constant velocity for a further 2 seconds.
50

CHAPTER 3. MOTION IN ONE DIMENSION - GRADE 10 3.8
Worked Example 9: Calculations from a velocity vs. time graph
Question: The velocity vs. time graph of a truck is plotted below. Calculate thedistance and displacement of the truck after 15 seconds.
1 2 3 4 5 6 7 8 9 10 11 12 13 14 150
1
2
3
4
−1
−2
v (m·s−1)
t (s)
AnswerStep 1 : Decide how to tackle the problemWe are asked to calculate the distance and displacement of the car. All we need toremember here is that we can use the area between the velocity vs. time graph andthe time axis to determine the distance and displacement.
Step 2 : Determine the area under the velocity vs. time graphBreak the motion up: 0 - 5 seconds, 5 - 12 seconds, 12 - 14 seconds and 14 - 15seconds.
For 0 - 5 seconds: The displacement isequal to the area of the triangle on theleft:
Area =1
2b × h
=1
2× 5 × 4
= 10 m
For 5 - 12 seconds: The displacementis equal to the area of the rectangle:
Area = ℓ × b
= 7 × 4
= 28 m
For 12 - 14 seconds the displacement isequal to the area of the triangle abovethe time axis on the right:
Area =1
2b × h
=1
2× 2 × 4
= 4 m
For 14 - 15 seconds the displacement isequal to the area of the triangle belowthe time axis:
Area =1
2b × h
=1
2× 1 × 2
= 1 m
Step 3 : Determine the total distance of the carNow the total distance of the car is the sum of all of these areas:
∆x = 10 + 28 + 4 + 1
= 43 m
51

3.8 CHAPTER 3. MOTION IN ONE DIMENSION - GRADE 10
Step 4 : Determine the total displacement of the car
Now the total displacement of the car is just the sum of all of these areas. HOW-EVER, because in the last second (from t = 14 s to t = 15 s) the velocity of thecar is negative, it means that the car was going in the opposite direction, i.e. backwhere it came from! So, to find the total displacement, we have to add the first 3areas (those with positive displacements) and subtract the last one (because it is adisplacement in the opposite direction).
∆x = 10 + 28 + 4 − 1
= 41 m in the positive direction
Worked Example 10: Velocity from a position vs. time graph
Question: The position vs. time graph below describes the motion of an athlete.
1. What is the velocity of the athlete during the first 4 seconds?
2. What is the velocity of the athlete from t = 4 s to t = 7 s?
0 1 2 3 4 5 6 70
1
2
3
4
x (m)
t (s)
Answer
Step 1 : The velocity during the first 4 seconds
The velocity is given by the gradient of a position vs. time graph. During the first4 seconds, this is
v =∆x
∆t
=4 − 0
4 − 0
= 1 m · s−1
Step 2 : The velocity during the last 3 seconds
For the last 3 seconds we can see that the displacement stays constant. The graphshows a horisontal line and therefore the gradient is zero. Thus v = 0 m · s−1.
52

CHAPTER 3. MOTION IN ONE DIMENSION - GRADE 10 3.8
Worked Example 11: Drawing a v vs. t graph from an a vs. t graph
Question: The acceleration vs. time graph for a car starting from rest, is givenbelow. Calculate the velocity of the car and hence draw the velocity vs. time graph.
1 2 3 4 5 60
1
2
−1
−2
a (m·s−2)
t (s)
Answer
Step 1 : Calculate the velocity values by using the area under each part ofthe graph.
The motion of the car can be divided into three time sections: 0 - 2 seconds; 2 - 4seconds and 4 - 6 seconds. To be able to draw the velocity vs. time graph, thevelocity for each time section needs to be calculated. The velocity is equal to thearea of the square under the graph:
For 0 - 2 seconds:
Area = ℓ × b
= 2 × 2
= 4 m · s−1
The velocity of the car is4 m·s−1 at t = 2s.
For 2 - 4 seconds:
Area = ℓ × b
= 2 × 0
= 0 m · s−1
The velocity of the car is0 m·s−1from t = 2 s tot = 4 s.
For 4 - 6 seconds:
Area = ℓ × b
= 2 ×−2
= −4 m · s−1
The acceleration had a nega-tive value, which means thatthe velocity is decreasing.It starts at a velocity of4 m·s−1and decreases to0 m·s−1.
Step 2 : Now use the values to draw the velocity vs. time graph.
The velocity vs. time graphlooks like this:
0 1 2 3 4 5 60
1
2
3
4
v (m·s−1)
t (s)
53
3.9 CHAPTER 3. MOTION IN ONE DIMENSION - GRADE 10
3.9 Equations of Motion
In this chapter we will look at the third way to describe motion. We have looked at describingmotion in terms of graphs and words. In this section we examine equations that can be used todescribe motion.
This section is about solving problems relating to uniformly accelerated motion. In other words,motion at constant acceleration.The following are the variables that will be used in this section:
vi = initial velocity (m·s−1) at t = 0 s
vf = final velocity (m·s−1) at time t
∆x = displacement (m)
t = time (s)
∆t = time interval (s)
a = acceleration (m·s−2)
vf = vi + at (3.1)
∆x =(vi + vf )
2t (3.2)
∆x = vit +1
2at2 (3.3)
v2f = v2
i + 2a∆x (3.4)
The questions can vary a lot, but the following method for answering them will always work.Use this when attempting a question that involves motion with constant acceleration. You needany three known quantities (vi, vf , ∆x, t or a) to be able to calculate the fourth one.
1. Read the question carefully to identify the quantities that are given. Write them down.
2. Identify the equation to use. Write it down!!!
3. Ensure that all the values are in the correct unit and fill them in your equation.
4. Calculate the answer and fill in its unit.
Interesting
Fact
teresting
FactGalileo Galilei of Pisa, Italy, was the first to determined the correct mathematicallaw for acceleration: the total distance covered, starting from rest, is proportionalto the square of the time. He also concluded that objects retain their velocityunless a force – often friction – acts upon them, refuting the accepted Aristotelianhypothesis that objects ”naturally” slow down and stop unless a force acts uponthem. This principle was incorporated into Newton’s laws of motion (1st law).
3.9.1 Finding the Equations of Motion
The following does not form part of the syllabus and can be considered additional information.
54
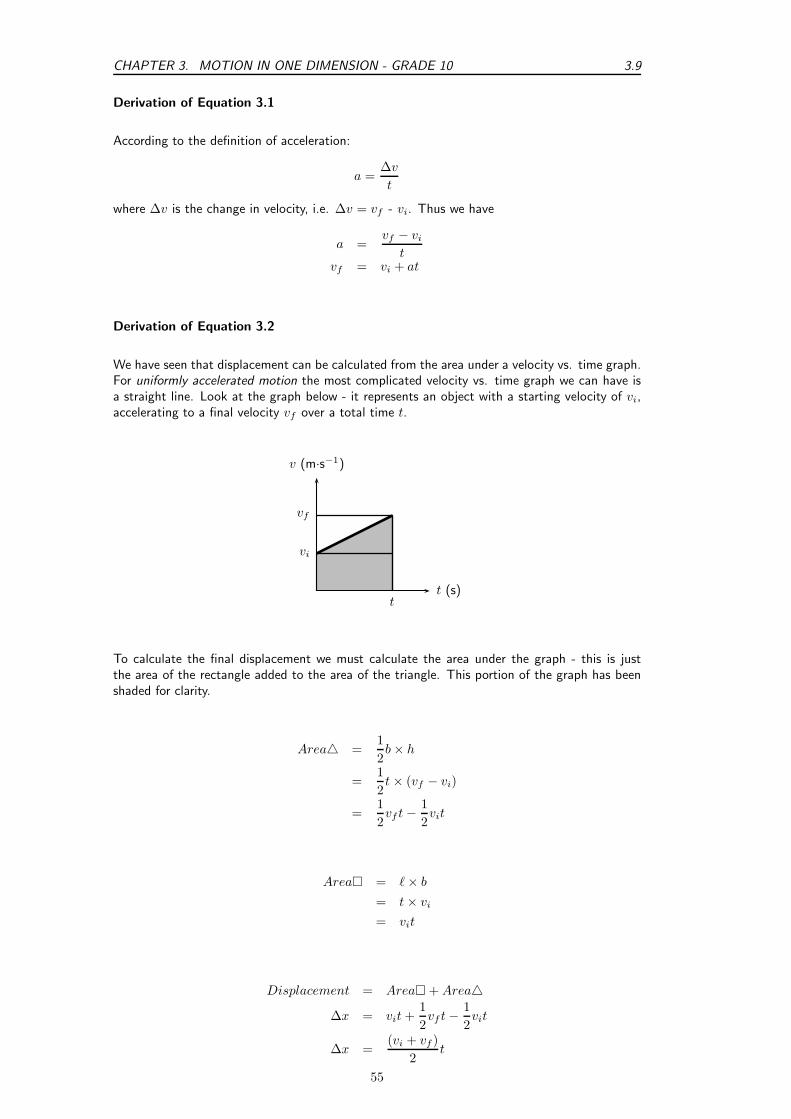
CHAPTER 3. MOTION IN ONE DIMENSION - GRADE 10 3.9
Derivation of Equation 3.1
According to the definition of acceleration:
a =∆v
t
where ∆v is the change in velocity, i.e. ∆v = vf - vi. Thus we have
a =vf − vi
tvf = vi + at
Derivation of Equation 3.2
We have seen that displacement can be calculated from the area under a velocity vs. time graph.For uniformly accelerated motion the most complicated velocity vs. time graph we can have isa straight line. Look at the graph below - it represents an object with a starting velocity of vi,accelerating to a final velocity vf over a total time t.
v (m·s−1)
t (s)
vi
vf
t
To calculate the final displacement we must calculate the area under the graph - this is justthe area of the rectangle added to the area of the triangle. This portion of the graph has beenshaded for clarity.
Area =1
2b × h
=1
2t × (vf − vi)
=1
2vf t −
1
2vit
Area = ℓ × b
= t × vi
= vit
Displacement = Area + Area
∆x = vit +1
2vf t −
1
2vit
∆x =(vi + vf )
2t
55

3.9 CHAPTER 3. MOTION IN ONE DIMENSION - GRADE 10
Derivation of Equation 3.3
This equation is simply derived by eliminating the final velocity vf in equation 3.2. Rememberingfrom equation 3.1 that
vf = vi + at
then equation 3.2 becomes
∆x =vi + vi + at
2t
=2vit + at2
2
∆x = vit +1
2at2
56

CHAPTER 3. MOTION IN ONE DIMENSION - GRADE 10 3.9
Derivation of Equation 3.4
This equation is just derived by eliminating the time variable in the above equation. FromEquation 3.1 we know
t =vf − vi
a
Substituting this into Equation 3.3 gives
∆x = vi(vf − vi
a) +
1
2a(
vf − vi
a)2
=vivf
a−
v2i
a+
1
2a(
v2f − 2vivf + v2
i
a2)
=vivf
a−
v2i
a+
v2f
2a−
vivf
a+
v2i
2a
2a∆x = −2v2i + v2
f + v2i
v2f = v2
i + 2a∆x (3.5)
This gives us the final velocity in terms of the initial velocity, acceleration and displacement andis independent of the time variable.
Worked Example 12: Equations of motion
Question: A racing car is travelling north. It accelerates uniformly covering adistance of 725 m in 10 s. If it has an initial velocity of 10 m·s−1, find its acceleration.
Answer
Step 1 : Identify what information is given and what is asked for
We are given:
vi = 10 m · s−1
∆x = 725 m
t = 10 s
a = ?
Step 2 : Find an equation of motion relating the given information to theacceleration
If you struggle to find the correct equation, find the quantity that is not given andthen look for an equation that does not have this quantity in it.We can use equation 3.3
∆x = vit +1
2at2
Step 3 : Substitute your values in and find the answer
∆x = vit +1
2at2
725 = (10 × 10) +1
2a × (10)2
725 − 100 = 50 a
a = 12,5 m · s−2
Step 4 : Quote the final answer
The racing car is accelerating at 12,5 m·s−2 north.
57

3.9 CHAPTER 3. MOTION IN ONE DIMENSION - GRADE 10
Worked Example 13: Equations of motion
Question: A motorcycle, travelling east, starts from rest, moves in a straight linewith a constant acceleration and covers a distance of 64 m in 4 s. Calculate
• its acceleration
• its final velocity
• at what time the motorcycle had covered half the total distance
• what distance the motorcycle had covered in half the total time.
AnswerStep 1 : Identify what information is given and what is asked forWe are given:
vi = 0 m · s−1(because the object starts from rest.)
∆x = 64 m
t = 4 s
a = ?
vf = ?
t = ? at half the distance ∆x = 32 m.
∆x = ? at half the time t = 2 s.
All quantities are in SI units.Step 2 : Acceleration: Find a suitable equation to calculate the accelerationWe can use equations 3.3
∆x = vit +1
2at2
Step 3 : Substitute the values and calculate the acceleration
∆x = vit +1
2at2
64 = (0 × 4) +1
2a × (4)2
64 = 8a
a = 8 m · s−2 east
Step 4 : Final velocity: Find a suitable equation to calculate the final velocityWe can use equation 3.1 - remember we now also know the acceleration of theobject.
vf = vi + at
Step 5 : Substitute the values and calculate the final velocity
vf = vi + at
vf = 0 + (8)(4)
= 32 m · s−1 east
Step 6 : Time at half the distance: Find an equation to calculate the timeWe can use equation 3.3:
∆x = vi +1
2at2
32 = (0)t +1
2(8)(t)2
32 = 0 + 4t2
8 = t2
t = 2,83 s
58

CHAPTER 3. MOTION IN ONE DIMENSION - GRADE 10 3.10
Step 7 : Distance at half the time: Find an equation to relate the distanceand timeHalf the time is 2 s, thus we have vi, a and t - all in the correct units. We can useequation 3.3 to get the distance:
∆x = vit +1
2at2
= (0)(2) +1
2(8)(2)2
= 16 m east
Exercise: Acceleration
1. A car starts off at 10 m·s−1 and accelerates at 1 m·s−2 for 10 s. What is itsfinal velocity?
2. A train starts from rest, and accelerates at 1 m·s−2 for 10 s. How far does itmove?
3. A bus is going 30 m·s−1 and stops in 5 s. What is its stopping distance for thisspeed?
4. A racing car going at 20 m·s−1 stops in a distance of 20 m. What is itsacceleration?
5. A ball has a uniform acceleration of 4 m·s−1. Assume the ball starts from rest.Determine the velocity and displacement at the end of 10 s.
6. A motorcycle has a uniform acceleration of 4 m·s−1. Assume the motorcyclehas an initial velocity of 20 m·s−1. Determine the velocity and displacement atthe end of 12 s.
7. An aeroplane accelerates uniformly such that it goes from rest to 144 km·hr−1in8 s. Calculate the acceleration required and the total distance that it hastraveled in this time.
3.10 Applications in the Real-World
What we have learnt in this chapter can be directly applied to road safety. We can analyse therelationship between speed and stopping distance. The following worked example illustrates thisapplication.
Worked Example 14: Stopping distance
Question: A truck is travelling at a constant velocity of 10 m·s−1when the driversees a child 50 m in front of him in the road. He hits the brakes to stop the truck.The truck accelerates at a rate of -1.25 m·s−2. His reaction time to hit the brakesis 0,5 seconds. Will the truck hit the child?AnswerStep 1 : Analyse the problem and identify what information is givenIt is useful to draw a timeline like this one:
59
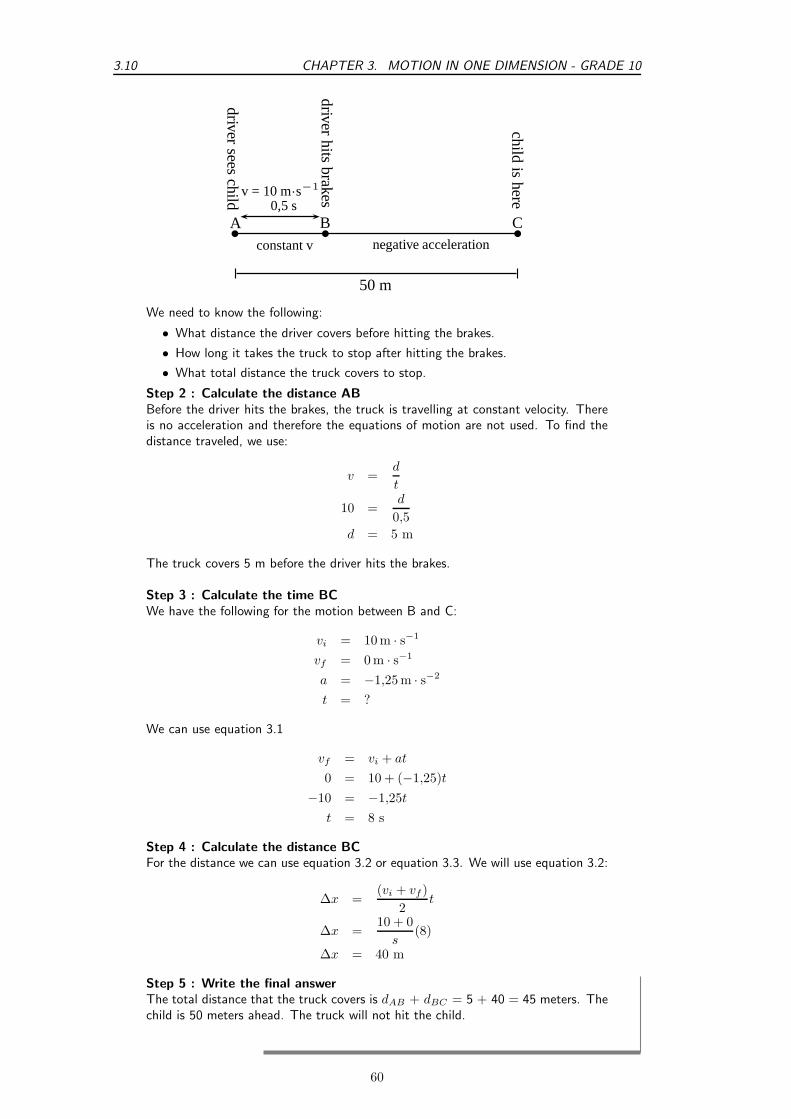
3.10 CHAPTER 3. MOTION IN ONE DIMENSION - GRADE 10
driversees
child
driverhits
brakes
constant v negative acceleration
childis
here
A B Cb b bb
50 m
0,5 sv = 10 m·s−1
We need to know the following:
• What distance the driver covers before hitting the brakes.
• How long it takes the truck to stop after hitting the brakes.
• What total distance the truck covers to stop.
Step 2 : Calculate the distance ABBefore the driver hits the brakes, the truck is travelling at constant velocity. Thereis no acceleration and therefore the equations of motion are not used. To find thedistance traveled, we use:
v =d
t
10 =d
0,5
d = 5 m
The truck covers 5 m before the driver hits the brakes.
Step 3 : Calculate the time BCWe have the following for the motion between B and C:
vi = 10 m · s−1
vf = 0 m · s−1
a = −1,25 m · s−2
t = ?
We can use equation 3.1
vf = vi + at
0 = 10 + (−1,25)t
−10 = −1,25t
t = 8 s
Step 4 : Calculate the distance BCFor the distance we can use equation 3.2 or equation 3.3. We will use equation 3.2:
∆x =(vi + vf )
2t
∆x =10 + 0
s(8)
∆x = 40 m
Step 5 : Write the final answerThe total distance that the truck covers is dAB + dBC = 5 + 40 = 45 meters. Thechild is 50 meters ahead. The truck will not hit the child.
60
CHAPTER 3. MOTION IN ONE DIMENSION - GRADE 10 3.11
3.11 Summary
• A reference point is a point from where you take your measurements.
• A frame of reference is a reference point with a set of directions.
• Your position is where you are located with respect to your reference point.
• The displacement of an object is how far it is from the reference point. It is the shortestdistance between the object and the reference point. It has magnitude and directionbecause it is a vector.
• The distance of an object is the length of the path travelled from the starting point to theend point. It has magnitude only because it is a scalar.
• A vector is a physical quantity with magnitude and direction.
• A scalar is a physical quantity with magnitude only.
• Speed (s) is the distance covered (d) divided by the time taken (∆t):
s =d
∆t
• Average velocity (v) is the displacement (∆x) divided by the time taken (∆t):
v =∆x
∆t
• Instantaneous speed is the speed at a specific instant in time.
• Instantaneous velocity is the velocity at a specific instant in time.
• Acceleration (a) is the change in velocity (∆x) over a time interval (∆t):
a =∆v
∆t
• The gradient of a position - time graph (x vs. t) give the velocity.
• The gradient of a velocity - time graph (v vs. t) give the acceleration.
• The area under a velocity - time graph (v vs. t) give the displacement.
• The area under an acceleration - time graph (a vs. t) gives the velocity.
• The graphs of motion are summarised in figure 3.10.
• The equations of motion are used where constant acceleration takes place:
vf = vi + at
∆x =(vi + vf )
2t
∆x = vit +1
2at2
v2f = v2
i + 2a∆x
61
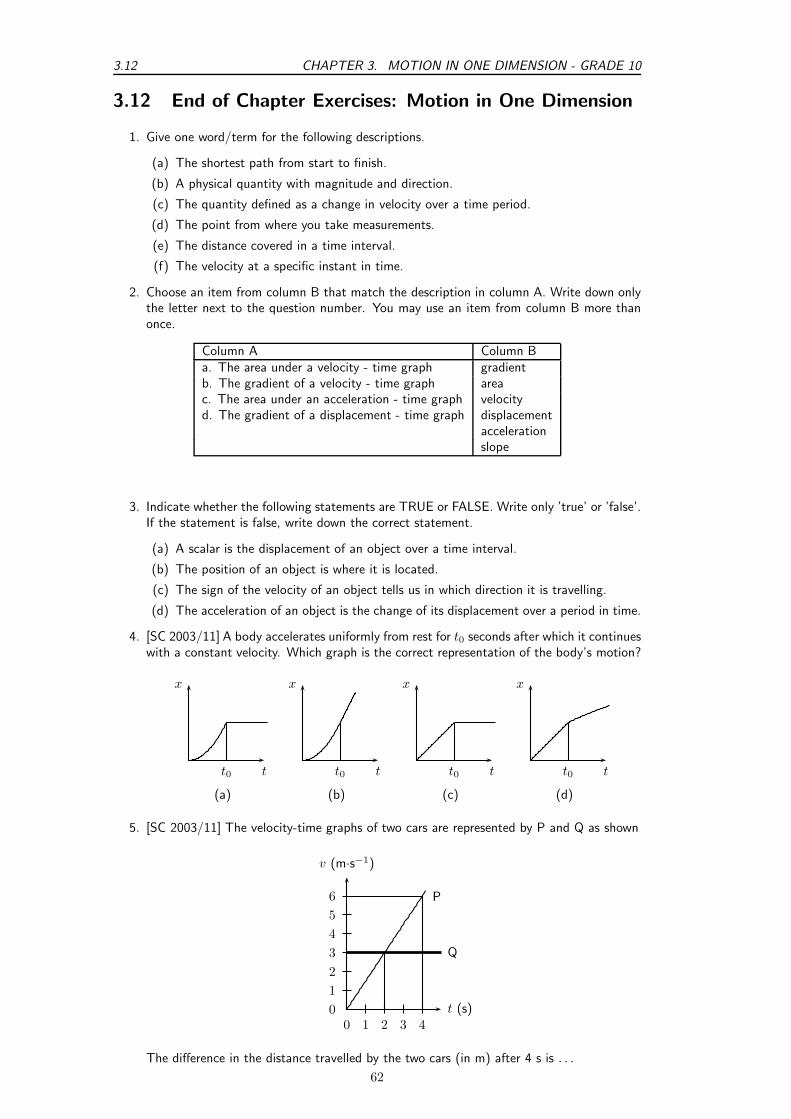
3.12 CHAPTER 3. MOTION IN ONE DIMENSION - GRADE 10
3.12 End of Chapter Exercises: Motion in One Dimension
1. Give one word/term for the following descriptions.
(a) The shortest path from start to finish.
(b) A physical quantity with magnitude and direction.
(c) The quantity defined as a change in velocity over a time period.
(d) The point from where you take measurements.
(e) The distance covered in a time interval.
(f) The velocity at a specific instant in time.
2. Choose an item from column B that match the description in column A. Write down onlythe letter next to the question number. You may use an item from column B more thanonce.
Column A Column Ba. The area under a velocity - time graph gradientb. The gradient of a velocity - time graph areac. The area under an acceleration - time graph velocityd. The gradient of a displacement - time graph displacement
accelerationslope
3. Indicate whether the following statements are TRUE or FALSE. Write only ’true’ or ’false’.If the statement is false, write down the correct statement.
(a) A scalar is the displacement of an object over a time interval.
(b) The position of an object is where it is located.
(c) The sign of the velocity of an object tells us in which direction it is travelling.
(d) The acceleration of an object is the change of its displacement over a period in time.
4. [SC 2003/11] A body accelerates uniformly from rest for t0 seconds after which it continueswith a constant velocity. Which graph is the correct representation of the body’s motion?
t
x
t0 t
x
t0 t
x
t0 t
x
t0
(a) (b) (c) (d)
5. [SC 2003/11] The velocity-time graphs of two cars are represented by P and Q as shown
0 1 2 3 40
1
2
3
4
5
6 P
Q
t (s)
v (m·s−1)
The difference in the distance travelled by the two cars (in m) after 4 s is . . .
62

CHAPTER 3. MOTION IN ONE DIMENSION - GRADE 10 3.12
(a) 12
(b) 6
(c) 2
(d) 0
6. [IEB 2005/11 HG] The graph that follows shows how the speed of an athlete varies withtime as he sprints for 100 m.
speed (m·s−1)
time (s)
10
t 11
Which of the following equations can be used to correctly determine the time t for whichhe accelerates?
(a) 100 = (10)(11) − 12 (10)t
(b) 100 = (10)(11) + 12 (10)t
(c) 100 = 10t + 12 (10)t2
(d) 100 = 12 (0)t + 1
2 (10)t2
7. [SC 2002/03 HG1] In which one of the following cases will the distance covered and themagnitude of the displacement be the same?
(a) A girl climbs a spiral staircase.
(b) An athlete completes one lap in a race.
(c) A raindrop falls in still air.
(d) A passenger in a train travels from Cape Town to Johannesburg.
8. [SC 2003/11] A car, travelling at constant velocity, passes a stationary motor cycle at atraffic light. As the car overtakes the motorcycle, the motorcycle accelerates uniformlyfrom rest for 10 s. The following displacement-time graph represents the motions of bothvehicles from the traffic light onwards.
motorcycle
car
x (m)
t (s)
375300
0 5 X 10 15
(a) Use the graph to find the magnitude of the constant velocity of the car.
(b) Use the information from the graph to show by means of calculation that the mag-nitude of the acceleration of the motorcycle, for the first 10 s of its motion is 7,5m·s−2.
(c) Calculate how long (in seconds) it will take the motorcycle to catch up with the car(point X on the time axis).
(d) How far behind the motorcycle will the car be after 15 seconds?
63

3.12 CHAPTER 3. MOTION IN ONE DIMENSION - GRADE 10
9. [IEB 2005/11 HG] Which of the following statements is true of a body that acceleratesuniformly?
(a) Its rate of change of position with time remains constant.
(b) Its position changes by the same amount in equal time intervals.
(c) Its velocity increases by increasing amounts in equal time intervals.
(d) Its rate of change of velocity with time remains constant.
10. [IEB 2003/11 HG1] The velocity-time graph for a car moving along a straight horizontalroad is shown below.
t (s)
v (m·s−1)
20
12
0 t
Area A
Area B
Which of the following expressions gives the magnitude of the average velocity of the car?
(a) AreaAt
(b) AreaA + AreaBt
(c) AreaBt
(d) AreaA − AreaBt
11. [SC 2002/11 SG] A car is driven at 25 m·s−1 in a municipal area. When the driver sees atraffic officer at a speed trap, he realises he is travelling too fast. He immediately appliesthe brakes of the car while still 100 m away from the speed trap.
(a) Calculate the magnitude of the minimum acceleration which the car must have toavoid exceeding the speed limit, if the municipal speed limit is 16.6 m·s−1.
(b) Calculate the time from the instant the driver applied the brakes until he reaches thespeed trap. Assume that the car’s velocity, when reaching the trap, is 16.6 m·s−1.
12. A traffic officer is watching his speed trap equipment at the bottom of a valley. He cansee cars as they enter the valley 1 km to his left until they leave the valley 1 km to hisright. Nelson is recording the times of cars entering and leaving the valley for a schoolproject. Nelson notices a white Toyota enter the valley at 11:01:30 and leave the valley at11:02:42. Afterwards, Nelson hears that the traffic officer recorded the Toyota doing 140km·hr−1.
(a) What was the time interval (∆t) for the Toyota to travel through the valley?
(b) What was the average speed of the Toyota?
(c) Convert this speed to km·hr−1.
(d) Discuss whether the Toyota could have been travelling at 140km·hr−1 at the bottomof the valley.
(e) Discuss the differences between the instantaneous speed (as measured by the speedtrap) and average speed (as measured by Nelson).
64

CHAPTER 3. MOTION IN ONE DIMENSION - GRADE 10 3.12
13. [IEB 2003/11HG] A velocity-time graph for a ball rolling along a track is shown below.The graph has been divided up into 3 sections, A, B and C for easy reference. (Disregardany effects of friction.)
time (s)
velocity (m·s−1)
A B C
121050
-0,2
0,6
t1
(a) Use the graph to determine the following:
i. the speed 5 s after the start
ii. the distance travelled in Section A
iii. the acceleration in Section C
(b) At time t1 the velocity-time graph intersects the time axis. Use an appropriateequation of motion to calculate the value of time t1 (in s).
(c) Sketch a displacement-time graph for the motion of the ball for these 12 s. (You donot need to calculate the actual values of the displacement for each time interval,but do pay attention to the general shape of this graph during each time interval.)
14. In towns and cities, the speed limit is 60 km·hr−1. The length of the average car is 3.5m, and the width of the average car is 2 m. In order to cross the road, you need to beable to walk further than the width of a car, before that car reaches you. To cross safely,you should be able to walk at least 2 m further than the width of the car (4 m in total),before the car reaches you.
(a) If your walking speed is 4 km·hr−1, what is your walking speed in m·s−1?
(b) How long does it take you to walk a distance equal to the width of the average car?
(c) What is the speed in m·s−1 of a car travelling at the speed limit in a town?
(d) How many metres does a car travelling at the speed limit travel, in the same timethat it takes you to walk a distance equal to the width of car?
(e) Why is the answer to the previous question important?
(f) If you see a car driving toward you, and it is 28 m away (the same as the length of 8cars), is it safe to walk across the road?
(g) How far away must a car be, before you think it might be safe to cross? How manycar-lengths is this distance?
15. A bus on a straight road starts from rest at a bus stop and accelerates at 2 m·s−2 until itreaches a speed of 20 m·s−1. Then the bus travels for 20 s at a constant speed until thedriver sees the next bus stop in the distance. The driver applies the brakes, stopping thebus in a uniform manner in 5 s.
(a) How long does the bus take to travel from the first bus stop to the second bus stop?
(b) What is the average velocity of the bus during the trip?
65

3.12 CHAPTER 3. MOTION IN ONE DIMENSION - GRADE 10
66

Chapter 4
Gravity and Mechanical Energy -Grade 10
4.1 Weight
Weight is the gravitational force that the Earth exerts on any object. The weight of an objectsgives you an indication of how strongly the Earth attracts that body towards its centre. Weightis calculated as follows:
Weight = mg
where m = mass of the object (in kg)and g = the acceleration due to gravity (9,8 m·s−2)
For example, what is Sarah’s weight if her mass is 50 kg. Sarah’sweight is calculated according to:
Weight = mg
= (50 kg)(9,8 m · s−2)
= 490 kg · m · s−2
= 490 N
Important: Weight is sometimes abbreviated as Fg which refers to the force of gravity. Donot use the abbreviation ’W’ for weight as it refers to ’Work’.
Now, we have said that the value of g is approximately 9,8 m·s−2on the surface of the Earth.The actual value varies slightly over the surface of the Earth. Each planet in our Solar Systemhas its own value for g. These values are listed as multiples of g on Earth in Table 4.1
Worked Example 15: Determining mass and weight on other planets
Question: Sarah’s mass on Earth is 50 kg. What is her mass and weight on Mars?AnswerStep 1 : Determine what information is given and what is askedm (on Earth) = 50 kgm (on Mars) = ?Weight (on Mars) = ?
67

4.1 CHAPTER 4. GRAVITY AND MECHANICAL ENERGY - GRADE 10
Planet Gravitational Acceleration(multiples of g on Earth)
Mercury 0.376Venus 0.903Earth 1Mars 0.38Jupiter 2.34Saturn 1.16Uranus 1.15Neptune 1.19Pluto 0.066
Table 4.1: A list of the gravitational accelerations at the surfaces of each of the planets in oursolar system. Values are listed as multiples of g on Earth. Note: The ”surface” is taken tomean the cloud tops of the gas giants (Jupiter, Saturn, Uranus and Neptune).
Step 2 : Calculate her mass on MarsSarah’s mass does not change because she is still made up of the same amount ofmatter. Her mass on Mars is therefore 50 kg.
Step 3 : Calculate her weight on Mars
Sarah′s weight = 50 × 0,38 × 9,8
= 186,2 N
4.1.1 Differences between Mass and Weight
Mass is measured in kilograms (kg) and is the amount of matter in an object. An object’s massdoes not change unless matter is added or removed from the object.
The differences between mass and weight can be summarised in the following table:
Mass Weight1. is a measure of how manymolecules there are in an object.
1. is the force with which theEarth attracts an object.
2. is measured in kilograms. 2. is measured in newtons3. is the same on any planet. 3. is different on different planets.4. is a scalar. 4. is a vector.
Exercise: Weight
1. A bag of sugar has a mass of 1 kg. How much does it weigh:
(a) on Earth?
(b) on Jupiter?
(c) on Pluto?
2. Neil Armstrong was the first man to walk on the surface of the Moon. Thegravitational acceleration on the Moon is 1
6 of the gravitational acceleration onEarth, and there is no gravitational acceleration in outer space. If Neil’s masswas 90 kg, what was his weight:
(a) on Earth?
68

CHAPTER 4. GRAVITY AND MECHANICAL ENERGY - GRADE 10 4.2
(b) on the Moon?
(c) in outer space?
3. A monkey has a mass of 15 kg on Earth. The monkey travels to Mars. Whatis his mass and weight on Mars?
4. Determine your mass by using a bathroom scale and calculate your weight foreach planet in the Solar System, using the values given in Table 4.1
4.2 Acceleration due to Gravity
4.2.1 Gravitational Fields
A field is a region of space in which a mass experiences a force. Therefore, a gravitational fieldis a region of space in which a mass experiences a gravitational force.
4.2.2 Free fall
Important: Free fall is motion in the Earth’s gravitational field when no other forces acton the object.
Free fall is the term used to describe a special kind of motion in the Earth’s gravitational field.Free fall is motion in the Earth’s gravitational field when no other forces act on the object. Itis basically an ideal situation, since in reality, there is always some air friction which slows downthe motion.
Activity :: Experiment : Acceleration due to GravityAim: Investigating the acceleration of two different objects during free fall.Apparatus: Tennis ball and a sheet of A4 paper.Method:
1. Hold the tennis ball and sheet of paper (horizontally) the same distance fromthe ground. Which one would strike the ground first if both were dropped?
b
2. Drop both objects and observe. Explain your observations.
3. Now crumple the paper into a ball, more or less the same size as the tennis ball.Drop the paper and tennis ball again and observe. Explain your observations.
4. Why do you think the two situations are different?
5. Compare the value for the acceleration due to gravity of the tennis ball to thecrumpled piece of paper.
6. Predict what will happen if an iron ball and a tennis ball of the same size aredropped from the same height. What will the values for their acceleration dueto gravity be?
69

4.2 CHAPTER 4. GRAVITY AND MECHANICAL ENERGY - GRADE 10
If a metal ball and tennis ball (of the same size) were dropped from the same height, both wouldreach the ground at the same time. It does not matter that the one ball is heavier than theother. The acceleration of an object due to gravity is independent of the mass of the object. Itdoes not matter what the mass of the object is.
The shape of the object, however, is important. The sheet of paper took much longer to reachthe ground than the tennis ball. This is because the effect of air friction on the paper was muchgreater than the air friction on the tennis ball.
If we lived in a world where there was no air resistance, the A4 sheet of paper and the tennisball would reach the ground at the same time. This happens in outer space or in a vaccuum.
Galileo Galilei, an Italian scientist, studied the motion of objects. The following case study willtell you more about one of his investigations.
Activity :: Case Study : Galileo GalileiIn the late sixteenth century, it was generally believed that heavier objects would
fall faster than lighter objects. The Italian scientist Galileo Galilei thought differently.Galileo hypothesized that two objects would fall at the same rate regardless of theirmass. Legend has it that in 1590, Galileo planned out an experiment. He climbedto the top of the Leaning Tower of Pisa and dropped several large objects to test histheory. He wanted to show that two different objects fall at the same rate (as longas we ignore air resistance). Galileo’s experiment proved his hypothesis correct; theacceleration of a falling object is independent of the object’s mass.
A few decades after Galileo, Sir Isaac Newton would show that accelerationdepends upon both force and mass. While there is greater force acting on a largerobject, this force is canceled out by the object’s greater mass. Thus two objects willfall (actually they are pulled) to the earth at exactly the same rate.
Questions: Read the case study above and answer the following questions.
1. Divide into pairs and explain Galileo’s experiment to your friend.
2. Write down an aim and a hypothesis for Galileo’s experiment.
3. Write down the result and conclusion for Galileo’s experiment.
Activity :: Research Project : Experimental DesignDesign an experiment similar to the one done by Galileo to prove that the ac-
celeration due to gravity of an object is independent of the object’s mass. Theinvestigation must be such that you can perform it at home or at school. Bringyour apparatus to school and perform the experiment. Write it up and hand it in forassessment.
70

CHAPTER 4. GRAVITY AND MECHANICAL ENERGY - GRADE 10 4.2
Activity :: Case Study : Determining the acceleration due to gravity 1Study the set of photographs alongside andanswer the following questions:
1. Determine the time between each pictureif the frequency of the exposures were 10Hz.
2. Determine the distance between each pic-ture.
3. Calculate the velocity of the ball betweenpictures 1 and 3.
v =x3 − x1
t3 − t1
4. Calculate the velocity of the ball betweenpictures 4 and 6.
5. Calculate the acceleration the ball betweenpictures 2 and 5.
a =v5 − v2
t5 − t2
6. Compare your answer to the value for theacceleration due to gravity (9,8 m·s−2).
t = 0 s
The acceleration due to gravity is constant. This means we can use the equations of motionunder constant acceleration that we derived in Chapter 3 (on Page 23) to describe the motionof an object in free fall. The equations are repeated here for ease of use.
vi = initial velocity (m·s−1) at t = 0 s
vf = final velocity (m·s−1) at time t
∆x = displacement (m)
t = time (s)
∆t = time interval (s)
g = acceleration (m·s−2)
vf = vi + gt (4.1)
∆x =(vi + vf )
2t (4.2)
∆x = vit +1
2gt2 (4.3)
v2f = v2
i + 2g∆x (4.4)
Activity :: Experiment : Determining the acceleration due to gravity 2Work in groups of at least two people.Aim: To determine the acceleration of an object in freefall.
71
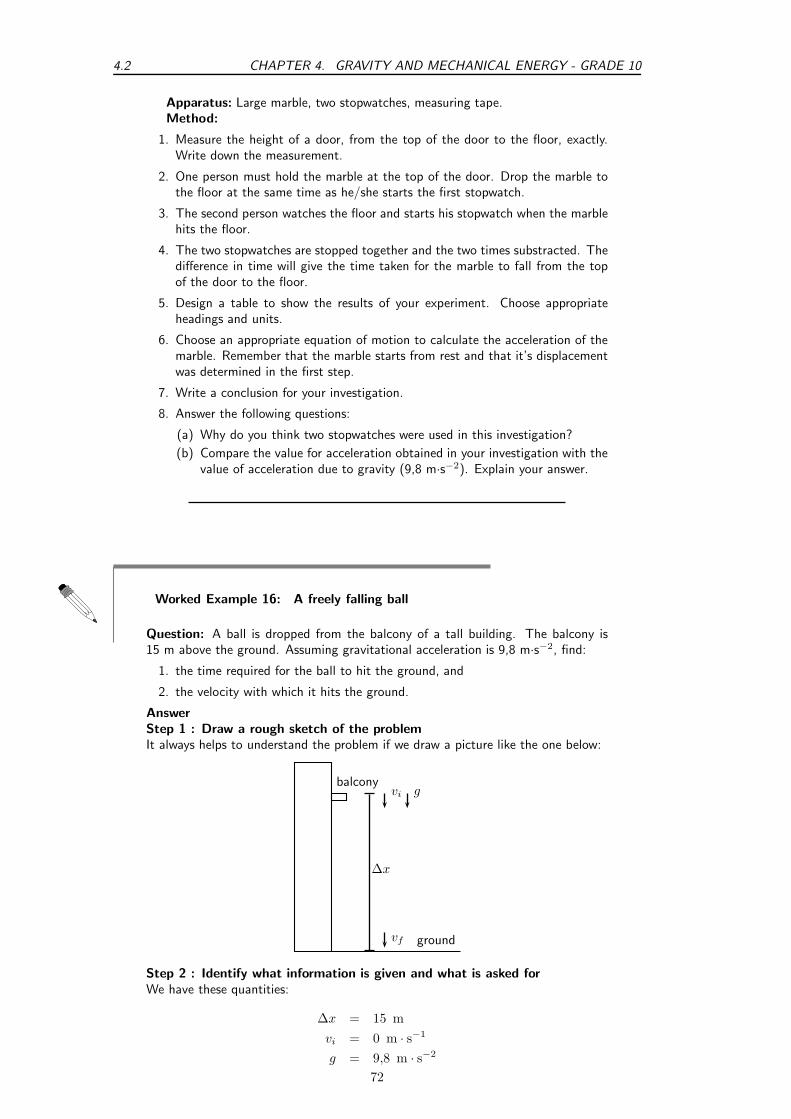
4.2 CHAPTER 4. GRAVITY AND MECHANICAL ENERGY - GRADE 10
Apparatus: Large marble, two stopwatches, measuring tape.Method:
1. Measure the height of a door, from the top of the door to the floor, exactly.Write down the measurement.
2. One person must hold the marble at the top of the door. Drop the marble tothe floor at the same time as he/she starts the first stopwatch.
3. The second person watches the floor and starts his stopwatch when the marblehits the floor.
4. The two stopwatches are stopped together and the two times substracted. Thedifference in time will give the time taken for the marble to fall from the topof the door to the floor.
5. Design a table to show the results of your experiment. Choose appropriateheadings and units.
6. Choose an appropriate equation of motion to calculate the acceleration of themarble. Remember that the marble starts from rest and that it’s displacementwas determined in the first step.
7. Write a conclusion for your investigation.
8. Answer the following questions:
(a) Why do you think two stopwatches were used in this investigation?
(b) Compare the value for acceleration obtained in your investigation with thevalue of acceleration due to gravity (9,8 m·s−2). Explain your answer.
Worked Example 16: A freely falling ball
Question: A ball is dropped from the balcony of a tall building. The balcony is15 m above the ground. Assuming gravitational acceleration is 9,8 m·s−2, find:
1. the time required for the ball to hit the ground, and
2. the velocity with which it hits the ground.
AnswerStep 1 : Draw a rough sketch of the problemIt always helps to understand the problem if we draw a picture like the one below:
balcony
ground
∆x
vf
vi g
Step 2 : Identify what information is given and what is asked forWe have these quantities:
∆x = 15 m
vi = 0 m · s−1
g = 9,8 m · s−2
72

CHAPTER 4. GRAVITY AND MECHANICAL ENERGY - GRADE 10 4.3
Step 3 : Choose up or down as the positive directionSince the ball is falling, we choose down as positive. This means that the values forvi ∆x and a will be positive.Step 4 : Choose the most appropriate equation.We can use equation 21.3 to find the time: ∆x = vit + 1
2gt2
Step 5 : Use the equation to find t.
∆x = vit +1
2gt2
15 = (0)t +1
2(9,8)(t)2
15 = 4,9 t2
t2 = 3.0612...
t = 1,7496...
t = 1,75 s
Step 6 : Find the final velocity vf .Using equation 21.1 to find vf :
vf = vi + gt
vf = 0 + (9,8)(1,7496...)
vf = 17,1464...
Remember to add the direction: vf = 17,15 m·s−1downwards.
By now you should have seen that free fall motion is just a special case of motion with constantacceleration, and we use the same equations as before. The only difference is that the value forthe acceleration, a, is always equal to the value of gravitational acceleration, g. In the equationsof motion we can replace a with g.
Exercise: Gravitational Acceleration
1. A brick falls from the top of a 5 m high building. Calculate the velocity withwhich the brick reaches the ground. How long does it take the brick to reachthe ground?
2. A stone is dropped from a window. It takes the stone 1,5 seconds to reach theground. How high above the ground is the window?
3. An apple falls from a tree from a height of 1,8 m. What is the velocity of theapple when it reaches the ground?
4.3 Potential Energy
The potential energy of an object is generally defined as the energy an object has because ofits position relative to other objects that it interacts with. There are different kinds of potentialenergy such as gravitional potential energy, chemical potential energy, electrical potential energy,to name a few. In this section we will be looking at gravitational potential energy.
73

4.3 CHAPTER 4. GRAVITY AND MECHANICAL ENERGY - GRADE 10
Definition: Potential energyPotential energy is the energy an object has due to its position or state.
Gravitational potential energy is the energy of an object due to its position above the surface ofthe Earth. The symbol PE is used to refer to gravitational potential energy. You will often findthat the words potential energy are used where gravitational potential energy is meant. We candefine potential energy (or gravitational potential energy, if you like) as:
PE = mgh (4.5)
where PE = potential energy measured in joules (J)m = mass of the object (measured in kg)g = gravitational acceleration (9,8 m·s−2)h = perpendicular height from the reference point (measured in m)
A suitcase, with a mass of 1 kg, is placed at the top of a 2 m high cupboard. By lifting thesuitcase against the force of gravity, we give the suitcase potential energy. This potential energycan be calculated using equation 4.5.
If the suitcase falls off the cupboard, it will lose its potential energy. Halfway down the cupboard,the suitcase will have lost half its potential energy and will have only 9,8 J left. At the bottomof the cupboard the suitcase will have lost all it’s potential energy and it’s potential energy willbe equal to zero.
Objects have maximum potential energy at a maximum height and will lose their potentialenergy as they fall.
PE = mgh = 1 × 9,8 × 2 = 19,6 J
PE = mgh = 1 × 9,8 × 0 = 0 J
The potential energy is a maximum.
The potential energy is a minimum.
Worked Example 17: Gravitational potential energy
Question: A brick with a mass of 1 kg is lifted to the top of a 4 m high roof. Itslips off the roof and falls to the ground. Calculate the potential energy of the brickat the top of the roof and on the ground once it has fallen.AnswerStep 1 : Analyse the question to determine what information is provided
• The mass of the brick is m = 1 kg
• The height lifted is h = 4 m
All quantities are in SI units.Step 2 : Analyse the question to determine what is being asked
• We are asked to find the gain in potential energy of the brick as it is lifted ontothe roof.
74

CHAPTER 4. GRAVITY AND MECHANICAL ENERGY - GRADE 10 4.4
• We also need to calculate the potential energy once the brick is on the groundagain.
Step 3 : Identify the type of potential energy involvedSince the block is being lifted we are dealing with gravitational potential energy. Towork out PE, we need to know the mass of the object and the height lifted. Asboth of these are given, we just substitute them into the equation for PE.Step 4 : Substitute and calculate
PE = mgh
= (1)(9,8)(4)
= 39,2 J
Exercise: Gravitational Potential Energy
1. Describe the relationship between an object’s gravitational potential energy andits:
(a) mass and
(b) height above a reference point.
2. A boy, of mass 30 kg, climbs onto the roof of their garage. The roof is 2,5 mfrom the ground. He now jumps off the roof and lands on the ground.
(a) How much potential energy has the boy gained by climbing on the roof?
(b) The boy now jumps down. What is the potential energy of the boy whenhe is 1 m from the ground?
(c) What is the potential energy of the boy when he lands on the ground?
3. A hiker walks up a mountain, 800 m above sea level, to spend the night at thetop in the first overnight hut. The second day he walks to the second overnighthut, 500 m above sea level. The third day he returns to his starting point, 200m above sea level.
(a) What is the potential energy of the hiker at the first hut (relative to sealevel)?
(b) How much potential energy has the hiker lost during the second day?
(c) How much potential energy did the hiker have when he started his journey(relative to sea level)?
(d) How much potential energy did the hiker have at the end of his journey?
4.4 Kinetic Energy
Definition: Kinetic EnergyKinetic energy is the energy an object has due to its motion.
Kinetic energy is the energy an object has because of its motion. This means that any movingobject has kinetic energy. The faster it moves, the more kinetic energy it has. Kinetic energy(KE) is therefore dependent on the velocity of the object. The mass of the object also plays a
75

4.4 CHAPTER 4. GRAVITY AND MECHANICAL ENERGY - GRADE 10
role. A truck of 2000 kg, moving at 100 km·hr−1, will have more kinetic energy than a car of500 kg, also moving at 100 km·hr−1. Kinetic energy is defined as:
KE =1
2mv2 (4.6)
Consider the 1 kg suitcase on the cupboard that was discussed earlier. When the suitcase falls, itwill gain velocity (fall faster), until it reaches the ground with a maximum velocity. The suitcasewill not have any kinetic energy when it is on top of the cupboard because it is not moving.Once it starts to fall it will gain kinetic energy, because it gains velocity. Its kinetic energy willincrease until it is a maximum when the suitcase reaches the ground.
KE = 12mv2 = 0 J
KE = 12mv2 = 19,6 J
The kinetic energy is a minimum.
The kinetic energy is a maximum.
Worked Example 18: Calculation of Kinetic Energy
Question: A 1 kg brick falls off a 4 m high roof. It reaches the ground with avelocity of 8,85 m·s−1. What is the kinetic energy of the brick when it starts to falland when it reaches the ground?
Answer
Step 1 : Analyse the question to determine what information is provided
• The mass of the rock m = 1 kg
• The velocity of the rock at the bottom vbottom = 8,85 m·s−1
These are both in the correct units so we do not have to worry about unit conversions.
Step 2 : Analyse the question to determine what is being asked
We are asked to find the kinetic energy of the brick at the top and the bottom.From the definition we know that to work out KE, we need to know the mass andthe velocity of the object and we are given both of these values.
Step 3 : Calculate the kinetic energy at the top
Since the brick is not moving at the top, its kinetic energy is zero.
Step 4 : Substitute and calculate the kinetic energy
KE =1
2mv2
=1
2(1 kg)(8,85 m · s−1)2
= 39,2 J
76

CHAPTER 4. GRAVITY AND MECHANICAL ENERGY - GRADE 10 4.4
4.4.1 Checking units
According to the equation for kinetic energy, the unit should be kg·m2 ·s−2. We can prove thatthis unit is equal to the joule, the unit for energy.
(kg)(m · s−1)2 = (kg · m · s−2) · m
= N · m (because Force (N) = mass (kg) × acceleration (m·s−2))
= J (Work (J) = Force (N) × distance (m))
We can do the same to prove that the unit for potential energy is equal to the joule:
(kg)(m · s−2)(m) = N · m
= J
Worked Example 19: Mixing Units & Energy Calculations
Question: A bullet, having a mass of 150 g, is shot with a muzzle velocity of960 m·s−1. Calculate its kinetic energy?AnswerStep 1 : Analyse the question to determine what information is provided
• We are given the mass of the bullet m = 150 g. This is not the unit we wantmass to be in. We need to convert to kg.
Mass in grams÷ 1000 = Mass in kg
150 g ÷ 1000 = 0,150 kg
• We are given the initial velocity with which the bullet leaves the barrel, calledthe muzzle velocity, and it is v = 960 m·s−1.
Step 2 : Analyse the question to determine what is being asked
• We are asked to find the kinetic energy.
Step 3 : Substitute and calculateWe just substitute the mass and velocity (which are known) into the equation forkinetic energy:
KE =1
2mv2
=1
2(150)(960)2
= 69 120 J
Exercise: Kinetic Energy
1. Describe the relationship between an object’s kinetic energy and its:
(a) mass and
(b) velocity
2. A stone with a mass of 100 g is thrown up into the air. It has an initial velocityof 3 m·s−1. Calculate its kinetic energy
(a) as it leaves the thrower’s hand.
(b) when it reaches its turning point.
77

4.5 CHAPTER 4. GRAVITY AND MECHANICAL ENERGY - GRADE 10
3. A car with a mass of 700 kg is travelling at a constant velocity of 100 km·hr−1.Calculate the kinetic energy of the car.
4.5 Mechanical Energy
Important: Mechanical energy is the sum of the gravitational potential energy and thekinetic energy.
Mechanical energy, U , is simply the sum of gravitational potential energy (PE) and the kineticenergy (KE). Mechanical energy is defined as:
U = PE + KE (4.7)
U = PE + KE
U = mgh +1
2mv2 (4.8)
4.5.1 Conservation of Mechanical Energy
The Law of Conservation of Energy states:
Energy cannot be created or destroyed, but is merely changed from one form intoanother.
Definition: Conservation of EnergyThe Law of Conservation of Energy: Energy cannot be created or destroyed, but is merelychanged from one form into another.
So far we have looked at two types of energy: gravitational potential energy and kinetic energy.The sum of the gravitational potential energy and kinetic energy is called the mechanical energy.In a closed system, one where there are no external forces acting, the mechanical energy willremain constant. In other words, it will not change (become more or less). This is called theLaw of Conservation of Mechanical Energy and it states:
The total amount of mechanical energy in a closed system remains constant.
Definition: Conservation of Mechanical EnergyLaw of Conservation of Mechanical Energy: The total amount of mechanical energy in aclosed system remains constant.
This means that potential energy can become kinetic energy, or vise versa, but energy cannot’dissappear’. The mechanical energy of an object moving in the Earth’s gravitational field (oraccelerating as a result of gravity) is constant or conserved, unless external forces, like airresistance, acts on the object.
We can now use the conservation of mechanical energy to calculate the velocity of a body infreefall and show that the velocity is independent of mass.
78

CHAPTER 4. GRAVITY AND MECHANICAL ENERGY - GRADE 10 4.5
Important: In problems involving the use of conservation of energy, the path taken bythe object can be ignored. The only important quantities are the object’s velocity (whichgives its kinetic energy) and height above the reference point (which gives its gravitationalpotential energy).
Important: In the absence of friction, mechanical energy is conserved and
Ubefore = Uafter
In the presence of friction, mechanical energy is not conserved. The mechanical energy lostis equal to the work done against friction.
∆U = Ubefore − Uafter = work done against friction
In general mechanical energy is conserved in the absence of external forces. Examples of externalforces are: applied forces, frictional forces, air resistance, tension, normal forces.
In the presence of internal forces like the force due to gravity or the force in a spring, mechanicalenergy is conserved.
4.5.2 Using the Law of Conservation of Energy
Mechanical energy is conserved (in the absence of friction). Therefore we can say that the sumof the PE and the KE anywhere during the motion must be equal to the sum of the PE andthe KE anywhere else in the motion.
We can now apply this to the example of the suitcase on the cupboard. Consider the mechanicalenergy of the suitcase at the top and at the bottom. We can say:
The mechanical energy (U) at the top.
The mechanical energy will remain constantthroughout the motion and will always be a maximum.
The mechanical energy (U) at the bottom.
Utop = Ubottom
PEtop + KEtop = PEbottom + KEbottom
mgh +1
2mv2 = mgh +
1
2mv2
(1)(9,8)(2) + 0 = 0 +1
2(1)(v2)
19,6 J =1
2v2
39,2 = v2
v = 6,26 m · s−1
79
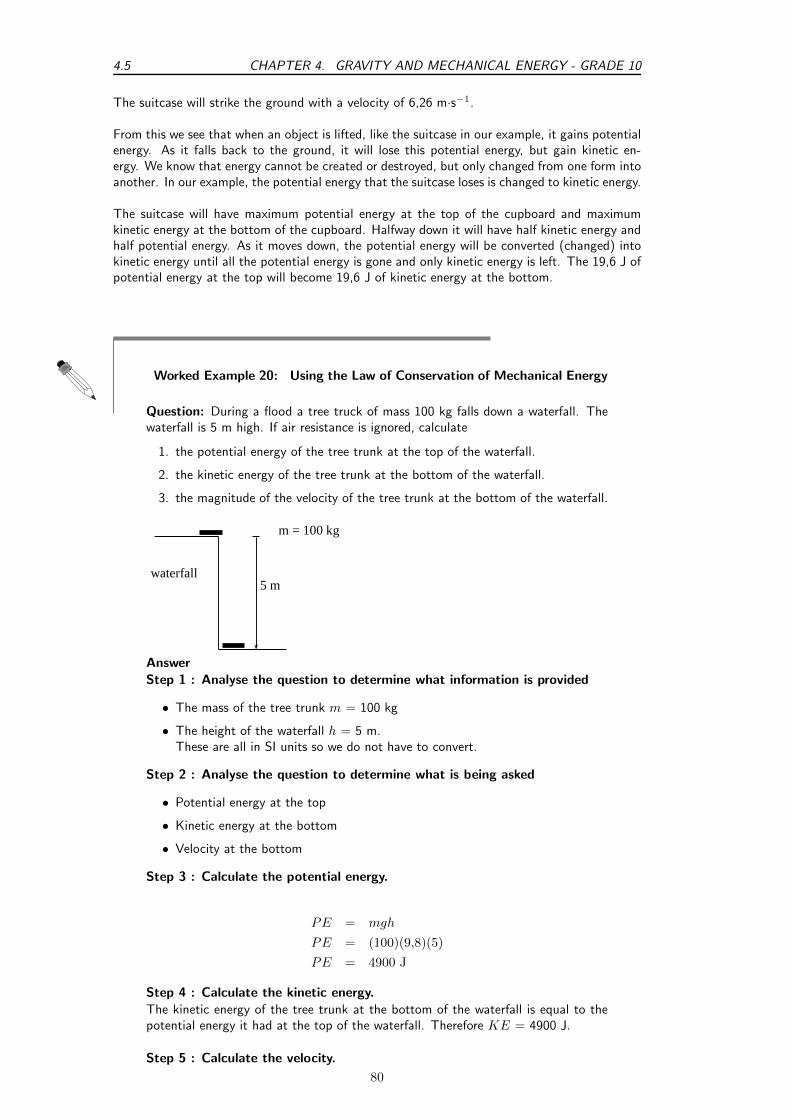
4.5 CHAPTER 4. GRAVITY AND MECHANICAL ENERGY - GRADE 10
The suitcase will strike the ground with a velocity of 6,26 m·s−1.
From this we see that when an object is lifted, like the suitcase in our example, it gains potentialenergy. As it falls back to the ground, it will lose this potential energy, but gain kinetic en-ergy. We know that energy cannot be created or destroyed, but only changed from one form intoanother. In our example, the potential energy that the suitcase loses is changed to kinetic energy.
The suitcase will have maximum potential energy at the top of the cupboard and maximumkinetic energy at the bottom of the cupboard. Halfway down it will have half kinetic energy andhalf potential energy. As it moves down, the potential energy will be converted (changed) intokinetic energy until all the potential energy is gone and only kinetic energy is left. The 19,6 J ofpotential energy at the top will become 19,6 J of kinetic energy at the bottom.
Worked Example 20: Using the Law of Conservation of Mechanical Energy
Question: During a flood a tree truck of mass 100 kg falls down a waterfall. Thewaterfall is 5 m high. If air resistance is ignored, calculate
1. the potential energy of the tree trunk at the top of the waterfall.
2. the kinetic energy of the tree trunk at the bottom of the waterfall.
3. the magnitude of the velocity of the tree trunk at the bottom of the waterfall.
5 m
m = 100 kg
waterfall
Answer
Step 1 : Analyse the question to determine what information is provided
• The mass of the tree trunk m = 100 kg
• The height of the waterfall h = 5 m.These are all in SI units so we do not have to convert.
Step 2 : Analyse the question to determine what is being asked
• Potential energy at the top
• Kinetic energy at the bottom
• Velocity at the bottom
Step 3 : Calculate the potential energy.
PE = mgh
PE = (100)(9,8)(5)
PE = 4900 J
Step 4 : Calculate the kinetic energy.
The kinetic energy of the tree trunk at the bottom of the waterfall is equal to thepotential energy it had at the top of the waterfall. Therefore KE = 4900 J.
Step 5 : Calculate the velocity.
80

CHAPTER 4. GRAVITY AND MECHANICAL ENERGY - GRADE 10 4.5
To calculate the velocity of the tree trunk we need to use the equation for kineticenergy.
KE =1
2mv2
4900 =1
2(100)(v2)
98 = v2
v = 9,899...
v = 9,90 m · s−1downwards
Worked Example 21: Pendulum
Question: A 2 kg metal ball is suspended from a rope. If it is released from pointA and swings down to the point B (the bottom of its arc):
1. Show that the velocity of the ball is independent of it mass.
2. Calculate the velocity of the ball at point B.
A
B
0.5m
AnswerStep 1 : Analyse the question to determine what information is provided
• The mass of the metal ball is m = 2 kg
• The change in height going from point A to point B is h = 0,5 m
• The ball is released from point A so the velocity at point, vA = 0 m·s−1.
All quantities are in SI units.
Step 2 : Analyse the question to determine what is being asked
• Prove that the velocity is independent of mass.
• Find the velocity of the metal ball at point B.
Step 3 : Apply the Law of Conservation of Mechanical Energy to the situationAs there is no friction, mechanical energy is conserved. Therefore:
UA = UB
PEA + KEA = PEB + KEB
mghA +1
2m(vA)2 = mghB +
1
2m(vB)2
mghA + 0 = 0 +1
2m(vB)2
mghA =1
2m(vB)2
As the mass of the ball m appears on both sides of the equation, it can be eliminatedso that the equation becomes:
ghA =1
2(vB)2
81

4.6 CHAPTER 4. GRAVITY AND MECHANICAL ENERGY - GRADE 10
2ghA = (vB)2
This proves that the velocity of the ball is independent of its mass. It does notmatter what its mass is, it will always have the same velocity when it falls throughthis height.Step 4 : Calculate the velocity of the ballWe can use the equation above, or do the calculation from ’first principles’:
(vB)2 = 2ghA
(vB)2 = (2)(9.8)(0,5)
(vB)2 = 9,8
vB =√
9,8 m · s−1
Exercise: Potential Energy
1. A tennis ball, of mass 120 g, is dropped from a height of 5 m. Ignore airfriction.
(a) What is the potential energy of the ball when it has fallen 3 m?
(b) What is the velocity of the ball when it hits the ground?
2. A bullet, mass 50 g, is shot vertically up in the air with a muzzle velocity of 200m·s−1. Use the Principle of Conservation of Mechanical Energy to determinethe height that the bullet will reach. Ignore air friction.
3. A skier, mass 50 kg, is at the top of a 6,4 m ski slope.
(a) Determine the maximum velocity that she can reach when she skies to thebottom of the slope.
(b) Do you think that she will reach this velocity? Why/Why not?
4. A pendulum bob of mass 1,5 kg, swings from a height A to the bottom of itsarc at B. The velocity of the bob at B is 4 m·s−1. Calculate the height A fromwhich the bob was released. Ignore the effects of air friction.
5. Prove that the velocity of an object, in free fall, in a closed system, is indepen-dent of its mass.
4.6 Energy graphs
Let us consider our example of the suitcase on the cupboard, once more.
Let’s look at each of these quantities and draw a graph for each. We will look at how eachquantity changes as the suitcase falls from the top to the bottom of the cupboard.
• Potential energy: The potential energy starts off at a maximum and decreases until itreaches zero at the bottom of the cupboard. It had fallen a distance of 2 metres.
PE (J)
20
19,6
distance (m)
82

CHAPTER 4. GRAVITY AND MECHANICAL ENERGY - GRADE 10 4.7
The kinetic energy is zero at the top.
The kinetic energy is a maximum at the bottom
The mechanical energy will remain constantthroughout the motion and will always be a maximum.
The potential energy is a maximum at the top.
The potential energy is zero at the bottom.
• Kinetic energy: The kinetic energy is zero at the start of the fall. When the suitcasereaches the ground, the kinetic energy is a miximum. We also use distance on the x-axis.
KE (J)
20
19,6
distance (m)
• Mechanical energy: The mechanical energy is constant throughout the motion and isalways a maximum. At any point in time, when we add the potential energy and thekinetic energy, we will get the same number.
U (J)
20
19,6
distance (m)
4.7 Summary
• Mass is the amount of matter an object is made up of.
• Weight is the force with which the Earth attracts a body towards its centre.
• A body is in free fall if it is moving in the Earth’s gravitational field and no other forcesact on it.
• The equations of motion can be used for free fall problems. The acceleration (a) is equalto the acceleration due to gravity (g).
• The potential energy of an object is the energy the object has due to his position above areference point.
• The kinetic energy of an object is the energy the object has due to its motion.
• Mechanical energy of an object is the sum of the potential energy and kinetic energy ofthe object.
• The unit for energy is the joule (J).
83

4.8 CHAPTER 4. GRAVITY AND MECHANICAL ENERGY - GRADE 10
• The Law of Conservation of Energy states that energy cannot be created or destroyed, butcan only be changed from one form into another.
• The Law of Conservation of Mechanical Energy states that the total mechanical energy ofan isolated system remains constant.
• The table below summarises the most important equations:
Weight Fg = m · gEquation of motion vf = vi + gt
Equation of motion ∆x =(vi+vf )
2 tEquation of motion ∆x = vit + 1
2gt2
Equation of motion v2f = v2
i + 2g∆x
Potential Energy PE = mgh
Kinetic Energy KE = 12mv2
Mechanical Energy U = KE + PE
4.8 End of Chapter Exercises: Gravity and Mechanical En-ergy
1. Give one word/term for the following descriptions.
(a) The force with which the Earth attracts a body.
(b) The unit for energy.
(c) The movement of a body in the Earth’s gravitational field when no other forces acton it.
(d) The sum of the potential and kinetic energy of a body.
(e) The amount of matter an object is made up of.
2. Consider the situation where an apple falls from a tree. Indicate whether the followingstatements regarding this situation are TRUE or FALSE. Write only ’true’ or ’false’. If thestatement is false, write down the correct statement.
(a) The potential energy of the apple is a maximum when the apple lands on the ground.
(b) The kinetic energy remains constant throughout the motion.
(c) To calculate the potential energy of the apple we need the mass of the apple and theheight of the tree.
(d) The mechanical energy is a maximum only at the beginning of the motion.
(e) The apple falls at an acceleration of 9,8 m·s−2.
3. [IEB 2005/11 HG] Consider a ball dropped from a height of 1 m on Earth and an identicalball dropped from 1 m on the Moon. Assume both balls fall freely. The acceleration dueto gravity on the Moon is one sixth that on Earth. In what way do the following comparewhen the ball is dropped on Earth and on the Moon.
Mass Weight Increase in kinetic energy(a) the same the same the same(b) the same greater on Earth greater on Earth(c) the same greater on Earth the same(d) greater on Earth greater on Earth greater on Earth
4. A man fires a rock out of a slingshot directly upward. The rock has an initial velocity of15 m·s−1.
(a) How long will it take for the rock to reach its highest point?
(b) What is the maximum height that the rock will reach?
(c) Draw graphs to show how the potential energy, kinetic energy and mechanical energyof the rock changes as it moves to its highest point.
84

CHAPTER 4. GRAVITY AND MECHANICAL ENERGY - GRADE 10 4.8
5. A metal ball of mass 200 g is tied to a light string to make a pendulum. The ball is pulledto the side to a height (A), 10 cm above the lowest point of the swing (B). Air frictionand the mass of the string can be ignored. The ball is let go to swing freely.
(a) Calculate the potential energy of the ball at point A.
(b) Calculate the kinetic energy of the ball at point B.
(c) What is the maximum velocity that the ball will reach during its motion?
6. A truck of mass 1,2 tons is parked at the top of a hill, 150 m high. The truck driver letsthe truck run freely down the hill to the bottom.
(a) What is the maximum velocity that the truck can achieve at the bottom of the hill?
(b) Will the truck achieve this velocity? Why/why not?
7. A stone is dropped from a window, 3 metres above the ground. The mass of the stone is25 grams.
(a) Use the Equations of Motion to calculate the velocity of the stone as it reaches theground.
(b) Use the Principle of Conservation of Energy to prove that your answer in (a) is correct.
85

4.8 CHAPTER 4. GRAVITY AND MECHANICAL ENERGY - GRADE 10
86

Chapter 5
Transverse Pulses - Grade 10
5.1 Introduction
This chapter forms the basis of the discussion into mechanical waves. Waves are all around us,even though most of us are not aware of it. The most common waves are waves in the sea, butwaves can be created in any container of water, ranging from an ocean to a tea-cup. Simply, awave is moving energy.
5.2 What is a medium?
In this chapter, as well as in the following chapters, we will speak about waves moving in amedium. A medium is just the substance or material through which waves move. In other wordsthe medium carries the wave from one place to another. The medium does not create the waveand the medium is not the wave. Air is a medium for sound waves, water is a medium for waterwaves and rock is a medium for earthquakes (which are also a type of wave). Air, water androck are therefore examples of media (media is the plural of medium).
Definition: MediumA medium is the substance or material in which a wave will move.
In each medium, the atoms that make up the medium are moved temporarily from their restposition. In order for a wave to travel, the different parts of the medium must be able to interactwith each other.
5.3 What is a pulse?
Activity :: Investigation : Observation of PulsesTake a heavy rope. Have two people hold the rope stretched out horizontally.
Flick the rope at one end only once.
flick rope upwards at one end, once only
What happens to the disturbance that you created in the rope? Does it stay at theplace where it was created or does it move down the length of the rope?
87

5.3 CHAPTER 5. TRANSVERSE PULSES - GRADE 10
In the activity, we created a pulse. A pulse is a single disturbance that moves through amedium. A transverse pulse moves perpendicular to the medium. Figure 5.1 shows an exampleof a transverse pulse. In the activity, the rope or spring was held horizontally and the pulsemoved the rope up and down. This was an example of a transverse pulse.
Definition: PulseA pulse is a single disturbance that moves through a medium.
5.3.1 Pulse Length and Amplitude
The amplitude of a pulse is a measurement of how far the medium is displaced from a positionof rest. The pulse length is a measurement of how long the pulse is. Both these quantities areshown in Figure 5.1.
Definition: AmplitudeThe amplitude of a pulse is a measurement of how far the medium is displaced from rest.
amplitude
pulse lengthposition of rest
Figure 5.1: Example of a transverse pulse
Activity :: Investigation : Pulse Length and AmplitudeThe graphs below show the positions of a pulse at different times.
a
pa
pa
pa
p
t=0 s
t=1 s
t=2 s
t=3 s
Use your ruler to measure the lengths of a and p. Fill your answers in the table.
Time a pt = 0 st = 1 st = 2 st = 3 s
88

CHAPTER 5. TRANSVERSE PULSES - GRADE 10 5.3
What do you notice about the values of a and p?
In the activity, we found that the values for how high the pulse (a) is and how wide the pulse(p) is the same at different times. Pulse length and amplitude are two important quantities ofa pulse.
5.3.2 Pulse Speed
Definition: Pulse SpeedPulse speed is the distance a pulse travels in a specific time.
In Chapter 3 we saw that speed was defined as the distance travelled in a specified time. Wecan use the same definition of speed to calculate how fast a pulse travels. If the pulse travels adistance d in a time t, then the pulse speed v is:
v =d
t
Worked Example 22: Pulse Speed
Question: A pulse covers a distance of 2 m in 4 s on a heavy rope. Calculate thepulse speed.AnswerStep 5 : Determine what is given and what is requiredWe are given:
• the distance travelled by the pulse: d = 2 m
• the time taken to travel 2 m: t = 4 s
We are required to calculate the speed of the pulse.Step 6 : Determine how to approach the problemWe can use:
v =d
t
to calculate the speed of the pulse.Step 7 : Calculate the pulse speed
v =d
t
=2 m
4 s
= 0,5 m · s−1
Step 8 : Write the final answerThe pulse speed is 0,5 m·s−1.
Important: The pulse speed depends on the properties of the medium and not on theamplitude or pulse length of the pulse.
89

5.4 CHAPTER 5. TRANSVERSE PULSES - GRADE 10
Exercise: Pulse Speed
1. A pulse covers a distance of 5 m in 15 seconds. Calculate the speed of thepulse.
2. A pulse has a speed of 5 cm.s−1. How far does it travel in 2,5 seconds?
3. A pulse has a speed of 0,5 m·s−1. How long does it take to cover a distanceof 25 cm?
4. How long will it take a pulse moving at 0,25 m·s−1 to travel a distance of 20 m?
5. Examine the two pulses below andstate which has the higher speed. Ex-plain your answer.
A
B
6. Ocean waves do not bring more water onto the shore until the beach is com-pletely submerged. Explain why this is so.
5.4 Graphs of Position and Velocity
When a pulse moves through a medium, there are two different motions: the motion of theparticles of the medium and the motion of the pulse. These two motions are at right angles toeach other when the pulse is transverse. Each motion will be discussed.
Consider the situation shown in Figure ??. The dot represents one particle of the medium. Wesee that as the pulse moves to the right the particle only moves up and down.
5.4.1 Motion of a Particle of the Medium
First we consider the motion of a particle of the medium when a pulse moves through themedium. For the explanation we will zoom into the medium so that we are looking at the atomsof the medium. These atoms are connected to each other as shown in Figure 5.2.
b b b b b b b b b
Figure 5.2: Particles in a medium.
When a pulse moves through the medium, the particles in the medium only move up and down.We can see this in the figure below which shows the motion of a single particle as a pulse movesthrough the medium.
90

CHAPTER 5. TRANSVERSE PULSES - GRADE 10 5.4
t=0 s
t=1 s
t=2 s
t=3 s
t=4 s
t=5 s
t=6 s
t=7 s
t=8 s
t=9 s
b
b
b
b
b
b
b
b
b
b
pulse
Important: A particle in the medium only moves up and down when a transverse pulsemoves through the medium. The pulse moves from left to right (or right to left). Themotion of the particle is perpendicular to the motion of a transverse pulse.
If you consider the motion of the particle as a function of time, you can draw a graph of positionvs. time and velocity vs. time.
Activity :: Investigation : Drawing a position-time graph
1. Study Figure ?? and complete the following table:
time (s) 0 1 2 3 4 5 6 7 8 9position (cm)
2. Use your table to draw a graph of position vs. time for a particle in a medium.
The position vs. time graph for a particle in a medium when a pulse passes through the mediumis shown in Figure 5.3
Activity :: Investigation : Drawing a velocity-time graph
1. Study Figure 5.3 and Figure 5.4 and complete the following table:
91

5.4 CHAPTER 5. TRANSVERSE PULSES - GRADE 10
b
b
b
b
b b
b
b
b
b
0 1 2 3 4 5 6 7 8 90
0.5
1.0
1.5
2.0
2.5
3.0
3.5
4.0
4.5
Time (s)
Po
sitio
n(c
m)
Figure 5.3: Position against Time graph of a particle in the medium through which a transversepulse is travelling.
time (s) 0 1 2 3 4 5 6 7 8 9velocity (cm.s−1)
2. Use your table to draw a graph of velocity vs time for a particle in a medium.
The velocity vs. time graph far a particle in a medium when a pulse passes through the mediumis shown in Figure 5.4.
0 1 2 3 4 5 6 7 8 90
0.5
1.0
1.5
Time (s)
Vel
oci
ty(c
m.s−
1)
b b b b b b b b b
Figure 5.4: Velocity against Time graph of a particle in the medium through which a transversepulse is travelling.
5.4.2 Motion of the Pulse
The motion of the pulse is much simpler than the motion of a particle in the medium.
Important: A point on a transverse pulse, eg. the peak, only moves in the direction of themotion of the pulse.
92
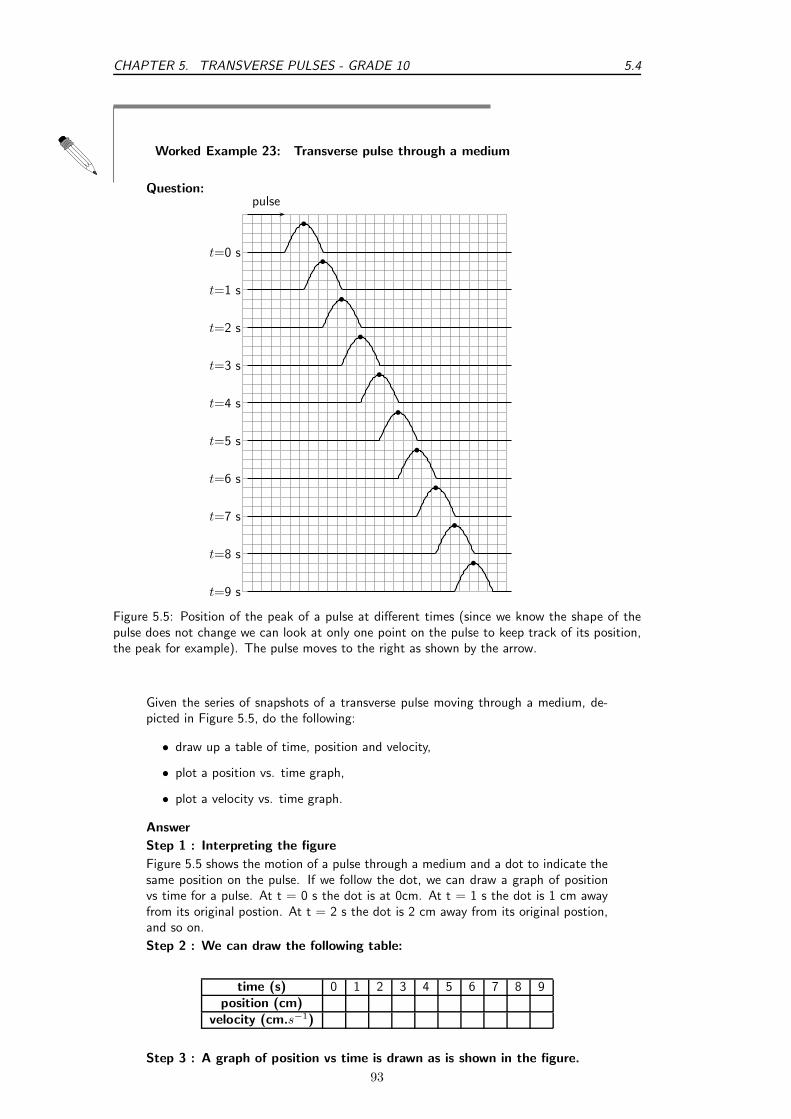
CHAPTER 5. TRANSVERSE PULSES - GRADE 10 5.4
Worked Example 23: Transverse pulse through a medium
Question:
b
b
b
b
b
b
b
b
b
b
t=0 s
t=1 s
t=2 s
t=3 s
t=4 s
t=5 s
t=6 s
t=7 s
t=8 s
t=9 s
pulse
Figure 5.5: Position of the peak of a pulse at different times (since we know the shape of thepulse does not change we can look at only one point on the pulse to keep track of its position,the peak for example). The pulse moves to the right as shown by the arrow.
Given the series of snapshots of a transverse pulse moving through a medium, de-picted in Figure 5.5, do the following:
• draw up a table of time, position and velocity,
• plot a position vs. time graph,
• plot a velocity vs. time graph.
Answer
Step 1 : Interpreting the figure
Figure 5.5 shows the motion of a pulse through a medium and a dot to indicate thesame position on the pulse. If we follow the dot, we can draw a graph of positionvs time for a pulse. At t = 0 s the dot is at 0cm. At t = 1 s the dot is 1 cm awayfrom its original postion. At t = 2 s the dot is 2 cm away from its original postion,and so on.
Step 2 : We can draw the following table:
time (s) 0 1 2 3 4 5 6 7 8 9position (cm)
velocity (cm.s−1)
Step 3 : A graph of position vs time is drawn as is shown in the figure.
93

5.4 CHAPTER 5. TRANSVERSE PULSES - GRADE 10
0 1 2 3 4 5 6 7 8 90
1
2
3
4
5
6
7
8
9
b
b
b
b
b
b
Time (s)
Po
sitio
n(c
m)
b
b
b
Step 4 : Similarly, a graph of velocity vs time is drawn and is shown in thefigure below.
0 1 2 3 4 5 6 7 8 90
0.5
1.0
1.5
Time (s)
Vel
oci
ty(c
m.s−
1)
b b b b b b b b b
Exercise: Travelling Pulse
1. A pulse is passed through a rope and the following pictures were obtained for each timeinterval:
94

CHAPTER 5. TRANSVERSE PULSES - GRADE 10 5.4
0 1 2 3 4 5 6 7
0
1
2
t=0 s
t=0.25 s
t=0.50 s
t=0.75 s
t=1.00 s
t=1.25 s
t=1.50 s
t=1.75 s
t=2.00 s
pulse
(cm)
(cm)
(a) Complete the following table for a particle in the medium:
time (s) 0,00 0,25 0,50 0,75 1,00 1,25 1,50 1,75 2,00position (mm)
velocity (mm.s−1)
(b) Draw a position vs. time graph for the motion of a particle in the medium.
(c) Draw a velocity vs. time graph for the motion of a particle in the medium.
(d) Draw a position vs. time graph for the motion of the pulse through the rope.
(e) Draw a velocity vs. time graph for the motion of the pulse through the rope.
95

5.5 CHAPTER 5. TRANSVERSE PULSES - GRADE 10
5.5 Transmission and Reflection of a Pulse at a Boundary
What happens when a pulse travelling in one medium finds that medium is joined to another?
Activity :: Investigation : Two ropesFind two different ropes and tie both ropes together. Hold the joined ropes
horizontally and create a pulse by flicking the rope up and down. What happens tothe pulse when it encounters the join?
When a pulse meets a boundary between two media, part of the pulse is reflected and part of itis transmitted. You will see that in the thin rope the pulse moves back (is reflected). The pulseis also passed on (transmitted) to the thick rope and it moves away from the boundary.
pulse approaches second medium
pulse at boundary of second medium
pulse reflected and transmitted at boundary
pulses move away from other
Figure 5.6: Reflection and transmission of a pulse at the boundary between two media.
When a pulse is transmitted from one medium to another, like from a thin rope to a thicker one,the pulse will change where it meets the boundary of the two mediums (for example where theropes are joined). When a pulse moves from a thin rope to a thicker one, the speed of the pulsewill decrease. The pulse will move slower and the pulse length will increase.
1 cm 2 cm
Figure 5.7: Reflection and transmission of a pulse at the boundary between two media.
96

CHAPTER 5. TRANSVERSE PULSES - GRADE 10 5.6
2 cm 1 cm
Figure 5.8: Reflection and transmission of a pulse at the boundary between two media.
When a pulse moves from a thick rope to a thinner one, the opposite happens. The pulse speedwill increase and the pulse length will decrease.
When the speed of the pulse increases, the pulse length will decrease. If the speed decreases,the pulse length will increase. The incident pulse is the one that arrives at the boundary. Thereflected pulse is the one that moves back, away from the boundary. The transmitted pulseis the one that moves into the new medium, away from the boundary.
Exercise: Pulses at a Boundary I
1. Fill in the blanks or select the correct answer: A pulse in a heavy rope istraveling towards the boundary with a thin piece of string.
(a) The reflected pulse in the heavy rope will/will not be inverted because.
(b) The speed of the transmitted pulse will be greater than/less than/thesame as the speed of the incident pulse.
(c) The speed of the reflected pulse will be greater than/less than/the sameas the speed of the incident pulse.
(d) The pulse length of the transmitted pulse will be greater than/less than/thesame as the pulse length of the incident pulse.
(e) The frequency of the transmitted pulse will be greater than/less than/thesame as the frequency of the incident pulse.
2. A pulse in a light string is traveling towards the boundary with a heavy rope.
(a) The reflected pulse in the light rope will/will not be inverted because.
(b) The speed of the transmitted pulse will be greater than/less than/thesame as the speed of the incident pulse.
(c) The speed of the reflected pulse will be greater than/less than/the sameas the speed of the incident pulse.
(d) The pulse length of the transmitted pulse will be greater than/less than/thesame as the pulse length of the incident pulse.
5.6 Reflection of a Pulse from Fixed and Free Ends
Let us now consider what happens to a pulse when it reaches the end of a medium. The mediumcan be fixed, like a rope tied to a wall, or it can be free, like a rope tied loosely to a pole.
5.6.1 Reflection of a Pulse from a Fixed End
97

5.6 CHAPTER 5. TRANSVERSE PULSES - GRADE 10
Activity :: Investigation : Reflection of a Pulse from a Fixed EndTie a rope to a wall or some other object that cannot move. Create a pulse in
the rope by flicking one end up and down. Observe what happens to the pulse whenit reaches the wall.
wall wallpulse at wall
wall
pulse reflected
Figure 5.9: Reflection of a pulse from a fixed end.
When the end of the medium is fixed, for example a rope tied to a wall, a pulse reflects fromthe fixed end, but the pulse is inverted (i.e. it is upside-down). This is shown in Figure 5.9.
5.6.2 Reflection of a Pulse from a Free End
Activity :: Investigation : Reflection of a Pulse from a Free EndTie a rope to a pole in such a way that the rope can move up and down the pole.
Create a pulse in the rope by flicking one end up and down. Observe what happensto the pulse when it reaches the pole.
When the end of the medium is free, for example a rope tied loosely to a pole, a pulse reflectsfrom the free end, but the pulse is not inverted. This is shown in Figure 5.10. We draw thefree end as a ring around the pole. The ring will move up and down the pole, while the pulse isreflected away from the pole.
pole polepulse at pole
polepulse reflected
Figure 5.10: Reflection of a pulse from a free end.
Important: The fixed and free ends that were discussed in this section are examples ofboundary conditions. You will see more of boundary conditions as you progress in thePhysics syllabus.
Exercise: Pulses at a Boundary II
98
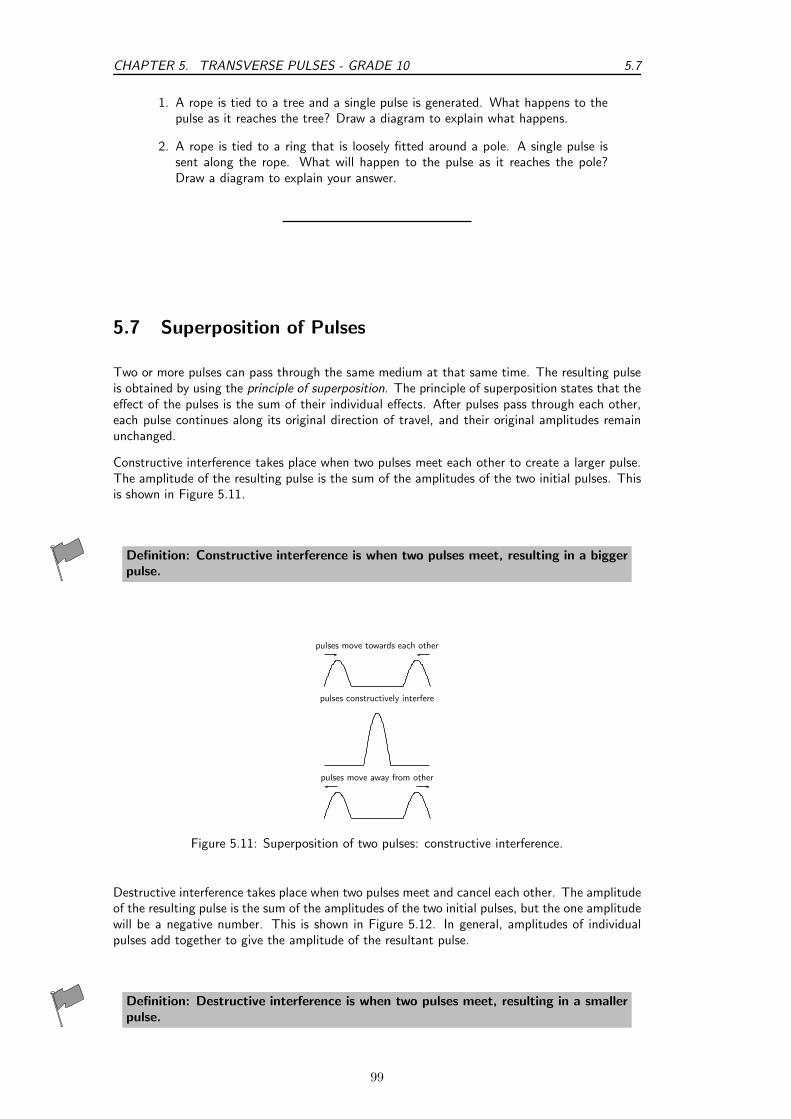
CHAPTER 5. TRANSVERSE PULSES - GRADE 10 5.7
1. A rope is tied to a tree and a single pulse is generated. What happens to thepulse as it reaches the tree? Draw a diagram to explain what happens.
2. A rope is tied to a ring that is loosely fitted around a pole. A single pulse issent along the rope. What will happen to the pulse as it reaches the pole?Draw a diagram to explain your answer.
5.7 Superposition of Pulses
Two or more pulses can pass through the same medium at that same time. The resulting pulseis obtained by using the principle of superposition. The principle of superposition states that theeffect of the pulses is the sum of their individual effects. After pulses pass through each other,each pulse continues along its original direction of travel, and their original amplitudes remainunchanged.
Constructive interference takes place when two pulses meet each other to create a larger pulse.The amplitude of the resulting pulse is the sum of the amplitudes of the two initial pulses. Thisis shown in Figure 5.11.
Definition: Constructive interference is when two pulses meet, resulting in a biggerpulse.
pulses move towards each other
pulses constructively interfere
pulses move away from other
Figure 5.11: Superposition of two pulses: constructive interference.
Destructive interference takes place when two pulses meet and cancel each other. The amplitudeof the resulting pulse is the sum of the amplitudes of the two initial pulses, but the one amplitudewill be a negative number. This is shown in Figure 5.12. In general, amplitudes of individualpulses add together to give the amplitude of the resultant pulse.
Definition: Destructive interference is when two pulses meet, resulting in a smallerpulse.
99

5.7 CHAPTER 5. TRANSVERSE PULSES - GRADE 10
pulses move towards each other
pulses destructively interfere
pulses move away from other
pulses move towards each other
pulses interfere
pulses move away from other
Figure 5.12: Superposition of two pulses. The left-hand series of images demonstrates destructiveinterference, since the pulses cancel each other. The right-hand series of images demonstrate apartial cancelation of two pulses, as their amplitudes are not the same in magnitude.
Worked Example 24: Superposition of Pulses
Question: The two pulses shown below approach each other at 1 m·s−1. Drawwhat the waveform would look like after 1 s, 2 s and 5 s.
0 1 2 3 4 5 6 7 80
1
2
amplit
ude
(m)
distance (m)
A B
AnswerStep 1 : After 1 sAfter 1 s, pulse A has moved 1 m to the right and pulse B has moved 1 m to theleft.
0 1 2 3 4 5 6 7 80
1
2
amplit
ude
(m)
distance (m)
A B
Step 2 : After 2 sAfter 1 s more, pulse A has moved 1 m to the right and pulse B has moved 1 m tothe left.
0 1 2 3 4 5 6 7 80
1
2
amplit
ude
(m)
distance (m)
A+B
Step 3 : After 5 sAfter 5 s more, pulse A has moved 5 m to the right and pulse B has moved 5 m to
100

CHAPTER 5. TRANSVERSE PULSES - GRADE 10 5.7
Important: The idea of superposition is one that occurs often in physics. You will seemuch, much more of superposition!
Exercise: Superposition of Pulses
1. For each of the following pulses, draw the resulting wave forms after 1 s, 2 s,3 s, 4 s and 5 s. Each pulse is travelling at 1 m·s−1. Each block represents1 m.
(a)
t=0 s
(b)
t=0 s
(c)
t=0 s
(d)
t=0 s
(e)
t=0 s
(f)
t=0 s
2. (a) What is superposition of waves?
(b) What is constructive interference? Use the letter “c” to indicate whereconstructive interference took place in each of your answers for question1. Only look at diagrams for t = 3 s.
(c) What is destructive interference? Use the letter “d” to indicate wheredestructive interference took place in each of your answers for question 1.Only look at diagrams for t = 2 s.
101

5.8 CHAPTER 5. TRANSVERSE PULSES - GRADE 10
5.8 Exercises - Transverse Pulses
1. A heavy rope is flicked upwards, creating a single pulse in the rope. Make a drawing ofthe rope and indicate the following in your drawing:
(a) The direction of motion of the pulse
(b) Amplitude
(c) Pulse length
(d) Position of rest
2. A pulse has a speed of 2,5m.s−1. How far will it have travelled in 6s?
3. A pulse covers a distance of 75cm in 2,5s. What is the speed of the pulse?
4. How long does it take a pulse to cover a distance of 200mm if its speed is 4m.s−1?
5. The following position-time graph for a pulse in a slinky spring is given. Draw an accuratesketch graph of the velocity of the pulse against time.
4
8
time (s)
position ∆x(m)
6. The following velocity-time graph for a particle in a medium is given. Draw an accuratesketch graph of the position of the particle vs. time.
5
4
time (s)
velocity v
(m.s−1)
3
2
7. Describe what happens to a pulse in a slinky spring when:
(a) the slinky spring is tied to a wall.
(b) the slinky spring is loose, i.e. not tied to a wall.
(Draw diagrams to explain your answers.)
8. The following diagrams each show two approaching pulses. Redraw the diagrams to showwhat type of interference takes place, and label the type of interference.
(a)1
3
(b)
3
2
102
CHAPTER 5. TRANSVERSE PULSES - GRADE 10 5.8
9. Two pulses, A and B, of identical frequency and amplitude are simultaneously generatedin two identical wires of equal mass and length. Wire A is, however, pulled tighter thanwire. Which pulse will arrive at the other end first, or will they both arrive at the sametime?
103

5.8 CHAPTER 5. TRANSVERSE PULSES - GRADE 10
104

Chapter 6
Transverse Waves - Grade 10
6.1 Introduction
Waves occur frequently in nature. The most obvious examples are waves in water, on a dam, inthe ocean, or in a bucket. We are most interested in the properties that waves have. All waveshave the same properties, so if we study waves in water, then we can transfer our knowledge topredict how other examples of waves will behave.
6.2 What is a transverse wave?
We have studied pulses in Chapter 5, and know that a pulse is a single disturbance that travelsthrough a medium. A wave is a periodic, continuous disturbance that consists of a train ofpulses.
Definition: WaveA wave is a periodic, continuous disturbance that consists of a train of pulses.
Definition: Transverse waveA transverse wave is a wave where the movement of the particles of the medium is perpen-dicular to the direction of propagation of the wave.
Activity :: Investigation : Transverse WavesTake a rope or slinky spring. Have two people hold the rope or spring stretched
out horizontally. Flick the one end of the rope up and down continuously to createa train of pulses.
Flick rope up and down
1. Describe what happens to the rope.
2. Draw a diagram of what the rope looks like while the pulses travel along it.
105
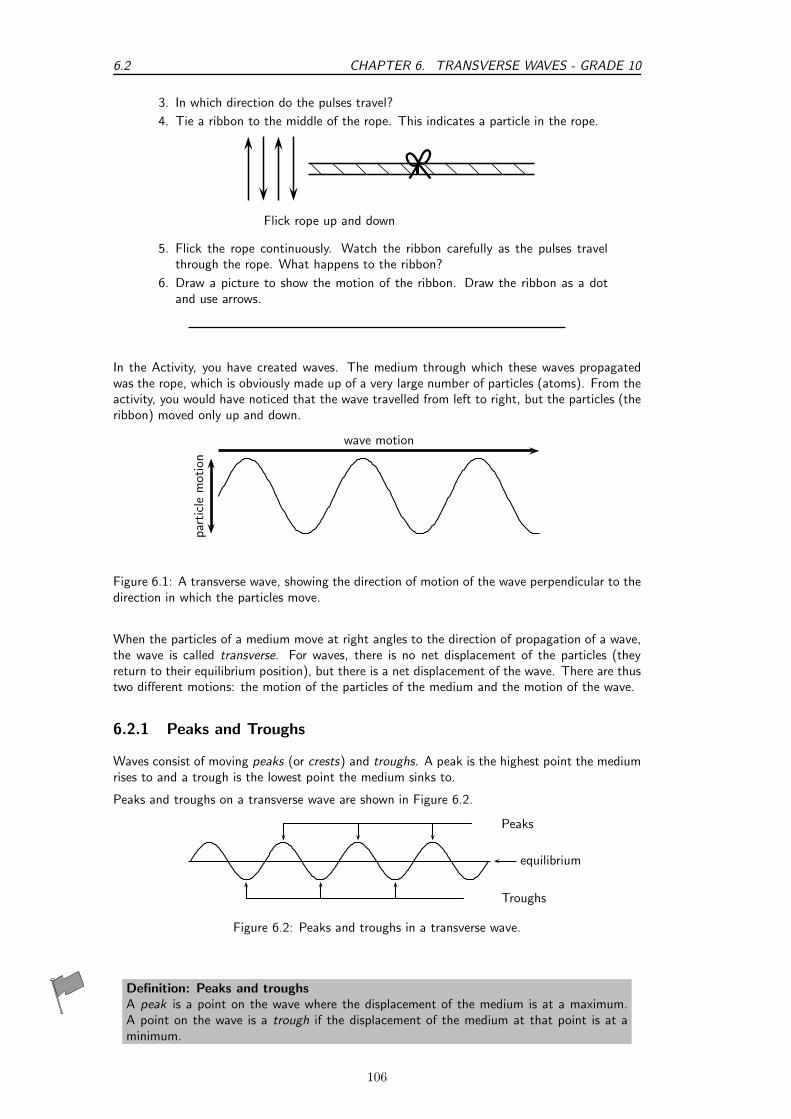
6.2 CHAPTER 6. TRANSVERSE WAVES - GRADE 10
3. In which direction do the pulses travel?
4. Tie a ribbon to the middle of the rope. This indicates a particle in the rope.
Flick rope up and down
5. Flick the rope continuously. Watch the ribbon carefully as the pulses travelthrough the rope. What happens to the ribbon?
6. Draw a picture to show the motion of the ribbon. Draw the ribbon as a dotand use arrows.
In the Activity, you have created waves. The medium through which these waves propagatedwas the rope, which is obviously made up of a very large number of particles (atoms). From theactivity, you would have noticed that the wave travelled from left to right, but the particles (theribbon) moved only up and down.
par
ticl
em
otion
wave motion
Figure 6.1: A transverse wave, showing the direction of motion of the wave perpendicular to thedirection in which the particles move.
When the particles of a medium move at right angles to the direction of propagation of a wave,the wave is called transverse. For waves, there is no net displacement of the particles (theyreturn to their equilibrium position), but there is a net displacement of the wave. There are thustwo different motions: the motion of the particles of the medium and the motion of the wave.
6.2.1 Peaks and Troughs
Waves consist of moving peaks (or crests) and troughs. A peak is the highest point the mediumrises to and a trough is the lowest point the medium sinks to.
Peaks and troughs on a transverse wave are shown in Figure 6.2.
equilibrium
Peaks
Troughs
Figure 6.2: Peaks and troughs in a transverse wave.
Definition: Peaks and troughsA peak is a point on the wave where the displacement of the medium is at a maximum.A point on the wave is a trough if the displacement of the medium at that point is at aminimum.
106

CHAPTER 6. TRANSVERSE WAVES - GRADE 10 6.2
6.2.2 Amplitude and Wavelength
There are a few properties that we saw with pulses that also apply to waves. These are amplitudeand wavelength (we called this pulse length).
Definition: AmplitudeThe amplitude is the maximum displacement of a particle from its equilibrium position.
Activity :: Investigation : Amplitude
equilibrium
a
b
c
d
e
f
equilibrium
Fill in the table below by measuring the distance between the equilibrium andeach peak and troughs in the wave above. Use your ruler to measure the distances.
Peak/Trough Measurement (cm)abcdef
1. What can you say about your results?
2. Are the distances between the equilibrium position and each peak equal?
3. Are the distances between the equilibrium position and each trough equal?
4. Is the distance between the equilibrium position and peak equal to the distancebetween equilibrium and trough?
As we have seen in the activity on amplitude, the distance between the peak and the equilibriumposition is equal to the distance between the trough and the equilibrium position. This distanceis known as the amplitude of the wave, and is the characteristic height of wave, above or belowthe equilibrium position. Normally the symbol A is used to represent the amplitude of a wave.The SI unit of amplitude is the metre (m).
Amplitude
Amplitude
2 x Amplitude
107

6.2 CHAPTER 6. TRANSVERSE WAVES - GRADE 10
Worked Example 25: Amplitude of Sea Waves
Question: If the peak of a wave measures 2m above the still water mark in theharbour, what is the amplitude of the wave?AnswerThe definition of the amplitude is the height that the water rises to above when itis still. This is exactly what we were told, so the amplitude is 2m.
Activity :: Investigation : Wavelength
a b
c d
equilibrium
Fill in the table below by measuring the distance between peaks and troughs inthe wave above.
Distance(cm)abcd
1. What can you say about your results?
2. Are the distances between peaks equal?
3. Are the distances between troughs equal?
4. Is the distance between peaks equal to the distance between troughs?
As we have seen in the activity on wavelength, the distance between two adjacent peaks is thesame no matter which two adjacent peaks you choose. There is a fixed distance between thepeaks. Similarly, we have seen that there is a fixed distance between the troughs, no matterwhich two troughs you look at. More importantly, the distance between two adjacent peaks isthe same as the distance between two adjacent troughs. This distance is call the wavelength ofthe wave.
The symbol for the wavelength is λ (the Greek letter lambda) and wavelength is measured inmetres (m).
λ
λ108

CHAPTER 6. TRANSVERSE WAVES - GRADE 10 6.2
Worked Example 26: Wavelength
Question: The total distance between 4 consecutive peaks of a transverse wave is6 m. What is the wavelength of the wave?AnswerStep 1 : Draw a rough sketch of the situation
6m
equilibrium
λ λ λ
Step 2 : Determine how to approach the problemFrom the sketch we see that 4 consecutive peaks is equivalent to 3 wavelengths.Step 3 : Solve the problemTherefore, the wavelength of the wave is:
3λ = 6 m
λ =6 m
3= 2 m
6.2.3 Points in Phase
Activity :: Investigation : Points in PhaseFill in the table by measuring the distance between the indicated points.
bA
bB
bCb
D
bE bF
bG
bHb
I
b
J
Points Distance (cm)
A to FB to GC to HD to IE to J
What do you find?
109
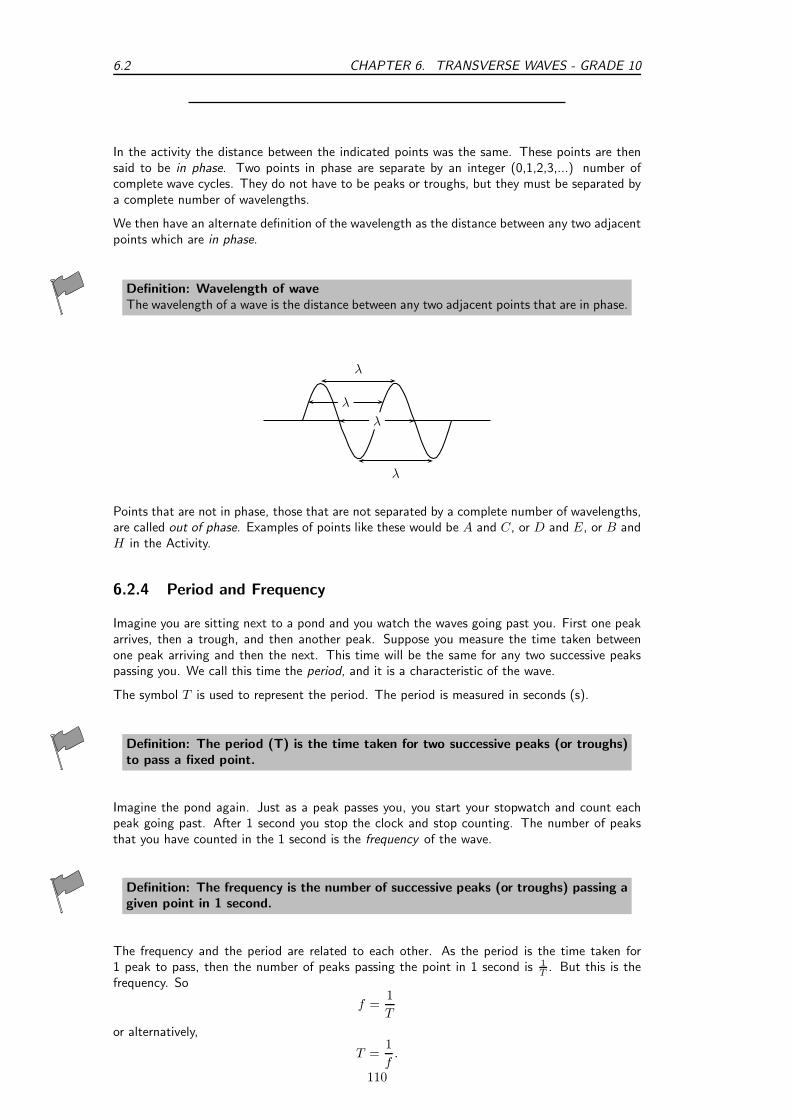
6.2 CHAPTER 6. TRANSVERSE WAVES - GRADE 10
In the activity the distance between the indicated points was the same. These points are thensaid to be in phase. Two points in phase are separate by an integer (0,1,2,3,...) number ofcomplete wave cycles. They do not have to be peaks or troughs, but they must be separated bya complete number of wavelengths.
We then have an alternate definition of the wavelength as the distance between any two adjacentpoints which are in phase.
Definition: Wavelength of waveThe wavelength of a wave is the distance between any two adjacent points that are in phase.
λ
λ
λ
λ
Points that are not in phase, those that are not separated by a complete number of wavelengths,are called out of phase. Examples of points like these would be A and C, or D and E, or B andH in the Activity.
6.2.4 Period and Frequency
Imagine you are sitting next to a pond and you watch the waves going past you. First one peakarrives, then a trough, and then another peak. Suppose you measure the time taken betweenone peak arriving and then the next. This time will be the same for any two successive peakspassing you. We call this time the period, and it is a characteristic of the wave.
The symbol T is used to represent the period. The period is measured in seconds (s).
Definition: The period (T) is the time taken for two successive peaks (or troughs)to pass a fixed point.
Imagine the pond again. Just as a peak passes you, you start your stopwatch and count eachpeak going past. After 1 second you stop the clock and stop counting. The number of peaksthat you have counted in the 1 second is the frequency of the wave.
Definition: The frequency is the number of successive peaks (or troughs) passing agiven point in 1 second.
The frequency and the period are related to each other. As the period is the time taken for1 peak to pass, then the number of peaks passing the point in 1 second is 1
T. But this is the
frequency. So
f =1
T
or alternatively,
T =1
f.
110
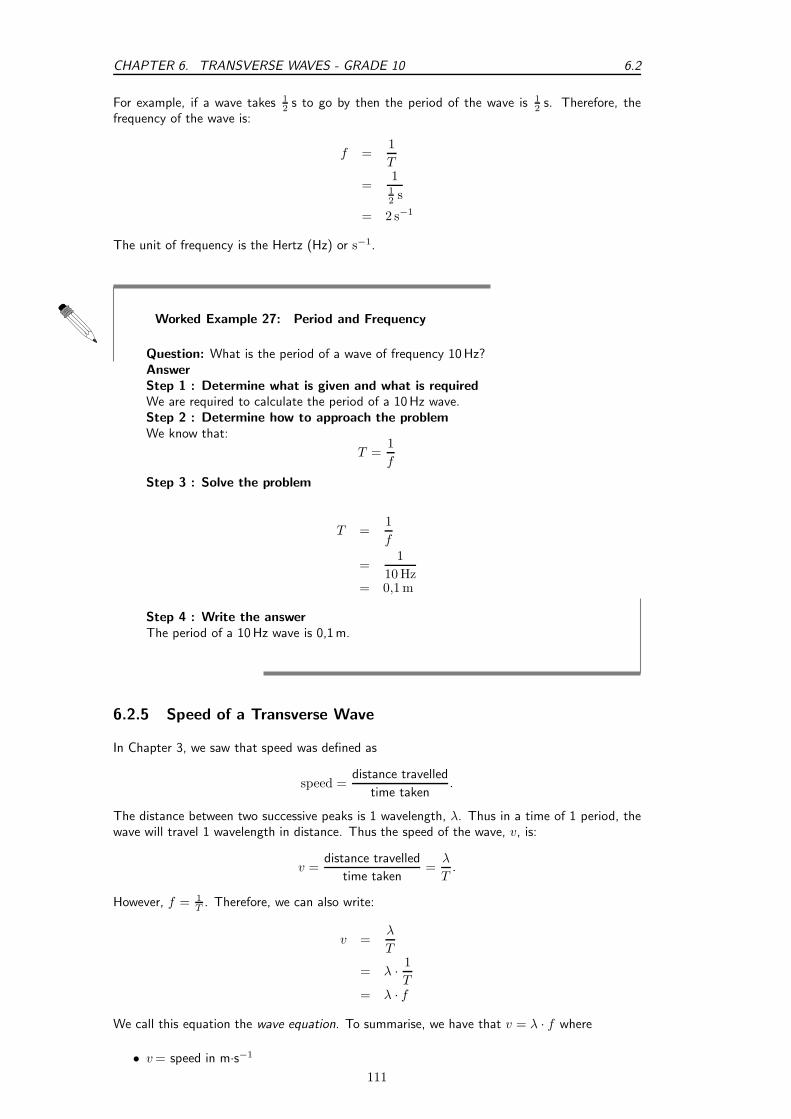
CHAPTER 6. TRANSVERSE WAVES - GRADE 10 6.2
For example, if a wave takes 12 s to go by then the period of the wave is 1
2 s. Therefore, thefrequency of the wave is:
f =1
T
=112 s
= 2 s−1
The unit of frequency is the Hertz (Hz) or s−1.
Worked Example 27: Period and Frequency
Question: What is the period of a wave of frequency 10Hz?AnswerStep 1 : Determine what is given and what is requiredWe are required to calculate the period of a 10Hz wave.Step 2 : Determine how to approach the problemWe know that:
T =1
f
Step 3 : Solve the problem
T =1
f
=1
10 Hz= 0,1 m
Step 4 : Write the answerThe period of a 10Hz wave is 0,1m.
6.2.5 Speed of a Transverse Wave
In Chapter 3, we saw that speed was defined as
speed =distance travelled
time taken.
The distance between two successive peaks is 1 wavelength, λ. Thus in a time of 1 period, thewave will travel 1 wavelength in distance. Thus the speed of the wave, v, is:
v =distance travelled
time taken=
λ
T.
However, f = 1T
. Therefore, we can also write:
v =λ
T
= λ ·1
T= λ · f
We call this equation the wave equation. To summarise, we have that v = λ · f where
• v = speed in m·s−1
111

6.2 CHAPTER 6. TRANSVERSE WAVES - GRADE 10
• λ= wavelength in m
• f = frequency in Hz
Worked Example 28: Speed of a Transverse Wave 1
Question: When a particular string is vibrated at a frequency of 10Hz, a transversewave of wavelength 0,25m is produced. Determine the speed of the wave as ittravels along the string.AnswerStep 1 : Determine what is given and what is required
• frequency of wave: f = 10Hz
• wavelength of wave: λ = 0,25m
We are required to calculate the speed of the wave as it travels along the string. Allquantities are in SI units.Step 2 : Determine how to approach the problemWe know that the speed of a wave is:
v = f · λ
and we are given all the necessary quantities.Step 3 : Substituting in the values
v = f · λ
= (10 Hz)(0,25 m)
= 2,5 m · s−1
Step 4 : Write the final answerThe wave travels at 2,5m·s−1 in the string.
Worked Example 29: Speed of a Transverse Wave 2
Question: A cork on the surface of a swimming pool bobs up and down once persecond on some ripples. The ripples have a wavelength of 20 cm. If the cork is 2mfrom the edge of the pool, how long does it take a ripple passing the cork to reachthe shore?AnswerStep 1 : Determine what is given and what is requiredWe are given:
• frequency of wave: f = 1Hz
• wavelength of wave: λ = 20 cm
• distance of leaf from edge of pool: d = 2m
We are required to determine the time it takes for a ripple to travel between the corkand the edge of the pool.The wavelength is not in SI units and should be converted.Step 2 : Determine how to approach the problemThe time taken for the ripple to reach the edge of the pool is obtained from:
t =d
v(from v =
d
t)
112

CHAPTER 6. TRANSVERSE WAVES - GRADE 10 6.2
We know thatv = f · λ
Therefore,
t =d
f · λ
Step 3 : Convert wavelength to SI units
20 cm = 0,2 m
Step 4 : Solve the problem
t =d
f · λ
=2 m
(1 Hz)(0,2 m)
= 10 s
Step 5 : Write the final answerA ripple passing the leaf will take 10 s to reach the edge of the pool.
Exercise: Waves
1. List one property that distinguishes waves from matter.
2. When the particles of a medium move perpendicular to the direction of thewave motion, the wave is called a . . . . . . . . . wave.
3. A transverse wave is moving downwards. In what direction do the particles inthe medium move?
4. Consider the diagram below and answer the questions that follow:
A
B
C D
(a) the wavelength of the wave is shown by letter . . . . . ..
(b) the amplitude of the wave is shown by letter . . . . . ..
5. Draw 2 wavelengths of the following transverse waves on the same graph paper.Label all important values.
(a) Wave 1: Amplitude = 1 cm, wavelength = 3 cm
(b) Wave 2: Peak to trough distance (vertical) = 3 cm, peak to peak distance(horizontal) = 5 cm
6. You are given the transverse wave below.
1 2 3 40
1
−1
Draw the following:
(a) A wave with twice the amplitude of the given wave.
(b) A wave with half the amplitude of the given wave.
113
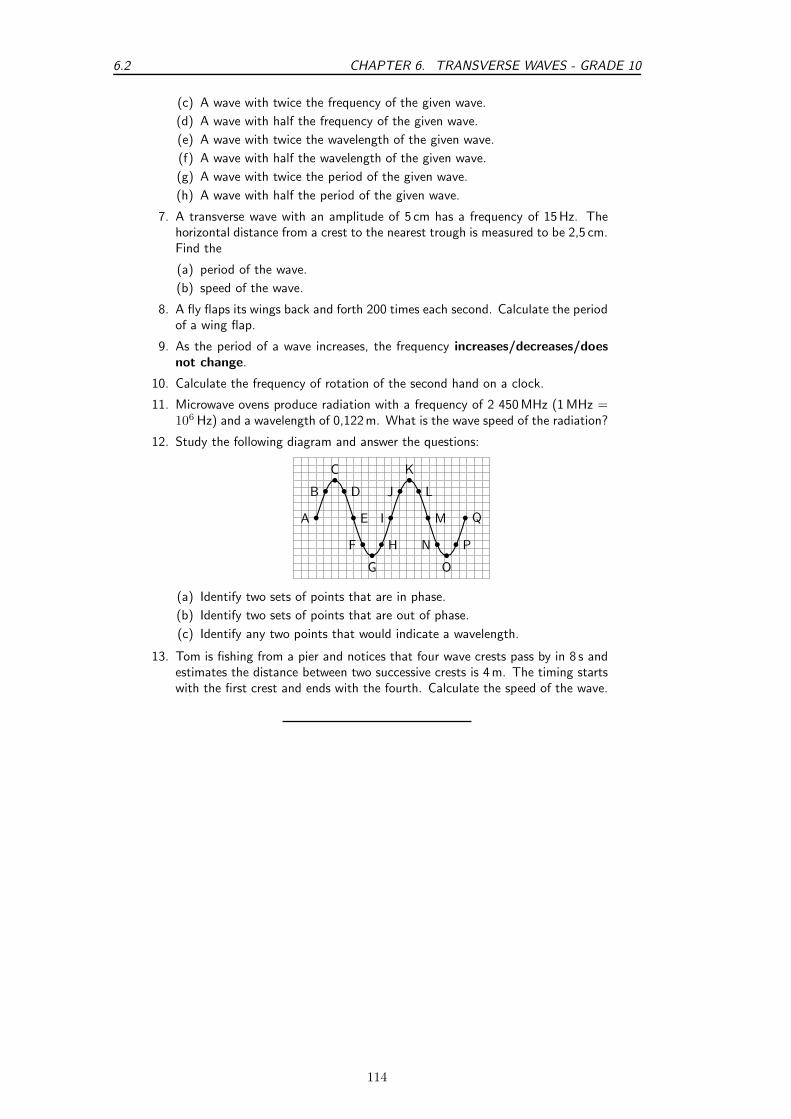
6.2 CHAPTER 6. TRANSVERSE WAVES - GRADE 10
(c) A wave with twice the frequency of the given wave.
(d) A wave with half the frequency of the given wave.
(e) A wave with twice the wavelength of the given wave.
(f) A wave with half the wavelength of the given wave.
(g) A wave with twice the period of the given wave.
(h) A wave with half the period of the given wave.
7. A transverse wave with an amplitude of 5 cm has a frequency of 15Hz. Thehorizontal distance from a crest to the nearest trough is measured to be 2,5 cm.Find the
(a) period of the wave.
(b) speed of the wave.
8. A fly flaps its wings back and forth 200 times each second. Calculate the periodof a wing flap.
9. As the period of a wave increases, the frequency increases/decreases/doesnot change.
10. Calculate the frequency of rotation of the second hand on a clock.
11. Microwave ovens produce radiation with a frequency of 2 450MHz (1 MHz =106 Hz) and a wavelength of 0,122m. What is the wave speed of the radiation?
12. Study the following diagram and answer the questions:
bA
bBb
C
bD
bE
bFb
G
bH
bI
bJb
K
bL
bM
bNb
O
bP
bQ
(a) Identify two sets of points that are in phase.
(b) Identify two sets of points that are out of phase.
(c) Identify any two points that would indicate a wavelength.
13. Tom is fishing from a pier and notices that four wave crests pass by in 8 s andestimates the distance between two successive crests is 4m. The timing startswith the first crest and ends with the fourth. Calculate the speed of the wave.
114

CHAPTER 6. TRANSVERSE WAVES - GRADE 10 6.3
6.3 Graphs of Particle Motion
In Chapter 5, we saw that when a pulse moves through a medium, there are two different motions:the motion of the particles of the medium and the motion of the pulse. These two motions areat right angles to each other when the pulse is transverse. Since a transverse wave is a series oftransverse pulses, the particle in the medium and the wave move in exactly the same way as forthe pulse.
When a transverse wave moves through the medium, the particles in the medium only move upand down. We can see this in the figure below, which shows the motion of a single particle as atransverse wave moves through the medium.
direction of motion of the wave
bt = 0 s
bt = 20 s
b
t = 40 s
b
t = 60 s
b
t = 80 s
b
t = 100 s
b
t = 120 s
b
t = 140 s
Important: A particle in the medium only moves up and down when a transverse wavemoves through the medium.
As in Chapter 3, we can draw a graph of the particles’ position as a function of time. For thewave shown in the above figure, we can draw the graph shown below.
b
b
b
bb b b
b
t
y
Graph of particle position as a function of time.
115

6.3 CHAPTER 6. TRANSVERSE WAVES - GRADE 10
The graph of the particle’s velocity as a function of time is obtained by taking the gradient ofthe position vs. time graph. The graph of velocity vs. time for the position vs. time graphabove, is shown in the graph below.
b bb
b
b
b
b
b
t
vy
Graph of particle velocity as a function of time.
The graph of the particle’s acceleration as a function of time is obtained by taking the gradientof the velocity vs. time graph. The graph of acceleration vs. time for the position vs. timegraph shown above, is shown below.
b
b
b
bb b b
b
t
ay
Graph of particle acceleration as a function of time.
As for motion in one dimension, these graphs can be used to describe the motion of the particle.This is illustrated in the worked examples below.
Worked Example 30: Graphs of particle motion 1
Question: The following graph shows the position of a particle of a wave as afunction of time.
y
tCA
B
D
b
b
E
1. Draw the corresponding velocity vs. time graph for the particle.
2. Draw the corresponding acceleration vs. time graph for the particle.
Answer
Step 1 : Determine what is given and what is required.
The y vs. t graph is given.The vy vs. t and ay vs. t graphs are required.
Step 2 : Draw the velocity vs. time graph
To find the velocity of the particle we need to find the gradient of the y vs. tgraph at each time.
116
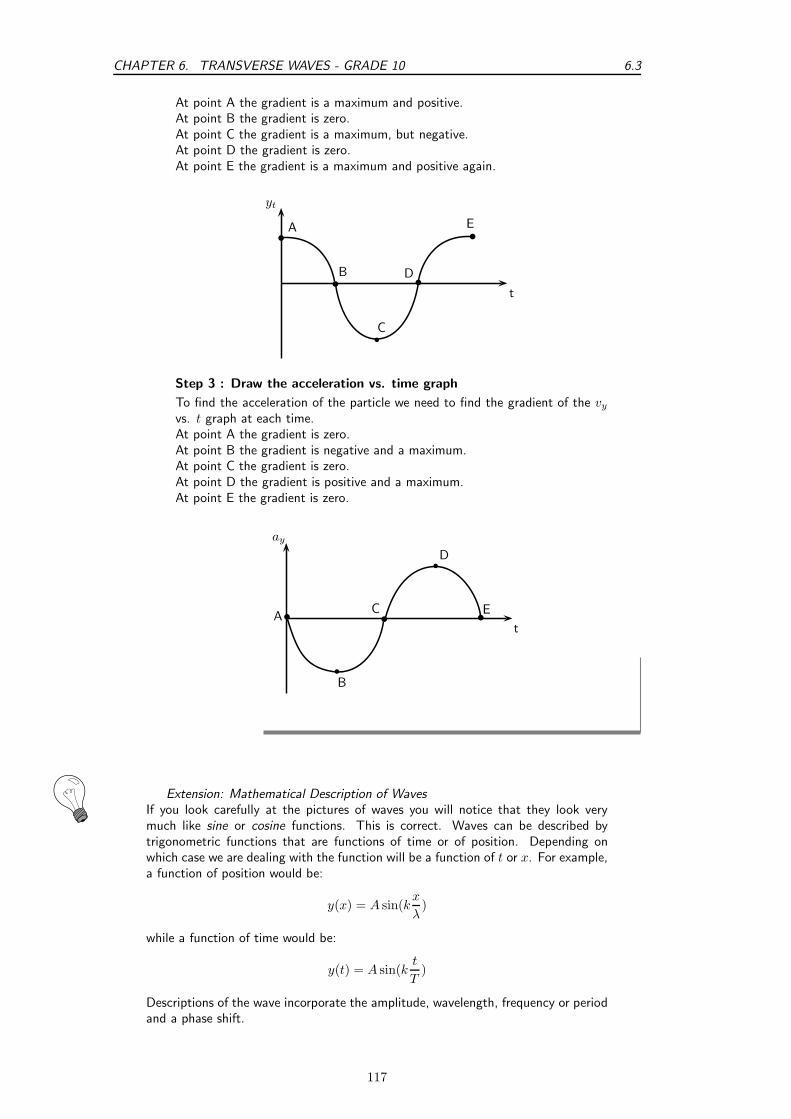
CHAPTER 6. TRANSVERSE WAVES - GRADE 10 6.3
At point A the gradient is a maximum and positive.At point B the gradient is zero.At point C the gradient is a maximum, but negative.At point D the gradient is zero.At point E the gradient is a maximum and positive again.
yt
t
C
A
B D
E
b
Step 3 : Draw the acceleration vs. time graph
To find the acceleration of the particle we need to find the gradient of the vy
vs. t graph at each time.At point A the gradient is zero.At point B the gradient is negative and a maximum.At point C the gradient is zero.At point D the gradient is positive and a maximum.At point E the gradient is zero.
ay
t
CA
B
D
E
b
b
Extension: Mathematical Description of Waves
If you look carefully at the pictures of waves you will notice that they look verymuch like sine or cosine functions. This is correct. Waves can be described bytrigonometric functions that are functions of time or of position. Depending onwhich case we are dealing with the function will be a function of t or x. For example,a function of position would be:
y(x) = A sin(kx
λ)
while a function of time would be:
y(t) = A sin(kt
T)
Descriptions of the wave incorporate the amplitude, wavelength, frequency or periodand a phase shift.
117
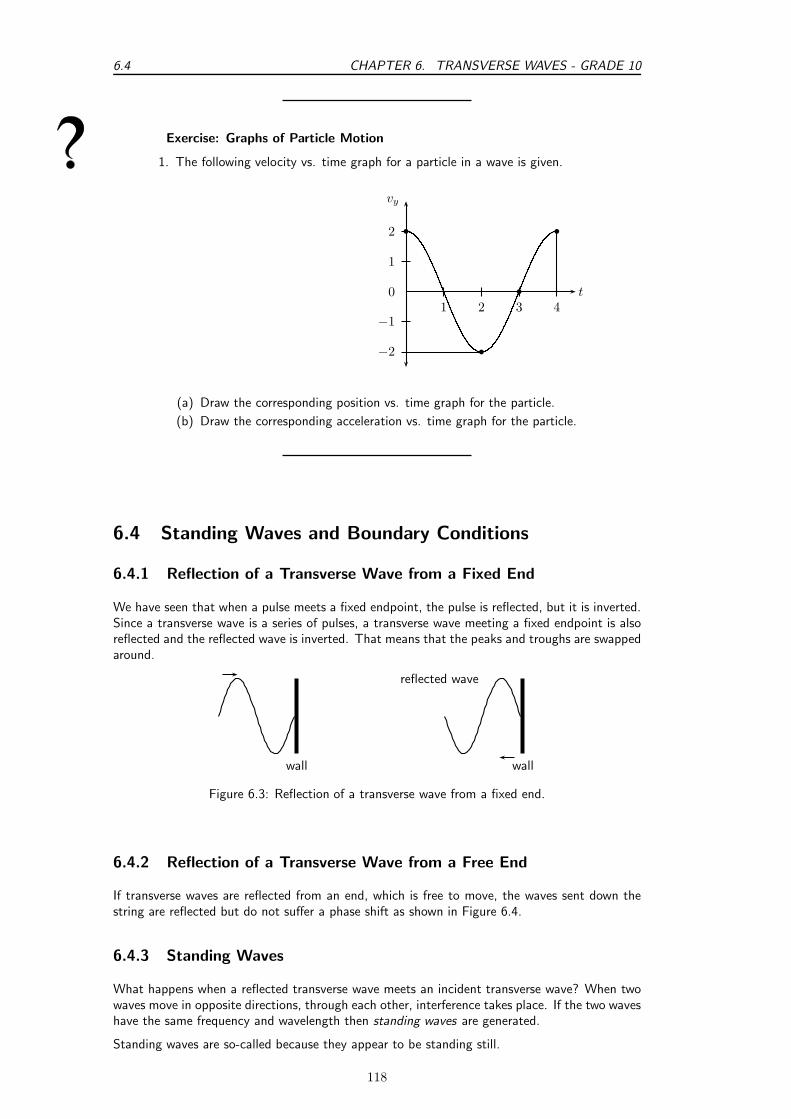
6.4 CHAPTER 6. TRANSVERSE WAVES - GRADE 10
Exercise: Graphs of Particle Motion
1. The following velocity vs. time graph for a particle in a wave is given.
1 2 3 40
1
2
−1
−2 b
b
b
b
vy
t
(a) Draw the corresponding position vs. time graph for the particle.
(b) Draw the corresponding acceleration vs. time graph for the particle.
6.4 Standing Waves and Boundary Conditions
6.4.1 Reflection of a Transverse Wave from a Fixed End
We have seen that when a pulse meets a fixed endpoint, the pulse is reflected, but it is inverted.Since a transverse wave is a series of pulses, a transverse wave meeting a fixed endpoint is alsoreflected and the reflected wave is inverted. That means that the peaks and troughs are swappedaround.
wall wall
reflected wave
Figure 6.3: Reflection of a transverse wave from a fixed end.
6.4.2 Reflection of a Transverse Wave from a Free End
If transverse waves are reflected from an end, which is free to move, the waves sent down thestring are reflected but do not suffer a phase shift as shown in Figure 6.4.
6.4.3 Standing Waves
What happens when a reflected transverse wave meets an incident transverse wave? When twowaves move in opposite directions, through each other, interference takes place. If the two waveshave the same frequency and wavelength then standing waves are generated.
Standing waves are so-called because they appear to be standing still.
118

CHAPTER 6. TRANSVERSE WAVES - GRADE 10 6.4
pole polereflected wave
Figure 6.4: Reflection of a transverse wave from a free end.
Activity :: Investigation : Creating Standing Waves
Tie a rope to a fixed object such that the tied end does not move. Continuouslymove the free end up and down to generate firstly transverse waves and later standingwaves.
We can now look closely how standing waves are formed. Figure 6.5 shows a reflected wavemeeting an incident wave.
Figure 6.5: A reflected wave (solid line) approaches the incident wave (dashed line).
When they touch, both waves have an amplitude of zero:
Figure 6.6: A reflected wave (solid line) meets the incident wave (dashed line).
If we wait for a short time the ends of the two waves move past each other and the wavesoverlap. To find the resultant wave, we add the two together.
Figure 6.7: A reflected wave (solid line) overlaps slightly with the incident wave (dashed line).
In this picture, we show the two waves as dotted lines and the sum of the two in the overlapregion is shown as a solid line:
119

6.4 CHAPTER 6. TRANSVERSE WAVES - GRADE 10
The important thing to note in this case is that there are some points where the two wavesalways destructively interfere to zero. If we let the two waves move a little further we get thepicture below:
Again we have to add the two waves together in the overlap region to see what the sum of thewaves looks like.
In this case the two waves have moved half a cycle past each other but because they are out ofphase they cancel out completely.
When the waves have moved past each other so that they are overlapping for a large regionthe situation looks like a wave oscillating in place. The following sequence of diagrams showwhat the resulting wave will look like. To make it clearer, the arrows at the top of the pictureshow peaks where maximum positive constructive interference is taking place. The arrows atthe bottom of the picture show places where maximum negative interference is taking place.
As time goes by the peaks become smaller and the troughs become shallower but they do notmove.
For an instant the entire region will look completely flat.
The various points continue their motion in the same manner.
120

CHAPTER 6. TRANSVERSE WAVES - GRADE 10 6.4
Eventually the picture looks like the complete reflection through the x-axis of what we startedwith:
Then all the points begin to move back. Each point on the line is oscillating up and down witha different amplitude.
If we look at the overall result, we get a standing wave.
Figure 6.8: A standing wave
If we superimpose the two cases where the peaks were at a maximum and the case where thesame waves were at a minimum we can see the lines that the points oscillate between. We callthis the envelope of the standing wave as it contains all the oscillations of the individual points.To make the concept of the envelope clearer let us draw arrows describing the motion of pointsalong the line.
Every point in the medium containing a standing wave oscillates up and down and the amplitudeof the oscillations depends on the location of the point. It is convenient to draw the envelopefor the oscillations to describe the motion. We cannot draw the up and down arrows for everysingle point!
Interesting
Fact
teresting
FactStanding waves can be a problem in for example indoor concerts where thedimensions of the concert venue coincide with particular wavelengths. Standingwaves can appear as ‘feedback’, which would occur if the standing wave waspicked up by the microphones on stage and amplified.
121
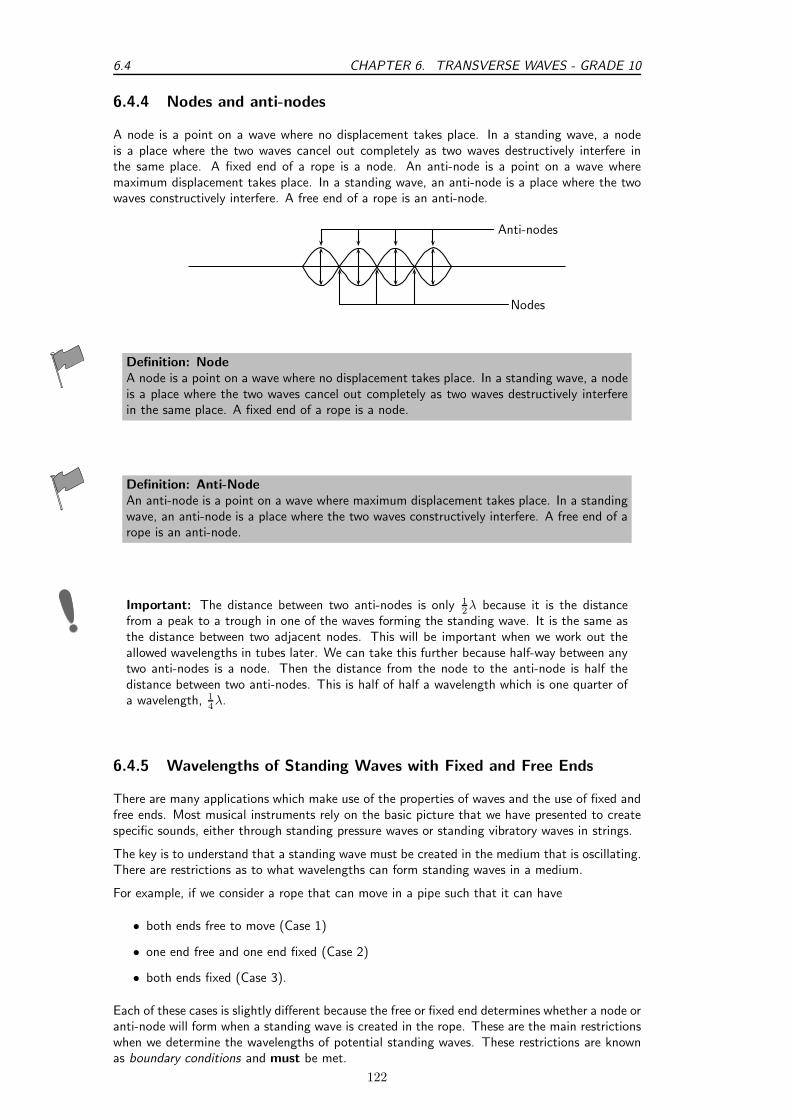
6.4 CHAPTER 6. TRANSVERSE WAVES - GRADE 10
6.4.4 Nodes and anti-nodes
A node is a point on a wave where no displacement takes place. In a standing wave, a nodeis a place where the two waves cancel out completely as two waves destructively interfere inthe same place. A fixed end of a rope is a node. An anti-node is a point on a wave wheremaximum displacement takes place. In a standing wave, an anti-node is a place where the twowaves constructively interfere. A free end of a rope is an anti-node.
Anti-nodes
Nodes
Definition: NodeA node is a point on a wave where no displacement takes place. In a standing wave, a nodeis a place where the two waves cancel out completely as two waves destructively interferein the same place. A fixed end of a rope is a node.
Definition: Anti-NodeAn anti-node is a point on a wave where maximum displacement takes place. In a standingwave, an anti-node is a place where the two waves constructively interfere. A free end of arope is an anti-node.
Important: The distance between two anti-nodes is only 12λ because it is the distance
from a peak to a trough in one of the waves forming the standing wave. It is the same asthe distance between two adjacent nodes. This will be important when we work out theallowed wavelengths in tubes later. We can take this further because half-way between anytwo anti-nodes is a node. Then the distance from the node to the anti-node is half thedistance between two anti-nodes. This is half of half a wavelength which is one quarter ofa wavelength, 1
4λ.
6.4.5 Wavelengths of Standing Waves with Fixed and Free Ends
There are many applications which make use of the properties of waves and the use of fixed andfree ends. Most musical instruments rely on the basic picture that we have presented to createspecific sounds, either through standing pressure waves or standing vibratory waves in strings.
The key is to understand that a standing wave must be created in the medium that is oscillating.There are restrictions as to what wavelengths can form standing waves in a medium.
For example, if we consider a rope that can move in a pipe such that it can have
• both ends free to move (Case 1)
• one end free and one end fixed (Case 2)
• both ends fixed (Case 3).
Each of these cases is slightly different because the free or fixed end determines whether a node oranti-node will form when a standing wave is created in the rope. These are the main restrictionswhen we determine the wavelengths of potential standing waves. These restrictions are knownas boundary conditions and must be met.
122
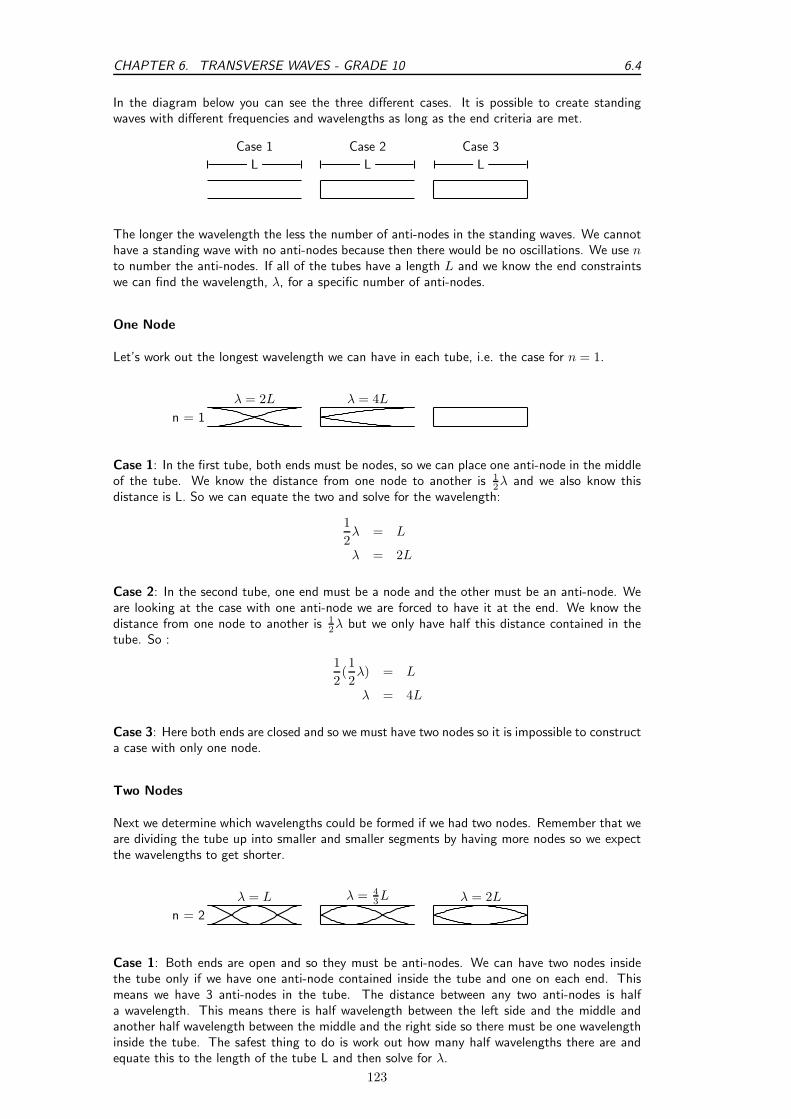
CHAPTER 6. TRANSVERSE WAVES - GRADE 10 6.4
In the diagram below you can see the three different cases. It is possible to create standingwaves with different frequencies and wavelengths as long as the end criteria are met.
Case 1
L
Case 2
L
Case 3
L
The longer the wavelength the less the number of anti-nodes in the standing waves. We cannothave a standing wave with no anti-nodes because then there would be no oscillations. We use nto number the anti-nodes. If all of the tubes have a length L and we know the end constraintswe can find the wavelength, λ, for a specific number of anti-nodes.
One Node
Let’s work out the longest wavelength we can have in each tube, i.e. the case for n = 1.
n = 1
λ = 2L λ = 4L
Case 1: In the first tube, both ends must be nodes, so we can place one anti-node in the middleof the tube. We know the distance from one node to another is 1
2λ and we also know thisdistance is L. So we can equate the two and solve for the wavelength:
1
2λ = L
λ = 2L
Case 2: In the second tube, one end must be a node and the other must be an anti-node. Weare looking at the case with one anti-node we are forced to have it at the end. We know thedistance from one node to another is 1
2λ but we only have half this distance contained in thetube. So :
1
2(1
2λ) = L
λ = 4L
Case 3: Here both ends are closed and so we must have two nodes so it is impossible to constructa case with only one node.
Two Nodes
Next we determine which wavelengths could be formed if we had two nodes. Remember that weare dividing the tube up into smaller and smaller segments by having more nodes so we expectthe wavelengths to get shorter.
n = 2
λ = L λ = 43L λ = 2L
Case 1: Both ends are open and so they must be anti-nodes. We can have two nodes insidethe tube only if we have one anti-node contained inside the tube and one on each end. Thismeans we have 3 anti-nodes in the tube. The distance between any two anti-nodes is halfa wavelength. This means there is half wavelength between the left side and the middle andanother half wavelength between the middle and the right side so there must be one wavelengthinside the tube. The safest thing to do is work out how many half wavelengths there are andequate this to the length of the tube L and then solve for λ.
123

6.4 CHAPTER 6. TRANSVERSE WAVES - GRADE 10
2(1
2λ) = L
λ = L
Case 2: We want to have two nodes inside the tube. The left end must be a node and the rightend must be an anti-node. We can have one node inside the tube as drawn above. Again we cancount the number of distances between adjacent nodes or anti-nodes. If we start from the leftend we have one half wavelength between the end and the node inside the tube. The distancefrom the node inside the tube to the right end which is an anti-node is half of the distance toanother node. So it is half of half a wavelength. Together these add up to the length of thetube:
1
2λ +
1
2(1
2λ) = L
2
4λ +
1
4λ = L
3
4λ = L
λ =4
3L
Case 3: In this case both ends have to be nodes. This means that the length of the tube is onehalf wavelength: So we can equate the two and solve for the wavelength:
1
2λ = L
λ = 2L
Important: If you ever calculate a longer wavelength for more nodes you have made amistake. Remember to check if your answers make sense!
Three Nodes
To see the complete pattern for all cases we need to check what the next step for case 3 is whenwe have an additional node. Below is the diagram for the case where n = 3.
n = 3
λ = 23L λ = 4
5L λ = L
Case 1: Both ends are open and so they must be anti-nodes. We can have three nodes insidethe tube only if we have two anti-nodes contained inside the tube and one on each end. Thismeans we have 4 anti-nodes in the tube. The distance between any two anti-nodes is half awavelength. This means there is half wavelength between every adjacent pair of anti-nodes.We count how many gaps there are between adjacent anti-nodes to determine how many halfwavelengths there are and equate this to the length of the tube L and then solve for λ.
3(1
2λ) = L
λ =2
3L
Case 2: We want to have three nodes inside the tube. The left end must be a node and theright end must be an anti-node, so there will be two nodes between the ends of the tube. Again
124

CHAPTER 6. TRANSVERSE WAVES - GRADE 10 6.4
we can count the number of distances between adjacent nodes or anti-nodes, together these addup to the length of the tube. Remember that the distance between the node and an adjacentanti-node is only half the distance between adjacent nodes. So starting from the left end wecount 3 nodes, so 2 half wavelength intervals and then only a node to anti-node distance:
2(1
2λ) +
1
2(1
2λ) = L
λ +1
4λ = L
5
4λ = L
λ =4
5L
Case 3: In this case both ends have to be nodes. With one node in between there are twosets of adjacent nodes. This means that the length of the tube consists of two half wavelengthsections:
2(1
2λ) = L
λ = L
6.4.6 Superposition and Interference
If two waves meet interesting things can happen. Waves are basically collective motion ofparticles. So when two waves meet they both try to impose their collective motion on theparticles. This can have quite different results.
If two identical (same wavelength, amplitude and frequency) waves are both trying to form apeak then they are able to achieve the sum of their efforts. The resulting motion will be a peakwhich has a height which is the sum of the heights of the two waves. If two waves are bothtrying to form a trough in the same place then a deeper trough is formed, the depth of which isthe sum of the depths of the two waves. Now in this case, the two waves have been trying todo the same thing, and so add together constructively. This is called constructive interference.
A=0,5m
+
B=1,0m
=
A+B=1,5m
If one wave is trying to form a peak and the other is trying to form a trough, then they arecompeting to do different things. In this case, they can cancel out. The amplitude of theresulting wave will depend on the amplitudes of the two waves that are interfering. If the depthof the trough is the same as the height of the peak nothing will happen. If the height of thepeak is bigger than the depth of the trough, a smaller peak will appear. And if the trough isdeeper then a less deep trough will appear. This is destructive interference.
125

6.4 CHAPTER 6. TRANSVERSE WAVES - GRADE 10
A=0,5m
+
B=1,0m
=B-A=0,5m
Exercise: Superposition and Interference
1. For each labelled point, indicate whether constructive or destructive interferencetakes place at that point.
A B C D E F G H I
Position Constructive/DestructiveABCDEFGHI
2. A ride at the local amusement park is called ”Standing on Waves”. Whichposition (a node or an antinode) on the ride would give the greatest thrill?
3. How many nodes and how many anti-nodes appear in the standing wave below?
4. For a standing wave on a string, you are given three statements:
A you can have any λ and any f as long as the relationship, v = λ · f issatisfied.
B only certain wavelengths and frequencies are allowed
C the wave velocity is only dependent on the medium
Which of the statements are true:
(a) A and C only
(b) B and C only
(c) A, B, and C
(d) none of the above
5. Consider the diagram below of a standing wave on a string 9 m long that istied at both ends. The wave velocity in the string is 16m·s−1. What is thewavelength?
126
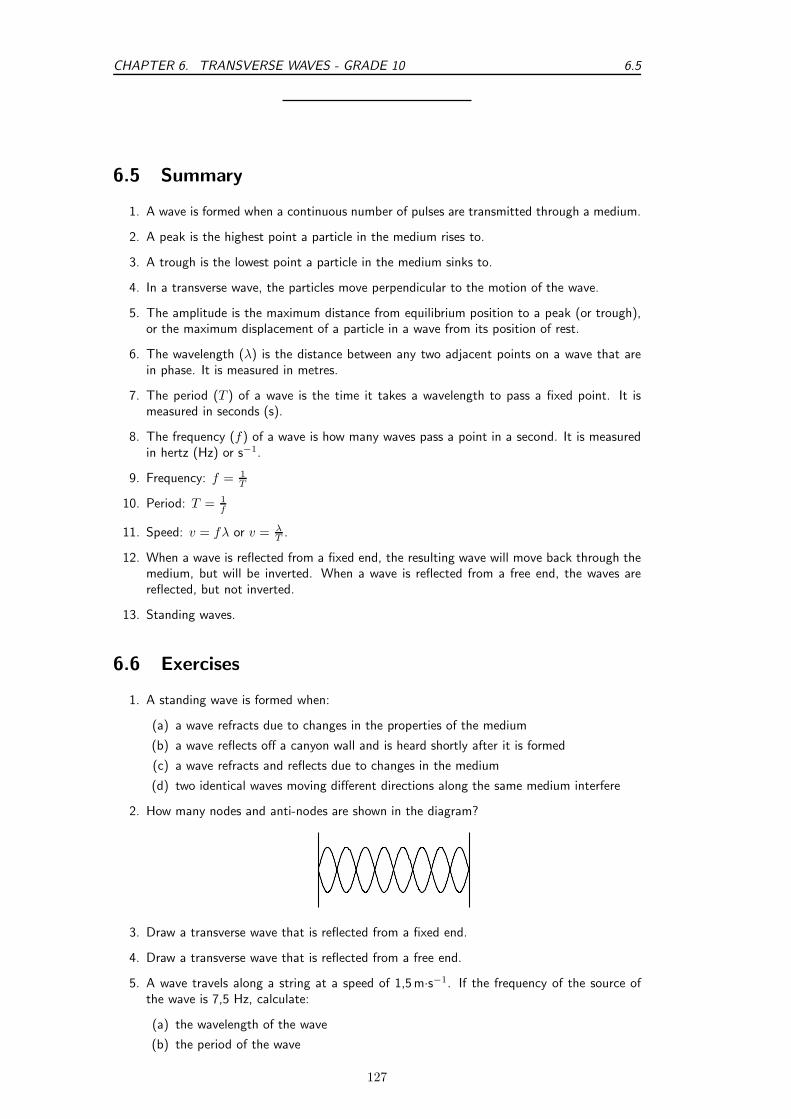
CHAPTER 6. TRANSVERSE WAVES - GRADE 10 6.5
6.5 Summary
1. A wave is formed when a continuous number of pulses are transmitted through a medium.
2. A peak is the highest point a particle in the medium rises to.
3. A trough is the lowest point a particle in the medium sinks to.
4. In a transverse wave, the particles move perpendicular to the motion of the wave.
5. The amplitude is the maximum distance from equilibrium position to a peak (or trough),or the maximum displacement of a particle in a wave from its position of rest.
6. The wavelength (λ) is the distance between any two adjacent points on a wave that arein phase. It is measured in metres.
7. The period (T ) of a wave is the time it takes a wavelength to pass a fixed point. It ismeasured in seconds (s).
8. The frequency (f) of a wave is how many waves pass a point in a second. It is measuredin hertz (Hz) or s−1.
9. Frequency: f = 1T
10. Period: T = 1f
11. Speed: v = fλ or v = λT
.
12. When a wave is reflected from a fixed end, the resulting wave will move back through themedium, but will be inverted. When a wave is reflected from a free end, the waves arereflected, but not inverted.
13. Standing waves.
6.6 Exercises
1. A standing wave is formed when:
(a) a wave refracts due to changes in the properties of the medium
(b) a wave reflects off a canyon wall and is heard shortly after it is formed
(c) a wave refracts and reflects due to changes in the medium
(d) two identical waves moving different directions along the same medium interfere
2. How many nodes and anti-nodes are shown in the diagram?
3. Draw a transverse wave that is reflected from a fixed end.
4. Draw a transverse wave that is reflected from a free end.
5. A wave travels along a string at a speed of 1,5m·s−1. If the frequency of the source ofthe wave is 7,5 Hz, calculate:
(a) the wavelength of the wave
(b) the period of the wave
127

6.6 CHAPTER 6. TRANSVERSE WAVES - GRADE 10
128

Chapter 7
Geometrical Optics - Grade 10
7.1 Introduction
You are indoors on a sunny day. A beam of sunlight through a window lights up a section ofthe floor. How would you draw this sunbeam? You might draw a series of parallel lines showingthe path of the sunlight from the window to the floor. This is not exactly accurate – no matterhow hard you look, you will not find unique lines of light in the sunbeam! However, this is agood way to draw light. It is also a good way to model light geometrically, as we will see in thischapter.
We will call these narrow, imaginary lines of light light rays. Since light is an electromagneticwave, you could think of a light ray as the path of a point on the crest of a wave. Or, you couldthink of a light ray as the path taken by a miniscule particle that carries light. We will alwaysdraw them the same way: as straight lines between objects, images, and optical devices.
We can use light rays to model mirrors, lenses, telescopes, microscopes, and prisms. The studyof how light interacts with materials is optics. When dealing with light rays, we are usuallyinterested in the shape of a material and the angles at which light rays hit it. From these angles,we can work out, for example, the distance between an object and its reflection. We thereforerefer to this kind of optics as geometrical optics.
7.2 Light Rays
In physics we use the idea of a light ray to indicate the direction that light travels. Light raysare lines with arrows and are used to show the path that light travels. In Figure 7.1, the lightrays from the object enters the eye and the eye sees the object.
The most important thing to remember is that we can only see an object when light from theobject enters our eyes. The object must be a source of light (for example a light bulb) or else itmust reflect light from a source (for example the moon), and the reflected light enters our eyes.
Important: We cannot see an object unless light from that object enters our eyes.
Definition: Light rayLight rays are straight lines with arrows to show the path of light.
Important: Light rays are not real. They are merely used to show the path that lighttravels.
129

7.2 CHAPTER 7. GEOMETRICAL OPTICS - GRADE 10
Figure 7.1: We can only see an object when light from that object enters our eyes. We drawlight as lines with arrows to show the direction the light travels. When the light travels from theobject to the eye, the eye can see the object.
Activity :: Investigation : Light travels in straight linesApparatus:You will need a candle, matches and three sheets of paper.Method:
1. Make a small hole in the middle of each of the three sheets of paper.
2. Light the candle.
3. Look at the burning candle through the hole in the first sheet of paper.
4. Place the second sheet of paper between you and the candle so that you canstill see the candle through the holes.
5. Now do the same with the third sheet so that you can still see the candle. Thesheets of paper must not touch each other.
Figure 7.2: Light travels in straight lines
6. What do you notice about the holes in the paper?
Conclusions:In the investigation you will notice that the holes in the paper need to be in a straightline. This shows that light travels in a straight line. We cannot see around corners.This also proves that light does not bend around a corner, but travels straight.
Activity :: Investigation : Light travels in straight linesOn a sunny day, stand outside and look at something in the distance, for example
a tree, a flower or a car. From what we have learnt, we can see the tree, flower orcar because light from the object is entering our eye. Now take a sheet of paper andhold it about 20 cm in front of your face. Can you still see the tree, flower or car?Why not?
130

CHAPTER 7. GEOMETRICAL OPTICS - GRADE 10 7.2
Figure 7.3 shows that a sheet of paper in front of your eye prevents light rays from reaching youreye.
sheet of paper
Figure 7.3: The sheet of paper prevents the light rays from reaching the eye, and the eye cannotsee the object.
131

7.3 CHAPTER 7. GEOMETRICAL OPTICS - GRADE 10
7.2.1 Shadows
Objects cast shadows when light shines on them. This is more evidence that light travels instraight lines. The picture below shows how shadows are formed.
7.2.2 Ray Diagrams
A ray diagram is a drawing that shows the path of light rays. Light rays are drawn using straightlines and arrow heads. The figure below shows some examples of ray diagrams.
b b
mirror
Exercise: Light Rays
1. Are light rays real? Explain.
2. Give evidence to support the statement: “Light travels in straight lines”. Drawa ray diagram to prove this.
3. You are looking at a burning candle. Draw the path of light that enables youto see that candle.
7.3 Reflection
When you smile into a mirror, you see your own face smiling back at you. This is caused by thereflection of light rays on the mirror. Reflection occurs when a light ray bounces off a surface.
132

CHAPTER 7. GEOMETRICAL OPTICS - GRADE 10 7.3
7.3.1 Terminology
In Chapters 5 and 6 we saw that when a pulse or wave strikes a surface it is reflected. This meansthat waves bounce off things. Sound waves bounce off walls, light waves bounce off mirrors,radar waves bounce off aeroplanes and it can explain how bats can fly at night and avoid thingsas thin as telephone wires. The phenomenon of reflection is a very important and useful one.
We will use the following terminology. The incoming light ray is called the incident ray. Thelight ray moving away from the surface is the reflected ray. The most important characteristicof these rays is their angles in relation to the reflecting surface. These angles are measuredwith respect to the normal of the surface. The normal is an imaginary line perpendicular tothe surface. The angle of incidence, θi is measured between the incident ray and the surfacenormal. The angle of reflection, θr is measured between the reflected ray and the surfacenormal. This is shown in Figure 7.4.
When a ray of light is reflected, the reflected ray lies in the same plane as the incident ray andthe normal. This plane is called the plane of incidence and is shown in Figure 7.5.
incidentrefle
ctedray ray
surface
nor
mal
θ i θ r
Figure 7.4: The angles of incidence and reflection are measured with respect to the surfacenormal.
Normal
Plane of incidence
Surface
θi θr
Figure 7.5: The plane of incidence is the plane including the incident ray, reflected ray, and thesurface normal.
7.3.2 Law of Reflection
The Law of Reflection states that the angles of incidence and reflection are always equal andthat the reflected ray always lies in the plane of incidence.
133
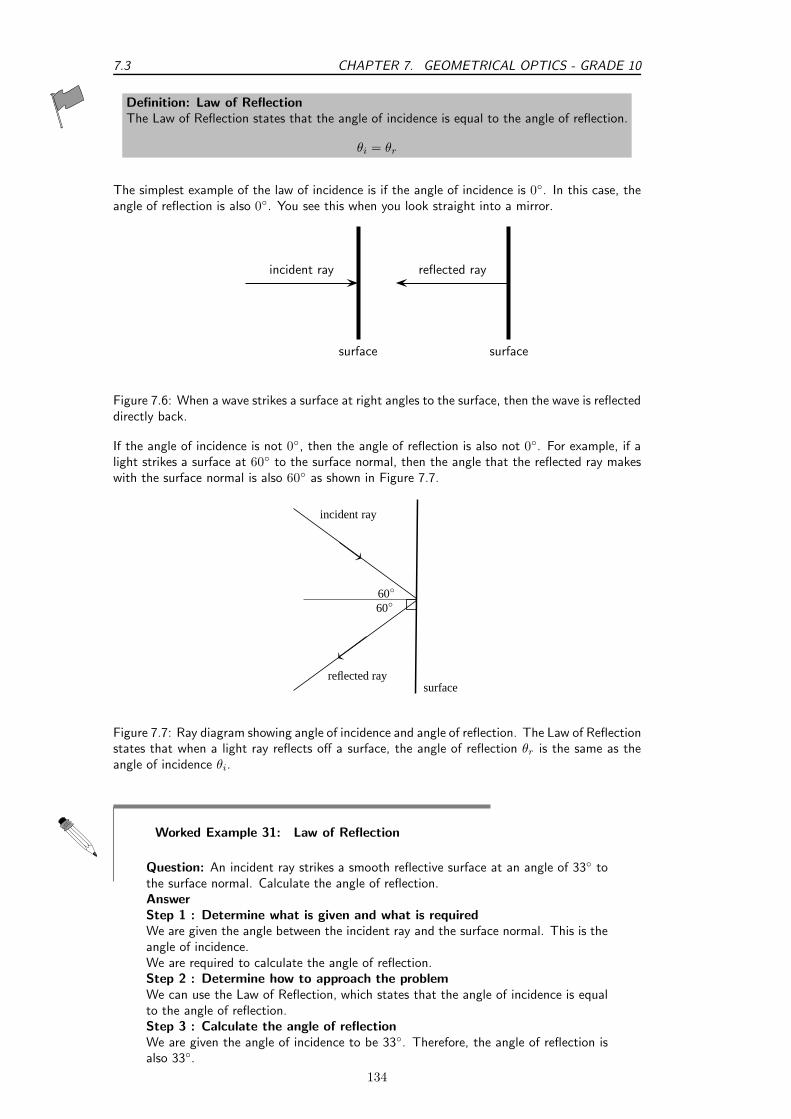
7.3 CHAPTER 7. GEOMETRICAL OPTICS - GRADE 10
Definition: Law of ReflectionThe Law of Reflection states that the angle of incidence is equal to the angle of reflection.
θi = θr
The simplest example of the law of incidence is if the angle of incidence is 0. In this case, theangle of reflection is also 0. You see this when you look straight into a mirror.
surface
incident ray
surface
reflected ray
Figure 7.6: When a wave strikes a surface at right angles to the surface, then the wave is reflecteddirectly back.
If the angle of incidence is not 0, then the angle of reflection is also not 0. For example, if alight strikes a surface at 60 to the surface normal, then the angle that the reflected ray makeswith the surface normal is also 60 as shown in Figure 7.7.
incident ray
reflected raysurface
60
60
Figure 7.7: Ray diagram showing angle of incidence and angle of reflection. The Law of Reflectionstates that when a light ray reflects off a surface, the angle of reflection θr is the same as theangle of incidence θi.
Worked Example 31: Law of Reflection
Question: An incident ray strikes a smooth reflective surface at an angle of 33 tothe surface normal. Calculate the angle of reflection.AnswerStep 1 : Determine what is given and what is requiredWe are given the angle between the incident ray and the surface normal. This is theangle of incidence.We are required to calculate the angle of reflection.Step 2 : Determine how to approach the problemWe can use the Law of Reflection, which states that the angle of incidence is equalto the angle of reflection.Step 3 : Calculate the angle of reflectionWe are given the angle of incidence to be 33. Therefore, the angle of reflection isalso 33.
134

CHAPTER 7. GEOMETRICAL OPTICS - GRADE 10 7.3
7.3.3 Types of Reflection
The Law of Reflection is true for any surface. Does this mean that when parallel rays approacha surface, the reflected rays will also be parallel? This depends on the texture of the reflectingsurface.
smooth surface
(a) Specular reflection
rough surface
(b) Diffuse reflection
Figure 7.8: Specular and diffuse reflection.
Specular Reflection
Figure 7.8(a) shows a surface that is flat and even. Parallel incident light rays hit the smoothsurface and parallel reflected light rays leave the surface. This type of reflection is called specularreflection. Specular reflection occurs when rays are reflected from a smooth, shiny surface. Thenormal to the surface is the same at every point on the surface. Parallel incident rays becomeparallel reflected rays. When you look in a mirror, the image you see is formed by specularreflection.
Diffuse Reflection
Figure 7.8(b) shows a surface with bumps and curves. When multiple rays hit this unevensurface, diffuse reflection occurs. The incident rays are parallel but the reflected rays are not.Each point on the surface has a different normal. This means the angle of incidence is differentat each point. Then according to the Law of Reflection, each angle of reflection is different.Diffuse reflection occurs when light rays are reflected from bumpy surfaces. You can still see areflection as long as the surface is not too bumpy. Diffuse reflection enables us to see all objectsthat are not sources of light.
Activity :: Experiment : Specular and Diffuse Reflection
A bouncing ball can be used to demonstrate the basic difference between specularand diffuse reflection.Aim:To demonstrate and compare specular and diffuse reflection.Apparatus:You will need:
1. a small ball (a tennis ball or a table tennis ball is perfect)
2. a smooth surface, like the floor inside the classroom
3. a very rough surface, like a rocky piece of ground
Method:
1. Bounce the ball on the smooth floor and observe what happens.
2. Bounce the ball on the rough ground floor and observe what happens.
3. What do you observe?
135

7.3 CHAPTER 7. GEOMETRICAL OPTICS - GRADE 10
4. What is the difference between the two surfaces?
Conclusions:You should have seen that the ball bounces (is reflected off the floor) in a predictablemanner off the smooth floor, but bounces unpredictably on the rough ground.
The ball can be seen to be a ray of light and the floor or ground is the reflectingsurface. For specular reflection (smooth surface), the ball bounces predictably. Fordiffuse reflection (rough surface), the ball bounces unpredictably.
Exercise: Reflection
1. The diagram shows a curved surface. Draw normals to the surface at themarked points.
b
b
b
b
b
b
b
b
AB
C
D
EF
G
H
2. In the diagram, label the following:
(a) normal
(b) angle of incidence
(c) angle of reflection
(d) incident ray
(e) reflected ray
EB A
C D
surface
3. State the Law of Reflection. Draw a diagram, label the appropriate angles andwrite a mathematical expression for the Law of Reflection.
4. Draw a ray diagram to show the relationship between the angle of incidenceand the angle of reflection.
5. The diagram shows an incident ray I. Which of the other 5 rays (A, B, C, D,E) best represents the reflected ray of I?
surface
normalA
BC
D
E
I
6. A ray of light strikes a surface at 15 to the surface normal. Draw a ray diagramshowing the incident ray, reflected ray and surface normal. Calculate the anglesof incidence and reflection and fill them in on your diagram.
136
CHAPTER 7. GEOMETRICAL OPTICS - GRADE 10 7.4
7. A ray of light leaves a surface at 45 to the surface normal. Draw a ray diagramshowing the incident ray, reflected ray and surface normal. Calculate the anglesof incidence and reflection and fill them in on your diagram.
8. A ray of light strikes a surface at 25 to the surface. Draw a ray diagramshowing the incident ray, reflected ray and surface normal. Calculate the anglesof incidence and reflection and fill them in on your diagram.
9. A ray of light leaves a surface at 65 to the surface. Draw a ray diagramshowing the incident ray, reflected ray and surface normal. Calculate the anglesof incidence and reflection and fill them in on your diagram.
10. If the incident ray, the reflected ray and the surface normal do not fall on thesame plane, will the angle of incidence equal the angle of reflection?
11. Explain the difference between specular and diffuse reflection.
12. We see an object when the light that is reflected by the object enters our eyes.Do you think the reflection by most objects is specular reflection or diffusereflection? Explain.
13. A beam of light (for example from a torch) is generally not visible at night, asit travels through air. Try this for yourself. However, if you shine the torchthrough dust, the beam is visible. Explain why this happens.
14. If a torch beam is shone across a classroom, only students in the direct line ofthe beam would be able to see that the torch is shining. However, if the beamstrikes a wall, the entire class will be able to see the spot made by the beamon the wall. Explain why this happens.
15. A scientist looking into a flat mirror hung perpendicular to the floor cannot seeher feet but she can see the hem of her lab coat. Draw a ray diagram to helpexplain the answers to the following questions:
(a) Will she be able to see her feet if she backs away from the mirror?
(b) What if she moves towards the mirror?
7.4 Refraction
In the previous sections we studied light reflecting off various surfaces. What happens when lightpasses through a medium? Like all waves, the speed of light is dependent on the medium inwhich it is travelling. When light moves from one medium into another (for example, from airto glass), the speed of light changes. The effect is that the light ray passing into a new mediumis refracted, or bent. Refraction is therefore the bending of light as it moves from one opticalmedium to another.
Definition: RefractionRefraction is the bending of light that occurs because light travels at different speeds indifferent materials.
When light travels from one medium to another, it will be bent away from its original path.When it travels from an optically dense medium like water or glass to a less dense medium likeair, it will be refracted away from the normal (Figure 7.9). Whereas, if it travels from a lessdense medium to a denser one, it will be refracted towards the normal (Figure 7.10).
Just as we defined an angle of reflection in the previous section, we can similarly define an angleof refraction as the angle between the surface normal and the refracted ray. This is shown inFigure 7.11.
137

7.4 CHAPTER 7. GEOMETRICAL OPTICS - GRADE 10
water
air
normal
incidentray
refractedray
the light is bentor refracted awayfrom the normal
this is the paththat the lightshould take ifthe two media
were the same
Figure 7.9: Light is moving from an optically dense medium to an optically less dense medium.Light is refracted away from the normal.
water
air
normal
incidentray
refractedray
the light is bentor refracted towards
the normal
original pathof light
Figure 7.10: Light is moving from an optically less dense medium to an optically denser medium.Light is refracted towards the normal.
surface normal
Air
Water
θ
(a) Light moves from air to water
surface normal
Air
Water
θ
(b) Light moves from water to air
Figure 7.11: Light moving from one medium to another bends towards or away from the surfacenormal. The angle of refraction θ is shown.
138
CHAPTER 7. GEOMETRICAL OPTICS - GRADE 10 7.4
7.4.1 Refractive Index
Which is easier to travel through, air or water? People usually travel faster through air. Sodoes light! The speed of light and therefore the degree of bending of the light depends on therefractive index of material through which the light passes. The refractive index (symbol n) isthe ratio of the speed of light in a vacuum to its speed in the material. You can think of therefractive index as a measure of how difficult it is for light to get through a material.
Definition: Refractive IndexThe refractive index of a material is the ratio of the speed of light in a vacuum to its speedin the medium.
Interesting
Fact
teresting
FactThe symbol c is used to represent the speed of light in a vacuum.
c = 299 792 485 m · s−1
For purposes of calculation, we use 3 × 10⁸ m · s−1. A vacuum is a region withno matter in it, not even air. However, the speed of light in air is very close tothat in a vacuum.
Definition: Refractive IndexThe refractive index (symbol n) of a material is the ratio of the speed of light in a vacuumto its speed in the material and gives an indication of how difficult it is for light to getthrough the material.
n =c
v
wheren = refractive index (no unit)c = speed of light in a vacuum (3,00 × 10⁸ m · s−1)v = speed of light in a given medium (m · s−1)
Extension: Refractive Index and Speed of Light
Using
n =c
v
we can also examine how the speed of light changes in different media, because thespeed of light in a vacuum (c) is constant.
If the refractive index n increases, the speed of light in the material v mustdecrease. Light therefore travels slowly through materials of high n.
Table 7.4.1 shows refractive indices for various materials. Light travels slower in any materialthan it does in a vacuum, so all values for n are greater than 1.
7.4.2 Snell’s Law
Now that we know that the degree of bending, or the angle of refraction, is dependent on therefractive index of a medium, how do we calculate the angle of refraction?
The angles of incidence and refraction when light travels from one medium to another can becalculated using Snell’s Law.
139
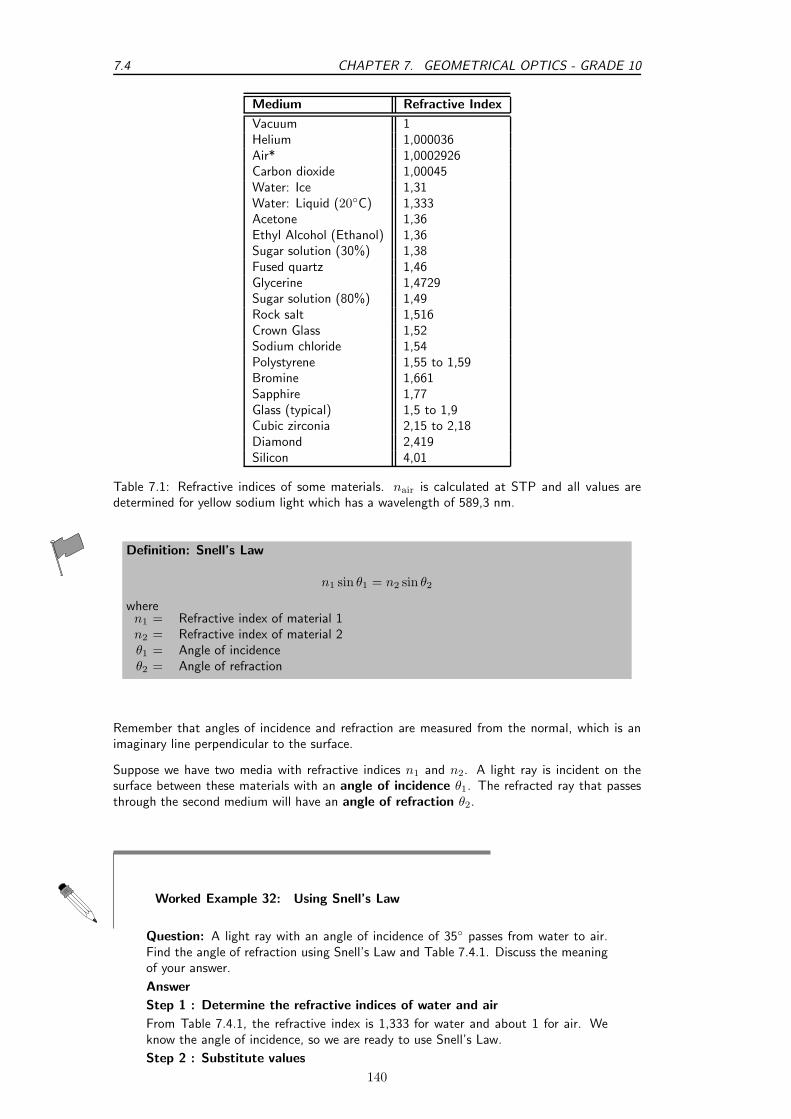
7.4 CHAPTER 7. GEOMETRICAL OPTICS - GRADE 10
Medium Refractive Index
Vacuum 1Helium 1,000036Air* 1,0002926Carbon dioxide 1,00045Water: Ice 1,31Water: Liquid (20C) 1,333Acetone 1,36Ethyl Alcohol (Ethanol) 1,36Sugar solution (30%) 1,38Fused quartz 1,46Glycerine 1,4729Sugar solution (80%) 1,49Rock salt 1,516Crown Glass 1,52Sodium chloride 1,54Polystyrene 1,55 to 1,59Bromine 1,661Sapphire 1,77Glass (typical) 1,5 to 1,9Cubic zirconia 2,15 to 2,18Diamond 2,419Silicon 4,01
Table 7.1: Refractive indices of some materials. nair is calculated at STP and all values aredetermined for yellow sodium light which has a wavelength of 589,3 nm.
Definition: Snell’s Law
n1 sin θ1 = n2 sin θ2
wheren1 = Refractive index of material 1n2 = Refractive index of material 2θ1 = Angle of incidenceθ2 = Angle of refraction
Remember that angles of incidence and refraction are measured from the normal, which is animaginary line perpendicular to the surface.
Suppose we have two media with refractive indices n1 and n2. A light ray is incident on thesurface between these materials with an angle of incidence θ1. The refracted ray that passesthrough the second medium will have an angle of refraction θ2.
Worked Example 32: Using Snell’s Law
Question: A light ray with an angle of incidence of 35 passes from water to air.Find the angle of refraction using Snell’s Law and Table 7.4.1. Discuss the meaningof your answer.
Answer
Step 1 : Determine the refractive indices of water and air
From Table 7.4.1, the refractive index is 1,333 for water and about 1 for air. Weknow the angle of incidence, so we are ready to use Snell’s Law.
Step 2 : Substitute values
140

CHAPTER 7. GEOMETRICAL OPTICS - GRADE 10 7.4
According to Snell’s Law:
n1 sin θ1 = n2 sin θ2
1,33 sin35 = 1 sin θ2
sin θ2 = 0,763
θ2 = 49,7.
Step 3 : Discuss the answerThe light ray passes from a medium of high refractive index to one of low refractiveindex. Therefore, the light ray is bent away from the normal.
Worked Example 33: Using Snell’s Law
Question: A light ray passes from water to diamond with an angle of incidence of75. Calculate the angle of refraction. Discuss the meaning of your answer.AnswerStep 1 : Determine the refractive indices of water and airFrom Table 7.4.1, the refractive index is 1,333 for water and 2,42 for diamond. Weknow the angle of incidence, so we are ready to use Snell’s Law.Step 2 : Substitute values and solveAccording to Snell’s Law:
n1 sin θ1 = n2 sin θ2
1,33 sin75 = 2,42 sin θ2
sin θ2 = 0,531
θ2 = 32,1.
Step 3 : Discuss the answerThe light ray passes from a medium of low refractive index to one of high refractiveindex. Therefore, the light ray is bent towards the normal.
Ifn2 > n1
then from Snell’s Law,sin θ1 > sin θ2.
For angles smaller than 90, sin θ increases as θ increases. Therefore,
θ1 > θ2.
This means that the angle of incidence is greater than the angle of refraction and the light rayis bent toward the normal.
Similarly, ifn2 < n1
then from Snell’s Law,sin θ1 < sin θ2.
For angles smaller than 90, sin θ increases as θ increases. Therefore,
θ1 < θ2.
141
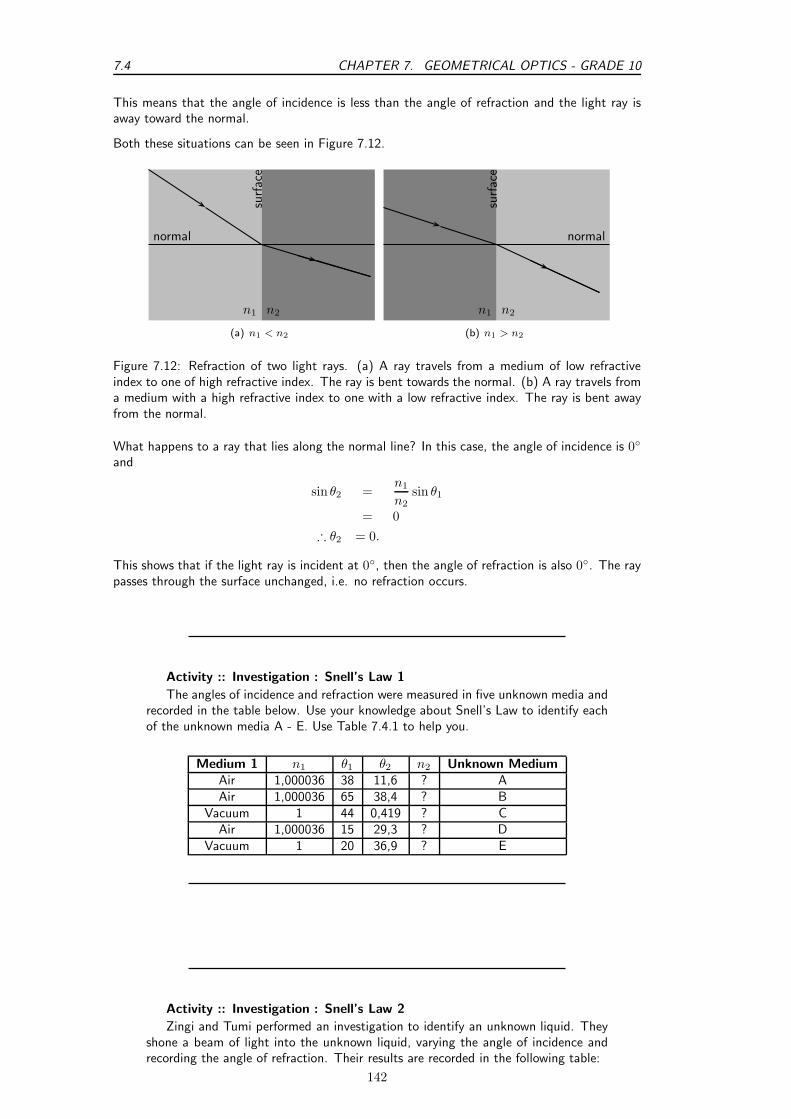
7.4 CHAPTER 7. GEOMETRICAL OPTICS - GRADE 10
This means that the angle of incidence is less than the angle of refraction and the light ray isaway toward the normal.
Both these situations can be seen in Figure 7.12.
n1 n2
normal
surfac
e
(a) n1 < n2
n1 n2
normal
surfac
e
(b) n1 > n2
Figure 7.12: Refraction of two light rays. (a) A ray travels from a medium of low refractiveindex to one of high refractive index. The ray is bent towards the normal. (b) A ray travels froma medium with a high refractive index to one with a low refractive index. The ray is bent awayfrom the normal.
What happens to a ray that lies along the normal line? In this case, the angle of incidence is 0
and
sin θ2 =n1
n2sin θ1
= 0
∴ θ2 = 0.
This shows that if the light ray is incident at 0, then the angle of refraction is also 0. The raypasses through the surface unchanged, i.e. no refraction occurs.
Activity :: Investigation : Snell’s Law 1
The angles of incidence and refraction were measured in five unknown media andrecorded in the table below. Use your knowledge about Snell’s Law to identify eachof the unknown media A - E. Use Table 7.4.1 to help you.
Medium 1 n1 θ1 θ2 n2 Unknown MediumAir 1,000036 38 11,6 ? AAir 1,000036 65 38,4 ? B
Vacuum 1 44 0,419 ? CAir 1,000036 15 29,3 ? D
Vacuum 1 20 36,9 ? E
Activity :: Investigation : Snell’s Law 2
Zingi and Tumi performed an investigation to identify an unknown liquid. Theyshone a beam of light into the unknown liquid, varying the angle of incidence andrecording the angle of refraction. Their results are recorded in the following table:
142

CHAPTER 7. GEOMETRICAL OPTICS - GRADE 10 7.4
Angle of Incidence Angle of Refraction
0,0 0,00
5,0 3,76
10,0 7,50
15,0 11,2
20,0 14,9
25,0 18,5
30,0 22,1
35,0 25,5
40,0 28,9
45,0 32,1
50,0 35,2
55,0 38,0
60,0 40,6
65,0 43,0
70,0 ?75,0 ?80,0 ?85,0 ?
1. Write down an aim for the investigation.
2. Make a list of all the apparatus they used.
3. Identify the unknown liquid.
4. Predict what the angle of refraction will be for 70, 75, 80 and 85.
7.4.3 Apparent Depth
Imagine a coin on the bottom of a shallow pool of water. If you reach for the coin, you will missit because the light rays from the coin are refracted at the water’s surface.
Consider a light ray that travels from an underwater object to your eye. The ray is refracted atthe water surface and then reaches your eye. Your eye does not know Snell’s Law; it assumeslight rays travel in straight lines. Your eye therefore sees the image of the at coin shallowerlocation. This shallower location is known as the apparent depth.
The refractive index of a medium can also be expressed as
n =real depth
apparent depth.
realdepth
apparent
depth
Worked Example 34: Apparent Depth 1
143

7.4 CHAPTER 7. GEOMETRICAL OPTICS - GRADE 10
Question: A coin is placed at the bottom of a 40 cm deep pond. The refractiveindex for water is 1,33. How deep does the coin appear to be?AnswerStep 1 : Identify what is given and what is askedn = 1,33real depth = 40 cmapparent depth = ?Step 2 : Substitute values and find answer
n =real depth
apparent depth
1,33 =40
x
x =40
1,33= 30,08 cm
The coin appears to be 30,08 cm deep.
Worked Example 35: Apparent Depth 2
Question: A R1 coin appears to be 7 cm deep in a colourless liquid. The depth ofthe liquid is 10,43 cm.
1. Determine the refractive index of the liquid.
2. Identify the liquid.
AnswerStep 1 : Identify what is given and what is askedreal depth = 7 cmapparent depth = 10,43 cmn = ?Identify the liquid.Step 2 : Calculate refractive index
n =real depth
apparent depth
=10,43
7= 1,49
Step 3 : Identify the liquidUse Table 7.4.1. The liquid is an 80% sugar solution.
Exercise: Refraction
1. Explain refraction in terms of a change of wave speed in different media.
2. In the diagram, label the following:
(a) angle of incidence
(b) angle of refraction
144

CHAPTER 7. GEOMETRICAL OPTICS - GRADE 10 7.4
(c) incident ray
(d) refracted ray
(e) normal
A
Medium 1
Medium 2
EF
G
D
C
B
3. What is the angle of refraction?
4. Describe what is meant by the refractive index of a medium.
5. State Snell’s Law.
6. In the diagram, a ray of light strikes the interface between two media.
normal
Medium 1
Medium 2
Draw what the refracted ray would look like if:
(a) medium 1 had a higher refractive index than medium 2.
(b) medium 1 had a lower refractive index than medium 2.
7. Light travels from a region of glass into a region of glycerine, making an angleof incidence of 40.
(a) Describe the path of the light as it moves into the glycerine.
(b) Calculate the angle of refraction.
8. A ray of light travels from silicon to water. If the ray of light in the watermakes an angle of 69 to the surface normal, what is the angle of incidence inthe silicon?
9. Light travels from a medium with n = 1,25 into a medium of n = 1,34, at anangle of 27 from the interface normal.
(a) What happens to the speed of the light? Does it increase, decrease, orremain the same?
(b) What happens to the wavelength of the light? Does it increase, decrease,or remain the same?
(c) Does the light bend towards the normal, away from the normal, or not atall?
10. Light travels from a medium with n = 1,63 into a medium of n = 1,42.
(a) What happens to the speed of the light? Does it increase, decrease, orremain the same?
(b) What happens to the wavelength of the light? Does it increase, decrease,or remain the same?
145

7.5 CHAPTER 7. GEOMETRICAL OPTICS - GRADE 10
(c) Does the light bend towards the normal, away from the normal, or not atall?
11. Light is incident on a glass prism. The prism is surrounded by air. The angle ofincidence is 23. Calculate the angle of reflection and the angle of refraction.
12. Light is refracted at the interface between air and an unknown medium. Ifthe angle of incidence is 53 and the angle of refraction is 37, calculate therefractive index of the unknown, second medium.
13. A coin is placed in a bowl of acetone (n = 1,36). The coin appears to be 10cm deep. What is the depth of the acetone?
14. A dot is drawn on a piece of paper and a glass prism placed on the dot accordingto the diagram.
glass
4 cm6 cm
dot
(a) Use the information supplied to determine the refractive index of glass.
(b) Draw a ray diagram to explain how the image of the dot is above wherethe dot really is.
15. Light is refracted at the interface between a medium of refractive index 1,5and a second medium of refractive index 2,1. If the angle of incidence is 45,calculate the angle of refraction.
16. A ray of light strikes the interface between air and diamond. If the incidentray makes an angle of 30 with the interface, calculate the angle made by therefracted ray with the interface.
17. Challenge Question: What values of n are physically impossible to achieve?Explain your answer. The values provide the limits of possible refractive indices.
18. Challenge Question: You have been given a glass beaker full of an unknownliquid. How would you identify what the liquid is? You have the followingpieces of equipment available for the experiment: a laser, a protractor, a ruler,a pencil, and a reference guide containing optical properties of various liquids.
7.5 Mirrors
A mirror is a highly reflective surface. The most common mirrors are flat and are known asplane mirrors. Household mirrors are plane mirrors. They are made of a flat piece of glass witha thin layer of silver nitrate or aluminium on the back. However, other mirrors are curved andare either convex mirrors or are concave mirrors. The reflecting properties of all three typesof mirrors will be discussed in this section.
7.5.1 Image Formation
Definition: ImageAn image is a representation of an object formed by a mirror or lens. Light from the imageis seen.
If you place a candle in front of a mirror, you now see two candles. The actual, physical candleis called the object and the picture you see in the mirror is called the image. The object is thesource of the incident rays. The image is the picture that is formed by the reflected rays.
146

CHAPTER 7. GEOMETRICAL OPTICS - GRADE 10 7.5
mirror
distance (di)
distance(do)
image
objectobject
image
Figure 7.13: An object formed in a mirror is real and upright.
The object could be an actual source that emits light, such as a light bulb or a candle. Morecommonly, the object reflects light from another source. When you look at your face in themirror, your face does not emit light. Instead, light from a light bulb or from the sun reflects offyour face and then hits the mirror. However, in working with light rays, it is easiest to pretendthe light is coming from the object.
An image formed by reflection may be real or virtual. A real image occurs when light raysactually intersect at the image. A real image is inverted, or upside down. A virtual image occurswhen light rays do not actually meet at the image. Instead, you ”see” the image because youreye projects light rays backward. You are fooled into seeing an image! A virtual image is erect,or right side up (upright).
You can tell the two types apart by putting a screen at the location of the image. A real imagecan be formed on the screen because the light rays actually meet there. A virtual image cannotbe seen on a screen, since it is not really there.
To describe objects and images, we need to know their locations and their sizes. The distancefrom the mirror to the object is the object distance, do.
The distance from the mirror to the image is the image distance, di.
7.5.2 Plane Mirrors
Activity :: Investigation : Image formed by a mirror
1. Stand one step away from a large mirror
2. What do you observe in the mirror? This is called your image.
3. What size is your image? Bigger, smaller or the same size as you?
4. How far is your image from you? How far is your image from the mirror?
5. Is your image upright or upside down?
6. Take one step backwards. What does your image do? How far are you awayfrom your image?
7. Lift your left arm. Which arm does your image lift?
When you look into a mirror, you see an image of yourself.
The image created in the mirror has the following properties:
1. The image is virtual.
147

7.5 CHAPTER 7. GEOMETRICAL OPTICS - GRADE 10
b b
one step
mirror
you your image
Figure 7.14: An image in a mirror is virtual, upright, the same size and laterally inverted.
2. The image is the same distance behind the mirror as the object is in front of the mirror.
3. The image is laterally inverted. This means that the image is inverted from side to side.
4. The image is the same size as the object.
5. The image is upright.
Virtual images are images formed in places where light does not really reach. Light does notreally pass through the mirror to create the image; it only appears to an observer as though thelight were coming from behind the mirror. Whenever a mirror creates an image which is virtual,the image will always be located behind the mirror where light does not really pass.
Definition: Virtual ImageA virtual image is upright, on the opposite side of the mirror as the object, and light doesnot actually reach it.
7.5.3 Ray Diagrams
We draw ray diagrams to predict the image that is formed by a plane mirror. A ray diagram isa geometrical picture that is used for analyzing the images formed by mirrors and lenses. Wedraw a few characteristic rays from the object to the mirror. We then follow ray-tracing rules tofind the path of the rays and locate the image.
Important: A mirror obeys the Law of Reflection.
The ray diagram for the image formed by a plane mirror is the simplest possible ray diagram.Figure 7.15 shows an object placed in front of a plane mirror. It is convenient to have a centralline that runs perpendicular to the mirror. This imaginary line is called the principal axis.
Important: Ray diagramsThe following should be remembered when drawing ray diagrams:
1. Objects are represented by arrows. The length of the arrow represents the height ofthe object.
2. If the arrow points upwards, then the object is described as upright or erect. If thearrow points downwards then the object is described as inverted.
3. If the object is real, then the arrow is drawn with a solid line. If the object is virtual,then the arrow is drawn with a dashed line.
148

CHAPTER 7. GEOMETRICAL OPTICS - GRADE 10 7.5
Method: Ray Diagrams for Plane MirrorsRay diagrams are used to find the position and size and whether the image is real or virtual.
1. Draw the plane mirror as a straight line on a principal axis.
Principal
Axis
mirror
2. Draw the object as an arrow in front of the mirror.
PrincipalAxis
mirror
Object
objectdistance
3. Draw the image of the object, by using the principle that the image is placed at the samedistance behind the mirror that the object is in front of the mirror. The image size is alsothe same as the object size.
PrincipalAxis
mirror
image distanceObject
Image
image size thesame as object
same as object distance
4. Place a dot at the point the eye is located.
5. Pick one point on the image and draw the reflected ray that travels to the eye as it seesthis point. Remember to add an arrowhead.
mirror
Object Image
b
6. Draw the incident ray for light traveling from the corresponding point on the object to themirror, such that the law of reflection is obeyed.
149

7.5 CHAPTER 7. GEOMETRICAL OPTICS - GRADE 10
Object Image
b
θi
θr
θi = θr
7. Continue for other extreme points on the object.
Object Image
Figure 7.15: Ray diagram to predict the image formed by a plane mirror.
Suppose a light ray leaves the top of the object traveling parallel to the principal axis. The raywill hit the mirror at an angle of incidence of 0 degrees. We say that the ray hits the mirrornormally. According to the law of reflection, the ray will be reflected at 0 degrees. The ray thenbounces back in the same direction. We also project the ray back behind the mirror because thisis what your eye does.
Another light ray leaves the top of the object and hits the mirror at its centre. This ray will bereflected at the same angle as its angle of incidence, as shown. If we project the ray backwardbehind the mirror, it will eventually cross the projection of the first ray we drew. We have foundthe location of the image! It is a virtual image since it appears in an area that light cannotactually reach (behind the mirror). You can see from the diagram that the image is erect and isthe same size as the object. This is exactly as we expected.
We use a dashed line to indicate that the image is virtual.
7.5.4 Spherical Mirrors
The second class of mirrors that we will look at are spherical mirrors. These mirrors are calledspherical mirrors because if you take a sphere and cut it as shown in Figure 7.16 and then polishthe inside of one and the outside of the other, you will get a concave mirror and convex mirror
as shown. These two mirrors will be studied in detail.
The centre of curvature is the point at the centre of the sphere and describes how big the sphereis.
7.5.5 Concave Mirrors
The first type of curved mirror we will study are concave mirrors. Concave mirrors have the shapeshown in Figure 7.17. As with a plane mirror, the principal axis is a line that is perpendicular tothe centre of the mirror.
If you think of light reflecting off a concave mirror, you will immediately see that things will lookvery different compared to a plane mirror. The easiest way to understand what will happen isto draw a ray diagram and work out where the images will form. Once we have done that it iseasy to see what properties the image has.
First we need to define a very important characteristic of the mirror. We have seen that thecentre of curvature is the centre of the sphere from which the mirror is cut. We then define that
150
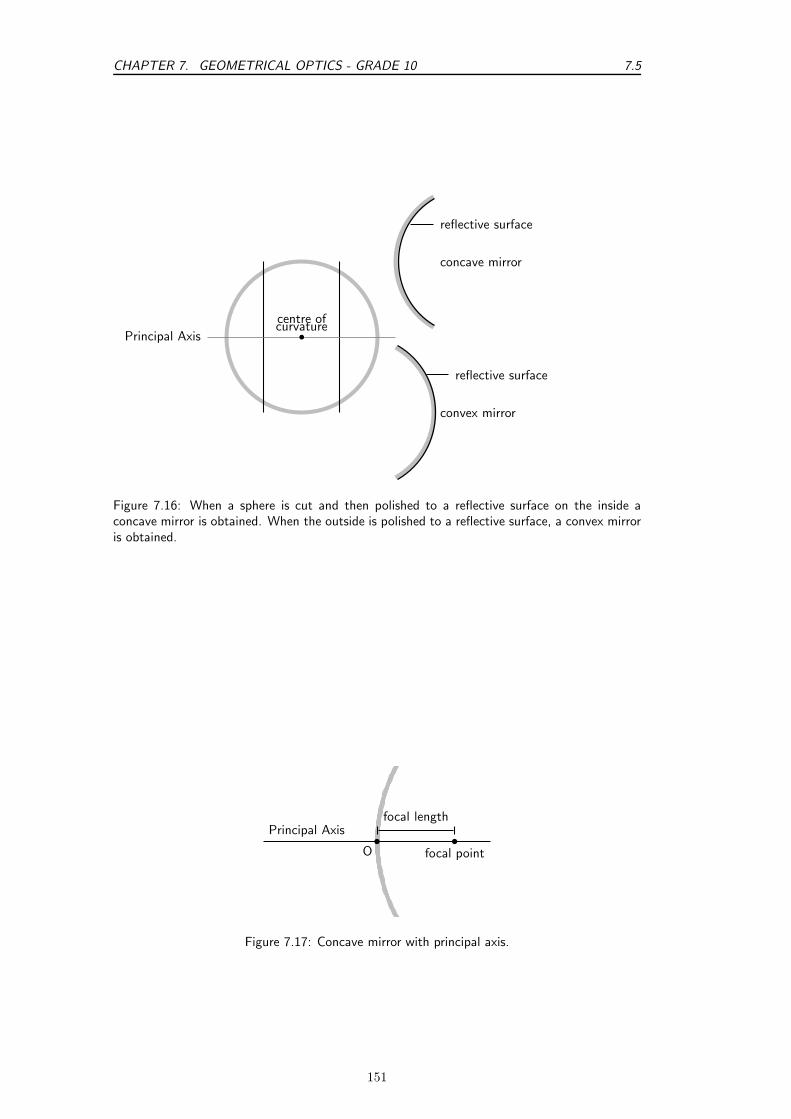
CHAPTER 7. GEOMETRICAL OPTICS - GRADE 10 7.5
Principal Axis b
centre ofcurvature
reflective surface
concave mirror
convex mirror
reflective surface
Figure 7.16: When a sphere is cut and then polished to a reflective surface on the inside aconcave mirror is obtained. When the outside is polished to a reflective surface, a convex mirroris obtained.
focal length
focal pointO
Principal Axis
Figure 7.17: Concave mirror with principal axis.
151

7.5 CHAPTER 7. GEOMETRICAL OPTICS - GRADE 10
a distance that is half-way between the centre of curvature and the mirror on the principal axis.This point is known as the focal point and the distance from the focal point to the mirror isknown as the focal length (symbol f). Since the focal point is the midpoint of the line segmentjoining the vertex and the center of curvature, the focal length would be one-half the radius ofcurvature. This fact can come in very handy, remember if you know one then you know theother!
Definition: Focal PointThe focal point of a mirror is the midpoint of a line segment joining the vertex and thecentre of curvature. It is the position at which all parallel rays are focussed.
Why are we making such a big deal about this point we call the focal point? It has an importantproperty we will use often. A ray parallel to the principal axis hitting the mirror will always bereflected through the focal point. The focal point is the position at which all parallel rays arefocussed.
focal point
Figure 7.18: All light rays pass through the focal point.
F A
B
A’
B’
Object
Image
Focus
Figure 7.19: A concave mirror with three rays drawn to locate the image. Each incident rayis reflected according to the Law of Reflection. The intersection of the reflected rays gives thelocation of the image. Here the image is real and inverted.
From Figure 7.19, we see that the image created by a concave mirror is real and inverted, ascompared to the virtual and erect image created by a plane mirror.
152

CHAPTER 7. GEOMETRICAL OPTICS - GRADE 10 7.5
Definition: Real ImageA real image can be cast on a screen; it is inverted, and on the same side of the mirror asthe object.
Extension: Convergence
A concave mirror is also known as a converging mirror. Light rays appear to convergeto the focal point of a concave mirror.
7.5.6 Convex Mirrors
The second type of curved mirror we will study are convex mirrors. Convex mirrors have the shapeshown in Figure 7.20. As with a plane mirror, the principal axis is a line that is perpendicular tothe centre of the mirror.
We have defined the focal point as that point that is half-way along the principal axis betweenthe centre of curvature and the mirror. Now for a convex mirror, this point is behind the mirror.A convex mirror has a negative focal length because the focal point is behind the mirror.
reflecting surface
bb b
C F O
focal lengthPA
Figure 7.20: Convex mirror with principle axis, focal point (F) and centre of curvature (C). Thecentre of the mirror is the optical centre (O).
To determine what the image from a convex mirror looks like and where the image is located,we need to remember that a mirror obeys the laws of reflection and that light appears to comefrom the image. The image created by a convex mirror is shown in Figure 7.21.
153

7.5 CHAPTER 7. GEOMETRICAL OPTICS - GRADE 10
C FA
BPRPR’
MR
MR’
FR FR’
ObjectImageF Ob b
Figure 7.21: A convex mirror with three rays drawn to locate the image. Each incident ray isreflected according to the Law of Reflection. The reflected rays diverge. If the reflected rays areextended behind the mirror, then their intersection gives the location of the image behind themirror. For a convex mirror, the image is virtual and upright.
From Figure 7.21, we see that the image created by a convex mirror is virtual and upright, ascompared to the real and inverted image created by a concave mirror.
Extension: Divergence
A convex mirror is also known as a diverging mirror. Light rays appear to divergefrom the focal point of a convex mirror.
7.5.7 Summary of Properties of Mirrors
The properties of mirrors are summarised in Table 7.2.
Table 7.2: Summary of properties of concave and convex mirrors.Plane Concave Convex
– converging divergingvirtual image real image virtual image
upright inverted uprightimage behind mirror image in front of mirror image behind mirror
7.5.8 Magnification
In Figures 7.19 and 7.21, the height of the object and image arrows were different. In any opticalsystem where images are formed from objects, the ratio of the image height, hi, to the objectheight, ho is known as the magnification, m.
m =hi
ho
This is true for the mirror examples we showed above and will also be true for lenses, which willbe introduced in the next sections. For a plane mirror, the height of the image is the same as the
154

CHAPTER 7. GEOMETRICAL OPTICS - GRADE 10 7.5
height of the object, so the magnification is simply m = hi
ho= 1. If the magnification is greater
than 1, the image is larger than the object and is said to be magnified. If the magnification isless than 1, the image is smaller than the object so the image is said to be diminished.
Worked Example 36: Magnification
Question: A concave mirror forms an image that is 4,8 cm high. The height of theobject is 1,6 cm. Calculate the magnification of the mirror.
Answer
Step 1 : Identify what is given and what is asked.
Image height hi = 4,8 cmObject height ho = 1,6 cmMagnification m = ?
Step 2 : Substitute the values and calculate m.
m =hi
ho
=4,8
1,6= 3
The magnification is 3 times.
Exercise: Mirrors
1. List 5 properties of a virtual image created by reflection from a plane mirror.
2. What angle does the principal axis make with a plane mirror?
3. Is the principal axis a normal to the surface of the plane mirror?
4. Do the reflected rays that contribute to forming the image from a plane mirrorobey the law of reflection?
5. If a candle is placed 50 cm in front of a plane mirror, how far behind the planemirror will the image be? Draw a ray diagram to show how the image is formed.
6. If a stool 0,5 m high is placed 2 m in front of a plane mirror, how far behindthe plane mirror will the image be and how high will the image be?
7. If Susan stands 3 m in front of a plane mirror, how far from Susan will herimage be located?
8. Explain why ambulances have the word ‘ambulance’ reversed on the front bon-net of the car?
9. Complete the diagram by filling in the missing lines to locate the image.
155

7.6 CHAPTER 7. GEOMETRICAL OPTICS - GRADE 10
principal axis
Mirror
b
10. An object 2 cm high is placed 4 cm in front of a plane mirror. Draw a raydiagram, showing the object, the mirror and the position of the image.
11. The image of an object is located 5 cm behind a plane mirror. Draw a raydiagram, showing the image, the mirror and the position of the object.
12. How high must a mirror be so that you can see your whole body in it? Does itmake a difference if you change the distance you stand in front of the mirror?Explain.
13. If 1-year old Tommy crawls towards a mirror at a rate of 0,3 m·s−1, at whatspeed will Tommy and his image approach each other?
14. Use a diagram to explain how light converges to the focal point of a concavemirror.
15. Use a diagram to explain how light diverges away from the focal point of aconvex mirror.
16. An object 1 cm high is placed 4 cm from a concave mirror. If the focal lengthof the mirror is 2 cm, find the position and size of the image by means of a raydiagram. Is the image real or virtual?
17. An object 2 cm high is placed 4 cm from a convex mirror. If the focal lengthof the mirror is 4 cm, find the position and size of the image by means of a raydiagram. Is the image real or virtual?
18. Calculate the magnification for each of the mirrors in the previous two questions.
7.6 Total Internal Reflection and Fibre Optics
7.6.1 Total Internal Reflection
Activity :: Investigation : Total Internal ReflectionWork in groups of four. Each group will need a raybox (or torch) with slit,
triangular glass prism and protractor. If you do not have a raybox, use a torch andstick two pieces of tape over the lens so that only a thin beam of light is visible.Aim:To investigate total internal reflection.Method:
156

CHAPTER 7. GEOMETRICAL OPTICS - GRADE 10 7.6
1. Place the raybox next to the glass block so that the light shines right throughwithout any refraction. See ”Position 1” in diagram.
Position 1
No refraction
takes place
ray box
glass prism
refracted ray
incident ray
2. Move the raybox such that the light is refracted by the glass. See ”Position 2”.
Position 2
Refraction
takes place
3. Move the raybox further and observe what happens.
Position 3
More refractiontakes place
4. Move the raybox until the refracted ray seems to disappear. See ”Position 4”.The angle of the incident light is called the critical angle.
Position 4
θi = θc
5. Move the raybox further and observe what happens. See ”Position 5”. Thelight shines back into the glass block. This is called total internal reflection.
157

7.6 CHAPTER 7. GEOMETRICAL OPTICS - GRADE 10
Position 5
θi > θc
incident ray
reflected ray
When we increase the angle of incidence, we reach a point where the angle of refraction is 90
and the refracted ray runs along the surface of the medium. This angle of incidence is called thecritical angle.
Definition: Critical AngleThe critical angle is the angle of incidence where the angle of reflection is 90. The lightmust shine from a dense to a less dense medium.
If the angle of incidence is bigger than this critical angle, the refracted ray will not emerge fromthe medium, but will be reflected back into the medium. This is called total internal reflection.
Total internal reflection takes place when
• light shines from an optically denser medium to an optically less dense medium.
• the angle of incidence is greater than the critical angle.
Definition: Total Internal ReflectionTotal internal reflection takes place when light is reflected back into the medium becausethe angle of incidence is greater than the critical angle.
Less densemedium
mediumDenser
θc > θc
Figure 7.22: Diagrams to show the critical angle and total internal reflection.
Each medium has its own unique critical angle. For example, the critical angle for glass is 42,and that of water is 48,8. We can calculate the critical angle for any medium.
Calculating the Critical Angle
Now we shall learn how to derive the value of the critical angle for two given media. The processis fairly simple and involves just the use of Snell’s Law that we have already studied. To recap,Snell’s Law states:
n1 sin θ1 = n2 sin θ2
158

CHAPTER 7. GEOMETRICAL OPTICS - GRADE 10 7.6
where n1 is the refractive index of material 1, n2 is the refractive index of material 2, θ1 is theangle of incidence and θ2 is the angle of refraction. For total internal reflection we know thatthe angle of incidence is the critical angle. So,
θ1 = θc.
However, we also know that the angle of refraction at the critical angle is 90. So we have:
θ2 = 90.
We can then write Snell’s Law as:
n1 sin θc = n2 sin 90
Solving for θc gives:
n1 sin θc = n2 sin 90
sin θc =n2
n1(1)
∴ θc = sin−1 (n2
n1)
Important: Take care that for total internal reflection the incident ray is always in thedenser medium.
Worked Example 37: Critical Angle 1
Question: Given that the refractive indices of air and water are 1 and 1,33, respec-tively, find the critical angle.
AnswerStep 1 : Determine how to approach the problem
We know that the critical angle is given by:
θc = sin−1(n2
n1)
Step 2 : Solve the problem
θc = sin−1 (n2
n1)
= sin−1 (1
1,33)
= 48,8
Step 3 : Write the final answerThe critical angle for light travelling from water to air is 48,8.
Worked Example 38: Critical Angle 2
Question: Complete the following ray diagrams to show the path of light in eachsituation.
159

7.6 CHAPTER 7. GEOMETRICAL OPTICS - GRADE 10
air
water
30
a)
air
water
50
b)
air
water
48,8
c)
water
air
48,8
d)
AnswerStep 1 : Identify what is given and what is askedThe critical angle for water is 48,8.We are asked to complete the diagrams.For incident angles smaller than 48,8 refraction will occur.For incident angles greater than 48,8 total internal reflection will occur.For incident angles equal to 48,8 refraction will occur at 90.The light must travel from a high optical density to a lower one.Step 2 : Complete the diagrams
air
water
30
a)
Refraction occurs (ray is bent away from the normal)
air
water
50
b)
50
Total internal reflection occurs
air
water
48,8
c)
θc = 48,8
160

CHAPTER 7. GEOMETRICAL OPTICS - GRADE 10 7.6
water
air
48,8
d)
Refraction towards the normal (air is less dense than water)
7.6.2 Fibre Optics
Total internal reflection is a powerful tool since it can be used to confine light. One of themost common applications of total internal reflection is in fibre optics. An optical fibre is a thin,transparent fibre, usually made of glass or plastic, for transmitting light. Optical fibres are usuallythinner than a human hair! The construction of a single optical fibre is shown in Figure 7.23.
The basic functional structure of an optical fibre consists of an outer protective cladding and aninner core through which light pulses travel. The overall diameter of the fibre is about 125 µm(125×10−6 m) and that of the core is just about 10 µm (10×10−6 m). The mode of operationof the optical fibres, as mentioned above, depends on the phenomenon of total internal reflection.The difference in refractive index of the cladding and the core allows total internal reflection inthe same way as happens at an air-water surface. If light is incident on a cable end with anangle of incidence greater than the critical angle then the light will remain trapped inside theglass strand. In this way, light travels very quickly down the length of the cable.
inner core
cladding
Figure 7.23: Structure of a single optical fibre.
Fibre Optics in Telecommunications
Optical fibres are most common in telecommunications, because information can be transportedover long distances, with minimal loss of data. The minimised loss of data gives optical fibresan advantage over conventional cables.
Data is transmitted from one end of the fibre to another in the form of laser pulses. A single strandis capable of handling over 3000 simultaneous transmissions which is a huge improvement overthe conventional co-axial cables. Multiple signal transmission is achieved by sending individuallight pulses at slightly different angles. For example if one of the pulses makes a 72,23 angleof incidence then a separate pulse can be sent at an angle of 72,26! The transmitted data isreceived almost instantaneously at the other end of the cable since the information coded ontothe laser travels at the speed of light! During transmission over long distances repeater stations
are used to amplify the signal which has weakened somewhat by the time it reaches the station.The amplified signals are then relayed towards their destination and may encounter several otherrepeater stations on the way.
Fibre Optics in Medicine
Optic fibres are used in medicine in endoscopes.
161

7.6 CHAPTER 7. GEOMETRICAL OPTICS - GRADE 10
Interesting
Fact
teresting
FactEndoscopy means to look inside and refers to looking inside the human body fordiagnosing medical conditions.
The main part of an endoscope is the optical fibre. Light is shone down the optical fibre and amedical doctor can use the endoscope to look inside a patient. Endoscopes are used to examinethe inside of a patient’s stomach, by inserting the endoscope down the patient’s throat.
Endoscopes allow minimally invasive surgery. This means that a person can be diagnosed andtreated through a small incision. This has advantages over open surgery because endoscopy isquicker and cheaper and the patient recovers more quickly. The alternative is open surgery whichis expensive, requires more time and is more traumatic for the patient.
Exercise: Total Internal Reflection and Fibre Optics
1. Describe total internal reflection, referring to the conditions that must be sat-isfied for total internal reflection to occur.
2. Define what is meant by the critical angle when referring to total internalreflection. Include a ray diagram to explain the concept.
3. Will light travelling from diamond to silicon ever undergo total internal reflec-tion?
4. Will light travelling from sapphire to diamond undergo total internal reflection?
5. What is the critical angle for light traveling from air to acetone?
6. Light traveling from diamond to water strikes the interface with an angle ofincidence of 86. Calculate the critical angle to determine whether the light betotally internally reflected and so be trapped within the water.
7. Which of the following interfaces will have the largest critical angle?
(a) a glass to water interface
(b) a diamond to water interface
(c) a diamond to glass interface
8. If the fibre optic strand is made from glass, determine the critical angle of thelight ray so that the ray stays within the fibre optic strand.
9. A glass slab is inserted in a tank of water. If the refractive index of water is1,33 and that of glass is 1,5, find the critical angle.
10. A diamond ring is placed in a container full of glycerin. If the critical angle isfound to be 37,4 and the refractive index of glycerin is given to be 1,47, findthe refractive index of diamond.
11. An optical fibre is made up of a core of refractive index 1,9, while the refractiveindex of the cladding is 1,5. Calculate the maximum angle which a light pulsecan make with the wall of the core. NOTE: The question does not ask for theangle of incidence but for the angle made by the ray with the wall of the core,which will be equal to 90- angle of incidence.
162

CHAPTER 7. GEOMETRICAL OPTICS - GRADE 10 7.7
7.7 Summary
1. We can see objects when light from the objects enters our eyes.
2. Light rays are thin imaginary lines of light and are indicated in drawings by means ofarrows.
3. Light travels in straight lines. Light can therefore not travel around corners. Shadows areformed because light shines in straight lines.
4. Light rays reflect off surfaces. The incident ray shines in on the surface and the reflectedray is the one that bounces off the surface. The surface normal is the perpendicular lineto the surface where the light strikes the surface.
5. The angle of incidence is the angle between the incident ray and the surface, and the angleof reflection is the angle between the reflected ray and the surface.
6. The Law of Reflection states the angle of incidence is equal to the angle of reflection andthat the reflected ray lies in the plane of incidence.
7. Specular reflection takes place when parallel rays fall on a surface and they leave the objectas parallel rays. Diffuse reflection takes place when parallel rays are reflected in differentdirections.
8. Refraction is the bending of light when it travels from one medium to another. Lighttravels at different speeds in different media.
9. The refractive index of a medium is a measure of how easily light travels through themedium. It is a ratio of the speed of light in a vacuum to the speed of light in themedium.n = c
v
10. Snell’s Law gives the relationship between the refractive indices, angles of incidence andreflection of two media.n1 sin θ1 = n2 sin θ2
11. Light travelling from one medium to another of lighter optical density will be refractedtowards the normal.Light travelling from one medium to another of lower optical density will be refracted awayfrom the normal.
12. Objects in a medium (e.g. under water) appear closer to the surface than they really are.This is due to the refraction of light, and the refractive index of the medium.n = real depth
apparent depth
13. Mirrors are highly reflective surfaces. Flat mirrors are called plane mirrors. Curved mirrorscan be convex or concave. The properties of the images formed by mirrors are summarisedin Table 3.2.
14. A real image can be cast on a screen, is inverted and in front of the mirror.A virtual image cannot be cast on a screen, is upright and behind the mirror.
15. The magnification of a mirror is how many times the image is bigger or smaller than theobject.
m = image height (hi)object height (h0)
16. The critical angle of a medium is the angle of incidence when the angle of refraction is90 and the refracted ray runs along the interface between the two media.
17. Total internal reflection takes place when light travels from one medium to another oflower optical density. If the angle of incidence is greater than the critical angle for themedium, the light will be reflected back into the medium. No refraction takes place.
18. Total internal reflection is used in optical fibres in telecommunication and in medicine inendoscopes. Optical fibres transmit information much more quickly and accurately thantraditional methods.
163

7.8 CHAPTER 7. GEOMETRICAL OPTICS - GRADE 10
7.8 Exercises
1. Give one word for each of the following descriptions:
1.1 The image that is formed by a plane mirror.
1.2 The perpendicular line that is drawn at right angles to a reflecting surface at thepoint of incidence.
1.3 The bending of light as it travels from one medium to another.
1.4 The ray of light that falls in on an object.
1.5 A type of mirror that focuses all rays behind the mirror.
2. State whether the following statements are TRUE or FALSE. If they are false, rewrite thestatement correcting it.
2.1 The refractive index of a medium is an indication of how fast light will travel throughthe medium.
2.2 Total internal refraction takes place when the incident angle is larger than the criticalangle.
2.3 The magnification of an object can be calculated if the speed of light in a vacuumand the speed of light in the medium is known.
2.4 The speed of light in a vacuum is about 3 × 10⁸ m.s−1.
2.5 Specular reflection takes place when light is reflected off a rough surface.
3. Choose words from Column B to match the concept/description in Column A. All theappropriate words should be identified. Words can be used more than once.
Column A Column B(a) Real image Upright(b) Virtual image Can be cast on a screen(c) Concave mirror In front(d) Convex mirror Behind(e) Plane mirror Inverted
Light travels to itUpside downLight does not reach itErectSame size
4. Complete the following ray diagrams to show the path of light.
waterglass
40
(a)
airglass
50
(b)
glass
air
30
(c)
airwater
48,8
(d)
airwater
42
(e)
water
air
55
(f)
5. A ray of light strikes a surface at 35 to the surface normal. Draw a ray diagram showingthe incident ray, reflected ray and surface normal. Calculate the angles of incidence andreflection and fill them in on your diagram.
6. Light travels from glass (n = 1,5) to acetone (n = 1,36). The angle of incidence is 25.
164

CHAPTER 7. GEOMETRICAL OPTICS - GRADE 10 7.8
6.1 Describe the path of light as it moves into the acetone.
6.2 Calculate the angle of refraction.
6.3 What happens to the speed of the light as it moves from the glass to the acetone?
6.4 What happens to the wavelength of the light as it moves into the acetone?
6.5 What is the name of the phenomenon that occurs at the interface between the twomedia?
7. A stone lies at the bottom of a swimming pool. The water is 120 cm deep. The refractiveindex of water is 1,33. How deep does the stone appear to be?
8. Light strikes the interface between air and an unknown medium with an incident angle of32. The angle of refraction is measured to be 48. Calculate the refractive index of themedium and identify the medium.
9. Explain what total internal reflection is and how it is used in medicine and telecommuni-cations. Why is this technology much better to use?
10. A candle 10 cm high is placed 25 cm in front of a plane mirror. Draw a ray diagram toshow how the image is formed. Include all labels and write down the properties of theimage.
11. A virtual image, 4 cm high, is formed 3 cm from a plane mirror. Draw a labelled raydiagram to show the position and height of the object. What is the magnification?
12. An object, 3 cm high, is placed 4 cm from a concave mirror of focal length 2 cm. Draw alabelled ray diagram to find the position, height and properties of the image.
13. An object, 2 cm high, is placed 3 cm from a convex mirror. The magnification is 0,5.Calculate the focal length of the mirror.
165

7.8 CHAPTER 7. GEOMETRICAL OPTICS - GRADE 10
166

Chapter 8
Magnetism - Grade 10
8.1 Introduction
Magnetism is the force that a magnetic object exerts, through its magnetic field, on anotherobject. The two objects do not have to physically touch each other for the force to be exerted.Object 2 feels the magnetic force from Object 1 because of Object 1’s surrounding magneticfield.
Humans have known about magnetism for many thousands of years. For example, lodestone isa magnetised form of the iron oxide mineral magnetite. It has the property of attracting ironobjects. It is referred to in old European and Asian historical records; from around 800 BCE inEurope and around 2 600 BCE in Asia.
Interesting
Fact
teresting
FactThe root of the English word magnet is from the Greek word magnes, probablyfrom Magnesia in Asia Minor, once an important source of lodestone.
8.2 Magnetic fields
A magnetic field is a region in space where a magnet or object made of ferromagnetic materialwill experience a non-contact force.
Electrons moving inside any object have magnetic fields associated with them. In most materialsthese fields point in all directions, so the net magnetic field is zero. For example, in the plastic ballbelow, the directions of the magnetic fields of the electrons (shown by the arrows) are pointingin different directions and cancel each other out. Therefore the plastic ball is not magnetic andhas no magnetic field.
plastic ball
directions of electron magnetic fields
The electron magnetic fields point in all directionsand so there is no net magnetic field
167

8.2 CHAPTER 8. MAGNETISM - GRADE 10
In some materials (e.g. iron), called ferromagnetic materials, there are regions called domains,where these magnetic fields line up. All the atoms in each domain group together so that themagnetic fields from their electrons point the same way. The picture shows a piece of an ironneedle zoomed in to show the domains with the electric fields lined up inside them.
iron needle
zoomed-in part of needle
in each domain the electron magnetic fields (black arrows)are pointing in the same direction, causing a netmagnetic field (big white arrows) in each domain
In permanent magnets, many domains are lined up, resulting in a net magnetic field. Objectsmade from ferromagnetic materials can be magnetised, for example by rubbing a magnet alongthe object in one direction. This causes the magnetic fields of most, or all, of the domains to lineup and cause the object to have a magnetic field and be magnetic. Once a ferromagnetic objecthas been magnetised, it can stay magnetic without another magnet being nearby (i.e. withoutbeing in another magnetic field). In the picture below, the needle has been magnetised becausethe magnetic fields in all the domains are pointing in the same direction.
iron needle
zoomed-in part of needle
when the needle is magnetised, the magnetic fieldsof all the domains (white arrows) point in thesame direction, causing a net magnetic field
Activity :: Investigation : Ferromagnetic materials and magnetisation
1. Find 2 paper clips. Put the paper clips close together and observe what hap-pens.
1.1 What happens to the paper clips?
1.2 Are the paper clips magnetic?
2. Now take a permanent bar magnet and rub it once along 1 of the paper clips.Remove the magnet and put the paper clip which was touched by the magnetclose to the other paper clip and observe what happens.
2.1 Does the untouched paper clip feel a force on it? If so, is the forceattractive or repulsive?
3. Rub the same paper clip a few more times with the bar magnet, in the samedirection as before. Put the paper clip close to the other one and observe whathappens.
3.1 Is there any difference to what happened in step 2?
168

CHAPTER 8. MAGNETISM - GRADE 10 8.3
3.2 If there is a difference, what is the reason for it?
3.3 Is the paper clip which was rubbed by the magnet now magnetised?
3.4 What is the difference between the two paper clips at the level oftheir atoms and electrons?
4. Now, find a metal knitting needle, or a plastic ruler, or other plastic object.Rub the bar magnet along the knitting needle a few times in the same direction.Now put the knitting needle close to the paper clips and observe what happens.
4.1 Does the knitting needle attract the paper clips?
4.2 What does this tell you about the material of the knitting needle?Is it ferromagnetic?
5. Repeat this experiment with objects made from other materials.
5.1 Which materials appear to be ferromagnetic and which are not? Putyour answers in a table.
8.3 Permanent magnets
8.3.1 The poles of permanent magnets
Because the domains in a permanent magnet all line up in a particular direction, the magnethas a pair of opposite poles, called north (usually shortened to N) and south (usually shortenedto S). Even if the magnet is cut into tiny pieces, each piece will still have both a N and a Spole. These poles always occur in pairs. In nature we never find a north magnetic pole or southmagnetic pole on its own.
S N
S N
S N S
... after breaking in half ...
Magnetic fields are different to gravitational and electric fields. In nature, positive and negativeelectric charges can be found on their own, but you never find just a north magnetic pole orsouth magnetic pole on its own. On the very small scale, zooming in to the size of atoms,magnetic fields are caused by moving charges (i.e. the negatively charged electrons).
8.3.2 Magnetic attraction and repulsion
Like poles of magnets repel one another whilst unlike poles attract. This means that two N polesor two S poles will push away from each other while a N pole and a S pole will be drawn towardseach other.
Definition: Attraction and RepulsionLike poles of magnets repel each other whilst unlike poles attract each other.
169

8.3 CHAPTER 8. MAGNETISM - GRADE 10
Worked Example 39: Attraction and Repulsion
Question: Do you think the following magnets will repel or be attracted to eachother?
magnetS N magnetN S
Answer
Step 1 : Determine what is required
We are required to determine whether the two magnets will repel each other or beattracted to each other.
Step 2 : Determine what is given
We are given two magnets with the N pole of one approaching the N pole of theother.
Step 3 : Determine the conclusion
Since both poles are the same, the magnets will repel each other.
Worked Example 40: Attraction and repulsion
Question: Do you think the following magnets will repel or be attracted to eachother?
magnetN S magnetN S
Answer
Step 1 : Determine what is required
We are required to determine whether the two magnets will repel each other or beattracted to each other.
Step 2 : Determine what is given
We are given two magnets with the N pole of one approaching the S pole of theother.
Step 3 : Determine the conclusion
Since both poles are the different, the magnets will be attracted to each other.
8.3.3 Representing magnetic fields
Magnetic fields can be represented using magnetic field lines. Although the magnetic field ofa permanent magnet is everywhere surrounding the magnet (in all 3 dimensions), we draw onlysome of the field lines to represent the field (usually only 2 dimensions are shown in drawings).
170
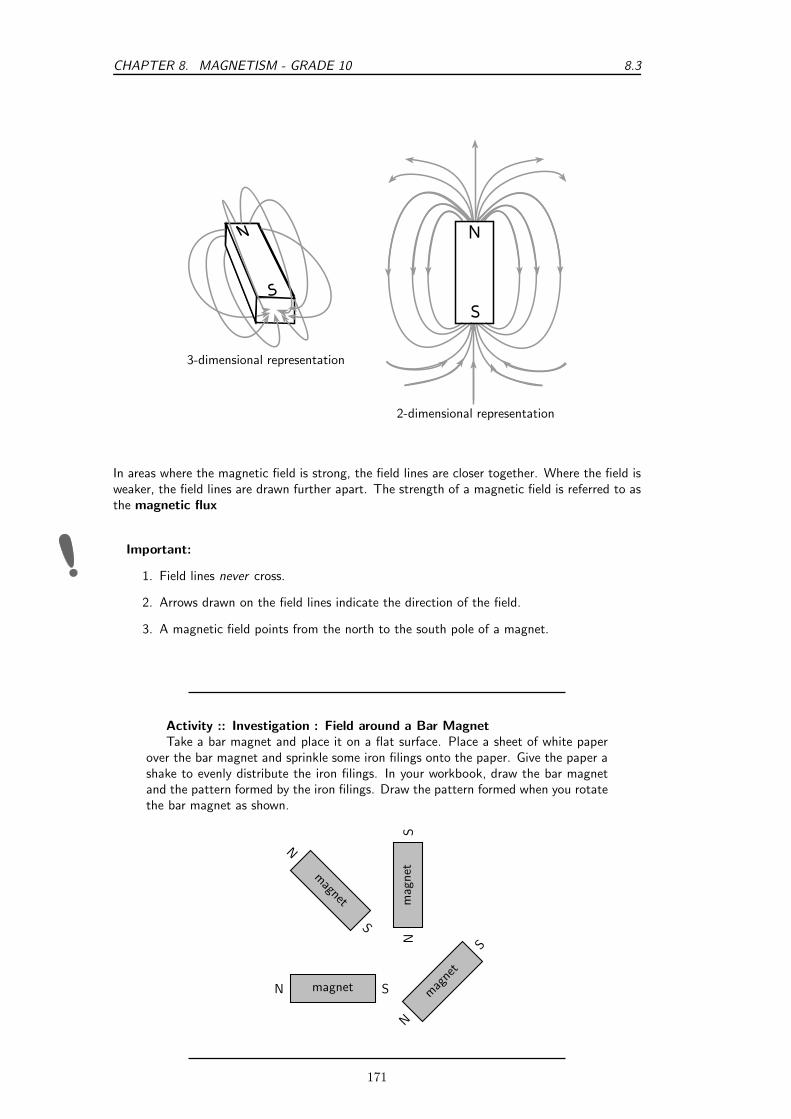
CHAPTER 8. MAGNETISM - GRADE 10 8.3
3-dimensional representation
2-dimensional representation
In areas where the magnetic field is strong, the field lines are closer together. Where the field isweaker, the field lines are drawn further apart. The strength of a magnetic field is referred to asthe magnetic flux
Important:
1. Field lines never cross.
2. Arrows drawn on the field lines indicate the direction of the field.
3. A magnetic field points from the north to the south pole of a magnet.
Activity :: Investigation : Field around a Bar MagnetTake a bar magnet and place it on a flat surface. Place a sheet of white paper
over the bar magnet and sprinkle some iron filings onto the paper. Give the paper ashake to evenly distribute the iron filings. In your workbook, draw the bar magnetand the pattern formed by the iron filings. Draw the pattern formed when you rotatethe bar magnet as shown.
magnetN S mag
net
N
S
magnet
N
S
mag
net
NS
171
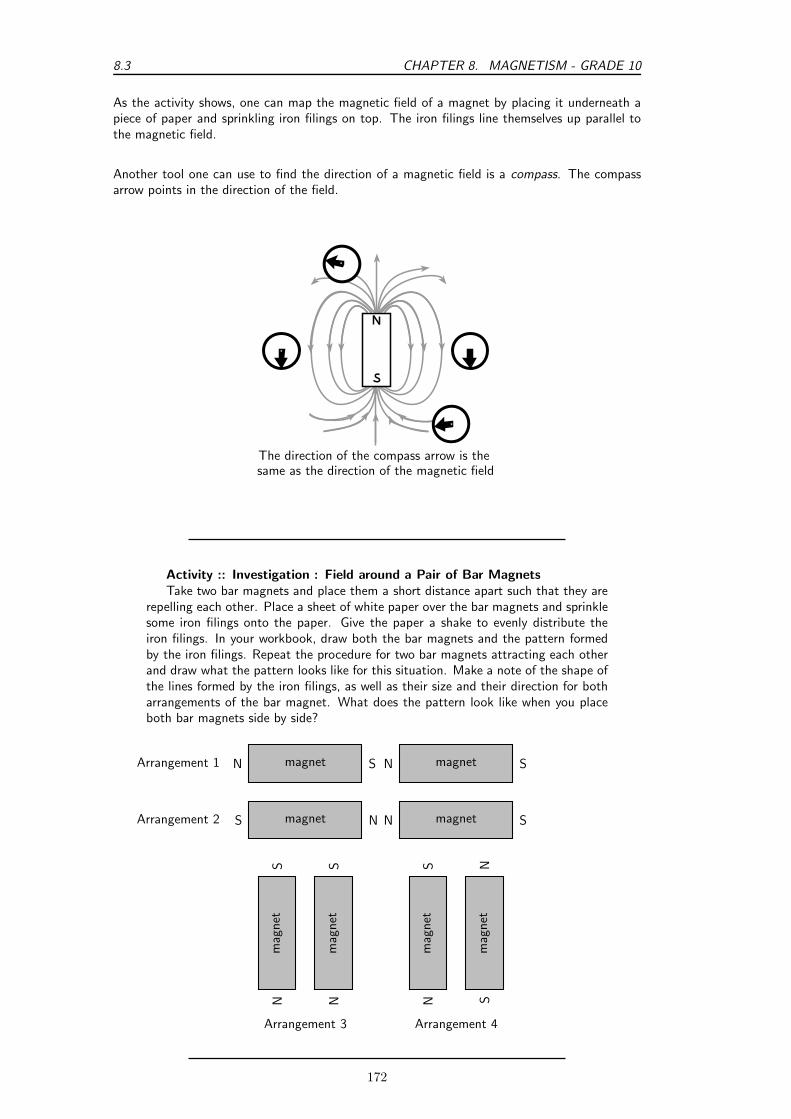
8.3 CHAPTER 8. MAGNETISM - GRADE 10
As the activity shows, one can map the magnetic field of a magnet by placing it underneath apiece of paper and sprinkling iron filings on top. The iron filings line themselves up parallel tothe magnetic field.
Another tool one can use to find the direction of a magnetic field is a compass. The compassarrow points in the direction of the field.
The direction of the compass arrow is thesame as the direction of the magnetic field
Activity :: Investigation : Field around a Pair of Bar MagnetsTake two bar magnets and place them a short distance apart such that they are
repelling each other. Place a sheet of white paper over the bar magnets and sprinklesome iron filings onto the paper. Give the paper a shake to evenly distribute theiron filings. In your workbook, draw both the bar magnets and the pattern formedby the iron filings. Repeat the procedure for two bar magnets attracting each otherand draw what the pattern looks like for this situation. Make a note of the shape ofthe lines formed by the iron filings, as well as their size and their direction for botharrangements of the bar magnet. What does the pattern look like when you placeboth bar magnets side by side?
magnetN S magnetN SArrangement 1
magnetS N magnetN SArrangement 2
mag
net
NS
mag
net
NS
Arrangement 3
mag
net
NS
mag
net
SN
Arrangement 4
172

CHAPTER 8. MAGNETISM - GRADE 10 8.4
As already said, opposite poles of a magnet attract each other and bringing them together causestheir magnetic field lines to converge (come together). Like poles of a magnet repel each otherand bringing them together causes their magnetic field lines to diverge (bend out from eachother).
N NS S
Like poles repel each other
The field lines between 2 like poles diverge
N SS N
Unlike poles attract each other
The magnetic field lines between 2 unlike poles converge
Extension: Ferromagnetism and Retentivity
Ferromagnetism is a phenomenon shown by materials like iron, nickel or cobalt.These materials can form permanent magnets. They always magnetise so as tobe attracted to a magnet, no matter which magnetic pole is brought toward theunmagnetised iron/nickel/cobalt.The ability of a ferromagnetic material to retain its magnetisation after an externalfield is removed is called its retentivity.Paramagnetic materials are materials like aluminium or platinum, which becomemagnetised in an external magnetic field in a similar way to ferromagnetic materials.However, they lose their magnetism when the external magnetic field is removed.Diamagnetism is shown by materials like copper or bismuth, which become mag-netised in a magnetic field with a polarity opposite to the external magnetic field.Unlike iron, they are slightly repelled by a magnet.
8.4 The compass and the earth’s magnetic field
A compass is an instrument which is used to find the direction of a magnetic field. It can dothis because a compass consists of a small metal needle which is magnetised itself and which isfree to turn in any direction. Therefore, when in the presence of a magnetic field, the needle isable to line up in the same direction as the field.
Interesting
Fact
teresting
FactLodestone, a magnetised form of iron-oxide, was found to orientate itself in anorth-south direction if left free to rotate by suspension on a string or on a floatin water. Lodestone was therefore used as an early navigational compass.
173

8.4 CHAPTER 8. MAGNETISM - GRADE 10
Compasses are mainly used in navigation to find direction on the earth. This works because theearth itself has a magnetic field which is similar to that of a bar magnet (see the picture below).The compass needle aligns with the magnetic field direction and points north (or south). Onceyou know where north is, you can figure out any other direction. A picture of a compass is shownbelow:
N
S
W E
NW NE
SW SE
magnetised needle
pivot
Some animals can detect magnetic fields, which helps them orientate themselves and find di-rection. Animals which can do this include pigeons, bees, Monarch butterflies, sea turtles andfish.
174

CHAPTER 8. MAGNETISM - GRADE 10 8.5
8.4.1 The earth’s magnetic field
In the picture below, you can see a representation of the earth’s magnetic field which is verysimilar to the magnetic field of a giant bar magnet like the one on the right of the picture. Sothe earth has two sets of north poles and south poles: geographic poles and magnetic poles.
11.5o
Geographic North poleMagnetic ’North’ pole
S
N
The earth’s magnetic field is thought to be caused by churning liquid metals in the core whichcauses electric currents and a magnetic field. From the picture you can see that the directionof magnetic north and true north are not identical. The geographic north pole, which is thepoint through which the earth’s rotation axis goes, is about 11,5o away from the direction ofthe magnetic north pole (which is where a compass will point). However, the magnetic polesshift slightly all the time.
Another interesting thing to note is that if we think of the earth as a big bar magnet, and weknow that magnetic field lines always point from north to south, then the compass tells us thatwhat we call the magnetic north pole is actually the south pole of the bar magnet!
Interesting
Fact
teresting
FactThe direction of the earth’s magnetic field flips direction about once every
200 000 years! You can picture this as a bar magnet whose north and south poleperiodically switch sides. The reason for this is still not fully understood.
The earth’s magnetic field is very important for humans and other animals on earth because itstops charged particles emitted by the sun from hitting the earth and us. Charged particles canalso damage and cause interference with telecommunications (such as cell phones). Chargedparticles (mainly protons and electrons) are emitted by the sun in what is called the solar wind,and travel towards the earth. These particles spiral in the earth’s magnetic field towards thepoles. If they collide with other particles in the earth’s atmosphere they sometimes cause red orgreen lights or a glow in the sky which is called the aurora. This happens close to the north andsouth pole and so we cannot see the aurora from South Africa.
8.5 Summary
1. Magnets have two poles - North and South.
175

8.6 CHAPTER 8. MAGNETISM - GRADE 10
2. Some substances can be easily magnetised.
3. Like poles repel each other and unlike poles attract each other.
4. The Earth also has a magnetic field.
5. A compass can be used to find the magnetic north pole and help us find our direction.
8.6 End of chapter exercises
1. Describe what is meant by the term magnetic field.
2. Use words and pictures to explain why permanent magnets have a magnetic field aroundthem. Refer to domains in your explanation.
3. What is a magnet?
4. What happens to the poles of a magnet if it is cut into pieces?
5. What happens when like magnetic poles are brought close together?
6. What happens when unlike magnetic poles are brought close together?
7. Draw the shape of the magnetic field around a bar magnet.
8. Explain how a compass indicates the direction of a magnetic field.
9. Compare the magnetic field of the Earth to the magnetic field of a bar magnet using wordsand diagrams.
10. Explain the difference between the geographical north pole and the magnetic north poleof the Earth.
11. Give examples of phenomena that are affected by Earth’s magnetic field.
12. Draw a diagram showing the magnetic field around the Earth.
176

Chapter 9
Electrostatics - Grade 10
9.1 Introduction
Electrostatics is the study of electric charge which is static (not moving).
9.2 Two kinds of charge
All objects surrounding us (including people!) contain large amounts of electric charge. Thereare two types of electric charge: positive charge and negative charge. If the same amountsof negative and positive charge are brought together, they neutralise each other and there isno net charge. Neutral objects are objects which contain positive and negative charges, but inequal numbers. However, if there is a little bit more of one type of charge than the other on theobject then the object is said to be electrically charged. The picture below shows what thedistribution of charges might look like for a neutral, positively charged and negatively chargedobject.
++
++
+
+--
--
--
+
++
+
+
++
+--
- -
-
-- +
++
++
+ --
--
--
-
-
There are:
6 positive charges and6 negative charges
6 + (-6) = 0
There is zero net charge:
The object is neutral
8 positive charges and6 negative charges
8 + (-6) = 2
The net charge is +2
The object is positively charged
6 positive charges and9 negative charges
6 + (-9) = -3
The net charge is -3
The object is negatively charged
9.3 Unit of charge
Charge is measured in units called coulombs (C). A coulomb of charge is a very large charge.In electrostatics we therefore often work with charge in microcoulombs (1 µC = 1 × 10⁻⁶ C)and nanocoulombs (1 nC = 1 × 10⁻⁹ C).
9.4 Conservation of charge
Objects can become charged by contact or by rubbing them. This means that they can gainextra negative or positive charge. Charging happens when you, for example, rub your feet againstthe carpet. When you then touch something metallic or another person, you will feel a shock as
177

9.5 CHAPTER 9. ELECTROSTATICS - GRADE 10
the excess charge that you have collected is discharged.
Important: Charge, just like energy, cannot be created or destroyed. We say that chargeis conserved.
When you rub your feet against the carpet, negative charge is transferred to you from the carpet.The carpet will then become positively charged by the same amount.
Another example is to take two neutral objects such as a plastic ruler and a cotton cloth(handkerchief). To begin, the two objects are neutral (i.e. have the same amounts of positiveand negative charge.)
+++++++++- - - - - - - - -+
++
+
+-
-
-
-
-
The ruler has 9 postive charges and
The neutral cotton cloth has5 positive charges and
5 negative charges
The total number of charges is:
(9+5)=14 positive charges(9+5)=14 negative charges
9 negative charges
BEFORE rubbing:
Now, if the cotton cloth is used to rub the ruler, negative charge is transferred from the cloth to
the ruler. The ruler is now negatively charged and the cloth is positively charged. If you countup all the positive and negative charges at the beginning and the end, there are still the sameamount. i.e. total charge has been conserved !
+++++++++- - - - - - - - -+
++
+
+--
-
--
The ruler has 9 postive charges and
The cotton cloth has5 positive charges and2 negative charges.
The total number of charges is:
(9+5)=14 positive charges(12+2)=14 negative charges
12 negative charges
AFTER rubbing:
It is now positively charged.
It is now negatively charged.
Charges have been transferred from thecloth to the ruler BUT total charge hasbeen conserved!
9.5 Force between Charges
The force exerted by non-moving (static) charges on each other is called the electrostatic force.The electrostatic force between:
• like charges is repulsive
• opposite (unlike) charges is attractive.
In other words, like charges repel each other while opposite charges attract each other. This isdifferent to the gravitational force which is only attractive.
F F- +
attractive force
F F- -
repulsive force
F F+ +
repulsive force
178

CHAPTER 9. ELECTROSTATICS - GRADE 10 9.5
The closer together the charges are, the stronger the electrostatic force between them.
weaker repulsive force
F F+ + stronger repulsive force
F F+ +
(shorter distance between charges)
(longer distance between charges)
Activity :: Experiment : Electrostatic Force
You can easily test that like charges repel and unlike charges attract each otherby doing a very simple experiment.
Take a glass rod and rub it with a piece of silk, then hang it from its middlewith a piece string so that it is free to move. If you then bring another glass rodwhich you have also charged in the same way next to it, you will see the rod on thestring turn away from the rod in your hand i.e. it is repelled. If, however, you takea plastic rod, rub it with a piece of fur and then bring it close to the rod on thestring, you will see the rod on the string turn towards the rod in your hand i.e. it isattracted.
//////////
F
F
+
++
+
++
+
++
++
+
//////////
F
F
+
++
+
++
-
--
--
--
This happens because when you rub the glass with silk, tiny amounts of negativecharge are transferred from the glass onto the silk, which causes the glass to haveless negative charge than positive charge, making it positively charged. When yourub the plastic rod with the fur, you transfer tiny amounts of negative charge ontothe rod and so it has more negative charge than positive charge on it, making itnegatively charged.
179

9.5 CHAPTER 9. ELECTROSTATICS - GRADE 10
Worked Example 41: Application of electrostatic forces
Question: Two charged metal spheres hang from strings and are free to move asshown in the picture below. The right hand sphere is positively charged. The chargeon the left hand sphere is unknown.
+?
The left sphere is now brought close to the right sphere.
1. If the left hand sphere swings towards the right hand sphere, what can you sayabout the charge on the left sphere and why?
2. If the left hand sphere swings away from the right hand sphere, what can yousay about the charge on the left sphere and why?
AnswerStep 1 : Identify what is known and what question you need to answer:In the first case, we have a sphere with positive charge which is attracting the leftcharged sphere. We need to find the charge on the left sphere.Step 2 : What concept is being used?We are dealing with electrostatic forces between charged objects. Therefore, weknow that like charges repel each other and opposite charges attract each other.Step 3 : Use the concept to find the solution
1. In the first case, the positively charged sphere is attracting the left sphere.Since an electrostatic force between unlike charges is attractive, the left spheremust be negatively charged.
2. In the second case, the positively charged sphere repels the left sphere. Likecharges repel each other. Therefore, the left sphere must now also be positively
charged.
Extension: Electrostatic Force
The electrostatic force determines the arrangement of charge on the surface of con-ductors. When we place a charge on a spherical conductor the repulsive forcesbetween the individual like charges cause them to spread uniformly over the sur-face of the sphere. However, for conductors with non-regular shapes, there is aconcentration of charge near the point or points of the object.
--
------ - -
-
---
---
------
- --
---
This collection of charge can actually allow charge to leak off the conductor if thepoint is sharp enough. It is for this reason that buildings often have a lightning rodon the roof to remove any charge the building has collected. This minimises thepossibility of the building being struck by lightning. This “spreading out” of chargewould not occur if we were to place the charge on an insulator since charge cannotmove in insulators.
180

CHAPTER 9. ELECTROSTATICS - GRADE 10 9.6
Interesting
Fact
teresting
FactThe word ‘electron’ comes from the Greek word for amber. The ancient Greeksobserved that if you rubbed a piece of amber, you could use it to pick up bits ofstraw.
9.6 Conductors and insulators
All atoms are electrically neutral i.e. they have the same amounts of negative and positive chargeinside them. By convention, the electrons carry negative charge and the protons carry positivecharge. The basic unit of charge, called the elementary charge, e, is the amount of charge carriedby one electron.
All the matter and materials on earth are made up of atoms. Some materials allow electrons tomove relatively freely through them (e.g. most metals, the human body). These materials arecalled conductors.
Other materials do not allow the charge carriers, the electrons, to move through them (e.g.plastic, glass). The electrons are bound to the atoms in the material. These materials are callednon-conductors or insulators.
If an excess of charge is placed on an insulator, it will stay where it is put and there will be aconcentration of charge in that area of the object. However, if an excess of charge is placed ona conductor, the like charges will repel each other and spread out over the surface of the object.When two conductors are made to touch, the total charge on them is shared between the two.If the two conductors are identical, then each conductor will be left with half of the total charge.
Extension: Charge and electrons
The basic unit of charge, namely the elementary charge is carried by the electron(equal to 1.602×10⁻¹⁹ C!). In a conducting material (e.g. copper), when the atomsbond to form the material, some of the outermost, loosely bound electrons becomedetached from the individual atoms and so become free to move around. The chargecarried by these electrons can move around in the material. In insulators, there arevery few, if any, free electrons and so the charge cannot move around in the material.
Worked Example 42: Conducting spheres and movement of charge
Question: I have 2 charged metal conducting spheres. Sphere A has a charge of -5nC and sphere B has a charge of -3 nC. I then bring the spheres together so thatthey touch each other. Afterwards I move the two spheres apart so that they are nolonger touching.
1. What happens to the charge on the two spheres?
2. What is the final charge on each sphere?
AnswerStep 1 : Identify what is known and what question/s we need to answer:We have two identical negatively charged conducting spheres which are broughttogether to touch each other and then taken apart again. We need to explain what
181

9.6 CHAPTER 9. ELECTROSTATICS - GRADE 10
happens to the charge on each sphere and what the final charge on each sphere isafter they are moved apart.
Step 2 : What concept is being used?
We know that the charge carriers in conductors are free to move around and thatcharge on a conductor spreads itself out on the surface of the conductor.
Step 3 : Use the concept to find the answer
1. When the two conducting spheres are brought together to touch, it is as thoughthey become one single big conductor and the total charge of the two spheresspreads out across the whole surface of the touching spheres. When the spheresare moved apart again, each one is left with half of the total original charge.
2. Before the spheres touch, the total charge is: -5 nC + (-3) nC = -8 nC. Whenthey touch they share out the -8 nC across their whole surface. When they areremoved from each other, each is left with half of the original charge:
−8 nC /2 = −4 nC
on each sphere.
9.6.1 The electroscope
The electroscope is a very sensitive instrument which can be used to detect electric charge. Adiagram of a gold leaf electroscope is shown the figure below. The electroscope consists of aglass container with a metal rod inside which has 2 thin pieces of gold foil attached. The otherend of the metal rod has a metal plate attached to it outside the glass container.
++++++++ ++
- - - - - - - ---
++
++++
++++ gold foil leaves
metal plate
charged rod
glass container
The electroscope detects charge in the following way: A charged object, like the positivelycharged rod in the picture, is brought close to (but not touching) the neutral metal plate ofthe electroscope. This causes negative charge in the gold foil, metal rod, and metal plate, tobe attracted to the positive rod. Because the metal (gold is a metal too!) is a conductor, thecharge can move freely from the foil up the metal rod and onto the metal plate. There is nowmore negative charge on the plate and more positive charge on the gold foil leaves. This iscalled inducing a charge on the metal plate. It is important to remember that the electroscopeis still neutral (the total positive and negative charges are the same), the charges have just beeninduced to move to different parts of the instrument! The induced positive charge on the goldleaves forces them apart since like charges repel! This is how we can tell that the rod is charged.If the rod is now moved away from the metal plate, the charge in the electroscope will spreaditself out evenly again and the leaves will fall down again because there will no longer be aninduced charge on them.
182

CHAPTER 9. ELECTROSTATICS - GRADE 10 9.7
Grounding
If you were to bring the charged rod close to the uncharged electroscope, and then you touchedthe metal plate with your finger at the same time, this would cause charge to flow up from theground (the earth), through your body onto the metal plate. This is called grounding. Thecharge flowing onto the plate is opposite to the charge on the rod, since it is attracted to therod. Therefore, for our picture, the charge flowing onto the plate would be negative. Nowcharge has been added to the electroscope. It is no longer neutral, but has an excess of negativecharge. Now if we move the rod away, the leaves will remain apart because they have an excessof negative charge and they repel each other.
- -
-
-
-
-
- --+
++
+
+
+
+
+ +
+
gold foil leaves with
metal plate
glass container
-
-
---
---
----
-
--
- excess of negative chargerepel each other
-
-
9.7 Attraction between charged and uncharged objects
9.7.1 Polarisation of Insulators
Unlike conductors, the electrons in insulators (non-conductors) are bound to the atoms of theinsulator and cannot move around freely in the material. However, a charged object can stillexert a force on a neutral insulator through the concept of polarisation.If a positively charged rod is brought close to a neutral insulator such as polystyrene, it canattract the bound electrons to move round to the side of the atoms which is closest to the rodand cause the positive nuclei to move slightly to the opposite side of the atoms. This process iscalled polarisation. Although it is a very small (microscopic) effect, if there are many atoms andthe polarised object is light (e.g. a small polystyrene ball), it can add up to enough force to beattracted onto the charged rod. Remember, that the polystyrene is only polarised, not charged.
The polystyrene ball is still neutral since no charge was added or removed from it. The pictureshows a not-to-scale view of the polarised atoms in the polystyrene ball:
++++
+++
+
+++++
++++-
+-
+-
+-
+-
+-
+-+
-+-+
-
+- +-
+-
+-
+-
+-+-+-+-
positivelycharged rod
polarisedpolystyrene ball
Some materials are made up of molecules which are already polarised. These are molecules whichhave a more positive and a more negative side but are still neutral overall. Just as a polarisedpolystyrene ball can be attracted to a charged rod, these materials are also affected if broughtclose to a charged object.
183

9.8 CHAPTER 9. ELECTROSTATICS - GRADE 10
Water is an example of a substance which is made of polarised molecules. If a positively chargedrod is brought close to a stream of water, the molecules can rotate so that the negative sides allline up towards the rod. The stream of water will then be attracted to the rod since oppositecharges attract.
9.8 Summary
1. Objects can be positively charged, negatively charged or neutral.
2. Objects that are neutral have equal numbers of positive and negative charge.
3. Unlike charges are attracted to each other and like charges are repelled from each other.
4. Charge is neither created nor destroyed, it can only be transferred.
5. Charge is measured in coulombs (C).
6. Conductors allow charge to move through them easily.
7. Insulators do not allow charge to move through them easily.
9.9 End of chapter exercise
1. What are the two types of charge called?
2. Provide evidence for the existence of two types of charge.
3. The electrostatic force between like charges is ????? while the electrostatic force betweenopposite charges is ?????.
4. I have two positively charged metal balls placed 2 m apart.
4.1 Is the electrostatic force between the balls attractive or repulsive?
4.2 If I now move the balls so that they are 1 m apart, what happens to the strength ofthe electrostatic force between them?
5. I have 2 charged spheres each hanging from string as shown in the picture below.
++
Choose the correct answer from the options below: The spheres will
5.1 swing towards each other due to the attractive electrostatic force between them.
5.2 swing away from each other due to the attractive electrostatic force between them.
5.3 swing towards each other due to the repulsive electrostatic force between them.
5.4 swing away from each other due to the repulsive electrostatic force between them.
6. Describe how objects (insulators) can be charged by contact or rubbing.
7. You are given a perspex ruler and a piece of cloth.
7.1 How would you charge the perspex ruler?
7.2 Explain how the ruler becomes charged in terms of charge.
7.3 How does the charged ruler attract small pieces of paper?
184

CHAPTER 9. ELECTROSTATICS - GRADE 10 9.9
8. [IEB 2005/11 HG] An uncharged hollow metal sphere is placed on an insulating stand. Apositively charged rod is brought up to touch the hollow metal sphere at P as shown inthe diagram below. It is then moved away from the sphere.
P+++
Where is the excess charge distributed on the sphere after the rod has been removed?
8.1 It is still located at point P where the rod touched the sphere.
8.2 It is evenly distributed over the outer surface of the hollow sphere.
8.3 It is evenly distributed over the outer and inner surfaces of the hollow sphere.
8.4 No charge remains on the hollow sphere.
9. What is the process called where molecules in an uncharged object are caused to align ina particular direction due to an external charge?
10. Explain how an uncharged object can be attracted to a charged object. You should usediagrams to illustrate your answer.
11. Explain how a stream of water can be attracted to a charged rod.
185

9.9 CHAPTER 9. ELECTROSTATICS - GRADE 10
186

Chapter 10
Electric Circuits - Grade 10
10.1 Electric Circuits
In South Africa, people depend on electricity to provide power for most appliances in the home,at work and out in the world in general. For example, flourescent lights, electric heating andcooking (on electric stoves), all depend on electricity to work. To realise just how big an impactelectricity has on our daily lives, just think about what happens when there is a power failure orload shedding.
Activity :: Discussion : Uses of electricityWith a partner, take the following topics and, for each topic, write down at least 5items/appliances/machines which need electricity to work. Try not to use the sameitem more than once.
• At home
• At school
• At the hospital
• In the city
Once you have finished making your lists, compare with the lists of other people inyour class. (Save your lists somewhere safe for later because there will be anotheractivity for which you’ll need them.)When you start comparing, you should notice that there are many different itemswhich we use in our daily lives which rely on electricity to work!
Important: Safety Warning: We believe in experimenting and learning about physics atevery opportunity, BUT playing with electricity can be EXTREMELY DANGEROUS! Donot try to build home made circuits alone. Make sure you have someone with you who knowsif what you are doing is safe. Normal electrical outlets are dangerous. Treat electricity withrespect in your everyday life.
10.1.1 Closed circuits
In the following activity we will investigate what is needed to cause charge to flow in an electriccircuit.
187

10.1 CHAPTER 10. ELECTRIC CIRCUITS - GRADE 10
Activity :: Experiment : Closed circuitsAim:To determine what is required to make electrical charges flow. In this experiment,we will use a lightbulb to check whether electrical charge is flowing in the circuit ornot. If charge is flowing, the lightbulb should glow. On the other hand, if no chargeis flowing, the lightbulb will not glow.Apparatus:You will need a small lightbulb which is attached to a metal conductor (e.g. a bulbfrom a school electrical kit), some connecting leads and a battery.Method:Take the apparatus items and try to connect them in a way that you cause the lightbulb to glow (i.e. charge flows in the circuit).Questions:
1. Once you have arranged your circuit elements to make the lightbulb glow, drawyour circuit.
2. What can you say about how the battery is connected? (i.e. does it have oneor two connecting leads attached? Where are they attached?)
3. What can you say about how the light bulb is connected in your circuit? (i.e.does it connect to one or two connecting leads, and where are they attached?)
4. Are there any items in your circuit which are not attached to something? Inother words, are there any gaps in your circuit?
Write down your conclusion about what is needed to make an electric circuit workand charge to flow.
In the experiment above, you will have seen that the light bulb only glows when there is a closed
circuit i.e. there are no gaps in the circuit and all the circuit elements are connected in a closed
loop. Therefore, in order for charges to flow, a closed circuit and an energy source (in this casethe battery) are needed. (Note: you do not have to have a lightbulb in the circuit! We used thisas a check that charge was flowing.)
Definition: Electric circuitAn electric circuit is a closed path (with no breaks or gaps) along which electrical charges(electrons) flow powered by an energy source.
10.1.2 Representing electric circuits
Components of electrical circuits
Some common elements (components) which can be found in electrical circuits include lightbulbs, batteries, connecting leads, switches, resistors, voltmeters and ammeters. You will learnmore about these items in later sections, but it is important to know what their symbols are andhow to represent them in circuit diagrams. Below is a table with the items and their symbols:
Circuit diagrams
Definition: Representing circuitsA physical circuit is the electric circuit you create with real components.A circuit diagram is a drawing which uses symbols to represent the different componentsin the physical circuit.
188
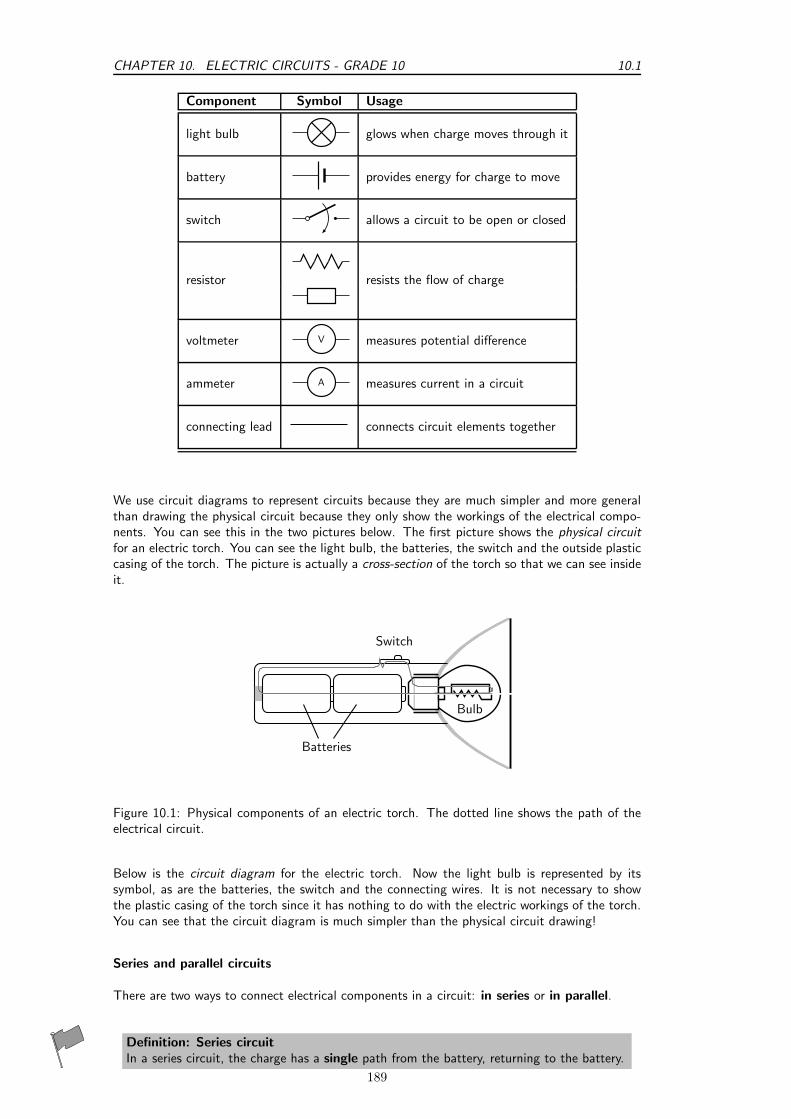
CHAPTER 10. ELECTRIC CIRCUITS - GRADE 10 10.1
Component Symbol Usage
light bulb glows when charge moves through it
battery provides energy for charge to move
switch allows a circuit to be open or closed
resistor resists the flow of charge
voltmeter V measures potential difference
ammeter A measures current in a circuit
connecting lead connects circuit elements together
We use circuit diagrams to represent circuits because they are much simpler and more generalthan drawing the physical circuit because they only show the workings of the electrical compo-nents. You can see this in the two pictures below. The first picture shows the physical circuit
for an electric torch. You can see the light bulb, the batteries, the switch and the outside plasticcasing of the torch. The picture is actually a cross-section of the torch so that we can see insideit.
Switch
Batteries
Bulb
Figure 10.1: Physical components of an electric torch. The dotted line shows the path of theelectrical circuit.
Below is the circuit diagram for the electric torch. Now the light bulb is represented by itssymbol, as are the batteries, the switch and the connecting wires. It is not necessary to showthe plastic casing of the torch since it has nothing to do with the electric workings of the torch.You can see that the circuit diagram is much simpler than the physical circuit drawing!
Series and parallel circuits
There are two ways to connect electrical components in a circuit: in series or in parallel.
Definition: Series circuitIn a series circuit, the charge has a single path from the battery, returning to the battery.
189

10.1 CHAPTER 10. ELECTRIC CIRCUITS - GRADE 10
2 Batteries
On/off switch
Lightbulb
Figure 10.2: Circuit diagram of an electric torch.
Definition: Parallel circuitIn a parallel circuit, the charge has multiple paths from the battery, returning to the battery.
The picture below shows a circuit with three resistors connected in series on the left and a circuitwith three resistors connected in parallel on the right:
R1
R3
R2
R2
R1
R3
3 resistors in a series circuit 3 resistors in a parallel circuit
Worked Example 43: Drawing circuits I
Question: Draw the circuit diagram for a circuit which has the following compo-nents:
1. 1 battery
2. 1 lightbulb connected in series
3. 2 resistors connected in parallel
AnswerStep 1 : Identify the components and their symbols and draw according tothe instructions:
resist
or
resist
or
light bulb
battery
190

CHAPTER 10. ELECTRIC CIRCUITS - GRADE 10 10.1
Worked Example 44: Drawing circuits II
Question: Draw the circuit diagram for a circuit which has the following compo-nents:
1. 3 batteries in series
2. 1 lightbulb connected in parallel with 1 resistor
3. a switch in series
AnswerStep 1 : Identify the symbol for each component and draw according to theinstructions:
light bulb
3 batteries
resistor
switch
Exercise: Circuits
1. Using physical components, set up the physical circuit which is described bythe circuit diagram below:
1.1 Now draw a picture of the physical circuit you have built.
2. Using physical components, set up a closed circuit which has one battery anda light bulb in series with a resistor.
2.1 Draw the physical circuit.
2.2 Draw the resulting circuit diagram.
2.3 How do you know that you have built a closed circuit? (What happens tothe light bulb?)
2.4 If you add one more resistor to your circuit (also in series), what do younotice? (What happens to the light from the light bulb?)
2.5 Draw the new circuit diagram which includes the second resistor.
3. Draw the circuit diagram for the following circuit: 2 batteries, a switch in seriesand 1 lightbulb which is in parallel with two resistors.
3.1 Now use physical components to set up the circuit.
191

10.2 CHAPTER 10. ELECTRIC CIRCUITS - GRADE 10
3.2 What happens when you close the switch? What does does this meanabout the circuit?
3.3 Draw the physical circuit.
Activity :: Discussion : Alternative EnergyAt the moment, electric power is produced by burning fossil fuels such as coal and oil.In South Africa, our main source of electric power is coal burning power stations. (Wealso have one nuclear power plant called Koeberg in the Western Cape). However,burning fossil fuels releases large amounts of pollution into the earth’s atmosphereand can contribute to global warming. Also, the earth’s fossil fuel reserves (especiallyoil) are starting to run low. For these reasons, people all across the world areworking to find alternative/other sources of energy and on ways to conserve/saveenergy. Other sources of energy include wind power, solar power (from the sun),hydro-electric power (from water) among others.With a partner, take out the lists you made earlier of the item/appliances/machineswhich used electricity in the following environments. For each item, try to think ofan alternative AND a way to conserve or save power.For example, if you had a flourescent light as an item used in the home, then:
• Alternative: use candles at supper time to reduce electricity consumption
• Conservation: turn off lights when not in a room, or during the day.
Topics:
• At home
• At school
• At the hospital
• In the city
Once you have finished making your lists, compare with the lists of other people inyour class.
10.2 Potential Difference
10.2.1 Potential Difference
When a circuit is connected and is a complete circuit charge can move through the circuit.Charge will not move unless there is a reason, a force. Think of it as though charge is at restand something has to push it along. This means that work needs to be done to make chargemove. A force acts on the charges, doing work, to make them move. The force is provided bythe battery in the circuit.
We call the moving charge ”current” and we will talk about this later.
The position of the charge in the circuit tells you how much potential energy it has because ofthe force being exerted on it. This is like the force from gravity, the higher an object is abovethe ground (position) the more potential energy it has.
The amount of work to move a charge from one point to another point is how much the potentialenergy has changed. This is the difference in potential energy, called potential difference. Noticethat it is a difference between the value of potential energy at two points so we say that potentialdifference is measured between or across two points. We do not say potential difference throughsomething.
192

CHAPTER 10. ELECTRIC CIRCUITS - GRADE 10 10.2
Definition: Potential DifferenceElectrical potential difference as the difference in electrical potential energy per unit chargebetween two points. The units of potential difference are the volt (V).
The units are volt (V), which is the same as joule per coulomb, the amount of work done perunit charge. Electrical potential difference is also called voltage.
10.2.2 Potential Difference and Parallel Resistors
When resistors are connected in parallel the start and end points for all the resistors are the same.These points have the same potential energy and so the potential difference between them is thesame no matter what is put in between them. You can have one, two or many resistors betweenthe two points, the potential difference will not change. You can ignore whatever componentsare between two points in a circuit when calculating the difference between the two points.
Look at the following circuit diagrams. The battery is the same in all cases, all that changes ismore resistors are added between the points marked by the black dots. If we were to measurethe potential difference between the two dots in these circuits we would get the same answer forall three cases.
b
b
b
b
b
b
Lets look at two resistors in parallel more closely. When you construct a circuit you use wires andyou might think that measuring the voltage in different places on the wires will make a difference.This is not true. The potential difference or voltage measurement will only be different if youmeasure a different set of components. All points on the wires that have no circuit componentsbetween them will give you the same measurements.
All three of the measurements shown in the picture below will give you the same voltages. Thedifferent measurement points on the left have no components between them so there is no changein potential energy. Exactly the same applies to the different points on the right. When youmeasure the potential difference between the points on the left and right you will get the sameanswer.
A B
C DE F
zooming in:
E F
A B
C D
b b
b b
b b
V
V
V
V = 5 V
V = 5 V
V = 5 V
193
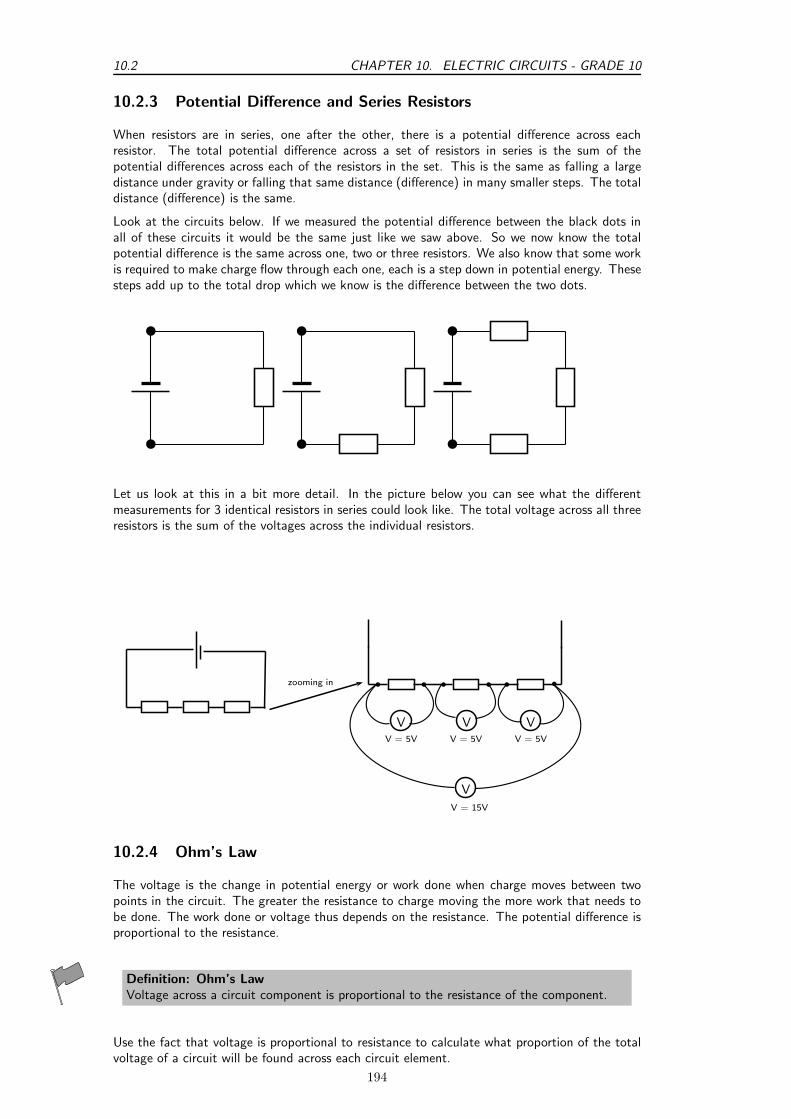
10.2 CHAPTER 10. ELECTRIC CIRCUITS - GRADE 10
10.2.3 Potential Difference and Series Resistors
When resistors are in series, one after the other, there is a potential difference across eachresistor. The total potential difference across a set of resistors in series is the sum of thepotential differences across each of the resistors in the set. This is the same as falling a largedistance under gravity or falling that same distance (difference) in many smaller steps. The totaldistance (difference) is the same.
Look at the circuits below. If we measured the potential difference between the black dots inall of these circuits it would be the same just like we saw above. So we now know the totalpotential difference is the same across one, two or three resistors. We also know that some workis required to make charge flow through each one, each is a step down in potential energy. Thesesteps add up to the total drop which we know is the difference between the two dots.
b
b
b
b
b
b
Let us look at this in a bit more detail. In the picture below you can see what the differentmeasurements for 3 identical resistors in series could look like. The total voltage across all threeresistors is the sum of the voltages across the individual resistors.
b b b b b b
V V V
V
V = 5V V = 5V V = 5V
V = 15V
zooming in
10.2.4 Ohm’s Law
The voltage is the change in potential energy or work done when charge moves between twopoints in the circuit. The greater the resistance to charge moving the more work that needs tobe done. The work done or voltage thus depends on the resistance. The potential difference isproportional to the resistance.
Definition: Ohm’s LawVoltage across a circuit component is proportional to the resistance of the component.
Use the fact that voltage is proportional to resistance to calculate what proportion of the totalvoltage of a circuit will be found across each circuit element.
194
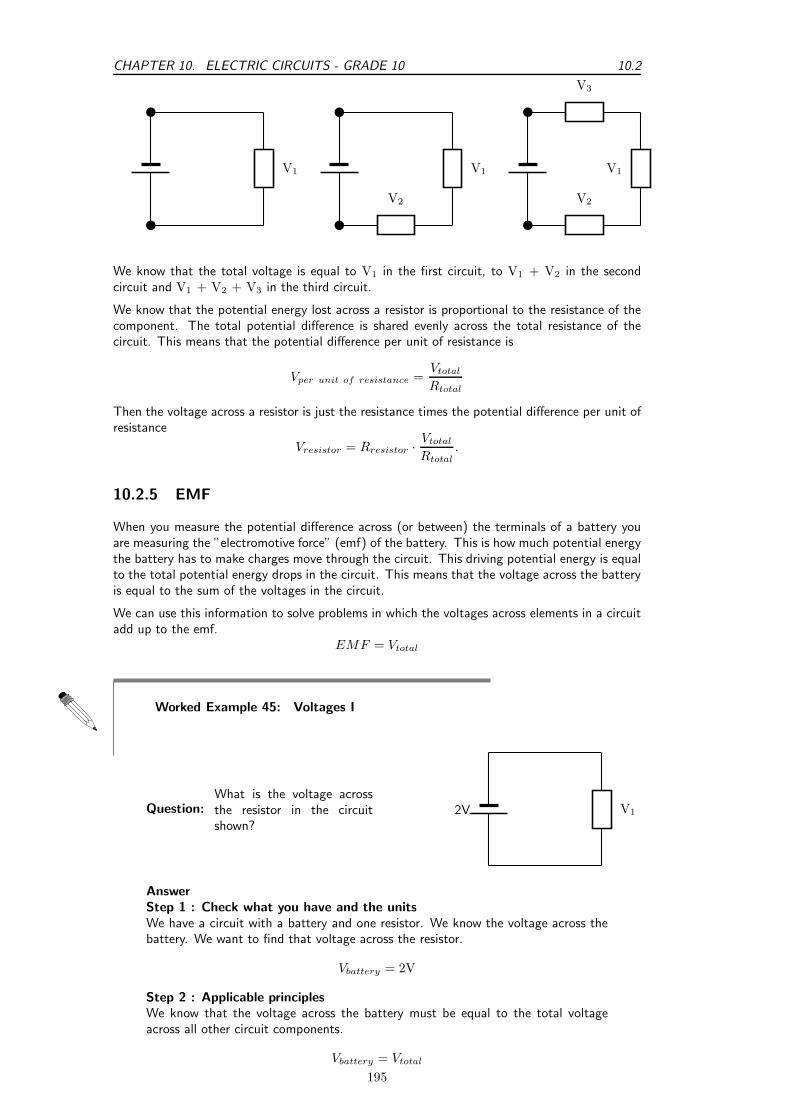
CHAPTER 10. ELECTRIC CIRCUITS - GRADE 10 10.2
b
b
V1
b
b
V1
V2
b
b
V2
V1
V3
We know that the total voltage is equal to V1 in the first circuit, to V1 + V2 in the secondcircuit and V1 + V2 + V3 in the third circuit.
We know that the potential energy lost across a resistor is proportional to the resistance of thecomponent. The total potential difference is shared evenly across the total resistance of thecircuit. This means that the potential difference per unit of resistance is
Vper unit of resistance =Vtotal
Rtotal
Then the voltage across a resistor is just the resistance times the potential difference per unit ofresistance
Vresistor = Rresistor ·Vtotal
Rtotal
.
10.2.5 EMF
When you measure the potential difference across (or between) the terminals of a battery youare measuring the ”electromotive force” (emf) of the battery. This is how much potential energythe battery has to make charges move through the circuit. This driving potential energy is equalto the total potential energy drops in the circuit. This means that the voltage across the batteryis equal to the sum of the voltages in the circuit.
We can use this information to solve problems in which the voltages across elements in a circuitadd up to the emf.
EMF = Vtotal
Worked Example 45: Voltages I
Question:What is the voltage acrossthe resistor in the circuitshown?
2V V1
AnswerStep 1 : Check what you have and the unitsWe have a circuit with a battery and one resistor. We know the voltage across thebattery. We want to find that voltage across the resistor.
Vbattery = 2V
Step 2 : Applicable principlesWe know that the voltage across the battery must be equal to the total voltageacross all other circuit components.
Vbattery = Vtotal
195
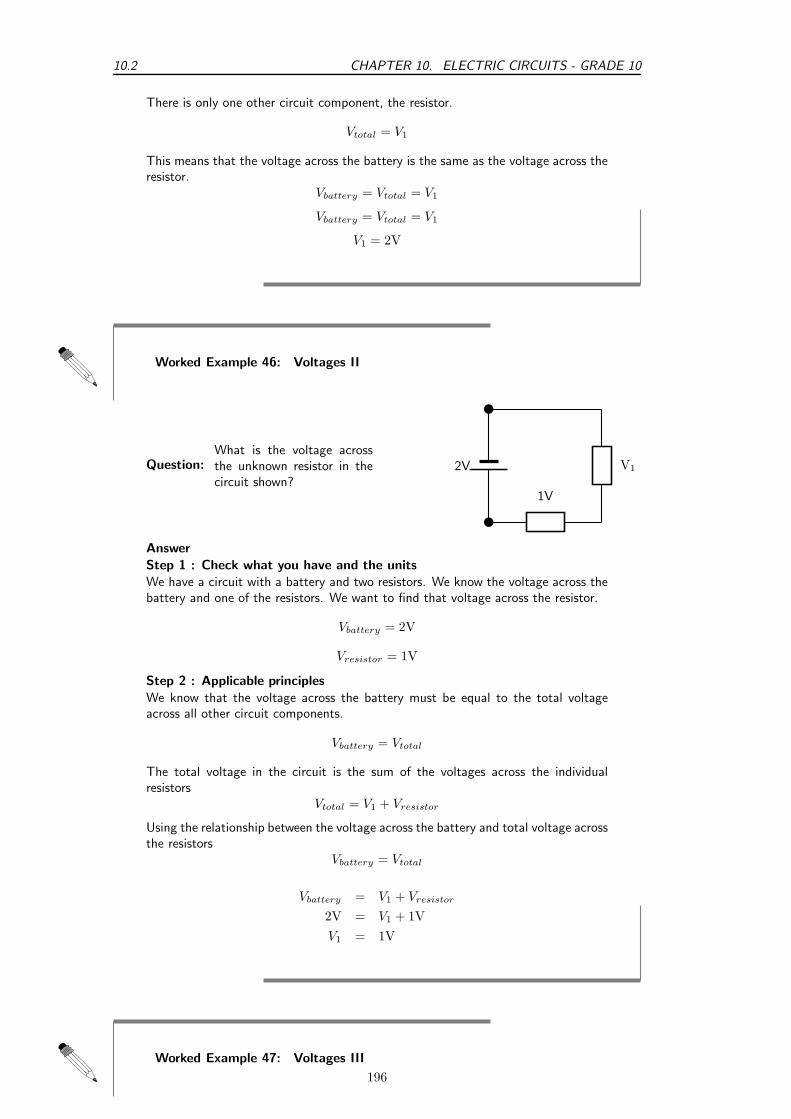
10.2 CHAPTER 10. ELECTRIC CIRCUITS - GRADE 10
There is only one other circuit component, the resistor.
Vtotal = V1
This means that the voltage across the battery is the same as the voltage across theresistor.
Vbattery = Vtotal = V1
Vbattery = Vtotal = V1
V1 = 2V
Worked Example 46: Voltages II
Question:What is the voltage acrossthe unknown resistor in thecircuit shown?
b
b
2V
1V
V1
Answer
Step 1 : Check what you have and the units
We have a circuit with a battery and two resistors. We know the voltage across thebattery and one of the resistors. We want to find that voltage across the resistor.
Vbattery = 2V
Vresistor = 1V
Step 2 : Applicable principles
We know that the voltage across the battery must be equal to the total voltageacross all other circuit components.
Vbattery = Vtotal
The total voltage in the circuit is the sum of the voltages across the individualresistors
Vtotal = V1 + Vresistor
Using the relationship between the voltage across the battery and total voltage acrossthe resistors
Vbattery = Vtotal
Vbattery = V1 + Vresistor
2V = V1 + 1V
V1 = 1V
Worked Example 47: Voltages III
196

CHAPTER 10. ELECTRIC CIRCUITS - GRADE 10 10.2
Question:What is the voltage acrossthe unknown resistor in thecircuit shown?
7V
4V
V1
1V
AnswerStep 1 : Check what you have and the unitsWe have a circuit with a battery and three resistors. We know the voltage across thebattery and two of the resistors. We want to find that voltage across the unknownresistor.
Vbattery = 7V
Vknown = 1V + 4V
Step 2 : Applicable principlesWe know that the voltage across the battery must be equal to the total voltageacross all other circuit components.
Vbattery = Vtotal
The total voltage in the circuit is the sum of the voltages across the individualresistors
Vtotal = V1 + Vknown
Using the relationship between the voltage across the battery and total voltage acrossthe resistors
Vbattery = Vtotal
Vbattery = V1 + Vknown
7V = V1 + 5V
V1 = 2V
Worked Example 48: Voltages IV
Question:
What is the voltage acrossthe parallel resistor combi-nation in the circuit shown?Hint: the rest of the circuitis the same as the previousproblem.
7V
4V
1V
AnswerStep 1 : Quick AnswerThe circuit is the same as the previous example and we know that the voltagedifference between two points in a circuit does not depend on what is between themso the answer is the same as above Vparallel = 2V.Step 2 : Check what you have and the units - long answerWe have a circuit with a battery and three resistors. We know the voltage acrossthe battery and two of the resistors. We want to find that voltage across the parallelresistors, Vparallel.
Vbattery = 7V
197

10.3 CHAPTER 10. ELECTRIC CIRCUITS - GRADE 10
Vknown = 1V + 4V
Step 3 : Applicable principlesWe know that the voltage across the battery must be equal to the total voltageacross all other circuit components.
Vbattery = Vtotal
The total voltage in the circuit is the sum of the voltages across the individualresistors
Vtotal = Vparallel + Vknown
Using the relationship between the voltage across the battery and total voltage acrossthe resistors
Vbattery = Vtotal
Vbattery = Vparallel + Vknown
7V = V1 + 5V
Vparallel = 2V
10.3 Current
10.3.1 Flow of Charge
We have been talking about moving charge. We need to be able to deal with numbers, howmuch charge is moving, how fast is it moving? The concept that gives us this information iscalled current. Current allows us to quantify the movement of charge.
When we talk about current we talk about how much charge moves past a fixed point in circuitin one second. Think of charges being pushed around the circuit by the battery, there are chargesin the wires but unless there is a battery they won’t move. When one charge moves the chargesnext to it also move. They keep their spacing. If you had a tube of marbles like in this picture.
marble marble
If you push one marble into the tube one must come out the other side. If you look at any pointin the tube and push one marble into the tube, one marble will move past the point you arelooking at. This is similar to charges in the wires of a circuit.
If a charge moves they all move and the same number move at every point in the circuit.
10.3.2 Current
Now that we’ve thought about the moving charges and visualised what is happening we needto get back to quantifying moving charge. I’ve already told you that we use current but we stillneed to define it.
Definition: CurrentCurrent is the rate at which charges moves past a fixed point in a circuit. We use thesymbol I to show current and it is measured in amperes (A). One ampere is one coulombof charge moving in one second.
I =Q
∆t
When current flows in a circuit we show this on a diagram by adding arrows. The arrows showthe direction of flow in a circuit. By convention we say that charge flows from the positiveterminal on a battery to the negative terminal.
198

CHAPTER 10. ELECTRIC CIRCUITS - GRADE 10 10.3
10.3.3 Series Circuits
In a series circuit, the charge has a single path from the battery, returning to the battery.
R
R
RE
The arrows in this picture show you the direction that charge will flow in the circuit. They don’tshow you much charge will flow, only the direction.
Interesting
Fact
teresting
FactBenjamin Franklin made a guess about the direction of charge flow when rubbingsmooth wax with rough wool. He thought that the charges flowed from the wax tothe wool (i.e. from positive to negative) which was opposite to the real direction.Due to this, electrons are said to have a negative charge and so objects which BenFranklin called “negative” (meaning a shortage of charge) really have an excessof electrons. By the time the true direction of electron flow was discovered, theconvention of “positive” and “negative” had already been so well accepted in thescientific world that no effort was made to change it.
Important: A cell does not produce the same amount of current no matter what isconnected to it. While the voltage produced by a cell is constant, the amount of currentsupplied depends on what is in the circuit.
How does the current through the battery in a circuit with several resistors in series compare tothe current in a circuit with a single resistor?
Activity :: Experiment : Current in Series CircuitsAim:To determine the effect of multiple resistors on current in a circuitApparatus:
• Battery
• Resistors
• Light bulb
• Wires
199
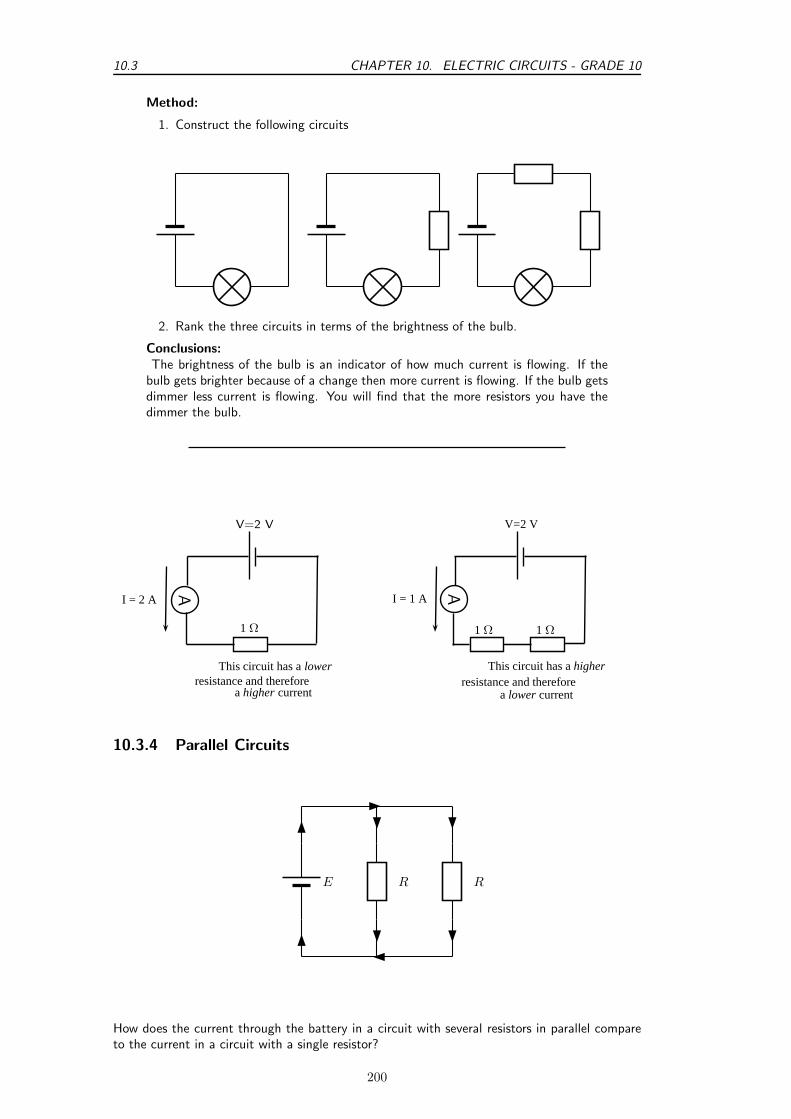
10.3 CHAPTER 10. ELECTRIC CIRCUITS - GRADE 10
Method:
1. Construct the following circuits
2. Rank the three circuits in terms of the brightness of the bulb.
Conclusions:The brightness of the bulb is an indicator of how much current is flowing. If the
bulb gets brighter because of a change then more current is flowing. If the bulb getsdimmer less current is flowing. You will find that the more resistors you have thedimmer the bulb.
A A
V=2 V V=2 V
1 Ω 1 Ω 1 Ω
I = 2 A I = 1 A
This circuit has ahigherresistance and therefore
a lower current
This circuit has alowerresistance and therefore
a higher current
10.3.4 Parallel Circuits
RRE
How does the current through the battery in a circuit with several resistors in parallel compareto the current in a circuit with a single resistor?
200

CHAPTER 10. ELECTRIC CIRCUITS - GRADE 10 10.3
Activity :: Experiment : Current in Series Circuits
Aim:
To determine the effect of multiple resistors on current in a circuit
Apparatus:
• Battery
• Resistors
• Light bulb
• Wires
Method:
1. Construct the following circuits
2. Rank the three circuits in terms of the brightness of the bulb.
Conclusions:
The brightness of the bulb is an indicator of how much current is flowing. If thebulb gets brighter because of a change then more current is flowing. If the bulb getsdimmer less current is flowing. You will find that the more resistors you have thebrighter the bulb.
Why is this the case? Why do more resistors make it easier for charge to flow in the circuit?It is because they are in parallel so there are more paths for charge to take to move. You canthink of it like a highway with more lanes, or the tube of marbles splitting into multiple paralleltubes. The more branches there are, the easier it is for charge to flow. You will learn more aboutthe total resistance of parallel resistors later but always remember that more resistors in parallelmean more pathways. In series the pathways come one after the other so it does not make iteasier for charge to flow.
A A
V=2 V V=2 V
1 Ω1 Ω
I = 2 A I = 4 A
1 Ω
the 2 resistors in parallel result in a
lower total resistance and thereforea higher current in the circuit
201

10.4 CHAPTER 10. ELECTRIC CIRCUITS - GRADE 10
10.4 Resistance
10.4.1 What causes resistance?
We have spoken about resistors that slow down the flow of charge in a conductor. On amicroscopic level, electrons moving through the conductor collide with the particles of whichthe conductor (metal) is made. When they collide, they transfer kinetic energy. The electronstherefore lose kinetic energy and slow down. This leads to resistance. The transferred energycauses the conductor to heat up. You can feel this directly if you touch a cellphone charger whenyou are charging a cell phone - the charger gets warm!
Definition: ResistanceResistance slows down the flow of charge in a circuit. We use the symbol R to showresistance and it is measured in units called Ohms with the symbol Ω.
1 Ohm = 1Volt
Ampere.
All conductors have some resistance. For example, a piece of wire has less resistance than a lightbulb, but both have resistance. The high resistance of the filament (small wire) in a lightbulbcauses the electrons to transfer a lot of their kinetic energy in the form of heat. The heat energyis enough to cause the filament to glow white-hot which produces light. The wires connectingthe lamp to the cell or battery hardly even get warm while conducting the same amount ofcurrent. This is because of their much lower resistance due to their larger cross-section (theyare thicker).
An important effect of a resistor is that it converts electrical energy into other forms of energy,such as heat and light.
Interesting
Fact
teresting
FactThere is a special type of conductor, called a superconductor that has noresistance, but the materials that make up superconductors only start supercon-ducting at very low temperatures (approximately -170C).
Why do batteries go flat?
A battery stores chemical potential energy. When it is connected in a circuit, a chemical reactiontakes place inside the battery which converts chemical potential energy to electrical energywhich powers the electrons to move through the circuit. All the circuit elements (such as theconducting leads, resistors and lightbulbs) have some resistance to the flow of charge and convertthe electrical energy to heat and/or light. The battery goes flat when all its chemical potentialenergy has been converted into other forms of energy.
10.4.2 Resistors in electric circuits
It is important to understand what effect adding resistors to a circuit has on the total resistanceof a circuit and on the current that can flow in the circuit.
202

CHAPTER 10. ELECTRIC CIRCUITS - GRADE 10 10.4
Resistors in series
When we add resistors in series to a circuit, we increase the resistance to the flow of current.There is only one path that the current can flow down and the current is the same at all placesin the series circuit. Take a look at the diagram below: On the left there is a circuit with a singleresistor and a battery. No matter where we measure the current, it is the same in a series circuit.On the right, we have added a second resistor in series to the circuit. The total resistance ofthe circuit has increased and you can see from the reading on the ammeter that the current inthe circuit has decreased.
V = 2 V
R = 2 Ω
I = 0.67 A
Adding a resistor to the circuit
increases the total resistance
A
A
R = 1 Ω
I = 0.67 A
V = 2 V
R = 2 Ω
I = 1 A
The current in a series circuitis the same everywhere
A
A
I = 1 A
(the current issmaller)
smaller)(the current is
Resistors in parallel
In contrast to the series case, when we add resistors in parallel, we create more paths alongwhich current can flow. By doing this we decrease the total resistance of the circuit!
Take a look at the diagram below. On the left we have the same circuit as in the previousdiagram with a battery and a resistor. The ammeter shows a current of 1 ampere. On the rightwe have added a second resistor in parallel to the first resistor. This has increased the numberof paths (branches) the charge can take through the circuit - the total resistance has decreased.You can see that the current in the circuit has increased. Also notice that the current in thedifferent branches can be different.
Adding a resistor to the circuit inparallel decreases the total resistance
V = 2 V
R = 2 Ω
I = 1 AA
V = 2 V
R = 2 Ω
I = 3 AA
R = 1 Ω
A
A
I = 1 A
I = 2 A
The currentis bigger
Exercise: Resistance
1. What is the unit of resistance called and what is its symbol?
2. Explain what happens to the total resistance of a circuit when resistors areadded in series?
203

10.5 CHAPTER 10. ELECTRIC CIRCUITS - GRADE 10
3. Explain what happens to the total resistance of a circuit when resistors areadded in parallel?
4. Why do batteries go flat?
10.5 Instruments to Measure voltage, current and resis-tance
As we have seen in previous sections, an electric circuit is made up of a number of differentcomponents such as batteries, resistors and light bulbs. There are devices to measure theproperties of these components. These devices are called meters.
For example, one may be interested in measuring the amount of current flowing through a circuitusing an ammeter or measuring the voltage provided by a battery using a voltmeter. In thissection we will discuss the practical usage of voltmeters, ammeters, and ohmmeters.
10.5.1 Voltmeter
A voltmeter is an instrument for measuring the voltage between two points in an electric circuit.In analogy with a water circuit, a voltmeter is like a meter designed to measure pressure difference.Since one is interested in measuring the voltage between two points in a circuit, a voltmetermust be connected in parallel with the portion of the circuit on which the measurement is made.
V
Figure 10.3: A voltmeter should be connected in parallel in a circuit.
Figure 10.3 shows a voltmeter connected in parallel with a battery. One lead of the voltmeter isconnected to one end of the battery and the other lead is connected to the opposite end. Thevoltmeter may also be used to measure the voltage across a resistor or any other component ofa circuit that has a voltage drop.
10.5.2 Ammeter
An ammeter is an instrument used to measure the flow of electric current in a circuit. Since oneis interested in measuring the current flowing through a circuit component, the ammeter mustbe connected in series with the measured circuit component (Figure 10.4).
10.5.3 Ohmmeter
An ohmmeter is an instrument for measuring electrical resistance. The basic ohmmeter canfunction much like an ammeter. The ohmmeter works by suppling a constant voltage to theresistor and measuring the current flowing through it. The measured current is then convertedinto a corresponding resistance reading through Ohm’s Law. Ohmmeters only function correctlywhen measuring resistance that is not being powered by a voltage or current source. In otherwords, you cannot measure the resistance of a component that is already connected to a circuit.This is because the ohmmeter’s accurate indication depends only on its own source of voltage.
204
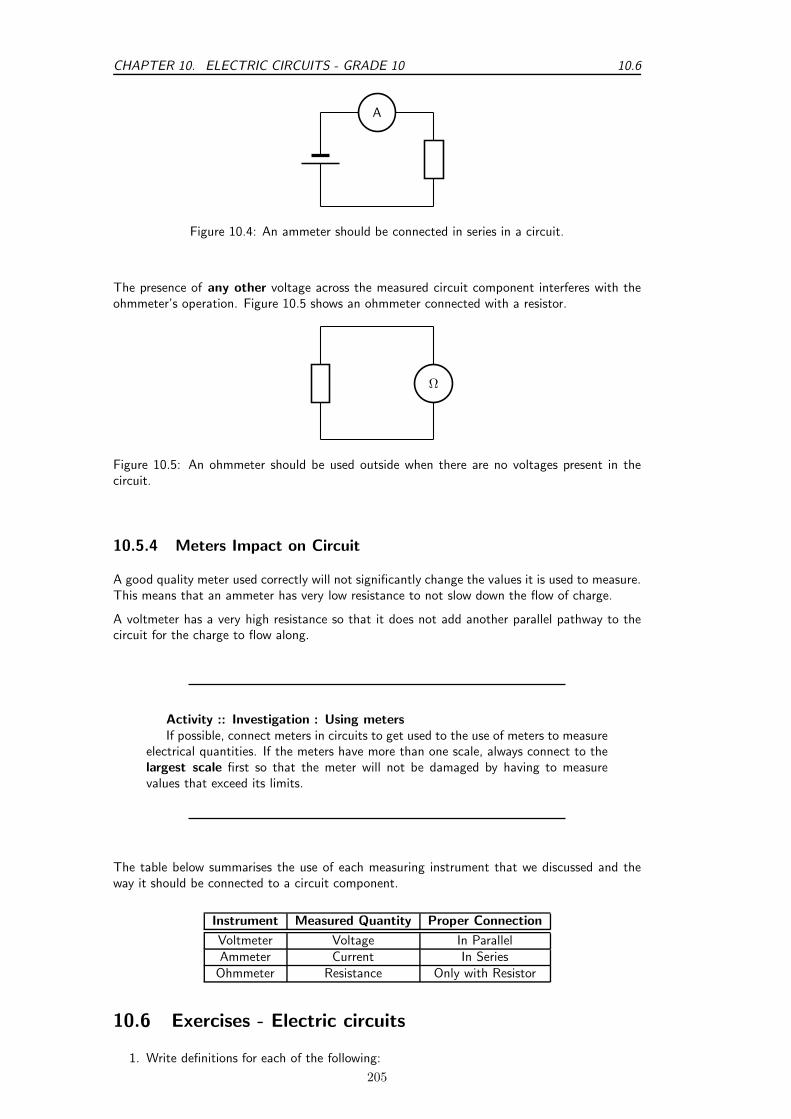
CHAPTER 10. ELECTRIC CIRCUITS - GRADE 10 10.6
A
Figure 10.4: An ammeter should be connected in series in a circuit.
The presence of any other voltage across the measured circuit component interferes with theohmmeter’s operation. Figure 10.5 shows an ohmmeter connected with a resistor.
Ω
Figure 10.5: An ohmmeter should be used outside when there are no voltages present in thecircuit.
10.5.4 Meters Impact on Circuit
A good quality meter used correctly will not significantly change the values it is used to measure.This means that an ammeter has very low resistance to not slow down the flow of charge.
A voltmeter has a very high resistance so that it does not add another parallel pathway to thecircuit for the charge to flow along.
Activity :: Investigation : Using metersIf possible, connect meters in circuits to get used to the use of meters to measure
electrical quantities. If the meters have more than one scale, always connect to thelargest scale first so that the meter will not be damaged by having to measurevalues that exceed its limits.
The table below summarises the use of each measuring instrument that we discussed and theway it should be connected to a circuit component.
Instrument Measured Quantity Proper Connection
Voltmeter Voltage In ParallelAmmeter Current In SeriesOhmmeter Resistance Only with Resistor
10.6 Exercises - Electric circuits
1. Write definitions for each of the following:
205
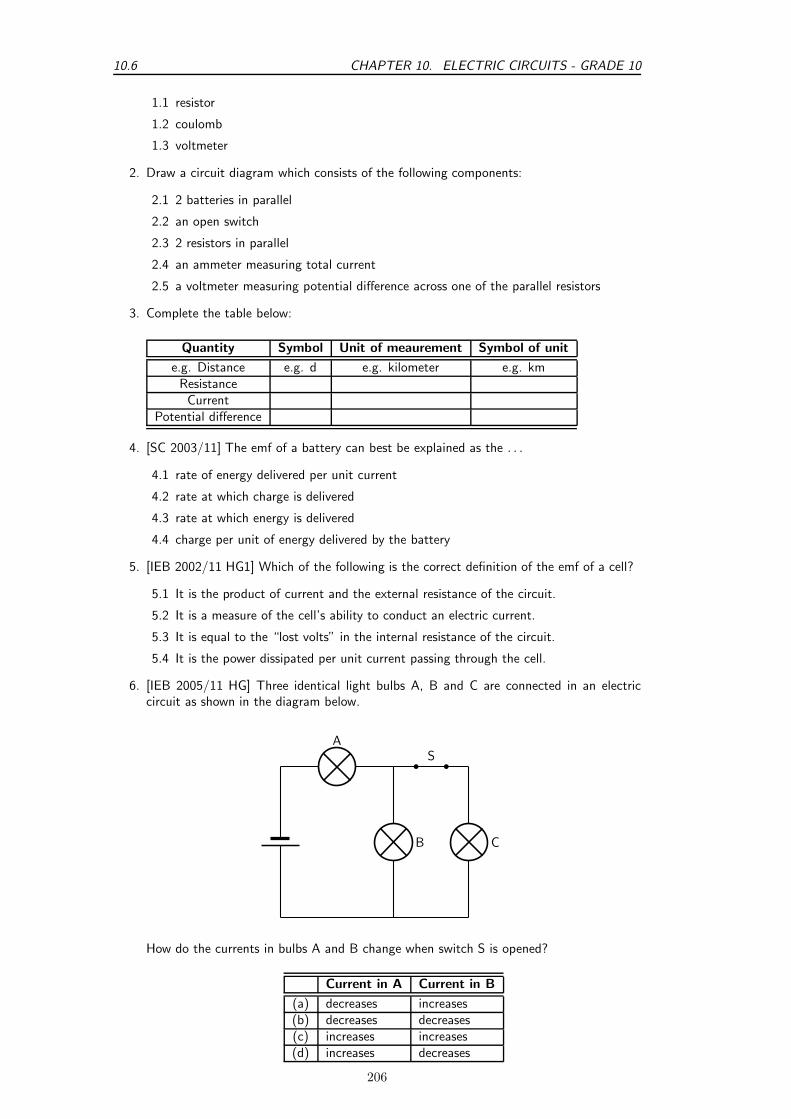
10.6 CHAPTER 10. ELECTRIC CIRCUITS - GRADE 10
1.1 resistor
1.2 coulomb
1.3 voltmeter
2. Draw a circuit diagram which consists of the following components:
2.1 2 batteries in parallel
2.2 an open switch
2.3 2 resistors in parallel
2.4 an ammeter measuring total current
2.5 a voltmeter measuring potential difference across one of the parallel resistors
3. Complete the table below:
Quantity Symbol Unit of meaurement Symbol of unit
e.g. Distance e.g. d e.g. kilometer e.g. kmResistanceCurrent
Potential difference
4. [SC 2003/11] The emf of a battery can best be explained as the . . .
4.1 rate of energy delivered per unit current
4.2 rate at which charge is delivered
4.3 rate at which energy is delivered
4.4 charge per unit of energy delivered by the battery
5. [IEB 2002/11 HG1] Which of the following is the correct definition of the emf of a cell?
5.1 It is the product of current and the external resistance of the circuit.
5.2 It is a measure of the cell’s ability to conduct an electric current.
5.3 It is equal to the “lost volts” in the internal resistance of the circuit.
5.4 It is the power dissipated per unit current passing through the cell.
6. [IEB 2005/11 HG] Three identical light bulbs A, B and C are connected in an electriccircuit as shown in the diagram below.
A
b b
S
CB
How do the currents in bulbs A and B change when switch S is opened?
Current in A Current in B
(a) decreases increases(b) decreases decreases(c) increases increases(d) increases decreases
206

CHAPTER 10. ELECTRIC CIRCUITS - GRADE 10 10.6
7. [IEB 2004/11 HG1] When a current I is maintained in a conductor for a time of t, howmany electrons with charge e pass any cross-section of the conductor per second?
7.1 It
7.2 It/e
7.3 Ite
7.4 e/It
207

10.6 CHAPTER 10. ELECTRIC CIRCUITS - GRADE 10
208

Appendix A
GNU Free Documentation License
Version 1.2, November 2002Copyright c© 2000,2001,2002 Free Software Foundation, Inc.59 Temple Place, Suite 330, Boston, MA 02111-1307 USAEveryone is permitted to copy and distribute verbatim copies of this license document, butchanging it is not allowed.
PREAMBLE
The purpose of this License is to make a manual, textbook, or other functional and usefuldocument “free” in the sense of freedom: to assure everyone the effective freedom to copy andredistribute it, with or without modifying it, either commercially or non-commercially.Secondarily, this License preserves for the author and publisher a way to get credit for theirwork, while not being considered responsible for modifications made by others.
This License is a kind of “copyleft”, which means that derivative works of the document mustthemselves be free in the same sense. It complements the GNU General Public License, whichis a copyleft license designed for free software.
We have designed this License in order to use it for manuals for free software, because freesoftware needs free documentation: a free program should come with manuals providing thesame freedoms that the software does. But this License is not limited to software manuals; itcan be used for any textual work, regardless of subject matter or whether it is published as aprinted book. We recommend this License principally for works whose purpose is instruction orreference.
APPLICABILITY AND DEFINITIONS
This License applies to any manual or other work, in any medium, that contains a notice placedby the copyright holder saying it can be distributed under the terms of this License. Such anotice grants a world-wide, royalty-free license, unlimited in duration, to use that work underthe conditions stated herein. The “Document”, below, refers to any such manual or work. Anymember of the public is a licensee, and is addressed as “you”. You accept the license if youcopy, modify or distribute the work in a way requiring permission under copyright law.
A “Modified Version” of the Document means any work containing the Document or a portionof it, either copied verbatim, or with modifications and/or translated into another language.
A “Secondary Section” is a named appendix or a front-matter section of the Document thatdeals exclusively with the relationship of the publishers or authors of the Document to theDocument’s overall subject (or to related matters) and contains nothing that could fall directlywithin that overall subject. (Thus, if the Document is in part a textbook of mathematics, a
677

APPENDIX A. GNU FREE DOCUMENTATION LICENSE
Secondary Section may not explain any mathematics.) The relationship could be a matter ofhistorical connection with the subject or with related matters, or of legal, commercial,philosophical, ethical or political position regarding them.
The “Invariant Sections” are certain Secondary Sections whose titles are designated, as beingthose of Invariant Sections, in the notice that says that the Document is released under thisLicense. If a section does not fit the above definition of Secondary then it is not allowed to bedesignated as Invariant. The Document may contain zero Invariant Sections. If the Documentdoes not identify any Invariant Sections then there are none.
The “Cover Texts” are certain short passages of text that are listed, as Front-Cover Texts orBack-Cover Texts, in the notice that says that the Document is released under this License. AFront-Cover Text may be at most 5 words, and a Back-Cover Text may be at most 25 words.
A “Transparent” copy of the Document means a machine-readable copy, represented in aformat whose specification is available to the general public, that is suitable for revising thedocument straightforwardly with generic text editors or (for images composed of pixels) genericpaint programs or (for drawings) some widely available drawing editor, and that is suitable forinput to text formatters or for automatic translation to a variety of formats suitable for input totext formatters. A copy made in an otherwise Transparent file format whose markup, orabsence of markup, has been arranged to thwart or discourage subsequent modification byreaders is not Transparent. An image format is not Transparent if used for any substantialamount of text. A copy that is not “Transparent” is called “Opaque”.
Examples of suitable formats for Transparent copies include plain ASCII without markup,Texinfo input format, LATEX input format, SGML or XML using a publicly available DTD andstandard-conforming simple HTML, PostScript or PDF designed for human modification.Examples of transparent image formats include PNG, XCF and JPG. Opaque formats includeproprietary formats that can be read and edited only by proprietary word processors, SGML orXML for which the DTD and/or processing tools are not generally available, and themachine-generated HTML, PostScript or PDF produced by some word processors for outputpurposes only.
The “Title Page” means, for a printed book, the title page itself, plus such following pages asare needed to hold, legibly, the material this License requires to appear in the title page. Forworks in formats which do not have any title page as such, “Title Page” means the text nearthe most prominent appearance of the work’s title, preceding the beginning of the body of thetext.
A section “Entitled XYZ” means a named subunit of the Document whose title either isprecisely XYZ or contains XYZ in parentheses following text that translates XYZ in anotherlanguage. (Here XYZ stands for a specific section name mentioned below, such as“Acknowledgements”, “Dedications”, “Endorsements”, or “History”.) To “Preserve the Title”of such a section when you modify the Document means that it remains a section “EntitledXYZ” according to this definition.
The Document may include Warranty Disclaimers next to the notice which states that thisLicense applies to the Document. These Warranty Disclaimers are considered to be included byreference in this License, but only as regards disclaiming warranties: any other implication thatthese Warranty Disclaimers may have is void and has no effect on the meaning of this License.
VERBATIM COPYING
You may copy and distribute the Document in any medium, either commercially ornon-commercially, provided that this License, the copyright notices, and the license noticesaying this License applies to the Document are reproduced in all copies, and that you add noother conditions whatsoever to those of this License. You may not use technical measures toobstruct or control the reading or further copying of the copies you make or distribute.However, you may accept compensation in exchange for copies. If you distribute a large enoughnumber of copies you must also follow the conditions in section A.
678

APPENDIX A. GNU FREE DOCUMENTATION LICENSE
You may also lend copies, under the same conditions stated above, and you may publiclydisplay copies.
COPYING IN QUANTITY
If you publish printed copies (or copies in media that commonly have printed covers) of theDocument, numbering more than 100, and the Document’s license notice requires Cover Texts,you must enclose the copies in covers that carry, clearly and legibly, all these Cover Texts:Front-Cover Texts on the front cover, and Back-Cover Texts on the back cover. Both coversmust also clearly and legibly identify you as the publisher of these copies. The front cover mustpresent the full title with all words of the title equally prominent and visible. You may addother material on the covers in addition. Copying with changes limited to the covers, as long asthey preserve the title of the Document and satisfy these conditions, can be treated asverbatim copying in other respects.
If the required texts for either cover are too voluminous to fit legibly, you should put the firstones listed (as many as fit reasonably) on the actual cover, and continue the rest onto adjacentpages.
If you publish or distribute Opaque copies of the Document numbering more than 100, youmust either include a machine-readable Transparent copy along with each Opaque copy, orstate in or with each Opaque copy a computer-network location from which the generalnetwork-using public has access to download using public-standard network protocols acomplete Transparent copy of the Document, free of added material. If you use the latteroption, you must take reasonably prudent steps, when you begin distribution of Opaque copiesin quantity, to ensure that this Transparent copy will remain thus accessible at the statedlocation until at least one year after the last time you distribute an Opaque copy (directly orthrough your agents or retailers) of that edition to the public.
It is requested, but not required, that you contact the authors of the Document well beforeredistributing any large number of copies, to give them a chance to provide you with anupdated version of the Document.
MODIFICATIONS
You may copy and distribute a Modified Version of the Document under the conditions ofsections A and A above, provided that you release the Modified Version under precisely thisLicense, with the Modified Version filling the role of the Document, thus licensing distributionand modification of the Modified Version to whoever possesses a copy of it. In addition, youmust do these things in the Modified Version:
1. Use in the Title Page (and on the covers, if any) a title distinct from that of theDocument, and from those of previous versions (which should, if there were any, be listedin the History section of the Document). You may use the same title as a previousversion if the original publisher of that version gives permission.
2. List on the Title Page, as authors, one or more persons or entities responsible forauthorship of the modifications in the Modified Version, together with at least five of theprincipal authors of the Document (all of its principal authors, if it has fewer than five),unless they release you from this requirement.
3. State on the Title page the name of the publisher of the Modified Version, as thepublisher.
4. Preserve all the copyright notices of the Document.
5. Add an appropriate copyright notice for your modifications adjacent to the othercopyright notices.
679
APPENDIX A. GNU FREE DOCUMENTATION LICENSE
6. Include, immediately after the copyright notices, a license notice giving the publicpermission to use the Modified Version under the terms of this License, in the formshown in the Addendum below.
7. Preserve in that license notice the full lists of Invariant Sections and required Cover Textsgiven in the Document’s license notice.
8. Include an unaltered copy of this License.
9. Preserve the section Entitled “History”, Preserve its Title, and add to it an item statingat least the title, year, new authors, and publisher of the Modified Version as given onthe Title Page. If there is no section Entitled “History” in the Document, create onestating the title, year, authors, and publisher of the Document as given on its Title Page,then add an item describing the Modified Version as stated in the previous sentence.
10. Preserve the network location, if any, given in the Document for public access to aTransparent copy of the Document, and likewise the network locations given in theDocument for previous versions it was based on. These may be placed in the “History”section. You may omit a network location for a work that was published at least fouryears before the Document itself, or if the original publisher of the version it refers togives permission.
11. For any section Entitled “Acknowledgements” or “Dedications”, Preserve the Title of thesection, and preserve in the section all the substance and tone of each of the contributoracknowledgements and/or dedications given therein.
12. Preserve all the Invariant Sections of the Document, unaltered in their text and in theirtitles. Section numbers or the equivalent are not considered part of the section titles.
13. Delete any section Entitled “Endorsements”. Such a section may not be included in theModified Version.
14. Do not re-title any existing section to be Entitled “Endorsements” or to conflict in titlewith any Invariant Section.
15. Preserve any Warranty Disclaimers.
If the Modified Version includes new front-matter sections or appendices that qualify asSecondary Sections and contain no material copied from the Document, you may at youroption designate some or all of these sections as invariant. To do this, add their titles to thelist of Invariant Sections in the Modified Version’s license notice. These titles must be distinctfrom any other section titles.
You may add a section Entitled “Endorsements”, provided it contains nothing but endorsementsof your Modified Version by various parties–for example, statements of peer review or that thetext has been approved by an organisation as the authoritative definition of a standard.
You may add a passage of up to five words as a Front-Cover Text, and a passage of up to 25words as a Back-Cover Text, to the end of the list of Cover Texts in the Modified Version.Only one passage of Front-Cover Text and one of Back-Cover Text may be added by (orthrough arrangements made by) any one entity. If the Document already includes a cover textfor the same cover, previously added by you or by arrangement made by the same entity youare acting on behalf of, you may not add another; but you may replace the old one, on explicitpermission from the previous publisher that added the old one.
The author(s) and publisher(s) of the Document do not by this License give permission to usetheir names for publicity for or to assert or imply endorsement of any Modified Version.
COMBINING DOCUMENTS
You may combine the Document with other documents released under this License, under theterms defined in section A above for modified versions, provided that you include in the
680

APPENDIX A. GNU FREE DOCUMENTATION LICENSE
combination all of the Invariant Sections of all of the original documents, unmodified, and listthem all as Invariant Sections of your combined work in its license notice, and that youpreserve all their Warranty Disclaimers.
The combined work need only contain one copy of this License, and multiple identical InvariantSections may be replaced with a single copy. If there are multiple Invariant Sections with thesame name but different contents, make the title of each such section unique by adding at theend of it, in parentheses, the name of the original author or publisher of that section if known,or else a unique number. Make the same adjustment to the section titles in the list of InvariantSections in the license notice of the combined work.
In the combination, you must combine any sections Entitled “History” in the various originaldocuments, forming one section Entitled “History”; likewise combine any sections Entitled“Acknowledgements”, and any sections Entitled “Dedications”. You must delete all sectionsEntitled “Endorsements”.
COLLECTIONS OF DOCUMENTS
You may make a collection consisting of the Document and other documents released underthis License, and replace the individual copies of this License in the various documents with asingle copy that is included in the collection, provided that you follow the rules of this Licensefor verbatim copying of each of the documents in all other respects.
You may extract a single document from such a collection, and distribute it individually underthis License, provided you insert a copy of this License into the extracted document, and followthis License in all other respects regarding verbatim copying of that document.
AGGREGATION WITH INDEPENDENT WORKS
A compilation of the Document or its derivatives with other separate and independentdocuments or works, in or on a volume of a storage or distribution medium, is called an“aggregate” if the copyright resulting from the compilation is not used to limit the legal rightsof the compilation’s users beyond what the individual works permit. When the Document isincluded an aggregate, this License does not apply to the other works in the aggregate whichare not themselves derivative works of the Document.
If the Cover Text requirement of section A is applicable to these copies of the Document, thenif the Document is less than one half of the entire aggregate, the Document’s Cover Texts maybe placed on covers that bracket the Document within the aggregate, or the electronicequivalent of covers if the Document is in electronic form. Otherwise they must appear onprinted covers that bracket the whole aggregate.
TRANSLATION
Translation is considered a kind of modification, so you may distribute translations of theDocument under the terms of section A. Replacing Invariant Sections with translations requiresspecial permission from their copyright holders, but you may include translations of some or allInvariant Sections in addition to the original versions of these Invariant Sections. You mayinclude a translation of this License, and all the license notices in the Document, and anyWarranty Disclaimers, provided that you also include the original English version of this Licenseand the original versions of those notices and disclaimers. In case of a disagreement betweenthe translation and the original version of this License or a notice or disclaimer, the originalversion will prevail.
If a section in the Document is Entitled “Acknowledgements”, “Dedications”, or “History”, therequirement (section A) to Preserve its Title (section A) will typically require changing the
681

APPENDIX A. GNU FREE DOCUMENTATION LICENSE
actual title.
TERMINATION
You may not copy, modify, sub-license, or distribute the Document except as expressly providedfor under this License. Any other attempt to copy, modify, sub-license or distribute theDocument is void, and will automatically terminate your rights under this License. However,parties who have received copies, or rights, from you under this License will not have theirlicenses terminated so long as such parties remain in full compliance.
FUTURE REVISIONS OF THIS LICENSE
The Free Software Foundation may publish new, revised versions of the GNU FreeDocumentation License from time to time. Such new versions will be similar in spirit to thepresent version, but may differ in detail to address new problems or concerns. Seehttp://www.gnu.org/copyleft/.
Each version of the License is given a distinguishing version number. If the Document specifiesthat a particular numbered version of this License “or any later version” applies to it, you havethe option of following the terms and conditions either of that specified version or of any laterversion that has been published (not as a draft) by the Free Software Foundation. If theDocument does not specify a version number of this License, you may choose any version everpublished (not as a draft) by the Free Software Foundation.
ADDENDUM: How to use this License for your documents
To use this License in a document you have written, include a copy of the License in thedocument and put the following copyright and license notices just after the title page:
Copyright c© YEAR YOUR NAME. Permission is granted to copy, distribute and/ormodify this document under the terms of the GNU Free Documentation License,Version 1.2 or any later version published by the Free Software Foundation; with noInvariant Sections, no Front-Cover Texts, and no Back-Cover Texts. A copy of thelicense is included in the section entitled “GNU Free Documentation License”.
If you have Invariant Sections, Front-Cover Texts and Back-Cover Texts, replace the“with...Texts.” line with this:
with the Invariant Sections being LIST THEIR TITLES, with the Front-Cover Texts beingLIST, and with the Back-Cover Texts being LIST.
If you have Invariant Sections without Cover Texts, or some other combination of the three,merge those two alternatives to suit the situation.
If your document contains nontrivial examples of program code, we recommend releasing theseexamples in parallel under your choice of free software license, such as the GNU General PublicLicense, to permit their use in free software.
682