the french ”earned income supplement” (rsa) and back-to
TRANSCRIPT

HAL Id: halshs-00812109https://halshs.archives-ouvertes.fr/halshs-00812109
Preprint submitted on 11 Apr 2013
HAL is a multi-disciplinary open accessarchive for the deposit and dissemination of sci-entific research documents, whether they are pub-lished or not. The documents may come fromteaching and research institutions in France orabroad, or from public or private research centers.
L’archive ouverte pluridisciplinaire HAL, estdestinée au dépôt et à la diffusion de documentsscientifiques de niveau recherche, publiés ou non,émanant des établissements d’enseignement et derecherche français ou étrangers, des laboratoirespublics ou privés.
The French ”Earned Income Supplement” (RSA) andback-to-work incentives
Denis Anne, Yannick l’Horty
To cite this version:Denis Anne, Yannick l’Horty. The French ”Earned Income Supplement” (RSA) and back-to-workincentives. 2011. �halshs-00812109�

WORKING PAPER
N° 2011 - 1
The French “Earned Income Supplement” (RSA) and back-to-work incentives
DENIS ANNE, YANNICK L’H ORTY
www.tepp.eu
TEPP - Institute for Labor Studies and Public Policies TEPP - Travail, Emploi et Politiques Publiques - FR CNRS 3126

ISSN 2110-5472

The French “Earned Income Supplement” (RSA) and back-to-work incentives
Denis Anne*
denis.anne@cee-recherche. fr CEE and TEPP (FR n° 3126, CNRS)
Yannick L’Horty**
yannick. lhorty@cee-recherche. fr Universisté de Paris Est, ERUDITE, CEE and TEPP (FR n° 3126, CNRS)
ABSTRACT Using an inventory of local and/or non-statutory transfers in thirteen French towns and cities including Paris, Lyon and Marseille, we measure the gains from returning to work for recipients of means-tested benefits (RMI and API) by type of household.
The reforms of national and statutory benefits carried out during the 2000s, especially those affecting the employment tax credit (PPE), failed to ensure that the recipients of means-tested benefits always stood to gain from returning to work. In most localities and for most types of household, taking a part-time job on the minimum wage represents a loss of income compared to staying on welfare, and full-time work does not always present any advantage. The effects of the reforms were offset by the effects of other measures such as the widespread provision of travel assistance by regional councils, the development of social tariffs for telephone and electricity, or exemption from paying the television licence fee.
We then simulate the effects of introducing the RSA in place of the RMI. We take into account the way that local and/or non-statutory transfers (“ droits connexes”) are modified by the increases in national transfers. We observe that the RSA does indeed eliminate those areas where returning to work is unprofitable, for almost all localities and types of household. Lastly, we show that the marginal tax rate of 38 % chosen by the government in its bill is very close to the upper limit compatible with a back-to-work incentive.
Key words: RMI, API, unemployment, means-tested benefits, back-to-work incentives.
JEL Codes: I38 J32 R51
* Centre d’Etudes de l’Emploi.
** ERUDITE, Université de Paris Est Marne la Vallée, Centre d’Etudes de l’Emploi.

2
Introduction Twenty years after the creation of the “Revenu Minimum d’Insertion” (RMI – minimum integration income), the French system of means-tested benefits underwent a profound transformation in 2009 with the introduction of the “Revenu de Solidarité Active” (RSA – earned income supplement). The RSA replaced both the RMI and the “Allocation Parent Isolé” (API – single parent allowance). Its objective is to ensure that “returning to work is always more profitable than staying on welfare, and that work should give everyone the guarantee of escaping and being protected from poverty” 1.
This change followed a long series of reforms, each intended to avoid the phenomenon where returning to work pays less than staying on welfare. Were these measures ineffective from that point of view? Is the RSA more efficient?
These are difficult questions to answer, because the French measures of income support are so complex. To start with, we must distinguish between two types of welfare benefits. There is a national, statutory platform of primary welfare, consisting of means-tested benefits such as the RMI, the API or the RSA, family allowances such as the childcare allowance or the back-to-school allowance, housing benefits, etc. Then there is a huge range of secondary benefits that are known as “droits connexes”, local and/or non-statutory transfers. Some of these are statutory: the Christmas bonus, television licence fee exemptions, “social tariffs” for telephone and electricity, the CMU (universal healthcare cover) and complementary CMU (covering 100% of costs). Other welfare benefits are non-statutory: the Conseils Généraux (French “county councils”) are responsible for social welfare at the level of each department and give a variety of benefits to poor households, such as housing support, mobility or holiday allowances; each local family allowance fund has a degree of autonomy in the distribution of benefits to its recipients; social welfare/community centres provide school meal allowances, leisure centres and holiday camps; municipalities apply reduced fares for sports facilities and cultural attractions (museums, exhibitions, etc.); lastly, the regions, in charge of transport, have developed travel benefits where they meet costs of travelling by public transport.
Individually, these secondary benefits are of relatively low value, but together they constitute an essential additional resource for poor households. According to our study on this subject, published in 2002, these benefits account for about 20 % of the total resources of poor inactive households (Anne and L’Horty, 2002). So we cannot afford to ignore them, if our aim is to evaluate the gains from returning to work for poor households. The problem is that each of these benefits has its own particular scale, varying from one institution to another and so from one locality to another, and there is no exhaustive record of these local scales. That explains why these transfers are not taken into account in works on social transfers, and more especially in the simulations carried out by the economic administration for the purpose of informing public policy.
The aim of the present study is to propose a measurement of the gains from returning to work and the effects of reforms of the means-tested benefits that takes into account all social transfers, including local and/or non-statutory benefits. For this purpose, we use a method of typical cases and an inventory of all the local and/or non-statutory benefits offered in thirteen French towns and cities, including Paris, Lyon and Marseille. The data were collected in late 2006 and early 2007. They enable us to measure the gains from returning to work for
1 Extract from the “letter of mission” from the President of the Republic and the Prime Minister to the High Commissioner for Active Solidarity against Poverty, Martin Hirsch.
3
recipients of means-tested benefits (RMI and API) according to the type of household (using seven different types of household).
The first section gives an overview of the studies and reforms carried out in France over the last ten years, from the first reports on means-tested benefits to the Earned Income Supplement bill. The second section presents our methodology and the hypotheses adopted to construct the data. Section three describes the results of the descriptive data processing, thereby providing an account of the gains from returning to work before the introduction of the RSA. Section four presents the results of our simulations of the RSA and its effects on the income of recipients of means-tested benefits when they go back to work.
1. A DECADE OF REFORMS: FROM THE ACR TO THE RSA
Enacted by the law of December 1st 2008, the Earned Income Supplement (RSA) came into force in 2009, replacing both the Minimum Integration Income (RMI) and the Single Parent Allowance (API). When it was introduced in 1988, the RMI had itself represented a major reform of the French welfare system, instituting a basic form of means-tested universal allowance for anyone aged over 25 and for younger adults with children. The API was reserved for single parents with children under three years old. The RSA is a new welfare benefit based on a specific scale so that a rise in income from working is not cancelled out by a fall in income from transfers. The aim is to guarantee that returning to work systematically increases the income of poor households. This objective had not been achieved with the RMI, which was a differential allowance combined with a temporary incentive mechanism (a more formal comparison of the two measures is presented in Appendix 1).
Although innovative in its scale and method of implementation, the RSA is the latest in a long series of reforms of social transfers for low income groups, all aiming to increase the incentives for returning to work, whose origins can be traced back to the late 1990s. Since the “law against exclusion” of 1998, which extended the incentive mechanism of the RMI2, there have been a large number of reforms of the instruments of redistribution with a view to improving the gains from returning to work for the beneficiaries of means-tested benefits. These include the reform of the taxe d’habitation (local council tax) in 2000, the reform of housing benefits in 2001, the introduction of a working tax credit (PPE3) the same year and its extensions every year since, the tightening of unemployment benefits after 2003, strong hikes in the SMIC (national minimum wage) in 2003 and 2005, or the “back-to-work bonus” of 1000 euros introduced in 2005 and extended in 2006. All these institutional changes, adopted by successive governments of left and right, are practical expressions of the political desire to “make work pay”, so that returning to work really does represent a gain for recipients of means-tested benefits.
Preceding this succession of reforms leading up to the RSA, numerous studies over at least ten years had confirmed the observation that the monetary gains from returning to work for those on means-tested benefits were simply insufficient. The first studies were based on typical cases and micro-simulations of national and statutory transfers (Padieu, 1997; Cserc,
2 If they returned to work, recipients continued to receive their RMI allowance during three months. For the next nine months they received 50% of it. 3 The PPE (prime pour l’emploi) is a tax credit given to low-income working households but not to households which have no earned income. If there is no tax due, the PPE takes the form of a negative tax.

4
1997; Eyssartier and Paillaud, 1998; Bourguignon and Bureau, 1999). A second wave of studies set out to identify and describe the beneficiaries affected by this lack of monetary gain (Laroque and Salanié, 1999; Gurgand and Margolis, 2001; Legendre, Lorgnet and Thibault, 2002). These works indicated that several hundred thousand people were concerned by this situation on the French labour market. A third type of study widened the field of observation to include local and/or non-statutory transfers, concluding that previous studies, which had not taken these elements into consideration, were underestimates (Anne and L’Horty, 2002). In terms of the fight against poverty, it is important to consider income as a whole, taking into account not only state benefits, but also those paid out by departments, communes, family allowance funds, even charities.
These studies, essentially produced by economists, were widely taken up in official reports and translated into more political proposals. In 1999, in one of the last memos of the Saint-Simon foundation, Roger Godino suggested the idea of a compensatory income allowance, a proposal that was taken up, costed and subjected to a complex institutional process that eventually resulted in the PPE of 2001. To begin with, this working tax credit was of low value and focused on the full-time minimum wage. Poorly targeted, it was reformed every twelve months, to increase its value and shift its focus onto part-time work, where the problems of insufficient gains from returning to work are the most serious. The debate was revived by the 2004 CERC report on child poverty, which highlighted the scale of the problem, backed up by concrete figures. In response, the Minister of Solidarity, Health and Families, Philippe Douste-Blazy, set up the commission on Families, Vulnerability and Poverty within the Ministry of Social Affairs, chaired by Martin Hirsch. To reduce poverty in France, this commission proposed a “new social equation” that foreshadowed the RSA. The Hirsch commission report stressed the importance of local and non-statutary transfers. The parliamentary reports of Valérie Létard (2005) and Laurent Wauquiez (2005) confirmed the legitimacy of this proposal, again stressing the problems caused by local and non-statutary benefits from the perspective of the insufficiency of gains from returning to work.
In this context of intense parliamentary and legislative activity and given the quantity and quality of the studies conducted on these issues, we believe that two important questions must be addressed. Firstly, have the reforms of the last ten years succeeded in eliminating or at least limiting the range of wages for which gains from returning to work are insufficient for those on means-tested benefits? If this proved to be the case, it would be hard to understand the reason for a new, wide-reaching reform like the RSA. Whence the second question: what contribution does the RSA actually make?
These two questions can only be satisfactorily answered if we consider the architecture of social transfers in its entirety. It is not acceptable to limit the observation solely to national and statutory transfers. We must take into consideration all the sources of income of poor households, including local benefits and non-statutory transfers. According to our study published in 2002, these transfers represent on average about 15 to 20 % of the resources of a household with no earned income, a proportion that cannot be neglected.
2. HYPOTHESES AND METHODOLOGY
We use the micro-simulation model EQUINOXE, developed for our first study of local and/or non-statutary transfers which covered all the resources and benefits received by households in 2001 according to different types of household in ten French communes of varying sizes,

5
located in different departments: Paris (19th and 20th arrondissements), Lyon (69), Marseille (13), Amiens (80), Arras (62), Evry (92), Le Mans (72), Belley (01) and Pecquencourt (59).
EQUINOXE
EQUINOXE is an integrated quantitative evaluator of local and/or non-statutary transfers. It is a system of observation of benefits to low-income households and simulation of the reforms of social transfers. It is the only tool of evaluation and calculation available in France that incorporates the local dimension of social transfers by taking into account the benefits given by communes, departments, family allowance funds and local charities. For a sample of thirteen towns and cities including Paris, Lyon and Marseille, EQUINOXE calculates the amount of social benefits according to the household’s resources. The viewpoint adopted is that of the household receiving benefits. The simulator incorporates all the national and/or statutory benefits and all the local and/or non-statutory ones, for all benefits that are monetary (or can be attributed a monetary value) and calculated on the basis of a scale. The first version of the model was presented in the study by Anne and L’Horty [2002]. The present study uses a second version of the model on data collected in late 2006 and early 2007 and on a new set of localities.
In each locality and for each type of household, EQUINOXE calculates the total benefits received by income, taking into account the conditions governing the accumulation of different entitlements. It reconstructs the total benefits, net incomes and marginal tax rates by income, by category of benefits, by type of household and by locality. It also evaluates the number of hours that must be worked per week on the minimum wage to earn at least as much as the household would receive by not working (what we call the “reservation working time”). The calculations are performed for households receiving the RMI, the AI or the ASS. In simulation mode, EQUINOXE MODIFIES the local and/or non-statutary transfers in line with the reforms of national and statutory benefits, whether or not they are parametric. From the moment that the level of national benefits is included in the calculation basis of a local benefit (which EQUINOXE verifies), this tool allows to evaluate the effect on incomes of a reform of social transfers, taking into account the interdependencies between the different benefits.

6
The geographical field of the present study is different. It is based on an inventory of welfare benefits carried out in late 2006 for the ONPES, the national observatory of poverty and social exclusion (Baillon J.-N., Bellaredj F., Douard O., Mazalto M., 2006), which studies the local welfare benefits in ten medium-sized French towns (between 50,000 and 100,000 inhabitants) in five different departments: Bouches-du-Rhône (Arles and Martigues), Hérault (Béziers and Sète), Nord (Tourcoing and Villeneuve d’Ascq), Seine-Saint-Denis (Drancy and Montreuil), Val-de-Marne (Fontenay-sous-Bois and Ivry-sur-Seine). We have incorporated all the scales collected by the ONPES study into our simulator. We have added the missing scales (national non-statutary transfers, municipal aids for sports and cultural activities, specific price scales for meals, regional travel benefits) and we have widened the geographical field by collecting and including the scales for the three biggest cities in France (Paris, Lyon and Marseille). These scales were collected in late 2006 but we have taken into account certain changes that occurred in 2007, notably free school meals in Drancy, introduced in January 2007, and free public transport for RMI beneficiaries in the Île-de-France region. Rural communes have been excluded from the study. We have verified on several examples from 2001 and 2006 that small communes distribute very few local and/or non-statutary transfers. The communes have been made anonymous for the presentation of results.
Field of transfers
Table 1 presents all the different resources and transfers taken into account for our seven different types of household. In addition to earned income, all deductions and all national and statutory transfers have been taken into account by applying the scales defined by law. We exclude the situation of people failing to collect national and statutory benefits to which they are entitled. One-off aids like the “back-to-work bonus” (“prime de retour à l’emploi”) have not been taken into account. On the other hand, temporary measures like the incentive mechanism for leaving the RMI or the ASS (see Appendix 1) have been incorporated when specified. When this is not the case, the results of the simulations should be considered as long-term and between two stable situations of employment.
The scales are those that were in force in 2007. For income tax, we take the scale for tax on income earned in 2006 (paid in 2007). The scales for PPE include increases for part-time work. The API includes family support allowance. The cost of complementary CMU (universal health cover) has been based on the price of an equivalent complementary health insurance policy. Infant care allowance (for children under three) is composed of the “Prime à la naissance” (birth bonus – spread over three years here) and the basic allowance, but neither the CLCA (supplement for free choice of activity) nor the CLCMG (supplement for free choice of childcare). For families with three children, the benefits include the basic allowance but not the family supplement, who suppose that every child is more than three years old (see the presentation of typical cases in Table 3).
The field of local and/or non-statutary transfers is rather difficult to delimit. It covers at the same time statutory and non-statutory benefits, national and local benefits, monetary aids, other aids in the form of cheap rates or in kind, gifts and loans, longer-term aids (telephone subscriptions) and others of an exceptional nature, benefits based on a scale and others based on social evaluation, etc.

7
Table 1. The field of transfers taken into account
Sin
gle p
erson
Sin
gle-p
arent
family
(1 ch
ild <
3 years o
ld)
Sin
gle-p
arent
family
(1 ch
ild >
3 years o
ld)
Co
up
le with
ou
t ch
ildren
Co
up
le 1 enfan
t
Co
up
le 2 ch
ildren
Co
up
le 3 ch
ildren
National and statutory resources
RMI (minimum integration income) X X X X X X
API (single-parent allowance) X
APL (housing benefit) X X X X X X X
Allocations Familiales (family allowance) X X
ASF (family support allowance) X X
PAJE-Naissance (infant care allowance - birth) X X X X
PAJE (Basic infant care allowance) X X X X
Back-to-school allowance X X X
CMU and CMU-C (universal health cover) X X X X X X X
IRPP (personal income tax) X X X X X X X
PPE (working tax credit) X X X X X X X
“National” non-statutary transfers
Christmas bonus X X X X X X
Television licence fee exemption X X X X X X
Telephone reduction X X X X X X
Cheap-rate telephone X X X X X X
Cheap-rate electricity X X X X X X X
Local council tax X X X X X X X
Local transfers
Depending on each local situation
The providers of assistance are also many and diverse, although in most cases, as the report written for ONPES observes (Baillon J.-N., Bellaredj F., Douard O., Mazalto M., 2006), local specialisation means that duplicate benefits are usually avoided. In addition to regional councils (for transport), the departments and communes, there are charitable associations, public companies (telephone rates), etc. The family allowance funds have their own budgets and a certain degree of autonomy in the organisation of their social action. Local authorities, as well as choosing the rate of local taxation, can also grant specific reductions or exemptions. The study includes all these different providers of assistance, with the exception of charitable associations, which rarely use explicit scales and usually specialise in emergency aid – a domain that has been excluded from the study.

8
Specific hypotheses
The aim is to simulate the importance of local and/or non-statutary transfers in the resources of typical households. Emergency and exceptional benefits are not taken into account. By definition, these are one-off payments, of low value and rarely cumulative. More generally, we have not been able to include purely discretionary benefits, which depend on a social evaluation of the claimants’ situation by a local commission, due to a lack of scales and of detailed local information about the amount spent on these benefits. In any case, the gains from these discretionary benefits are unstable and uncertain, justifying our decision to exclude them. We only take into account regular benefits, either means-tested or conditional on the status of the claimant (RMI, API, etc.). On principle, we have assumed that benefits of a similar nature are not cumulative; when two different scales exist for the same benefit (for example, if day care centres have one price for beneficiaries of family allowance funds and another for beneficiaries of Social Action Community Centres (CCAS)), we have kept the more generous of the two.
The present study does not take into consideration childminding benefits, although these benefits are likely to have an important influence on women’s return to work. The problem is that they are very diverse locally according to the type of childminding (existence of a childcare centers, nature of the childcare center, rate of financial support). Families are therefore assumed not to use any form of childminding for children under three, which leads to making no distinction between couples where one partner works and those where both partners work. The implicit hypothesis is that some kind of free childminding solution exists – a close relative, for example. This hypothesis underestimates the cost of access to employment for mothers.
The gains obtained by households with two working adults are not incorporated either. For example, some communes reserve certain services for families with two working parents (although this was not the case for any of the communes in our sample for the benefits studied here, this condition is quite widespread in the provision of childcare services by local councils). Some companies also grant advantages to their employees depending on their type of household4 (company crèches, corporate social benefits conditional on family status). This hypothesis has an opposite effect to the previous one, underestimating the gains from access to employment.
In the case of price reductions, their attribution is usually not dependent on any social evaluation and can be equated with an entitlement for users who meet the required conditions of means or status. We have therefore directly incorporated the value of the price reduction, assuming a hypothesis about the frequency of use of the facilities in question. It is not possible to exploit budget data for this type of aid, the cost of which is, in any case, relatively low for the local authorities providing these services. This is all the more true when they are collective, largely non-rival goods with mainly fixed costs (public transport, swimming pools, museums, theatres or other municipal sporting and cultural facilities).
4 More generally, we exclude social aids paid by companies. There is no data base, national nor local, on these allowances. Taking them into account would increase the earned income.

9
Table 2. Hypotheses on the take-up of benefits
Nature of the benefit Take-up Frequency
Telephone Yes (social rate) 10 hours / month
School meals Yes, for schoolchildren
144 days per year per schoolchild
Before/after-school care No
Care for children not at school No
Day care centre (CLSH) Yes 20 days per year per child over 6 years old.
Holidays Yes 1 week(7 days) / year
Sporting activity Yes 1 per week (swimming)
Cultural activity Yes 1 per month (museum or theatre)
Transport Yes Season ticket where available.
Otherwise, hypothesis of 150 annual return train tickets for localities near urban centres (less than 30 km) and 75 return tickets for further-removed localities.
Housing Solidarity Fund Yes Every 10 years
Household equipment Yes Every 5 years
In the case of benefits in money or kind, we have made a distinction between those based on means-testing or status (e.g., holiday cheques from the Family Allowance Funds) and those which depend on the approval of an evaluation committee. In the latter case, we have assumed that the aid is obtained in 50 % of cases. For housing benefits, we have made additional hypotheses about the frequency with which they are obtained. Table 2 presents all the hypotheses concerning take-up.
For the Housing Solidarity Fund (FSL) run by the departments, we have assumed that an aid is obtained every ten years; this is an aid for obtaining housing or staying in it and an aid for paying electricity, gas and water bills. In the case of aids for obtaining housing, the value of the aid usually includes two months’ deposit plus one month’s rent, insurance, meter connection fees, removal costs, etc. We have therefore assumed a ten-yearly aid corresponding to four months’ rent or to the maximum aid, if it is defined and of lower value.
Not all the local councils specify whether the reductions offered to recipients of the RMI are extended to their families (for swimming pools or public transport, for example). To avoid bias, we only attribute the gain to the actual recipient of the means-tested benefit. Likewise, as we do not always have the information on reductions for large families, and as these are not dependent on income, we have excluded them.
To attribute a value to each benefit, we take the average amount when this is known; when only the maximum is known, we take half of that. In some localities, we have no details about the scales used. In this case, to avoid bias when aggregating the data, we have estimated a mean scale based on the known data from other localities.
10
Typical cases
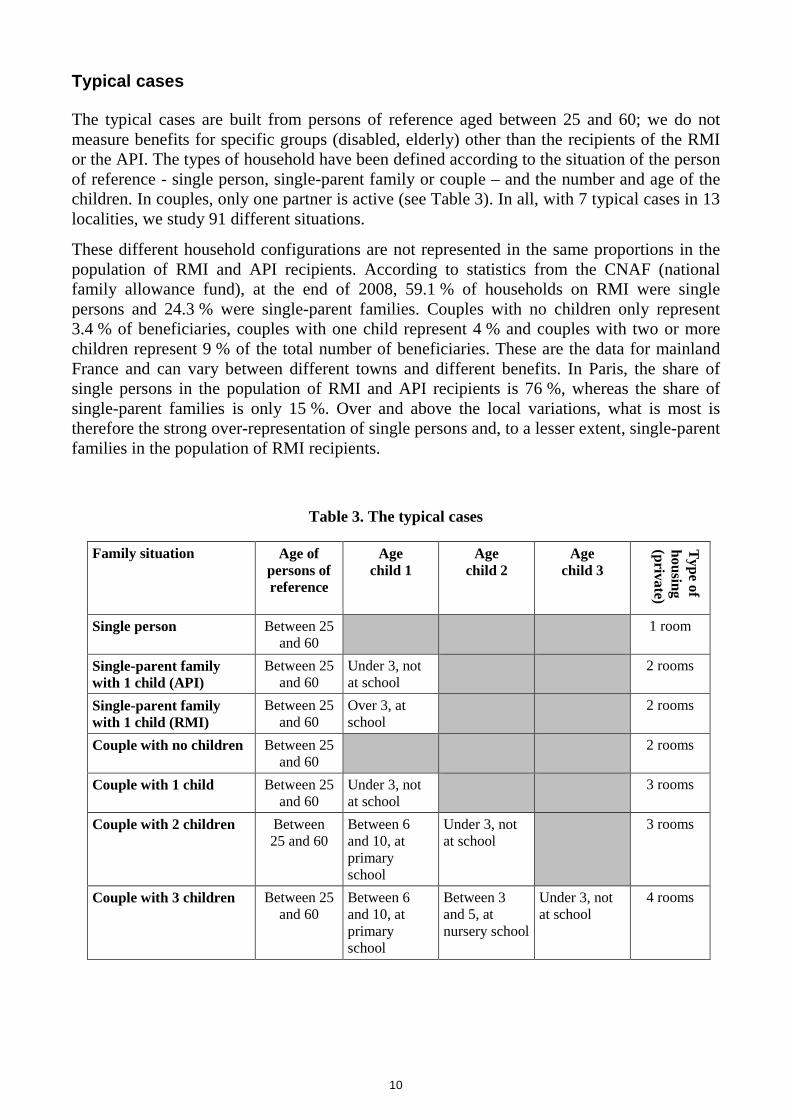
The typical cases are built from persons of reference aged between 25 and 60; we do not measure benefits for specific groups (disabled, elderly) other than the recipients of the RMI or the API. The types of household have been defined according to the situation of the person of reference - single person, single-parent family or couple – and the number and age of the children. In couples, only one partner is active (see Table 3). In all, with 7 typical cases in 13 localities, we study 91 different situations.
These different household configurations are not represented in the same proportions in the population of RMI and API recipients. According to statistics from the CNAF (national family allowance fund), at the end of 2008, 59.1 % of households on RMI were single persons and 24.3 % were single-parent families. Couples with no children only represent 3.4 % of beneficiaries, couples with one child represent 4 % and couples with two or more children represent 9 % of the total number of beneficiaries. These are the data for mainland France and can vary between different towns and different benefits. In Paris, the share of single persons in the population of RMI and API recipients is 76 %, whereas the share of single-parent families is only 15 %. Over and above the local variations, what is most is therefore the strong over-representation of single persons and, to a lesser extent, single-parent families in the population of RMI recipients.
Table 3. The typical cases
Family situation Age of persons of reference
Age child 1
Age child 2
Age child 3
Type of
housing (private)
Single person Between 25 and 60
1 room
Single-parent family with 1 child (API)
Between 25 and 60
Under 3, not at school
2 rooms
Single-parent family with 1 child (RMI)
Between 25 and 60
Over 3, at school
2 rooms
Couple with no children Between 25 and 60
2 rooms
Couple with 1 child Between 25 and 60
Under 3, not at school
3 rooms
Couple with 2 children Between 25 and 60
Between 6 and 10, at primary school
Under 3, not at school
3 rooms
Couple with 3 children Between 25 and 60
Between 6 and 10, at primary school
Between 3 and 5, at nursery school
Under 3, not at school
4 rooms

11
Rents are estimated on the basis of data from the National Federation of Estate Agents (FNAIM) 5 on average surface areas in the private rented sector in different localities. When we do not have specific information about a commune, we have used either data about a nearby communes (e.g., Créteil for Fontenay-sous-Bois), or those about the local economic centre (e.g., Lille for Villeneuve d’Ascq and Tourcoing). In this case, we have applied a reduction of 10 % to the outlying commune. An additional 10 % reduction has been applied to take into account the length of residence in the housing. This estimation was used to calculate the amount of APL (personalized housing benefit) received and the “family quotients”, “disposable income” or “economic means” used in certain scales. It also determines the amount of FSL (housing solidarity fund) obtained. Some scales also take into account service charges; we have estimated these at 25 % of the rent. Table 4 presents the communes used as reference.
Table 4. Communes of reference for the attribution of rents
Commune studied Commune of reference
Arles Marseille
Martigues Marseille
Marseille Marseille
Béziers Béziers
Sète Sète
Tourcoing Lille
Villeneuve d’Ascq Lille
Drancy Noisy-le-grand / Gagny
Montreuil Noisy-le-grand / Gagny
Fontenay sous bois Créteil
Ivry sur Seine Créteil
Paris Paris 18°
Lyon Lyon
3. RMI, LOCAL TRANSFERS AND GAINS FROM RETURNING TO WORK
Many informations can be obtained from the descriptive use of local social scales. As the scales were collected on two different occasions, with a first inventory carried out in 2001, it is possible to identify the major changes that have taken place since the beginning of the decade, which is one way to assess the impact of the numerous reforms. That is the purpose of this section.
5 Source: L’observatoire national du marché locatif, FNAIM, September 2006.

12
Diversity of local and/or non-statutary transfers
One preliminary observation should be made: the scales of local transfers differ greatly, both from one town to another and between different benefits. This result, already established in our 2002 study, is confirmed by the data of 2007. In each locality, there are usually as many different scales as there are different benefits. And for each benefit, there are as many different scales as there are localities in our study.
Alongside this observation of diversity, several regularities have to be mentioned. Firstly, although the scales of local social benefits are all different, their general appearance is often similar. The typical benefit consists of a fixed rate up to a given threshold of resources, above which people are ineligible. When there are several thresholds in a scale, the benefit is of a fixed rate between each threshold. So the scales of local and/or non-statutary transfers look like stairs – often with only one step. But the height and depth of the step differ greatly between benefits and localities. Two illustrations are given in Appendix 2 (Graphs A1 and B1).
Next, local social benefits are most often of low value. On average, the value of these benefits lies between 150 and 250 euros per year depending on the town and the type of household. Taken on its own, each local benefit therefore represents on average barely a few dozen euros per month for a household with no earned income. However, these benefits cannot be neglected, because they are so numerous: in all there are nearly twenty local and/or non-statutary allowances that supplement the income of underprivileged households.
Table 5. Total value and relative weight of transfers by type of household (in euros per year and in %)
A – Households with no earned income
Single person
Couple (without children)
SPF with API (1 child)
(1)
SPF with RMI
(1 child) (1)
Couple (1 child)
Couple (2 children)
Couple (3 children)
Value of national and statutory transfers (2) 7 916 10 640 13 578 12 209 13 224 17 291 21 287
Value of local and/or non-statutary transfers (2)
1 563 1 712 1 059 2 475 1 955 2 600 3 204
Including value of local social benefits (2)
918 948 777 1728 1 134 1 755 2 310
Ratio of local and/or non-statutary transfers to total transfers (3)
16 14 7 17 13 13 13
Ratio of local and/or non-statutary transfers to national statutory transfers (3)
20 16 8 20 15 15 15
Ratio of local social benefits to total local or non-statutary transfers (3)
59 55 73 70 58 68 72
1. SPF: single-parent family.
2. In euros.
3. In %.

13
B – Households with earned income equal to 50 % of SMIC (minimum wage)
Single person
Couple (without children)
SPF with API (1 child)
(1)
SPF with RMI
(1 child) (1)
Couple (1 child)
Couple (2 children)
Couple (3 children)
Value of national and statutory transfers (2)
1 700 4 340 8 290 6 506 7 741 11 722 15 823
Value of local and/or non-statutary transfers (2)
505 1 712 800 2 489 904 2 599 3 216
Including value of local social benefits (2)
464 948 635 1 741 710 1 754 2 321
Ratio of local and/or non-statutary transfers to total transfers (3)
23 28 9 28 10 18 17
Ratio of local and/or non-statutary transfers to national statutory transfers (3)
30 39 10 38 12 22 20
Ratio of local social benefits to total local or non-statutary transfers (3)
92 55 79 70 79 67 72
1. SPF: single-parent family.
2. In euros.
3. In %.
Source: EQUINOXE.
In Table 5 we have aggregated these benefits and made a simple, unweighted average for the thirteen communes covered by the present study. It can be seen that local and/or non-statutary transfers represent an increase of 15 to 20 % of national and statutory transfers. These figures are slightly lower than those of our 2002 study, including for the three towns covered by both studies. This could be explained by the more restrictive hypotheses we have adopted concerning the conditions for the accumulation of benefits in the present study. The households where the share of local and/or non-statutary transfers is lowest are families receiving the API. This is related to both the high level of national and statutory transfers and the low level of local and/or non-statutary transfers. There are two reasons for this. Firstly, by construction, certain of these transfers are reserved for children above a certain age (school meals, after-school care, etc.), and in our typical cases we have assumed that the children of single-parent families receiving the RMI are more than three years old, while the API is reserved for children under three. Secondly, unlike beneficiaries of the RMI, households receiving the API are not entitled to the Christmas bonus, television licence fee exemption, or reduced-rate telecommunications. These observations are valid for households with no earned income. When we assume that the earned income is half a SMIC (minimum wage), the total value of local and/or non-statutary transfers in relation to all national and statutory transfers is very different, and can reach nearly 40 % of those transfers.

14
There does not appear to be any clear relation between the size of the household and the level of “droits connexes” as a proportion of total transfers (Graph 1). In the study we published in 2002, we found, on the contrary, that the relative weight of local and/or non-statutary transfers increased with the household’s size. The difference can be explained by the strong rise in individual benefits, such as reduced transport fares provided by regional councils, which did not exist at the time of our first inventory. Furthermore, we have assumed that the frequency of use of sporting and cultural facilities does not depend on the size of the family.
Graph 1. Total value of transfers by type of household without earned income (average over the sample)
-
5 000
10 000
15 000
20 000
25 000
Single person
Single-parent
family w
ith AP
I(1 child)
Single-parent
family w
ith RM
I(1 child)
Couple (w
ithoutchildren)
Couple (1child)
Couple (2
children)
Couple (3
children)
Net
an
nu
al in
com
e (e
uro
s)
0%
2%
4%
6%
8%
10%
12%
14%
16%
18%
Amount of national and statutory transfers (left scale)
Amount of local and/or non statutory transfers (left scale)
Amount of local allowances (left scale)
Ratio Local and non-statutory transfers / total transfers (right scale)
Source: EQUINOXE.

15
Gains from returning to work
There are certain situations where “work doesn’t pay”. It is well-known that from a long-term perspective, i.e., outside the incentive mechanism whereby transfer income and earned income can be accumulated during the first few months of a return to work, the differential nature of the RMI may mean that going back to work leads to no monetary gain: excluding the incentive, the increase in earned income is entirely offset by the reduction in RMI as long as the exit point from the RMI has not been reached, corresponding to a marginal tax rate of 100 %. The distribution of net incomes as a function of gross incomes (Graph 2) shows that after a horizontal plateau, the household’s net income falls before rising back up (Graph 2-A). This trough is characteristic of a zone where “it doesn’t pay to work”. It can only be observed for single persons, couples without children and couples with more than two children. Further along in the distribution of incomes, there is a slight drop, forming a local peak. This peak corresponds to the exit point from complementary CMU: the household’s income falls when it is no longer entitled to complementary universal health cover.
Graph 2. Net income from statutory national transfers as a function of gross income (average over the sample)
2-A. Excluding working tax credit (PPE)
-
5 000
10 000
15 000
20 000
25 000
30 000
35 000
- 5 000 10 000 15 000 20 000 25 000 30 000 35 000
Gross annual income (Euros)
Net
ann
ual i
ncom
e (E
uros
)
Couple (3 children) Couple (2 children)
Couple (1 child) Couple (without children)
Single-parent family with RMI (1 child) Single-parent family with API (1 child)
Single person
Fall in APL
RMI exit point
CMUC exit point

16
2-B. Including working tax credit
-
5 000
10 000
15 000
20 000
25 000
30 000
35 000
- 5 000 10 000 15 000 20 000 25 000 30 000 35 000
Gross annual income (euros)
Net
an
nu
al in
com
e (e
uro
s)
Couple (3 children) Couple (2 children)
Couple (1 child) Couple (without children)
Single-parent family with RMI (1 child) Single-parent family with API (1 child)
Single person
2-C. Including an incentive of 50 % of the value of the RMI
-
5 000
10 000
15 000
20 000
25 000
30 000
35 000
- 5 000 10 000 15 000 20 000 25 000 30 000 35 000
Gross annual income (Euros)
Net
ann
ual i
ncom
e (E
uros
)
Couple (3 children) Couple (2 children)Couple (1 child) Couple (without children)Single-parent family with RMI (1 child) Single-parent family with API (1 child)Single person
Source: EQUINOXE.
Does the working tax credit (PPE), introduced in 2001 and reformed every year since, provide a solution to these “welfare traps”? It certainly affects them perceptibly, by provoking a sudden rise in income (Graph 2-B). This occurs at the spot where households become eligible for the working tax credit, when their earned income exceeds 0.3 SMIC (the

17
value of the credit received in 2007 for a single person was 322 € at that level of earned income). The working tax credit is based on a scale that increases up to 1 SMIC and then decreases to zero at 1.3 SMIC, and it is increased by a fixed amount for each dependant in the household. The successive reforms have increased the credit for all wage levels, but most strongly around the half-SMIC level. However, these reforms have not been sufficient to make up for the loss of income caused by the graduated nature of national transfers, and they have failed to remove those areas where “work doesn’t pay”.
However, when we incorporate the incentive mechanism as it existed before the introduction of the RSA, the “welfare trap” effect disappears (Graph 2-C). Extended by the law against exclusion of 1998, the incentive is the temporary possibility of accumulating earned income and benefits. When recipients of the RMI return to work, they are allowed to keep the whole of their benefit during three months and then half of it during the next nine months. The principle of the RSA is to make this mechanism permanent6. If we only take into account national benefits, as in Graph 2-C, then this incentive combined with the working tax credit is strong enough tools to prevent the disincentive effects of the RMI’s differential nature. If we ignore local benefits and non-statutary transfers for the time being, then this result repeats one of the main conclusions of the study by Hagneré and Trannoy (2001).
What happens if we now take local and/or non-statutary transfers into account? These benefits are targeted very precisely on the most disadvantaged households, and can therefore strongly reduce the gains from returning to work, even if they are individually of low value. To verify this, it is helpful to use a synthetic concept we first proposed in our 2002 article: the “reservation working time”. This is the minimum number of hours per week that a person must work, on the minimum wage, to earn more than they would receive when unemployed. Graph 3 illustrates the way this indicator is calculated. To earn the equivalent of the means-tested benefit received by an unemployed person (namely, 9479 € on average in the communes of our sample), a single person has two options. He can either work the equivalent of 6½ hours per week on the minimum wage, or work more than 26 hours per week. These calculations are performed on an annual basis for a net minimum wage (when we take as our reference a half-time job on the minimum wage, we calculate in terms of an annual income equivalent to a half-time job worked during the whole year).
6 Bearing in mind that with the RSA, the marginal tax rate is 38 %: the recipient loses 38 euros of benefits for every 100 euros of earned income. These 38% are higher than the 0 % for the first three months of the previous incentive mechanism but greater than the 50 % for the following nine months.

18
Graph 3. The reservation working time, an illustration for a single person with no children (average over the sample)
-
2 000
4 000
6 000
8 000
10 000
12 000
14 000
16 000
18 000
20 000
- 2 000 4 000 6 000 8 000 10000
12000
14000
16000
18000
20000
Gross annual income (euros)
Net
an
nu
al in
com
e (e
uro
s)
Earned income = 8 880€ per year
= 26 h of work per week at the minimum wage
(SMIC)
Income without working = 9479 €
Earned income= 2 160€ per year
= 6 h 30 of work per week at the minimum
wage (SMIC)
Source: EQUINOXE.
Graph 4 presents net income as a function of gross income for each type of household when all transfers are taken into account. Local and non-statutory benefits increase the disposable resources, particularly for households with little or no earned income (Graphs 2-B and 4). On the other hand, taking into account all transfers, including local and/or non-statutary transfers, widens the range of incomes for which “work doesn’t pay” (Graphs 5-A and 5-B). All types of households are now affected by situations where work doesn’t pay.

19
Graph 4. Net income (all transfers) as a function of gross income (average over the sample)
-
5 000
10 000
15 000
20 000
25 000
30 000
35 000
- 5 000 10 000 15 000 20 000 25 000 30 000 35 000
Gross annual income (Euros)
Net
ann
ual i
ncom
e (E
uro
s)
Couple (3 children) Couple (2 children) Couple (1 child)
Couple (without children) Single-parent family with RMI (1 child) Single-parent family with API (1 child)
Single person
Source: EQUINOXE.
Graph 5. Net income as a function of gross income (average over the sample)
5-A. Couple with 2 children 5-B Single-parent family (1 child) on RMI
-
5 000
10 000
15 000
20 000
25 000
30 000
- 5 000 10 000 15 000 20 000 Gross annual income (Euros)
Net
ann
ual i
ncom
e (E
uros
)
Disposable income (without local and non-statutory transfers)
Disposable income
-
5 000
10 000
15 000
20 000
25 000
30 000
- 2 000 4 000 6 000 8 000 10 000 12 000 14 000 16 000 18 000 20 000
Gross annual income (Euros)
Net
ann
ual i
ncom
e (E
uros
)
Disposable income (without local andnon-statutory transfers)
Disposable income
Source: EQUINOXE.
20
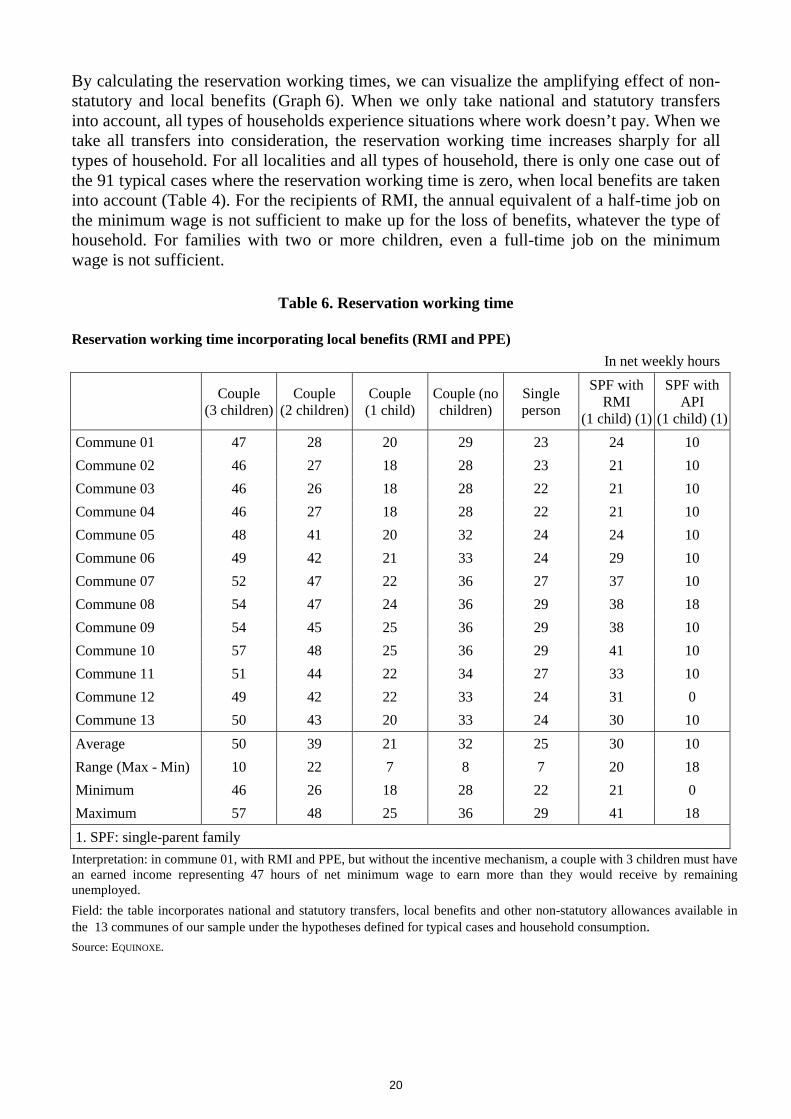
By calculating the reservation working times, we can visualize the amplifying effect of non-statutory and local benefits (Graph 6). When we only take national and statutory transfers into account, all types of households experience situations where work doesn’t pay. When we take all transfers into consideration, the reservation working time increases sharply for all types of household. For all localities and all types of household, there is only one case out of the 91 typical cases where the reservation working time is zero, when local benefits are taken into account (Table 4). For the recipients of RMI, the annual equivalent of a half-time job on the minimum wage is not sufficient to make up for the loss of benefits, whatever the type of household. For families with two or more children, even a full-time job on the minimum wage is not sufficient.
Table 6. Reservation working time
Reservation working time incorporating local benefits (RMI and PPE)
In net weekly hours
Couple
(3 children) Couple
(2 children) Couple (1 child)
Couple (no children)
Single person
SPF with RMI
(1 child) (1)
SPF with API
(1 child) (1)
Commune 01 47 28 20 29 23 24 10
Commune 02 46 27 18 28 23 21 10
Commune 03 46 26 18 28 22 21 10
Commune 04 46 27 18 28 22 21 10
Commune 05 48 41 20 32 24 24 10
Commune 06 49 42 21 33 24 29 10
Commune 07 52 47 22 36 27 37 10
Commune 08 54 47 24 36 29 38 18
Commune 09 54 45 25 36 29 38 10
Commune 10 57 48 25 36 29 41 10
Commune 11 51 44 22 34 27 33 10
Commune 12 49 42 22 33 24 31 0
Commune 13 50 43 20 33 24 30 10
Average 50 39 21 32 25 30 10
Range (Max - Min) 10 22 7 8 7 20 18
Minimum 46 26 18 28 22 21 0
Maximum 57 48 25 36 29 41 18
1. SPF: single-parent family
Interpretation: in commune 01, with RMI and PPE, but without the incentive mechanism, a couple with 3 children must have an earned income representing 47 hours of net minimum wage to earn more than they would receive by remaining unemployed.
Field: the table incorporates national and statutory transfers, local benefits and other non-statutory allowances available in the 13 communes of our sample under the hypotheses defined for typical cases and household consumption. Source: EQUINOXE.

21
Graph 6. Reservation working times with and without local and non-statutary transfers (average over the sample)
0
5
10
15
20
25
30
35
40
45
50
Sin
gle
pers
on
Cou
ple
(with
out
child
ren)
Sin
gle-
pare
ntfa
mily
with
RM
I(1
chi
ld)
Sin
gle-
pare
ntfa
mily
with
AP
I(1
chi
ld)
Cou
ple
(1 c
hild
)
Cou
ple
(2ch
ildre
n)
Cou
ple
(3ch
ildre
n)
Res
erva
tio
n w
ork
ing
tim
e (in
hou
rs o
f net
min
imum
wag
e S
MIC
)
National and statutory transfers Total transfers (national and local)
Source: EQUINOXE.
These conclusions are the same as we obtained in our 2002 study (which did not take API into account). This may seem surprising, given the number of reforms adopted since then with the express purpose of reducing the scale and frequency of welfare traps. These include the reform of the local council tax in 2000, the reform of housing benefits in 2001, the introduction of the working tax credit in the same year (followed by extensions to its field of application every year since then) and the “back-to-work bonus” of 1000 euros in 2005, the field of which was also widened in 2006 (this bonus is excluded from our study). Admittedly, these reforms did have a real effect, as we have seen in the case of the working tax credit, which substantially modified households’ net incomes. They were not, however, sufficient to compensate for the graduated nature of social transfers for low-income households. Moreover, the working tax credit (PPE) appears to have a rather paradoxical effect. It can be seen on the different graphs (2-B, 2-C, 4 and 5) that becoming eligible for the PPE at an earned income of 0.3 SMIC makes the corresponding jobs locally profitable. Thanks to the PPE, a job paying 0.3 SMIC is “worthwhile”, but a job paying 0.5 or 0.7 SMIC is not. The PPE only really makes the worst-paid jobs worthwhile.
The benefit reforms of the 2000s did not succeed in getting rid of the welfare trap because they were counteracted by other measures, with opposing effects on the gains from returning to work. These include travel benefits given by regional councils (such as free bus/subway passes for RMI recipients in the Île-de-France region since 2007), exemption from television licence fees for RMI recipients, reduced telephone rates launched in 2000, definition of a price for “necessity goods” and a reduced rate for electricity7. These benefits were extended again in 2008 with the special “solidarity rate” for gas8. All these innovations have
7 We have not included the “aide à la cuve”: - a heating oil aid worth 200 euros per year in 2008 that was abolished in 2009. 8 This extension is not taken into account in our simulations.

22
counteracted the accumulated effects of the reforms of the working tax credit, housing benefits, local council taxes and family allowances.
4. THE EFFECT OF THE RSA ON GAINS FROM RETURNING TO WORK
In this final section, we study the consequences of the replacement of RMI and API by the RSA. The intention behind the RSA is to avoid both the differential nature of the RMI and the temporary nature of the incentive mechanism. When recipients of the RSA return to work, their RSA is reduced by 38%, leaving them with a net gain of disposable income, ceteris paribus, of 62% of their earned income. This marginal tax rate of 38% is more generous than the RMI with incentive mechanism (after the initial three-month phase of total accumulation) which represented a marginal tax rate of 50%. Without the incentive scheme, the RMI’s marginal tax rate was 100%. For a single person, the exit point from the RSA corresponds to 1.04 times the full-time minimum wage. State funding of the additional income corresponding to the RSA allows to break down the benefit into “basic RSA”, which corresponds to the former RMI (or API) and is funded by the departments, and “working RSA”, which is funded by the State (Diagram 1).
Diagram 1: from RMI to RSA
Interpretation: with no earned income, recipients only receive the basic RSA (the former RMI or API); if their earned income is below the exit point from the former RMI, they receive, in addition to their earned income,
0
Exit point from RSA
Exit point from RMI
or API
Working
income
Net
income
Working
income
Basic + working RSA
Working RSA only
Basic RSA only
Working RSA
Basic RSA (former RMI)

23
the “basic RSA” (paid by the department) and a “working RSA” (paid by the State); above the RMI exit point and up to the RSA exit point, they only receive the “working RSA”.
The working tax credit (PPE) has been maintained in its entirety. The scale that is most favourable to the beneficiary, out of either the RSA or the PPE, is always chosen. The RSA scale is applied in the case of low earned incomes, and then the PPE, but for modest amounts. In certain cases, the RSA has been accompanied by a redefinition of the conditions governing the attribution of national non-statutary transfers. The television licence fee exemption given to recipients of the RMI was maintained in 2009 and will remain, on a means-tested basis, up until 2011. The reduction of local council tax, on the other hand, has been abolished.
As far as local benefits are concerned, we assume that the introduction of the RSA was not accompanied by any reforms in local benefits and other non-statutary transfers. The scales and conditions of eligibility remain the same: the benefits hitherto given to recipients of the RMI are now given to recipients of the RSA. We adopt the same hypothesis for beneficiaries of the API9. The stability of conditions of eligibility for local benefits has different effects depending on the nature of the benefit. For status-based benefits, the eligible public has been widened by extending the criterion of status to all RSA recipients, generating an additional cost for the institution paying the benefit. For means-tested benefits, the RSA is included in the income base (i.e., the different resources taken into account to calculate eligibility and the level of benefit paid) whenever the RMI was. This has the effect of increasing recipients’ income, since the RSA is more generous than the RMI, and therefore reducing the amount of benefits paid.
In the absence of local reforms, the RSA achieves its objective
Under these hypotheses, the RSA is spectacularly effective in terms of gains from returning to work. On average, over our sample of thirteen communes and for all types of household, the RSA eliminates all areas in which working represents a loss of income compared to remaining inactive (Graph 7). To appreciate the scale of the difference between “before” and “after” the RSA, the curves can be compared to those in Graph 4.
9 We do not assume a merger of the related entitlements between the RMI and the API: we assume that the differences in access are maintained.

24
Graph 7. Net income (all transfers) as a function of gross income after introduction of the RSA (average over the sample)
-
5 000
10 000
15 000
20 000
25 000
30 000
35 000
- 5 000 10 000 15 000 20 000 25 000 30 000 35 000
Gross annual income (Euros)
Net
ann
ual i
ncom
e (
Eur
os)
Couple (3 children) Couple (2 children)
Couple (1 child) Couple (without children)
Single-parent family with RMI (1 child) Single person
Source: EQUINOXE.
Instead of dropping sharply, as they did for households leaving the RMI, local and non-statutary transfers are gradually reduced as earned income increases (Graph 8). This gentle decline is linked to the effect of the income base: the RSA is included in the income base used to calculate certain related benefits, thus reducing the value of those benefits. The sudden fall in benefits on leaving the RMI, linked to the effect of status-based benefits, now occurs at a much higher level in the distribution of incomes, at the RSA exit point, which is situated at a level where the earned income is high enough to cushion the fall in transfer income. As the threshold effects have shifted, there is indeed a net increase in disposable income compared with the situation of not working. Remember that these calculations do not take into account the abolition of the council tax reductions previously enjoyed by RMI recipients.

25
Graph 8. Average value of local and non-statutary transfers for a single person (unweighted average of the values in our sample communes)
-
200
400
600
800
1 000
1 200
1 400
1 600
1 800
- 6 000 12 000
Gross annual income (Euros)
Net
an
nu
al t
ran
sfer
s (E
uro
s)
RMI + PPERSA
Source: EQUINOXE
We can compare the effectiveness of the RSA with that of previous schemes pursuing the same objective of providing a monetary incentive to return to work: the working tax credit and the temporary incentive mechanism (accumulating RMI and earned income) (Graph 9). The working tax credit has very little effect on the profile of disposable income and fails to eliminate the zones where returning to work doesn’t pay. The temporary incentive mechanism, on the other hand, produces a profile quite similar to that of the RSA. When added together with the PPE (which is not possible with the RSA, where only the more generous of the two – PPE or RSA – is given), it provides a disposable income slightly higher than that of the RSA, for a narrow range of incomes between 0.3 and about 0.5 SMIC. For higher levels of income, the RSA increases disposable income considerably compared with the incentive mechanism.

26
Graph 9. Net income (all transfers) of a single person by type of means-tested benefit (non-weighted)
-
5 000
10 000
15 000
20 000
- 6 000 12 000 18 000 24 000
Gross annual income (Euros)
Net
ann
ual i
ncom
e (E
uros
)
Working income RMI RMI + PPE RMI + 50% incentive + PPE RSA
Source: EQUINOXE.
The RSA reduces or eliminates most of the threshold effects that the RMI created in local and non-statutary transfers. Instead of amplifying the RMI’s marginal tax rate of 100 %, means-tested local transfers gradually decrease as the marginal tax rate of 38 % reduces the RSA. On the other hand, it does not eliminate status-based effects: there is still an abrupt fall in those transfers at the exit point from the benefit, but this occurs later because the RSA exit point is by definition higher than that of the RMI. In the situations studied here, it occurs at the level of an earned income ranging between 1 SMIC (single person) and 2.1 SMIC (couple with three children).
The RSA’s effectiveness in providing a back-to-work incentive can be measured by comparing the reservation working times before and after implementation of the reform. Remember that this concept does not prejudge the behaviour of households in these situations; it simply measures the wage level above which disposable income is permanently higher than that obtained with no earned income. To facilitate the comparison, we have translated this wage level into the weekly hours worked on the net minimum wage. In this perspective, Table 7 compares different types of means-tested benefit, indicating the minimum, average and maximum reservation working time, taking into account the local and non-statutary transfers in the thirteen communes studied.
While the working tax credit has superficial effects on the gains from returning to work, measured here by the reservation working times, the RSA has a very clear impact on these gains. With a marginal tax rate of 38 %, the RSA makes any level of work “worthwhile” compared with the benefits available to households remaining inactive, in every commune and for almost every type of household. The RSA therefore fully achieves its intended

27
purpose, even when we take into account local and non-statutary transfers and the interdependence between benefit scales and national and statutory transfers.
Table 7. Reservation working times before and after RSA (minimum, average and maximum over the sample of communes)
In weekly hours on net minimum wage
Couple
3 children Couple
2 children Couple 1 child
Couple no
children
Single person
SPF on RMI
(1 child) (1)
SPF on API
(1 child) (1)
RMI without PPE
Min 47 31 22 32 24 29 17
Avg 50 43 30 35 27 36 22
Max 57 50 40 38 31 43 34
RMI with PPE
Min 46 26 18 28 22 21 0
Avg 50 39 21 32 25 30 10
Max 57 48 25 36 29 41 18
RMI + incentive +
PPE
Min 0 0 0 0 0 0 0
Avg 4 18 0 0 9 12 0
Max 57 48 0 0 29 41 0
RSA (MTR 38%) (2)
Min 0 0 0 0 0 0 0
Avg 0 0 0 0 0 0 0
Max 5 0 0 0 0 1 0
RSA
(MTR 40%)
Min 0 0 0 0 0 0 0
Avg 0 0 0 0 0 0 0
Max 5 0 0 0 0 1 0
RSA (MTR 45%)
Min 0 0 0 0 0 0 0
Avg 0 7 0 0 2 3 0
Max 6 48 0 0 20 41 0
RSA (MTR 50%)
Min 0 0 0 0 0 0 0
Avg 7 18 0 2 18 12 0
Max 57 48 0 28 29 41 0
1. SPF: single-parent family.
2. MTR = marginal tax rate. It corresponds to the proportion by which the benefit (in this case the RSA) is reduced following a rise in earned income; the marginal tax rate of 38 % chosen for the RSA means that for each extra euro earned in wages, the RSA is reduced by 38 cents: all else being equal, the disposable income therefore increases by 62 cents. The marginal tax rate can be calculated: 1- ∆RD/∆RA where ∆RD is the variation in disposable income and ∆RA the variation in earned income. Interpretation: in 2007, in the 13 communes studied, taking into account local and non-statutary transfers but not the working tax credit (PPE), a single person had to work between 24 and 31 hours on the SMIC (27 hours on average) to obtain a disposable income higher than that obtained with no earned income, in the case of the RMI without PPE. The average reservation working times in this table are the averages of local reservation times; they are not directly comparable with those presented in Graph 6.
Source: EQUINOXE.

28
This shows that with the RMI, in all the communes studied, a certain number of hours must be worked before the disposable income of the household rises definitively. Depending on the type of household, a minimum of somewhere between a half-time and a full-time week on the minimum wage is needed before the income increases. The incentive mechanism with a marginal tax rate of 50 % temporarily removes these welfare traps, in all communes and for three types of household (couples with one or two children and single-parent families on API). For the other types, notably single persons who constitute the majority of recipients of these benefits, there are communes where the reservation working time remains high despite the incentive mechanism and the PPE, approaching or even exceeding a full-time working week on the SMIC.
With a marginal tax rate of 38 %, and even if it cannot be accumulated with the PPE, the RSA eliminates the zones where “working does not pay” in every commune and for almost every household type. Out of the 91 situations studied (13 communes and 7 household types), only two have a non-zero reservation working time. Even in these two cases, the values are very low (five hours and one hour per week on the SMIC respectively).
By varying the marginal tax rate of the RSA, we show that above a 40 % rate, zones where it is not worth working reappear. The rate of 38 % chosen by the government is therefore close to the maximum possible in terms of the declared objective of producing a monetary incentive for returning to work.
CONCLUSIONS
Local and/or non-statutary transfers cover a vast set of monetary benefits given to low-income households to top-up national and statutory benefits. These secondary aids have been largely neglected, and yet their analysis is indispensable to an accurate assessment of the impact of benefit reforms on incomes. In this study, we have used the EQUINOXE micro-simulation model to take into account the interdependence between local or non-statutary transfers and national, statutory benefits. Our aim has been to evaluate the effect on gains from returning to work of the introduction of the Earned Income Supplement (Revenu de Solidarité Active - RSA) to replace both the Minimum Integration Income (Revenu Minimum d’Insertion - RMI) and the Single Parent Allowance (Allocation Parent Isolé - API).
In Paris, Lyon, Marseille and ten medium-sized towns, we have analysed the total value of benefits as a function of household income, exhaustively incorporating every national and/or statutory benefit and every local and/or non-statutory benefit as long as they have or can be assigned a monetary value and are calculated on the basis of a scale. The present study extends and updates the work of Anne and L’Horty (2002), using data from 2007 and a new sample of communes.
Although local and non-statutary transfers are most often of low value (somewhere between 150 and 250 euros per year for each particular local benefit, depending on the locality and type of household), their sheer numbers make them too important to ignore: the income of poor households is complemented by nearly twenty transfers. Overall, these benefits increase national and statutory transfers by 15 to 20 %.
So despite their low individual value, these multiple benefits, targeted very precisely on the poorest households, can strongly reduce the gains from returning to work. For recipients of the RMI, our simulations show that the annual equivalent of a half-time job on the minimum
29
wage is not enough to make up for the loss of benefit income, whatever the type of household. For couples with two or more children, not even a full-time job on the minimum wage is enough.
This result is very similar to the one we obtained in our previous study on data collected in 2001. This is quite surprising when one considers the scale of the reforms introduced throughout the 2000s (reforms of the local council tax, housing benefits, family allowances and the working tax credit). These reforms clearly had a positive impact on the gains from returning to work, particularly the introduction of the working tax credit, which substantially modified households’ net incomes. But they hardly had any effect on the zones where returning to work entails a loss of income for those on benefits. The working tax credit in particular does not make any but the lowest-paying jobs more worthwhile.
If the reforms of social transfers of the 2000s failed to eliminate these welfare traps, it is because their effects were counteracted by the effects of other reforms of social transfers: the development of travel benefits given by regional councils (such as free season tickets for RMI recipients in the Île-de-France region since 2007), television licence fee exemption for RMI recipients thanks to a 2004 law, the social telephone reduction since 2000, reduced rate telephone and electricity bills since 2005. All these new measures offset the impact on the gains from returning to work of the reforms of the working tax credit, housing benefits, local council tax and family allowances.
The RSA was introduced in place of both the RMI and the API with the explicit goal of making work pay. According to our simulations, it has made returning to work profitable in almost every commune and for almost every type of household: out of the 91 simulated situations (seven typical cases in thirteen communes), only two continue to experience a loss of income, and only over a very narrow range of working hours.
The marginal tax rate of 38% (the amount by which the RSA is reduced for each rise in earned income) is close to the 40 % limit, where negative effects on the back-to-work incentive reappear locally. Here, the average reservation working times are still low, but the maxima are comparable to those observed with the RMI. The same holds true with a marginal tax rate of 50%, corresponding to the temporary incentive mechanism that existed before the RSA.
It remains to study the robustness of these results under different hypotheses concerning the reactions of local benefit providers. As it stands, the scenario studied here would lead to a marked increase in local benefit budgets.

30
REFERENCES
ANNE D. and L’HORTY Y., 2002, “Transferts sociaux locaux et retour à l’emploi”, Economie et Statistique, n° 357-358.
BAILLON J.-N., BELLAREDJ F., DOUARD O., MAZALTO M., 2006, “Pour une meilleure connaissance des aides locales”, rapport AMEDIS, December.
BELORGEY J-M, 2000, Minima sociaux, revenus d’activité, précarité, Rapport du Commissariat Général du Plan, La documentation française, May 2000. Extracts, pages 105 to 115.
BOURGUIGNON F. and BUREAU D., 1999, L’architecture des prélèvements en France. rapport au Conseil d’Analyse Economique, La documentation Française.
CSERC, 1997, Minima sociaux. Entre protection et insertion, éd. La documentation Française.
EYSSARTIER D. and PAILLAUD S., 1998, “Pâris, un outil d’évaluation dynamique du système fiscalo-social”, Economie et Statistique, n°308/309/310.
GODINO R., 1999, “Pour la création d'une allocation compensatrice de revenu”. Notes de la Fondation Saint-Simon, n°104, February.
GURGAND M. and MARGOLIS D., 2001, “RMI et revenus du travail : une évaluation des gains financiers à l’emploi”, Economie et Statistique, n° 346-347.
HAUT COMMISSAIRE AUX SOLIDARITES ACTIVES CONTRE LA PAUVRETE, 2008, Livre vert vers un revenu de Solidarité active.
L’H ORTY Y., OUVRARD J-F., 2006, “Les gains inégaux du retour à l’emploi”, Données sociales.
LAROQUE G. and B. SALANIE , 1999, “Prélèvements et transfert sociaux : une analyse descriptive des incitations financières au travail”, Economie et Statistique, n° 328.
LAROQUE G. and B. SALANIE , 2000, “Une décomposition du non emploi en France”, Economie et Statistique, n° 331.
LEGENDRE F., LORGNET J-P., THIBAULT F., 2002, “Prime pour l’emploi et soutien aux faibles revenus : une exploration à l’aide du modèle MYRIADE”, Revue économique, n° 59, May.
LETARD V., 2005, Minima sociaux : mieux concilier équité et reprise d'activité, Rapport d'information n° 334 (2004-2005), Commission des affaires sociales du Sénat, 11 May.
PADIEU C., 1997, “RMI et SMIC : étude sur l’apport financier de l’accès à l’emploi par types de ménages”, Les cahiers de l’ODAS, March.
PISANNI-FERRY J., 2000, Plein emploi, rapport au Conseil d’Analyse économique
WAUQUIEZ L., 2005, Retour à l’emploi et développement de l’emploi. Rapport fait au nom de la commission des affaires culturelles, familiales et sociales sur le projet de loi (n° 2668).

Appendix 1
FROM RMI TO RSA
The RMI is a guaranteed minimum income accompanied by an incentive mechanism, whereby beneficiaries returning to work can continue, temporarily, to receive a proportion of their RMI on top of their earned income. It is completed by a set of non-monetary incentives to return to work, with the “contrat d’insertion” (professional integration contract) and local measures of support for claimants. If we focus on the long-term, monetary dimension of the benefits given to poor households, the RMI can be summed up as a means-tested differential benefit that provides the strict minimum to take households up to the guaranteed level of resources. If we denote i the size of the household, R0i the guaranteed minimum income for a household of type i and w its earned income (more generally, w denotes all the resources included in the income base used to calculate the RMI), then the amount of RMI received by the household, denoted T(RMI), can be written:
( ) wRRMIT ii τ−= 0 (1)
where τ denotes the marginal tax rate on earned income. In the case of the RMI, this latter is 100 % ( 1=τ ), because at the end of the incentive period, each additional euro of earned income means one less euro of benefit. This reduction in transfer income is equivalent to a tax rise. The marginal tax rate (or marginal benefit reduction rate) expresses the variation in transfers as a proportion of the variation in earned income:
w
T
δδτ −= (2)
RMI and local/non-statutary transfers
The income of a household on the RMI, denoted Y(RMI), is equal to the sum of the RMI given by equation (1), the earned income and transfers included in the RMI income base (denoted w), and the local/non-statutary transfers, covering all the other benefits not included in the RMI income base. These aids are denoted DCi(w), because they depend on the household’s size and income:
( ) ( ) ( )wDCwRRMIY iii +−+= τ10 (3)
In practice, DCi(w) is an aggregate of several benefits attributed by non-coordinated institutions each with its own specific scale. It is a function of the earned income with points of discontinuity forming an overall profile of irregular steps (for an illustration of this, see graphs A2 and B2 in Appendix 2). From the households’ point of view, the effective marginal tax rate is the sum of that of the RMI and that of the local and non-statutary transfers. It presents numerous discontinuity points (for an illustration, see graphsA3 and B3 in Appendix 2).

32
Implementation of the RSA
The RSA is intended to reduce the marginal tax rate on earned incomes to a level that should remain fixed at 30 %. The mechanism remains at a constant rate. No discontinuities in the marginal tax rate are envisaged. In addition, the RSA does not modify the value of the RMI received by households with no earned income, whatever their configuration. The RMI’s implicit scale of equivalence, whereby couple were given 150 % of a single person’s income, 30 % more for each dependent child and 40 % for the third child (a couple with three children received 2.5 times more RMI than a single person) remained the same with the transition from RMI to RSA. The term iR0 therefore remained unchanged when the reform was implemented. The three equations written above continue to apply. The only difference is the value of the marginal tax rate (0.3 instead of 1). The new system is therefore unequivocally always more generous for all types of household.
The choice of a constant-rate mechanism facilitates calculations from the recipients’ viewpoint, and is almost certainly a guarantee of simplicity and clarity. It allows to deduce mechanically the range of application of the measure, i.e., the level of earned income above which it no longer applies. This earned income ceiling, above which claimants are no longer eligible for the RSA (denoted maxw ), can be very easily calculated from the guaranteed minimum income for households with no earned income (R0i) and the marginal tax rate (τ ).
τiR
w 0max = (4)
For example, for a single person with no earned income, the RMI is of the order of 0.35 gross SMIC. After the introduction of the RSA with a marginal tax rate of 30 %, the earned income ceiling is 0.35/0.3 = 1.15 SMIC. The table below gives the values for different types of households and different RSA coefficients. A rise of 5 points in the marginal tax rate reduces the earned income ceiling by 16 percent.
Earned income ceiling for RSA eligibility (in multiples of gross SMIC)
RSA Coefficient (marginal tax rate)
Type of household 0.3 0.35 0.4 0.45 0.5
Single person 1.15 0.99 0.86 0.77 0.69
Single-parent family, 1 child 1.73 1.48 1.29 1.15 1.04
Couple without children 1.73 1.48 1.29 1.15 1.04
Couple 1 child 2.07 1.78 1.55 1.38 1.24
Couple 2 children 2.42 2.07 1.81 1.61 1.45
Couple 3 children 2.88 2.47 2.16 1.92 1.73

Appendix 2
SCALES OF LOCAL/NON-STATUTARY TRANSFERS: TWO EXAMPLES
A. single person living in X
A-1. local and/or non-statutary transfers
-
100
200
300
400
500
600
700
800
900
-
1 200
2 400
3 600
4 800
6 000
7 200
8 400
9 600
10 800
12 000
13 200
14 400
15 600
16 800
18 000
19 200
20 400
21 600
22 800
24 000
25 200
26 400
27 600
28 800
30 000
31 200
32 400
33 600
34 800
36 000
Gross annual income (Euros)
An
nu
al a
mo
un
t o
f lo
cal a
nd
no
n-s
tatu
tory
tra
nsf
ers
Prime de Noël
Exonération de redevance TV
Réduction sociale téléphonique
Tarif Social Téléphone
Tarif social électricité
taxe d'habitation Gain
Département FSL
Département Chèque mobilité
Département Fonds d'aide àl'énergieDépartement Aide extra-légale
Département Chèques cadeaux
CAF Equipement mobilier
CAF Forfait Vacances
CAF Bons Japil
Caisse des écoles RestaurationscolaireCaisse des écoles Centre de loisirs
Commune Aide aux transportsurbainsRégion/Commune ActivitésculturellesCommune Piscine
Source: EQUINOXE.

34
A-2. Accumulation of local and/or non-statutary transfers
-
500
1 000
1 500
2 000
2 500
3 000
-
1 200
2 400
3 600
4 800
6 000
7 200
8 400
9 600
10 800
12 000
13 200
14 400
15 600
16 800
18 000
19 200
20 400
21 600
22 800
24 000
25 200
26 400
27 600
28 800
30 000
31 200
32 400
33 600
34 800
36 000
Gross annual income
Ann
ual t
otal
tran
sfer
s
Source: EQUINOXE.
A-3. Marginal tax rates
-50%
0%
50%
100%
150%
200%
250%
300%
-
1 20
0
2 40
0
3 60
0
4 80
0
6 00
0
7 20
0
8 40
0
9 60
0
10 8
00
12 0
00
13 2
00
14 4
00
15 6
00
16 8
00
18 0
00
19 2
00
20 4
00
21 6
00
22 8
00
24 0
00
25 2
00
26 4
00
27 6
00
28 8
00
30 0
00
31 2
00
32 4
00
33 6
00
34 8
00
Gross annual income
on total income
on local and no-statutory transfers
Source: EQUINOXE.

35
B. A couple with two children living in Y
B-1. local and/or non-statutary transfers
-
200
400
600
800
1 000
1 200
-
1 200
2 400 3 600 4 800
6 000 7 200 8 400
9 600 10 80012 000
13 20014 40015 600
16 800
18 00019 200
20 40021 60022 800
24 00025 20026 400
27 60028 80030 000
31 20032 40033 600
34 800
36 000
Gross annual income
An
nu
al a
mo
un
ts o
f lo
cal a
nd
no
n-s
tatu
tory
tra
nsf
ers
Prime de Noël
Exonération de redevance TV
Réduction sociale téléphonique
Tarif Social Téléphone
Tarif social électricité
taxe d'habitation Gain
CAF Aide aux vacances
CAF Equipement mobilier
CAF Entrée ou Maintien dans leslieuxDépartement FSL
Département Aide à l'énergie
Commune Activités culturelles
Commune Piscine
Commune Restauration scolaire
Commune CLSH
Commune Paris logement famille
Commune Avantages EDF pour lesfamillesCommune Carte Paris Famille
Commune Avantages EDF pour lespersonnes démunies de ressourcesCommune Aide à l'amélioration del'habitatCommune Aide aux transportsurbains
Source: EQUINOXE.

36
B-2. Accumulation of local/non-statutary transfers
-
500
1 000
1 500
2 000
2 500
3 000
3 500
4 000
4 500
-
1 200
2 400
3 600
4 800
6 000
7 200
8 400
9 600
10 800
12 000
13 200
14 400
15 600
16 800
18 000
19 200
20 400
21 600
22 800
24 000
25 200
26 400
27 600
28 800
30 000
31 200
32 400
33 600
34 800
36 000
Gross annual income
Tot
al lo
cal a
nd/o
r no
n st
atut
ary
tran
sfer
s
Source: EQUINOXE.
B-3. Marginal tax rates
-100%
-50%
0%
50%
100%
150%
200%
250%
300%
-
1 2
00
2 4
00
3 6
00
4 8
00
6 0
00
7 2
00
8 4
00
9 6
00
10
80
0
12
00
0
13
20
0
14
40
0
15
60
0
16
80
0
18
00
0
19
20
0
20
40
0
21
60
0
22
80
0
24
00
0
25
20
0
26
40
0
27
60
0
28
80
0
30
00
0
31
20
0
32
40
0
33
60
0
34
80
0
Gross annual income
on global income
on local and non-statutary transfers
Source: Equinoxe.

TEPP Working Papers 2010
10-1. Are young French jobseekers of ethnic immigrant origin discriminated against? A
controlled experiment in the Paris area
Emmanuel Duguet, Noam Leandri, Yannick L’Horty, Pascale Petit
10-2. Couple’s Work Hours, Satisfaction and reconciling Work and family Life
Nathalie Georges, Dominique Méda, Danièle Trancart
10-3. Housing ownership, social housing and unemployment: an econometric analysis of
the Paris area
Emmanuel Duguet, Yannick L’Horty, Florent Sari
10-4. Do Public Subsidies Have an Impact on New Firm Survival? An Empirical Study
with French Data
Lionel Désiage, Richard Duhautois, Dominique Redor
10-5. The effect of social security payroll tax reductions on employment and wages: an
evaluation of the 2003 French reform
Matthieu Bunel, Fabrice Gilles, Yannick L’Horty
10-6. What are Entrepreneurs’ Objectives When Starting a New Business?
Lionel Désiage
10-7. Health and Early Retirement: Evidence from French Data for individuals
Thomas Barnay, Karine Briard
10-8. Ageing, chronic conditions and the evolution of future drugs expenditures
Thomas Barnay, Sophie Thiébaut, Bruno Ventelou
10-9. Entrepreneurial motives and performance: Why might better educated
entrepreneurs be less successful?
Arnab Bhattacharjee, Jean Bonnet, Nicolas Le Pape, Régis Renault
10-10. Returns to firm-provided training in France: Evidence on mobility and wages
Arnaud Chéron, Bénédicte Rouland, François-Charles Wolff
10-11. Taxation of early retirement windows and delaying retirement: the French
experience
Pierre-Jean Messe

10-12. Pre Entry Motives into Entrepreneurship and Post Entry Entrepreneurial
Orientation
Jean Bonnet, Nicolas Le Pape
10-13. Hiring Practices, Employment Protection and Temporary Jobs
Anne Bucher
10-14. Young-in Old-out: a new evaluation
Michela Bia, Pierre-Jean Messe, Roberto Leombruni
10-15. On the impact of the TFP growth on the employment rate: does training on-the-
job matter?
Eva Moreno-Galbis
10-16. The dynamics of youth labor market integration
Anne Bucher
10-17. Fostering the potential endogenous development of European regions: a spatial
dynamic panel data analysis of the Cohesion Policy on regional convergence over the
period 1980-2005
Salima Bouayad-Agha, Nadine Turpin, Lionel Védrine
10-18. Cost-saving or Cost-enhancing Mergers: the Impact of the Distribution of Roles
in Oligopoly
Nicolas Le Pape, Kai Zhao
10-19. Bankruptcy Risk, Product Market Competition and Horizontal Mergers
Bernard Franck, Nicolas Le Pape
10-20. Endogenous Job Destructions and the Distribution of Wages
Arnaud Chéron, Bénédicte Rouland
10-21. Employment Protection Legislation and Adverse Selection at the Labor Market
Entry
Anne Bucher, Sébastien Ménard

The TEPP Institute
The CNRS Institute for Labor Studies and Public Policies (the TEPP Institute,
FR n°3126 CNRS) gathers together research centres specializing in economics and sociology:
• the Centre d'Etudes de l'Emploi (Centre for Employment Studies), CEE, Public
Administrative Organization, under the leadership of the Ministers of Work and
Research
• l'Equipe de Recherche sur les Marchés, l'Emploi et la Simulation (Research Team
on Markets, Employment and Simulation), ERMES, University of Paris II Panthéon-
Assas
• the Centre d'Etudes des Politiques Economiques de l'université d'Evry (Research
Centre focused on the analysis of economic policy and its foundations and
implications), EPEE, University of Evry Val d’Essonne
• the Centre Pierre Naville (Research on Work and Urban Policies), CPN, University
of Evry Val d’Essonne
• l'Equipe de Recherche sur l'Utilisation des Données Temporelles en Economie
(Research Team on Use of Time Data in Economics), ERUDITE , University of Paris-
Est Créteil and University of Paris-Est Marne-la-Vallée
• the Groupe d'Analyse des Itinéraires et des Niveaux Salariaux (The Group on
Analysis of Wage Levels and Trajectories), GAINS, University of the Maine
The TEPP Institute brings together 115 researchers and research professors, 140 PhD students
and 40 associate researchers who study changes in work and employment in relation to the
choices made by firms and analyse public policies using new evaluation methods.
www.tepp.eu