the fsai salt reduction programme · © fsai key components of this fsai work examine the...
TRANSCRIPT
© FSAI
The FSAI Salt Reduction Programme
Ten Years of Progress ?
Karl McDonald
© FSAI
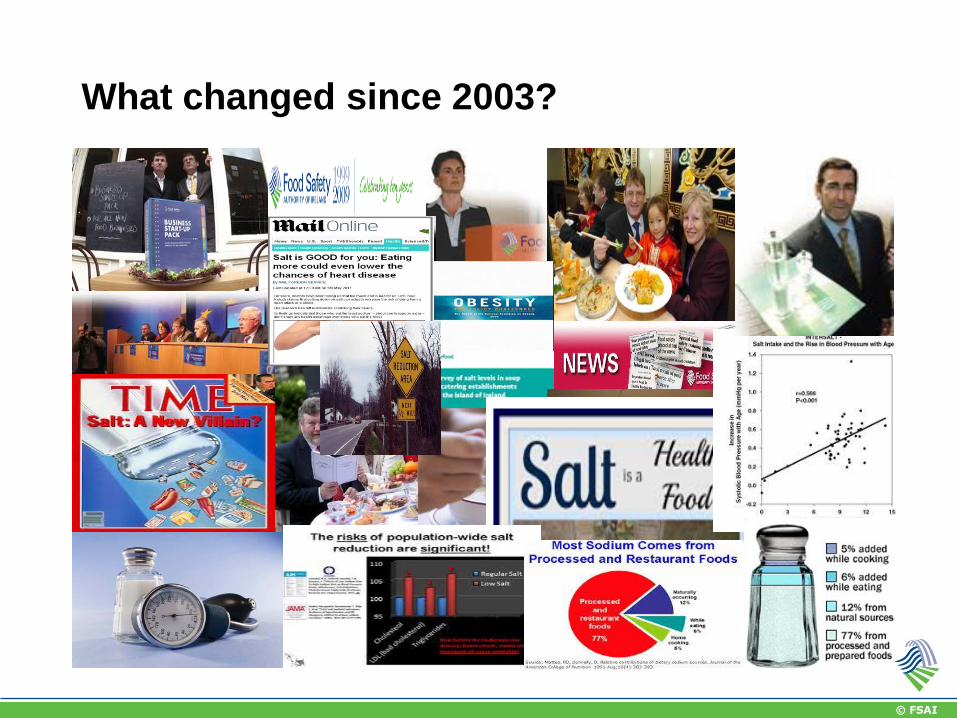
What changed since 2003?
© FSAI
“…current consumption contributes to
increased blood pressure and higher
risk of CVD”
European Food Safety Authority – The EFSA Journal (2005)

© FSAI
“…measures to reduce intake
requires reductions in the content
of processed foods.”
Salt and Health – FSAI (2005)
© FSAI
“..industry efforts have failed,
scientists call for mandatory,
phased in limits on salt in food”
Centre for Science in the Public Interest - May 13th 2013

© FSAI
“...available evidence on associations
between sodium intake and direct
health outcomes is consistent with
population-based efforts to lower
excessive diet...”
Institute of Medicine – May 14th 2013
© FSAI
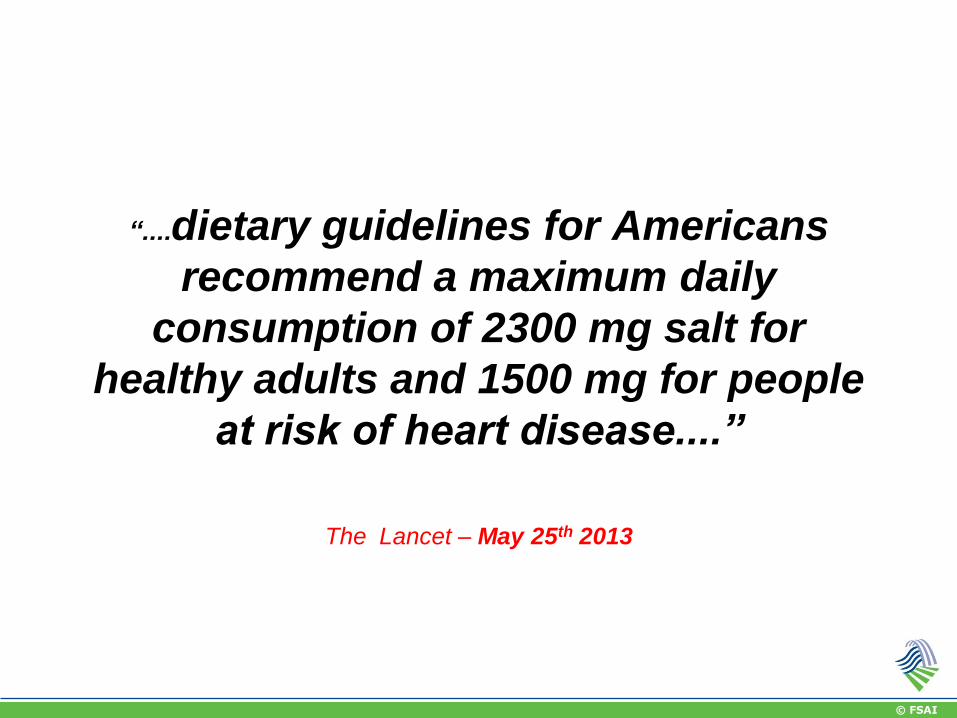
“....dietary guidelines for Americans
recommend a maximum daily
consumption of 2300 mg salt for
healthy adults and 1500 mg for people
at risk of heart disease....”
The Lancet – May 25th 2013
© FSAI
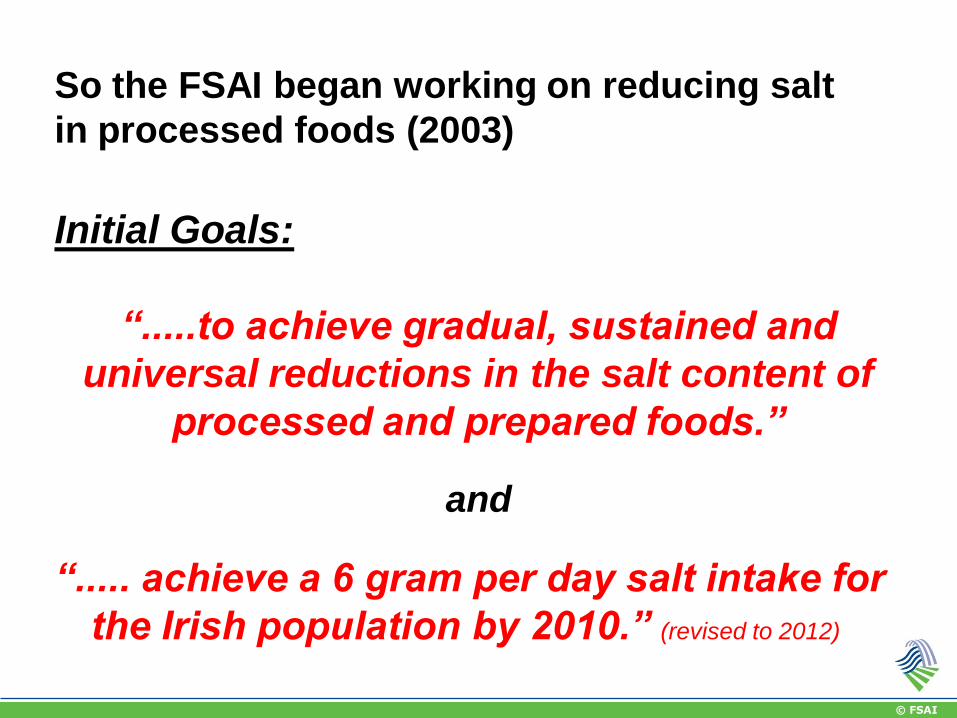
So the FSAI began working on reducing salt
in processed foods (2003)
Initial Goals:
“.....to achieve gradual, sustained and
universal reductions in the salt content of
processed and prepared foods.”
and
“..... achieve a 6 gram per day salt intake for
the Irish population by 2010.” (revised to 2012)
© FSAI
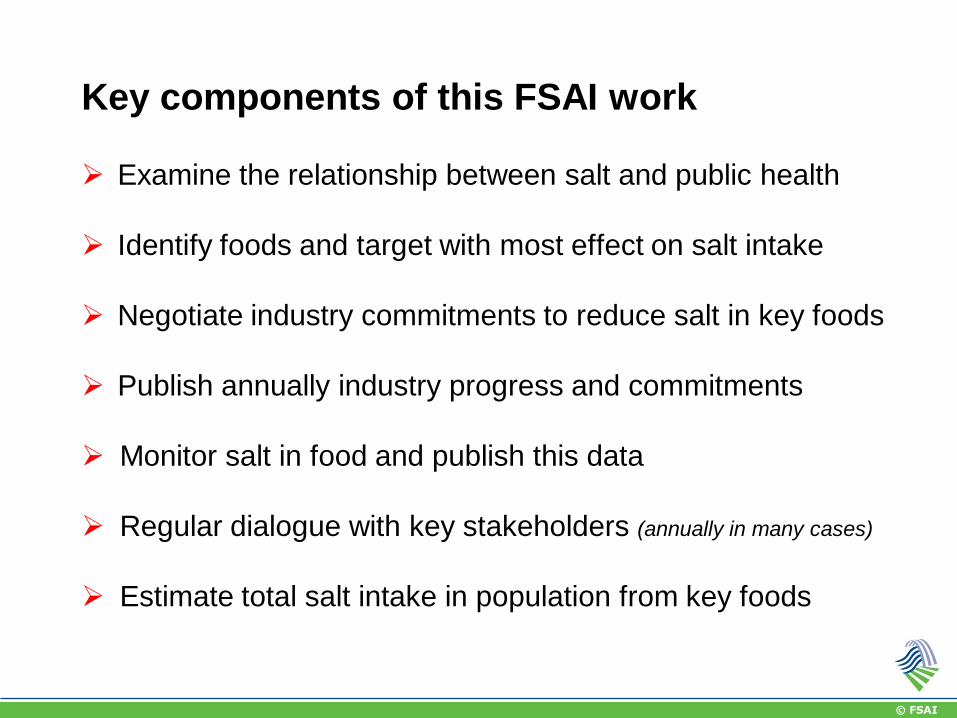
Key components of this FSAI work
Examine the relationship between salt and public health
Identify foods and target with most effect on salt intake
Negotiate industry commitments to reduce salt in key foods
Publish annually industry progress and commitments
Monitor salt in food and publish this data
Regular dialogue with key stakeholders (annually in many cases)
Estimate total salt intake in population from key foods
© FSAI
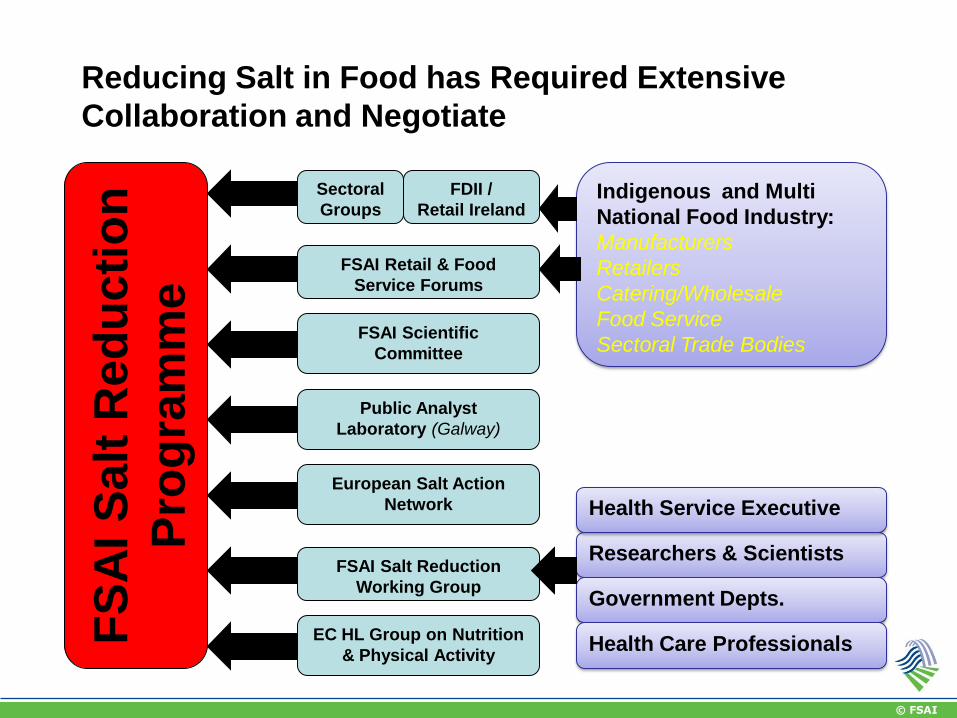
Reducing Salt in Food has Required Extensive
Collaboration and Negotiate
Indigenous and Multi
National Food Industry:
Manufacturers
Retailers
Catering/Wholesale
Food Service
Sectoral Trade Bodies
FS
AI
Sa
lt R
ed
uc
tio
n
Pro
gra
mm
e
Researchers & Scientists
FDII /
Retail Ireland
Government Depts.
Health Care Professionals
FSAI Retail & Food
Service Forums
FSAI Salt Reduction
Working Group
FSAI Scientific
Committee
Public Analyst
Laboratory (Galway)
European Salt Action
Network
EC HL Group on Nutrition
& Physical Activity
Health Service Executive
Sectoral
Groups
© FSAI
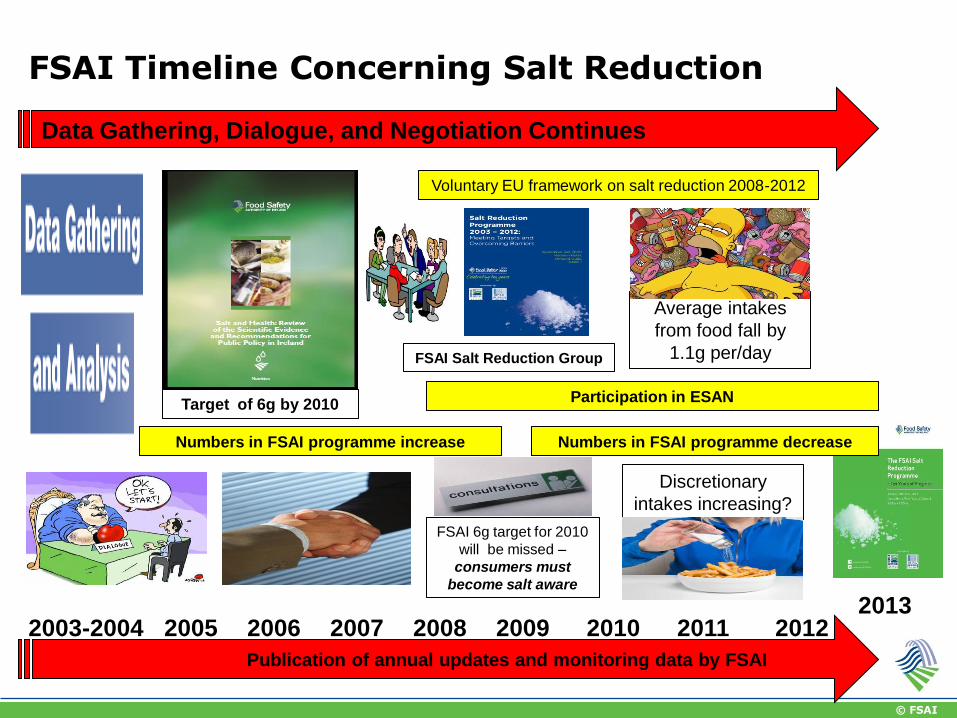
FSAI Timeline Concerning Salt Reduction
2003-2004
Publication of annual updates and monitoring data by FSAI
2005 2008
Data Gathering, Dialogue, and Negotiation Continues
2007 2006
FSAI Salt Reduction Group
Voluntary EU framework on salt reduction 2008-2012
Numbers in FSAI programme increase
2009 2013
2010 2011 2012
FSAI 6g target for 2010
will be missed –
consumers must
become salt aware
Numbers in FSAI programme decrease
Average intakes
from food fall by
1.1g per/day
Discretionary
intakes increasing?
Participation in ESAN Target of 6g by 2010

© FSAI
What's been achieved?
© FSAI
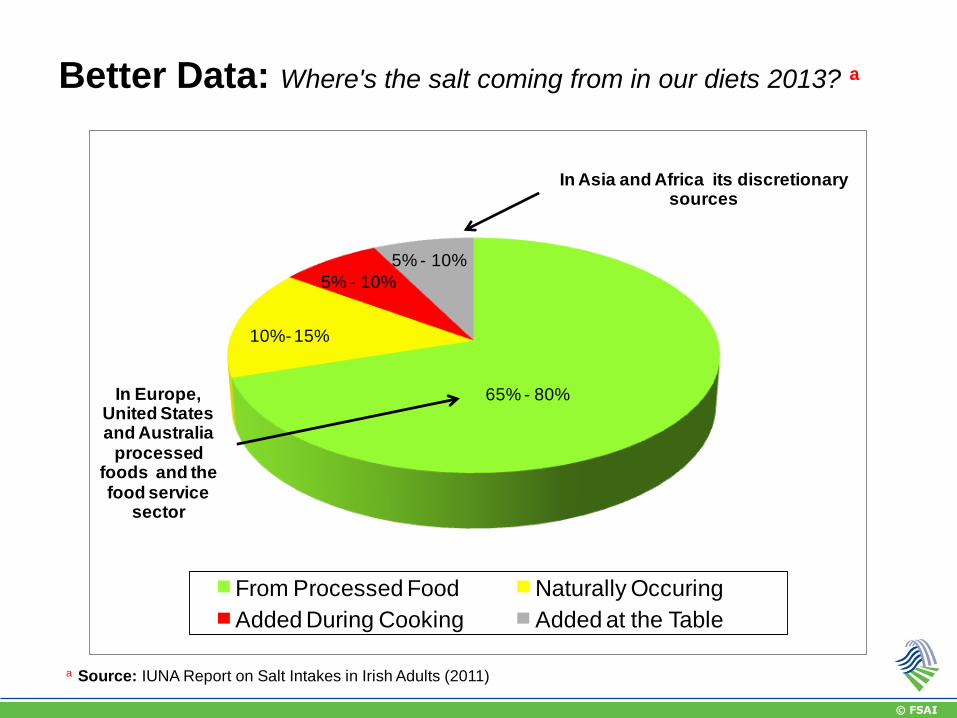
Better Data: Where's the salt coming from in our diets 2013? a
65% - 80%
10%- 15%
5% - 10%
5% - 10%
From Processed Food Naturally Occuring
Added During Cooking Added at the Table
In Asia and Africa its discretionary sources
In Europe, United States and Australia
processed foods and the food service
sector
a Source: IUNA Report on Salt Intakes in Irish Adults (2011)
© FSAI
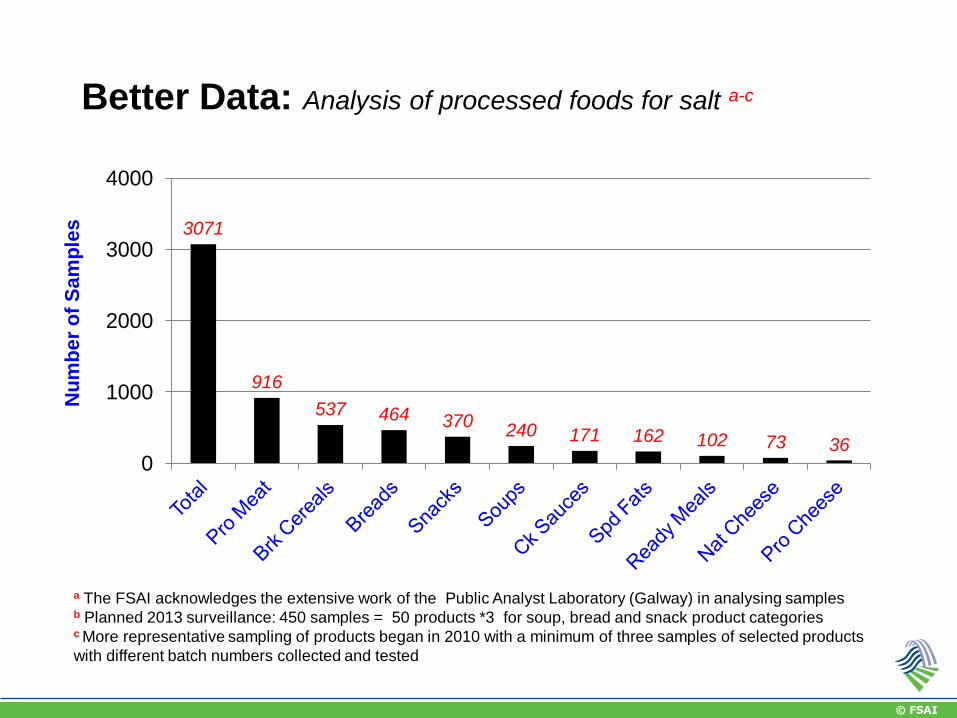
Better Data: Analysis of processed foods for salt a-c
3071
916
537 464 370 240 171 162 102 73 36
0
1000
2000
3000
4000
Nu
mb
er
of
Sam
ple
s
a The FSAI acknowledges the extensive work of the Public Analyst Laboratory (Galway) in analysing samples b Planned 2013 surveillance: 450 samples = 50 products *3 for soup, bread and snack product categories c More representative sampling of products began in 2010 with a minimum of three samples of selected products
with different batch numbers collected and tested

© FSAI
Better Data: Establishing levels of salt in processed foods
Table 2 Soup Products (Sodium in mg/100g)
Category
Mean Sodium (Std Dev) [Range] t-test
(α = 0.05) % Sodium Reduction
2005 2010 2005 v 2010 2005 to 2010
Fresh Soup 280 (76) [183 - 471] 230 (66) [90 - 380] 0.0052 18
Ambient Soup 277 (65) [202 - 433] 251 (77) [130 - 370] 0.2065 NSD
Canned Soup 362 (123) [ 208 - 641] 268 (118) [140 - 590] 0.0015 26
Dried Soup 4083 (1370) [1876 - 8609] 3320 (1055) [1430 - 6400] 0.0014 19
Total Samples 126 114
NSD = No Significant Difference
© FSAI
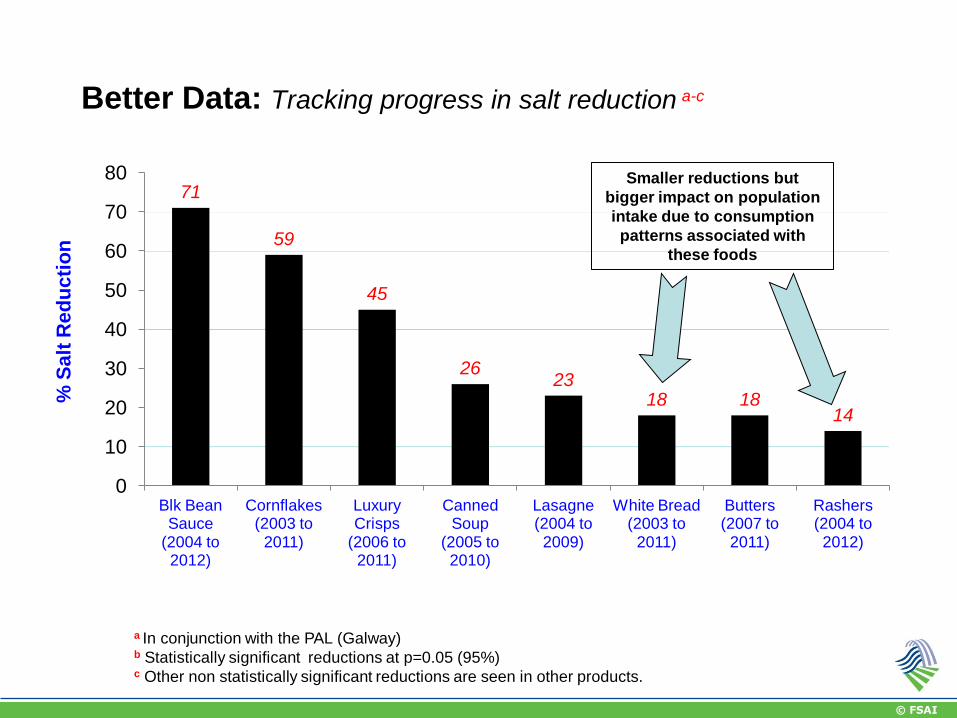
Better Data: Tracking progress in salt reduction a-c
71
59
45
26 23
18 18 14
0
10
20
30
40
50
60
70
80
Blk Bean Sauce
(2004 to 2012)
Cornflakes (2003 to
2011)
Luxury Crisps
(2006 to 2011)
Canned Soup
(2005 to 2010)
Lasagne (2004 to 2009)
White Bread (2003 to
2011)
Butters (2007 to
2011)
Rashers (2004 to 2012)
a In conjunction with the PAL (Galway) b Statistically significant reductions at p=0.05 (95%) c Other non statistically significant reductions are seen in other products.
% S
alt
Red
ucti
on
Smaller reductions but
bigger impact on population
intake due to consumption
patterns associated with
these foods
© FSAI
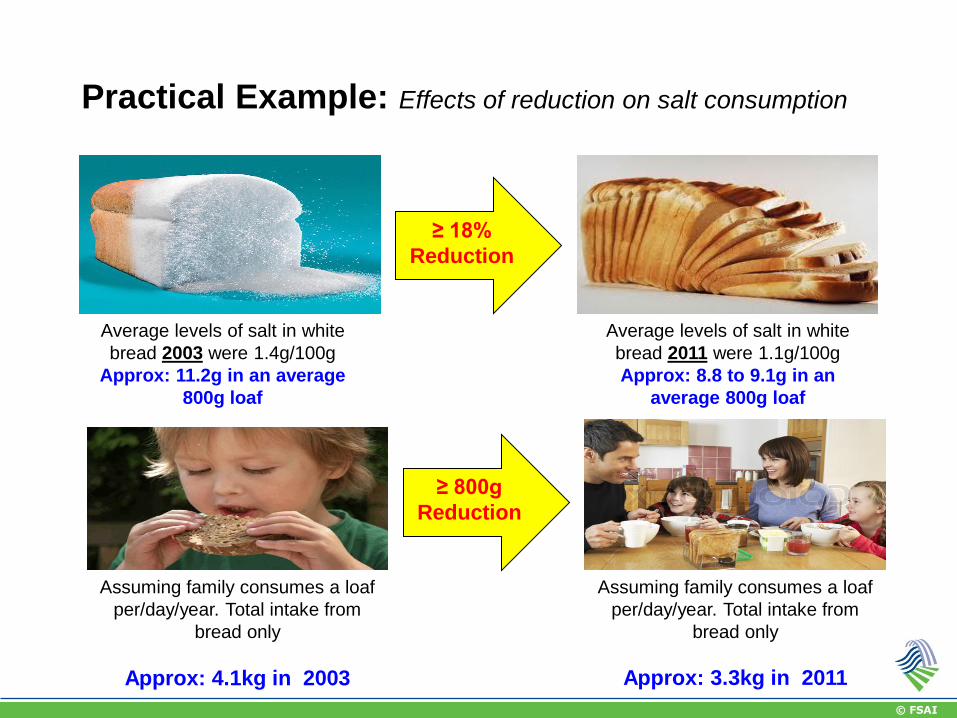
Practical Example: Effects of reduction on salt consumption
Average levels of salt in white
bread 2003 were 1.4g/100g
Approx: 11.2g in an average
800g loaf
Average levels of salt in white
bread 2011 were 1.1g/100g
Approx: 8.8 to 9.1g in an
average 800g loaf
≥ 18%
Reduction
Assuming family consumes a loaf
per/day/year. Total intake from
bread only
Approx: 4.1kg in 2003
Assuming family consumes a loaf
per/day/year. Total intake from
bread only
Approx: 3.3kg in 2011
≥ 800g
Reduction
© FSAI
Better Data: Tracking progress in salt reduction
“..... Decrease the average salt value
for processed food with a tighter
range of salt values for products
within a category.....”

© FSAI
Better Data: Tracking progress in salt reduction
Example
Average (g/100g) Std Dev (g/100g) Range (g/100g)
Date to Date Date to Date Date to Date
Dried Soup
(2005 to 2010) 10.4 8.4 3.5 2.7 4.8 - 21.9 3.6 - 16.2
Blk Bean Sauce
(2004 to 2012) 3.2 0.6 3.2 0.6 1.6 - 11.0 0.7 - 2.1
S&V Crisps
(2006 to 2011) NSD NSD 0.9 0.5 1.2 - 4.7 0.7 - 2.9
Sausages
(2004 to 2012) NSD NSD 0.6 0.4 1.2 - 4.2 1.5 - 2.7
White Bread
(2003 to 2011) 1.4 1.1 0.2 0.2 1.2 - 1.8 0.6 - 1.6
NSD = No Significant Difference
© FSAI
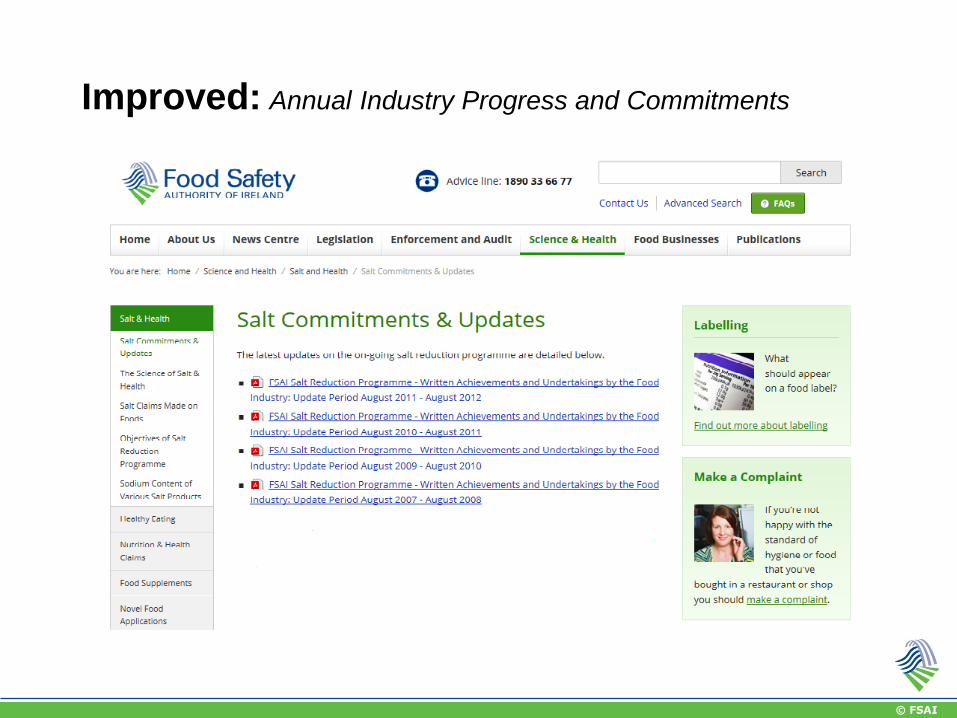
Improved: Annual Industry Progress and Commitments
© FSAI
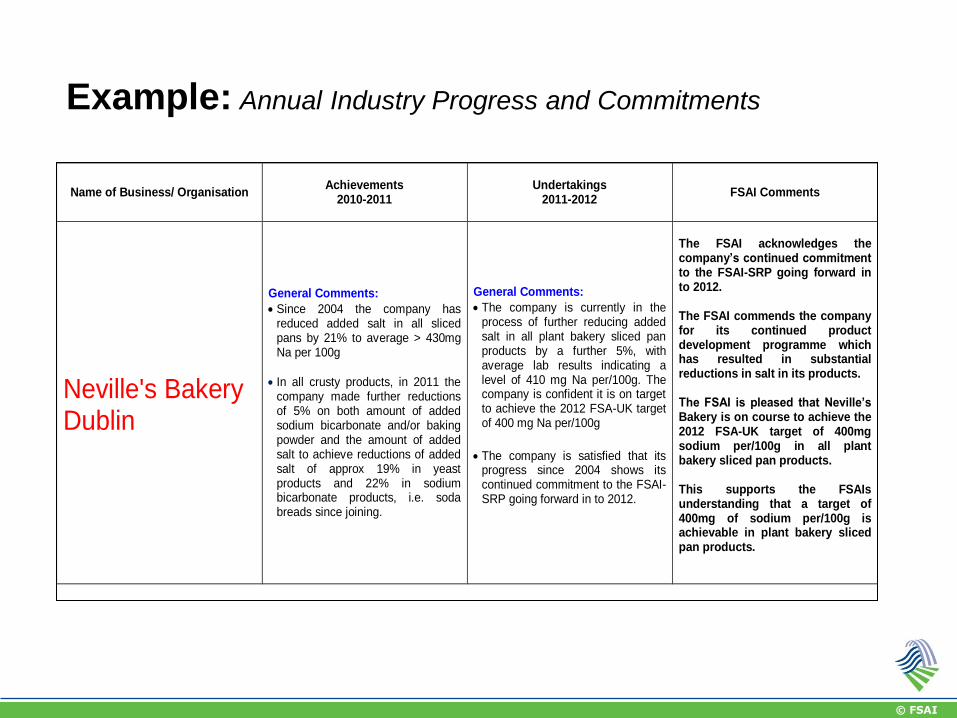
Example: Annual Industry Progress and Commitments
Name of Business/ Organisation
Achievements
2010-2011
Undertakings
2011-2012
FSAI Comments
Neville's Bakery Dublin
General Comments:
Since 2004 the company has reduced added salt in all sliced pans by 21% to average > 430mg Na per 100g
In all crusty products, in 2011 the company made further reductions of 5% on both amount of added sodium bicarbonate and/or baking powder and the amount of added salt to achieve reductions of added salt of approx 19% in yeast products and 22% in sodium bicarbonate products, i.e. soda breads since joining.
General Comments:
The company is currently in the process of further reducing added salt in all plant bakery sliced pan products by a further 5%, with average lab results indicating a level of 410 mg Na per/100g. The company is confident it is on target to achieve the 2012 FSA-UK target of 400 mg Na per/100g
The company is satisfied that its
progress since 2004 shows its continued commitment to the FSAI-SRP going forward in to 2012.
The FSAI acknowledges the company’s continued commitment to the FSAI-SRP going forward in to 2012. The FSAI commends the company for its continued product development programme which has resulted in substantial reductions in salt in its products. The FSAI is pleased that Neville’s Bakery is on course to achieve the 2012 FSA-UK target of 400mg sodium per/100g in all plant bakery sliced pan products. This supports the FSAIs understanding that a target of 400mg of sodium per/100g is achievable in plant bakery sliced pan products.
© FSAI
Summing Up: Pros cons, and realisations after 10 years
© FSAI
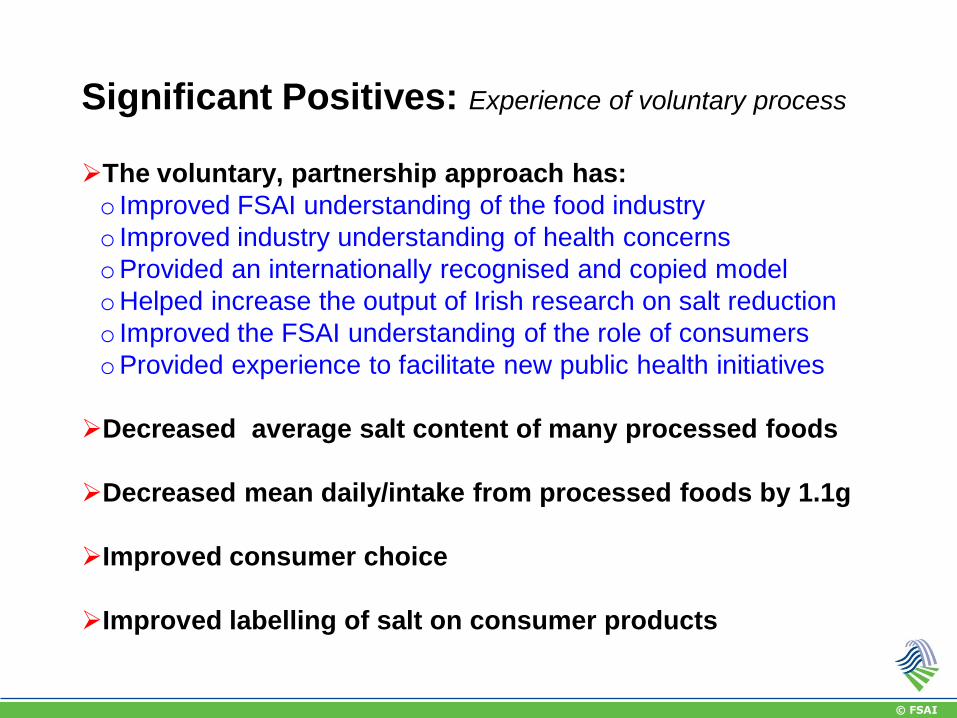
Significant Positives: Experience of voluntary process
The voluntary, partnership approach has:
o Improved FSAI understanding of the food industry
o Improved industry understanding of health concerns
oProvided an internationally recognised and copied model
oHelped increase the output of Irish research on salt reduction
o Improved the FSAI understanding of the role of consumers
oProvided experience to facilitate new public health initiatives
Decreased average salt content of many processed foods
Decreased mean daily/intake from processed foods by 1.1g
Improved consumer choice
Improved labelling of salt on consumer products
© FSAI
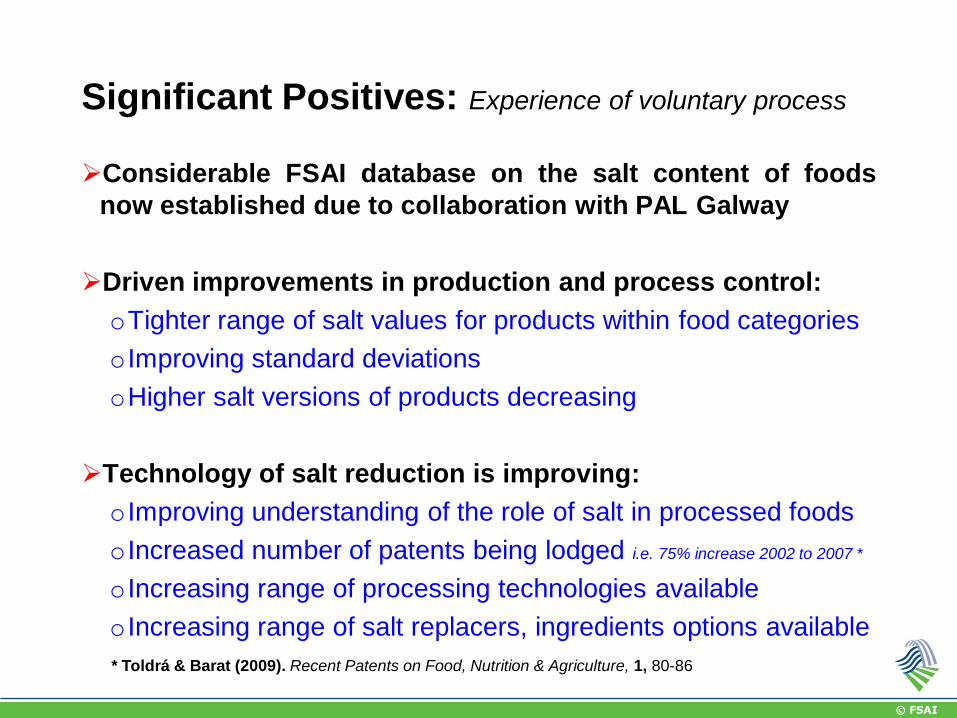
Considerable FSAI database on the salt content of foods
now established due to collaboration with PAL Galway
Driven improvements in production and process control:
oTighter range of salt values for products within food categories
o Improving standard deviations
oHigher salt versions of products decreasing
Technology of salt reduction is improving:
o Improving understanding of the role of salt in processed foods
o Increased number of patents being lodged i.e. 75% increase 2002 to 2007 *
o Increasing range of processing technologies available
o Increasing range of salt replacers, ingredients options available
Significant Positives: Experience of voluntary process
* Toldrá & Barat (2009). Recent Patents on Food, Nutrition & Agriculture, 1, 80-86
© FSAI
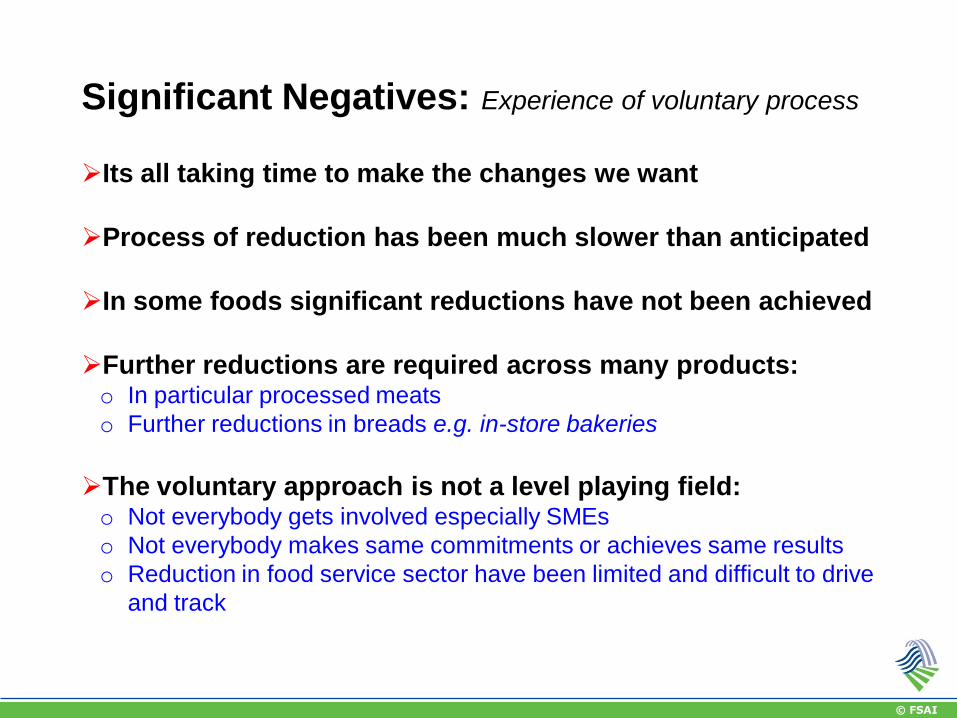
Significant Negatives: Experience of voluntary process
Its all taking time to make the changes we want
Process of reduction has been much slower than anticipated
In some foods significant reductions have not been achieved
Further reductions are required across many products: o In particular processed meats
o Further reductions in breads e.g. in-store bakeries
The voluntary approach is not a level playing field: o Not everybody gets involved especially SMEs
o Not everybody makes same commitments or achieves same results
o Reduction in food service sector have been limited and difficult to drive
and track
© FSAI
Imports often not be subject to similar reductions
There are many competing factors at play:
o Companies jockeying for competitive advantage/market share
o Escalating public health issues related to diet
o Very difficult economic conditions and a desire not to change
what is selling well
o The increasing importance of the food industry to our economy
Significant Negatives: Experience of voluntary process

© FSAI
Some Realisations: Experience of voluntary process
6g salt target will not be achieved in short/medium term
But no other country is likely to achieve this target
Discretionary salt intake maybe higher that previously thaught
Poor public awareness about the links between:
o Salt intake and health
o The salt content of processed food
o Discretionary use of salt during cooking and at table
o Consumer behaviour and consumption patterns
Investment of public money for health awareness and behavioural
change needed
© FSAI
Greater uptake by the food service sector required
Three year rolling programme of studies to assess salt
intake in Irish population needed
Technological barriers to salt reduction in some foods
remain and further research funding is needed
FSAI will continue its voluntary salt reduction programme
with monitoring and oversight of industry commitments
Any legislative approach, if considered in the future by
policy makers, should be at European Level due to the free
movement of food within the European Union.
Some Realisations: Experience of voluntary process
© FSAI