the fundamental interactions between deposits and surfaces
TRANSCRIPT

THE FUNDAMENTAL INTERACTIONS
BETWEEN DEPOSITS AND SURFACES AT
NANOSCALE USING ATOMIC FORCE
MICROSCOPY.
by
NOREEN RAZAQ AKHTAR
A thesis submitted to
The University of Birmingham
for the degree of
DOCTOR OF PHILOSOPHY
School of Chemical Engineering
University of Birmingham
June 2010
University of Birmingham Research Archive
e-theses repository This unpublished thesis/dissertation is copyright of the author and/or third parties. The intellectual property rights of the author or third parties in respect of this work are as defined by The Copyright Designs and Patents Act 1988 or as modified by any successor legislation. Any use made of information contained in this thesis/dissertation must be in accordance with that legislation and must be properly acknowledged. Further distribution or reproduction in any format is prohibited without the permission of the copyright holder.
ABSTRACT
The objective of this research was to investigate adhesion of different fouling deposits with
different contact surfaces using atomic force microscopy (AFM). In this thesis, AFM has
been employed to measure:
(i) The adhesive interactions between a colloidal silica microparticle and stainless
steel, PTFE-coated stainless steel, glass and ceramic surfaces, in the presence of a
number of solutions and suspensions of ingredients found in commercially
available toothpaste.
(ii) To compare the measurements from the AFM and micromanipulation to see the
differences and similarities. The micromanipulation technique was developed to
measure the adhesive strength of different deposits. The method uses a T-shaped
probe made of stainless steel chip, dimension 30 x 6 x 1 mm connected to the
output aperture of a transducer (Model BG-1000, Kulite Semiconductor, Leonia,
NJ. USA) which was itself mounted on a three dimensional micromanipulator
(MicroInstruments, Oxon, UK). The two measurement methods are capable of
giving quantitative results for the strength of the forces involved in adhesion; fast
moving consumer goods (FMCG) deposits, toothpaste and confectionary
stimulant deposits have been studied, and their interactions with stainless steel,
glass and PTFE surfaces measured.
(iii) Further investigation of AFM adhesion measurements, with caramel, whey protein
and sweet condensed milk (SCM) deposits after heating at 30ºC, 50ºC, 70ºC, and
90ºC. The two selected spherical microparticles used were stainless steel and
PTFE, which were attached to the end of an AFM tip.

The data shows that, for removal in all cases using micromanipulation, the pulling energy
increases with increasing height above the surface and the slope of the lines of pulling energy
versus thickness is similar. Stainless steel shows the highest pulling energy with slightly
higher energies than glass and PTFE, whilst PTFE show the lowest interaction. For the AFM
data, PTFE again gives much lower adhesion forces. This is due to the different molecular
interactions between different surfaces and caramel. There is thus partial agreement between
the two methods. The micromanipulation method measures a range of parameters – such as
the deformation and flow of the deposits, and so it might not be expected that there would be
complete agreement. Here stainless steel and glass show very similar behaviour, as opposed
to the differences seen using AFM; the different surface roughness of the two materials might
also be expected to have an effect.
At different temperatures the results from the different contact positions on the deposits; with
an approach speed to the deposits for all experiments was 3µm/s, then a 5 second pause on
the deposit and then the rate of retract was 0.25µm/s. Significant (more than an order of
magnitude) differences are seen between forces for the same and different deposits, and
between different surfaces for the same deposits. Lower forces are seen at 90ºC in all cases;
at the higher temperature, the force between surface and deposit is less. To design systems to
resist fouling, these results suggest that measurements at different process temperatures are
needed; data at room temperature has overpredicted the interactions.
The results suggest that the AFM force curve measurement technique could be used to study
a variety of food deposits that have undergone different processing conditions. The method
can help in optimising removal of food deposits in terms of food cleaning protocols. AFM

could be a valuable technique in measuring surface properties, and in relating behaviour to
surfaces.
The capability of the AFM to provide better understanding of materials structure, surface
characteristics and the interactive forces at the meso- and nanoscale level. The AFM will
enhance the understanding of large-scale engineering processes, especially as materials are
increasingly being designed down to the submicrometre level.
Presented in conference:
EFFoST/EHEDG Joint conference 2007, Practical application of research results 14-16
November 2007, Lisbon, Portugal. Investigating the fundamental interactions between
industrially relevant materials and the ingredients of toothpaste using atomic force
microscopy. N.R. Akhtar, J.Bowen, P.J.Fryer, university of Birmingham.

ACKNOWLEDGEMENTS
I would like to take this opportunity to express my gratitude to the University of Birmingham
and the School of Chemical Engineering in completing my thesis.
A massive thank you to Professor Peter Jonathan Fryer and Dr. Milla Shah, for their
encouragement, support and personal guidance.
A special thanks to Dr. James Bowen and Dr. Konstantia Asteriodiou for their stimulating
suggestions and help during the PhD.
The financial support of the Zeal project is gratefully acknowledged. Thank to the Zeal
project group for all their help, support, interest and valuable hints.
I would also like to thank all students, researchers, and academics who have given me so
much support and motivation throughout the duration of this project.
I would like to thank my Husband, Nassar Hussain, my parents, and all of our family.
I couldn’t have done it without you………….
TABLE OF CONTENTS
Nomenclature......................................................................................................................... i
CHAPTER 1: INTRODUCTION 1
1.1.1 Fouling problems. 2
1.1.2 Fouling Mechanisms 3
1.1.3 Definition of Cleaning. 4
1.1.4 Economics: Cost of fouling and cleaning. 5
1.1.5 Understanding cleaning. 6
1.1.6 Cleaning Mechanisms. 6
1.1.7 Surface interfacial parameters. 10
1.1.8 Aims of the Thesis. 12
1.1.9 Structure of Thesis. 14
Chapter One Figures 16
Chapter 2: A REVIEW OF SURFACE CLEANING 17
2.1 Fouling mechanisms. 18
2.2 Deposit-wall interaction 19
2.3 Deposit-fluid interactions 21
2.4 Methods for surface analysis 23
2.6 Surface Roughness. 28
2.7 Atomic force microscopy (AFM). 29
2.8 Studies of AFM in fouling and cleaning: 33
2.9 Micromanipulation to quantify the effects of cleaning. 39
2.1.0 Conclusions 46
Chapter 2 Figures and Tables 48
Chapter 3: MATERIAL AND METHODS. 59
3.1 Introduction and aims. 60
3.2 Surface and deposit selection and preparation. 63
3.2.1 Surfaces 63
3.2.2 Composition of Deposits. 64
3.2.3 Deposit preparation. 66
3.2.4 Deposits on surfaces. 65
3.2.5 Sample preparation for Micromanipulation. 67
3.2.6 Nanowizard II AFM: force measurements preparation. 68
3.3 AFM analysis. 71
3.3.1 Dimension 3100. 71
3.3.2 Roughness Analysis. 72
3.3.4 Cantilever spring constants. 73

3.3.5 AFM adhesion measurements 74
3.3.6 Thermal Heating Adhesion Measurements. 77
3.4 Experimental errors 77
3.5 Conclusions 79
Chapter 3 Figures and Tables: 80
Chapter 4:
Surface and deposit characterisation and toothpaste ingredients
force measurements 86
4 Surface characterisation. 88
4.1 Surface topography and roughness. 88
4.2 Scanning electron microscopy (SEM) 90
4.3 Measurements of contact angles. 91
4.4 Characterisation of surface interactions for toothpaste ingredients. 94
4.4.1 AFM Force measurements in fluid environments. 94
4.5 Conclusion 97
Chapter 4 Figures and Tables: 98
Chapter 5:
Comparison between measurements using Atomic Force Microscopy
to those of Micromanipulation. 109
5.1 AFM studies. 110
5.1.2 Caramel. 112
5.1.3 SCM 113
5.1.5 Toothpaste 114
5.2 Micromanipulation measurements. 116
5.2.1 Caramel behaviour on stainless steel, glass and PTFE surfaces. 116
5.2.2 SCM behaviour on stainless steel, glass and PTFE surfaces. 117
5.2.3 Turkish delight behaviour on stainless steel, glass and PTFE surfaces. 115
5.2.4 Toothpaste behaviour on stainless steel, glass and PTFE surfaces. 115
5.3 Discussion 120
5.4 Conclusions. 122
Chapter 5 Figures 124
Chapter 6:
Atomic Force Microscopy (AFM) experiments of caramel, whey
protein, and SCM deposits at different temperatures. 136
6.1 AFM analysis of interactions between test surfaces and heated caramel. 137
6.1.1 Different contact positions. 139
6.1.2 Different rates of retraction. 140
6.2 AFM analysis of interactions between test surfaces and SCM. 141

6.2.1 Different contact positions. 142
6.2.2 Different rates of retraction. 143
6.2.3 Different waiting times on SCM. 143
6.3.1 AFM analysis of interactions between test surfaces and Whey protein 144
6.3.2 Different rates of retraction. 145
6.3.3 Different waiting times on whey protein. 145
6.4.1 Conclusions and implications for fouling studies. 147
Chapter 6 Figures: 148
Chapter 7: CONCLUSIONS 168
7.1.1 Toothpaste ingredients force measurements 171
7.1.2
Comparison between measurements using Atomic Force Microscopy to
those of Micromanipulation. 173
7.1.3
Atomic Force Microscopy (AFM) experiments of caramel, whey protein,
and SCM deposits at different temperatures. 175
7.1.4 Future work 177
REFERENCES......................................................................................................................... 179

LIST OF FIGURES
Figure 1-1: Cleaning map: shows a range of cleaning issues from the food and personal product industries,
demonstrating that clusters of similar problems are found. The systems that are most difficult
to clean are shown in the shaded area; It can thus be define three types of soil that are most
difficult to clean.
Figure 2-1: Interfacial tensions at the three phase contact line. R is the radius of the drop base and h is the
height of droplet. The drop is small enough, thus, the gravity action can be neglected.
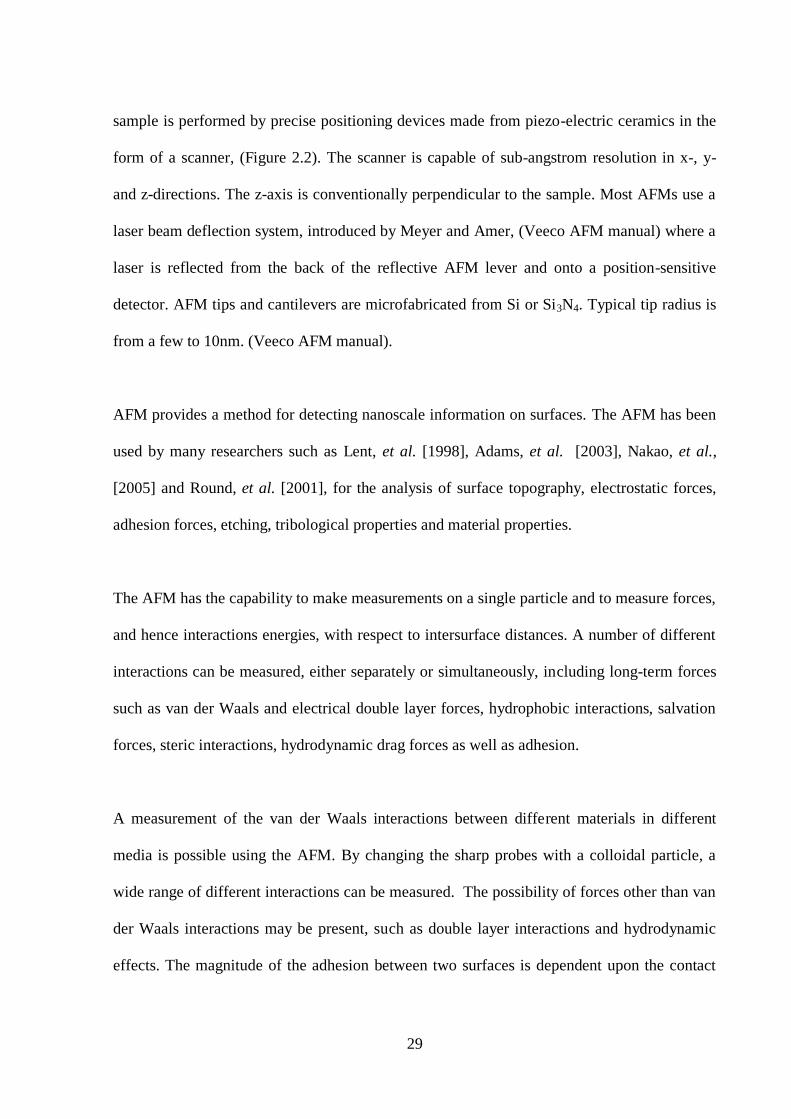
Figure 2-2: Image of AFM Scanner.
Figure 2-3: Etched logo of project on polycarbonate surface using a diamond probe with the AFM.
Figure 2-4: Micromanipulation rig at the University of Birmingham.
Figure 2-5: Schematic of the T-shaped probe, fouling sample and stainless steel disc.
Figure 2-6: The sequence of fouling sample pulling processes by the T-shaped probe: (A) (B) (C)
(D).
Figure 2-7: Typical curve showing force versus sampling time for pulling a fouling sample.
Figure 2-8: Variation of apparent adhesive strength with surface free energy (a) for baked and unbaked
tomato pastes; (b) for unbaked tomato paste samples of different thicknesses.
Figure 2-9: Variation of apparent adhesive strength with thickness for unbaked tomato paste deposits (a)
onto three surfaces of energy 20-25 mN/m, showing a good fit to a straight line as suggested
by equation (2.4), (b) onto four surfaces of energy >25mN/m, showing increasing deviation
from linearity with surface energy (c) at the minimum apparent adhesive strength, showing a
good straight line.
Figure 3-1: Nanowizard II AFM (JPK Berlin).
Figure 3-2: Dimension 3100 AFM (Veeco, UK).
Figure 3-3: Stainless steel particle attached to AFM Tipless cantilever, at 50µm by 50µm.
Figure 3-4: Stainless steel particles at 100µm by 100µm
Figure 3-5: Multimode Mode AFM ( Veeco, UK).
Figure 3-6: The AFM set up at the University of Birmingham.
Figure 3-7: Hypothetical AFM deflection-displacement force curve. It is based on a diagram from the
Veeco, MultiMode™ AFM Instruction Manual.
Figure 4-1: AFM topographic scans of the four surfaces (100µm by 100µm Scan). The ceramic and
stainless steel are rougher than PTFE and glass. This is seen by the imperfections in the
images.
Figure 4-2: SEM images of the microstructure of the four surfaces of interest at 50µm scan size. Ceramic
and stainless steel show increased roughness compared to PTFE and glass.
Figure 4-3: Goniometer used for contact angle experiments.
Figure 4-4 (a): Contact angles on the four surfaces with water and sorbitol, repeated least five times.
Figure 4-4 (b): Surface energies of sorbitol and water on the four surfaces, calculated from
Young’s equation.
Figure 4-5: Images of water drops on the four surfaces, showing typical contact angles:
Figure 4-5 (a): Water drop on ceramic
Figure 4-5 (b): Water drop on glass
Figure 4-5 (c): Water drop on PTFE
Figure 4-5 (d): Water drop on stainless steel
Figure 4-6: AFM force plots.
Figure 4-6 (a): Example of a retract plot recorded in Zinc citrate solution in the presence of a glass surface
using an AFM cantilever modified with a SiO2 microparticle. Zero is no deflection.
Figure 4-6 (b): Example of retract plot recorded during water in the presence of a stainless steel surface using
an AFM cantilever modified with a SiO2 microparticle. This is a typical ‘‘hydrophobic effect’’
curve.
Figure 4-6(c): Example of retract plot recorded in sorbitol solution in the presence of a stainless steel surface
using an AFM cantilever modified with a SiO2 microparticle.
Figure 4-6(d): Example of retract plot recorded in sorbitol solution in the presence of PTFE surface using an
AFM cantilever modified with a SiO2 microparticle.
Figure 4-6(e): Example of retract plot recorded in water in the presence of PTFE surface using an AFM
cantilever modified with a SiO2 microparticle.
Figure 4-7 (a): Example of retract plot recorded in saccharin solution in the presence of a ceramic surface
using an AFM cantilever modified with a SiO2 microparticle. (Velocity of 2000 nm s-1
).
Figure 4-7 (c): Example of retract plot recorded during saccharin solution in the presence of a ceramic surface
using an AFM cantilever modified with a SiO2 microparticle. (Velocity of 14000 nm s-1
).

Figure 5-1: Removal of toothpaste from stainless steel using the micromanipulation rig, at a cut height of
20 µm. On the left is a stainless steel disc fully covered with toothpaste. The middle is
partially removed toothpaste. On the right is the surface after passage of the probe. The probe
was moved at 1.1 mm/s over a displacement of 1.5 mm.
Figure 5.2-1: Interaction between stainless steel microparticles and caramel, measured using the AFM. Data
shows local variation of 5 points at each of the 5 regions on the caramel deposit; error bar
shows the equipment error per measurement.
Figure 5.2-2: AFM force measurements of Stainless steel, glass and PTFE microparticles immersed in
caramel (spread out between 50µm to 60µm thick on a glass slide) and then retracted. Data
shows results from five different contact positions on the caramel deposit. Error bars represent
the global variation of the mean of five experiments. The approach speed for all experiments
was 3µm/s, and then a 5 second pause on deposit and 0.25µm/s retract.
Figure 5-3: AFM force measurements of Stainless steel, glass and PTFE microparticles were immersed in
SCM and then retracted off the deposit. SCM was spread out between 50µm to 60µm thick on
a glass slide. The approach speed for all experiments was 3µm/s, and then a 5 second pause on
deposit and 0.25µm/s retract. Data shows the mean of five experiments at each of five.
Figure 5-4: AFM force measurements of Stainless steel, glass and PTFE microparticles were immersed in
Turkish delight and then retracted off the deposit. Turkish delight was spread out between
50µm to 60µm thick on a glass slide. The approach speed for all experiments was 3µm/s, and
then a 5 second pause on deposit and 0.25µm/s retract. Data shows the mean of five
experiments at each of five different contact positions on the Turkish delight deposit.
Figure 5-5: AFM force measurements of Stainless steel, glass and PTFE microparticles were immersed in
Toothpaste and then retracted off the deposit. Toothpaste was spread out between 50µm to
60µm thick on a glass slide. The approach speed for all experiments was 3µm/s, and then a 5
second pause on deposit and 0.25µm/s retract. Data shows the mean of five experiments at
each of five different contact positions on the Toothpaste deposit.
Figure 5-6: Summary of the forces measured by AFM for the different microparticles and all four
deposits.
Figure 5-7: Pulling energy for removal of caramel deposit using the micromanipulation probe. The gap
between probe and substrate was kept at 20, 100, 200, 300 and 400µm, the surfaces used were
stainless steel, glass and PTFE.
Figure 5-8: Pulling energy for removal of SCM deposit using the micromanipulation probe. The gap
between probe and substrate was kept at 20, 100, 200, 300 and 400µm, the surfaces used were
stainless steel, glass and PTFE.

Figure 5-9: Pulling energy for removal of Turkish delight deposit using the micromanipulation probe.
The gap between probe and substrate was kept at 20, 100, 200, 300 and 400µm, the surfaces
used were stainless steel, glass and PTFE.
Figure 5.-10: Pulling energy for removal of Toothpaste deposit using the micromanipulation probe. The gap
between probe and substrate was kept at 20, 100, 200, 300 and 400 µm, the surfaces used were
stainless steel, glass and PTFE.
Figure 5-11: Summary of Micromanipulation experiments at 20µm thickness of caramel, SCM, Turkish
delight and toothpaste on glass, stainless steel and PTFE.
Figure 6-1: The Nanowizard II (JPK) adapted with a heating stage (JPK).
Figures 6.2.1: Force measurements of Stainless steel microparticle immersed in caramel and then retracted
off the deposit. Caramel was spread out between 50µm to 60µm thick on a glass slide, then
the caramel was heated for 5 minutes at each temperature and the temperature was monitored
and controlled at required temperature. Data shows results from five different contact
positions on the caramel deposit. The approach speed for all experiments was 3µm/s, then a
5 second pause on deposit and rate of retract was 0.25µm/s. The data shows variation of the
mean of the five experiments. (The error bars show the average of five experiments)
Figure 6-2-2: Force measurements of Stainless steel microparticle immersed in caramel and then retracted
off the deposit, at variable rates. The deposit was spread out between 50µm to 60µm thick on
a glass slide, then the caramel was heated for 5 minutes at each temperature and the
temperature was monitored and controlled at the required temperature. The retract speed for
all experiments was 0.25, 0.75, 1.00, 1.5, 3 and 5µm/s. The tip was held on the deposit for 5
seconds before retraction.
Figure 6-2-3: Force measurements of Stainless steel microparticle immersed in caramel and then retracted
off the deposit, at variable times on caramel. The deposit was spread out between 50µm to
60µm thick on a glass slide, then the caramel was heated for 5 minutes at each temperature
and the temperature was monitored and controlled at the required temperature. The waiting
times on the deposits for the experiments were 0, 0.5, 1.0, 5.0 and 10 seconds. The approach
speed for all experiments was 3µm/s and a rate of retract was 0.25µm/s.
Figure 6-3-1: Force measurements of PTFE microparticle immersed in caramel and then retracted off the
deposit. Caramel was spread out between 50µm to 60µm thick on a glass slide, then the
caramel was heated for 5 minutes at each temperature and the temperature was monitored and
controlled at required temperature. Data shows results from five different contact positions on
the caramel deposit. The approach speed for all experiments was 3µm/s, then a 5 second pause

on deposit and rate of retract was 0.25µm/s. The data shows a global variation of the mean of
the five experiments.
Figure 6-3-2: Force measurements of PTFE microparticle immersed in caramel and then retracted off the
deposit, at variable rates on caramel. The deposit was spread out between 50µm to 60µm thick
on a glass slide, then the caramel was heated for 5 minutes at each temperature and the
temperature was monitored and controlled at the required temperature. The retract speed for
all experiments was 0.25, 0.75, 1.00, 1.5, 3 and 5µm/s. The tip was held on deposit for 5
seconds.
Figure 6-3-3: Force measurements of PTFE microparticle immersed in caramel and then retracted off the
deposit, at variable times on caramel. The deposit was spread out between 50µm to 60µm
thick on a glass slide, then the caramel was heated for 5 minutes at each temperature and
the temperature was monitored and controlled at the required temperature. The waiting times
on the deposits for the experiments were 0, 0.5, 1.0, 5.0 and 10 seconds. The approach speed
for all experiments was 3µm/s and a rate of retract was 0.25µm/s.
Figure 6-4-1: Force measurements of stainless steel microparticle immersed in SCM and then retracted off
the deposit. SCM was spread out between 50µm to 60µm thick on a glass slide, then the SCM
was heated for 5 minutes at each temperature and the temperature was monitored and
controlled at required temperature. Data shows results from five different contact positions on
the SCM deposit. The approach speed for all experiments was 3µm/s, then a 5 second
pause on deposit and rate of retract was 0.25µm/s. The data shows a global variation of the
mean of the five experiments.
Figure 6-4-2: Force measurements of stainless steel microparticle immersed in SCM and then retracted off
the deposit, at variable rates on SCM. The deposit was spread out between 50µm to 60µm
thick on a glass slide, then the SCM was heated for 5 minutes at each temperature and the
temperature was monitored and controlled at the required temperature. The retract speed for al
experiments was 0.25, 0.75, 1.00, 1.5, 3 and 5µm/s. The tip was held on deposit for 5 seconds.
Figure 6-4-3: Force measurements of stainless steel microparticle immersed in SCM and then retracted off
the deposit, at variable times on SCM. The deposit was spread out between 50µm to 60µm
thick on a glass slide, then the SCM was heated for 5 minutes at each temperature and the
temperature was monitored and controlled at the required temperature. The waiting times on
the deposits for the experiments were 0, 0.5, 1.0, 5.0, 10 and 60 seconds. The approach speed
for all experiments was 3µm/s and a rate of retract was 0.25µm/s.

Figure 6-5-1: Force measurements of PTFE microparticle immersed in SCM and then retracted off the
deposit. SCM was spread out between 50µm to 60µm thick on a glass slide, then the SCM
was heated for 5 minutes at each temperature and the temperature was monitored and
controlled at required temperature. Data shows results from five different contact positions
on the SCM deposit. The approach speed for all experiments was 3µm/s, then a 5 second
pause on deposit and rate of retract was 0.25µm/s. The data shows a global variation of the
mean of the five experiments.
Figure 6-5-2: Force measurements of PTFE microparticle immersed in SCM and then retracted off the
deposit, at variable rates on SCM. The deposit was spread out between 50µm to 60µm thick o
a glass slide, then the SCM was heated for 5 minutes at each temperature and the temperature
was monitored and controlled at the required temperature. .
Figure 6-5-3: Force measurements of PTFE microparticle immersed in SCM and then retracted off
the deposit, at variable times on SCM. The deposit was spread out between 50µm to 60µm
thick on a glass slide, then the SCM was heated for 5 minutes at each temperature and the
temperature was monitored and controlled at the required temperature. The waiting times on
the deposits for the experiments were 0, 0.5, 1.0, 5.0, 10, 20 and 60 seconds. The
approach speed for all experiments was 3µm/s and a rate of retract was 0.25µm/s.
Figure 6-6-1: Force measurements of stainless steel microparticle immersed in whey protein and then
retracted off the deposit. Whey protein was spread out between 50µm to 60µm thick on a
slide, then the whey protein was heated for 5 minutes at each temperature and the temperature
was monitored and controlled at required temperature. Data shows results from five different
contact positions on the whey protein deposit. The approach speed for all experiments was
3µm/s, then a 5 second pause on deposit and rate of retract was 0.25µm/s. The data shows a
global variation of the mean of the five experiments.
Figure 6-6-2: Force measurements of stainless steel microparticle immersed in whey protein and then
retracted off the deposit, at variable rates on whey protein. The deposit was spread out
50µm to 60µm thick on a glass slide, then the whey protein was heated for 5 minutes at each
temperature and the temperature was monitored and controlled at the required temperature.
The retract speed for all experiments was 0.25, 0.75, 1.00, 1.5, 3 and 5µm/s. The tip was held
on deposit for 5 seconds.
Figure 6-6-3: Force measurements of stainless steel microparticle immersed in whey protein and then
retracted off the deposit, at variable times on whey protein. The deposit was spread out
between 50µm to 60µm thick on a glass slide, then the whey protein was heated for 5 minutes

at each temperature and the temperature was monitored and controlled at the required
temperature.
Figure 6-7-1: Force measurements of PTFE microparticle immersed in whey protein and then retracted off
the deposit. Whey protein was spread out between 50µm to 60µm thick on a glass slide, then
the whey protein was heated for 5 minutes at each temperature and the temperature
was monitored and controlled at required temperature. Data shows results from five different
contact positions on the whey protein deposit. The approach speed for all experiments was
3µm/s, then a 5 second pause on deposit and rate of retract was 0.25µm/s. The data shows a
global variation of the mean of the five experiments.
Figure 6-7-2: Force measurements of PTFE microparticle immersed in whey protein and then retracted off
the deposit, at variable rates on whey protein. The deposit was spread out between 50µm to
60µm thick on a glass slide, then the whey protein was heated for 5 minutes at each
temperature and the temperature was monitored and controlled at the required temperature.
The retract speed for all experiments was 0.25, 0.75, 1.00, 1.5, 3 and 5µm/s. The tip was held
on deposit for 5 seconds.
Figure 6-7-3: Force measurements of PTFE microparticle immersed in whey protein and then retracted off
the deposit, at variable times on whey protein. The deposit was spread out between 50µm to
60µm thick on a glass slide, then the whey protein was heated for 5 minutes at each
temperature and the temperature was monitored and controlled at the required temperature.
The waiting times on the deposits for the experiments were 0, 0.5, 1.0, 5.0, 10, 20 and 60
seconds.
Figure 6-7-4: Summary of Log force measurements of stainless steel and PTFE microparticle immersed in
caramel, SCM and whey protein. Data shows results from different contact positions on the
deposits. The approach speed for all experiments was 3µm/s, then a 5 second pause on deposit
and rate of retract was 0.25µm/s at 30ºC and 90C.

LIST OF TABLES
Table 2-1: Surface characterisation techniques: To characterize surfaces a wide range of experimental
tools is available. Some equipment can be used in combination with each other to help create a
better picture. Imaging, profilometry and/or quantitative measurements of film thickness can
be determined by the following equipment
Table 2-2: Elemental composition and chemical state measurement can be determined by the
following techniques.
Table 2-3: Microstructure, crystallography, and defects measurements can be determined.
Table 3-1: Ingredients and composition of SCM, caramel, Turkish delight and toothpaste.
Table 4-1: Roughness analyses of the stainless steel, PTFE, ceramic and glass surfaces, using the D3100
AFM. Data is an average of a least 5 points.
Table 4-2: Pull-off forces between silica microparticle and materials in the presence of aqueous media.
The experiments were repeated at least five times.

NOMENCLATURE
Abbreviations
AFM Atomic Force Microscopy
AES Auger electron spectroscopy
CVD Chemical vapour deposition
CIP Cleaning in practice
DLC Diamond- like carbon
EELS High-resolution electron energy-loss
spectroscopy
EDS Energy-dispersive X-ray
FMCG Fast moving consumer goods
FT Raman Fourier transformation Raman
spectroscopy
LSM Light microscopy
HRTEM High- resolution transmission electron
microscopy
LEED Low-energy electron diffraction
Ni-P-PTFE Nickel-Phosphorous-
Polytetrafluoroethylene
PTFE Polytetrafluoroethylene
RMS Root Mean
SCM Sweet condensed milk
STM Scanning tunnelling microscopy
TEM Transmission Electron Microscopy
UV/Vis UV-Visible spectroscopy
VASE Variable angle spectroscopic ellipsometry
WPC Whey Protein Concentrate
XPS X-ray photoelectron spectroscopy
XRD X-ray diffraction
F/R Force/radius
Hookes law, F= -kz F is the force
k is the stiffness of the lever
z is the distance the lever bent
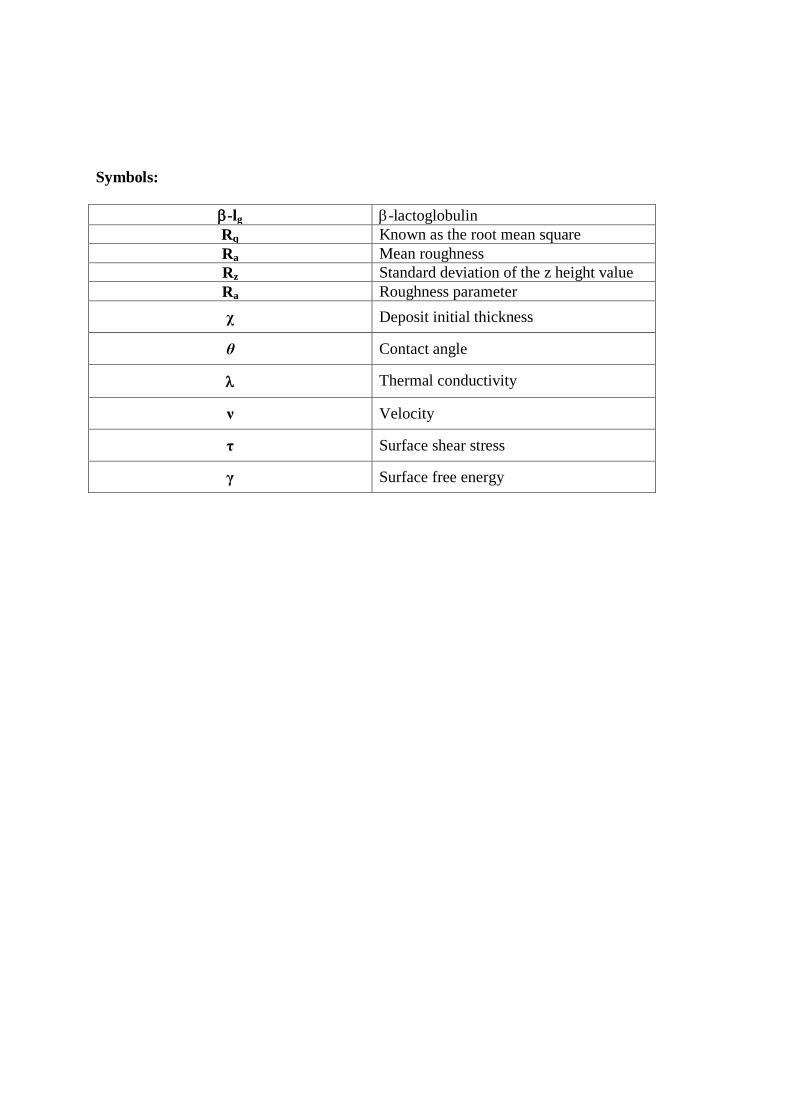
Symbols:
-lg -lactoglobulin
Rq Known as the root mean square
Ra Mean roughness
Rz Standard deviation of the z height value
Ra Roughness parameter
χ Deposit initial thickness
θ Contact angle
Thermal conductivity
ν Velocity
τ Surface shear stress
γ Surface free energy

1
CHAPTER 1: INTRODUCTION
Much work has been done in order to reduce the formation of fouling deposits. In food
production, it is often not possible to change product ingredients and process conditions to
reduce fouling. As a result, recent works by Wilson, et al. [2006], Müller-Steinhagen, et al.
[2005] and Watkinson, et al. [2003 have focussed on effective cleaning methods].
To understand any cleaning process, it is imperative to determine how soil deposits are
removed from process surfaces. Additionally it is necessary to measure the forces required to
remove these soils and their sensitivity to process variables such as temperature and flow
velocity, this could help to reduce effluent and energy used in cleaning. This data could then
be used as a basis for modelling and control of industrial cleaning processes.
Cleaning of fast moving consumer goods (FMCG) in the food industry is still poorly
understood. This chapter outlines how fouling research has benefited from the use of a
simplified classification of mechanisms. Parallel classifications for cleaning problems have
been proposed; one based on soil type and the other focused on cleaning mechanism. The aim
of the classification is firstly to allow results from different cleaning problems to be compared
and secondly to aid in the development of solutions that can be effectively transferred to the
food industry.

2
A set of deposits have been selected that are representative of different types of industrial
cleaning problems. These deposits: toothpaste, caramel, Turkish delight, sweet condensed
milk and whey protein, are then studied in the rest of the thesis.
1.1.1 Fouling problems.
Cleaning is required to remove deposit layers which are known as fouling and which form on
the surface of industrial plants by deposition of material from the surrounding fluids during
production. The issue of fouling problems have been known since the first heat exchangers
were used until about 1920, empirical methods were devised to overcome the problem of
fouling, during this period scientific knowledge of the mechanisms involved was limited
[Somerscales, et al. 1988]. Many researchers have since used a scientific approach to study
fouling such as Somerscales, et al. [1988], Changani, et al. [1997] and Verran, et al. [2002].
Fouling mechanisms have been identified and are described below:
Reaction fouling: where the fouling deposit results from the reaction of some
component of the fluid. This occurs in areas as diverse as milk and protein
denaturation, (see Changani, et al. [1997]) and petroleum engineering (see Yun-ren
Qiu, et al. [2009]).
Biological fouling: this can occur across several length scales, from the adhesion of
single organisms to the growth of biofilms (see Verran, et al. [2002]; Boulangé-
Petermann, et al. [2006]).
Crystallisation or precipitation fouling: here some component of the fluid is deposited
when its solubility limit is exceeded, such as calcium carbonate from boiling water or

3
calcium phosphate (whose solubility decreases with increasing temperature). A special
case of this is described in Helalizadeh et al. [2000].
Particulate fouling: the adhesion of particles which are transferred from the bulk onto
the surface, such as the deposition of magnetite particles from cooling water, dust
from air, or protein aggregates onto surfaces (see Simmons, et al. [2007]).
Corrosion fouling: fouling resulting from the corrosion of the surface. This can be in
situ, from the surface itself, or ex situ, via deposition of corrosion products formed
elsewhere (although this occurs via a particulate fouling mechanism).
These are the main types, but another type can be found, especially in processing of highly
viscous food and personal care products, Solidification fouling: the solidification of the fluid
or components of the fluid onto the surface (Sharma, et al. [1982]; Fernandez-Torres, et al.
[2001]), for example solidification of ice from water, starch from a food fluid, or, as in
personal care product processing, deposition of waxes in cosmetics.
1.1.2 Fouling Mechanisms
The processes of fouling can be further classified as a 5x5 matrix, Epstein [1983] in that
fouling from the five mechanisms involves 5 stages;
(i) Initiation: there may be some time before significant fouling starts, usually felt
to be due to some surface conditioning process,
(ii) Transport of fouling species to the surface,
(iii) Attachment of fouling material,
(iv) Removal – the fouling process is often modelled as a balance between
deposition and removal and,

4
(v) Ageing; in which the native deposit changes in structure and properties, for
example the browning and hardening of food deposits. This is the most
difficult step to predict and model;
It is also clear that repeated exposure to fouling and cleaning cycles changes the surface and
its fouling/cleaning properties [Jullien, et al. 2008].
1.1.3 Definition of Cleaning.
Cleaning can be described as the removal of unwanted deposits to return a system to its
original state after fouling occurs. The cleaning requirement of a system depends on the
process. Different classifications for the extent of cleaning are possible, outlined below:
physically: no physical measurement of the deposit is possible;
chemically: absence of substances that may interfere with product processing;
biologically (or sterile): free of microorganisms.
Fast moving consumer goods (FMCG) industries clean using a process called ‗cleaning-in-
place‘ (CIP). Here, an automated system provides a set of programs to rinse and recirculate
cleaning solutions through the equipment.
CIP regimes generally involve a number of cycles (Adnan Tamime, [2008]):
pre-rinse- circulation of water to remove loosely bound substances from the surface
and bulk,
detergent cycle- action of the cleaning chemical (typically acid or alkali) to release the
deposit from the surface. The resulting components are held in solution and removed
5
with the fluid flow. The majority of cleaning takes place during this cycle, and
sometimes a recycle,
post rinse- all traces of deposit and cleaning chemical are removed from the system by
circulation of water,
sanitization- using disinfection and surface conditioning,
final rinse- circulation of water prior to product processing. This could also been done
at a different temperature to give sterility.
CIP still requires development to increase efficiency: if it were possible to increase the time
between cleaning regimes or decrease CIP cycle time this would in effect increase production
times. Different chemicals are circulated to remove deposits; alternatively surfaces can be
subjected to sprays or jets of the cleaning chemicals. These processes have become highly
developed and automated, but are rarely fully optimised. Cleaning regimes have a number of
environmental impacts. Use of chemicals, water, steam and energy causes an increase in the
carbon footprint.
1.1.4 Economics: Cost of fouling and cleaning.
The direct costs of fouling and cleaning have been categorised by Gillham [1997]:
Loss of production: reduced process efficiency and the need to shut down to clean;
Maintenance costs: due to the necessity to install complex cleaning processes;
Fuel costs: increased heating and pumping power to maintain process conditions;
Capital expenditure: overestimating heat exchanger area and installation of extra pump
capacity to allow for fouling.
6
Environmental effects: are of increasingly importance. There are increasing global
concerns to reduce the amount of waste from food production and lessen C02
emissions.
1.1.5 Understanding cleaning.
If fouling did not occur the process of cleaning would not be required, but we still would
require cleaning after a product change over. However, extensive research has not yet found a
prevention method thus cleaning must still take place. Understanding cleaning requires
knowledge of the following aspects:
Deposit removal; understanding of how the deposit is removed will allow the process
to be improved.
Cleaning process parameters; these include cleaning fluid, temperature, chemical
type, chemical concentration and flow rate.
Process plant design; i.e. reduce the ‗dead legs‘ within the system and construction of
the plant to use material that is easily cleaned and maintained.
Cleaning regime; such as the order and duration of circulation of cleaning chemicals
and rinse waters. Knowledge of a regime to ensure cleaning in the shortest time and
with the lowest use of chemicals and water is desirable.
Monitoring the extent of cleaning; all of the above factors could be optimised if the
level of cleaning throughout the plant is sensitively and accurately known.
1.1.6 Cleaning Mechanisms.
Regular cleaning in-place can be very expensive in terms of downtime and materials
[Changani, et al. 1997]. To optimise the time for cleaning, it is essential to understand the
7
removal mechanism and to gain some knowledge of material behaviour during cleaning. This
can decrease maintenance cost and production losses; furthermore a better understanding of
cleaning could reduce contamination and breakdowns. ClP to remove deposit from process
equipment is often not a simple task, due to the highly complex chemistry of the processes
that give rise to deposition [Changani, et al. 1997]. The rate and extent of food fouling is a
function of many variables. Three layers within the process are involved during cleaning of
the food deposit:
A solid layer: the surfaces of process equipment in FMCG factories that are cleaned such
as pipes, valves, filters, vessels, and plate heat exchangers. The soiled surface materials
that may need to be cleaned may include: stainless steel (plant surfaces and valves),
copper (heat exchanger), and metal alloys. The civil construction surfaces of factories are
made of ceramics, plastics and glass.
An adherent deposit layer: The severity of the fouling deposit differs depending on the
material properties:
low viscosity fluids: here the fluid forming the ‗deposit‘ is water or has properties
close to water; examples are the emptying of pipes and tanks containing milk or beer
between process runs,
high viscosity fluids: here the deposit is a highly viscous (perhaps viscoelastic) fluid,
such as layers of toothpaste or shampoo left on the walls of process equipment in
personal product processing, or starch from food sauces. The viscosity of these fluids
may be several thousand times that of water,
cohesive solids: here the fouling deposit behaves as a solid; different deposits have
very different material properties, ranging from the soft protein gel films formed from
8
milk or other food fluids to the very hard solid scales generated by precipitated
minerals, (Figure 1.1: Produced by the Zeal Project part of the University of
Birmingham, Chemical Engineering).
A liquid: The cleaning fluids that are used include caustic detergents, (e.g 0.3%
NaOH(aq) which predominates in FMCG factories, rinse water and acid detergents. The
physical and chemicals properties of the deposit control the type of chemical needed.
cold water: some soils are sufficiently weakly bound to the surface that they can be
removed by rinsing with cold water alone.
hot water: in personal products processing it is common to clean by circulation of hot
water – product removed may then be able to be recycled.
hot cleaning fluid: many deposits are either impossible to remove by water alone or
removal would take an unacceptable amount of time; cleaning chemicals (based
around acid or alkali) are thus used to speed the cleaning process. Obviously the
environmental impact of these fluids is potentially much greater.
A wide variety of fouling deposits are formed which require different cleaning conditions.
Figure 1.1 shows cleaning problems classified in a two-dimensional plot. The two axes are
type of cleaning fluid against the soil complexity.
Figure 1.1 shows a range of cleaning issues from the food and personal product industries,
demonstrating that clusters of similar problems are found. A cross-section of cleaning
problems are shown in the shaded area; three types of soil can be defined:

9
Type 1: cleaning of highly viscous or viscoelastic fluids by water. In personal products, the
fouling film (such as toothpaste, shampoo, and creams) is often the same as the process fluid,
and so forms by solidification. Similar problems are found with viscous foods such as starch-
based sauces and confectionary fluids. However, these materials can be removed by the action
of water alone.
hard cohesive: these include proteinaceous soils as well as mineral scales formed from
dissolved salts in the fluid. These form solid and adhesive deposits that have to be
removed using hot cleaning chemical.
Type 2: cleaning and sterlisation of biofilms. Although it is possible to remove some biofilms
with water alone more usually some biocide is used to kill adhered organisms which changes
the removal characteristics (such as in Burfoot and Middleton, [2008])
biofilms; layers of bacteria and/or yeasts which adhere and grow on surfaces. These
are less adhesive than the solid soils and are removed with hot biocidal solution.
Type 3: cleaning of solid deposits by chemical action: formed by components of the process
fluid as a result of one or more of the fouling mechanisms and which require cleaning
chemicals for efficient deposit removal. The nature of the deposit will determine the type of
cleaning chemical used; such as sodium hydroxide to remove organic films and acids to
remove mineral scales.
complex fluids: these include many home and personal care fluids, such as toothpastes,
shampoos and detergents, which form deposits that are essentially composed of the
product. These are commonly removed by hot water in a rinsing step.

10
1.1.7 Surface interfacial parameters.
In the food industry a hygienic surface needs to be smooth, easy to clean, able to resist wear
and must retain its hygienic qualities. Stainless steel is the most common food contact
material used in industry being stable at a variety of temperatures, inert, relatively resistant to
corrosion, and it may be treated mechanically or electrolytically to obtain surfaces which are
easy to clean. It is able to maintain this surface through many operating cycles [Boulange-
Petermann, 1996].
Most surfaces have a complex structure; the properties depend on the nature of the solid and
the method of surface processing. The surface parameters arise from the interactions of the
surface and foulant, and the interaction between the surface and the environment. The
properties of the surface are crucial because they affect the real area of contact, the friction,
the wear, and the lubrication [Liang, 2004]. Interfacial parameters play a vital role in fouling
and cleaning.
Surface modification has often been proposed as a solution to the surface interfacial fouling
problem [such as Woo et al. 2009 and Nermen Maximous et al. 2009]. The move towards
surface modification promises to provide a revolution in fouling and cleaning studies. The
criteria for the success of modified surfaces are their ability to reduce the amount of fouling
formed, or the rate of formation and lengthen the induction period before fouling is
significant. Surface modification is an alteration of the surface of substrate material (normally
metal) to transform it to a new surface which has much better functions (e.g. chemical
resistance, corrosion resistance, abrasive wear resistance, electrical properties and non-stick).

11
This modification can be done by coating the surface or inclusion of certain elements on the
surface. Surface modification has been proposed as one solution to the fouling problem
[Muller-Steinhagen et al. 2000].
The interaction between the heat transfer surface and the process fluid is obviously critical in
fouling. Surface free energy, for instance, is one of the surface properties that may affect both
the fouling and cleaning rates. Adhesion forces are when two materials interact to join. The
strongest joins are where atoms of the two materials swap (ionic bonding) or share (covalent
bonding) outer electrons. Cohesive forces are the intermolecular attraction between like
molecules. The higher the surface energy, the more easily fouling is formed whilst lower
surface energy can reduce the fouling amount and weaken the adhesion force (Rankin &
Adamson, [1973]; Baier, [1970]). Corrieu [1981] reported that adhesive forces of a
proteinaceous deposit to a stainless steel surface are stronger than cohesive forces.
Britten et al. [1988] studied the effect of coatings (polymethylacrylate, nylon and cellulose
acetate) on fouling. The results showed that coating the heating surface could affect the
strength of adhesion to the surface, but not the amount of deposit. The interfacial energy of
the surface appeared to be the main factor affecting the adhesive strength. The higher the
surface energy the more easily fouling is formed. A number of authors have proposed
modifying the surface energy of stainless steel. Britten et al. [1988] and Yoon and Lund
[1994] altered the surface of equipment and found that PTFE (Poly-Tetra Fluoro Ethylene)
has lower surface energy than stainless steel. An alteration of surface energy reduces polarity
and fouling.
12
Different studies have been done to attempt to create anti-fouling surfaces by coatings, with
ceramic, PTFE and other polymer layers. Yoon and Lund [1994] investigated electropolished
stainless steel plates, Teflon-coated plates and polysiloxane coated plates. Implantation of the
stainless steel heat transfer surface with silicone and fluorine reduced surface energy and
CaSO4 scale formation [Zettler et al. 1999]. Muller-Steinhagen et al. [2000] concluded that
the effect of surface energy is much more significant than the effect of surface roughness.
1.1.8 Aims of the Thesis.
The aim of this thesis is to contribute to industrial objectives, to develop new technological
approaches to the measurement, modelling, monitoring and control of cleaning in FMCG
plant which will result in significant reduction in environmental impact:
deliver innovative solutions for minimising cleaning waste from FMCG factories;
create FMCG processes which are inherently less wasteful and more resource
efficient;
Generate new knowledge for plant, process and control system design, increasing
manufacturer profitability as well as that of their chemical, equipment and design
suppliers.
The response of surfaces to different foulant materials tested by AFM in force mode will
show how surfaces/foulants interact and aid in the specification of possible fouling-resistant
surfaces.
13
To increase understanding of how interactions between surfaces and deposits may control the
cleaning process. The thesis concentrates on surface interactions between different food
deposits using Atomic Force Microscopy (AFM), to investigate the responses of different
surfaces to different foulant materials using the AFM in force mode. This work will help to
understand the effects of interfacial surface parameters on the cleaning of different foulant
deposits.
Previous work on different fouling deposits and the AFM include Parbhu [2002, 2006],
Rosmaninho [2003], Verran [2006] and Whitehead [2006]. However there is very little work
done on AFM force measurements and food deposits. This work will provide a better
understanding of the AFM force measurements, to help understand the interactions which
may occur between the aqueous environments and different FMCG deposits. In order to
understand adhesion in food systems it is important to have an understanding of the medium
in which interactions occur. Studies using the micromanipulation technique developed at
Birmingham to quantify the forces involved in deposit removal [Liu, et al. [2007]; Liu, et al.
[2006]; Liu, et al. [2002]] , will be used as a bases of comparison to the AFM . [See chapter
3].
This project is part of a larger programme involving a group of industries such as Unilever,
GSK, Cadburys, S&N Breweries, Alfa Laval, Ecolab, GEA and Bruker Optics. The
commonality between the industrial members of the consortium was the need to resolve the
cleaning problems which are common across the industry sectors represented within the
consortium, so that the technical programme could be focused as much as possible.

14
The cleaning problems of these industries included are illustrated in Figure 1.1: The
horizontal axis shows the increasing complexity of the soil, from attached films of low
viscosity fluid, through attached films of complex non-Newtonian rheology, to adhered films
with significant microstructure. The vertical axis represents the energy and environmental
costs of cleaning, from water at ambient temperature, through hot water to the use of hot
cleaning chemical. In practice, the wish is to use the minimum level of cleaning that ensures
that cleaning times are economically short: the aim is to move to less environmentally
damaging methods.
The soils were chosen to represent major problems for the manufacturing industry:
(1) Hard cohesive soils: this study uses sweetened condensed milk (SCM), caramel/Turkish
delight and whey proteins, which are problems for the confectionary and milk processing
industries. The deposits which form tend to be gels which adhere to the surface strongly.
(2) Complex fluid: toothpaste. Toothpaste processing is a large industry, in which rinsing of
toothpaste from the surfaces – for examples of tanks and pipes - is necessary either to
ensure process sterility or at changeover.
(3) Surfaces: stainless steel, glass and Polytetrafluoroethylene (PTFE) have been identified
by industrial interest. Stainless steel is the basis of most process plant – PTFE is
obviously widely used in non-stick surfaces. Glasses and ceramics are the basis for many
food process hall surfaces.
15
1.1.9 Structure of Thesis.
Chapter 2 reviews the work on cleaning, based on the surface interactions that happen during
the process. It reports studies on modified surfaces and introduces AFM and
Micromanipulation.
Chapter 3 describes the methods and procedures followed and used to perform AFM force
experiments. The methods used to modify the AFM tips with the surface particles are
discussed in this chapter. The experimental procedures for micromanipulation results are
discussed. Summary of all the different types of AFM used to produce results are discussed in
chapter 4, 5 and 6.
Chapter 4 studies how different components of fluids might affect adhesion; this might be
useful in defining ways of varying the composition of formulation to minimize fouling or aid
cleaning.
Chapter 5 studies if AFM data can be related to micromanipulation data, to also see if nano
and micro-scale measurements can be related.
Chapter 6 studies the effects of temperature on fouling and cleaning from a range of
materials which are known to be thermally labile; cleaning rates are known to be temperature-
dependent.
Chapter 7 summarises and conclude the findings of the results and research of each chapter.
Future work is also suggested.

16
Chapter One Figures:
Figure 1.1 Cleaning map: shows a range of cleaning issues from the food and personal
product industries, demonstrating that clusters of similar problems are found. A cross-section
of cleaning problems are shown in the shaded area. It can thus be define to three types of soil
that are most difficult to clean. (Produced by the Zeal Project part of University of
Birmingham).
17
CHAPTER 2: A REVIEW OF SURFACES IN CLEANING
INVESTIGATIONS AND AFM APPLICATIONS.
Chapter 1 has introduced the concerns and needs of cleaning process plants. The
contamination of surfaces by fouling and micro-organisms (particularly pathogenic ones) are
a cause of serious concern within the food industry. The levels of cleanability of material
should be addressed when choosing the materials for process line equipment, along with their
mechanical and anticorrosive properties.
This Chapter will discuss food fouling and associated cleaning problems. In addition it will
discuss how various surfaces have been used in different anti-fouling situations. A detailed
description of AFM uses and AFM studies conducted on fouling will be discussed.
Here, the factors that need to be taken into account in the design of industrial processing
plants will be discussed. These are normally specified by knowledge and experience of
running a plant or process to simulate dirt accumulation on the heat transfer surfaces, but if
not defined carefully they can totally negate any benefits generated by skilful design
2.1 Fouling mechanisms.
The mechanisms of fouling are as follows [Fryer and Asteriadou, 2009]:
18
Chemical reaction fouling: when chemical changes within the fluid cause a fouling layer to be
deposited onto the surface. This can be, for example, reactions of proteins which generate
insoluble aggregates which form the majority of the fouled layer in milk pasteurisers.
Crystallisation fouling: a common example of this phenomenon is scaling in a kettle or boiler
caused by ‗hardness‘ salts depositing onto the heating elements as the solubility of the salts
reduce with increasing temperature.
Biological fouling: this is caused either by the growth of organisms within the fluid which
deposits out onto the surfaces of the heat exchanger, or by surface growth of organisms. When
this type of fouling occurs it is normally removed by either chemical treatment or mechanical
brushing processes.
Deposition fouling: this is when particles contained within the fluid settle out onto the surface
when the fluid velocity falls below a critical level. When this type of fouling occurs it can be
removed by mechanical brushing processes.
Corrosion fouling: this is when a layer of corrosion products build up on the surfaces forming
an extra layer of, usually, highly thermally resistance material. By careful choice of materials
the effects can be minimised as a wide range of corrosion resistant materials based on
stainless steel and other nickel based alloys are now available.
Fouling is taken account of in practice in heat exchange design in terms of a fouling resistance
fR , defined as:
U
1
0
1
U+ fR (2.1)
19
Where U 0 is the clean heat transfer coefficient (W/m2K), U is the heat transfer coefficient
after fouling and fR is the fouling resistance. Models for fouling attempt to predict both the
magnitude of fR and the rate of change.
2.2 Deposit-wall interaction
It is vital to know how the fouling deposit is formed, the structure of the fouling deposit and
its response towards the surfaces of equipment. Here the discussion will concentrate on milk
fouling, as it is a well defined fouling deposit on which many studies have been done.
Epstein [1983] and Burton [1988] described the stages involved in fouling. In the dairy
industry it is believed that proteins will be first transported to the stainless steel surface
(Belmar-Beiny & Fryer, [1992]). This is due to the fact that proteins have amphoteric (acid
and base criterion) and amphipathic (has hydrophobic, hydrophilic and charged side chains)
nature and high molecular weight, so they tend to move to interfaces reducing the interfacial
tension.
In contrast Green et al. [1988] studied milk fouling at high temperatures, and found that the
first layer of fouling was mostly calcium phosphate. Although a homogeneous protein layer
was observed in the first 40 seconds, after one hour, the layer near to the stainless steel
surface consisted of a high mineral content [Belmar-Beiny & Fryer, 1992]. However Foster
& Green [1990] suggested that minerals and protein layers are built simultaneously (studied
with milk fouling onto the stainless steel surface at wall temperature, 140°C). This suggests
that the structure of the deposit changes during fouling and initial adsorption will both alter
surface physical properties and might possibly encourage more adhesion.

20
During the period of rapid fouling from milk, aggregation of β-lactoglobulin (β-lg) in the bulk
fluid leads to rapid fouling [Gotham et al. 1989; Gotham, 1990] . This is caused by the
interaction between denatured or aggregated proteins. In denaturation, reactive groups inside
the proteins are exposed, accelerating the rate of reaction and causing protein to aggregate, so
that protein heated in the bulk fluid will react and adhere faster.
Protein-wall interactions are complicated and it is clear that many factors will determine the
structure of fouling deposits. Electrostatic and Van der Waals forces on the stainless steel
surface are known to affect the adsorption of β-lg onto the stainless steel surface so changes in
surface chemistry will affect adhesion [Sakiyama et al. 1996]. Complicated deposit formation
on the surfaces is expected for real food products.
2.3 Deposit-fluid interactions
The area of deposit-fluid interactions is critical in cleaning. If the deposit and fluid phases are
not contacted, cleaning reactions are unlikely.
Fluid actions: Cleaning solution and fluid flow play an important role in cleaning
both in chemical action and physical action [Grassoff, 1997] . In general, fluid is
needed both as a medium to transport the chemical to the deposit and to provide
mixing and shear. Once chemical solution is in contact with the deposit, reaction will
occur to modify or deform the deposit structure. Dissolution may also occur at the
same time. In addition to any reactions of the cleaning solution with the deposit, the
structure of the deposit will keep changing with time, this is known as ageing.

21
Cleaning fluids: Cleaning is a complex process involving interaction between the
cleaning components and the deposit. Cleaning begins with the deformation of the
fouling by the reaction of cleaning detergent [Grassoff, 1997] . This is agreed by
Karlsson et al. [1998] who concluded that cleaning is strongly influenced by deposit
and surface characteristics together with the choice of cleaning agent.
For economic cleaning, it is essential to choose the correct detergents or chemical
solution. Thus knowledge of fouling deposits is crucial. If proteins are the main
component, alkali based detergent is the best to apply; alkali cleaning is often used in
industries that process protein and fat containing foods. Alkalis react with proteins
through hydrolysis of the peptide bonds and solubilisation while with fat through
saponification. For milk fouling, cleaning of processing equipment starts with a hot water
rinse to melt the fats and thus enhance the chemical solution contact with the deposit [Alfa
-Laval, 1987] . Around 1 wt% concentration of alkali is normally used in the food
industry. For food deposit that mainly consists of minerals, acid solution is the best since
most minerals are acid soluble [Jeurnink & Brinkman, 1994; Grassoff, 1997] . Nitric acid
or phosphoric acid is usually used for acid wash and the typical concentration applied is
0.5 to 1.0 % [Kane & Middlemiss, 1985; Timperley & Smeulders, 1987] .
Nevertheless, alkali and acid solution alone may be insufficient to clean the surface
completely. Timperley & Smeulders [1987] discovered that the deposit contained 25%
w/w protein on the surface after the alkaline cleaning stage and once the cleaning stages
were completed, residual calcium phosphate was still detected. Jennings et al. [1957]

22
found that removal of milk deposit improved drastically when all the cleaning agents were
mixed: alkaline cleaners, sequestering agent and wetting agent. Sequestering agents and
surfactants (surface-active agents) are the major components in formulated detergents that
can enhance the removal process. Sequestering agents both prevent the precipitation of
salts and may prevent redeposition of fouling deposit [Kane & Middlemiss, 1985; IDF,
1993].
2.4 Methods for surface analysis
A variety of methods are available to characterise surfaces. These include:
Atomic force microscopy (AFM), Scanning tunnelling microscopy (STM),
Transmission electron microscopy (TEM), Scanning electron microscopy (SEM),
Scanning transmission electron microscopy (STEM), Variable angle spectroscopic
ellipsometry (VASE) and light microscopy (LSM). Table 2.1 summarises the
techniques that can image, and take quantitative measurements of film thickness.
Elemental composition and chemical state measurement can be determined by the following
techniques:
Auger electron spectroscopy (AES), Energy-dispersive X-ray (EDS), X-ray
photoelectron spectroscopy (XPS), High-resolution electron energy-loss spectroscopy
(EELS), Fourier transformation Raman spectroscopy (FT Raman) and UV-Visible
spectroscopy (UV/Vis). Table 2.2 shows a summary of the techniques, in which it
shows detailed information of a surface layer helps diagnose unwanted deposits on
surfaces.
23
Microstructure, crystallography, and defects (unwanted matter or damage of surface)
measurements can be determined by the following techniques:
High- resolution transmission electron microscopy (HRTEM), Low-energy electron
diffraction (LEED) and X-ray diffraction (XRD). Table 2.3 shows a summary of the
techniques that can show different defects on a surface which is useful to check if a
surface is clean or has some contamination on it.
The above experimental methods, can contribute to innovative cleaning methods and solution,
by using the techniques in conjunction with each other, giving a bigger and accurate picture.
These techniques will help to generate new information for plants, processes and designs. In
this study, both AFM and SEM have been used.
2.5 Surface modification.
The physical properties of the deposit and the surface will affect removal. Fouling deposits
form as a result of adhesion of species to the surface and cohesion between elements of the
material. Cohesion is defined as the internal strength of an adhesive as a result of a variety of
interactions within the adhesive. Adhesion is the bonding of one material to another, namely
an adhesive to a substrate. The forces between elements of the deposit depend on the nature of
the material; deposits may be covalently bonded (for example reacted egg or milk proteins) or
held together physically (such as gelled biopolymers). Understanding of the interaction
between deposits and surfaces is clearly critical in cleaning. On a nanoscale, atomic force
microscopy (AFM) has been used to characterise surfaces and fouling (such as Parbhu et al,
2002; Weiss et al, 2002). Low-adhesion coatings (Muller-Steinhagen and Zhao, 1997) have
been shown to reduce fouling in some situations such as mineral scales.
24
Modifying the properties of processing surfaces, which are typically stainless steel in food
applications, may be one way of achieving a reduction in initial fouling rate or of enhancing
cleaning, Parbhu, et al. [2006]. This is due to the highly complex chemistry of the processes
that give rise to deposition of milk proteins occurring on the equipment surfaces, [Changani,
et al. 1997]. Surface modification has often been proposed as a solution to the fouling
problem; Rosmaninho, Rizzo, Müller-Steinhagen and Melo, [2005] have dedicated time into
researching antifouling surfaces and found that they show interesting results in fouling and
cleaning studies. Rosmaninho, et al. [2006] investigated different modified stainless steels.
The surface modification techniques were: direct and turbulent ion implantation (with SiF
3
and MoS 2
2
ions); sputtering (thin diamond- like carbon (DLC) films); plasma chemical
vapour deposition (CVD) (thin films of DLC, SiO x , and DLC– Si–O) and an autocatalytic
Ni–P–PTFE coating.
(1) Direct and turbulent ion implantation: Here the surfaces were bombarded with highly
accelerated SiF
3 ions with an average energy of 200 keV, achieving an ion concentration of 5
x 10 16 ions/cm 2 . In this reported case, the ions were directly implanted into the metal
material, forming a surface alloy of approximately 0.2 µm in depth. MoS 2 ions were
implanted in the stainless steel surfaces by turbulent ion implantation. The atoms impacting
the surface of the substrate had such a high energy that they could penetrate into the interior
of the material, since molecules hitting the surface could push already deposited molecules
further inside the substrate, leading to implantation depths of up to 10µm and resulting in
modified surface layers of 2–5 µm thickness.

25
(2) Sputtering and plasma CVD technique: Sputter coating as well as plasma CVD coating
are plasma processes, which take place at sub-atmospheric pressures. The advantages of the
sputter coatings are the hardness and the good adherence of the films produced while the main
disadvantages of plasma CVD coatings are their reduced density and weaker adherence to the
substrate material. The DLC sputter coating used in this work was a multilayer coating with a
TiN sublayer, followed by a TiC film and finally a DLC coating. The DLC–Si–O surface was
produced by Plasma CVD using CxHx as precursor for the DLC film and
Hexamethyldisiloxan (HMDSO) for the addition of silicon and oxygen. In addition, a plasma
CVD SiOx film was produced using HMDSO as precursor.
(3) Autocatalytic Ni–P–PTFE coating: The Ni–P– PTFE coating was produced by an
autocatalytic plating process. In this process the stainless steel surface went through five
steps: (1) an alkaline cleaning bath; (2) a pickling process; (3) activation by the galvanic
deposition of nickel and (4) an autocatalytic reaction in which Ni–P plating is deposited. After
the Ni–P plating had reached a certain thickness, PTFE particles were added to the coating
bath, to be incorporated in the Ni–P matrix. In order to be effective in reducing fouling, the
outer surface of the Ni–P–PTFE plating should contain a high percentage of homogenously
distributed PTFE particles.
(4) Silica coating: Silica coated (SiOx) surfaces were prepared by a sol–gel process, where
metal alkoxide compounds are typically used as raw ingredients. The process started with the
hydrolysis of such compounds in the presence of water and condensation to form M–O–M
bonds (‗‗M‘‘ being elements like Si, Ti, Zr). After the hydrolysis and condensation have
26
proceeded to a certain degree (sol formation), a coating could be applied on the substrates by,
for example, dip- or spin-coating; dip-coating, under well controlled conditions was used. The
coating structure was then consolidated by high temperature annealing in order to oxidize and
remove any residual organic molecules. Sols were prepared from methyl triethoxysilane
(MTES): H2O (molar ratio 1:3) solutions in ethanol at various dilutions (1:10–1:4), and
annealed at temperatures in the range of 200–500ºC.
Different fouling materials used were: (i) Calcium phosphate, where deposition was from
Simulated Milk Ultra Filtrate (SMUF), was studied; this is an aqueous solution that simulates
the mineral composition of milk (Jenness and Koops, 1965). (ii) the -Lactoglobulin solution
preparation method and its gross chemical composition were as described by Holt et al.
(1999). The protein was dissolved in phosphate-buffered saline. The cleaning efficiency of
each surface is here defined as the percentage of deposit mass removed for each surface after
the cleaning process. It was concluded that Ni–P–PTFE coating was the easiest material to
clean. Conversely, SiOx, DLC, MoS2, and Silica coating did not show any advantage over
standard stainless steel.
The Ni–P–PTFE coating seems to be the most appropriate surface treatment to minimize milk
fouling effects. This conclusion is supported by the fact that the characteristics of the Ni–P–
PTFE surface modification method were systematically different from the other methods: (i)
Ni–P–PTFE was the most hydrophobic surface of them all, the others being essentially
hydrophilic; (ii) a polar component (London–van der Waals) of the surface energy of Ni–P–
PTFE was lowest among all surfaces, (iii) the electron donor component (polar) of the surface
energy had the lowest value for the Ni–P–PTFE material.
27
The use of Ni-P-PTFE coating in fouling studies has shown remarkable results. Ni-P-PTFE is
significantly improved by graded technique (in which the PTFE content is gradually increased
from the substrate to the top surface); and the fouling formation of CaSO4 deposits on heat
exchanger surfaces are reduced [Zhao et al. 2002] . Zhao & Liu [2005] found that the graded
technique of Ni-P-PTFE coatings give corrosion-resistant coatings. Zhao [2004] used graded
Ni-P-PTFE surfaces and found the attachment of thermophilic streptococci reduced by 82-
97%. In addition, Zhao & Liu et al, [2006] showed that the attachment of biofouling on Ni-
P-PTFE surfaces reduced by 87.7-92.8% compared to stainless steel 304.
To evaluate the importance of surface modification on the formation of mineral deposits,
calcium phosphate fouling was studied using stainless steel surfaces modified by TiN
sputtering. [Rosmaninho, Rocha, Rizzo, Müller-Steinhagen, & Melo, 2007]. The importance
of this work is the importance of the surface energy of the substrate, particularly its electron-
donor (γ−) component, on the fouling behaviour of calcium phosphate from a simulated milk
mineral solution.
Many researchers such as Rosmaninho et al. [2004] have used surface modifications to
characterized chemical composition, roughness, topography and wettability. Variety of
surface modifications methods have been studied SiF3+ and MoS2
2+ ion implantation;
diamond-like carbon (DLC) sputtering; DLC, DLC–Si–O and SiOx plasma enhanced
chemical vapor deposition (PECVD); autocatalytic Ni–P–PTFE and silica coating.
28
2.6 Surface Roughness.
Quantifying the degree of roughness can be complex, but a quantitative description of surface
roughness is critical in order to assess the effects of surface roughness in the food industry
[Round et al. 2001]. The topography of any surface will take the form of a series of peaks and
valleys which may vary in both height and spacing. Surface roughness exists in two principal
planes [Round et al. 2001] one perpendicular to the surface, described as height deviation, and
the second in the plane of the surface, described by spatial parameters and identified as
texture [Round et al. 2001]. There are a number of amplitude parameters, for example R a
known as arithmetic average height parameter; R q , known as the root mean square; the
standard deviation of the z height value and R z , the difference in height between the averages.
R a is the most universally used roughness parameter for general quality control [Verran et al.
2006].
2.7 Atomic force microscopy (AFM).
The atomic force microscope (AFM) was invented in 1986 by Binnig, Quate and Gerber,
[Martin et al, 1987]. The AFM collects information at the nanoscale by using a sharp probe (5
- 10 nm), which moves a few nanometers (<10nm) over the surface of a sample in a raster
scan. The AFM probe is a tip on the end of a cantilever (<125µm), which bends in response to
the force between the tip and the sample. The cantilever flexes, the light from the laser is
reflected onto the photo-diode. Changes in the bending of the cantilever can be measured by
this method. The cantilever obeys Hooke's Law, F = -kz, for small displacements, and so the
interaction force between the tip and the sample can be found, where F is the force, k is the
stiffness of the lever, and z is the distance the lever is bent. The movement of the tip or
29
sample is performed by precise positioning devices made from piezo-electric ceramics in the
form of a scanner, (Figure 2.2). The scanner is capable of sub-angstrom resolution in x-, y-
and z-directions. The z-axis is conventionally perpendicular to the sample. Most AFMs use a
laser beam deflection system, introduced by Meyer and Amer, (Veeco AFM manual) where a
laser is reflected from the back of the reflective AFM lever and onto a position-sensitive
detector. AFM tips and cantilevers are microfabricated from Si or Si3N4. Typical tip radius is
from a few to 10nm. (Veeco AFM manual).
AFM provides a method for detecting nanoscale information on surfaces. The AFM has been
used by many researchers such as Lent, et al. [1998], Adams, et al. [2003], Nakao, et al.,
[2005] and Round, et al. [2001], for the analysis of surface topography, electrostatic forces,
adhesion forces, etching, tribological properties and material properties.
The AFM has the capability to make measurements on a single particle and to measure forces,
and hence interactions energies, with respect to intersurface distances. A number of different
interactions can be measured, either separately or simultaneously, including long-term forces
such as van der Waals and electrical double layer forces, hydrophobic interactions, salvation
forces, steric interactions, hydrodynamic drag forces as well as adhesion.
A measurement of the van der Waals interactions between different materials in different
media is possible using the AFM. By changing the sharp probes with a colloidal particle, a
wide range of different interactions can be measured. The possibility of forces other than van
der Waals interactions may be present, such as double layer interactions and hydrodynamic
effects. The magnitude of the adhesion between two surfaces is dependent upon the contact

30
area at the junction between the surfaces as well as the interaction forces themselves. The
contact area will depend upon the mechanical deformation of the material due to the applied
force and material properties. [Hilal et al. 2009].
The AFM has been used to measure adhesive forces between particles and process surfaces.
Adhesion between particles, inorganic colloidal particles, bacterial cells and filtration
membranes. This interaction is of great importance when considering the fouling and
biofouling of such surfaces. Particles adhere to the process membrane and reduce flow
through the membrane, greatly reducing filtration, the efficiency and working lifetime of the
membranes. The quantification of adhesion forces between colloids and membranes can
provide an important contribution to developing the theoretical prediction and optimisation
and control of many engineering separation processes.
There are a number of models that have been developed to account for the effect of the
surface roughness on measured adhesion when trying to infer various properties of
interactions from adhesion forces. These generally use some measures of roughness, such as
the root mean square (RMS) roughness of the surface, or value of mean asperity size to
account for the reduced contact areas due to the presence of asperities. As well as serving to
keep the two surfaces separated, the angle at which asperities on the particle surfaces
approach each other may also affect the effective contact area and thus the measured
adhesion. [Hilal et al. 2009].

31
AFM Surface tip modifications.
The number of materials used to make the AFM tips is limited to silicon (which is in ambient
conditions oxidized to silica) and silicon nitride (which is also oxidized). These tips can be
coated with various metals and diamond (commercially available from the AFM tips suppliers
[Veeco,UK]). Direct measurements of forces involving such particles can therefore be very
useful from both fundamental and practical points of view. Direct attachment, gluing of
spherical multi-micron size particles to the AFM cantilevers was demonstrated first in 1991
[Drucker et al. 1991], and has been broadly used to study to molecular forces and mechanics
of biological cells [Sokolov, 2006, Berdyyeva, 2006 and Park, 2005]. Chemical
functionalization of AFM tips with various molecules has demonstrated its great importance
for studying molecular interactions, force spectroscopy, detection, etc.
The problems with attachment and functionalization of AFM tips with nanoparticles are:
To attach a single particle to the cantilever, it has to be visible under an optical
microscope. This is not the case for nano-sized particles.
The smaller the particle, the easier for epoxy to engulf it. Because the layer of epoxy
deposited on the cantilever is at least several cubic microns, it is quite tricky to avoid
coating of the particles with the epoxy.
To overcome these issues, Sokolov et al. [2006] suggested the following solutions:
gluing not a single nanoparticle but a large amount of nano-sized particles at once,
gluing not to the cantilever but to a standard Si 3 N 4 pyramidal tip,
depositing nanoparticles to the epoxy coated tip not immediately, but after the epoxy
being semi-rigidified, becoming viscous enough to avoid engulfing the particles

32
before complete curing. The suggested method can be used for attachment of virtually
any solid nanoparticles.
AFM is a powerful tool as it collects data for images by feeling and touching rather than
looking [Morris, et al. 1999]. AFM is a useful tool used in investigating the fine structure
information of food materials. AFM is capable of imaging both conductive and insulating
materials, a clear advantage over the scanning tunnelling microscope (STM), which works
only with conductors or semiconductors.
A number of researchers have used the AFM in fouling and cleaning, such as Boulange-
Petermann, [1997], Boyd, [2000], Allen, [1997] and Verran [2000]. To measure topographic
images and surface adhesion, the AFM can also provide much more information than just
surface imaging. The AFM has been used to measure the topography of worn surfaces, and of
surfaces of new materials used in the food industry. The problem in this area is a lack of good
correlation between roughness measurements and parameters such as cleanability, and
microbial adhesion and retention on surfaces (Boulange- Petermann, 1996; Garry et al. 1995;
Langeveld et al. 1972; Masurovsky and Jordan, 1958; Taylor et al. 1998b, Verran and
Maryan, 1997; Verran et al. 1991). Roughness measurements, particularly R a , are statistical
values describing a surface, and thus are only truly representative if there is a regular
topography, as for polished and brushed stainless steel, but not for worn surfaces whose
abrasions tend to be of a random nature. This feature is also of importance if the area
examined is considered, since defects may be included or excluded depending on the
sampling method and area. If wear occurs on a microbiological scale, then only the AFM
would be able to both measure and visualise the relevant topographic features, and potentially
33
relate surface features to fouling and cleanability. Surface roughness can play a key role of
attachment of fouling deposit to surfaces [Verran et al, 2002].
The AFM can record the amount of force felt by the cantilever as the probe tip is brought
close to and even indented into a sample surface and then pulled away (Figure 2.3). This
technique can be used to measure the long range attractive or repulsive forces between the
probe tip and the sample surface, elucidating local chemical and mechanical properties like
adhesion and elasticity. Topographic imaging of a sample can be performed using contact
mode AFM or tapping mode AFM:
(1) In contact mode: the cantilever tip is in direct contact with the surface, and as the tip
moves across the surface the change in cantilever deflection is monitored via the change in the
position of the laser beam on the photodiode. A feedback control system is used to maintain
contact at a prescribed force between the cantilever and the surface. This mode is suitable for
smooth surfaces; in this mode rough samples could damage the tip, [Verran, 2000].
(2) In tapping mode: AFM imaging the cantilever is vibrated close to its resonant frequency at
a short distance above the surface. When the tip and surface move relative to each other in the
vertical direction, the amplitude of oscillation of the cantilever is monitored using a feedback
loop, affording a topographic image of the surface. This mode is ideal for rougher surfaces
such as a ceramic, [Verran, 2000].
Force measurements can be performed in air, liquid, vapour or vacuum environments, using a
standard pyramidal Si3N4 AFM cantilever tip or with a variety of specially chosen probes
34
attached to the apex of an AFM cantilever. e.g. a microparticle. Force curves (force-versus-
distance curve) typically show the deflection of the free end of the AFM cantilever as the
fixed end of the cantilever is brought vertically towards and then away from the sample
surface. Experimentally, this is done by applying a triangle waveform voltage pattern to the
electrodes for the z-axis scanner. This causes the scanner to expand and then contract in the
vertical direction, generating relative motion between the cantilever and sample. The
deflection of the free end of the cantilever is measured and plotted at many points as the z-
axis scanner extends the cantilever towards the surface and then retracts it again. By
controlling the amplitude and frequency of the triangle waveform voltage pattern, it is
possible to vary the distance and speed that the AFM cantilever tip travels during the force
measurement.
2.8 Studies of AFM in fouling and cleaning:
The following studies demonstrate how the AFM has been used for surface measurements in
different applications such as: biofilms, hygiene, and microbes in biofouling and surface
modifications. The studies show that the AFM is a very helpful tool in determining surface
characteristics.
Verran, et al. [2000] investigated the wear of food contact surfaces using the AFM for
measuring surface roughness and wear on the nanometer scale, in order to produce realistic
models for in vitro testing. This was achieved by (i) comparing R a values for a range of
smooth surfaces obtained from solid and laser stylus profilometers and the AFM; (ii) using
the AFM to visualise and measure the roughness of stainless steel surfaces in situ in food
processing factories either directly, or indirectly using dental impression materials; (iii)

35
producing abraded stainless-steel surfaces in vitro which reproduced the typically worn
surface of real food contacts.
Worn food contact surfaces in a food processing factory were sampled. Flat, horizontal
surfaces representing a range of food contact surfaces were identified e.g. polypropylene,
polymethylmethacrylate, polished and unpolished 316L stainless steel, and glass and
porcelain materials.
Verran, et al. [2000], wiped the surfaces with 95% ethanol or detergent if greasy and placed
them on the test surface. The two components of a high-resolution impression material were
pipetted and mixed for 45 seconds in a weighing boat (working time 5 min) and then poured
into the frame. After 30 min of setting time, the material was peeled from the surface and the
top surface was attached to the lid of a Petri dish so that the contact surface was protected.
The surface was then examined via incident light optical microscopy, and also by AFM for
visualisation, and Ra measurement.
The samples of worn stainless steel surfaces, a range of Ra values were obtained, either at or
below the 0.8 µm hygiene levels. The information enabled the production of a range of worn
stainless steel surfaces, produced in a reproducible and controlled manner via the use of
silicon carbide paper and quartz grit with a known and constant load, to give surface
topographies mirroring those found in situ. These surfaces were then used for soil and
microbial fouling and cleanability studies, by Boyd, et al., [2000], Verran, et al, [1999].
The above studies showed that an increase in substratum surface roughness increases the
retention of microrganisms on that surface, An increase in roughness Ra (from 0.02 to 1.24

36
µm) had a significant effect on cell retention. Profilometric methods used to obtain Ra values
were relatively crude, and did not facilitate discrimination of surfaces differing only slightly
in R a value. R a values for the smooth test surfaces varied considerably. For the solid stylus
profilometer, the highly polished surfaces were not measurable in terms of R a values. The
laser profilometer was able to provide a measurement for these surfaces, but it was the same
value in each case. The AFM was able to differentiate between all surfaces in terms of R a
values on the nanometer scale. The R a values increase with decreasing probe size, reacting
greater resolving ability of the laser and AFM probes. Both SEM and AFM were used to
visualise the surface. AFM found the ceramic surfaces to be to rough for the depth of field.
However, for the smooth surfaces, the AFM provided images which gave more detail of
surface features than the SEM and also required less sample preparation.
The AFM was used to measure the topography of the worn surfaces, and of surfaces of the
new materials used in the food industry, providing data and information. These studies give
an insight into what problems that AFM encountered with the different surfaces and helps to
prove that more information can be obtained compared to other techniques.
The applications of AFM in interfacial science are too numerous to list. The following studies
illustrate some applications in different areas of research which have some relevance to
fouling and cleaning. All surfaces will become fouled eventually under adverse conditions,
Wu, et al. [2008], employ a robust defouling method to remove adsorbed protein in order to
maintain surfaces free of proteins. They found that nanobubbles can inhibit protein adsorption
on a variety of surfaces, but to make use of this, control over the production of nanobubbles is
required.

37
The ethanol–water exchange method for the production of nanobubbles depends upon the
nucleation of supersaturated gas, which is inherently difficult to regulate. Therefore the
coverage and size of nanobubbles cannot be controlled. In contrast, electrochemical formation
and growth of nanobubbles was found to be relatively easy to control. Nanobubbles are
formed on the surface with a regular density and their size can be controlled by the applied
current. Wu and Zhang [2008] demonstrated that the area density of nanobubbles on highly
oriented pyrolytic graphite (HOPG) surfaces can be controlled electrochemically. It was
demonstrated that the presence of nanobubbles on a surface decreases the adsorption of
protein dramatically, that is the nanobubbles act as antifouling agents. Wu, et al. [2008],
demonstrate that nanobubbles cannot only be used to prevent the nonspecific adsorption of
protein but also can be used to remove protein that is already adsorbed and therefore might be
used as cleaning (or defouling) agents.
The AFM was used for samples that had electrochemical treatment applied to using a battery
(1.5 V) electrically connected between the HOPG substrate (cathode) and a copper electrode
(anode) within the buffer solution for 20 to 50 seconds. Antifouling nanobubbles were first
formed on the HOPG surface electrochemically, and then a drop of bovine serum albumin
(BSA) solution (20 μg/ml, 200 μl) was deposited onto the HOPG and allowed to stand for 5
minutes. Then pure water was used to wash away any remaining BSA. For defouling
experiments, the BSA was applied in the same manner to the HOPG surface. Then the surface
was washed with a large quantity of pure water before nanobubbles were produced
electrochemically. The surface was then washed again with a large quantity of pure water.
The samples were dried using compressed air before AFM observation.

38
BSA solution (10 μg/ml, 4 ml) was injected into the fluid cell, and allowed to adsorb for 30
min. Then four millilitres of pure water was injected to rinse excess protein from the surface.
The sample was imaged by tapping mode AFM 10 min later. After imaging the BSA film, a
voltage of 1.5 V was applied for 30s to produce nanobubbles. Then the same region of the
BSA film was again imaged by tapping mode AFM.
Wu, et al. [2008] thus demonstrated using AFM that nanobubbles could desorb protein from
HOPG surfaces. This provides a means for control of protein adsorption and therefore, may
also be used to control cell and bacterial adsorption at interfaces on any conducting substrate.
Therefore, this approach may be used to control biocompatibility of materials or for the
regeneration of filters that have been clogged with adsorbed materials.
The AFM was used by Hankinso et al. [1968] to estimate the difference in adhesion strength
between the dissolved and suspended solids in milk samples and on glass surfaces. The
influence of the liquid phase of the milk products was minimized by a washing and drying
procedure which left a microscopic size film on the substrate. AFM can produce high
resolution images of the surface topography of organic/inorganic films and biological
materials [Raghavan et al., 2001; Herrmann et al. 2004], and has been used to study the
molecular structure of various food items [such as by Morris et al. 2001; Hodge and
Rousseau, 2002; Morris, 2004]. This imaging is achieved by scanning the surface using the
pointed tip attached to a cantilever, and the AFM can be operated in the contact and tapping
modes. In the contact mode, a predetermined dimension of the residual milk films can be
removed from the glass surface. This is sometimes referred to as the scratching AFM mode
[Schmutz and Frankel, 1998, 1999]. The tapping mode, on the other hand, provides high
resolution 3-D topographic images of the milk films before and after the scratch. This

39
combination can determine the thicknesses of residual milk samples on glass surfaces. Thus,
milk samples with deeper thicknesses represent those that are more difficult to be removed
during washing. The objective was to measure and compare the adhesion strength of different
milk products on glass surfaces before and after manual washing protocols using contact
angle, surface tension and atomic force microscopy analyses.
Schmidt [1997] showed that food proteins are one of the most difficult soils to be removed
from food contact surfaces. Handojo et al. [2009] used the atomic force microscope to
determine the thickness of a thin film of milk left on a drinking glass after a washing protocol.
The thickness of this film could be used to estimate the strength of the adhesion and by
extension, the difficulty of removing milk from glasses. This study demonstrated that the
whole and chocolate milk had the strongest adhesion force on the glass surface. Therefore, in
worst case scenarios during washing protocols when milk products are selected to soil
drinking glasses, chocolate and/or whole milk should be chosen. In summary, the
combination of contact angle, surface tension and AFM could be used to predict the difficulty
in removing various milk-based products from the surface of glasses.
2.9 Micromanipulation to quantify the effects of cleaning.
Significant work has been done at Birmingham and elsewhere to study and quantify cleaning
processes. The flows within process plant can be predicted using methods such as
Computational Fluid Dynamics (CFD) which has been used to predict surface shear stress and
thus cleanability, [Jensen and Friis, 2002, Christian and Fryer, 2004]. CFD predictions give
reasonable agreement with experimental results, and offer the possibility of being able to
design cleanable equipment. CFD does however have the problems that it does not take
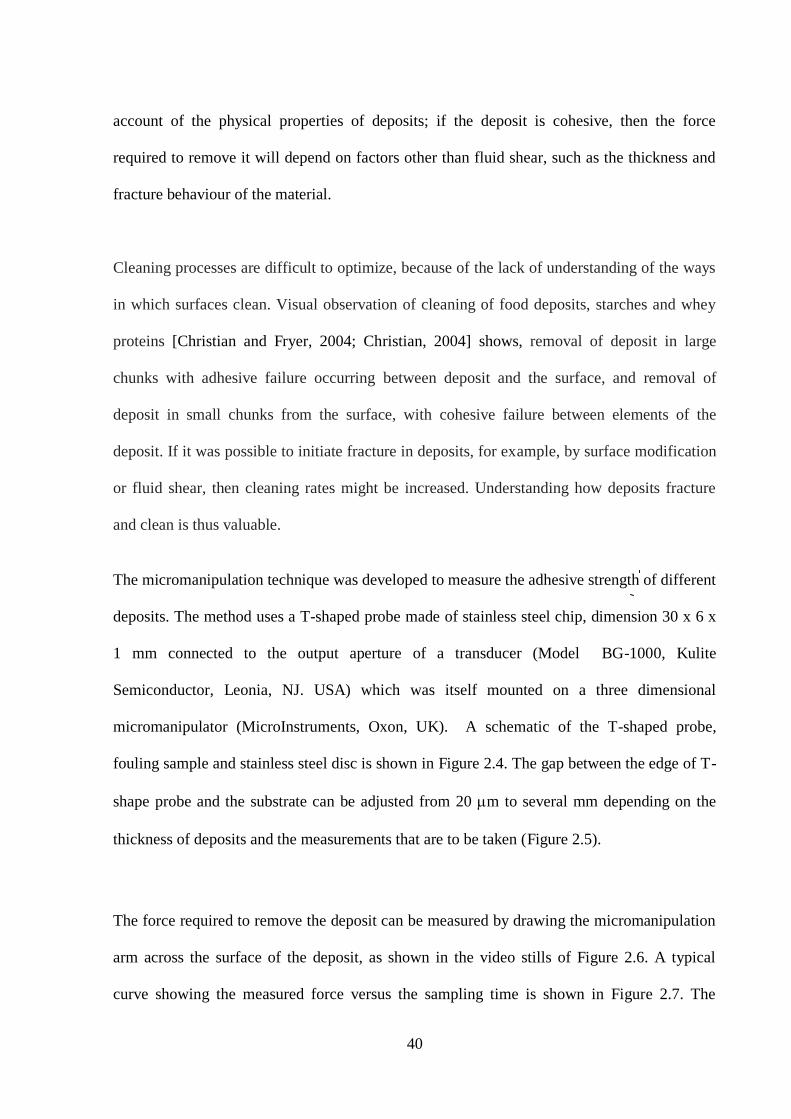
40
account of the physical properties of deposits; if the deposit is cohesive, then the force
required to remove it will depend on factors other than fluid shear, such as the thickness and
fracture behaviour of the material.
Cleaning processes are difficult to optimize, because of the lack of understanding of the ways
in which surfaces clean. Visual observation of cleaning of food deposits, starches and whey
proteins [Christian and Fryer, 2004; Christian, 2004] shows, removal of deposit in large
chunks with adhesive failure occurring between deposit and the surface, and removal of
deposit in small chunks from the surface, with cohesive failure between elements of the
deposit. If it was possible to initiate fracture in deposits, for example, by surface modification
or fluid shear, then cleaning rates might be increased. Understanding how deposits fracture
and clean is thus valuable.
The micromanipulation technique was developed to measure the adhesive strength of different
deposits. The method uses a T-shaped probe made of stainless steel chip, dimension 30 x 6 x
1 mm connected to the output aperture of a transducer (Model BG-1000, Kulite
Semiconductor, Leonia, NJ. USA) which was itself mounted on a three dimensional
micromanipulator (MicroInstruments, Oxon, UK). A schematic of the T-shaped probe,
fouling sample and stainless steel disc is shown in Figure 2.4. The gap between the edge of T-
shape probe and the substrate can be adjusted from 20 m to several mm depending on the
thickness of deposits and the measurements that are to be taken (Figure 2.5).
The force required to remove the deposit can be measured by drawing the micromanipulation
arm across the surface of the deposit, as shown in the video stills of Figure 2.6. A typical
curve showing the measured force versus the sampling time is shown in Figure 2.7. The
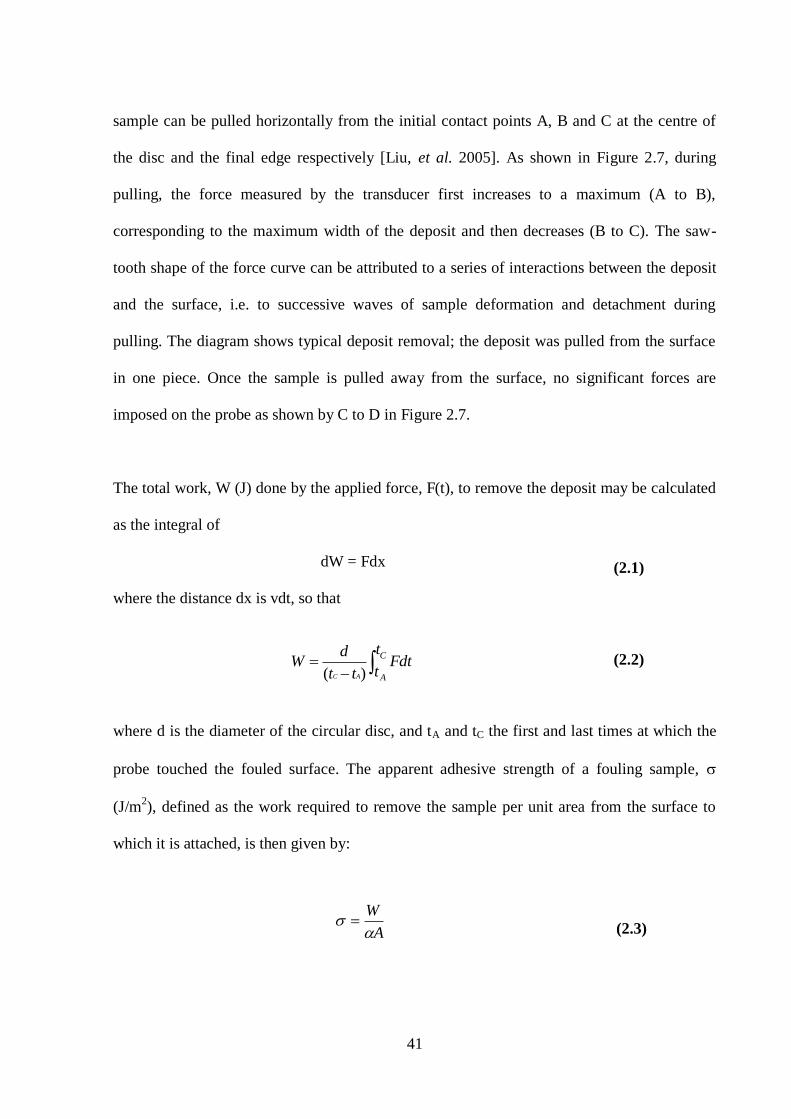
41
sample can be pulled horizontally from the initial contact points A, B and C at the centre of
the disc and the final edge respectively [Liu, et al. 2005]. As shown in Figure 2.7, during
pulling, the force measured by the transducer first increases to a maximum (A to B),
corresponding to the maximum width of the deposit and then decreases (B to C). The saw-
tooth shape of the force curve can be attributed to a series of interactions between the deposit
and the surface, i.e. to successive waves of sample deformation and detachment during
pulling. The diagram shows typical deposit removal; the deposit was pulled from the surface
in one piece. Once the sample is pulled away from the surface, no significant forces are
imposed on the probe as shown by C to D in Figure 2.7.
The total work, W (J) done by the applied force, F(t), to remove the deposit may be calculated
as the integral of
dW = Fdx
where the distance dx is vdt, so that
where d is the diameter of the circular disc, and tA and tC the first and last times at which the
probe touched the fouled surface. The apparent adhesive strength of a fouling sample,
(J/m2), defined as the work required to remove the sample per unit area from the surface to
which it is attached, is then given by:
A
W
C
A
t
tFdt
tt
dW
AC )(
(2.1)
(2.3)
(2.2)
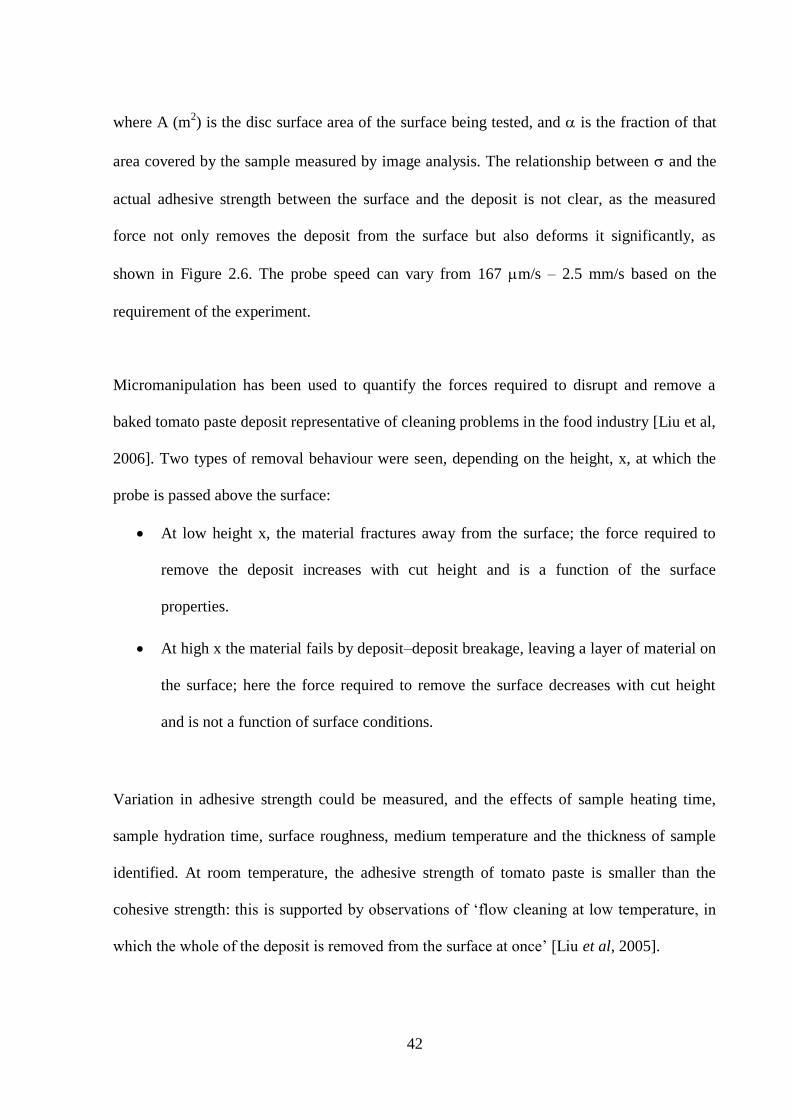
42
where A (m2) is the disc surface area of the surface being tested, and is the fraction of that
area covered by the sample measured by image analysis. The relationship between and the
actual adhesive strength between the surface and the deposit is not clear, as the measured
force not only removes the deposit from the surface but also deforms it significantly, as
shown in Figure 2.6. The probe speed can vary from 167 m/s – 2.5 mm/s based on the
requirement of the experiment.
Micromanipulation has been used to quantify the forces required to disrupt and remove a
baked tomato paste deposit representative of cleaning problems in the food industry [Liu et al,
2006]. Two types of removal behaviour were seen, depending on the height, x, at which the
probe is passed above the surface:
At low height x, the material fractures away from the surface; the force required to
remove the deposit increases with cut height and is a function of the surface
properties.
At high x the material fails by deposit–deposit breakage, leaving a layer of material on
the surface; here the force required to remove the surface decreases with cut height
and is not a function of surface conditions.
Variation in adhesive strength could be measured, and the effects of sample heating time,
sample hydration time, surface roughness, medium temperature and the thickness of sample
identified. At room temperature, the adhesive strength of tomato paste is smaller than the
cohesive strength: this is supported by observations of ‗flow cleaning at low temperature, in
which the whole of the deposit is removed from the surface at once‘ [Liu et al, 2005].

43
Tomato paste deposits are removed by (primarily) adhesive failure between deposit and
surface. Modifying the surface might thus be expected to have a significant effect on the
cleanability of the material. Experiments studied the total removal of tomato paste, baked and
unbaked onto modified surfaces which had surface energy values ranging from 15 – 40
mN/m. Figure 2.8(a) shows data for baked and unbaked pastes. In both cases there is a
minimum adhesive strength between the surface energies of 20 and 25 mN/m, with an
increase in the adhesive strength on either side. The data is scattered, but the minimum is
clear in both cases; the change in adhesive strength for the unbaked material with free energy
is smoother.
The force measured by the micromanipulation probe is a composite of the cohesive forces
between deposit elements and the adhesion to the surface. This is shown explicitly by Figure
2.8(b), which shows data for different thicknesses of unbaked paste. It can be seen:
As the thickness increases, the total energy required to remove the deposit increases.
The increase reflects the need to overcome the cohesive forces between elements of
the deposit and to force the deposit to break and flow with the probe away from the
sample surface; as the thickness increases, so does this force.
A similar minimum to that found in Figure 2.8(a), in similar regions of surface energy.
However, the minimum becomes more difficult to identify as the thickness of deposit
increases, reflecting the decreased contribution of the surface forces to the removal of
the deposits as the thickness increases. At the highest thicknesses used, there is no
measurable minimum; the curve simply flattens out at the lowest surface energies.

44
Estimation of cohesive and adhesive contribution.
Figure 2.8 shows that the thickness of deposits has impact on the overall apparent adhesive
strength when surfaces with a range of surface energies are employed. The force measured by
the probe is a combination of that required to overcome the forces between surface and
deposit and that required to disrupt the deposit-deposit bonds. The simplest model for the
relationship between the measured work (W) required to remove a deposit of volume (V)
from a surface of area (A) is:
VAW vs (2.4)
i.e. the measured W is the sum of the work required to overcome the surface-deposit bonds
and the deposit-deposit bonds, where s represents the work (per unit area) needed to
overcome the surface bonds and v is the work per unit volume required to overcome the
deposit-deposit bonds. This implies that (i) all of the deposit is removed, and (ii) that all of the
deposit is equally deformed (v is analogous to a plastic work of failure of a material). This
equation can be transformed into one that relates the apparent adhesive strength and the
deposit thickness
xA
Vvsvs (2.5)
Figure 2.9(a) and (b) replot the data of Figure 2.8(b) as a function of thickness rather than
surface energy. The graphs show that:
for some data sets, such as those for surfaces of surface energy 20-25.5 mN/m shown
in Figure 2.9(a), the data all lie on single straight lines, with a slope of 240 kJ/m3 and
an intercept of 540 mJ/m2;
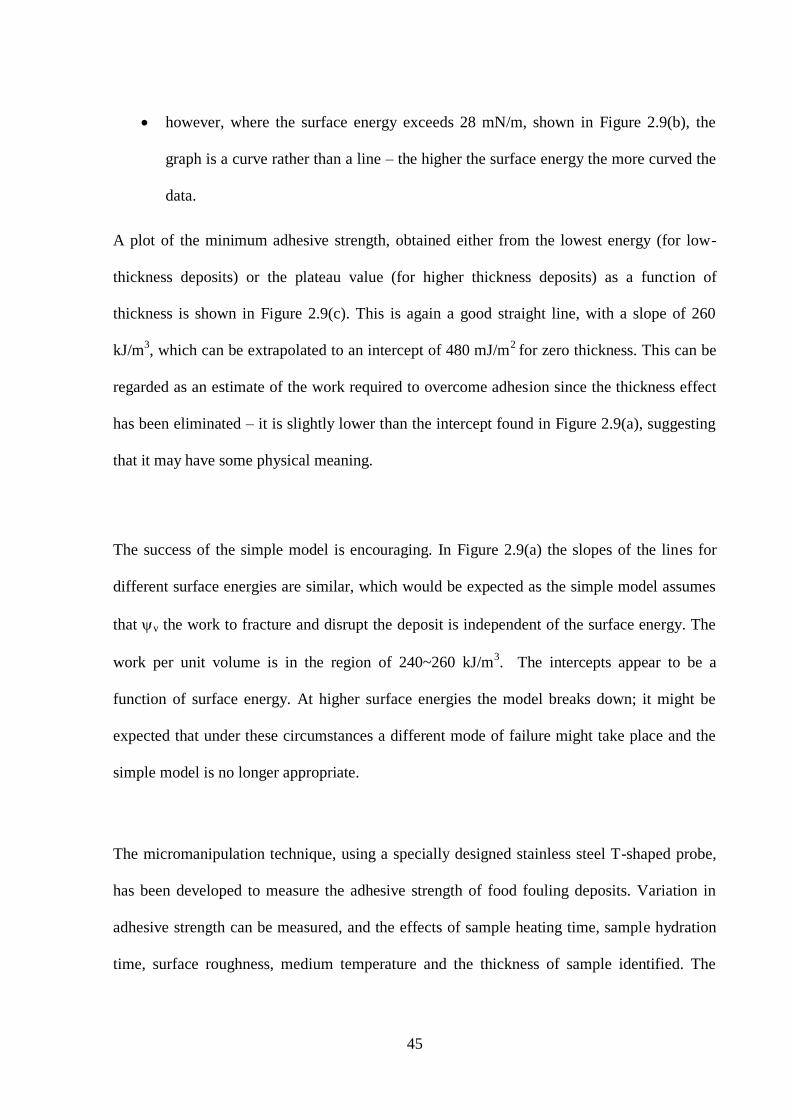
45
however, where the surface energy exceeds 28 mN/m, shown in Figure 2.9(b), the
graph is a curve rather than a line – the higher the surface energy the more curved the
data.
A plot of the minimum adhesive strength, obtained either from the lowest energy (for low-
thickness deposits) or the plateau value (for higher thickness deposits) as a function of
thickness is shown in Figure 2.9(c). This is again a good straight line, with a slope of 260
kJ/m3, which can be extrapolated to an intercept of 480 mJ/m
2 for zero thickness. This can be
regarded as an estimate of the work required to overcome adhesion since the thickness effect
has been eliminated – it is slightly lower than the intercept found in Figure 2.9(a), suggesting
that it may have some physical meaning.
The success of the simple model is encouraging. In Figure 2.9(a) the slopes of the lines for
different surface energies are similar, which would be expected as the simple model assumes
that v the work to fracture and disrupt the deposit is independent of the surface energy. The
work per unit volume is in the region of 240~260 kJ/m3. The intercepts appear to be a
function of surface energy. At higher surface energies the model breaks down; it might be
expected that under these circumstances a different mode of failure might take place and the
simple model is no longer appropriate.
The micromanipulation technique, using a specially designed stainless steel T-shaped probe,
has been developed to measure the adhesive strength of food fouling deposits. Variation in
adhesive strength can be measured, and the effects of sample heating time, sample hydration
time, surface roughness, medium temperature and the thickness of sample identified. The

46
AFM identifies the relationship between deposits and the surfaces. The AFM combined with
the micromanipulation technique will be valuable in measuring surface properties. It will be
necessary to study a wider variety of more realistic deposits: it would be interesting to look at
deposits in which adhesion is stronger than cohesive forces. Measurement of nano- and
micron- scale forces might reveal some interesting information.
2.10 Conclusions
Fouling is formed as a result of a variety of processes. It is essential to observe the responses
between different food deposits and surfaces. This will help towards improving cleaning. This
information can be used to find suitable cleaning in place (CIP) regimes for different surfaces
and equipment. Many studies have been carried out to improve CIP processes, such as work
done at Birmingham and described by Aziz et al. [2006], Christian et al. [2003] and Liu et
al.[2006], using surface modification and antifouling surfaces, but it is not known in practice
whether they give optimal conditions. Low surface energies can reduce adhesion, but more
work is needed to understand the effect of surface energy onto fouling removal and its
possible effects on cleaning in place (CIP).
The AFM provides a method for detecting nanoscale information. Applications of AFM are
potentially widespread in food research; it can see molecular interaction, surface topography,
and deposit characterization. The AFM analysis could be used to determine physical,
chemical and structural mechanisms of fouling and cleaning. However, the limiting factor in
applying AFM to food research is the lack of appropriate methodology for different food
deposits. Increasing understanding on AFM technology and developing corresponding

47
methodology for complicated food deposit systems, could lead to a more detailed
understanding of cleaning at macromolecular and nanometre levels.
Micromanipulation experiments have measured the adhesive/cohesive strength of deposits in
terms of the work required to remove them from the surface. Different food deposits have
been studied. Tomato paste, bread dough and egg albumin deposits have a lower adhesive
than cohesive strength, whilst others (whey protein) have a lower cohesive than adhesive
strength. A range of coated surfaces has been used to study the effect of surface energy on the
force required for removal of tomato deposits. Minima are found, as predicted by theory. A
simple material model has been developed and used to analyse the results in terms of the work
required to remove the deposit per unit surface area and volume.
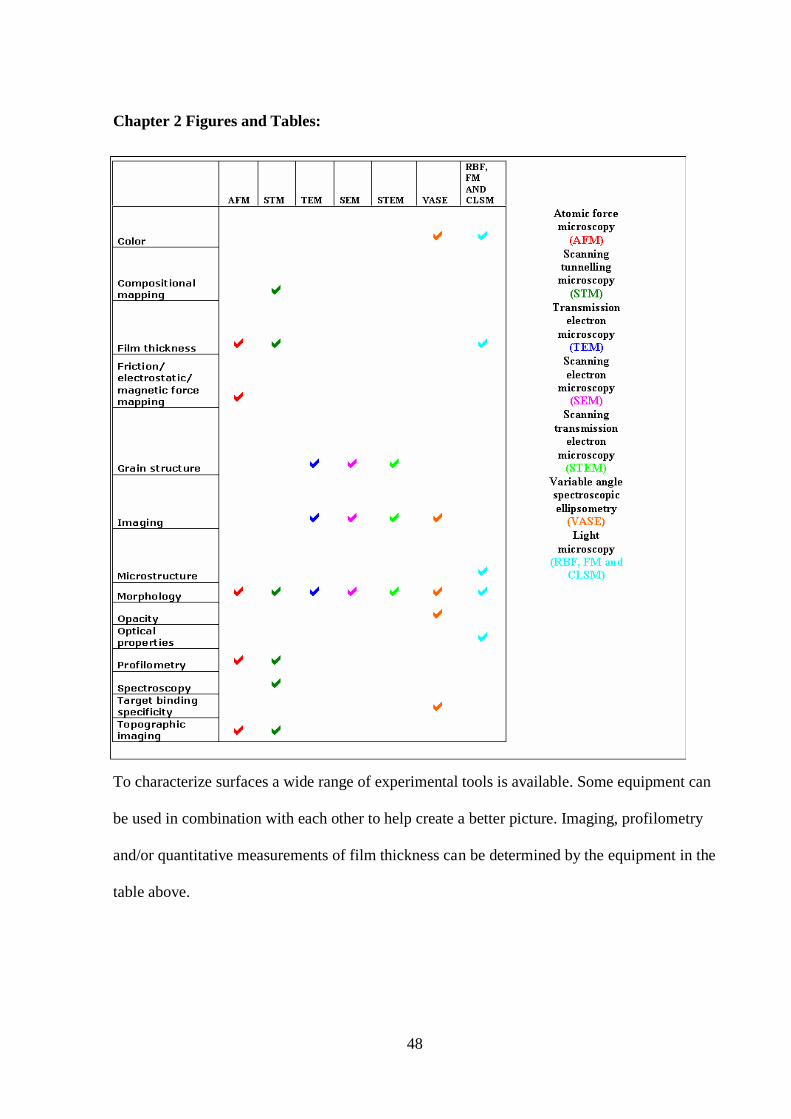
48
Chapter 2 Figures and Tables:
Table 2.1: Surface characterisation techniques.
To characterize surfaces a wide range of experimental tools is available. Some equipment can
be used in combination with each other to help create a better picture. Imaging, profilometry
and/or quantitative measurements of film thickness can be determined by the equipment in the
table above.

49
Table 2.2:
Elemental composition and chemical state measurement can be determined by the techniques
above.

50
Table 2.3:
Microstructure, crystallography, and defects measurements can be determined using the above
techniques.
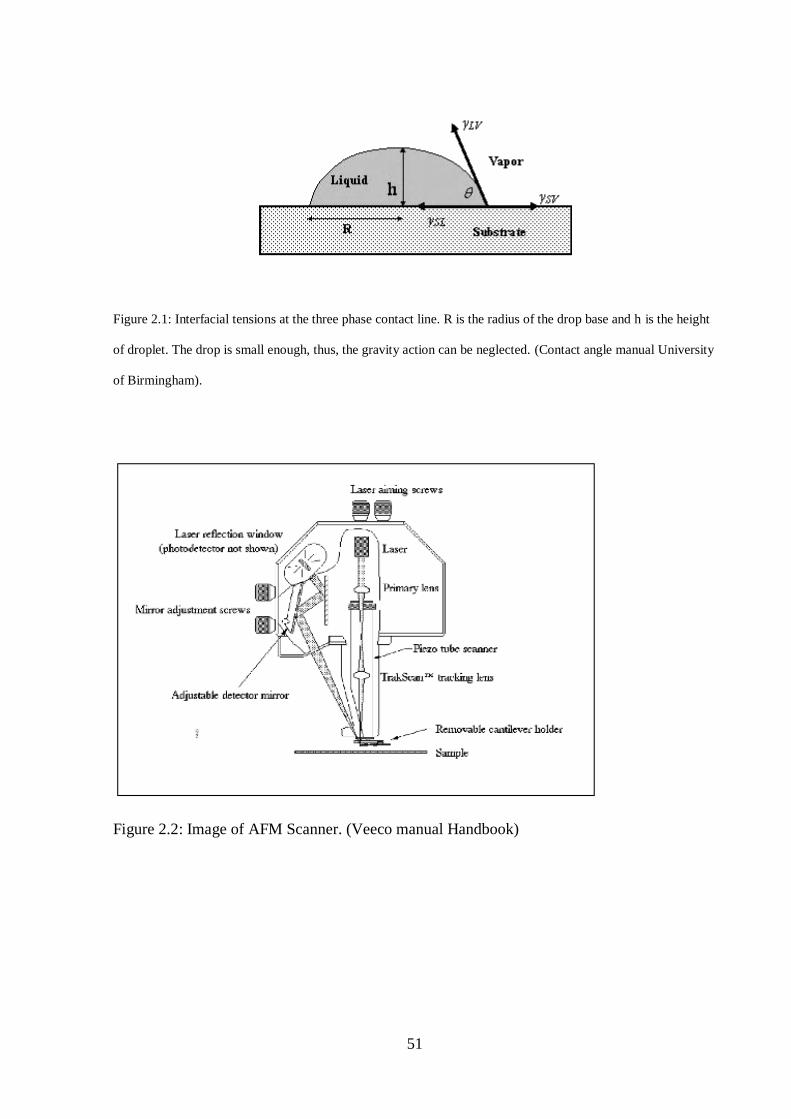
51
Figure 2.1: Interfacial tensions at the three phase contact line. R is the radius of the drop base and h is the height
of droplet. The drop is small enough, thus, the gravity action can be neglected. (Contact angle manual University
of Birmingham).
Figure 2.2: Image of AFM Scanner. (Veeco manual Handbook)

52
Figure 2.3: Etched logo of project on polycarbonate surface using a diamond probe with the
AFM.
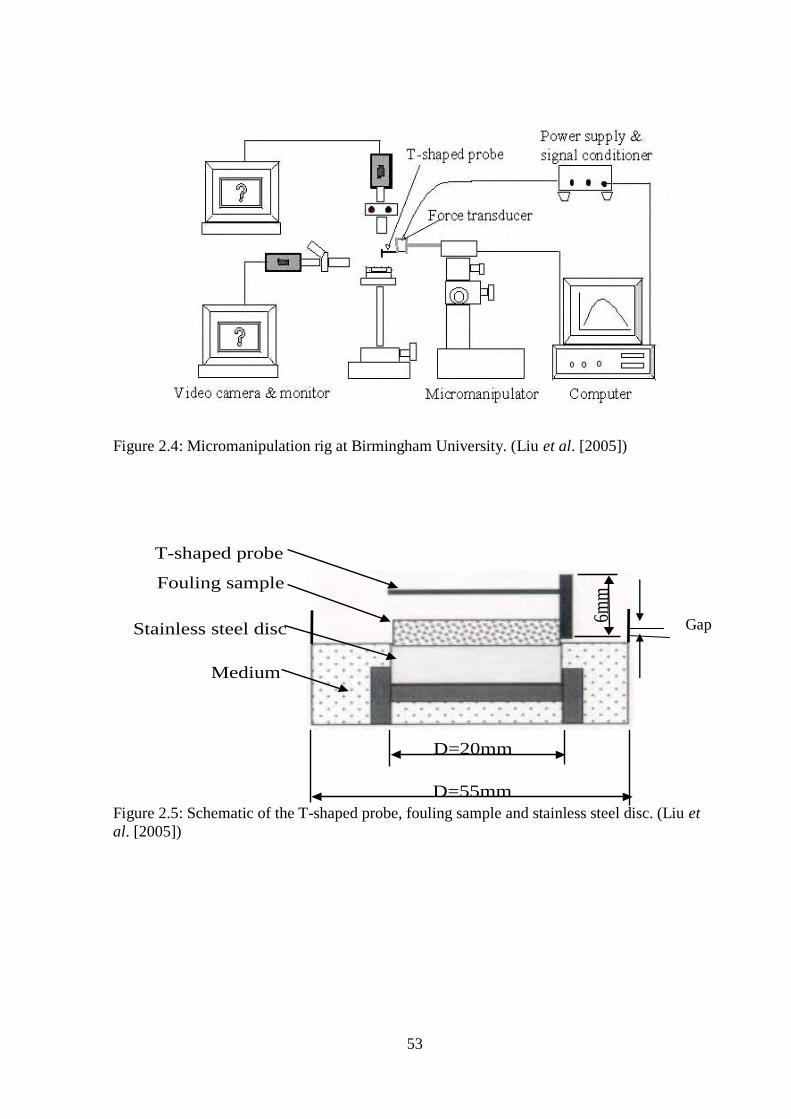
53
Figure 2.4: Micromanipulation rig at Birmingham University. (Liu et al. [2005])
Figure 2.5: Schematic of the T-shaped probe, fouling sample and stainless steel disc. (Liu et
al. [2005])
D=20mm
D=55mm
6mm
Stainless steel disc
Fouling sample
Medium
T-shaped probe
Gap

54
Figure 2.6: The sequence of fouling sample pulling processes by the T-shaped probe: (A)
(B) (C) (D). (Liu et al. [2005])
(A) (B)
(C) (D)
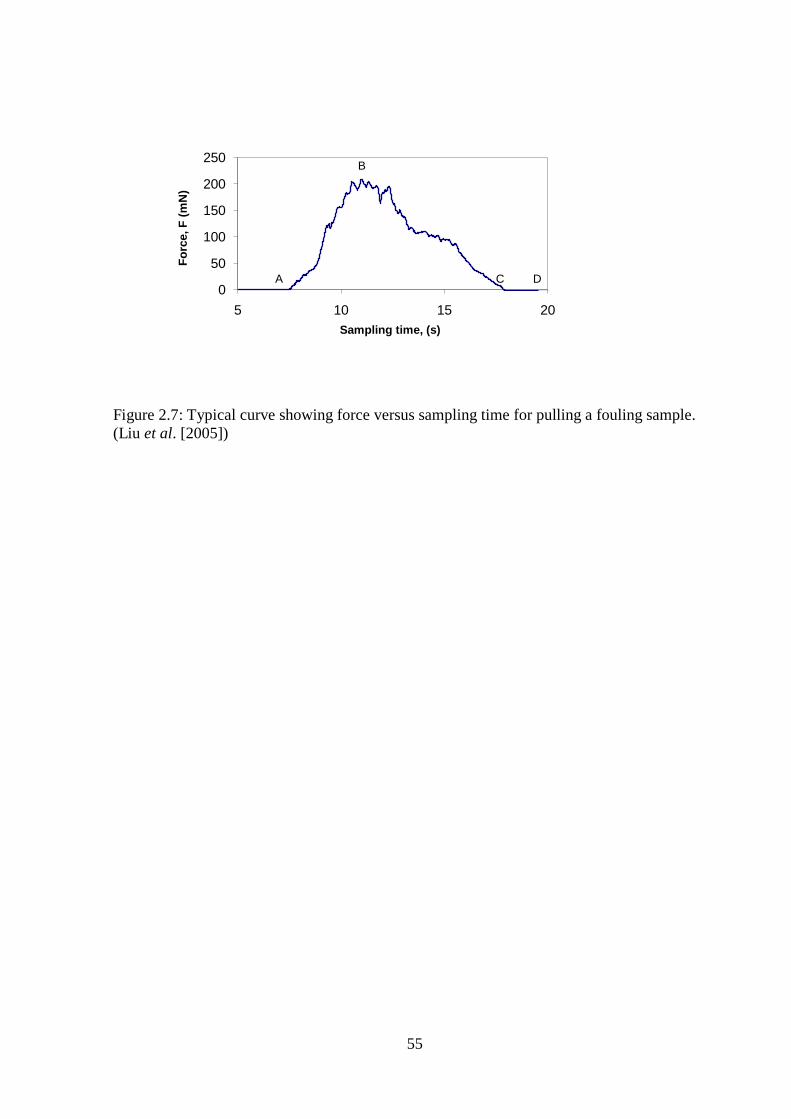
55
Figure 2.7: Typical curve showing force versus sampling time for pulling a fouling sample.
(Liu et al. [2005])
0
50
100
150
200
250
5 10 15 20
Fo
rce, F
(m
N)
Sampling time, (s)
A
B
C D

56
(a)
(b)
Figure 2.8. Variation of apparent adhesive strength with surface free energy (a) for baked and
unbaked tomato pastes; (b) for unbaked tomato paste samples of different thicknesses. (Liu et
al. [2005])
500
1000
1500
2000
2500
3000
10 20 30 40
Surface free energy (mN/m)
Ad
hes
ive
stre
ng
th, (
mJ/
m2 )
unbaked baked
500
750
1000
1250
1500
1750
2000
10 20 30 40
Surface energy, (mN/m)
Adh
esiv
e st
reng
th, (
mJ/
m2 )
1.2mm thick 1.8mm thick 2.4mm thick
3.0mm thick 3.6mm thick

57
(a)
(b)
600
800
1000
1200
1400
1600
1800
2000
0 1000 2000 3000 4000
Thickness, (m)
Ap
pa
ren
t a
dh
es
ive
str
en
gth
,(m
J/m
2)
28.83 mN/m
29.31 mN/m
36.0 mN/m
37.7 mN/m
400
600
800
1000
1200
1400
1600
0 1000 2000 3000 4000
Thickness, (m)
Ap
pare
nt
ad
hesiv
e s
tren
gth
,(m
J/m
2)
20.1 mN/m
21.5 mN/m
25.5 mN/m

58
(c)
Figure 2.9. Variation of apparent adhesive strength with thickness for unbaked tomato paste
deposits (a) onto three surfaces of energy 20-25 mN/m, showing a good fit to a straight line as
suggested by equation (2.4), (b) onto four surfaces of energy >25mN/m, showing increasing
deviation from linearity with surface energy (c) at the minimum apparent adhesive strength,
showing a good straight line (Liu et al. [2005]).
0
200
400
600
800
1000
1200
1400
1600
0 1000 2000 3000 4000
Thickness of deposit layer, (m)
Min
imum
app
aren
t adh
esiv
e st
reng
th,
(mJ/
m2 )

59
CHAPTER 3: MATERIALS AND METHODS.
Introduction and aims.
Chapters 1 and 2 introduced the industrial cleaning problems in the food sector and
demonstrated that for both economic and environmental reason it is crucial to optimise
protocols. In the two previous chapters, the use of AFM and micromanipulation to investigate
cleaning processes has also been reviewed. The aim of this chapter is to a give detailed
description of the methods, procedures and materials used to obtain the results that are
discussed in Chapters 4, 5 and 6.
In Chapter 2 the use of micromanipulation to study the forces involved in the removal of
deposits from surfaces was discussed. Micromanipulation was used to study the removal of
four different deposits on different surfaces types: stainless steel, PTFE, glass and ceramic. In
Chapter 1 the selection of the deposits to be used in this thesis was defined: Turkish delight,
caramel, sweetened condensed milk (SCM) and toothpaste deposits. These are representative
of deposits from the food and personal care industries.
Chapter 2 has discussed the deposit failure modes of deposits that take place during cleaning.
Three types of removal measurement were possible:
(i) adhesive failure, when deposit is totally removed without deformation by breakage
at the surface (such as is seen in Figure 2.6);
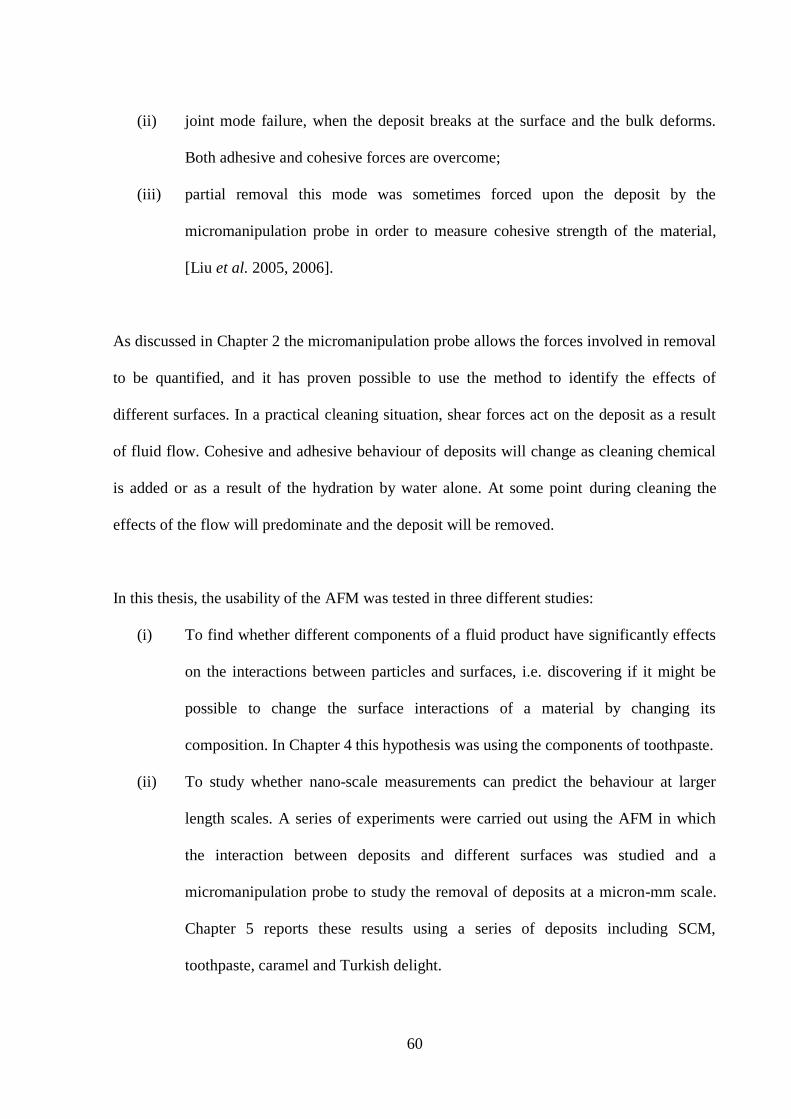
60
(ii) joint mode failure, when the deposit breaks at the surface and the bulk deforms.
Both adhesive and cohesive forces are overcome;
(iii) partial removal this mode was sometimes forced upon the deposit by the
micromanipulation probe in order to measure cohesive strength of the material,
[Liu et al. 2005, 2006].
As discussed in Chapter 2 the micromanipulation probe allows the forces involved in removal
to be quantified, and it has proven possible to use the method to identify the effects of
different surfaces. In a practical cleaning situation, shear forces act on the deposit as a result
of fluid flow. Cohesive and adhesive behaviour of deposits will change as cleaning chemical
is added or as a result of the hydration by water alone. At some point during cleaning the
effects of the flow will predominate and the deposit will be removed.
In this thesis, the usability of the AFM was tested in three different studies:
(i) To find whether different components of a fluid product have significantly effects
on the interactions between particles and surfaces, i.e. discovering if it might be
possible to change the surface interactions of a material by changing its
composition. In Chapter 4 this hypothesis was using the components of toothpaste.
(ii) To study whether nano-scale measurements can predict the behaviour at larger
length scales. A series of experiments were carried out using the AFM in which
the interaction between deposits and different surfaces was studied and a
micromanipulation probe to study the removal of deposits at a micron-mm scale.
Chapter 5 reports these results using a series of deposits including SCM,
toothpaste, caramel and Turkish delight.
61
(iii) To study the variation of the adhesion forces with respect to temperature. The
initial adhesion of deposits occurs at elevated temperature, so it would be useful to
understand how the magnitudes of the forces change with temperature. A
Nanowizard (JPK) was used to study the types of adhesion force between surfaces
and whey protein at temperatures between 30ºC and 90ºC.
In Chapters 4, 5 and 6, AFM analysis was performed using either a Dimension 3100
Nanoscope AFM (Veeco, UK) or a Multimode (Veeco, UK) at the University of Birmingham
or a Nanowizard II AFM (JPK, Berlin) at the JPK offices in Berlin. Each AFM was housed on
a vibration isolation table to minimise the effect of ambient noise on imaging and
measurement quality. JPK processing software (JPK, Berlin) and Nanoscope V613r1
processing software (Veeco UK) was used. (Figures 3.1, 3.2, 3.5, 3.6)
The aim of this work as whole was to identify whether AFM has a role in fouling and
cleaning studies, in terms of being able to relate measured adhesion forces to cleaning
parameters. The work consisted of three strands:
(i) Surface characterisation using AFM, which determined the surface parameters of glass,
PTFE, stainless steel and ceramic with the aid of imaging in tapping and contact mode. This
work revealed adhesion measurement data by doing fluid work between the different surfaces
and deposits.
(ii) Adhesion measurements at two length scale to make comparisons between the nano and
micron scale.

62
(iii) Force measurements at low and high temperatures. This work was designed to gain
understanding of the aqueous environment and toothpaste ingredient solutions, to see how
different components reacted with the surfaces.
AFM and micromanipulation should show similar behaviours at each length scale. In thermal
processing thermally labile materials form fouling deposits and adhesion should increase with
temperature.
Surface and deposit selection and preparation.
3.2.1 Surfaces
In Chapters 4, 5 and 6 stainless steel 316L, ceramic, glass and PTFE surfaces were used in
experiments. The compositions and characteristics of these surfaces have been discussed in
detail in Chapter 2. Chapter 2 gave the reason for selecting these materials:
Stainless steel is widely used in the food processing industry,
PTFE is used here to see any differences in force interactions or removal behaviours
compared to stainless steel. PTFE has been used to identify antifouling or easy- to-
clean behaviours in system such as marine fouling, by Callow et al. (2002) and in
dairy fouling by Rosmaninho et al. (2005).
Ceramic and glass are used in the food industry as hygienic surfaces both to prepare
and serve food.
The materials employed were as follows,
(i) Stainless steel 316L round discs 14 mm in diameter and 1-2 mm thick,

63
(ii) PTFE coated round discs 14 mm in diameter, and 1-2 mm thick,
(iii) Glass (SiO2) discs 14 mm diameter and 1-2 mm thick,
(iv) Ceramic squares 14 x 14mm and 1-2 mm thick.
All were prepared in-house at the University of Birmingham by the Engineering workshop.
3.2.2 Composition of Deposits.
The cleaning map shown in Figure 1.1 explains the selection of deposits. A wide variety of
fouling deposits are formed in industry which require different modes of cleaning. The
severity of the fouling deposit differs depending on the material properties. The cleaning map
defines three foulant types; low viscosity fluids, high viscosity fluids and cohesive solids.
Figure 1.1 was used as the basis of deposit selection for investigations: toothpaste, whey
protein, SCM, Turkish delight and caramel were chosen. Biofilms were omitted from the
scope of this work owing to the complexity of forming reproducible deposits. The chosen
deposits are from Types 1 and 3: those that are removed by water alone (toothpaste) and those
that require chemical removal (whey protein, SCM, Turkish delight and caramel). The model
foulants have the following compositions (Table 3.1 contains details):
(a) Toothpaste is a suspension of different particles that are approximately 0.5 µm in
diameter, titanium dioxide, zinc citrate, sorbitol and silica as well as saccharin, sodium
lauryl sulphate and water, (GSK, UK). Each component was mixed with HPLC water,
purchased from Sigma Aldrich (UK).
64
(b) Confectionery deposits:
(i) Caramel contains glucose, sugar, whey powder, palm oil and water, (given by
Cadburys, (UK)). Caramel is derived from the caramelisation of sugar by heating it
slowly to around 108° C. As the sugar melts and approaches this temperature, the
molecules break down to give caramel. The darker colour and the flavour arise due to
the Maillard reaction, which occurs between an amino acid and a reducing sugar
[Grandhee, et al. 1991]. The chemical interaction suggests that high temperature
causes the Maillard reaction to occur.
(ii) Turkish delight contains agar, glucose, starch, sugar and water (given by
Cadburys, UK). Turkish delight is made from starch, agar and sugar and has a soft,
sticky consistency with a gel-like structure. The component are heated up at 100ºC,
then dissolved using hot pressurised water at 135ºC.
(iii) Sweetened condensed milk (SCM) contains sugar, butterfat, whey protein and
water (given by Cadburys, UK) and is an intermediate in chocolate making. It contains
milk from which water has been evaporated and sugar added. This mix is heated to 85-
90°C for several seconds. This heating destroys some microorganisms, decreases fat
separation and inhibits oxidation. The sugar extends the shelf life, increasing the
osmotic pressure, which inhibits microorganism growth. The sweetened evaporated
milk is cooled and lactose crystallization induced. The materials are processed in a
unit, in which evaporation takes place whilst SCM is sheared and heated. Here fouling
deposits forms which are difficult to remove.

65
(iv) Whey protein (WPC) was prepared by the method defined by Christian [2003].
The WPC solution was prepared from whey powder to have a total -lactoglobulin
concentration of 0.3 wt%. -lg is the major protein responsible for fouling from whole
milk, as discussed by Christian [2003]. The amount of WPC powder used was
determined using the following equation:
0144.0
13.0)( ygaddedpowderofMass (3.1)
Where y (l) is the volume of WPC solution to be prepared, and the value 0.0144 arises
from the -lg content of WPC powder. An electronic mixer was used to ensure the
WPC solution was homogeneous. The blades of the mixer were completely covered
by the water, switched on and the powder added. After approximately 10 minutes the
mixer was switched off, removed and wiped clean. The WPC solution was left for a
further 20 minutes to de-aerate at 25ºC.
3.2.3 Deposit preparation.
Toothpaste ingredients.
For experiments described in Chapter 4 the following toothpaste ingredients were all
dissolved or suspended in HPLC (High Performance Liquid Chromatography) grade water
(Sigma-Aldrich, UK), using weight/weight concentrations. These solutions were used to
investigate pull off forces using the multimode AFM :
(i) Saccharin [C7H5NO3S], 0.3% w/w (Sigma-Aldrich, UK).
(ii) Sorbitol [C6H8(OH)6], 65% w/w, (Sigma-Aldrich, UK).
(iii) Sodium lauryl sulphate [C12H25NaO4S], 3% w/w (Sigma-Aldrich, UK).
66
(iv) Zinc citrate [Zn3(C6H5O7)2], 3% w/w (Sigma-Aldrich, UK).
(v) Titanium dioxide [TiO2], 10% w/w (Sigma-Aldrich, UK).
3.2.4 Deposits on surfaces.
The samples in section 3.2.3 were analysed using the Multimode AFM (Veeco, UK) in force
mode. The Multimode AFM is designed around a stationary probe. Samples were scanned
back and forth beneath the probe. The multimode has an added feature of being able to do
fluid work via its fluid cells. With the multimode AFM the systems were studied under liquid
conditions in force mode to gain force data, as shown in Chapter 4.
The D3100 AFM works by keeping the samples stationary whilst scanning the probe back and
forth above them. Typically, samples were fixed to 1.4 cm metal disks, and then magnetically
attached to the top of the scanner tube. The scanner moves back and forth, allowing the probe
to extract information such as surface roughness data from the sample surface. With the
D3100 AFM, ceramic, glass, stainless steel and PTFE surfaces were studied in contact and
tapping mode to obtain surface images and roughness data.
3.2.5 Sample preparation for Micromanipulation.
Chapter 2 has described previous work using the micromanipulation probe of Liu et al.
[2002]. A series of experiments were carried out where SCM, caramel, toothpaste and Turkish
delight were spread onto stainless steel discs and studied using the micromanipulation
technique. As detailed in Chapter 2 the technique was developed to measure the adhesive
strength of food fouling deposits using a T-shaped probe made of stainless steel chip. The T-
shaped probe was connected to the output aperture of a transducer (model BG-1000, Kulite

67
Semiconductor, Leonia, NJ, USA), which was itself mounted on a three dimensional
micromanipulator (MicroInstruments, Oxon, UK).
Micromanipulation experiments in chapter 5 required 0.2 g of Turkish delight, caramel, SCM
and toothpaste to be uniformly spread over the whole surface. It was possible to do this with
stainless steel, PTFE and glass discs, but not with the ceramic surface as it was too rough and
caused very inconsistent results. In all cases the initial thickness of the deposit layer was
approximately 0.7 mm. To simulate cooking, SCM deposit layers were baked in a pre-heated
laboratory fan oven at 80ºC for 1 hour, the other deposits were used unbaked. The T-shaped
probe was then passed at different cut heights over the surface and the force required for
removing the food deposits measured. All runs used a probe speed of 1.1 mm/s. A minimum
of five measurements were performed per cut height.
3.2.6 Nanowizard II AFM (JPK, Berlin): force measurements preparation.
The Nanowizard II AFM (JPK) (Figure 3.1) has a lateral scan range of 100µm by 100µm and
a vertical range of 15µm, which enabled force data for sticky deposits. In Chapter 5 the
caramel, Turkish delight, SCM and toothpaste deposits were spread thinly over a glass slide
(Agar Scientific). The thickness of the deposits was 50-60µm determined using the AFM
optics. The force measurements were taken on the deposits with the Nanowizard II (JPK)
AFM. The modified tip was immersed in the deposit and retracted to get force data.
In Chapters 5 and 6 tip modification of the AFM tipless cantilevers was required to enable
surface deposit interactions to be studied. Commercially available AFM tips were pre-made

68
with different attached materials such as silica of different sizes proving very expensive. Here
the interest was in forces between deposits and stainless steel, glass and PTFE. Ceramic was
omitted as it was too rough and heavy for the tipless cantilever. To obtain a force curve the
requirement was a tip with an attached particle of stainless steel or PTFE or glass. As this was
not commercially available tip modification was required.
Both components of epoxy glue were mixed together on a glass slide. Another glass slide
was taken, a drop of epoxy was spread using a spatula. Using the AFM built-in video system
of the Dimension 3100 AFM, the tip was put in contact with 0.2 ml droplet of epoxy glue,
then spread over a tipless Si cantilever of nominal length 225 µm. The nominal spring/force
constant was 48 Nm-1
from Hooke's law and nominal resonance frequency was 190 kHz were
used. [This is when maximum cantilever oscillation amplitude occurs (Windsor Scientific,
UK)]. After putting epoxy glue on the tip, the glue was allowed to semi-cure, this prevented
the glue from spreading all over the surface of interest. The microparticle was attached onto
the tip and left for 5 minutes
This allowed an unquantifiable amount of epoxy at the tip apex. Comparing the size of the
droplet on the slide before and after touching with the AFM tip, one can estimate the amount
of epoxy deposited onto the tip by trial and error. The amount of deposited epoxy should not
be more than a few cubic microns. Using the motorised stage on the Dimension 3100 AFM, a
30µm nominal diameter microparticle of stainless steel, PTFE and glass, was first isolated
from the powders; the epoxy covered tip was put in contact with the stainless steel (Reade,
USA) or glass (Polysciences, UK) microparticles.
Glass and Stainless steel modification tip. Using the AFM built-in video system, the tip was
put in contact with 0.2ml droplet of epoxy. A 30µm nominal diameter microparticle of

69
stainless steel/ glass, was put into contact with epoxy covered tip. After keeping the tip on the
stainless steel microparticle for 5-10 minutes, the tip was disengaged and stored for further
processing. (Figures 3.3 and 3.4).
PTFE modification tip. For the PTFE tip, a coating of 200 nm of trichloro(3,3,3-
trifluoropropyl)silane (Aldrich, UK) was applied to the glass microparticle by vapour
deposition. A Petri dish with 5ml of trichloro(3,3,3-trifluoropropyl)silane was put in a glass
container. The attached glass microparticle tips were placed on a silica wafer next to the Petri
dish. The glass container was sealed air tight, then covered with foil, and placed in a vacuum
cupboard. The glass microparticle tips were left for 24 hours before the thickness of
deposition was measured using the Dimension 3100 AFM. Using the AFM built-in video
system of the Dimension 3100 AFM, the tip was put in contact with a 0.2 ml droplet of
epoxy. A 30µm nominal diameter microparticle of PTFE, was put into contact with the epoxy
covered tip. After keeping the tip on the microparticle for 5-10 minutes, the tip was
disengaged and stored for further processing.
For experiments contained in Chapter 6 the same sample preparation methods were used as in
Chapter 5 for preparing stainless steel and PTFE tips for the caramel, whey protein and SCM.
The Nanowizard II AFM was attached to a heating stage (JPK, Germany), which heated and
controlled the temperature. This was done to obtain force measurements at different
temperatures.
3.3 AFM analysis.
3.3.1 Dimension 3100.
70
Chapter 2 introduced the concept of the Dimension 3100 (Figure 3.2) Scanning Probe
Microscope (SPM) which produces high-resolution, three-dimensional images by scanning a
sharp tip over the sample‘s surface. A stepper motor was coupled to a lead screw which
translates to the slide with the sample attached. A separate motor drive controlled the height
of the microscope and tip relative to the sample‘s surface. All images were acquired using
either a Dimension 3100 AFM (Veeco) or Nanowizard II (JPK). The Nanowizard II AFM
operated an 'E' scanner, with a maximum lateral range of 100 µm x100 µm and a maximum
vertical range of 15 µm. The Dimension 3100 AFM had a maximum lateral range of 106 µm
x 106 µm and a maximum vertical range of 5.5 µm in contact mode, but 2.75 µm in tapping
mode.
Contact Mode AFM imaging was performed using triangular 200 µm length thick- legged
Au-coated pyramidal-tipped Si3N4 cantilevers (Veeco) with nominal spring constants of 0.12
Nm-1
.
Tapping Mode AFM imaging was performed using rectangular 180 µm length pyramidal-
tipped Si cantilevers (Veeco) with nominal spring constants of 40 Nm-1
and resonant
frequencies in the range 250-350 kHz.
The feedback control loop was optimised by increasing the integral and proportional gains in
a sequential manner. The values of the integral and proportional gains employed were a
function of the tip velocity and the surface chemistry of the sample. For each image acquired,
either the deflection signal (Contact Mode AFM) or the amplitude signal (Tapping Mode
AFM) was monitored during this process. The optimum values were those which immediately
71
preceded uncontrolled oscillation of the cantilever, which occurred when the integral and
proportional gains were set too high. All images were acquired at scan rates between 0.2-2.0
Hz; each image being composed of 512 x 512 pixels. Height data was acquired for each
image, usually accompanied by deflection data for Contact Mode AFM. Amplitude and phase
data were also usually acquired in addition to height data for Tapping Mode AFM.
3.3.2 Roughness Analysis.
The roughness of the surfaces was measured at the nanoscale using the AFM. Data was
expressed as:
RMS (Rq): The Root Mean Square (RMS) roughness i.e. the standard deviation of the
Z values within a given area.
RMS=
N
ZZN
lt
avel
2
(3.2)
Z ave is the average Z value within the given area l
Z is the current Z value, and N is
the number of points within a given area.
Ra: is the mean roughness representing the arithmetic average of the deviations from
the centre plane.
aR =N
ZZN
l
cpl
1
(3.3)

72
Zcp is the Z value of the centre plane, and l
Z is the current Z value, and N is the
number of points within a given area.
R max: The difference in height between the highest and lowest points on the surface
relative to the mean plane.
3.3.4 Cantilever spring constants.
The spring constant is a measure of the flexibility of a cantilever and will determine the
resolution with which forces can be measured. A number of researchers have investigated the
calibration of spring constants, in particular Sader et al. [2005], who also studied the
frequency response, torsional frequency response, and effect of fluid viscosity on AFM
cantilevers. Other publications include that of Senden, et al. [2001] and Cleveland, et al.
[1995], who studied the effect of adding mass to the free end of a cantilever, and Torii, et al.
[1996] and Gibson, et al. [2005], who studied the deflection of an AFM cantilever when
pressed onto another cantilever. In each case, the research was done to make sure that the
parameters in Hookes law were still appropriate, i.e that force and displacement are linearly
related. The calibration of the spring constants of cantilevers was performed before the force
measurements were undertaken. This was done by pressing on a calibrated cantilever with a
non calibrated cantilever and determining the spring constant. The spring constants
calibrations of the cantilevers were performed before the adhesion measurements. This is an
important step in ensuring the complete validity of results obtained, and this was done before
every experiment.

73
3.3.5 AFM adhesion measurements
All force measurements were performed using a MultiMode AFM (Veeco) for experiments in
Chapter 4 or a Nanowizard II AFM (JPK) for experiments in Chapter 5 and 6.
Multimode AFM (Veeco) experiments were operated in Contact Mode in a liquid
environment. This was because experiments all toothpaste ingredients were made up as
suspensions or solutions in HPLC water. A glass fluid cell (Veeco) with a silicone O-ring
(Veeco) was employed for all force measurements. For each tip/sample combination, the
sample was housed in a 5 mL capacity Luer-Lok plastic syringe (Fisher Scientific) prior to
introducing the liquid to the fluid cell through clean silicone tubing (Veeco). Prior to
performing each measurement, the fluid cell was rinsed thoroughly with HPLC water (Fisher
scientific) and dried through absorption of H2O using a small piece of paper towel (Kimberly
Clark).
When filled with sample solution, the fluid cell was sealed off using tubing clips and the
system allowed to thermally equilibrate at room temperature (21°C). Equilibration was
considered to have occurred once the vertical and horizontal deflection of the cantilever had
stopped fluctuating. This generally took between 20-60 minutes and was dependent on the
starting temperature of the fluid cell system, sample condition and cantilever. Force
measurements were performed using triangular thick-legged Au-coated cantilevers, each with
a silica microparticle (6000nm tip diameter) attached at its apex (BioForce Nanosciences,
USA), with nominal spring constants of 0.58 N m-1
. A range of approach and retract velocities
(2,000 nm s-1
, 14,000 nm s-1
, 20,000 nm s-1
) were employed to assess the effect of
measurement speed on the measured forces. The real-time data was exported using

74
Nanoscope v6.12r1 software (Veeco, USA) to provide cantilever deflections, the measured
forces were calculated from the monitored deflection relative to the baseline deflection using
Hooke's law. The experiments were repeated a least five times to gain accuracy and
consistency. An example of a force curve is shown in Figure 3.7. On the curve:
Point 1: The tip approaches the surface, but is not in contact with it. Non-contact
repulsive forces will be observed during the approach phase as an upwards deflection
of the cantilever.
Point 2: Jump-to point. The tip is pulled down onto the surface by attractive forces
near the surface.
Point 3: As the tip is pressed into the surface, the cantilever bends upwards.
Point 4: As the cantilever retracts from the surface, it relaxes. The tip is still in contact
with the surface.
Point 5: As the cantilever continues to retract from the surface, the cantilever
continues to bend downwards as surface attraction holds onto the tip.
Point 6: Pull-off point. The tip breaks free of surface attraction and the cantilever
snaps upwards.
Point 7: The tip continues to retract from the surface. No further contact with the
surface is made.
Real-time 'Deflection-Separation' data was initially acquired for all measurements, displaying
the motion of the cantilever relative to the separation distance between the cantilever tip and
the surface. Upon completing the measurements, the data was processed off-line in Microsoft
Excel to provide mean ―pull-off‖ force values for all tip/sample combinations, as well as
75
mean values for any electrostatic forces observed during measurements. Forces were obtained
by multiplying the distance of cantilever motion by the cantilever spring constant, as
described by Hooke‘s law.
Nanowizard II (JPK) AFM force measurements detailed in Chapter 5 and 6 were performed
whilst operating in Contact Mode. Force measurements were performed using modified
tipless Si cantilevers of nominal length 225 µm, nominal force constant 48 Nm-1
and a
nominal resonance frequency of 190 kHz (Windsor Scientific, UK) throughout. Deposits
measuring 50µm to 60µm were spread on glass slides using a small spatula. The tip was
engaged to the sample and force measurements taken. The tip was cleaned after each
experiment in a HPLC water bath. Force over radius normalises the forces so that results from
different tips can be compared. Different tip radiuses have a different contact/interaction area
with a sample, meaning different forces, (Drucker, et al. [1992], Israelachvili, et al. [1987]).
A minimum of five measurements were performed per deposit surface. The standard errors
where calculated by (standard deviation/√n).
JPK processing software (JPK, Berlin) was used throughout for real-time analysis and post-
capture image processing. Samples were immobilised onto glass slides (Agar Scientific, UK)
using a small syringe needle (Fisher Scientific, UK) prior to AFM analysis. All sample
handling was carried out using Dumostar tweezers (Agar Scientific, UK) to minimise the risk
of sample contamination.

76
3.3.6 Thermal Heating Adhesion Measurements.
For experiments and detailed in Chapter 6 the Nanowizard II (JPK) AFM was adapted to
include a heating stage. The temperature control limits of the heating stages were between 0ºC
and 100ºC. The temperatures used in the thermal heating studies were 30ºC, 50ºC, 70ºC and
90ºC. This was done to see how holding the deposits at different temperatures affected the
adhesion strength to the microparticles. JPK processing software (JPK) was used throughout
for both real-time analysis and post-capture image processing. Sample preparation the same as
in section 3.3.4. The cantilevers were cleaned in between experiments with HPLC water.
3.4 Experimental errors
A number of factors could contribute to experimental errors:
1. Deposit production: The natural behaviour of food deposits to lose moisture to
the atmosphere can cause change in the deposit structure on the surface before
removal. So retaining original moisture is essential as results can vary and
cause inconsistency. Error was minimised by doing experiments one at time:
deposits were used quickly to minimise any moisture change.
2. Experimental procedures: Switching the cantilevers and cleaning the tips
during experimental work might have created errors. Generally each deposit
was studied with its own cantilever to eliminate contamination between
different deposits. In all cases the spring constants of the cantilever were
measured.
3. Cantilever: The cantilever can become contaminated, and damaged very easily.
Accidental breakage of a tip before the end of a set of experiments could cause
77
inconsistency in results: any breakages would be seen optically using the
microscope and the cantilever replaced.
4. Inaccuracy of equipment:
Imaging: There can be errors associated with tip shape; as the tip sharpness
can degrade over time. The tip shape needs to be monitored over time to see
any wear. [Veeco Instrument Manual]: this was done using the optical
microscope as noted above.
Noise/vibrations levels in the room can cause fluctuation in image
resolution.
Force measurements: Some deviation from the baseline (i.e points 1,7 on
Figure 3.7) can occur. This will affect the measured values as there will be
uncertainty in the "no deflection" value taken from the data. It is important to
know the contact area and penetration depth of the particle into the deposit
because the presence of deposit on the cantilever will change its behaviour.
Things such as the cantilever tilt and the spring constant of the cantilever are
also very important.
Fluid measurements: These tend to have noisier baselines than air
measurements, due to both thermal noise and diffraction of the laser light in
the liquid medium. Similarly it is difficult to pick the "zero deflection" point
of the data. The presence of contaminants, especially if they adsorb to
surfaces, will affect the results so it is important that the cantilevers are
clean.

78
Repeated experiments were done to maintain consistency (the numbers of repeats are
noted in the experimental sections) and regular cleaning was undertaken to reduce
contamination from deposits. Cantilevers were used consistently for one experiment type.
Wear and tear on the cantilever was analysed regularly.
3.5 Conclusions
This chapter has introduced the techniques and procedures followed to obtain the results given
in Chapters 4, 5 and 6. These experiments will provide an opportunity to see if the AFM is a
viable tool for adhesion measurements of food deposits. Experimental control and systematic
results will help to determine utilisation of the AFM and make relevant comparisons with
micromanipulation. The AFM tip modification was a novel technique developed to make
force measurement in very sticky deposits.
As discussed in Chapter 2 AFM has been used to study modified surfaces. The method
established here for tip modification will help to quantify the PTFE surface and make
comparisons possible between PTFE type surfaces and fouling deposits.
In Chapter 4, experiments were done to study the different effects of components of fluids
that might affect adhesion. This might be useful in defining ways to vary the composition of
formulations to minimise fouling or aid of cleaning. This information will help better
understanding of the aqueous environment in which AFM adhesion force measurements can
be performed and to understand the interactions which may occur between the aqueous
environment and toothpaste ingredient solutions.

79
Chapter 5 introduced AFM experiments that can be related to micromanipulation data, to see
if nano and micro-scale measurement can be related. To study the interactions between
interfacial measurements at two length scales would be valuable in developing ways to test
surfaces for their fouling potential and cleanability.
The experiments in Chapter 6 are to further develop the studies and experiments done in
Chapter 5. The effects of temperature on fouling and cleaning from a range of materials which
are known to be thermally labile as cleaning rates are known to be temperature-dependent.
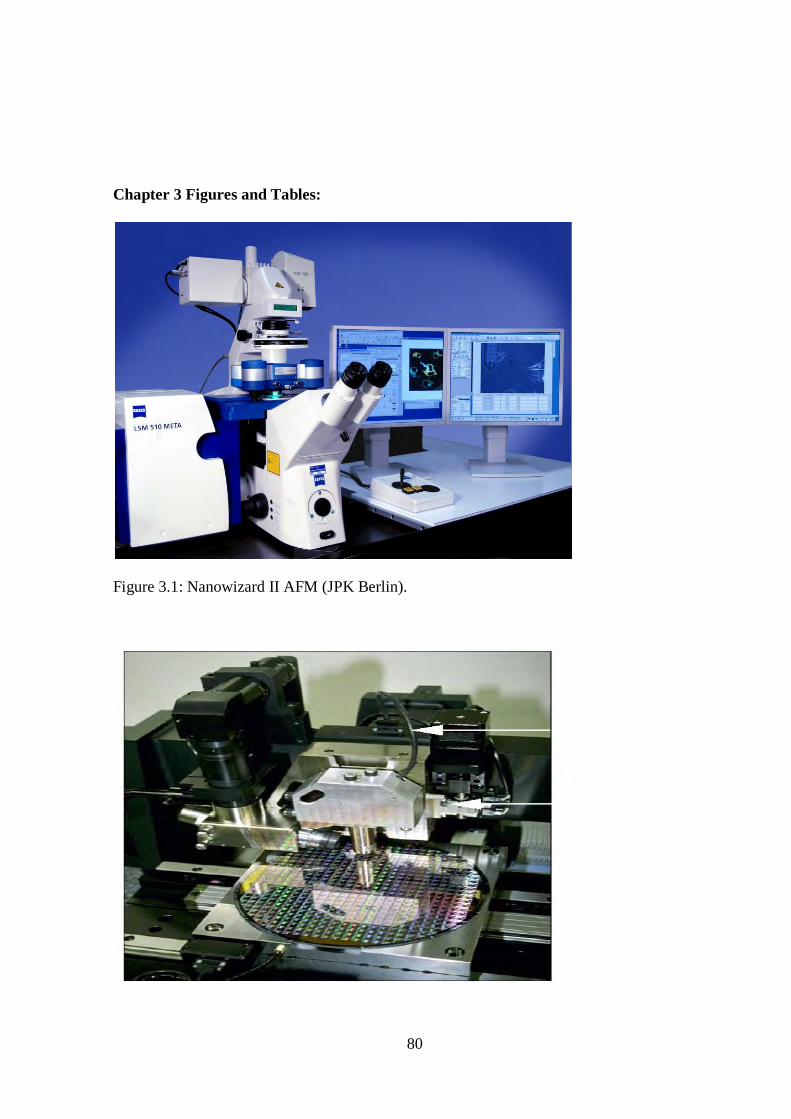
80
Chapter 3 Figures and Tables:
Figure 3.1: Nanowizard II AFM (JPK Berlin).

81
Figure 3.2: Dimension 3100 AFM (Veeco, UK).
Figure 3.3: Stainless steel particle attached to AFM Tipless cantilever, from the AFM optical
viewer.
Figure 3.4: Stainless steel particles snapshot on the glass slide from the AFM optical viewer.
Stainless
Steel
Particles
AFM tip
Stainless steel
Particles

82
Figure 3.5: Multimode Mode AFM ( Veeco, UK).

83
Figure 3.6: The AFM set up at the University of Birmingham.
Multimode
AFM
Vibrational
Table
PC
Controller Dimension
D3100

84
Figure 3.7: Hypothetical AFM deflection-displacement force curve. It is based on a diagram
from the Veeco, MultiMode™ AFM Instruction Manual.

85
CARAMEL Weight
%
TURKISH Weight
%
SCM Weight
%
TOOTHPASTE Weight
% DELIGHT
Water 8.4 Water 19 Sugar 50 Saccharin 0.3
Glucose D
42 26.7
Glucose
63DE 55.3
Butterfat 7 Sorbitol 65
Sodium
chloride 0.3 Agar 0.6
MSNF (milk
solid not fat)
17 Sodium 3
lauryl sulfate
GMS 30% 0.3 Starch 0.7 Water 26 zinc citrate 3
Sodium
carbonate 0.1 Sugar 24.3
0 Titanium dioxide 10
Whey
powder 5.1 0
0 Water 18.7
Palm Oil 11.3 0 0 0
Glucose D II
42 32.2
0 0 0
Granulated
Sugar 5.1
0 0 0
ISO Glucose 10.3
0 0 0
Table 3.1: Ingredients and composition of SCM, caramel, Turkish delight and toothpaste.

86
CHAPTER 4: Surface and deposit characterisation and
toothpaste ingredients force measurements.
The objective of the work presented in this chapter is to obtain better understanding of the
aqueous environment in which AFM adhesion force measurements can be performed and to
understand the interactions which may occur between the aqueous environment and
toothpaste ingredient in solution. Chapters 1 and 2 gave a brief background to this issue.
It is important to have an understanding of the aqueous medium in which adhesion
interactions occur. The properties of the medium will affect adhesion as they affect the
properties of surfaces that come into contact in any medium [Burgess, 1999]. Force
measurements using AFM between two surfaces in different solvents or solvent mixtures such
as seen in Kanda, et al. [1999] and in aqueous media of different ionic strengths [Drucker, et
al. 1992 and Carambassis, et al. 1999] exhibit different adhesion forces [Clear, et al. 1999].
The nature of the surfaces between which measurements are made is also an important
consideration; as this can alter or cause different interactions. For example, the preferential
orientation and arrangement of ions and solvent molecules at surfaces, as well as moieties
present in the terminal region of the surfaces affecting the properties of a system. Surface
87
roughness and surface charge will also affect the adhesion between two surfaces. Surface
charge occurs through the ionisation or dissociation of surface groups, such as the
deprotonation of carboxylic acid groups, or through the adsorption of ions from solution onto
a previously uncharged surface.
Chapter 3 has discussed methods that have been developed to quantify surface interactions
between stainless steel 316L, ceramic, glass and poly(tetrafluoroethylene)-coated stainless
steel with a series of components using the atomic force microscope (AFM). The interactions
between surfaces of stainless steel 316L, ceramic, glass and poly(tetrafluoroethylene)-coated
stainless steel materials were tested in different suspensions of toothpaste ingredients. Both
soluble compounds and insoluble colloidal particles were introduced to the aqueous medium
using a fluid cell. The surface roughness was determined using the AFM. Surface free
energies were estimated from contact angle experiments using drops of water and sorbitol.
Scanning electron microscopy (SEM) and AFM images were taken to identify the
microstructures of surfaces and deposits. Visualising the microstructure help characterise the
surfaces and give a broader understanding of what is happening on the surface layer.
Differences in surface interaction should help in characterising the system and reveal how
different ingredients affect fouling and cleaning.
4. Surface characterisation.
4.1. Surface topography and roughness.
Roughness analysis of the four surfaces was undertaken using the Dimension 3100 (Veeco)
AFM, to investigate if there is any correlation between surface roughness and adhesion

88
interaction. As discussed in Chapter 2 the roughness of a surface is critical when choosing
surfaces for cleaning equipment. Table 4.1 shows roughness measurements of ceramic,
stainless steel 316L, glass and PTFE measured using AFM. AFM topographic images of the
four materials investigated here are presented in Figure 4.1.
Figure 4.1(a) shows the surface layer of PTFE in a 100µm by 100µm scan, showing
very little surface imperfections. The surface roughness was measured as 75.6 nm. The
image shows the surface height and that the structure is flat and uniform.
Figure 4.1(b), shows that the stainless steel surface had an uneven surface layer, with a
significant amount of surface imperfections in a 100µm by 100µm scan. The
roughness of stainless steel was measured as 230 nm. The surface height shows the
grain structure to be randomly distributed.
Figure 4.1(c) shows the surface height of ceramic. This is the roughest of the four
surfaces (RMS value of 485 nm compared with that of the stainless steel of 230 nm)
and has a very uneven surface, shown by the colour range in a 100µm by 100µm scan.
Figure 4.1(d) shows the surface height of glass, with little imperfections, in a 100µm
by 100µm scan and surface roughness of 5.36 nm.
The roughness scans were taken at ten different points on the surfaces to give reproducible
and accurate data. The Nanowizard software package (Veeco) was used to obtain the surface
roughness information.

89
4.2 Scanning electron microscopy (SEM)
Scanning electron microscopy (SEM) involves the bombardment of a sample with high-
energy electrons, whereby the low energy secondary electrons and high energy backscattered
electrons emitted from the sample reaching the detector will vary as a result of sample
geometry. This allows an image of the sample to be produced. If the surface is not electrically
conductive it must be coated with a thin metallic layer (for example, Au deposited by
sputtering). SEM can also be used to image patterns and chemically different domains on
surfaces.
SEM images of ceramic, stainless steel, PTFE and glass discs were acquired using a XL30
ESEM FEG (University of Birmingham), operating at pressures of 10-4
mbar using a 20 kV
electron source gun. The samples were prepared for SEM imaging by sputter coating them
with Au in an Agar automatic sputter coater (Agar Scientific).
SEM images of the ceramic, stainless steel, PTFE and glass surfaces were taken using the
procedures described. The SEM images in Figures 4.2 show the characteristic depth of the
four surfaces of interest at 50 µm scan size. Figure 4.2(c) shows the ceramic surface which is
porous with rough surface imperfections at length scale of 50 µm. Figure 4.2(d) shows glass
to be smooth with little imperfections, as silica is bound together tightly. Figure 4.2(a) shows
the PTFE polymer chain is tightly bound which results in a smooth surface with no or little
imperfection on the surface layer and Figure 4.2(b) shows the grain structure of stainless steel
with surface imperfections making it rougher than glass and PTFE appears crystalline.

90
4.3 Measurements of contact angles.
A Goniometer (of University of Birmingham) (Figure 4.3) was used to measure the contact
angles of different surfaces. Contact angle measurements allow the wetting behaviour of a
surface to be assessed in a relatively short time under ambient conditions. The wetting
behaviour of the liquid droplet on a solid surface can be measured by taking a drop of water
(or liquid of interest) from a syringe, and passing it through the plastic tubing the surface of
interest. The surface is placed on the staging deck of the goniometer and the dynamic contact
angle is measured. As the droplet volume increases the advancing contact angle of the surface
is measured. As the surface droplet volume decreases the receding contact angle of the surface
is measured. [Chen et al. 1991]
The equilibrium contact angles of water (HPLC, Sigma) and 65% w/w sorbitol solution were
measured on glass, PTFE, ceramic and stainless steel. This procedure was repeated five
times. The surfaces were pre-soaked in hot water with ammonia solution to keep them clean.
The surface tension of water (HPLC grade) is known to be 0.072 Nm-1
[Sigma]. Glass is
hydrophilic with an affinity to water, and has low surface energy with a drop of water.
However, with a drop of sorbitol solution the surface energy is larger. Figure 4.4(a) plots the
contact angles for the two systems and the four surfaces. In two cases (PTFE and glass) the
contact angle is greater than 90º. The image of a typical drop can be seen in Figure 4.5. It is
possible to extract surface energy data from contact angle measurements. Equation 4.1 relates
the solid-vapour interfacial surface energy, γSV, the solid-liquid interfacial energy and γSL the
liquid-vapour energy (i.e. the surface tension), γ by θC, is the equilibrium contact angle.
0 = γSV -γSL –γcosθc (4.1)

91
This assumes a perfectly flat surface. In many cases surface roughness and impurities cause a
deviation in the equilibrium contact angle from that predicted by Young's equation. The
equation defines contact angles in terms of surface energies. If water is very strongly attracted
to the solid surface the droplet will completely spread over the solid surface and the contact
angle will be close to 0°. In other situations:
Less strongly hydrophilic solids will have a contact angle up to 90°.
On highly hydrophilic surfaces, water droplets will exhibit contact angles of 0° to 30°.
If the solid surface is hydrophobic, the contact angle will be larger than 90o.
On highly hydrophobic surfaces the surfaces have contact angles as high as 150° or
even nearly 180°.
Images of contact angle drops on the surfaces are shown in Figure 4.5. The drop is immersed
on each surface and the angle is measured.
Even on a perfectly smooth surface a drop will assume a wide spectrum of contact angles
between the highest (advancing) contact angle, θA, and the lowest (receding) contact angle,
θR. The equilibrium contact angle (θC) can be calculated from θA and θR as was shown by
Tadmor [2004]:
(4.2)
where, γsv--γsv = γcosθc
γsv—γsv + γ = γ(1+cosθc)
θC = arccos( rA cosθA + rR cosθR)
rA + rR
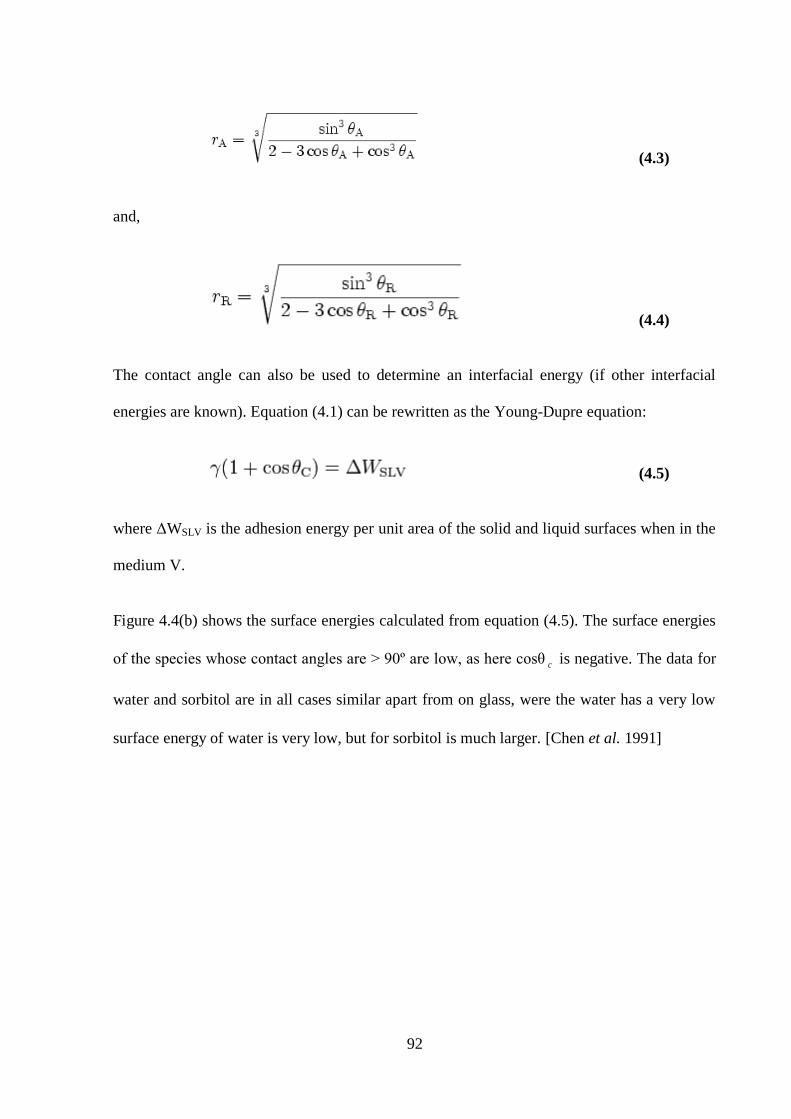
92
(4.3)
and,
(4.4)
The contact angle can also be used to determine an interfacial energy (if other interfacial
energies are known). Equation (4.1) can be rewritten as the Young-Dupre equation:
(4.5)
where ΔWSLV is the adhesion energy per unit area of the solid and liquid surfaces when in the
medium V.
Figure 4.4(b) shows the surface energies calculated from equation (4.5). The surface energies
of the species whose contact angles are > 90º are low, as here cosθ c is negative. The data for
water and sorbitol are in all cases similar apart from on glass, were the water has a very low
surface energy of water is very low, but for sorbitol is much larger. [Chen et al. 1991]

93
4.4 Characterisation of surface interactions for toothpaste ingredients.
Toothpaste is a multi-component particulate material which contains titanium dioxide, zinc
citrate, saccharin, sorbitol and sodium lauryl sulphate materials. Each component has a
different role. Each component of toothpaste will affect the environment of the surface in
different ways. Silica particles are used in toothpaste as an abrasive material. Hence silica was
chosen as one of the particles of interest. The role of saccharin in toothpaste is to act as a
sweetener. Sorbitol retains moisture, sodium lauryl sulfate causes the foaming action upon
cleaning, zinc citrate is the antibacterial agent and titanium dioxide gives the colour. AFM
was employed to provide information on the interaction forces between a colloidal silica
microparticle and the four surfaces of interest, in presence of the toothpaste ingredients listed
above. These experiments were performed to help understand the forces in cleaning behaviour
of toothpaste on different surfaces, and to help make comparisons between micro and nano
meter scale forces. This study will help to identify critical components and may even help
change the formulation of toothpaste. It was not possible to use the D3100 AFM as the z-
range was too small. Thus the Multimode AFM was used to perform fluid force
measurements. Chapter 3 gave the detailed procedure and methods.
4.4.1 AFM Force measurements in fluid environments.
Force measurements were performed using a Multimode AFM (Veeco). The materials and
methods employed are discussed in Chapter 3. Pull-off forces were measured for the
interaction between the silica microparticle and the four surfaces: stainless steel, PTFE-coated
stainless steel, glass and ceramic material surfaces in the presence of the different aqueous
media.
94
Force curves obtained are shown in Figures 4.6 (a,b,c,d,e). The results are presented in Table
4.2, which shows the pull-off forces between silica microparticles and the toothpaste
components in the presence of aqueous media. There was negligible variation in the measured
pull-off force with velocity for all systems. Hence the data presented in Table 4.2 are for the
force measurements performed at 14,000 nm s-1
. Figures 4.7( a,b,c) demonstrate that there
was negligible variation of the force curves at different velocities: 200 nm s-1
, 2000 nm s-1
and
14,000 nm s-1
, which suggest the rate of change of position does not affect adhesion.
The product of an AFM adhesion force measurement is a plot of cantilever deflection versus
cantilever displacement (deflection-displacement). The deflection-displacement plot shows
the movement of the AFM cantilever relative to its distance from the surface with which it is
intended to interact. The pull off forces between the silica microparticle and the surface
materials will be determined by the surface chemistry of both the silica and the material, as
well as the interaction of the surfaces with the aqueous media. All experiments were repeated
a least five times.
In the presence of saccharin solution, sodium lauryl sulphate solution, zinc citrate solution
and titanium dioxide suspension, no pull-off forces were measured for the four surfaces. In
fact a repulsive interaction was generally observed. Figure 4.6(a) shows an example of such a
repulsive interaction plot. It shows the cantilever deflection versus cantilever displacement in
zinc citrate solution when no pull off force is was seen. The data suggested that the
polyanionic charge on the silica surface (which will be deprotonated in aqueous solutions
such as zinc citrate and the other solutions mentioned above) dominates the interaction.
Stainless steel, glass and ceramic surfaces all present oxygen-rich surface chemistries in the
form of chromium oxide, silicon dioxide and aluminium oxide.

95
Figure 4.6(b) shows an example of a ‗‗hydrophobic effect‘‘ deflection-displacement curve, in
which a ±0.09 mNm-1
adhesion force was seen to result from the interaction between the
silica attached tip and stainless steel surface in presence of HPLC water. This interaction also
occurred with the ceramic surface, as shown in Table 4.2, with an adhesion force of ±0.01
mNm-1. It has previously been established that for hydrophobic surfaces immersed in water,
an attractive force exists that cannot be accounted for by dispersion forces alone [Mantel, et
al. 1995]. The origin of the hydrophobic effect shown in Figure 4.6(b) is often believed to be
changes in water structure adjacent to hydrophobic surfaces, which are entropically
unfavourable and impose a new, more ordered structure on the water molecules. This gives
rise to an attractive force between the silica and the surfaces. In water, both the ceramic and
stainless steel surfaces exhibit a long-range attractive interaction with the silica microparticle
and this interaction is indicative of a hydrophobic force. The oxide-terminated stainless steel
and ceramic surface could give rise to such a force. The glass surface would not be expected
to and indeed does not as the glass surface is terminated with silicon hydroxide moieties.
One component of the toothpaste sorbitol solution. shows strong adhesive interactions of
1.70mNm-1
between stainless steel surface discs using the silica microparticle, as shown in
Figure 4.6 (c) here the tip is pulled towards the surface in an attractive regime. Sorbitol is
used as humectant in many types of products for protection against loss of moisture such as in
toothpaste, mouthwash, chewing gum, cookies and cakes. It is also used in glues and sticky
tapes to help retain adhesive properties [Britten 1998]. Of the four surfaces only stainless steel
exhibited an adhesive interaction with the silica microparticle in sorbitol solution. This is
surprising (Table 4.2) as PTFE might not have been expected to display an adhesive
interaction given its hydrophobic surface chemistry. The oxygen-rich surfaces of the stainless
steel, glass and ceramic, (see Chapter 2) might have been expected to demonstrate similar

96
adhesive interactions. However the hydrophobicity, surface energy, and roughness of the
surface can all alter the behaviour of an individual surface interaction.
Figure 4.6 (c and d) shows the different AFM force plots for the interaction of stainless steel
and PTFE with sorbitol. The behaviour of the curves relates to the surface interactions
between the sorbitol drop and the PTFE and stainless steel respectively. The interaction
between sorbitol and stainless steel is significant, and would not have been predicted by the
macro-scale contact angle measurement. The data suggests that effects may manifest at the
nanoscale, which are not predicted by the macro-scale measurements of conventional contact
angle. The contact angles suggest that stainless steel has a higher surface energy compared to
PTFE, with sorbitol and water. Force curves of PTFE shows no attraction with water or
sorbitol as PTFE has lower surface energy compared to stainless steel. Further work on the
adhesion of toothpaste was carried out and is discussed in the next chapter.

97
4.5 Conclusion
AFM can be used to measure attractive or repulsive forces over micron-scale separations with
sub-nanometre sensitivity between a probe tip or colloidal particle and a sample surface,
elucidating local chemical and mechanical properties like adhesion, and even thickness of
adsorbed molecular layers or bond rupture lengths.
Atomic force microscopy has been employed to measure the adhesive interactions between a
colloidal silica microparticle and stainless steel, PTFE-coated stainless steel, glass and
ceramic surfaces, in the presence of a number of solutions and suspensions of ingredients
found in commercially available toothpaste. In the presence of most ingredients a repulsive
behaviour was observed, indicative of ionic double layer effects, as the silica microparticle
will be charged in aqueous solution. A hydrophobic effect-type attraction was observed for
the interaction between the silica microparticle and the stainless steel and ceramic surfaces.
The four different types of materials chosen for study were stainless steel, ceramic, glass and
PTFE. Results showed:
Ceramic and stainless steel surfaces were substantially rougher than the PTFE and
glass surfaces.
Contact angle measurements showed that the different surfaces behave differently
with a drop of water and sorbitol.
AFM found different types of behaviour in the presence of saccharin solution, sodium
lauryl sulphate solution, sorbitol, zinc citrate solution and titanium dioxide suspension.
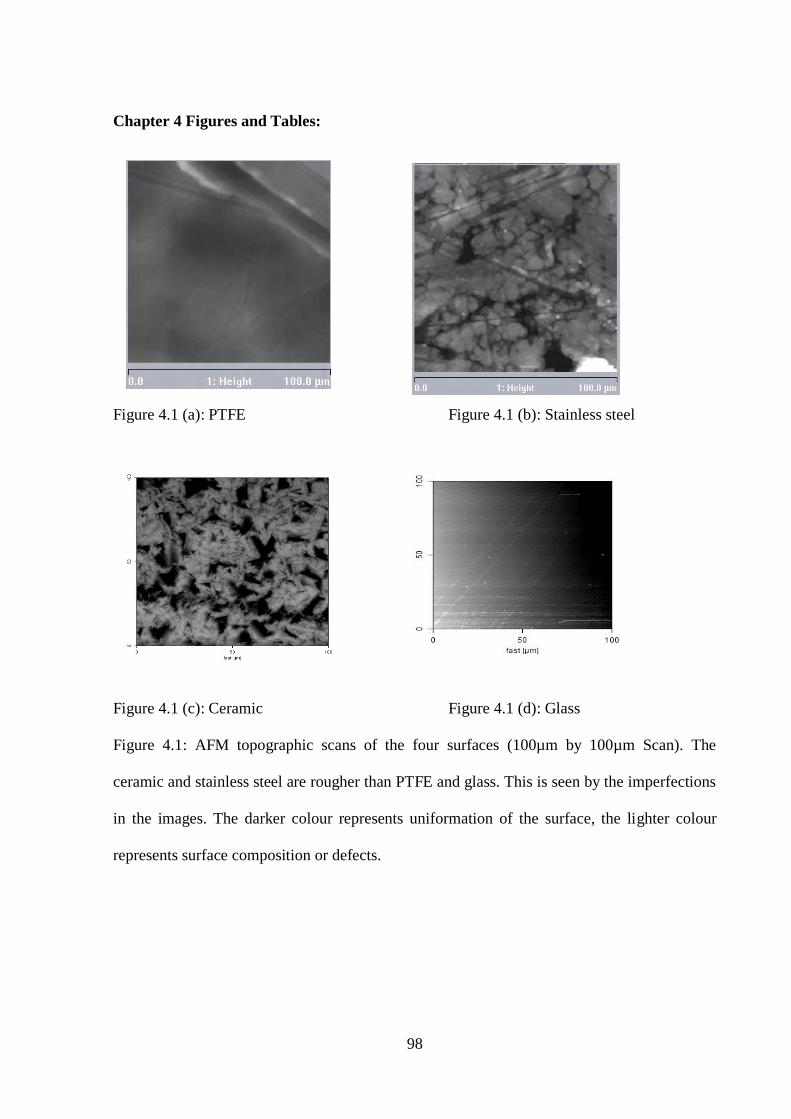
98
Chapter 4 Figures and Tables:
Figure 4.1 (a): PTFE Figure 4.1 (b): Stainless steel
Figure 4.1 (c): Ceramic Figure 4.1 (d): Glass
Figure 4.1: AFM topographic scans of the four surfaces (100µm by 100µm Scan). The
ceramic and stainless steel are rougher than PTFE and glass. This is seen by the imperfections
in the images. The darker colour represents uniformation of the surface, the lighter colour
represents surface composition or defects.

99
Figure 4.2 (a): PTFE Figure 4.2 (b): Stainless steel
Figure 4.2 (c): Ceramic Figure 4.2 (d): Glass
Figure 4.2: SEM images of the microstructure of the four surfaces of interest at 50µm scan
size. Ceramic and stainless steel show increased roughness compared to PTFE and glass.

100
Figure 4.3: Goniometer used for contact angle experiments. (Kruss website).
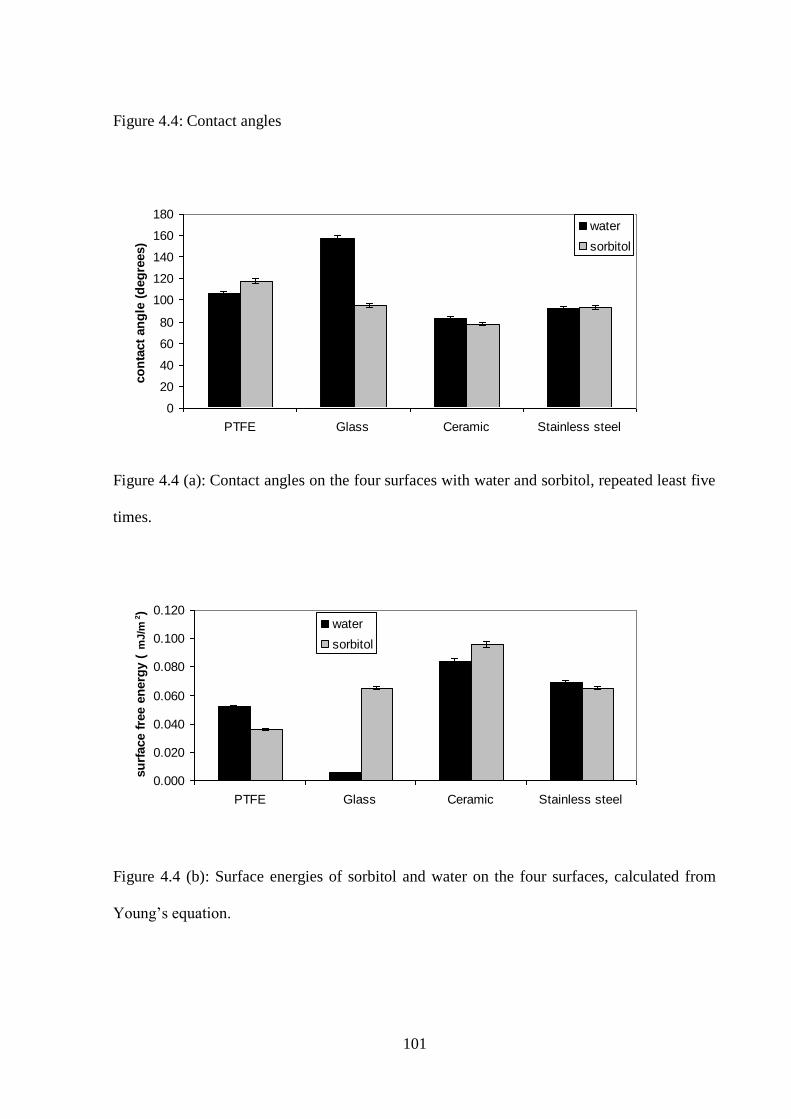
101
Figure 4.4: Contact angles
Figure 4.4 (a): Contact angles on the four surfaces with water and sorbitol, repeated least five
times.
Figure 4.4 (b): Surface energies of sorbitol and water on the four surfaces, calculated from
Young‘s equation.
0
20
40
60
80
100
120
140
160
180
PTFE Glass Ceramic Stainless steel
co
nta
ct
an
gle
(d
eg
rees)
water
sorbitol
0.000
0.020
0.040
0.060
0.080
0.100
0.120
PTFE Glass Ceramic Stainless steel
su
rface f
ree e
nerg
y (
mJ/m
2)
water
sorbitol

102
Figure 4.5 (a): Water drop on ceramic (83º) Figure 4.5 (b): Water drop on glass
(92º)
Figure 4.5 (c): Water drop on PTFE (106º) Figure 4.5 (d): Water drop on
stainless steel (157º)
Figure 4.5: Images of water drops on the four surfaces, showing typical contact angles.
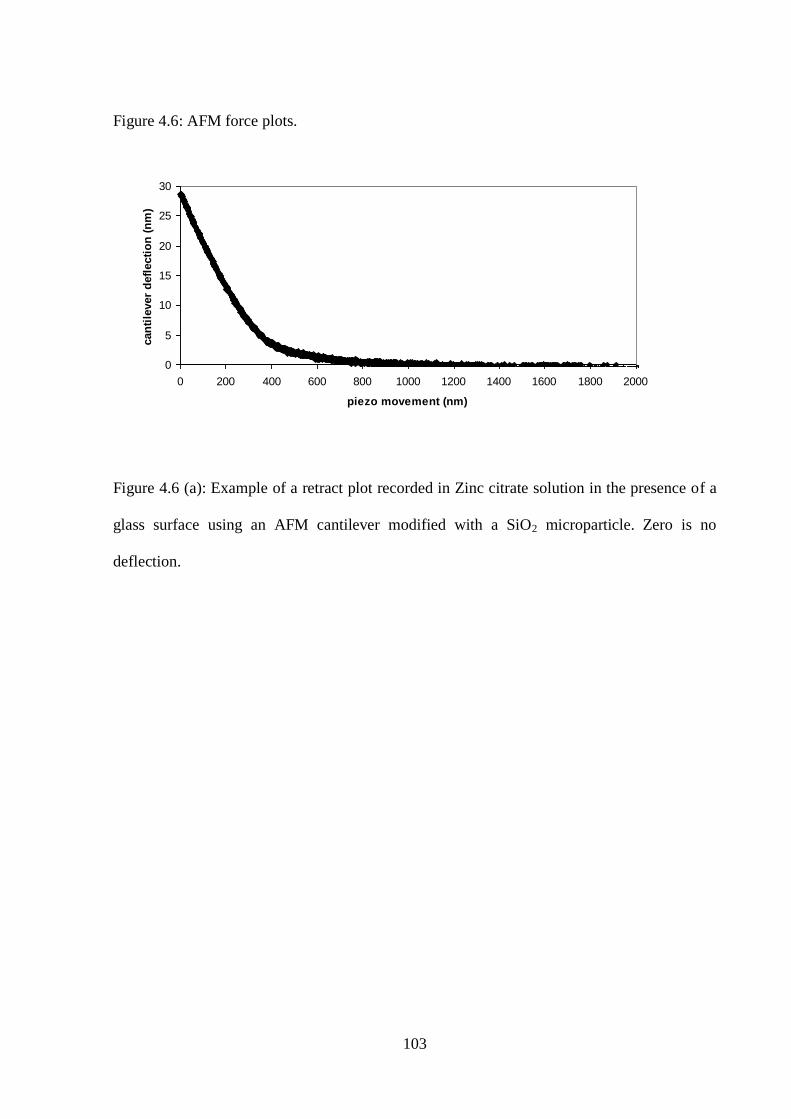
103
Figure 4.6: AFM force plots.
Figure 4.6 (a): Example of a retract plot recorded in Zinc citrate solution in the presence of a
glass surface using an AFM cantilever modified with a SiO2 microparticle. Zero is no
deflection.
0
5
10
15
20
25
30
0 200 400 600 800 1000 1200 1400 1600 1800 2000
piezo movement (nm)
can
tile
ver
defl
ecti
on
(n
m)

104
Figure 4.6 (b): Example of retract plot recorded during water in the presence of a stainless
steel surface using an AFM cantilever modified with a SiO2 microparticle. This is a typical
‗‗hydrophobic effect‘‘ curve.
Figure 4.6(c): Example of retract plot recorded in sorbitol solution in the presence of a
stainless steel surface using an AFM cantilever modified with a SiO2 microparticle.
es 4.6: Examples of negligible variation saccharin with velocity
-60
-50
-40
-30
-20
-10
0
10
20
30
0 200 400 600 800 1000 1200 1400 1600 1800 2000
piezo movement (nm)
can
tile
ver
defl
ecti
on
(n
m)

105
Figure 4.6 (d): Example of retract plot recorded in sorbitol solution in the presence of PTFE
surface using an AFM cantilever modified with a SiO2 microparticle.
Figure 4.6 (e): Example of retract plot recorded in water in the presence of PTFE surface
using an AFM cantilever modified with a SiO2 microparticle.
0
5
10
15
20
25
30
0 200 400 600 800 1000 1200 1400 1600 1800 2000
piezo movement (nm)
can
tile
ver
defl
ecti
on
(n
m)
0
5
10
15
20
25
30
0 200 400 600 800 1000 1200 1400 1600 1800 2000
piezo movement (nm)
can
tile
ver
def
lect
ion
(n
m)
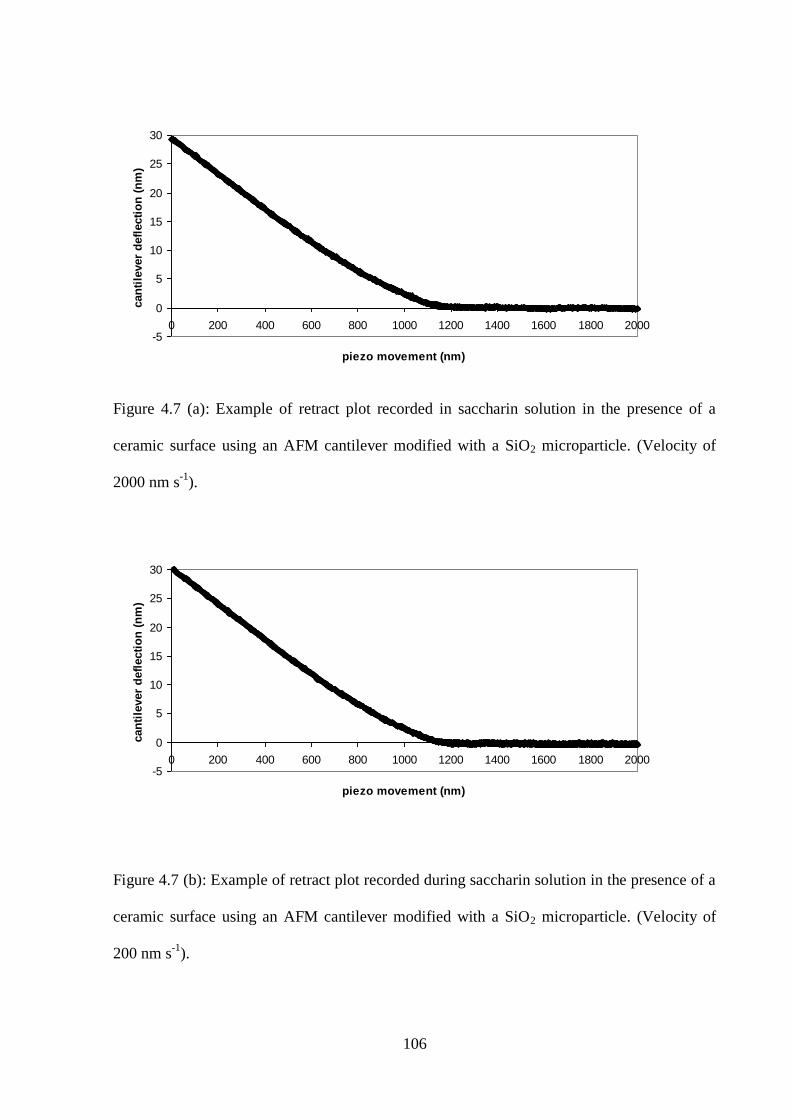
106
Figure 4.7 (a): Example of retract plot recorded in saccharin solution in the presence of a
ceramic surface using an AFM cantilever modified with a SiO2 microparticle. (Velocity of
2000 nm s-1
).
Figure 4.7 (b): Example of retract plot recorded during saccharin solution in the presence of a
ceramic surface using an AFM cantilever modified with a SiO2 microparticle. (Velocity of
200 nm s-1
).
-5
0
5
10
15
20
25
30
0 200 400 600 800 1000 1200 1400 1600 1800 2000
piezo movement (nm)
can
tile
ver
defl
ecti
on
(n
m)
-5
0
5
10
15
20
25
30
0 200 400 600 800 1000 1200 1400 1600 1800 2000
piezo movement (nm)
can
tile
ver
defl
ecti
on
(n
m)

107
Figure 4.7 (c): Example of retract plot recorded during saccharin solution in the presence of a
ceramic surface using an AFM cantilever modified with a SiO2 microparticle. (Velocity of
14000 nm s-1
).
Quantity
(nm)
Ceramic Stainless steel PTFE-coated
stainless steel
Glass
Z-range +/- 3473 +/- 1564 +/- 564 +/- 207
Rrms +/- 485 +/- 230 +/- 75.6 +/- 5.36
Ra +/- 369 +/- 92.2 +/- 59.6 +/- 2.37
Table 4.1: Roughness analyses of the stainless steel, PTFE, ceramic and glass surfaces, using
the D3100 AFM. Data is an average of a least 5 points. Units are nm.
-5
0
5
10
15
20
25
30
0 200 400 600 800 1000 1200 1400 1600 1800 2000
piezo movement (nm)
can
tile
ver
defl
ecti
on
(n
m)

108
F/R (mN/m)
Aqueous
medium
Stainless steel PTFE-coated
stainless steel
Glass Ceramic
Water +/- 0.09 ± 0.01 No attraction No attraction 0.01 ± 0.00
Sorbitol
solution
+/- 1.70 ± 0.08 No attraction No attraction No attraction
Table 4.2: Pull-off forces between silica microparticle and materials in the presence of
aqueous media. Force/ radius = (F/R) The experiments were repeated at least five times.
109
CHAPTER 5: Comparison between measurements using Atomic
Force Microscopy and those of Micromanipulation.
Previous chapters have identified surface interactions as being critical in fouling and cleaning,
and have described work to characterise surface interactions using methods such as AFM and
micromanipulation. The last chapter outlined that interactions at a nano-scale can be
quantified between systems that are known to cause fouling/cleaning problems, and that
different surfaces and deposits have different responses. No previous work has been attempted
to study measurements at two length scales. It would be valuable to do this for a range of
reasons: (i) to develop ways of testing surfaces for their fouling potential and cleanability, (ii)
to identify what are the smallest scale results obtainable, (iii) it may be that AFM
measurements can give data relevant to lab or plant scale relating the two.
Here, microparticles of each of the tested surface materials were attached to tipless AFM
cantilevers with epoxy resin. The microparticles were next immersed into different food
deposits and then pulled away using the AFM and the interactions were quantified with the
different soils of interest: toothpaste, caramel, Turkish delight and sweetened condensed milk
(SCM). At the higher scale the interactions were studied using micromanipulation at different
gap widths (the height above the surface that the micromanipulation probe passes) of 20µm,
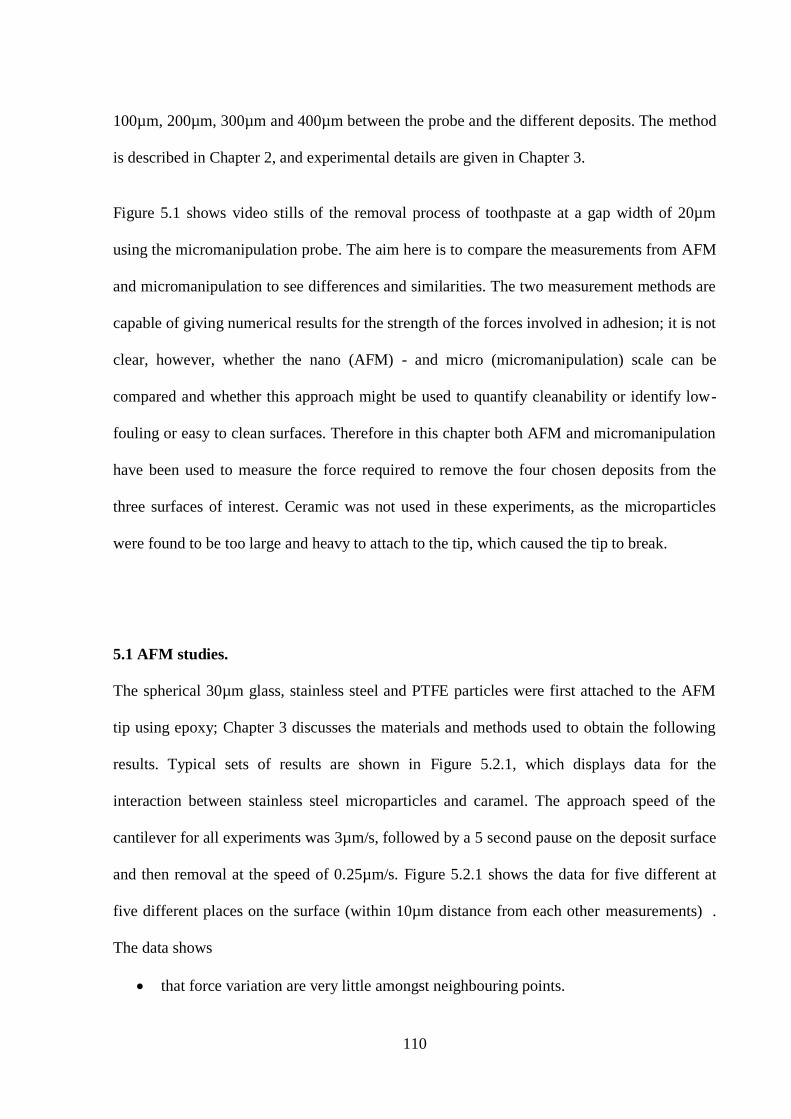
110
100µm, 200µm, 300µm and 400µm between the probe and the different deposits. The method
is described in Chapter 2, and experimental details are given in Chapter 3.
Figure 5.1 shows video stills of the removal process of toothpaste at a gap width of 20µm
using the micromanipulation probe. The aim here is to compare the measurements from AFM
and micromanipulation to see differences and similarities. The two measurement methods are
capable of giving numerical results for the strength of the forces involved in adhesion; it is not
clear, however, whether the nano (AFM) - and micro (micromanipulation) scale can be
compared and whether this approach might be used to quantify cleanability or identify low-
fouling or easy to clean surfaces. Therefore in this chapter both AFM and micromanipulation
have been used to measure the force required to remove the four chosen deposits from the
three surfaces of interest. Ceramic was not used in these experiments, as the microparticles
were found to be too large and heavy to attach to the tip, which caused the tip to break.
5.1 AFM studies.
The spherical 30µm glass, stainless steel and PTFE particles were first attached to the AFM
tip using epoxy; Chapter 3 discusses the materials and methods used to obtain the following
results. Typical sets of results are shown in Figure 5.2.1, which displays data for the
interaction between stainless steel microparticles and caramel. The approach speed of the
cantilever for all experiments was 3µm/s, followed by a 5 second pause on the deposit surface
and then removal at the speed of 0.25µm/s. Figure 5.2.1 shows the data for five different at
five different places on the surface (within 10µm distance from each other measurements) .
The data shows
that force variation are very little amongst neighbouring points.
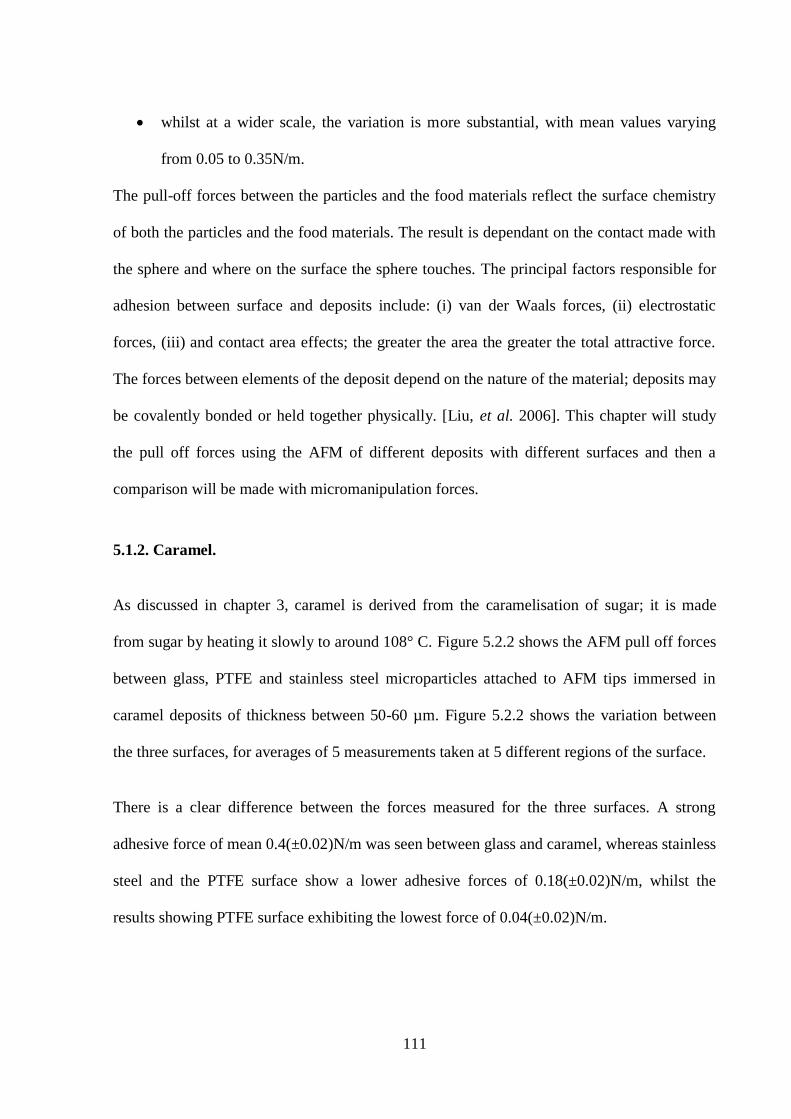
111
whilst at a wider scale, the variation is more substantial, with mean values varying
from 0.05 to 0.35N/m.
The pull-off forces between the particles and the food materials reflect the surface chemistry
of both the particles and the food materials. The result is dependant on the contact made with
the sphere and where on the surface the sphere touches. The principal factors responsible for
adhesion between surface and deposits include: (i) van der Waals forces, (ii) electrostatic
forces, (iii) and contact area effects; the greater the area the greater the total attractive force.
The forces between elements of the deposit depend on the nature of the material; deposits may
be covalently bonded or held together physically. [Liu, et al. 2006]. This chapter will study
the pull off forces using the AFM of different deposits with different surfaces and then a
comparison will be made with micromanipulation forces.
5.1.2. Caramel.
As discussed in chapter 3, caramel is derived from the caramelisation of sugar; it is made
from sugar by heating it slowly to around 108° C. Figure 5.2.2 shows the AFM pull off forces
between glass, PTFE and stainless steel microparticles attached to AFM tips immersed in
caramel deposits of thickness between 50-60 µm. Figure 5.2.2 shows the variation between
the three surfaces, for averages of 5 measurements taken at 5 different regions of the surface.
There is a clear difference between the forces measured for the three surfaces. A strong
adhesive force of mean 0.4(±0.02)N/m was seen between glass and caramel, whereas stainless
steel and the PTFE surface show a lower adhesive forces of 0.18(±0.02)N/m, whilst the
results showing PTFE surface exhibiting the lowest force of 0.04(±0.02)N/m.

112
The results obtained for PTFE were as expected given the hydrophobic nature of the
fluorinated surface. Water and water-containing substances like most foods do not wet PTFE;
therefore adhesion to PTFE surfaces is inhibited is low as discussed in chapter 2.
5.1.3 SCM
The composition of SCM is discussed in Chapter 3. The results shown in Figure 5.3 show the
forces between glass, PTFE and stainless steel microparticle and SCM.
The results generally are lower in magnitude than those for caramel. SCM exhibited
the strongest attraction to glass of 0.22(±0.02)N/m, approximately twice the
magnitude of the force of contact with the stainless steel, and significantly less than
the forces of 0.35(±0.03)N/m seen for the combination of glass and caramel.
The results for stainless steel had a greater variation of 0.1(±0.03)N/m between the
forces measured at different points than it was found for the glass and PTFE surfaces:
the mean force measured is significantly less than that for caramel.
The forces between SCM and the PTFE microparticle show near zero adhesion forces
of 0.01(±0.001)N/m.
SCM structurally is different from caramel. SCM contains milk and sugar from which water
has been evaporated, compared to caramel which is a cooked sugar with lower water content,
and polymerises as no or little water remains in the product. Therefore it adheres to surface
more.

113
5.1.4 Turkish delight
Figure 5.4 shows data for the forces between the three microparticle surfaces with Turkish
delight. The results show that the forces are lower than those measured for SCM and caramel.
Both glass and stainless steel microparticle immersions showed adhesion forces one
order of magnitude lower than with SCM showing adhesion of 0.096(±0.0001)N/m
and caramel showing adhesion of 0.183(±0.01)N/m.
The most significant difference is that PTFE showed the highest of the three surfaces,
the adhesion force with Turkish delight showing 0.04(±0.001)N/m adhesion than with
SCM 0.002(±0.0002)N/m and caramel 0.01(±0.002)N/m. The forces for PTFE are
however more similar for the three systems than for those of the other two surfaces.
Turkish delight has a gel like structure, which pulls off the surface more easily compared to
SCM and caramel. However with PTFE the Turkish delight adhered to the surface. This could
be due to cross linking of the agar to PTFE of some possibility of charging on the surface.
Agar is a polymer made up of the sugar galactose. Agar polysaccharides serve as the primary
structural support for Turkish delight. Also the low water content of Turkish delight could
also suggest the adhesion to PTFE.
5.1.5 Toothpaste
Toothpaste is made up of different particles, which is discussed in Chapter 3. Figure 5.5
highlights that toothpaste has the lowest adhesion forces from all four deposits;
Toothpaste shows a force of 0.01(±0.003N/m) with glass.

114
The force seen with stainless steel is 0.005(±0.0001)N/m and PTFE is
0.004(±0.0001)N/m.
The interactions with the glass microparticle and toothpaste provided the greatest adhesion
force at all locations. The PTFE and stainless steel showed low adhesion in line with the
caramel and SCM deposits. Toothpaste adhesion forces were lower than Turkish delight.
5.1.6. Summary.
Figure 5.6 summarises the adhesion behaviour of the combination of each microparticle and
deposit. The relative strengths of the interactions between each type of deposit and surface
can be seen.
Overall it can be seen that the measured forces for the different surfaces vary by more
than a factor of 10, from caramel at the highest value to toothpaste at the lowest;
The forces between the deposits and the glass microparticle show the largest adhesive
behaviour with caramel, SCM, and toothpaste;
Turkish delight exhibits the greatest adhesion on PTFE microparticle, although for
Turkish delight and toothpaste the forces are very low in general.
The soils investigated here generally adhere most strongly to the glass surface with the
exception of Turkish delight. The results suggest that the general behaviour of deposit and
substrate (microparticle) is that glass gives the largest adhesion compared to stainless steel
and PTFE.

115
The data suggests that PTFE surfaces would in general be better than stainless steel in terms
of reducing fouling or cleaning. The use of PTFE-based surfaces in fouling reduction has been
discussed in Chapter two, and it has been shown to work in some cases; however there is a
difficulty in producing PTFE coated equipment, which is cheap and robust in operation. It is
clear that this sort of surface can give either reduced fouling or more effective cleaning.
Further investigation is required to help explain why Turkish delight is so different. One
possible explanation could be that Turkish delight slides off the surface.
5.2 Micromanipulation measurements.
5.2.1 Caramel behaviour on stainless steel, glass and PTFE surfaces.
In Chapters 2 and 3 the background to these experiments and the procedure followed are
described. Experiments were carried out using 0.7mm thickness of material, by passing the
blade of the micromanipulation probe over the surface at different cut heights above the
surface.
Figure 5.7 shows pulling energy (measured force per unit area from where deposit is
removed) for measurements taken using the micromanipulation system for different gap
widths (of 20µm, 100µm, 200µm, 300µm and 400µm) between the probe and the caramel
deposit. The data shows that, for removal in all cases, the pulling energy increases with
increasing height above the surface and the slopes of the lines of pulling energy versus
thickness are similar. Stainless steel shows the highest pulling energy with slightly higher
energies than glass and PTFE, whilst PTFE shows the lowest interaction. For the AFM data,
shown in Figure 5.2.2, PTFE again gives much lower adhesion forces. This is due to the

116
different molecular interactions between different surfaces and caramel. There is thus partial
agreement between the two methods. The micromanipulation method will measure a range of
parameters – such as the deformation and flow of the fluids deposits, and so it might not be
expected that there would be complete agreement. Here stainless steel and glass show very
similar behaviour, as opposed to the differences seen using AFM; the different surface
roughness of the two substrate might also be expected to have an effect.
5.2.2 SCM behaviour on stainless steel, glass and PTFE surfaces.
Figure 5.8 shows the behaviour seen with SCM on stainless steel, glass and PTFE at different
cut heights. The results show with increasing thickness the pulling energy decreases for the
three systems. Stainless steel shows the greatest pulling force with SCM compared to glass
and PTFE, whilst PTFE shows the smallest. The micromanipulation data does not show the
very large differences seen by the AFM.
Liu et al. [2005] gives a simplistic model for the behaviour of a system of thickness L cut at
height x; assuming that the work to remove unit volume of materials is constant, then the
energy should decrease with x, with an equation of the form
σ = A+ (L-x)B
where A is the energy required to cut the surface, and B that to deform the deposits. The
model suggests that the slope of all the lines should be similar, but that intercepts at x=0
might be different and surface dependent. It can be seen in Figure 5.8 that the slopes of the

117
lines are not dissimilar, whilst the intercepts again show that the least pulling energy is found
for PTFE, whilst the largest forces are for stainless steel. The model is clearly simple – but
there are clearly both surface and bulk effects involved in the micromanipulation
measurements, this is representative of what we see when cleaning surfaces.
5.2.3 Turkish delight behaviour on stainless steel, glass and PTFE surfaces.
Micromanipulation experiments for Turkish delight are illustrated in Figure 5.9. The results
show that with increasing thickness the pulling energy decreases for stainless steel, glass and
PTFE. The data for stainless steel and glass are very similar, with that for PTFE being
significantly greater at low cut heights – this is a very interesting result which is essentially
the same as is seen for the AFM in Figure 5.4. That PTFE shows the greatest interaction with
Turkish delight is supported by both AFM and micromanipulation, and is surprising given the
results from previous work discussed in Chapter 2. This could suggest some crosslinking with
the agar and PTFE surface or Turkish delight could be pulling off the coating of PTFE in
removal. It was seen that Turkish delight slides off the surfaces at different cut heights and
thicknesses. The values of pulling energy are less than for SCM and caramel deposits, but the
difference is not as large as for AFM. This again indicates that the micromanipulation method
measures both surface and bulk effects; the rheology of the material will control how it
deforms and flows under the effects of the moving blade.
Toothpaste, SCM, caramel and Turkish delight deposits are non- Newtonian fluids
investigations carried out by Konstantia Asteriadou and group at the University of
Birmingham using a rheometer. All deposits process viscoelastic behaviours. Toothpaste

118
behaves to the Herschel-Bulkley model. SCM, caramel and Turkish delight are all shear
thinning fluids this is a result of:
Orientation of non-spherical particles in the direction of flow.
Orientation of polymer chains in the direction of flow and breaking of polymer chains
during flow.
Deformation of spherical droplets to elliptical droplets in an emulsion.
Breaking of particle aggregates in suspensions.
5.2.4 Toothpaste behaviour on stainless steel, glass and PTFE surfaces.
Figure 5.10 shows the behaviour seen with toothpaste on stainless steel, glass and PTFE at
different cut heights. The results show that with increasing thickness the forces decrease.
Stainless steel requires the largest pulling energy, glass follows quite closely and PTFE
demands the least. It was seen that at larger thickness there was no complete removal was
achieved. This is similarly seen with Turkish delight and SCM, but the reverse is seen with
the caramel deposit. AFM showed that toothpaste showed the strongest adhesion to glass
whilst with the micromanipulation it demonstrated the strongest interaction with stainless
steel.
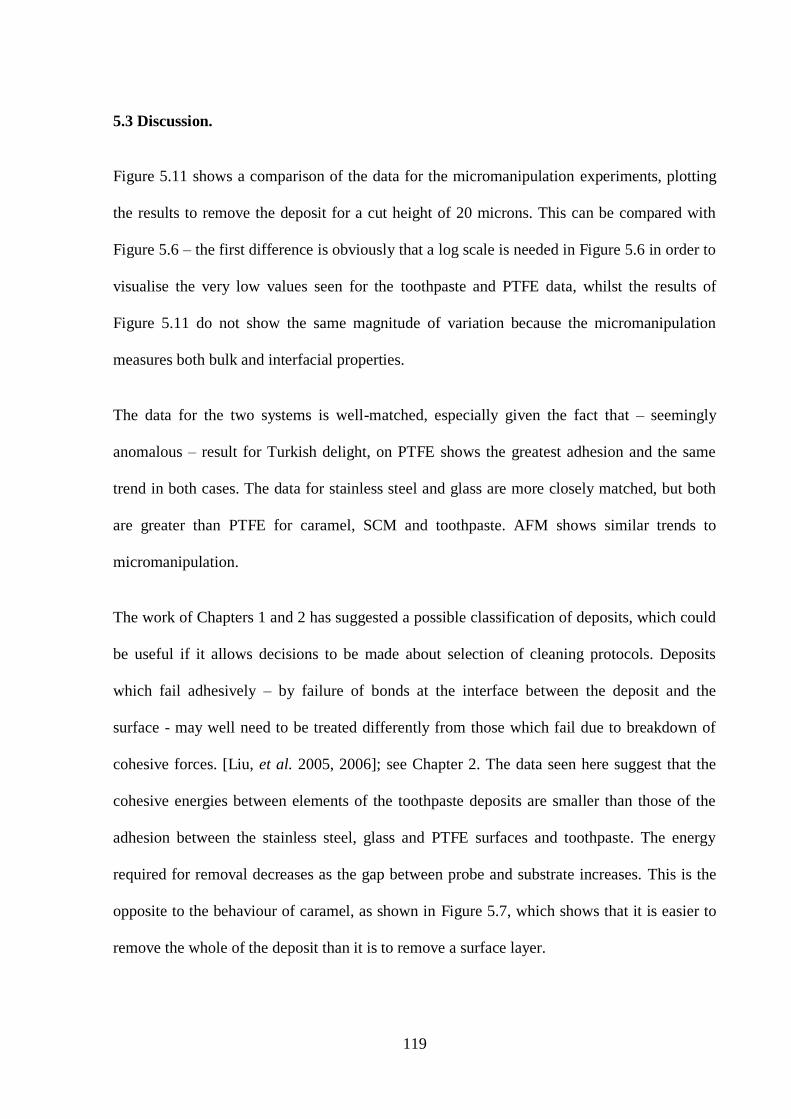
119
5.3 Discussion.
Figure 5.11 shows a comparison of the data for the micromanipulation experiments, plotting
the results to remove the deposit for a cut height of 20 microns. This can be compared with
Figure 5.6 – the first difference is obviously that a log scale is needed in Figure 5.6 in order to
visualise the very low values seen for the toothpaste and PTFE data, whilst the results of
Figure 5.11 do not show the same magnitude of variation because the micromanipulation
measures both bulk and interfacial properties.
The data for the two systems is well-matched, especially given the fact that – seemingly
anomalous – result for Turkish delight, on PTFE shows the greatest adhesion and the same
trend in both cases. The data for stainless steel and glass are more closely matched, but both
are greater than PTFE for caramel, SCM and toothpaste. AFM shows similar trends to
micromanipulation.
The work of Chapters 1 and 2 has suggested a possible classification of deposits, which could
be useful if it allows decisions to be made about selection of cleaning protocols. Deposits
which fail adhesively – by failure of bonds at the interface between the deposit and the
surface - may well need to be treated differently from those which fail due to breakdown of
cohesive forces. [Liu, et al. 2005, 2006]; see Chapter 2. The data seen here suggest that the
cohesive energies between elements of the toothpaste deposits are smaller than those of the
adhesion between the stainless steel, glass and PTFE surfaces and toothpaste. The energy
required for removal decreases as the gap between probe and substrate increases. This is the
opposite to the behaviour of caramel, as shown in Figure 5.7, which shows that it is easier to
remove the whole of the deposit than it is to remove a surface layer.
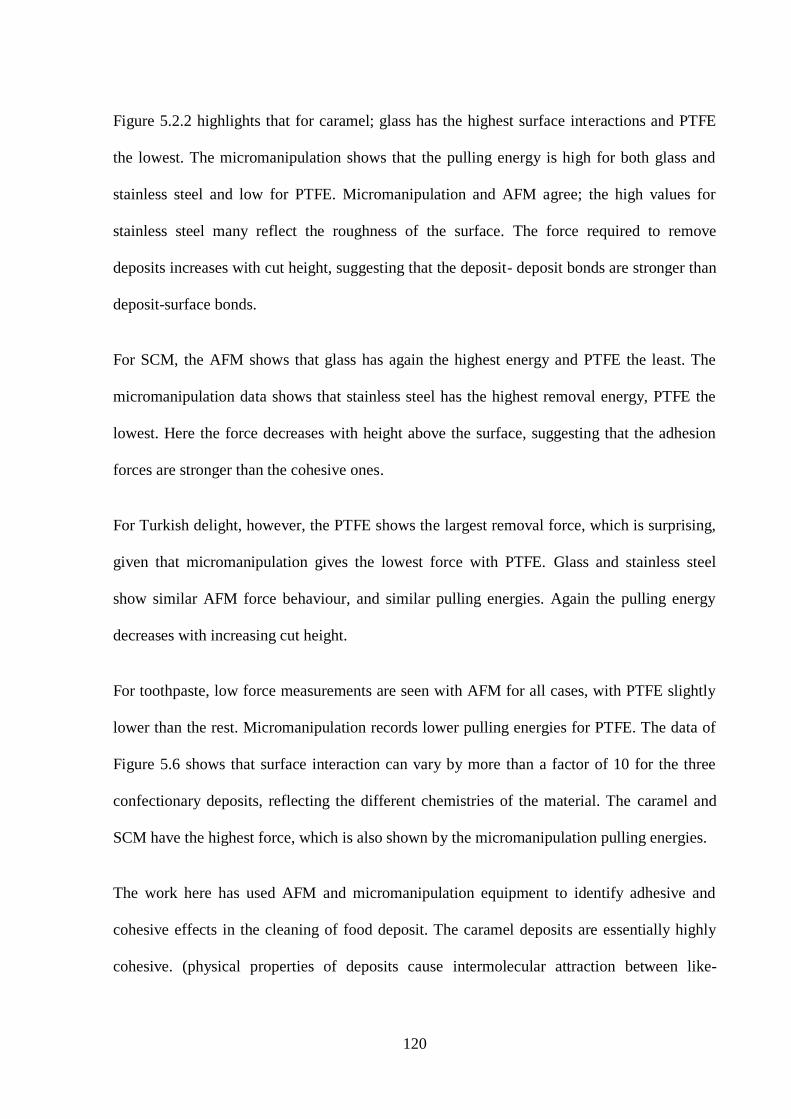
120
Figure 5.2.2 highlights that for caramel; glass has the highest surface interactions and PTFE
the lowest. The micromanipulation shows that the pulling energy is high for both glass and
stainless steel and low for PTFE. Micromanipulation and AFM agree; the high values for
stainless steel many reflect the roughness of the surface. The force required to remove
deposits increases with cut height, suggesting that the deposit- deposit bonds are stronger than
deposit-surface bonds.
For SCM, the AFM shows that glass has again the highest energy and PTFE the least. The
micromanipulation data shows that stainless steel has the highest removal energy, PTFE the
lowest. Here the force decreases with height above the surface, suggesting that the adhesion
forces are stronger than the cohesive ones.
For Turkish delight, however, the PTFE shows the largest removal force, which is surprising,
given that micromanipulation gives the lowest force with PTFE. Glass and stainless steel
show similar AFM force behaviour, and similar pulling energies. Again the pulling energy
decreases with increasing cut height.
For toothpaste, low force measurements are seen with AFM for all cases, with PTFE slightly
lower than the rest. Micromanipulation records lower pulling energies for PTFE. The data of
Figure 5.6 shows that surface interaction can vary by more than a factor of 10 for the three
confectionary deposits, reflecting the different chemistries of the material. The caramel and
SCM have the highest force, which is also shown by the micromanipulation pulling energies.
The work here has used AFM and micromanipulation equipment to identify adhesive and
cohesive effects in the cleaning of food deposit. The caramel deposits are essentially highly
cohesive. (physical properties of deposits cause intermolecular attraction between like-

121
molecules). On the other hand, SCM, Turkish delight and toothpaste are adhesive. The results
suggest that for SCM, toothpaste and Turkish delight, the cohesive forces between elements
of the deposits are weaker (loosely bound) than those of adhesion between surface and
deposits, which is opposite to the behaviour of caramel. Thus it is easier to remove the whole
of the deposit than to remove a surface layer.
This indicates that AFM and micromanipulation technique can identify the different
mechanical properties of fouling deposits. In both measurement methods the results show
caramel to display adhesive failure and toothpaste, Turkish delight and SCM to show
cohesive failure. The PTFE surface generally shows lower adhesion with both AFM and
micromanipulation. Both measurement methods measure adhesion force, however the size of
force is larger with micromanipulation due to the sample size and amount.
The AFM measures the force at smaller scale areas than micromanipulation. AFM is a more
sensitive measurement method, and more parameters are required to set up experiments, such
as the need for the right size particle and the right cantilever stiffness. Also it is not known
until the experiment is performed how much z-range is required. In comparison,
micromanipulation is relatively simple to use and set up. Most deposits are easily compatible,
compared to the AFM. The AFM requires more preparation to set up an experiment. Both
methods are acceptable as the overall data sets show similar behaviour with each deposit.
Micromanipulation and AFM show similarities in adhesion forces. However, the range of
adhesion is on two length scales, making it very difficult to compare. It is clear that, as found
by other researchers, the surface energy affects the force required for removal. The advantage
of AFM is that it is an instrument commonly used in the development and characterisation of
new materials, which may initially only be available in very small quantities. Measurements
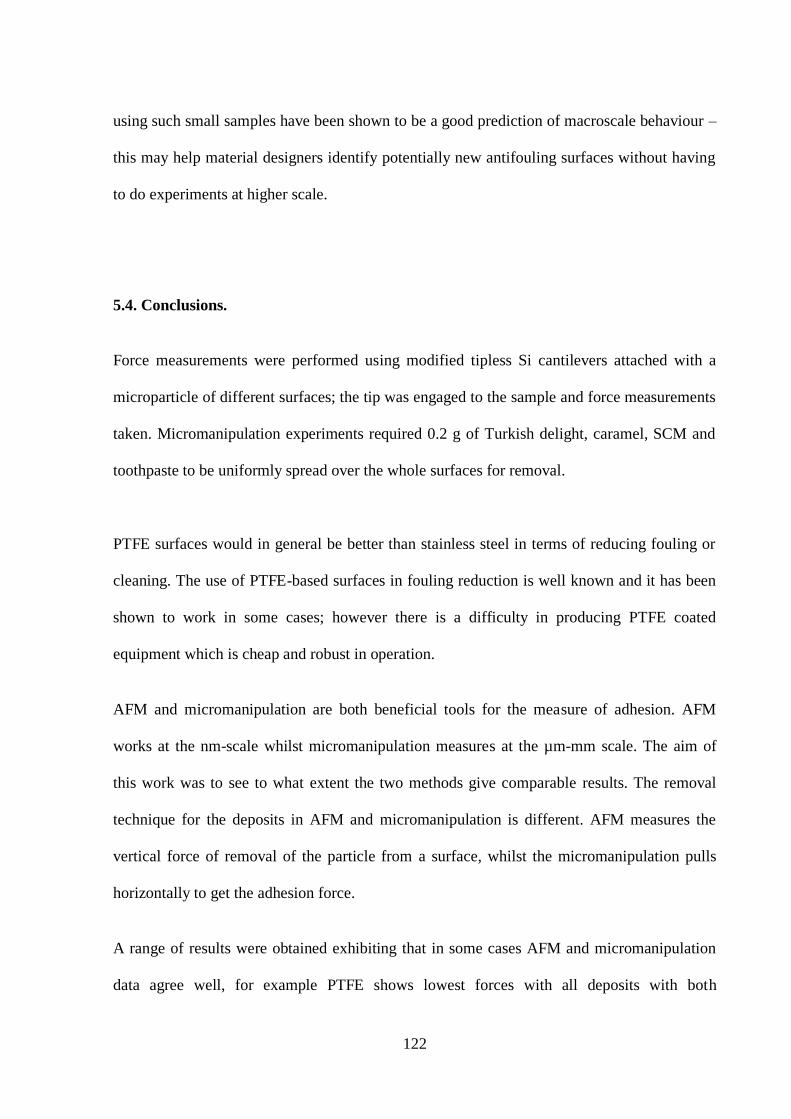
122
using such small samples have been shown to be a good prediction of macroscale behaviour –
this may help material designers identify potentially new antifouling surfaces without having
to do experiments at higher scale.
5.4. Conclusions.
Force measurements were performed using modified tipless Si cantilevers attached with a
microparticle of different surfaces; the tip was engaged to the sample and force measurements
taken. Micromanipulation experiments required 0.2 g of Turkish delight, caramel, SCM and
toothpaste to be uniformly spread over the whole surfaces for removal.
PTFE surfaces would in general be better than stainless steel in terms of reducing fouling or
cleaning. The use of PTFE-based surfaces in fouling reduction is well known and it has been
shown to work in some cases; however there is a difficulty in producing PTFE coated
equipment which is cheap and robust in operation.
AFM and micromanipulation are both beneficial tools for the measure of adhesion. AFM
works at the nm-scale whilst micromanipulation measures at the µm-mm scale. The aim of
this work was to see to what extent the two methods give comparable results. The removal
technique for the deposits in AFM and micromanipulation is different. AFM measures the
vertical force of removal of the particle from a surface, whilst the micromanipulation pulls
horizontally to get the adhesion force.
A range of results were obtained exhibiting that in some cases AFM and micromanipulation
data agree well, for example PTFE shows lowest forces with all deposits with both

123
techniques, however, some effects seen with the AFM differ to those of micromanipulation.
For example the forces size is greater with the latter.
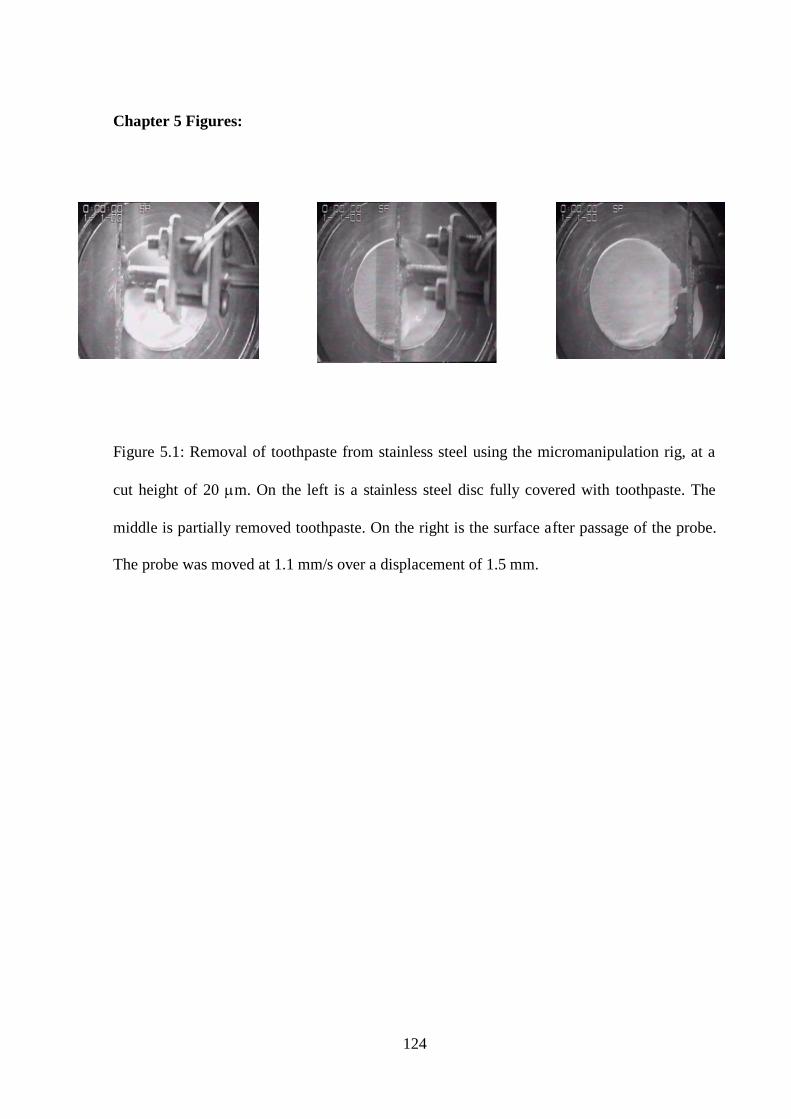
124
Chapter 5 Figures:
Figure 5.1: Removal of toothpaste from stainless steel using the micromanipulation rig, at a
cut height of 20 m. On the left is a stainless steel disc fully covered with toothpaste. The
middle is partially removed toothpaste. On the right is the surface after passage of the probe.
The probe was moved at 1.1 mm/s over a displacement of 1.5 mm.
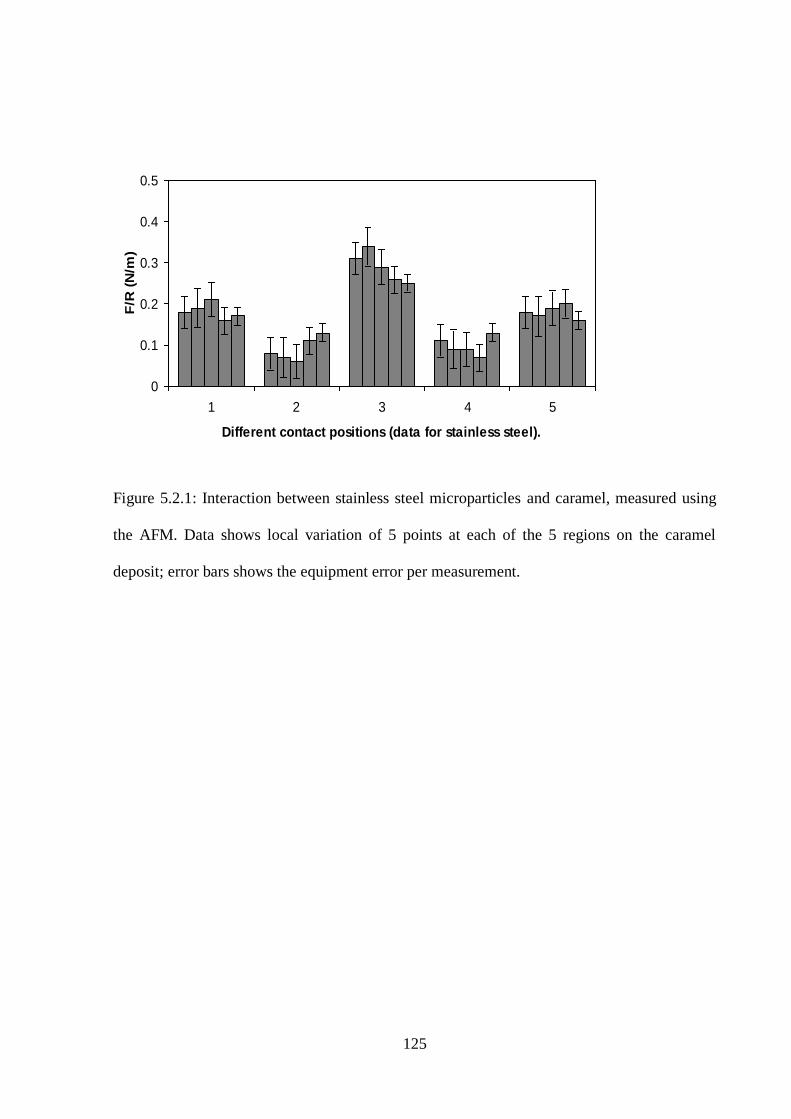
125
Figure 5.2.1: Interaction between stainless steel microparticles and caramel, measured using
the AFM. Data shows local variation of 5 points at each of the 5 regions on the caramel
deposit; error bars shows the equipment error per measurement.
0
0.1
0.2
0.3
0.4
0.5
1 2 3 4 5
Different contact positions (data for stainless steel).
F/R
(N
/m)

126
Figure 5.2.2: AFM force measurements of Stainless steel, glass and PTFE microparticles
immersed in caramel (spread out between 50µm to 60µm thickness on a glass slide) and then
retracted. Data shows results from five different contact positions on the caramel deposit.
Error bars represent the global variation of the mean of five experiments. The approach speed
for all experiments was 3µm/s, and then a 5 second pause on deposit and 0.25µm/s retraction
speed.
0
0.1
0.2
0.3
0.4
0.5
1 2 3 4 5
Different Contact positons
F/R
(N
/m)
Glass
stainless steel
PTFE
127
Figure 5.3: AFM force measurements of Stainless steel, glass and PTFE microparticles were
immersed in SCM and then retracted off the deposit. SCM was spread out between 50µm to
60µm thick on a glass slide. The approach speed for all experiments was 3µm/s, and then a 5
second pause on deposit and 0.25µm/s retract. Data shows the mean of five experiments at
each of five different contact positions on the SCM deposit.
0
0.05
0.1
0.15
0.2
0.25
1 2 3 4 5
Contact postion
F/R
(N
/m)
GlassStainless steelPTFE

128
Figure 5.4: AFM force measurements of Stainless steel, glass and PTFE microparticles were
immersed in Turkish delight and then retracted off the deposit. Turkish delight was spread out
between 50µm to 60µm thick on a glass slide. The approach speed for all experiments was
3µm/s, and then a 5 second pause on deposit and 0.25µm/s retract. Data shows the mean of
five experiments at each of five different contact positions on the Turkish delight deposit.
0
0.01
0.02
0.03
0.04
0.05
1 2 3 4 5
Different contact positions
F/R
(N/m
)Glass
Stainless steel
PTFE
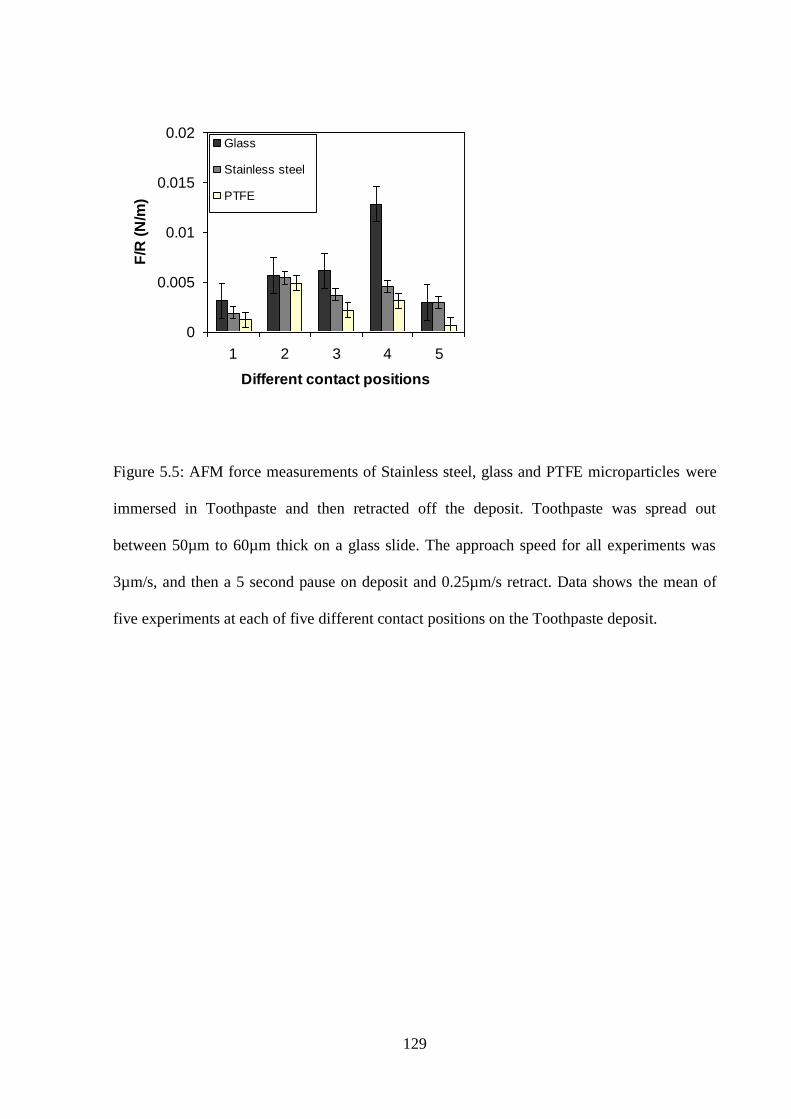
129
Figure 5.5: AFM force measurements of Stainless steel, glass and PTFE microparticles were
immersed in Toothpaste and then retracted off the deposit. Toothpaste was spread out
between 50µm to 60µm thick on a glass slide. The approach speed for all experiments was
3µm/s, and then a 5 second pause on deposit and 0.25µm/s retract. Data shows the mean of
five experiments at each of five different contact positions on the Toothpaste deposit.
0
0.005
0.01
0.015
0.02
1 2 3 4 5
Different contact positions
F/R
(N
/m)
Glass
Stainless steel
PTFE

130
Figure 5.6: Summary of the forces measured by AFM for the different microparticles and all
four deposits. (Log Scale).
0.0001
0.001
0.01
0.1
1
Caramel SCM Turkish
delight
Toothpaste
F/R
(N/m
)Stainless steel
PTFE
Glass
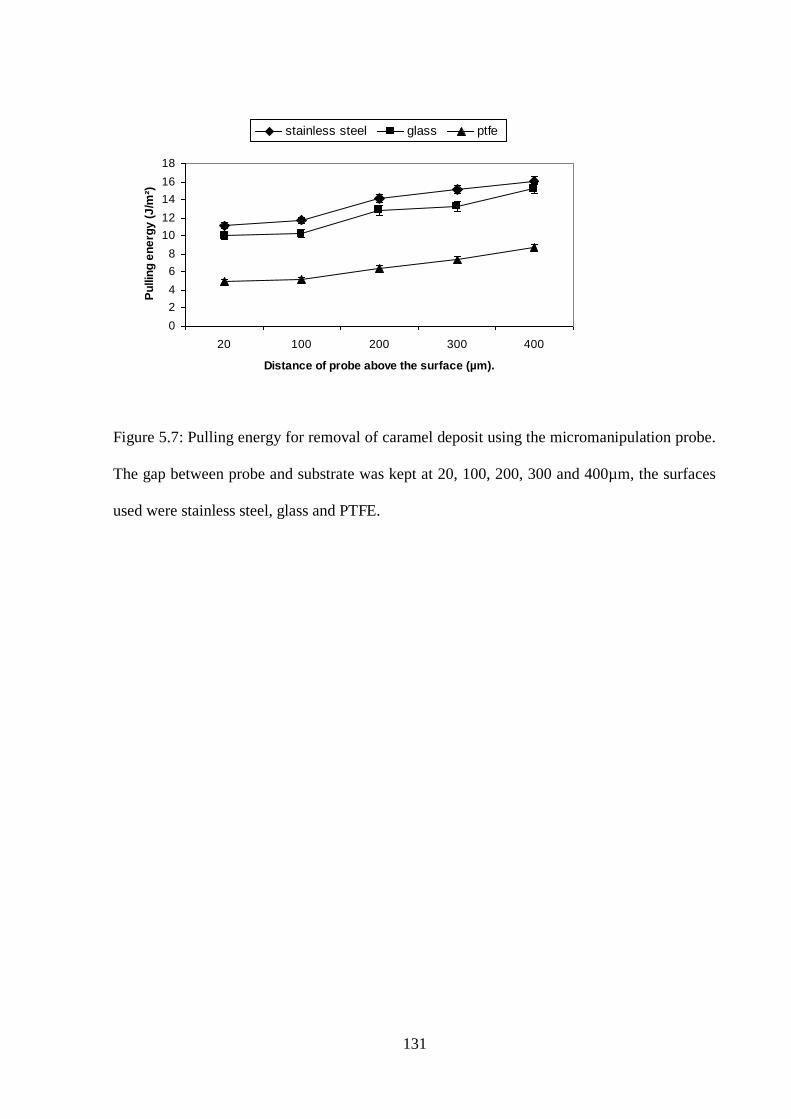
131
Figure 5.7: Pulling energy for removal of caramel deposit using the micromanipulation probe.
The gap between probe and substrate was kept at 20, 100, 200, 300 and 400µm, the surfaces
used were stainless steel, glass and PTFE.
0
2
4
6
8
10
12
14
16
18
20 100 200 300 400
Distance of probe above the surface (µm).
Pu
llin
g e
ne
rgy
(J
/m²)
stainless steel glass ptfe

132
Figure 5.8: Pulling energy for removal of SCM deposit using the micromanipulation probe.
The gap between probe and substrate was kept at 20, 100, 200, 300 and 400µm, the surfaces
used were stainless steel, glass and PTFE.
0
1
2
3
4
5
6
7
8
20 100 200 300 400
Distance of probe above the surface (µm).
Pu
llin
g e
nerg
y (
J/m
²)Stainless steel Glass PTFE
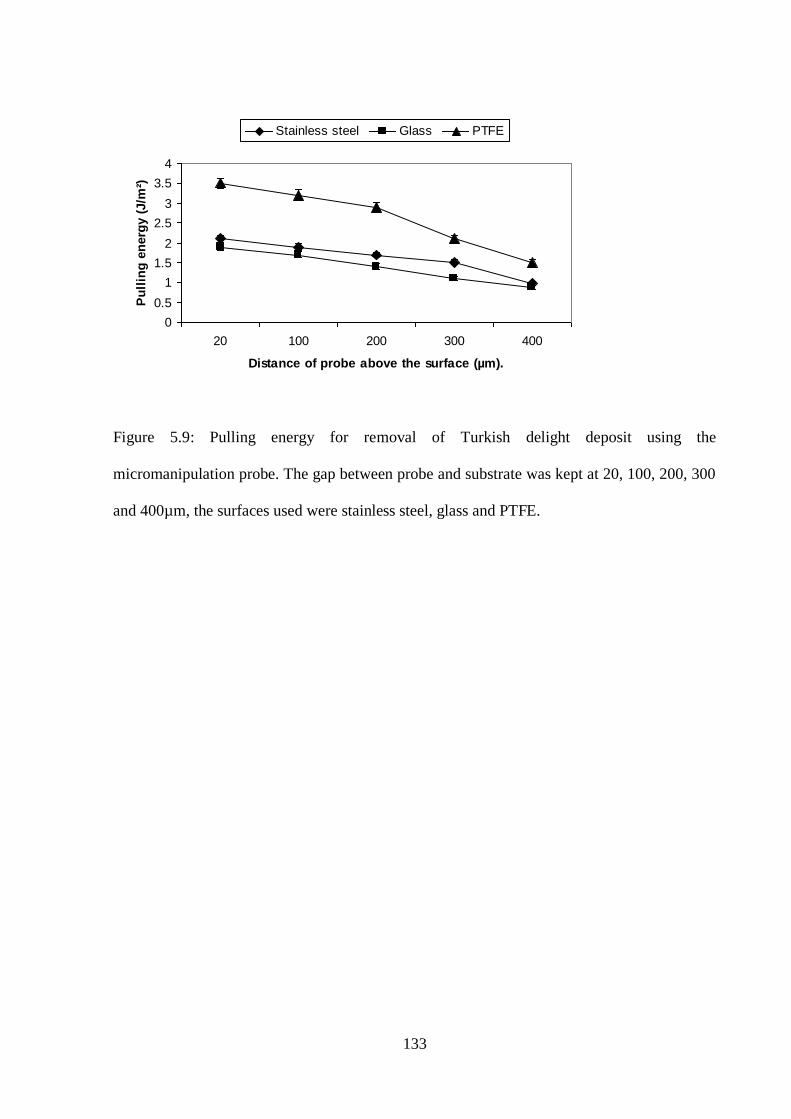
133
Figure 5.9: Pulling energy for removal of Turkish delight deposit using the
micromanipulation probe. The gap between probe and substrate was kept at 20, 100, 200, 300
and 400µm, the surfaces used were stainless steel, glass and PTFE.
0
0.5
1
1.5
2
2.5
3
3.5
4
20 100 200 300 400
Distance of probe above the surface (µm).
Pu
llin
g e
nerg
y (
J/m
²)Stainless steel Glass PTFE
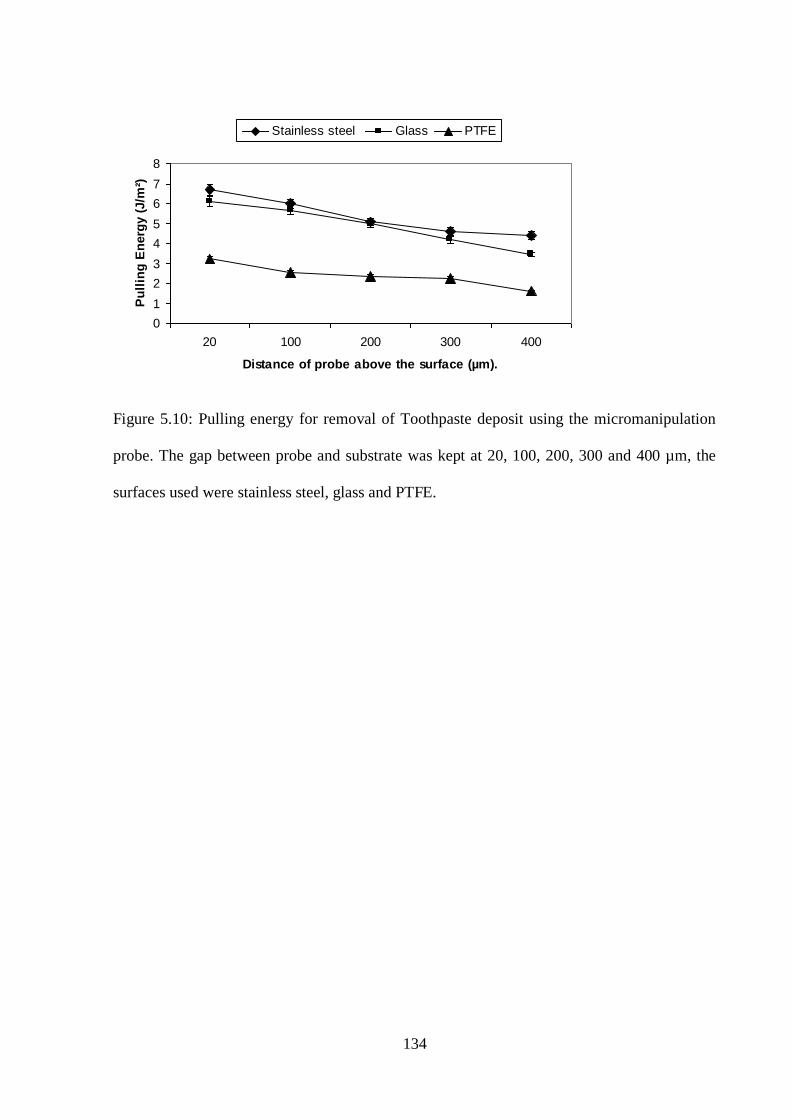
134
Figure 5.10: Pulling energy for removal of Toothpaste deposit using the micromanipulation
probe. The gap between probe and substrate was kept at 20, 100, 200, 300 and 400 µm, the
surfaces used were stainless steel, glass and PTFE.
0
1
2
3
4
5
6
7
8
20 100 200 300 400
Distance of probe above the surface (µm).
Pu
llin
g E
nerg
y (
J/m
²)Stainless steel Glass PTFE

135
Figure 5.11: Summary of Micromanipulation experiments at 20µm thickness of caramel,
SCM, Turkish delight and toothpaste on glass, stainless steel and PTFE.
0
2
4
6
8
10
12
14
caramel SCM Turkish delight toothpaste
Distance of probe above the surface (µm).
Pu
llin
g E
nerg
y (
J/m
²)stainless steel glass PTFE
136
Chapter 6: Atomic Force Microscopy (AFM) experiments of
caramel, whey protein, and SCM deposits at different
temperatures.
Most food production processes require heating, the efficiency of which depends on the
cleanliness of the heat transfer equipment explained in Chapter 2. In the food sector the
thermal instability of food products causes very rapid build up of deposits onto heat transfer
surfaces. Most food processing equipment needs to be cleaned regularly to maintain thermal
efficiency. Fouling in the food industry is considered to be severe; daily cleaning is needed.
Furthermore many food processing plants rely on heat treatment to kill dangerous bacteria, so
cleaning is required for food safety reasons.
In Chapter 5, AFM adhesion measurements have been carried out using different
microparticles and different deposits. A range of results is obtained that can in some cases be
related to the micro-meso-scale of removal measured by micromanipulation. This chapter
will further investigate AFM adhesion measurements, when caramel, whey protein and SCM
are studied at 30ºC, 50ºC, 70ºC, and 90ºC using an AFM heating stage (seen in Figure 6.1).
Fouling occurs at different temperatures, depending on the deposit, as described in Chapter 2.
In thermal processing the most thermally labile materials form fouling deposits, such as -
lactoglobulin, a milk whey protein, which forms the majority of milk pasteuriser deposit,
despite being only a small fraction of the protein in milk [Changani et al. 1997]. Heating

137
caramel and SCM involves the loss of water the breaking of carbon-carbon linkages of the
sugar molecule at high temperatures (above 130ºC). Adhesion occurs at high temperatures:
for example, in milk pasteurisation deposition of proteins occurs onto surfaces held at 75ºC.
Most of the measurements of forces are such as those of Chapters 4 and 5, carried out at room
temperature. The measurements of adhesion at process temperature would obviously be of
value, both to investigate the forces required to cause adhesion at these temperatures as well
as to study the ways in which forces change with temperature.
In all cases here the deposits were first heated for 5 minutes and the temperatures maintained
and monitored during experiments before pull off forces were measured. Experiments were
carried out using a Nanowizard II AFM adapted using a JPK (U.K) heating stage. While
experiments were carried out at 30ºC, 50ºC, 70ºC and 90ºC only limited access to the
equipment was possible, so only two microparticles were used; stainless steel and PTFE. The
variable parameters used in the heating experiments were:
(i) Different Contact positions: The same methodology was used in Chapter 5.
Different force curves were taken at different positions (at least five) on the
deposits to investigate the spatial variation of adhesion.
(ii) Different Rate: The speed at which the tip approaches and retracts on and off the
deposit was varied, at 0.25, 0.75, 1, 3 and 5µm/s. These rates were chosen to be
within the size (40-50µm) of sample used and the Z-range limits of the AFM. The
rate was controlled and monitored on screen by the Nanowizard II software; this
could be changed as desired.
(iii) Different Contact Times: The force curves were taken for different contact times
between the tip attached with microparticle and the deposits. The time is varied
138
between zero seconds, where the tip touches the sample, and then is retracted
instantly, the contact times are 0.5, 1, 5 and 10 and 60 seconds. The tip and deposit
contact could be seen using the AFM optical camera and the software allows the
input of different values and control of the Z-range scanner to move up or down.
In some experiments no force curve was obtained for 60 seconds holding times as
the deposits engulfed the microparticle and the cantilever would not retract.
These experiments were designed to test the balance between two factors (i) the increase
in deposit cohesion which would be expected to occur at high temperature, as a result of
thermally-induced reactions, and (ii) any possible decrease in the cohesion as a result of
the decrease in the effectiveness of intermolecular forces which occurs at high
temperature.
6.1 AFM analysis of interactions between test surfaces and heated caramel.
6.1.1 Different contact positions.
Figure 6.2.1 shows the force of adhesion at different contact positions, when caramel is heated
at different temperatures using the stainless steel tip. The results show:
(i) At 30°C the largest adhesion of 0.5 (±0.1)N/m is found between the stainless steel
microparticle and caramel at different contact positions; there is however considerable
variation between the values measured at this temperature.
(ii) At 50°C some adhesion of 0.3(±0.05)N/m is shown, as the temperature increases the
adhesion decreases.
139
(iii) At 70°C and 90°C the force decreases further, to 0.25(±0.002)N/m. There is some
loss of moisture as the sample is heated, and some reactions might take place as the
deposit starts to turn into a darker brown colour.
The force decreases with temperature increases Figure 6.3.1 shows the interactions between
the PTFE tip and caramel at different contact positions and allows comparison of the two
surfaces. There is a decrease in adhesion from 30°C to 90°C but the change between 50ºC and
90ºC is very small. The force at 30ºC is 0.18(±0.02)N/m, at 50ºC is 0.16(±0.02)N/m, at 70ºC
is 0.09(±0.02)N/m and at 90ºC is 0.08(±0.02)N/m. The data shows that the magnitude of the
adhesive forces between caramel and stainless steel is significantly greater than with PTFE,
an effect also seen with unheated caramel in Chapter 5. For both PTFE and stainless steel, the
force of adhesion decreases as the temperature increases. It has been noted in the introduction
that different effects are possible with an increase in temperature; the caramel deposit will
have a lower viscosity with increasing temperature but may also undergo reactions to enhance
adhesion. The data suggests that any effect of increased adhesion is minimal, and that the
effects of the surface are significant.
6.1.2 Different rates of retraction.
Figure 6.2.2 shows the results on interaction between caramel and stainless steel at varying
points. The highest adhesion is seen at 30°C where for all the forces shows the highest
adhesion for all the different temperatures is seen under all speeds and points. There is no
measurable trend at 30C when changing the rate of removal of stainless steel from the
surface, this could be due to experimental error. Figure 6.2.2 shows at 30°C the mean force is
0.5N/m at 0.25µm/s, 0.55N/m at 0.75µm/s, 0.45N/m at 1.00µm/s, 0.45N/m at 1.5µm/s,
0.58N/m at 3µm/s and 0.45N/m at 5µm/s. Lower values are seen at the other temperatures,

140
with the same lack of trends at 50ºC; (where values were between 0.43(±-0.02)N/m and
0.33(±0.02)N/m). The data at high temperature does suggest that the faster the rates the lower
the force. At 0.25µm/s the F/R values are 0.3(±0.02)N/m, whilst at 5µm/s the values have
dropped to 0.23(±0.02)N/m. For PTFE, the values are significantly smaller, as shown in
Figure 6.3.2. The trend is that force decreases as speed increases (which shows that there is
some effect of increasing rate, which is again to decrease the force): from 0.13(±0.02)N/m at
30ºC, to 0.09(±0.02)N/m, at 50ºC, to 0.07(± 0.02) at 70ºC and to 0.06(±0.02) at 90ºC.
6.1.3 Different waiting times on caramel.
Figure 6.2.3 shows the force of adhesion of the stainless steel microparticle for variable
contact times with caramel. It might be expected that as the holding time increases the force
between particle and surfaces increases, because more time is available to form bonding
interactions with the surface. Very little change in the force is seen between 0.5 and 10
seconds at all temperatures. Figure 6.3.3 shows the force of adhesion for the PTFE
microparticle at variable times on caramel. Here as the waiting time increased the adhesion
decreased. At 30C, the adhesion changes from 0.18N/m to 0.08N/m, whilst there is a small
effect (0.11 to 0.08N/m) at 90C. The reason for this decrease is not clear, as an increase
would be expected.
6.2 AFM analysis of interactions between test surfaces and SCM.
6.2.1 Different contact positions.
The experiments were repeated using sweetened condensed milk (SCM). Figure 6.4.1 shows
the force of adhesion at different contact positions, when SCM is heated at different
temperatures using the stainless steel tip. The results show that

141
(i) at 30°C the largest adhesion force of 0.1(±0.04)N/m is felt between the stainless
steel microparticle and SCM deposit at different contact position. This is the same
as the caramel, however the values are much smaller.
(ii) At 50°C degrees adhesion of 0.08(±0.02)N/m is felt; with caramel, as the
temperature increases the adhesion decreases.
(iii) At 70°C the adhesion forces are 0.07(±0.02)N/m whilst caramel were 0.29(±
0.02)N/m.
(iv) At 90°C the force is 0.05(±0.02)N/m. The data is all lower than for caramel, but
similar trends can be identified.
Figure 6.5.1 shows the interactions between the PTFE tip and SCM at different contact
positions. The forces are much smaller by more than an order of magnitude compared to
caramel at 30ºC where values are 0.006(±0.001)N/m, at 50ºC is 0.0055(±0.001)N/m, at 70ºC
is 0.005(±-0.001)N/m and at 90ºC is 0.0045(±0.001)N/m. The decrease with temperature is
marked but is proportionally less than that seen for the stainless steel. Overall stainless steel
and PTFE both display much weaker forces for SCM than for caramel.
6.2.2 Different rates of retraction.
Figure 6.4.2 shows the results for adhesion forces at different rates of withdrawal from the
surface over the four temperatures. Adhesion is seen to be very inconsistent, and few trends
can be identified. At 30ºC the adhesion is 0.08(±0.02)N/m at 0.25µm/s, 0.09(±0.02)N/m at
0.75µm/s, 0.09(±0.02) at 1µm/s, 0.08(±0.02)N/m at 1.5µm/s, 0.1(±0.02) at 3µm/s and
0.1(±0.02)µm/s at 5µm/s. No possible trends are seen. The highest adhesion forces are found

142
for the fastest rate. Figure 6.5.2 shows the results at different rates, for the PTFE, here again
no trends are seen, although the force may decrease slightly with the higher rate.
6.2.3 Different waiting times on SCM.
Figure 6.4.3 shows the force of adhesion for stainless steel microparticle at variable times on
SCM. The results show:
(i) At 30°C the largest adhesion of 0.09(±0.02)N/m was seen between the stainless steel
microparticle and SCM deposit this does not change significantly with hold time on the
surface.
(ii) At 50°C degrees some adhesion of 0.08(±0.02)N/m is seen. As the temperature increases
the adhesion decreases and no change is seen with time.
(iii) At 70ºC the force is 0.07(±0.02)N/m and at 90ºC the force is 0.06(±0.02)N/m at all times.
Figure 6.5.3 shows the force of adhesion for the PTFE microparticle at variable times on
SCM. Similar trends can be seen with the PTFE as in Figure 6.4.3 of stainless steel, the
smallest adhesion forces are seen at intermediate contact times of 1 to 5 seconds. The stainless
steel shows adhesion forces one order of magnitude greater than for PTFE, but the effect of
contact time is similar. This suggests that it may be due to deposit properties, such as
viscosity/ viscoelasticity that will not be surface-dependent.

143
6.3.1 AFM analysis of interactions between test surfaces and Whey protein
Whey protein was studied because it is known to be critical in milk fouling, and thus would
be useful to compare the magnitude of the forces seen in the whey protein alone and in SCM.
6.3.1 Interactions at different contact positions.
Figure 6.6.1 illustrates the adhesion force at different contact positions, using the stainless
steel microparticle when whey protein is heated at different temperatures. The results show
(i) At 30°C the largest adhesion of 0.005(±0.001)N/m was seen between stainless
steel and whey protein,
(ii) At 50°C adhesion of 0.004(±0.001)N/m was seen. As observed in all other
measurements. When temperature increases the adhesion decreases.
(iii) At 70°C adhesion of 0.0035(±0.001)N/m occurs and at 90°C the force is
0.0025(±0.001)N/m.
SCM showed values between 0.08 and 0.05N/m suggesting that the major contribution to
fouling from SCM and stainless steel is not the whey proteins, as the force is an order of
magnitude greater for SCM than for the protein alone. In Figure 6.7.1 results show the
interactions between the PTFE tip and whey protein at different contact positions. There is a
decrease in adhesion from 30°C to 90°C. The force at 30ºC is 0.004(±0.001)N/m, at 50ºC is
0.0038(±0.001)N/m, at 70ºC it is 0.0035(±0.001)N/m and at 90ºC it is 0.0028(±0.001)N/m.
The magnitude of adhesion on stainless steel is greater than with PTFE. Data for PTFE is only
about 20% less than for stainless steel. It is interesting to compare PTFE, SCM and whey
protein, where the force values are quite similar. Figure 6.5.1 and 6.7.1, can be compared as
they show values of the order of 0.004-0.006N/m for SCM and 0.004-0.003N/m for whey

144
protein. This is significantly different to the behaviour of whey protein and stainless steel; it
suggests that for PTFE the major contribution to the adhesion in SCM is the whey proteins.
6.3.2 Different rates of retraction.
Figure 6.6.2 shows the results for different rates, changing the speed it takes for the stainless
steel microparticle to go into the whey protein deposit and back off. At all temperatures the
adhesion is seen to be very inconsistent, with no trend seen between the different rates. Figure
6.7.2 shows the results at different rates, for the PTFE microparticle on the whey protein.
There are some effects from the rate of retraction; the minimum adhesion force appears to be
at intermediate rates, at 1-1.5m/s. Data for PTFE and stainless steel surfaces are similar.
6.3.3 Different waiting times on whey protein.
Figure 6.6.3 shows the force of adhesion on stainless steel microparticle at variable times on
whey protein. The results show
(i) At 30°C the largest adhesion of 0.004(±0.001)N/m is between the stainless steel
microparticle and whey protein deposit at different contact positions. There is little effect of
contact time.
(ii) At 50°C degrees some adhesion of 0.003(±0.002)N/m is felt, as for all cases as the
temperature increases adhesion decreases. No effect of time is seen.
(iv) At 70ºC force is 0.003(±0.002)N/m and
(v) At 90ºC force is 0.0025(±0.002)N/m at all times.
145
Figure 6.7.3 shows the force of adhesion between the PTFE microparticle and the whey
protein at different times. A similar lack of trend is seen as in Figure 6.6.3. Slightly greater
adhesion of 0.0045(±0.001)N/m is seen with stainless steel compared to the force of
0.004(±0.001)N/m with PTFE. In both cases, adhesion seems to be independent of waiting
time on the deposits.
This similar behaviour was seen with stainless steel and PTFE in chapter 5 in Figures 5.2.2
and 5.3. Again adhesion decreases as temperature increases. This is due to a slight loss of
moisture in SCM when heated; the sample weight decreases with heating by 5%. This trend
was also evident with the caramel. However the different order of magnitude on the forces
depending on temperature the two particles was not seen.
To summarise the results Figure 6.7.4 compares the force measurements for stainless steel and
PTFE microparticle immersed in caramel, SCM and whey protein. At 30ºC and 90ºC data
shows results from different contact positions on the deposits; the approach speed of 3µm/s,
then a 5 second pause on the deposit and then the rate of retraction is 0.25µm/s. Significant
(more than an order of magnitude) differences are seen between forces for the same and
different deposits, and between different surfaces for the same deposits. Lower forces are seen
at 90ºC in all cases. The higher the temperature, the less the force between surface and
deposit. To design systems to resist fouling, these results suggest that measurements at
process temperatures are needed.
146
6.4. Conclusions and implications for fouling studies.
To identify whether the data would be of value in fouling, AFM force measurement
experiments have been conducted over a range of temperatures, rates, contact positions,
surfaces and contact times. The following conclusions can be made:
Temperature changes the food deposit structure as well as increasing the rate of some
reactions, such as protein denaturation and aggregation. By comparison to the forces
found at room temperature in previous chapters, the increase in temperature causes
adhesion forces to decrease at different contact points.
The time the tip sits on each food deposit does not affect adhesion behaviour. The
adhesion is similar or consistent at all times, but varies with temperature. This is
similar to micromanipulation.
The rate of retraction on the deposit causes some variability in the adhesion behaviour.
The effect on adhesion with retraction rate is not predictable.
The two surfaces used; PTFE and stainless steel show that adhesion occurs with both but
is less with PTFE than stainless steel. The results of Chapters 5 and 6 show similar effects
– micromanipulation and AFM data appears to be comparable, suggesting that it is
possible to use AFM to study cleanability.
The experimental data shows that the forces of adhesion are much less at high temperature
than at low temperatures. This is especially interesting as fouling deposits form at high
temperatures; such as the 60-100ºC at which caramel is processed, and the 70-90ºC for
milk pasteurisation, which causes deposition of Type A protein-rich deposit. Deposit must
form at these high process temperatures, but the adhesive forces are very small – much

147
smaller than would be predicted by doing experiments with AFM and micromanipulation
at room temperature. It is interesting that the trends of the measurements at room
temperature are the same as those at high temperatures. Any effective models for fouling
must account for adhesion of deposits onto surfaces with the low adhesion forces seen
here, such as for whey protein and stainless steel. The effect of these forces must be
greater than the effect of surface shear in creating a deposit. The results suggest that
equipment or flow regimes to resist fouling will be overdesigned if only data for adhesion
at room temperature is considered. This potentially is an important result: data at room
temperature for cleaning is much easier to obtain than that at high temperature.
The experiments suggest that only by doing experiments on measuring adhesion at real
process temperatures will an accurate measurement be obtained. This is especially
important if we are to use computational models for fouling and cleaning, in which the
shear stress on the surfaces of plant or deposit can be predicted. The forces measured at
room temperature are a significant overestimate of those, which are found at temperature.
Of course it is well known that cleaning becomes easier at high temperatures [as discussed
in Chapter 2] but these results allow quantification of it.
It was expected that the adhesion force between particle and surface would increase with
time as – for example, whey protein denaturation and aggregation proceeds and bonds
form. The data suggests that these reactions have little effect on the adhesion forces, at
least as measured by AFM; more work needs to be done to determine what effects, if any,
reaction processes have on adhesion at these temperatures.
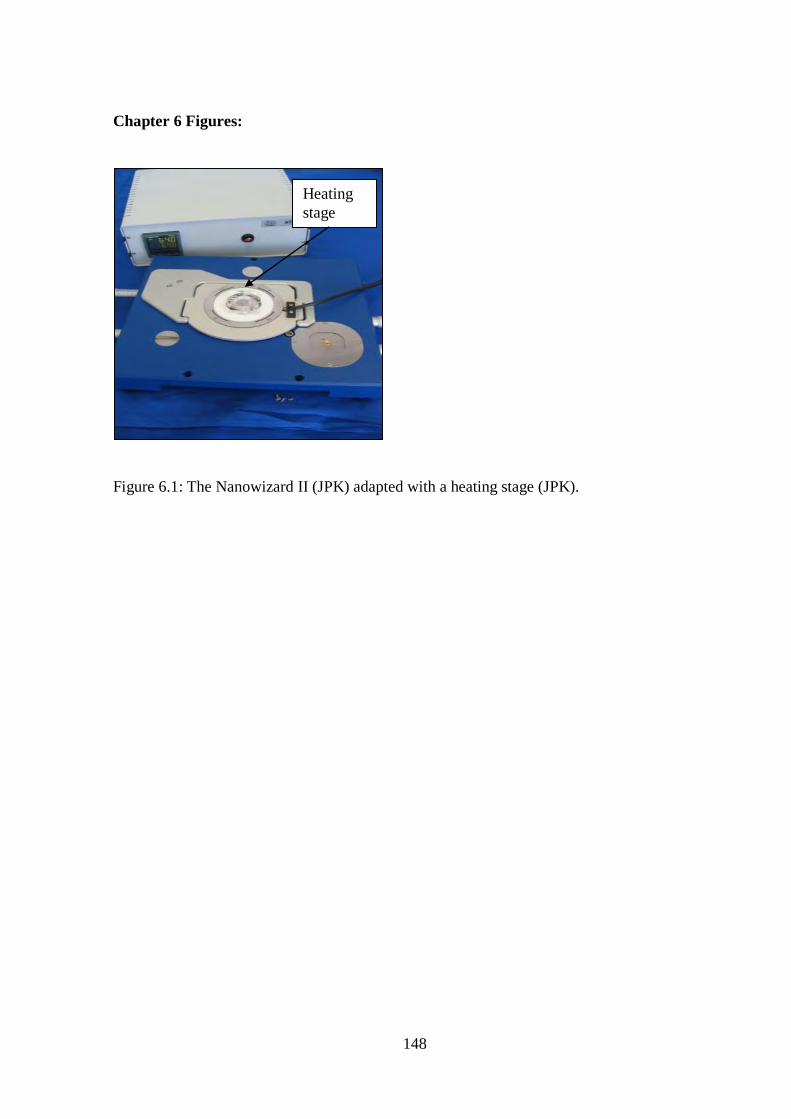
148
Chapter 6 Figures:
Figure 6.1: The Nanowizard II (JPK) adapted with a heating stage (JPK).
Heating
stage

149
Figures 6.2.1: Force measurements of a Stainless steel microparticle immersed in caramel and
then retracted off the deposit. Caramel was spread out between 50µm to 60µm thick on a
glass slide, then the caramel was heated for 5 minutes at each temperature and the temperature
was monitored and controlled at required temperature. Data shows results from five different
contact positions on the caramel deposit. The approach speed for all experiments was 3µm/s,
then a 5 second pause on deposit and rate of retract was 0.25µm/s. The data shows variation
of the mean of the five experiments. F/R at different contact positions. (The error bars show
the average of five experiments)

150
Figure 6.2.2: Force measurements of a Stainless steel microparticle immersed in caramel and
then retracted off the deposit, at variable rates. The deposit was spread out between 50µm to
60µm thick on a glass slide, then the caramel was heated for 5 minutes at each temperature
and the temperature was monitored and controlled at the required temperature. The retract
speed for all experiments was 0.25, 0.75, 1.00, 1.5, 3 and 5µm/s. The tip was held on the
deposit for 5 seconds before retraction.

151
Figure 6.2.3: Force measurements of a Stainless steel microparticle immersed in caramel and
then retracted off the deposit, at variable times. The deposit was spread out between 50µm to
60µm thick on a glass slide, then the caramel was heated for 5 minutes at each temperature
and the temperature was monitored and controlled at the required temperature. The waiting
times on the deposits for the experiments were 0, 0.5, 1.0, 5.0 and 10 seconds. The approach
speed for all experiments was 3µm/s and a rate of retraction was 0.25µm/s.

152
6.3.1: Force measurements of a PTFE microparticle immersed in caramel and then retracted
off the deposit. Caramel was spread out between 50µm to 60µm thick on a glass slide, then
the caramel was heated for 5 minutes at each temperature and the temperature was monitored
and controlled at required temperature. Data shows results from five different contact
positions on the caramel deposit. The approach speed for all experiments was 3µm/s, then a 5
second pause on deposit and rate of retraction was 0.25µm/s. The data shows a global
variation of the mean of the five experiments.

153
6.3.2: Force measurements of a PTFE microparticle immersed in caramel and then retracted
off the deposit, at variable rates on caramel. The deposit was spread out between 50µm to
60µm thick on a glass slide, then the caramel was heated for 5 minutes at each temperature
and the temperature was monitored and controlled at the required temperature. The retraction
speed for all experiments was 0.25, 0.75, 1.00, 1.5, 3 and 5µm/s. The tip was held on deposit
for 5 seconds.

154
6.3.3: Force measurements of a PTFE microparticle immersed in caramel and then retracted
off the deposit, at variable times on caramel. The deposit was spread out between 50µm to
60µm thick on a glass slide, then the caramel was heated for 5 minutes at each temperature
and the temperature was monitored and controlled at the required temperature. The waiting
times on the deposits for the experiments were 0, 0.5, 1.0, 5.0 and 10 seconds. The approach
speed for all experiments was 3µm/s and a rate of retract was 0.25µm/s.

155
6.4.1: Force measurements of a stainless steel microparticle immersed in SCM and then
retracted off the deposit. SCM was spread out between 50µm to 60µm thick on a glass slide,
then the SCM was heated for 5 minutes at each temperature and the temperature was monitored
and controlled at required temperature. Data shows results from five different contact positions
on the SCM deposit. The approach speed for all experiments was 3µm/s, then a 5 second pause
on deposit and rate of retract was 0.25µm/s. The data shows a global variation of the mean of
the five experiments.
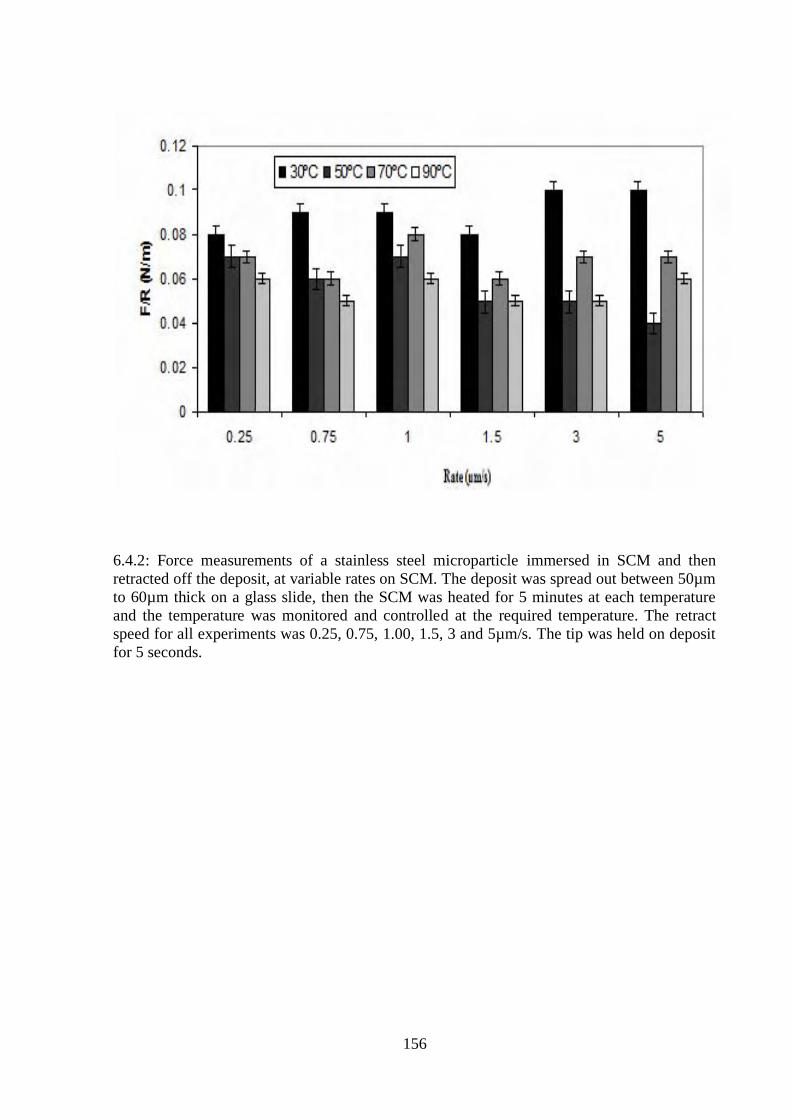
156
6.4.2: Force measurements of a stainless steel microparticle immersed in SCM and then
retracted off the deposit, at variable rates on SCM. The deposit was spread out between 50µm
to 60µm thick on a glass slide, then the SCM was heated for 5 minutes at each temperature
and the temperature was monitored and controlled at the required temperature. The retract
speed for all experiments was 0.25, 0.75, 1.00, 1.5, 3 and 5µm/s. The tip was held on deposit
for 5 seconds.

157
6.4.3: Force measurements of a stainless steel microparticle immersed in SCM and then
retracted off the deposit, at variable times on SCM. The deposit was spread out between
50µm to 60µm thick on a glass slide, then the SCM was heated for 5 minutes at each
temperature and the temperature was monitored and controlled at the required temperature.
The waiting times on the deposits for the experiments were 0, 0.5, 1.0, 5.0, 10, 20 and 60
seconds. The approach speed for all experiments was 3µm/s and a rate of retract was
0.25µm/s.

158
6.5.1: Force measurements of a PTFE microparticle immersed in SCM and then retracted off
the deposit. SCM was spread out between 50µm to 60µm thick on a glass slide, then the SCM
was heated for 5 minutes at each temperature and the temperature was monitored and
controlled at required temperature. Data shows results from five different contact positions on
the SCM deposit. The approach speed for all experiments was 3µm/s, then a 5 second pause
on deposit and rate of retract was 0.25µm/s. The data shows a global variation of the mean of
the five experiments.

159
6.5.2: Force measurements of a PTFE microparticle immersed in SCM and then retracted off
the deposit, at variable rates on SCM. The deposit was spread out between 50µm to 60µm
thick on a glass slide, then the SCM was heated for 5 minutes at each temperature and the
temperature was monitored and controlled at the required temperature. The retract speed for
all experiments was 0.25, 0.75, 1.00, 1.5, 3 and 5µm/s. The tip was held on deposit for 5
seconds.

160
6.5.3: Force measurements of a PTFE microparticle immersed in SCM and then retracted off
the deposit, at variable times on SCM. The deposit was spread out between 50µm to 60µm
thick on a glass slide, then the SCM was heated for 5 minutes at each temperature and the
temperature was monitored and controlled at the required temperature. The waiting times on
the deposits for the experiments were 0, 0.5, 1.0, 5.0, 10, 20 and 60 seconds. The approach
speed for all experiments was 3µm/s and a rate of retract was 0.25µm/s.
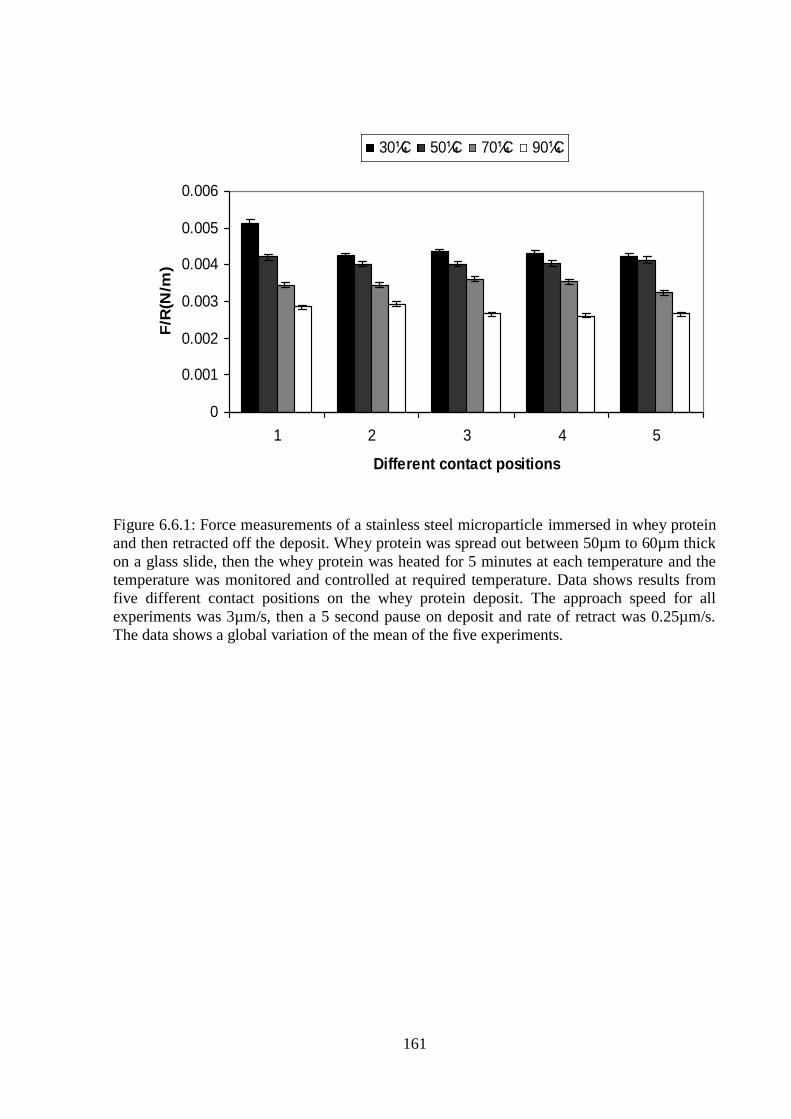
161
Figure 6.6.1: Force measurements of a stainless steel microparticle immersed in whey protein
and then retracted off the deposit. Whey protein was spread out between 50µm to 60µm thick
on a glass slide, then the whey protein was heated for 5 minutes at each temperature and the
temperature was monitored and controlled at required temperature. Data shows results from
five different contact positions on the whey protein deposit. The approach speed for all
experiments was 3µm/s, then a 5 second pause on deposit and rate of retract was 0.25µm/s.
The data shows a global variation of the mean of the five experiments.
0
0.001
0.002
0.003
0.004
0.005
0.006
1 2 3 4 5
Different contact positions
F/R
(N/m
)30¼C 50¼C 70¼C 90¼C

162
Figure 6.6.2: Force measurements of a stainless steel microparticle immersed in whey protein
and then retracted off the deposit, at variable rates on whey protein. The deposit was spread
out between 50µm to 60µm thick on a glass slide, then the whey protein was heated for 5
minutes at each temperature and the temperature was monitored and controlled at the required
temperature. The retract speed for all experiments was 0.25, 0.75, 1.00, 1.5, 3 and 5µm/s. The
tip was held on deposit for 5 seconds.
0
0.001
0.002
0.003
0.004
0.005
0.006
0.25 0.75 1 1.5 3 5
F/R
(N
/m)
30C 50C 70C 90C

163
Figure 6.6.3: Force measurements of a stainless steel microparticle immersed in whey protein
and then retracted off the deposit, at variable times on whey protein. The deposit was spread
out between 50µm to 60µm thick on a glass slide, then the whey protein was heated for 5
minutes at each temperature and the temperature was monitored and controlled at the required
temperature. The waiting times on the deposits for the experiments were 0, 0.5, 1.0, 5.0, 10,
20 and 60 seconds. The approach speed for all experiments was 3µm/s and a rate of retract
was 0.25µm/s.

164
Figure 6.7.1: Force measurements of a PTFE microparticle immersed in whey protein and
then retracted off the deposit. Whey protein was spread out between 50µm to 60µm thick on a
glass slide, then the whey protein was heated for 5 minutes at each temperature and the
temperature was monitored and controlled at required temperature. Data shows results from
five different contact positions on the whey protein deposit. The approach speed for all
experiments was 3µm/s, then a 5 second pause on deposit and rate of retract was 0.25µm/s.
The data shows a global variation of the mean of the five experiments.
0
0.001
0.002
0.003
0.004
0.005
1 2 3 4 5
Different contact positions
F/R
(N/m
)
30ºC 50ºC 70ºC 90ºC

165
Figure 6.7.2: Force measurements of a PTFE microparticle immersed in whey protein and
then retracted off the deposit, at variable rates on whey protein. The deposit was spread out
between 50µm to 60µm thick on a glass slide, then the whey protein was heated for 5 minutes
at each temperature and the temperature was monitored and controlled at the required
temperature. The retract speed for all experiments was 0.25, 0.75, 1.00, 1.5, 3 and 5µm/s. The
tip was held on deposit for 5 seconds.

166
Figure 6.7.3: Force measurements of a PTFE microparticle immersed in whey protein and
then retracted off the deposit, at variable times on whey protein. The deposit was spread out
between 50µm to 60µm thick on a glass slide, then the whey protein was heated for 5 minutes
at each temperature and the temperature was monitored and controlled at the required
temperature. The waiting times on the deposits for the experiments were 0, 0.5, 1.0, 5.0, 10,
20 and 60 seconds. The approach speed for all experiments was 3µm/s and a rate of retract
was 0.25µm/s.

167
30ºC
90ºC
Figure 6.7.4: Summary of Log force measurements of stainless steel and PTFE microparticle
immersed in caramel, SCM and whey protein. Data shows results from different contact
positions on the deposits. The approach speed for all experiments was 3µm/s, then a 5 second
pause on deposit and rate of retract was 0.25µm/s at 30ºC and 90ºC.
168
CHAPTER 7: CONCLUSIONS AND FURTHER DISCUSSIONS
The contamination of surfaces by fouling and pathogenic micro-organisms is a cause of
serious concern within the food industry. The levels of cleanability of material should be
addressed when choosing materials for process line equipment, along with their mechanical
and anticorrosive properties. A review of previous studies in the literature, largely based on
studying the surface interactions and cleaning/fouling processes showed little information on
the use of Atomic Force Microscopy (AFM) used in fouling and cleaning. The aim of this
thesis is to increase understanding of how interactions between surfaces and deposits may
control the cleaning process.
Previous work at Birmingham has led to the classification of cleaning problems into a series
of types, of which three are the most difficult to remove in practical terms:
Fluid mechanical soils; here the bonds between elements of the deposits are such that
the deposits can be cleaned with water alone; examples are personal care products
such as shampoos, deodorants and toothpaste;
Biofilms; these can form as thin layers or materials of living organisms, which have to
be cleaned using chemical that will kill the organisms as well as remove them from the
surface;
169
Diffusion-reaction soils; here the bonds between elements of the deposit, and/or
deposit and surface are such that the deposit cannot be removed by fluid action alone,
so cleaning chemical is needed to react with the deposit to enable removal; examples
are the protein or mineral-based deposits which are formed on heat exchanger surfaces
during the thermal processing of milk.
Within this project a series of deposits were chosen as representatives of the above problem
categories:
Toothpaste, a soil which can be removed by fluid mechanical action alone;
As representative of diffusion-reaction soils a series of materials have been used;
‗Turkish delight‘, ‗caramel‘ and sweetened condensed milk give cleaning problems in
confectionary processing, whilst whey proteins form the majority of the deposit in
milk pasteurisers;
The thesis concentrates on surface interactions between these different food and personal
product deposits, using AFM in force mode, to investigate the responses of different surfaces
to different foulant materials. This work will help to understand the effects of interfacial
surface parameters on the cleaning of different foulant deposits, and may aid in the
development of low-fouling and easy-to-clean surfaces.
Four different surfaces were chosen as being representative of surfaces found in industrial
practice; stainless steel, glass, ceramic and PTFE. Ceramic and stainless steel surfaces were

170
substantially rougher than the PTFE and glass surfaces. A number of ‗anti-fouling‘ surfaces
have been proposed, many of which are based around PTFE.
The AFM provides a method for detecting nanoscale information. Applications of AFM are
potentially widespread in food research; it has been used for molecular interaction, molecular
manipulation, surface topography, and deposit characterization. AFM analysis could be used
to determine physical, chemical and structural mechanisms of fouling and cleaning.
The utility of the AFM has been tested in three different studies:
(iv) To find whether different components of a fluid have significantly different effects
on the interactions between particles and surfaces, i.e. to see whether it might be
possible to change the surface interactions of a material by changing its
composition;
(v) To study whether nano-scale measurements can predict the behaviour at higher
length scales, a series of experiments were carried out in which the interaction
between deposits and different surfaces was studied using the AFM, as well as
using a micromanipulation probe to study the removal of deposits at a micron-mm
scale;
(vi) To study the variation of the adhesion forces with temperature; clearly the initial
adhesion of deposits occurs at elevated temperature, so it would be useful to
understand how the magnitude of the forces change.
171
7.1.1 Toothpaste ingredients force measurements
. AFM was employed to measure the adhesive interactions between a colloidal silica
microparticle and stainless steel, PTFE-coated stainless steel, glass and ceramic surfaces, in
the presence of a number of solutions and suspensions of ingredients found in commercially
available toothpaste. The purpose was to obtain better understanding of the aqueous
environment in which AFM adhesion force measurements were performed and to understand
interactions that may occur between the aqueous environment and ingredient solutions
In the presence of most ingredients a repulsive behaviour was observed, indicative of ionic
double layer effects, as the silica microparticle will be charged in aqueous solution. A
hydrophobic effect-type attraction was observed for the interaction between the silica
microparticle and the stainless steel and ceramic surfaces.
In the presence of saccharin solution, sodium lauryl sulphate solution, zinc citrate solution
and titanium dioxide suspension, no pull-off forces were measured for the four surfaces and a
repulsive interaction was generally observed. The data suggest that the polyanionic charge on
the silica surface, which will be deprotonated in aqueous solutions such as zinc citrate and the
other solutions mentioned above, dominates the interaction. Stainless steel, glass and ceramic
surfaces all have oxygen-rich surface chemistries, in the form of chromium oxide, silicon
dioxide and aluminium oxide.
A ‗‗hydrophobic effect‘‘ deflection-displacement curve is seen, in which an adhesion force is
seen to result from the interaction between the silica attached tip and stainless steel surface in
presence of HPLC water. This interaction also occurs with the ceramic surface. It has
previously been established that for hydrophobic surfaces immersed in water, an attractive
172
force exists that cannot be accounted for by dispersion forces alone [Mantel, et al. 1995]. The
origin of the hydrophobic effect is often believed to be changes in water structure adjacent to
hydrophobic surfaces, which are entropically unfavourable and impose a new, more ordered
structure on the water molecules. This gives rise to an attractive force between silica and
surfaces. In water, both ceramic and stainless steel surfaces exhibit a long-range attractive
interaction with the silica microparticle and this interaction is indicative of a hydrophobic
force. The oxide-terminated stainless steel and ceramic surfaces could give rise to such a
force, whereas the glass surface would not be expected to, and indeed does not, as the glass
surface is terminated with silicon hydroxide moieties.
One component of the toothpaste, sorbitol solution, shows strong adhesive interactions of
1.70mN/m between stainless steel surfaces discs using the silica microparticle. Sorbitol is
used as humectant in many types of products for protection against loss of moisture content,
both in oral care products, such as toothpaste and mouthwash, food products such as chewing
gums, cookies and cakes, as well as in glues and sticky tapes to help retain adhesive
properties. [Britten 1998].
Of the four surfaces only stainless steel exhibited an adhesive interaction with the silica
microparticle in sorbitol solution. Conclusions were:
Contact angle measurements showed that the different surfaces behave differently
with a drop of water and sorbitol.
AFM found different types of behaviour in the presence of saccharin solution, sodium
lauryl sulphate solution, sorbitol, zinc citrate solution and titanium dioxide suspension.

173
7.1.2 Comparison between measurements using Atomic Force Microscopy to those of
Micromanipulation.
No previous work has attempted to study the interactions between interfacial measurements at
two length scales. It was valuable to do this for a range of reasons, firstly to develop ways of
testing surfaces for their fouling potential and cleanability and to identify the smallest scale
relevant results that can be obtained.
The soils investigated here generally adhere most strongly to the glass surface with the
exception of Turkish delight. The results suggest that the general behaviour with the deposit
and microparticle is as follows; glass provides the largest adhesion, then stainless steel and
PTFE. The data suggests that PTFE surfaces would in general be better than stainless steel in
terms of reducing fouling or cleaning. The use of PTFE-based surfaces in fouling reduction is
discussed in Chapter two of the thesis; however there is a difficulty in making reproducible
and cheap PTFE coated equipment.. It is clear that this sort of surface can give either reduced
fouling or more effective cleaning.
This work has used AFM and micromanipulation equipment to identify adhesive and cohesive
effects in the cleaning of food deposit. The caramel deposits are essentially highly cohesive
(physical properties of deposits cause intermolecular attraction between like-molecules). On
the other hand, SCM, Turkish delight and toothpaste are highly adhesive results suggest that
for the SCM, toothpaste and Turkish delight, the cohesive forces between elements of the
deposits are weaker (loosely bound) than those of adhesion between surface and deposits,
which is opposite to the behaviour of caramel. Thus, it is easier to remove the whole of the
caramel deposit than to remove a surface layer. This indicates the AFM and

174
micromanipulation technique can identify the different mechanical properties of fouling
deposits.
In both measurement methods the results show caramel to display adhesive failure and
toothpaste, Turkish delight and SCM to show cohesive failure. The PTFE surface generally
shows lower adhesion using both AFM and micromanipulation. Both measurement methods
measure adhesion forces, however the size of the force is larger with micromanipulation due
to the sample contact requiring deformation of the solid as well as contact between deposit
and surface. The AFM measures the force at smaller scale length than the Micromanipulation.
AFM is a more sensitive measurement method, but significantly more parameters are required
to set up experiments, such as the right size of particle and the right cantilever stiffness. Also
it is not known until till the experiment is performed how much z-range is required. In
comparison the micromanipulation is simple to use and set up. Most deposits are easily
compatible, compared to the AFM. The AFM requires more preparation to set up an
experiment. Both methods show similar behaviour with each deposit. The micromanipulation
and AFM show similarities in adhesion forces with the deposits; however, the range of
adhesion is on two different length scales, making it very difficult to compare. It is clear that,
as found by other workers, the surface energy affects the force required for removal.
AFM and micromanipulation are both beneficial tools for the measure of adhesion. AFM
works at nm-scale whilst micromanipulation measures at µm-mm scale. The aim of this work
was to see to what extent the two methods give the same results. The removal technique for
the deposits in AFM and micromanipulation is different. AFM measures the vertical force of
removal of the particle from a surface, whilst the micromanipulation pulls horizontally to get
the adhesion force. A range of results we obtained exhibited that in some cases AFM and
175
micromanipulation data agree well, for example PTFE shows lowest forces with all deposits
with both techniques. However, some effects are seen with AFM and micromanipulation
behaviour differs. For example the sizes of the forces are greater with micromanipulation.
7.1.3 Atomic Force Microscopy (AFM) experiments of caramel, whey protein, and SCM
deposits at different temperatures.
The effects of temperature on fouling and cleaning of materials, which are known to be
thermally labile are studied. Cleaning rates, are known to be temperature-dependent. To
identify whether the data would be of value in fouling, AFM force measurements experiments
have been conducted over a range of temperatures, approach, retraction rates, contact
positions, surfaces and contact times. The following conclusions can be made:
Temperature changes the food deposits structure as well as increasing the rates of
reactions, which create deposits, such as protein denaturation and aggregation. By
comparison to the forces found at room temperature, the increase in temperature
causes adhesion forces to decrease at different contact points.
The time the tip sits on the food deposits does not affect adhesion behaviour. The
adhesion is similar or consistent at all times, but varies with temperature. This is
similar to micromanipulation.
The rate of retraction on the deposits causes some variability in the adhesion
behaviour. The effect on adhesion with approach and retraction rates is not
predictable.

176
The two surfaces used PTFE and stainless steel, show that adhesion occurs with both but
is lesser with PTFE than stainless steel. The results show similar effects –
micromanipulation and AFM data appears to be comparable, suggesting that it is possible
to use AFM to study cleanability.
The experiments show that the forces of adhesion are much less at high temperature than
at low temperatures. This is especially interesting as fouling deposits form at high
temperatures; such as the 60-100ºC at which caramel is processed, and the 70-90ºC for
milk pasteurisation, which causes deposition of Type A protein-rich deposit. Deposits
must form at these high process temperatures, but the adhesive forces are very small –
much smaller than would be predicted by doing experiments with AFM and
micromanipulation at room temperature. It is interesting that the trends of the
measurements at room temperature are the same as those at high temperatures. Any
effective models for fouling must account for adhesion of deposits onto surfaces with the
low adhesion forces seen here, such as for whey protein and stainless steel. The effect of
these forces must be greater than the effect of surfaces shear in creating a deposit. The
results suggest that equipment or flow regime to resist fouling at temperatures will be
overdesigned if data for adhesion at room temperature is considered. This is a potentially
important result: data at room temperature for cleaning is much easier to obtain than at
high temperature.
The results suggest that only by doing experiments on measuring adhesion at real process
temperatures will an accurate measurement be obtained. This is especially important if we
are to use computational models for fouling and cleaning, in which the shear stress on the
surfaces of plant or deposit can be predicted. The forces measured at room temperature are

177
a significant overestimate of those, which are found at high temperature. Of course it is
well known that cleaning becomes easier at high temperatures but these results allow
quantification of it.
It was expected that the adhesion force between particle and surface would increase with
time as – for example, whey protein denaturation and aggregation proceeds and bonds
form. The data suggests that these reactions have little effect on the adhesion forces, at
least as measured by AFM; more work needs to be done to determine what effects, if any,
reaction processes have on adhesion at these temperatures.
7.1.4 Future work
The adhesion behaviour of variety of deposits has been investigated on different surfaces.
Different ranges of temperatures, rates of removal, positions and at different contact times
were tested to investigate AFM in process engineering. Results have provided useful
information on the mechanisms involved in cleaning. Further work could be carried out to
determine adhesion behaviour over a greater range of surfaces and cleaning conditions
and deposit types to increase knowledge of AFM in the processing industry.
It would be useful to develop a technique that could quantify the removal of deposits
visually. The image analysis program used could not record all movement of tip to deposit
effectively on the AFM. This could help to make better analysis on removal modes, and
also to make quantification of the amount remaining on the surface.
178
Further work can be pursued on chemically treated surfaces and worn surfaces, to see
differences in force measurements. However, the limiting factor in applying AFM to food
research is the lack of appropriate methodology for different food deposits. Increasing
understanding on AFM technology and developing corresponding methodology for
complicated food deposit systems, could lead to a more detailed understanding of cleaning at
macromolecular and nanometre levels.
The capability of the AFM to provide better understanding of materials structure, surface
characteristics and the interactive forces at the meso- and nanoscale level. The AFM will
enhance the understanding of large-scale engineering processes, especially as materials are
increasingly being designed down to the submicrometre level.

179
REFERENCES
Adams, E. Kroon, A. Williamson, G. Morris, J. (2003) Characterisation of heterogeneous
arabinoxylans by direct imaging of individual molecules by atomic force microscopy.
Carbohydrate Research, 338, 771–80.
Allen, S. Davies, M. Roberts, C. Tendler, S. Williams, P. (1997) Atomic force microscopy in
analytical biotechnology. Tibtech 15, 101-105.
Amoudi, A. Robert, W. Lovitt, R. (2007) A Review article Fouling strategies and the cleaning
system of NF membranes and factors affecting cleaning efficiency. Journal of Membrane
Science 303, 4–28.
Asthana, R. Sobczak, N. (2000) Wettability, Spreading, and Interfacial Phenomena in High-
Temperature Coatings. JOM-e, 52 (1).
Aziz, N. Fryer, P. Zhao, Q. (2006) Effect of electroless Ni-P based composite coating with
different surfaces free energies on cleaning of tomato fouling deposit. Fouling, cleaning&
Disinfection in Food conference, Cambridge.
Baier, R.E. (1970) Surface properties influencing biological adhesion. In R.S.Manly (Ed)
Adhesion in Biological Systems. Academic Press, New York, USA. 5, 15-67.
Barnes, L. Lo, F. Adam, R. Chamberlian, L. (1999) Effect of milk protein on adhesion of
bacteria on stainless steel surfaces. Appl EnV Microboil 67, 2319-2325.

180
Belmar-Beiny, M. T. Fryer, P. J. (1992). Bulk and surface effects on the initial stages of whey
fouling. Trans IChemE 70(C) 193-199.
Berdyyeva, C.D. Woodworth, I. Sokolov. (2005) Silica Nanoparticles to Polish Tooth
Surfaces for Caries Prevention, Phys. Med. Biol. 50, 81.
Beuf, M. Rizzo, G. Leuliet, J. Müller-Steinhagen, H. Yiantsios, S. Karabelas, A. Benezech, T.
(2003) Potency of stainless steel modifications in reducing fouling and increasing cleaning of
plate heat exchangers processing dairy products. In: Heat Exchanger Fouling and Cleaning
Fundermentals and Applications, Santa Fe, New Mexico, USA.
Binnig, G. Quate, F. Gerber, C. Phys. Rev. Lett., (1986) 56, 930 – 933.
Blel, W. Legentilhomme, P. Bénézech, T. Legrand, J. Le Gentil-Lelièvre, C. (2008)
Application of turbulent pulsating flows to the bacterial removal during a cleaning in place procedure.
Part 1: Experimental analysis of wall shear stress in a cylindrical pipe. Journal of Food
Engineering.
Bott, T.R. (1995) Fouling of heat exchangers, Elsevier, New York.
Boulangé-Petermann, L. (1996) Processes of bioadhesion on stainless steel surfaces and
cleanability: a review with special reference to the food industry. Biofouling 10, 275-300.
Boulange-Petermann, L. Rault, J. Bellon-Fontaine, N. (1997) Adhesion of Streptococcus
thermophilus to stainless steel with different surface topography and roughness. Biofouling
11, 201-216.

181
Bowen, R. Lovitt, J. Wright (2000) The influence of ionic strength, nutrients and pH on
bacterial adhesion to metals. J. Colloid Interface Sci. 228, 428–433.
Boyd, R.D. Cole, D. Rowe, D.L. Verran, J, Coultas, S.J. Paul, A.J. West, R.H. Goddard, D.T.
(2000) Surface characterisation of glass and poly(methylmethacrylate) soiled with a mixture
of fat, oil and starch. Journal of Adhesion Science and Technology. 5, 13-23.
Britten, M. Green, M. Boulet, M. Paquin, P. (1988) Deposit formation on heated surfaces:
effect of interface energetic. Journal of Dairy Research 55, 551-562.
Burfoot, D. Middleton, K. (2008) Effects of operating conditions of high pressure washing on the removal
of biofilms from stainless steel surfaces. Journal of Food Engineering. 5, 23-44.
Burgess, J. (1999) Ions in Solution: Basic Principles of Chemical Interactions. 2nd Edition,
Horwood Publishing (Chichester), 16, 45-89.
Callow, J. Ista, L. Lopez, P. (2007) The Influence of Surface Wettability on the Adhesion
Strength of Settled Spores of the Green Alga Enteromorpha and the Diatom Amphora. Integr.
Comput. Biol. (2002), 42, 1116.
Carambassis, A. Rutland, M.W. (1999) The Charging Properties of Monodisperse Colloidal
Silica in Symmetrical Quaternary Ammonium Ion Solutions. Langmuir, 15, 5584-5590.
Changani, D. BelmarBeiny, T. and Fryer, J. (1997) Engineering and chemical factors
associated with fouling and cleaning in milk processing. Experimental Thermal and Fluid
Science 14, 392-406.
182
Chen, Y.L. Helm, C.A. Israelachvili, J.N. (2008) Measurements of the Elastic Properties of
Surfactant and Lipid Monolayers. J. Phys. Chem. 95, 10736-10747.
Christian, G.K. (2003) PhD: Cleaning of carbohydrate and dairy protein deposits. University
of Birmingham, Birmingham, UK.
Clear, S.C. Nealey, P.F. (1999) Chemical force microscopy study of adhesion and friction. J.
Colloid. Interf. Sci., 213, 238-250.
Cleveland, J.P. Manne, S. Bocek, D. Hansma, P.K. (1996) Choosing AFM Probes for
Biological Applications Rev. Sci. Instrum. 64, 403-405.
Corrieu, G. (1981) State of the art of cleaning surfaces. Fundamentals and Application of
Surface Phenomena Associated with Fouling and Cleaning in Food Processing. Division of
Food Engineering, Lund University, Lund, Sweden.
Digital Instruments Veeco Metrology Group, MultiMode™ SPM Instruction Manual Version.
Ducker, W.A. Senden, T.J. Pashley, R.M. (1991) Role of hydration and water structure in
biological and colloidal interactions, Nature, 353, 239 - 241.
Ducker, W. Tim, J. Senden. (1992) Measurement of forces in liquids using a force
microscope, Langmuir 8, 1831-1836.
Epstein, N. (1983) Fouling in heat exchangers. In J.Taborek, G.F.Hewitt, and N.Afgan (Eds)
Heat Exhangers: Theory and Practice. Hemisphere Publishing Corp., Washington, USA.

183
Fermandez-Torres, M.J. Fitzgerald, A. M. Paterson, W.R. Wilson, D. I. (2001) A Theoretical
study of freezing fouling: limiting behaviour based on a heat and mass transfer analysis,
Chemical Engineering and Processing, 40, 335-344.
Finlay, A. Callow, Ista,
K. Lopez. (2002) The Influence of Surface Wettability on the
Adhesion Strength of Settled Spores of the Green Alga Enteromorpha and the Diatom
Amphora School of Biosciences, University of Birmingham. Integrative and Comparative
Biology by The Society for Integrative and Comparative Biology, 42.
Friis, A. Jensen, B. (2002) Prediction of Hygiene in Food Processing Equipment Using Flow
Modelling, Food and Bioproducts Processing, 80, 4, 2002, 281-285.
Fryer, P. Asteriadou. K. (2009) A prototype cleaning map: a classification of industrial
cleaning processes. Trends in Food Science & Technology 20, 6-7, 255-262.
Foster, C. L. Green, M. L. (1990) A model heat-exchange apparatus for the investigation of
fouling of stainless steel surfaces by milk II. Deposition of fouling material at 140ºC, its
adhesion and depth profouling. Journal of Dairy Research 57 339-348.
Gibson, C.T. Smith, D.A. Roberts, C.J. (2005) Calibration of the spring constants of various
AFM cantilevers with the small uncertainty level of 2%. Nanotechnology 16, 234-238.
Gibson, C.T. Watson, G.S. Myhra, S. (1996) Resonance Response of Scanning Force
Microscopy Cantilevers. Nanotechnology, 7, 259-262.
Gillham C.R. (1997) Enhanced cleaning of surfaces fouled by whey proteins. University of
Cambridge, Cambridge, UK. 46, 3, 199-209.
184
Grandhee. Monnier. V.M. (1991) Mechanism of formation of the Maillard protein cross-link
pentosidine. Glucose, fructose, and ascorbate as pentosidine precursors. J. Biol. Chem 266
(18): 11649–11653.
Grasshoff, A. (1997) Cleaning of heat treatment equipment. For: IDF monograph, Fouling
and cleaning in Heat Exchangers. 90, 4, 433-440.
Gotham, S.M. (1990) Mechanisms of protein fouling in heat exchanger. PhD Thesis,
University of Cambridge, Cambridge, UK.
Gotham, S.M. Fryer P.J. Pritchard A.M. (1989) Model studies of food fouling. In H.G.Kessler
and D.B.Lund (Eds). Fouling and Cleaning in Food Processing, Munich University, FRG.
Hankinso, D.J. Carver, C.E. (1968) Fluid dynamic relationships involved in circulation
cleaning. Journal of Dairy Science 51, 1761-1768.
Hasting (Eds) Fouling, Cleaning and Disinfection in Food Processing. Deparment of
Chemical Engineering, University of Cambridge, Cambridge, UK.
Haynes,C.A. Norde,W. (1994) Globular proteins at solid/liquid interfaces. Colloids and
surfaces.B.Biointerfaces 2, 517-566.
Helalizadeh, A. Müller-Steinhagen, H. Jamialahmadi, A. (2000) Mixed salt crystallisation
fouling. Chemical Engineering and Processing 39, 1, 29-43.
Herrmann, P.S.P. Yoshida, C.M.P. Antunes, A.J. Marcondes, J.A. (2004) Surface evaluation
of whey protein films by atomic force microscopy and water vapour permeability analysis.
Packaging Technology and Science 17, 267–273

185
Hilal, N. Bowen, R. (2009) Atomic force microscopy in process engineering. ISBN-13: 978-
1-85617-517-3.
Hodge, R. Rousseau, D. (2003) Flocculation and coalescence in water-in-oil emulsions
stabilized by paraffin wax crystals Food Research International, 36, 7, 695-702.
Holt, C. Geoffrey, B. Jameson, G. Gillian, E. Norris. (2002) International Dairy Journal, 12
4, 2002, 299-310.
Hu, K. Bard, A.J. (1997) Electrochemical Properties of Mixed Self-Assembled Monolayers
on Gold Electrodes Containing Mercaptooctylhydroquinone and Alkylthiols. Langmuir, 13,
5114-51192
Kane, D. R. Middlemiss, N. E. (1985). Cleaning chemicals- state of the knowledge in 1985. in
Fouling and Cleaning in Food Processing, eds Lund, D. B. Plett E. and Sandu C., Wisconsin,
USA. 312-355.
Iler, R.K. (1979) The Chemistry of Silica: Solubility, Polymerisation, Colloid and Surface
Properties, and Biochemistry, John Wiley and Sons (New York; Chichester). 8,13-67.
Israelachvili, J, (1987) Solvation Forces and Liquid Structure, As Probed by Direct Force
Measurements Acc. Chem. Res., 20, 415-421.
Jennings, W. G. McKillop, A. A. Luick, J. R. (1957). Circulation cleaning. J of Dairy Science
40 1471-1479.
Jullien, C. Benezech, T. Le Gentil, C. Boulange-Petermann, L. Dubois, PE. Tissier, J.P.
Traisnel, M. Faille, C. (2008) Physico-chemical and hygienic property modifications of
stainless steel surfaces induced by conditioning with food and detergent, Biofouling, 24, 163
– 172.

186
Kanda, Y. Murata, T. Higashitani, K. (1999) Physicochemical and Engineering Aspects,
Colloid Surface A, 154, 157-166.
Karlsson, A-C. (1999). Fouling and Cleaning of Solid Surface: The influence of surface
characteristics and operating conditions. Lund University, Sweden, 5, 28-33.
Kerber, J. S. PhD. (2000) President of Material Interface, Inc.
Kerner, R. Phillips, J. C. (2000) Quantitative principles of silicate glass chemistry, Solid State
Communications. 117, 1, 47-51.
Koops, J. Kerkhof, M.F. (1965) Adsorption of euglobulin on agglutinating milk fat globules
Biochimica et Biophysica Acta (BBA) - Biophysics including Photosynthesis, 94, 2, 29,576-
578
Lee, J. Cartwright, R.. Grueser, T. Pascall, M.A. (2007) Efficiency of manual dishwashing
conditions on bacterial survival on eating utensils. Journal of Food Engineering 80, 885–891.
Lent LE, Vanasupa LS, Tong PS. (1998). Whey protein edible film structures determined by
atomic force microscope. J Food Sci 63(5):824–7.
Liang, H. (2004). Surface science.VCH Publishers, Inc., New York, USA. 565, 173-179
Liu, W, Aziz, N.A. Zhang, Z. Fryer, P.J. (2007) Quantification of the cleaning of egg albumin
deposits using micromanipulation and direct observation techniques. Journal of Food
Engineering 78, 217-224.
Liu, W. Christian, G.K. Zhang, Z. Fryer, P.J. (2002) Development and use of a
micromanipulation technique for measuring the force required to disrupt and remove fouling
deposits. Food and Bioproducts Processing 80, 286-291.

187
Liu, W. Fryer, P.J. Aziz, Ab. Bridson, N. Zhang, Z. Zhao, Q. Liu, Y. (2005) Cohesion and
Adhesion in the Cleaning of Food Fouling Deposits, to be presented at World Congress of
Chemical Engineering. 61, 6, 2079-2084
Liu, W. Christian, G.K., Zhang, Z., Fryer, P.J. (2006) Direct measurement of the force
required to disrupt and remove fouling deposits of whey protein concentrate. International
Dairy Journal 16, 164-172.
Lower, C.J. Tadanier ,M.F. Hochella, Geomicrobiol. J (2001), Measuring interfacial and
adhesion forces between bacteria and mineral surfaces with biological force microscopy. Int.
J. Sys. Bacteriol 18 63– 76.
Mantel, M. Rabinovich, Y.I. Wightman, J.P. Yoon, R.-H. (1995) A Study of Hydrophobic
Interactions between Stainless Steel and Silanated Glass Surface Using Atomic Force
Microscopy. Journal of Colloid and Interface Science, 170, 203-214.
Martin, H.K. Wickramasinghe, (1987), Optical absorption microscopy and spectroscopy with
nanometre resolution. Appl. Phys. Lett. 50, 1455.
Morris, V.J., 2004. Probing molecular interactions in foods. Trends in Food Science and
Technology 15, 291–297.
Morris, V.J. Kirby, R. Gunning, A.P. (1999). Atomic force microscopy for biologists,
London: Imperial College Press. 21, 4, 617-629.
Morris, V.J. Mackie, A.R. Wilde, P.J. Kirby, A.R. Mills, E.C.N. Gunning, A.P. (2001).
Atomic force microscopy as a tool for interpreting the rheology of food biopolymers at the
molecular level. Lebensmittel-Wissenschaft and Technologie 34, 3–10.
Müller-Steinhagen, H. (2000) Heat Exchanger Fouling, Mitigation and Cleaning
Technologies. IChem, ISBN 0 85295 436 0.

188
Müller-Steinhagen H. Malayeri M.R. Watkinson P. (2005) Heat Exchanger Fouling and
Cleaning - Challenges and Opportunities. In H.Müller-Steinhagen, M.R.Malayeri, and
Watkinson (Eds) Heat Exchanger Fouling and Cleaning - Challenges and Opportunities.
Engineering Conferences International.
Myres, D. (1991). Surfaces, interfaces and colloids: principles and applications. VCH
Publishers, Inc., New York, USA. 5,12-14.
Nakao, H. Hayashi, H. Karasawa H. Hirano K. Sugiyama S. Ohtani T. (2005) Fabricating and
aligning π-conjugated polymer-functionalized DNA nanowires: atomic force microscopic and
scanning near-field optical microscopic studies. Langmuir 21, 7945–50.
Nermen, M.G. Nakhla, W. Wan. (2009) Comparative assessment of hydrophobic and
hydrophilic membrane fouling in wastewater applications. Journal of Membrane Science,
339, 1-2, 1, 93-99.
Norde,W. (1986) Adsorption of proteins from solution at the solid-liquid interface. Advances
in Colloid and Interface Science 25, 267-340.
Parbhu A. Danne, M. Hendy, S. (2006) Reducing milk protein adhesion rate: a transient
surface treatment of stainless steel, Fouling, cleaning and Disinfection in food processing
conference, Cambridge, 8-15.
Parbhu, A. Lee, A. N. Thomsen, S. J. Siew, D. C. W. (2002) Atomic force microscopy
applied to monitoring initial stages of milk fouling on stainless steel, Fouling, cleaning and
Disinfection in food processing. 333-239.
Park, D. Koch, R. Cardenas, J. Kas, C.K. Dynamics of cell membranes and the underlying
cytoskeletons observed by noninterferometric widefield optical profilometry and fluorescence
microscopy Biophys J. (2005) 89.
189
Raghavan, D. Gu, X. Nguyen, T. Vanlandingham, M. (2001). Characterization of chemical
heterogeneity in polymer systems using hydrolysis and tapping-mode atomic force
microscopy. Journal of Polymer Science 39, 1460–1470.
Rankin, B.H, Adamson, W.L. (1973) Scale formation as related to evaporator surface
conditions. Desalination 13, 63-87.
Rosaninho, R. Rizzo, G. Müller-Steinhagen, H. and Melo, L. F. (2003) The influence of bulk
properties and surface characteristics on the deposition process of calcium phosphate on
stainless steel. In: Heat Exchanger Fouling and Cleaning Fundamentals and Applications,
Santa Fe, New Mexico, USA.
Rosmaninho, R. Rizzo, G. Müller-Steinhagen, H. Melo, F. (2005) "Anti fouling stainless steel
based surface for milk heating processes in "Heat Exchanger Fouling and Cleaning, German
Aerospace Centre, Stuttgart, Germany, the University of British Columbia, Canada Eds, ECI
Symposium Series, Volume RP2.
Round, N. Rigby, M, MacDougall, J. Ring, G. Morris, J. (2001) Investigating the Nature of
branchingin pectin by atomic force microscopy and carbohydrate analysis. Carbohydrate
Reserach 331, 337–42.
Sader, J.E. Pacifico, J. Green, C.P. Mulvaney, P. (2005) AFM Cantilevers - Calibration.
J. Appl. Phys, 97, 124903.
Sakiyama T., Nagata A., Nagai T., Saeki Y., & Nakanishi K. (1996) Adsorption of β-
lactoglobulin onto stainless steel particles and its desorption behaviour in alkaline and

190
proteolytic enzyme solutions. In P.J.Fryer, A.P.M.Hasting, and J.M.Jeurnink (Eds). Fouling
and Cleaning in Food Processing 93-100. European Commission, Brussels.
Saygil, G. Ahmali. (2003) Effect of ceramic surface treatment on the shear bond strengths of
two resin luting agents to all-ceramic materials, Journal of Oral Rehabilitation 30, 758–764.
Schmutz, P. Frankel, G.S. (1998) Corrosion study of AA2024–T3 by scanning Kelvin probe
force microscopy and in situ atomic force microscopy scratching. Journal of the
Electrochemical Society 145, 2295–2306.
Schmidt, D.L. Brady Jr. R.F. Lam, K. Schmidt, D.C. Chaudhury, M.K (2004) Contact angle
hysteresis, adhesion, and marine biofouling. Langmuir 20, 2830–2836.
Schmutz, P. Frankel, G.S. (1999) Influence of dichromate ions on corrosion of pure
aluminium and AA2024–T3 in NaCl solution studied by AFM scratching. Journal of the
Electrochemical Society 146, 4461–4472.
Schmidt, R.H. (1998) Basic Elements of Equipment Cleaning and Sanitizing in Food
Processing and Handling Operations. Institute of Food and Agricultural Sciences Extension,
University of Florida. 5, 33-79.
Senden, T.J. (2001) Force microscopy and surface interactions Curr. Opin. Colloid In., 6, 95-
101.
Sharma, A., Garg, D., and Gupta JP. (1982) Solidification fouling of paraffin wax from
hydrocarbons, Letters in heat and mass transfer, 9, (3): 209-219.
Shaw, Introduction to Colloid and Surface Chemistry. ISBN-13: 978-0750611824
Sheng, X. Yen, P. (2007) Force measurements of bacterial adhesion on metals using a cell
probe atomic force microscope, Journal of Colloid and Interface Science, 310(2), 661-669.

191
Simmons, M.J.H. Jayaraman, P. Fryer, P.J (2007) The effect of temperature and shear rate
upon the aggregation of whey protein and its implications for milk fouling, Journal of Food
Engineering, 79, 517-528.
Sokolov, S. Iyer, D. Woodworth, (2006) Nanomed. Nanotechnol. Biol. Med. 2, 31.
Somercales, E. F. C. (1988) Fouling of heat transfer surfaces: an historical review. 25th
Nat.
Heat. Trans. Conf. ASME. Houston.
Tamime. A (2008) Cleaning-In- Place: dairy, food and beverages, 3rd
(Ed) ISBN: 978-1-4051-
5503-8
Tadmor, R. (2004). Line energy and the relation between advancing, receding and Young
contact angles. Langmuir, 20, 7659-7664. ISBN 0743-7463.
Thalhammer, W. Heckl, M. Zink, A. Nerlich, A. G. (2000) Atomic Force Microscopy for
High Resolution Imaging of Collagen Fibrils—A New Technique to Investigate Collagen
Structure in Historic Bone Tissues. 41, 12-46.
Timperley, D. A., Smeulders, C. N. M. (1987). Cleaning of dairy HTST plate heat
exchangers: comparison of single- and two-stage procedures. Journal of the society of Dairy
Technology 40, 1, 4-7.
Torii, A. Sasaki, M. Hane, K. Okuma, S. (1996) Surface Mechanical Property Determination
of Soft Materials Through an AFM Nanoindentation Experiment, Meas. Sci. Technol., 7, 179-
184.
192
Verran J, (2002) Biofouling in food processing: biofilm or biotransfer potential?
TransIChemE, 80, 292 – 298.
Verran, J. (2006) The effect of substratum surface topography on the retention of micro-
organisms and organic material on defined surfaces. Fouling, Cleaning and Disinfection in
Food Processing. Deparment of Chemical Engineering, University of Cambridge, Cambridge,
UK.
Watkinson, P. Müller-Steinhagen, H. Malayeri, M.R. (2003) Heat exchanger fouling and
cleaning: Fundamentals and applications. Engineering Conferences International, USA.
Weiss, A. Bird, M .R. Chukwuemeka, J. K. and Price, Wilson et al, (2002) Effect of surface
coating on platelet count drop during cardiopulmonary bypass R. TransIChemE 151-164.
Wilson, D.I. Chew, J.Y.M. Fryer, P.J. Hasting A.P.M. (2006) Fouling, Cleaning &
Disinfection in Food Processing. Fouling, Cleaning & Disinfection in Food Processing.
Department of Chemical Engineering, University of Cambridge, Cambridge, UK.
Whitehead, K. Verran, J. (2006) The effect of substratum surface topography on the retention
of micro-organisms and organic material on defined surfaces. TransIChemE 5,12-19.
Woo, M.W. Daud, W.R.W. Tasirin, S.M. Talib, M.Z.M. (2009) Controlling food powder
deposition in spray dryers: Wall surface energy manipulation as an alternative Journal of
Food Engineering, 94, 2,192-198.
193
Wu, Z. Hongbing, Chen, Yaming, D, Huiling, M, Jielin, S, Shenfu, C, Vincent, S.J. Craig,
J.H. (2008) Cleaning using nanobubbles: Defouling by Journal of Colloid and Interface
Science, 328, 1.
Victo, J. Alan, R. Wilde, Kirby, E. Clare, N. Mills, A. (2000) Atomic Force Microscopy as a
Tool for Interpreting the Rheology of Food Biopolymers at the Molecular Level Gunning
Institute of Food Research, Norwich Research Park, Colney, Norwich. 29, 44-67.
Yada R.Y. Jackman R.L. Smith J.L. Payie K.G. Tanaka T. (2000) Proteins: Denaturation and
food processing. In F.J.Francis (Ed) Encyclopedia of food science and technology. John Wiley
& Sons, Inc., New York, USA. 4, 45-67.
Yongan, Gu D. L. (1998), A Model for a Liquid Drop Spreading on a Solid Surface Colloids
and Surfaces A: Physicochemical and Eng Aspects 142, 243-256.
Yoon, J. Lund, D.B. (1994) Magnetic treatment of milk and surface treatment of plate heat
exchangers: effects on milk fouling. Journal of food science 59, 964-969.
Yun-ren, Q.I.U. Hong, Zhong, Qi-xiu, Zhang, (2009) Treatment of stable oil/water emulsion
by novel felt-metal supported PVA composite hydrophilic membrane using cross flow
ultrafiltration. Transactions of Nonferrous Metals Society of China, 19(3), 773-777.
Zettler, H.U. Weiss, M. Zhao, Q. and Müller-Steinhagen, H. (1999). Modification of heat
exchanger plates for reduced fouling deposition. Transactions of the IMechE, 6th UK
National Heat Transfer Conference, 125-132.
Zhao, Q. Liu, Y. Müller-Steinhagen, H. (2002). Graded Ni-P-PTFE coatings and their
potential applications. Surfaces and Coatings Technology 155, 279-284.