the future of electricity resource planning · lavin’s recent work includes studies valuing...
TRANSCRIPT
THE FUTURE OF ELECTRICITY RESOURCE PLANNING
Fredrich Kahrl1, Andrew Mills2, Luke Lavin1,
Nancy Ryan1 and Arne Olsen1 1Energy and Environmental Economics, Inc.; 2Lawrence Berkeley National Laboratory
Project Manager and Technical Editor:
Lisa Schwartz, Lawrence Berkeley National Laboratory
LBNL-1006269
Report No. 6
September 2016

Future Electric Utility Regulation / Report No. 6 ii
About the Authors Dr. Fredrich Kahrl is a director at the consulting firm Energy and Environmental Economics, Inc. (E3), where he leads the firm’s research efforts and coordinates international work. Kahrl has worked on electricity planning, markets, and regulation in a variety of state and national contexts. He received M.S. and Ph.D. degrees in energy and resources from the University of California, Berkeley, and a B.A. in philosophy from the College of William & Mary.
Dr. Andrew D. Mills is a research scientist in the Electricity Markets and Policy Group at Lawrence Berkeley National Laboratory. He conducts research and policy analysis on renewable resources and transmission, including power system operations and valuation of wind and solar. Mills has published his research in leading academic journals and was a contributing author to the International Panel on Climate Change’s Fifth Assessment Report and Special Report on Renewable Energy Sources and Climate Change Mitigation. Previously, Mills worked with All Cell Technologies, a battery technology start-up company. He has a Ph.D. and M.S. in energy and resources from University of California, Berkeley, and a B.S. in mechanical engineering from the Illinois Institute of Technology.
Luke Lavin is an associate at E3, working primarily in the distributed energy resources and resource planning groups. Lavin’s recent work includes studies valuing energy storage, distributed solar PV, and other distributed energy resources, as well as work on the California Public Utilities Commission’s implementation of a 50 percent renewable portfolio standard. He holds a B.A. in physics and anthropology from Amherst College.
Dr. Nancy E. Ryan is a partner at E3, where she leads its work on transportation electrification and works across the firm on policy and strategy projects for a diverse array of public- and private-sector clients. Previously, Ryan served on the California Public Utilities Commission, where she also held a series of high level positions, including Commissioner. She holds a Ph.D. in economics from the University of California, Berkeley, and a B.A. in economics from Yale University.
Arne Olson is a partner at E3, where he leads the company’s resource planning group. Olson has worked extensively with regulators and utilities on resource planning in a number of states, including California, Colorado, Oregon, Idaho, Washington and Wyoming. He earned B.S. degrees in mathematical sciences and statistics from the University of Washington, and an M.S. degree in International energy management and policy from the University of Pennsylvania and the École Nationale Supérieure du Pétrole et des Moteurs of the Institut Français du Pétrole.

Future Electric Utility Regulation / Report No. 6 iii
The work described in this technical report was funded by the Electricity Policy Technical Assistance Program of the U.S. Department of Energy’s Office of Electricity Delivery and Energy Reliability under Lawrence Berkeley National Laboratory Contract No. DE-AC02-05CH11231.
Disclaimer
This document was prepared as an account of work sponsored by the United States Government. While this document is believed to contain correct information, neither the United States Government nor any agency thereof, nor The Regents of the University of California, nor any of their employees, makes any warranty, express or implied, or assumes any legal responsibility for the accuracy, completeness, or usefulness of any information, apparatus, product, or process disclosed, or represents that its use would not infringe privately owned rights. Reference herein to any specific commercial product, process, or service by its trade name, trademark, manufacturer, or otherwise, does not necessarily constitute or imply its endorsement, recommendation, or favoring by the United States Government or any agency thereof, or The Regents of the University of California. The views and opinions of authors expressed herein do not necessarily state or reflect those of the United States Government or any agency thereof, or The Regents of the University of California.
Ernest Orlando Lawrence Berkeley National Laboratory is an equal opportunity employer.
Future Electric Utility Regulation / Report No. 6 iv
Future Electric Utility Regulation Advisory Group
Commissioner Lorraine Akiba, Hawaii Public Utilities Commission Janice Beecher, Institute of Public Utilities, Michigan State University Doug Benevento, Xcel Energy Ashley Brown, Harvard Electricity Policy Group Paula Carmody, Maryland Office of People’s Counsel Ralph Cavanagh, Natural Resources Defense Council Steve Corneli, consultant Tim Duff, Duke Energy Commissioner Mike Florio, California Public Utilities Commission Peter Fox-Penner, Boston University Questrom School of Business Scott Hempling, attorney Val Jensen, Commonwealth Edison Steve Kihm, Seventhwave Commissioner Nancy Lange, Minnesota Public Utilities Commission Kris Mayes, Arizona State University College of Law/Utility of the Future Center Jay Morrison, National Rural Electric Cooperative Association Allen Mosher, American Public Power Association Sonny Popowsky, Former consumer advocate of Pennsylvania Karl Rábago, Pace Energy & Climate Center, Pace University School of Law Rich Sedano, Regulatory Assistance Project Chair Audrey Zibelman, New York State Public Service Commission Peter Zschokke, National Grid Reports in this series
1. Electric Industry Structure and Regulatory Responses in a High Distributed Energy Resources Future (November 2015)
2. Distribution Systems in a High Distributed Energy Resources Future: Planning, Market Design, Operation and Oversight (October 2015)
3. Performance-Based Regulation in a High Distributed Energy Resources Future (January 2016) 4. Distribution System Pricing With Distributed Energy Resources (May 2016) 5. Recovery of Utility Fixed Costs: Utility, Consumer, Environmental and Economist Perspectives
(June 2016) 6. The Future of Electricity Resource Planning (September 2016)
Reports and webinar materials are available at feur.lbl.gov. Additional reports are underway.

Future Electric Utility Regulation / Report No. 6 v
Acknowledgments
We thank the following Future Electric Utility Regulation Advisory Group members who provided comments on a draft of this report: Janice Beecher, Steve Kihm, Commissioner Nancy Lange, Jay Morrison, Sonny Popowsky and Rich Sedano. We also appreciate comments on the draft report from Caitlin Callaghan, Eli Massey, Joe Paladino and Caitlin Smith (U.S. Department of Energy), Peter Larsen and JP Carvallo (Lawrence Berkeley National Laboratory), Adam Diamant (Electric Power Research Institute) and Elaine Prause (Oregon Public Utility Commission). Finally, we thank those utilities that reviewed the draft report, particularly with respect to our discussion of their resource plans. Any remaining errors or omissions are the sole responsibility of the authors.
Future Electric Utility Regulation / Report No. 6 vi
Table of Contents
Foreword by U.S. Department of Energy ........................................................................................ xi
Glossary of Terms............................................................................................................................. 1
Executive Summary .......................................................................................................................... 3
Introduction ..................................................................................................................................... 6
1. Background .............................................................................................................................. 8
1.1 Historical Perspective ....................................................................................................... 8
1.1.1 The Roots of Electricity Resource Planning .............................................................. 8
1.1.2 Electricity Industry Restructuring and Current Status ........................................... 10
1.2 A Changing Paradigm ..................................................................................................... 14
1.2.1 Environmental and Energy Policies ........................................................................ 14
1.2.2 Natural Gas Reliance and Price Uncertainty .......................................................... 16
1.2.3 Declining Renewable Energy Technology Costs ..................................................... 17
1.2.4 Flat or Declining Load Growth ............................................................................... 18
1.2.5 Changing Customer Preferences ............................................................................ 19
1.2.6 ICT Improvements and Deployment ...................................................................... 20
1.2.7 Implications for Resource Planning ....................................................................... 20
2. Report Approach and Scope .................................................................................................. 22
2.1 Approach ........................................................................................................................ 22
2.2 Utilities and Jurisdictions Reviewed ............................................................................... 22
2.3 Planning Roles and Responsibilities in Jurisdictions Reviewed...................................... 24
3. Current Resource Planning Practices ..................................................................................... 26
3.1 Central-scale Generation ............................................................................................... 26
3.1.1 Background ............................................................................................................ 26
3.1.2 Current Approaches to Integrating Central-Scale Renewable Resources Into Resource Planning .................................................................................................................. 28
Future Electric Utility Regulation / Report No. 6 vii
3.2 Distributed Generation .................................................................................................. 34
3.2.1 Background ............................................................................................................ 34
3.2.2 Approaches to Integrating Distributed Generation Into Resource Planning ......... 35
3.3 Demand-side Resources ................................................................................................. 41
3.3.1 Background ............................................................................................................ 41
3.3.2 Approaches to Integrating Demand-side Resources Into Resource Planning ....... 42
3.4 Transmission .................................................................................................................. 46
3.4.1 Background ............................................................................................................ 46
3.4.2 Approaches to Integrating Transmission Into Resource Planning ......................... 47
3.5 Uncertainty and Risk Management ............................................................................... 51
3.5.1 Background ............................................................................................................ 51
3.5.2 Current Approaches to Integrating Uncertainty and Risk Analysis Into Resource Planning ............................................................................................................................... 54
4. Emerging Issues, Best Practices and Key Gaps ...................................................................... 61
4.1 Central-scale Generation ............................................................................................... 61
4.1.1 Emerging Issues for Resource Planning ................................................................. 61
4.1.2 Emerging Best Practices and Key Gaps .................................................................. 62
4.2 Distributed Generation .................................................................................................. 64
4.2.1 Emerging Issues for Resource Planning ................................................................. 64
4.2.2 Emerging Best Practices and Key Gaps .................................................................. 65
4.3 Demand-side Resources ................................................................................................. 68
4.3.1 Emerging Issues for Resource Planning ................................................................. 68
4.3.2 Emerging Best Practices ......................................................................................... 69
4.4 Transmission .................................................................................................................. 71
4.4.1 Emerging Issues for Resource Planning ................................................................. 71
4.4.2 Emerging Best Practices and Key Gaps .................................................................. 72
Future Electric Utility Regulation / Report No. 6 viii
4.5 Uncertainty and Risk Management ............................................................................... 72
4.5.1 Emerging Issues for Resource Planning ................................................................. 72
4.5.2 Emerging Best Practices and Key Gaps .................................................................. 74
5. Summary and Considerations for Regulators ........................................................................ 76
5.1 Summary ........................................................................................................................ 76
5.1.1 Central-scale Generation ....................................................................................... 76
5.1.2 Distributed Generation .......................................................................................... 77
5.1.3 Demand-side Resources ......................................................................................... 77
5.1.4 Transmission .......................................................................................................... 78
5.1.5 Uncertainty and Risk Management ....................................................................... 78
5.2 Considerations for Regulators ....................................................................................... 79
References ..................................................................................................................................... 84
Appendix 1: Economics of Solar and Wind Generation ................................................................. 93
Appendix 2: Illustrations of Different Approaches to Uncertainty and Risk Analysis .................... 98

Future Electric Utility Regulation / Report No. 6 ix
List of Figures
Figure 1. Five Steps in Resource Planning and Key Analytical Tools ................................................ 9
Figure 2. RTOs, ISOs and Non-RTO Regions in North America ...................................................... 12
Figure 3. Six Factors Driving a Paradigm Shift in Resource Planning ............................................. 14
Figure 4. U.S. Net Electricity Generation (left) and Generation Mix (right), 1980–2014 .............. 16
Figure 5. Annual Energy Outlook (2016) Natural Gas Price Forecasts to 2040 and Actual Prices, 1997–2015 ............................................................................................................................. 17
Figure 6. Sampled Solar PPA Prices, 2006–2015 ............................................................................ 18
Figure 7. Annual Growth in Electricity Sales, 1950–2015 Annual and Decadal Averages ............. 19
Figure 8. Annual Installed Capacity of Customers on NEM Tariff, HECO, HELCO, and MECO, 2001–2015 ....................................................................................................................................... 20
Figure 9. Illustrative Lead Times and Physical Lifetimes for Electricity Resources ........................ 53
Figure 10. Scenarios and Strategies in TVA’s 2015 IRP .................................................................. 57
Figure 11. Recommended Ranges of Resource Capacity Additions and Retirements in TVA’s 2015 IRP .......................................................................................................................................... 58
Figure 12. Reduced Solar Curtailment in CAISO Through Export Capability to PacifiCorp ............ 62
Figure 13. Directionality of Factors Influencing Optimal Level of Investment in Energy Efficiency ............................................................................................................................................... 70
Figure 14. Illustration of how Solar PV and Wind Generation Change Daily Net Loads and Dispatchable Generation ....................................................................................................... 93
Figure 15. Gross and Net Load Shapes for the CAISO Region Assuming 15 Percent Solar PV and 10 Percent Wind Penetrations (top), and Impact on Utilization of Dispatchable Generation Capacity (bottom) .................................................................................................................. 95
Figure 16. Cost Duration Curves for Gross and Net Load Shapes .................................................. 96
Figure 17. PVRR Results from NSP Uncertainty Analysis (million $ and rank) ............................... 98
Figure 18. Expected PVRR and PVRR Variance from PacifiCorp Uncertainty Analysis (“Initial Screen Scatter Plot, High Price Curve Scenario”) ................................................................... 99
Future Electric Utility Regulation / Report No. 6 x
List of Tables
Table 1. Resource Planning Roles and Responsibilities for Different Actors Under Different Industry Structures................................................................................................................. 13
Table 2. Utilities Covered and RTO/ISO Region and States Where Utility Operates ..................... 23
Table 3. Plans and Planning Horizons for Utilities Reviewed ......................................................... 24
Table 4. Approaches to Determining the Level and Composition of New Central-Scale Renewable Resources ............................................................................................................................... 28
Table 5. Approaches to Considering the Operational Impacts of Renewable Energy ................... 31
Table 6. Approaches to Accounting for the Resource Adequacy Value of Solar PV and Wind ..... 33
Table 7. Approaches to Creating Distributed Generation Forecasts ............................................. 37
Table 8. Approaches to Integrating Demand-side Resources Into Resource Planning.................. 43
Table 9. Approaches to Addressing Transmission in Resource Plans in Jurisdictional Planning (“Model 1” Utilities) ............................................................................................................... 48
Table 10. Approaches to Addressing Resource Value of Transmission in Transmission Plans, State and Multistate RTO/ISO Regions (“Model 2” and “Model 3” Utilities) ................................. 50
Table 11. Key Identified Sources of Uncertainty in Utility Resource Plans .................................... 55
Table 12. Approaches to Incorporating Compliance With GHG Regulations ................................ 59

Future Electric Utility Regulation / Report No. 6 xi
Foreword by U.S. Department of Energy The provision of electricity in the United States is undergoing significant changes for a number of reasons. The implications are unclear.
The current level of discussion and debate surrounding these changes is similar in magnitude to the discussion and debate in the 1990s on the then-major issue of electric industry restructuring, both at the wholesale and retail level. While today’s issues are different, the scale of the discussion, the potential for major changes, and the lack of clarity related to implications are similar. The U.S. Department of Energy (DOE) played a useful role by sponsoring a series of in-depth papers on a variety of issues being discussed at that time. Topics and authors were selected to showcase diverse positions on the issues to inform the ongoing discussion and debate, without driving an outcome.
Today’s discussions have largely arisen from a range of challenges and opportunities created by new and improved technologies, changing customer and societal expectations and needs, and structural changes in the electric industry. Some technologies are at the wholesale (bulk power) level, some at the retail (distribution) level, and some blur the line between the two. Some technologies are ready for deployment or are already being deployed, while the future availability of others may be uncertain. Other key factors driving current discussions include continued low load growth in many regions and changing state and federal policies and regulations. Issues evolving or outstanding from electric industry changes of the 1990s also are part of the current discussion and debate.
To provide future reliable and affordable electricity, power sector regulatory approaches may require reconsideration and adaptation to change. Historically, major changes in the electricity industry often came with changes in regulation at the local, state or federal levels.
DOE is funding a series of reports, of which this is a part, reflecting different and sometimes opposing positions on issues surrounding the future of regulation of electric utilities. DOE hopes this series of reports will help better inform discussions underway and decisions by public stakeholders, including regulators and policy makers, as well as industry.
The topics for these papers were chosen with the assistance of a group of recognized subject matter experts. This advisory group, which includes state regulators, utilities, stakeholders and academia, works closely with DOE and Lawrence Berkeley National Laboratory (Berkeley Lab) to identify key issues for consideration in discussion and debate.
The views and opinions expressed in this report are solely those of the authors and do not reflect those of the United States Government, or any agency thereof, or The Regents of the University of California.
Future Electric Utility Regulation / Report No. 6 1
Glossary of Terms
Ancillary services. Services necessary to support the reliable operation of the high voltage grid, including frequency regulation and contingency reserves
Bulk power system. The high voltage grid, typically referring to generation and transmission lines operated at voltages of higher than 100 kilovolts
Capacity expansion model. An optimization model used to develop least-cost investment, and in some cases retirement, strategies over a multiple-year time horizon
Central-scale generation. Generation resources that deliver power directly to the high voltage transmission system
Cost variance. The difference in cost estimates in a probabilistic economic projection
Default service provider. In jurisdictions with competitive retail markets, an incumbent distribution company that provides electricity service for customers who do not choose a competitive supplier
Dispatchable resource. A resource that can be controlled centrally by a system operator
Distributed energy resources. Broadly, resources that are deployed at the distribution level, including energy efficiency, demand response (including price-responsive loads), distribution-level energy storage, distributed generation, and electric vehicles
Distributed generation. Generation resources that deliver power to the distribution system
Dynamic pricing. Rate designs where the price schedule is set 24 hours or less ahead of time based on anticipated or actual power system conditions, high wholesale power costs, or both (e.g., critical peak pricing, real-time pricing)
Expected cost. The mean of cost estimates in a probabilistic economic projection
Independent system operator (ISO). An independent operator of the bulk electric grid, responsible for ensuring non-discriminatory access and reliability; operates within a single state
Integrated demand-side management (IDSM). Integrated evaluation of demand-side resources, to identify what portfolio of these resources will be least-cost
Integrated resource planning (IRP). A planning process that identifies least-cost or best-value resources to meet reliability and public policy goals
Load serving entity (LSE). An entity that is permitted to sell electricity to end users
Loss of load expectation (LOLE). The duration of time over which load exceeds available generation capacity
Future Electric Utility Regulation / Report No. 6 2
Loss of load probability (LOLP). The probability that load exceeds generation in a given hour
Monte Carlo simulation. A technique that uses repeated sampling to translate uncertainties in inputs into uncertainty in the results
Net energy metering (NEM). A rate design that credits customers for distributed generation at their full retail rate
Net load. Load minus non-dispatchable generation
Non-wires alternatives. Alternatives to transmission and distribution investments, typically through load reductions or shifting as a result of investments in distributed energy resources
Operating reserves. Resources held in reserve above the daily peak electricity demand forecast to respond to load forecast errors, solar and wind generation forecast errors, and unscheduled generator and transmission line outages
Overgeneration. When the supply of non-dispatchable renewable energy generation plus thermal generation needed for reliability exceeds load plus net exports
Power purchase agreement (PPA). A legal contract between a seller and a buyer of electricity, often playing an important role in securing project finance
Present value of revenue requirement (PVRR). The present value of revenues required for utilities to recover their prudent costs and regulated return
Production simulation (cost) model. An optimization model used to simulate detailed operation and production costs of an electricity system, typically over the course of a year
Public Utility Regulatory Policies Act (PURPA). An Act of Congress passed in 1978 that, among other things, enabled the emergence of non-utility power producers by requiring utilities to purchase their output at the utility’s avoided cost
Regional Transmission Operator (RTO). An independent operator of the bulk electric grid, responsible for ensuring non-discriminatory access and reliability; operates across multiple states
Resource adequacy. The adequacy of system resources relative to a reliability target
Transmission congestion. Occurs when power flows over transmission systems are constrained, requiring the redispatch of system resources to alleviate these constraints
Future Electric Utility Regulation / Report No. 6 3
Executive Summary Electricity resource planning is the process of identifying longer-term investments to meet electricity reliability requirements and public policy goals at a reasonable cost. Resource planning processes provide a forum for regulators, electric utilities, and electricity industry stakeholders to evaluate the economic, environmental, and social benefits and costs of different investment options. By facilitating a discussion on future goals, challenges and strategies, resource planning processes often play an important role in shaping utility business decisions.
Resource planning emerged more than three decades ago in an era of transition, where declining electricity demand and rising costs spurred fundamental changes in electricity industry regulation and structure. Despite significant changes in the industry, resource planning continues to play an important role in supporting investment decision making.
Over the next two decades, the electricity industry will again undergo a period of transition, driven by technological change, shifting customer preferences and public policy goals. This transition will bring about a gradual paradigm shift in resource planning, requiring changes in scope, approaches and methods. Even as it changes, resource planning will continue to be a central feature of the electricity industry. Its functions — ensuring the reliability of high voltage (“bulk”) power systems, enabling oversight of regulated utilities and facilitating low-cost compliance with public policy goals — are likely to grow in importance as the electricity industry enters a new period of technological, economic and regulatory change.
This report examines the future of electricity resource planning in the context of a changing electricity industry. The report examines emerging issues and evolving practices in five key areas that will shape the future of resource planning: (1) central-scale generation, (2) distributed generation, (3) demand-side resources, (4) transmission and (5) uncertainty and risk management. The analysis draws on a review of recent resource plans for 10 utilities that reflect some of the U.S. electricity industry’s extensive diversity.
Across these five key areas, the report highlights 10 emerging resource planning needs for state utility regulators to consider. Although the relevance of these needs varies across states and industry contexts, many of the underlying issues and themes have broader relevance. The 10 emerging considerations for resource planning include the following:
1) More integrated approaches to resource evaluation and acquisition. With utilities facing significant uncertainty in electricity demand, resource costs and environmental compliance needs, there is a renewed need to better integrate the evaluation and acquisition of different kinds of resources: conventional thermal generation, large-scale renewable energy generation, nuclear generation, distributed generation, energy efficiency, demand response, energy storage and transmission. In non-restructured jurisdictions, regulators can encourage more integrated evaluation through integrated resource planning (IRP) rules and guidelines. In restructured jurisdictions, regulators can encourage more integrated evaluation through closer coordination between wholesale
Future Electric Utility Regulation / Report No. 6 4
markets and state targets and programs for demand-side resources, renewable energy and distributed generation.
2) More comprehensive consideration of investment drivers. Although utility resource acquisition has historically been driven by load growth and resource adequacy, resource acquisition will increasingly be driven by energy costs, risk management, environmental regulations and customer behavior. To accommodate this shift, regulators can encourage utilities to take a more integrated portfolio approach to resource acquisition, where investment and procurement decisions are evaluated by their impact on portfolio costs and risks.
3) More accurate representation of solar and wind generation in resource planning models. Resource planning models are still limited in their ability to capture the unique operating characteristics and economics of solar and wind generation. Improving these models will require an industry-wide effort, though regulators can support modeling improvements by encouraging utilities to use best available modeling practices.
4) Greater attention in resource planning to customer behavior, retail rate designs and the distribution system. The emergence of lower-cost distributed generation, customer-sited energy storage, electric vehicles, and other price-responsive loads will likely strengthen the interactive relationships among utility resource acquisition decisions, retail rates, and adoption of distributed energy technologies. Regulators can encourage utilities to proactively respond to the challenges posed by distributed energy resources in their resource plans. Methods for doing so can be enhanced through information sharing and collaboration among states and utilities.
5) Risk analysis and use of risk-adjusted metrics. Despite increased uncertainty and risk facing the electricity industry — stemming from changing demand patterns, technological change, fuel price uncertainty and new environmental regulations — many utilities do not conduct rigorous risk analysis in their resource plans. To respond to growing uncertainty and risk, regulators can encourage more widespread use of risk analysis and the use of risk-adjusted metrics in resource planning, give critical consideration to how risks can be managed by incorporating risk-adjusted metrics into the selection of preferred resource plans, and make more explicit use of risk management frameworks and tools in their oversight of resource planning processes.
6) Balancing precision and transparency in planning models. The ability to collect more data through advanced metering infrastructure and continued improvements in computing power will enable the development of more sophisticated resource planning models. Regulators will need to ensure that improvements in modeling capability are balanced with the continued need for transparency in model assumptions and intuition about model results.

Future Electric Utility Regulation / Report No. 6 5
7) Coherence between planning and long-term policies and regulations. The multi-decadal nature of many federal and state environmental goals and the long-lived nature of most electricity infrastructure suggest the need for greater coherence between resource planning and the longer-term transitions required to ensure regulatory compliance. Drawing on recent innovations, including those described in this report, regulators can support greater attention to transition strategies in resource planning.
8) Deeper expertise at state regulatory commissions and energy agencies. As resource planning problems become more complex, from renewable energy integration to the role and treatment of distributed energy resources — state regulatory commissions and energy offices will need to expand and deepen their expertise to inform their decision making. Developing this expertise should be a near-term priority for states.
9) Exploring new opportunities for information sharing and collaboration. Information sharing and collaboration among states can promote greater convergence in resource planning assumptions and adoption of best practices. These efforts can be supported through the development of informational sites, such as Berkeley Lab’s Resource Planning Portal,1 or through research collaboration facilitated by organizations such as the Electric Power Research Institute.
10) Regional coordination in resource planning. A number of drivers, including the benefits of regional coordination for integrating renewable energy resources, are strengthening the rationale for greater regional coordination in resource planning. Existing regional entities, such as regional transmission organizations, the North American Electric Reliability Corporation’s regional entities, and regional committees of states,2 can play a role in facilitating coordination and cooperation among states and utilities, though in some regions this will require new institutions and processes.
1 See http://resourceplanning.lbl.gov/. 2 Such as the New England States Committee on Electricity (www.nescoe.org) and the Committee for Regional Electric Utility Cooperation (http://westernenergyboard.org/crepc-spsc/what-we-do/).
Future Electric Utility Regulation / Report No. 6 6
Introduction Electricity resource planning is the process of identifying longer-term investments to meet reliability and public policy objectives at a reasonable cost.3 Resource planning emerged more than three decades ago, in an era characterized by slowing load growth, rising electricity costs, vertical integration of the electricity industry and increasing environmental regulation. As the electricity industry changed, resource planning evolved to address new problems and challenges. It continues to be an important part of the industry today.
Over the next two decades, a combination of factors — federal and state environmental regulations, state energy policies, growing reliance on natural gas, natural gas price uncertainty, falling renewable energy costs, flat or declining load growth, shifting consumer preferences, and greater deployment of information and communication technologies — will drive fundamental changes in the electricity industry, with significant implications for resource planning.
This report explores the future of electricity resource planning for the bulk power system, through an examination of emerging issues and evolving practices in five areas that will shape it: (1) central-scale generation, (2) distributed generation, (3) demand-side resources, (4) transmission and (5) uncertainty and risk management. The report draws on a review of recent resource plans for 10 utilities4 that capture some of the U.S. electricity industry’s diversity. Based on this review, it identifies emerging best practices and key gaps. The report closes with a list of key considerations for regulators.
The analysis in this report builds on a number of recent studies of resource planning practices in the United States that cover a wide range of topics, including general overviews of current planning rules and practices;5 identification of best practices;6 current and best practices for treating specific resources;7 reviews of planning inputs, assumptions and outputs;8 and general assessments of future directions for resource planning.9 In contrast, this report aims to be both more forward looking and more specific, evaluating existing planning practices in the context of potential changes in the electricity industry over the next two decades.
The report is organized into five sections:
• Section 1 (Background) describes the evolution of resource planning and the forces that are driving changes in the electricity industry and in resource planning.
3 States have varying requirements regarding what is considered reasonable, such as least-cost, best-fit or best combination of expected cost and risk. 4 One of these 10 “utilities,” the Tennessee Valley Authority, is a federal power agency rather than a utility per se. For simplicity, we use the term “utility” broadly in this report. 5 See EPA (2015a), Wilson and Biewald (2013), Wilson and Peterson (2011), RAP (2013), and AEG and E3 (2008). 6 See EPA (2015a), Wilson and Biewald (2013), and AEG and E3 (2008). 7 For solar energy, see Sterling et al. (2013) and Mills and Wiser (2012); for energy efficiency, refer to SEE Action Network (2011); for demand response, see Satchwell and Hledik (2013). 8 See Wilkerson et al. (2014). 9 See Chupka et al. (2008).

Future Electric Utility Regulation / Report No. 6 7
• Section 2 (Report Approach and Scope) provides an overview of our approach and the 10 utilities for which we review resource plans.
• Section 3 (Current Resource Planning Practices) reviews current practices for the 10 utilities in each of the five areas described above.
• Section 4 (Emerging Issues, Best Practices and Key Gaps) examines emerging issues, best practices and key gaps in each of the five areas, drawing on the review in Section 3.
• Section 5 (Summary and Key Considerations) summarizes the material in sections 3 and 4 for each of the five areas and distills a list of key considerations for regulators on the future of resource planning.
Future Electric Utility Regulation / Report No. 6 8
1. Background
1.1 Historical Perspective
1.1.1 The Roots of Electricity Resource Planning Resource planning emerged in the late 1970s and 1980s, in response to a confluence of dramatic changes affecting the U.S. electricity industry — slowing electricity demand growth, rising interest rates, cost overruns at generating facilities, excess capacity, rising fuel costs, and new federal and state regulations for air and water quality. State utility regulators found themselves wedged among competing interests: (1) utility customers, which opposed rate increases; (2) environmental groups, which argued for regulations and investments to reduce the electricity sector’s environmental footprint; and (3) electric utilities, which argued that price increases were needed to cover rising costs and higher risks.10
Resource planning provided a forum to more transparently and inclusively reconcile these competing interests. Planning processes were conducted through public regulatory proceedings, which enabled participation by consumer advocates and public interest groups. Although resource plans often were not explicitly tied to investment approvals for utility projects and ratemaking processes, they allowed for disagreements over investment decision making to be informed, aired and resolved in advance of discrete approval processes, reducing disallowance risk to utilities. By the early 1990s, a majority of states had implemented some form of resource planning for investor-owned utilities.11 A number of municipal utilities, cooperatives, public utility districts and federal power agencies had also created public resource planning processes.12
In addition, resource plans provided a forum to integrate evaluation and acquisition of different kinds of resources, an approach that became known as integrated resource planning (IRP). For instance, a number of states passed statutes, rules or guidelines specifying that utilities consider energy efficiency and demand response in their resource plans, enabling these resources to be integrated into supply-side planning. A smaller number of states also required utilities to consider new transmission as an alternative to new generation in their IRPs.13 Through the IRP process, regulators sought to encourage utilities to find least-cost or, in some cases, best-value solutions for providing electricity services to their customers.
The passage of the Public Utility Regulatory Policies Act (PURPA) in 1978 marked a major shift in the electricity industry, opening it to non-utility generation and creating new planning and
10 For more on the history of this period and its aftermath, see Kahn (1988). 11 Mitchell (1992). 12 For an overview of the physical, economic and legislative drivers of resource planning for a number of municipal utilities, cooperatives, public utility districts and federal power agencies in the Western United States, see Eto and Goldman (1993). 13 Wilson and Biewald (2013).
Future Electric Utility Regulation / Report No. 6 9
operational challenges for utilities.14 Utilities were required to purchase energy and capacity from qualifying facilities at the utility’s avoided cost. To address both the opportunities and potential challenges of qualifying facility generation, requirements to assess new non-utility generation became a common feature of resource plans.
IRP became the dominant form of resource planning during the 1980s and 1990s. By the end of the 1990s, a majority of states had issued rules requiring investor-owned utilities (IOUs) to file IRPs.15 Among states, however, resource plans and planning processes varied significantly. Differences included the planning horizon, frequency of updates, resources evaluated, level of stakeholder involvement, link to investment approvals, and level of regulatory oversight.
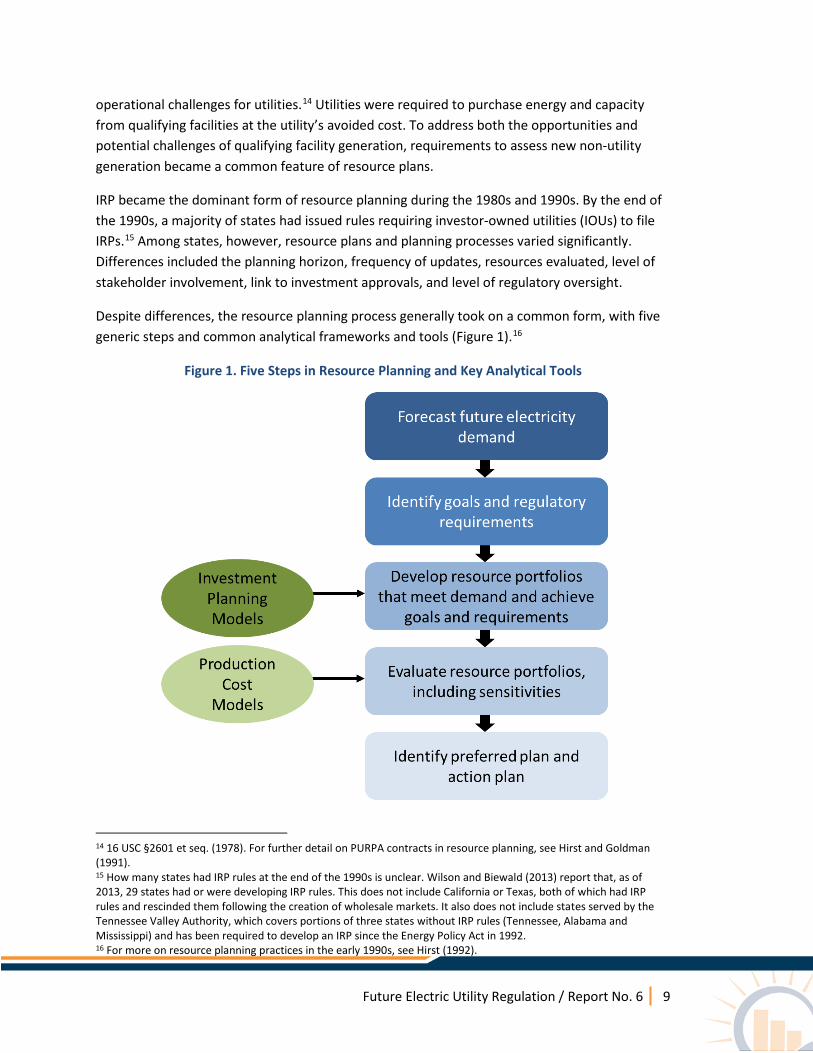
Despite differences, the resource planning process generally took on a common form, with five generic steps and common analytical frameworks and tools (Figure 1).16
Figure 1. Five Steps in Resource Planning and Key Analytical Tools
14 16 USC §2601 et seq. (1978). For further detail on PURPA contracts in resource planning, see Hirst and Goldman (1991). 15 How many states had IRP rules at the end of the 1990s is unclear. Wilson and Biewald (2013) report that, as of 2013, 29 states had or were developing IRP rules. This does not include California or Texas, both of which had IRP rules and rescinded them following the creation of wholesale markets. It also does not include states served by the Tennessee Valley Authority, which covers portions of three states without IRP rules (Tennessee, Alabama and Mississippi) and has been required to develop an IRP since the Energy Policy Act in 1992. 16 For more on resource planning practices in the early 1990s, see Hirst (1992).

Future Electric Utility Regulation / Report No. 6 10
Development of resource portfolios was oriented around physical reliability standards for the high voltage (“bulk”) power system, which drove the need for new investment. The dominant standard in the United States became a 1-in-10-year loss-of-load expectation (LOLE), though in practice utilities and regulators interpreted this standard differently in different jurisdictions.17 Through modeling, utilities could translate this standard into a planning reserve margin — the amount of generation capacity in excess of peak demand needed to maintain a given LOLE target. Planning reserve margins enabled the development of load-resource tables, which compared generation resources against peak demand plus the reserve margin, to determine whether utilities had adequate resources to maintain reliability.
Resource portfolio development and evaluation occurred in two steps and used various tools. Utilities used investment planning models to examine least-cost investment strategies over a long-term planning horizon. These included models that focused on the avoided cost of non-utility resources to determine utility investments in these resources, as well as portfolio assessment models, which focused on developing least-cost resource portfolios. Utilities used production cost models, with a more detailed annual representation of generator operations and transmission constraints, to examine generator operations and operating (“production”) costs associated with each portfolio.
Despite more widespread use of quantitative metrics and modes in resource planning processes, individual and collective judgment continues to play an important role in determining planning metrics, developing planning methods, choosing models, interpreting results, and developing preferred resource plans and action plans to achieve them. For instance, is a 1-in-10-year standard the “right” level of reliability and, if not, how should the right level be determined? How should load forecast uncertainty be accounted for in investment planning models? What are reasonable cost trajectories for new technologies? Addressing these kinds of questions involves the exercise of considerable judgment by utilities and regulators.
1.1.2 Electricity Industry Restructuring and Current Status In the late 1990s and 2000s, electric industry restructuring and the emergence of organized wholesale markets led to changes in the scope and allocation of responsibilities in resource planning in some regions. Where it did occur, restructuring proceeded in two main areas: (1) on the generation side, utilities divested their generation to enable the creation of competitive wholesale markets, and (2) on the retail side, regulators opened the retail sector to competition, with utilities acting as default service providers. To facilitate competition in generation, the Federal Energy Regulatory Commission’s (FERC’s) Orders 888 (1996) and 889 (1996) required utilities to provide non-discriminatory access to their transmission systems, unbundle their
17 LOLE is the expected duration of time during which load exceeds available generation capacity. In some cases, the standard was interpreted as one event in 10 years (0.1 events per year), whereas in others it was interpreted as one day in 10 years (2.4 hours per year). For more on the history of resource adequacy, see Carden et al. (2011).

Future Electric Utility Regulation / Report No. 6 11
generation and transmission functions, and create information systems to report available transfer capabilities.18
As a means to comply with these orders, many regions formed independent system operators (ISOs) to oversee the operation of the bulk power system. Later, FERC Order 2000 (1999) encouraged the development of regional transmission organizations (RTOs) to operate bulk power systems across multiple states.19 ISOs and RTOs organized bid-based energy and ancillary services markets to facilitate their operations of state and multistate power systems.
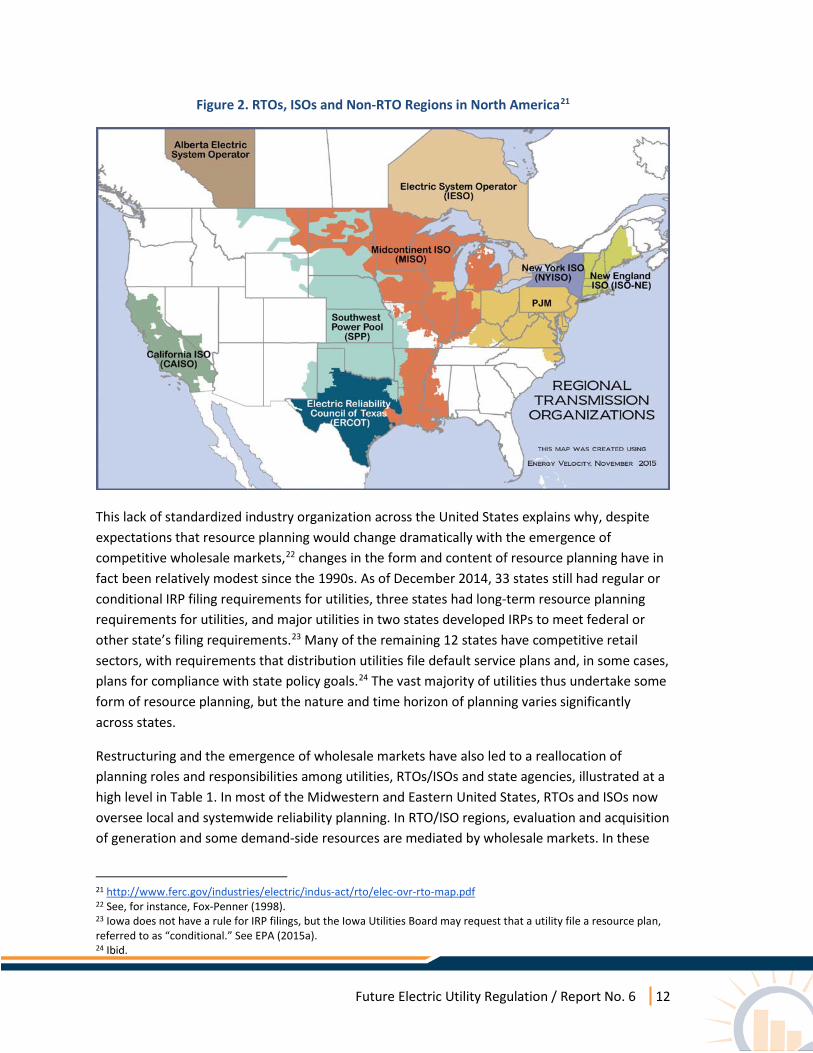
Subsequent changes in the industry, however, were neither uniform nor consistent across states. Most of the Western and Southeastern United States chose not to restructure or form centralized markets (Figure 2). In other states, particularly in the Midwest, vertically integrated utilities joined wholesale markets operated by RTOs. California required utilities to divest their generation and join an ISO, but limited retail competition. Most Northeastern states underwent full restructuring, facilitated by RTOs or ISOs. Operating in both restructured and non-restructured regions, municipalities, electric cooperatives and public utility districts continue to play an important role in the U.S. electricity sector, accounting for about one-quarter of total retail electricity sales.20
18 FERC (1996a) and FERC (1996b). Restructuring and open access transmission were facilitated by the 1992 Energy Policy Act (42 U.S.C. § 13201 note), which created a new class of generators (“exempt wholesale generators”) and granted FERC the authority to mandate non-discriminatory access to transmission systems. 19 FERC (1999). 20 According to the U.S. Energy Information Administration (EIA) Form EIA-826 data, municipalities, cooperatives, and public utility districts accounted for 428 terawatt-hours (TWh) (11 percent), 395 TWh (10 percent) and 109 TWh (3 percent) of a total of 3,765 TWh in electricity sales in 2014. Data are from the EIA website: http://www.eia.gov/electricity/data.cfm#sales
Future Electric Utility Regulation / Report No. 6 12
Figure 2. RTOs, ISOs and Non-RTO Regions in North America21
This lack of standardized industry organization across the United States explains why, despite expectations that resource planning would change dramatically with the emergence of competitive wholesale markets,22 changes in the form and content of resource planning have in fact been relatively modest since the 1990s. As of December 2014, 33 states still had regular or conditional IRP filing requirements for utilities, three states had long-term resource planning requirements for utilities, and major utilities in two states developed IRPs to meet federal or other state’s filing requirements.23 Many of the remaining 12 states have competitive retail sectors, with requirements that distribution utilities file default service plans and, in some cases, plans for compliance with state policy goals.24 The vast majority of utilities thus undertake some form of resource planning, but the nature and time horizon of planning varies significantly across states.
Restructuring and the emergence of wholesale markets have also led to a reallocation of planning roles and responsibilities among utilities, RTOs/ISOs and state agencies, illustrated at a high level in Table 1. In most of the Midwestern and Eastern United States, RTOs and ISOs now oversee local and systemwide reliability planning. In RTO/ISO regions, evaluation and acquisition of generation and some demand-side resources are mediated by wholesale markets. In these
21 http://www.ferc.gov/industries/electric/indus-act/rto/elec-ovr-rto-map.pdf 22 See, for instance, Fox-Penner (1998). 23 Iowa does not have a rule for IRP filings, but the Iowa Utilities Board may request that a utility file a resource plan, referred to as “conditional.” See EPA (2015a). 24 Ibid.

Future Electric Utility Regulation / Report No. 6 13
regions, state agencies have often taken on larger planning roles for renewable energy and demand-side resources. Despite this reallocation of roles and responsibilities, many basic resource planning functions and drivers remain relevant.
Table 1. Resource Planning Roles and Responsibilities for Different Actors Under Different Industry Structures25
RTO/ISO Regions Planning Function Vertically Integrated
States Vertically Integrated
Utility Restructured Markets
Resource adequacy26 Utility RTO/ISO
Utility
RTO/ISO
Load Serving Entities
Generation planning
Utility Utility Competitive Generators
Transmission planning
Utility RTO/ISO RTO/ISO
Public policy resource planning
Utility Utility Utility State Agencies
The emergence of open access transmission, RTOs, and regional wholesale markets has created new tensions regarding regulatory jurisdiction over electricity sector planning. For example, jurisdictional questions have emerged over state regulatory authority in the context of regional capacity markets and regional transmission planning, and federal regulatory authority over distributed energy resources that participate in organized markets.27 Although questions remain, states continue to exercise principal oversight and authority over electric utility planning processes.
The continued importance of resource planning in the electricity sector stems from its role in guiding investments to meet reliability and public policy goals and ensuring that regulated utilities make prudent decisions in the public interest. In addition, an essential goal of integrated resource planning — ensuring consistent economic evaluations among comparable resources — remains relevant, even in areas where restructuring and wholesale markets have reallocated planning roles and responsibilities. That said, there are and will continue to be fundamental
25 This table is intended to be illustrative rather than comprehensive. Actual allocation of roles and responsibilities varies across jurisdictions. For instance, in some cases state regulators have retained oversight over resource adequacy in restructured jurisdictions (e.g., California), although in general this function lies with RTOs/ISOs. State agencies also engage in planning for public policy purposes in jurisdictions with vertically integrated utilities, but in restructured jurisdictions they often take a more active role in setting targets and designing procurement processes. 26 Resource adequacy planning includes two functions: (1) setting a total amount of required peak resource capacity, such as through a planning reserve margin; and (2) ensuring that sufficient resource capacity is available to meet that capacity need. In RTO/ISO regions, the former may be done by the RTO/ISO, though the latter remains the responsibility of load serving entities. 27 For a discussion of these issues, see Dennis et al. (forthcoming).
Future Electric Utility Regulation / Report No. 6 14
differences between states with restructured and non-restructured electricity sectors, in terms of the nature of resource planning and the emphasis given to planning proceedings.
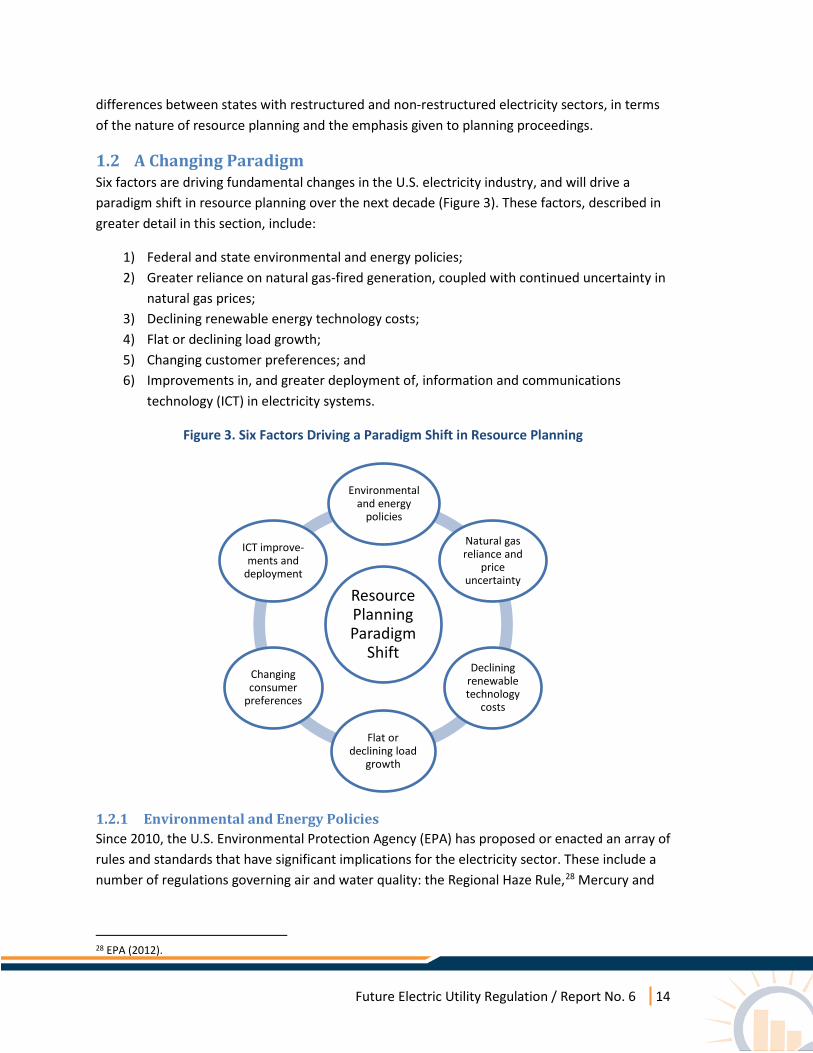
1.2 A Changing Paradigm Six factors are driving fundamental changes in the U.S. electricity industry, and will drive a paradigm shift in resource planning over the next decade (Figure 3). These factors, described in greater detail in this section, include:
1) Federal and state environmental and energy policies; 2) Greater reliance on natural gas-fired generation, coupled with continued uncertainty in
natural gas prices; 3) Declining renewable energy technology costs; 4) Flat or declining load growth; 5) Changing customer preferences; and 6) Improvements in, and greater deployment of, information and communications
technology (ICT) in electricity systems.
Figure 3. Six Factors Driving a Paradigm Shift in Resource Planning
1.2.1 Environmental and Energy Policies Since 2010, the U.S. Environmental Protection Agency (EPA) has proposed or enacted an array of rules and standards that have significant implications for the electricity sector. These include a number of regulations governing air and water quality: the Regional Haze Rule,28 Mercury and
28 EPA (2012).
Resource Planning Paradigm
Shift
Environmental and energy
policies
Natural gas reliance and
price uncertainty
Declining renewable technology
costs
Flat or declining load
growth
Changing consumer
preferences
ICT improve-ments and
deployment

Future Electric Utility Regulation / Report No. 6 15
Air Toxics Standards (MATS),29 Coal Combustion Residuals (CCR) Rule,30 the Cross-State Air Pollution Rule (CSAPR),31 and the Cooling Water Intake Structures (CWIS) Rule.32 These rules require many older generating units to install control equipment, switch fuels or retire.
In 2015, the EPA also passed two rules regulating greenhouse gas (GHG) emissions for power plants: Carbon Pollution Standards for new, modified, and reconstructed power plants33 and the Clean Power Plan for existing power plants.34 The Carbon Pollution Standards establish maximum carbon dioxide (CO2) limits on new, modified and reconstructed power plants, effectively curbing the development of new coal units without carbon capture and storage (CCS) capabilities.35 The Clean Power Plan creates national emission standards for existing steam generation units and natural gas-fired combustion turbines, allows states flexibility in how they comply with these standards, and sets state-level CO2 emission goals for electricity generation based on the national emission standards.36 Clean Power Plan goals must be achieved by 2030, with initial interim compliance required in phases starting in 2022.37
A growing number of states are developing their own climate policies, with nearer- and longer-term implications for the electricity sector. As of 2015, 20 states had longer-term, economy-wide GHG targets mandating steep reductions in emissions over the next three decades.38 Achieving these targets will require very low levels of CO2 emissions from the electricity sector by mid-century.39 To promote fuel diversification, economic development or climate policies, 29 states established renewable portfolio standards (RPS).40
29 EPA (2015b). 30 EPA (2015c). 31 EPA (2015d). EPA finalized an update to the rule on September 7, 2016: https://www.epa.gov/airmarkets/final-cross-state-air-pollution-rule-update. 32 EPA (2014). 33 EPA (2015e). 34 EPA (2015f). 35 For new units, the standard is 1,400 lb CO2/MWh (0.64 kg CO2/kWh), which is equivalent to a natural gas-fired unit with a net heat rate of around 12,000 Btu/kWh (28 percent net thermal efficiency), assuming a natural gas emission factor (higher heating value, or HHV) of 117 lb CO2/MMBtu. See EPA (2015f). 36 These standards are: (1) 1,305 lb CO2/MWh for steam generating units (coal-, oil- and gas-fired boilers) and (2) 771 lb CO2/MWh for natural gas-fired combustion turbines (combined cycle units). The EPA derived these emission rates by assessing the emissions reductions achievable using three “building blocks” that comprise the “best system of emissions reduction”: (1) heat rate improvements at existing coal-fired units; (2) replacement of higher-emitting steam generation with lower-emitting generation from gas-fired combined cycle units; and (3) replacement of fossil fuel-fired generation with generation from zero-emitting renewable resources. Each state’s goal is expressed both as an emissions rate (lbs CO2/MWh) and as an absolute mass of CO2 (tons CO2), and states can choose to comply with the Clean Power Plan on either a rate or a mass basis. The EPA set state-specific goals on the basis of its emission rate standards and state generation mixes. See EPA (2015f). 37 The Supreme Court granted a stay for the Clean Power Plan in February 2016. Despite the stay, a number of states have continued to proceed with compliance planning. 38 Based on Center for Climate and Energy Solutions, “Greenhouse Gas Emissions Targets,” http://www.c2es.org/us-states-regions/policy-maps/emissions-targets. 39 For instance, Williams et al. (2014) argue that reducing U.S. GHG emissions by 80 percent below 1990 levels would require reducing the electricity sector’s average CO2 emission factor to less than 60 g CO2/kWh. 40 Based on DSIRE Database of State Incentives for Renewables & Efficiency, http://www.dsireusa.org/resources/detailed-summary-maps/.
Future Electric Utility Regulation / Report No. 6 16
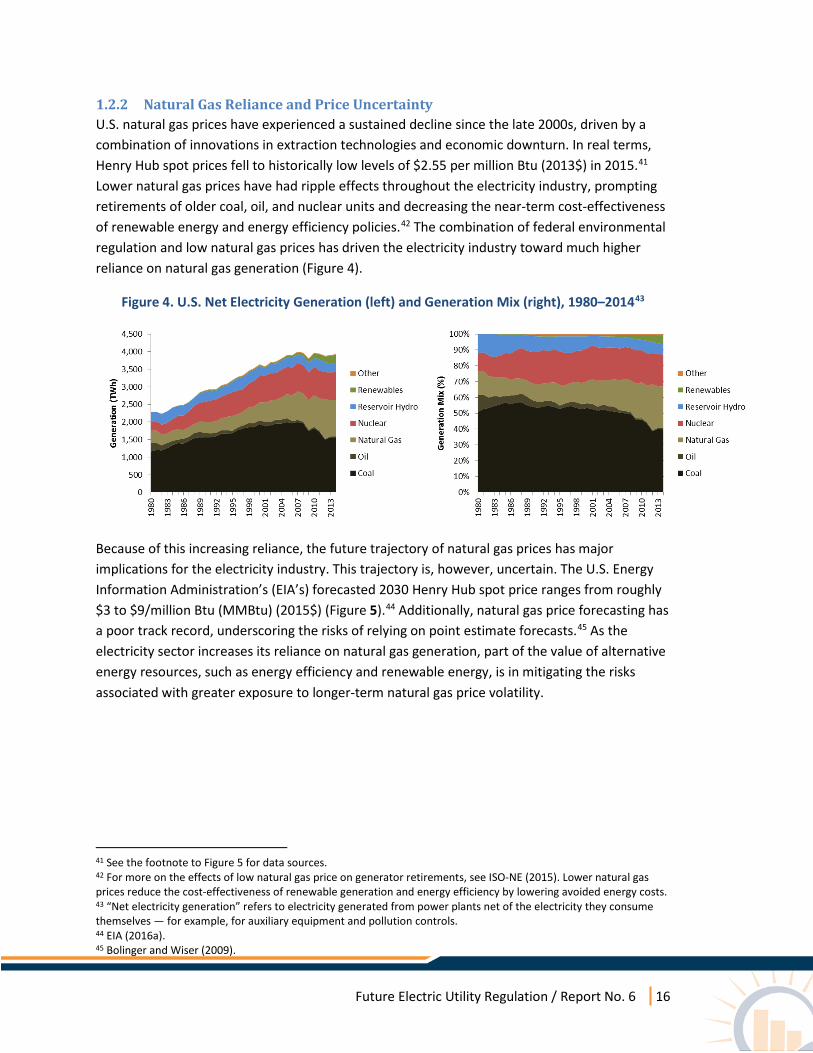
1.2.2 Natural Gas Reliance and Price Uncertainty U.S. natural gas prices have experienced a sustained decline since the late 2000s, driven by a combination of innovations in extraction technologies and economic downturn. In real terms, Henry Hub spot prices fell to historically low levels of $2.55 per million Btu (2013$) in 2015.41 Lower natural gas prices have had ripple effects throughout the electricity industry, prompting retirements of older coal, oil, and nuclear units and decreasing the near-term cost-effectiveness of renewable energy and energy efficiency policies.42 The combination of federal environmental regulation and low natural gas prices has driven the electricity industry toward much higher reliance on natural gas generation (Figure 4).
Figure 4. U.S. Net Electricity Generation (left) and Generation Mix (right), 1980–201443
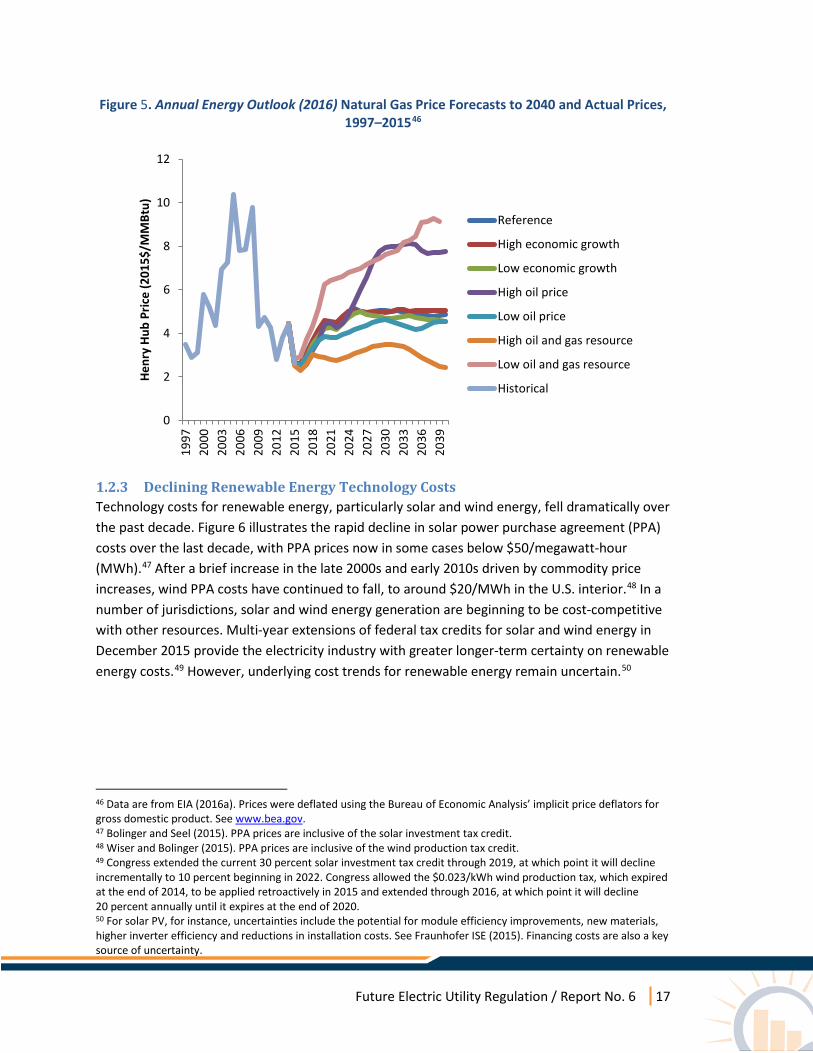
Because of this increasing reliance, the future trajectory of natural gas prices has major implications for the electricity industry. This trajectory is, however, uncertain. The U.S. Energy Information Administration’s (EIA’s) forecasted 2030 Henry Hub spot price ranges from roughly $3 to $9/million Btu (MMBtu) (2015$) (Figure 5).44 Additionally, natural gas price forecasting has a poor track record, underscoring the risks of relying on point estimate forecasts.45 As the electricity sector increases its reliance on natural gas generation, part of the value of alternative energy resources, such as energy efficiency and renewable energy, is in mitigating the risks associated with greater exposure to longer-term natural gas price volatility.
41 See the footnote to Figure 5 for data sources. 42 For more on the effects of low natural gas price on generator retirements, see ISO-NE (2015). Lower natural gas prices reduce the cost-effectiveness of renewable generation and energy efficiency by lowering avoided energy costs. 43 “Net electricity generation” refers to electricity generated from power plants net of the electricity they consume themselves — for example, for auxiliary equipment and pollution controls. 44 EIA (2016a). 45 Bolinger and Wiser (2009).
Future Electric Utility Regulation / Report No. 6 17
Figure 5. Annual Energy Outlook (2016) Natural Gas Price Forecasts to 2040 and Actual Prices, 1997–201546
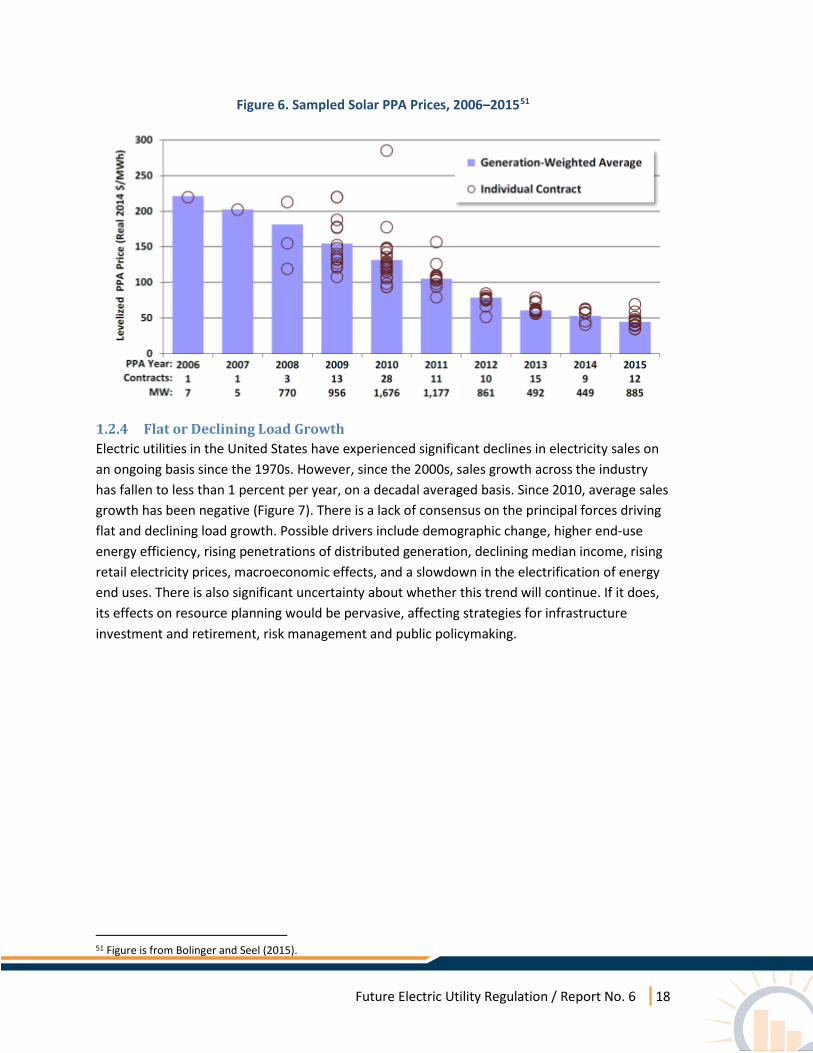
1.2.3 Declining Renewable Energy Technology Costs Technology costs for renewable energy, particularly solar and wind energy, fell dramatically over the past decade. Figure 6 illustrates the rapid decline in solar power purchase agreement (PPA) costs over the last decade, with PPA prices now in some cases below $50/megawatt-hour (MWh).47 After a brief increase in the late 2000s and early 2010s driven by commodity price increases, wind PPA costs have continued to fall, to around $20/MWh in the U.S. interior.48 In a number of jurisdictions, solar and wind energy generation are beginning to be cost-competitive with other resources. Multi-year extensions of federal tax credits for solar and wind energy in December 2015 provide the electricity industry with greater longer-term certainty on renewable energy costs.49 However, underlying cost trends for renewable energy remain uncertain.50
46 Data are from EIA (2016a). Prices were deflated using the Bureau of Economic Analysis’ implicit price deflators for gross domestic product. See www.bea.gov. 47 Bolinger and Seel (2015). PPA prices are inclusive of the solar investment tax credit. 48 Wiser and Bolinger (2015). PPA prices are inclusive of the wind production tax credit. 49 Congress extended the current 30 percent solar investment tax credit through 2019, at which point it will decline incrementally to 10 percent beginning in 2022. Congress allowed the $0.023/kWh wind production tax, which expired at the end of 2014, to be applied retroactively in 2015 and extended through 2016, at which point it will decline 20 percent annually until it expires at the end of 2020. 50 For solar PV, for instance, uncertainties include the potential for module efficiency improvements, new materials, higher inverter efficiency and reductions in installation costs. See Fraunhofer ISE (2015). Financing costs are also a key source of uncertainty.
0
2
4
6
8
10
12
1997
2000
2003
2006
2009
2012
2015
2018
2021
2024
2027
2030
2033
2036
2039
Henr
y Hu
b Pr
ice
(201
5$/M
MBt
u)
Reference
High economic growth
Low economic growth
High oil price
Low oil price
High oil and gas resource
Low oil and gas resource
Historical
Future Electric Utility Regulation / Report No. 6 18
Figure 6. Sampled Solar PPA Prices, 2006–201551
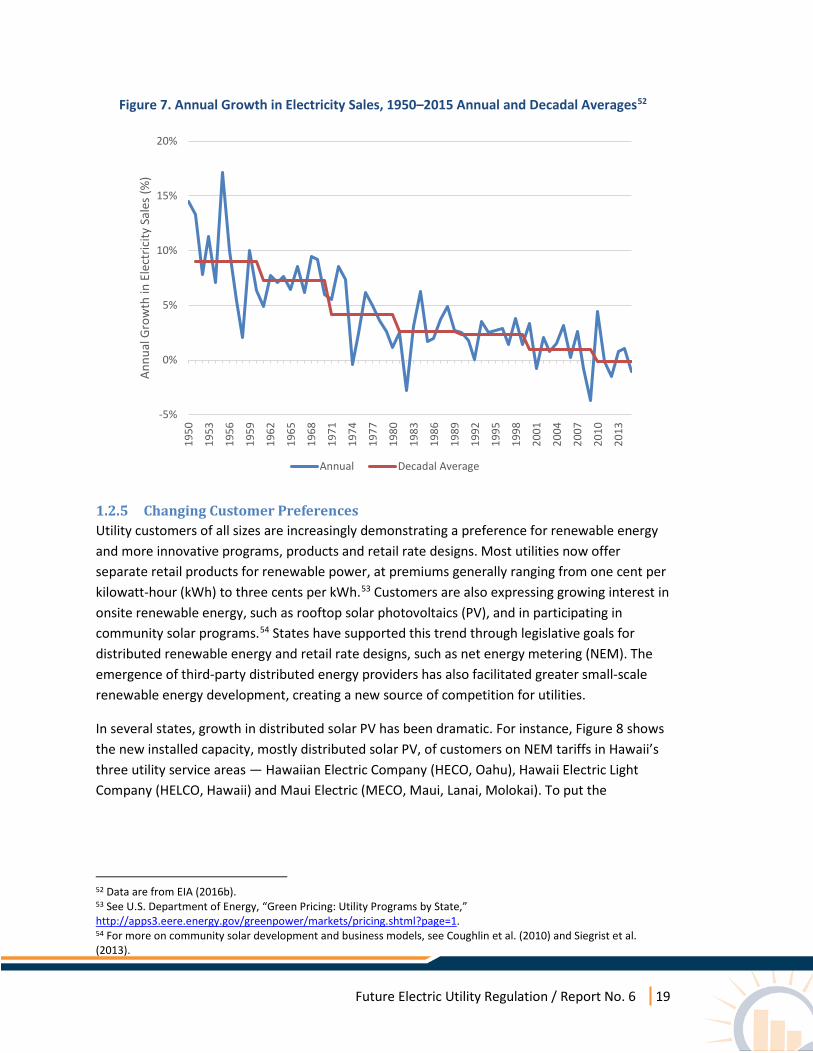
1.2.4 Flat or Declining Load Growth Electric utilities in the United States have experienced significant declines in electricity sales on an ongoing basis since the 1970s. However, since the 2000s, sales growth across the industry has fallen to less than 1 percent per year, on a decadal averaged basis. Since 2010, average sales growth has been negative (Figure 7). There is a lack of consensus on the principal forces driving flat and declining load growth. Possible drivers include demographic change, higher end-use energy efficiency, rising penetrations of distributed generation, declining median income, rising retail electricity prices, macroeconomic effects, and a slowdown in the electrification of energy end uses. There is also significant uncertainty about whether this trend will continue. If it does, its effects on resource planning would be pervasive, affecting strategies for infrastructure investment and retirement, risk management and public policymaking.
51 Figure is from Bolinger and Seel (2015).
Future Electric Utility Regulation / Report No. 6 19
Figure 7. Annual Growth in Electricity Sales, 1950–2015 Annual and Decadal Averages52
1.2.5 Changing Customer Preferences Utility customers of all sizes are increasingly demonstrating a preference for renewable energy and more innovative programs, products and retail rate designs. Most utilities now offer separate retail products for renewable power, at premiums generally ranging from one cent per kilowatt-hour (kWh) to three cents per kWh.53 Customers are also expressing growing interest in onsite renewable energy, such as rooftop solar photovoltaics (PV), and in participating in community solar programs.54 States have supported this trend through legislative goals for distributed renewable energy and retail rate designs, such as net energy metering (NEM). The emergence of third-party distributed energy providers has also facilitated greater small-scale renewable energy development, creating a new source of competition for utilities.
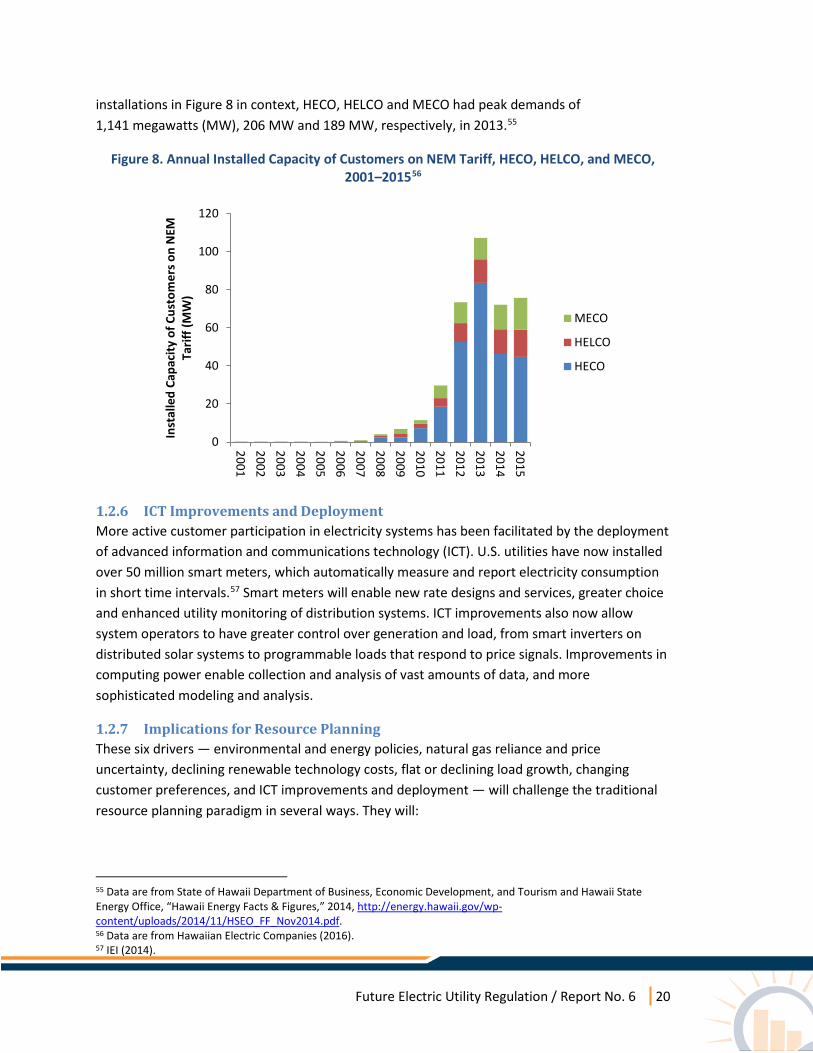
In several states, growth in distributed solar PV has been dramatic. For instance, Figure 8 shows the new installed capacity, mostly distributed solar PV, of customers on NEM tariffs in Hawaii’s three utility service areas — Hawaiian Electric Company (HECO, Oahu), Hawaii Electric Light Company (HELCO, Hawaii) and Maui Electric (MECO, Maui, Lanai, Molokai). To put the
52 Data are from EIA (2016b). 53 See U.S. Department of Energy, “Green Pricing: Utility Programs by State,” http://apps3.eere.energy.gov/greenpower/markets/pricing.shtml?page=1. 54 For more on community solar development and business models, see Coughlin et al. (2010) and Siegrist et al. (2013).
-5%
0%
5%
10%
15%
20%
1950
1953
1956
1959
1962
1965
1968
1971
1974
1977
1980
1983
1986
1989
1992
1995
1998
2001
2004
2007
2010
2013
Annu
al G
row
th in
Ele
ctric
ity S
ales
(%)
Annual Decadal Average
Future Electric Utility Regulation / Report No. 6 20
installations in Figure 8 in context, HECO, HELCO and MECO had peak demands of 1,141 megawatts (MW), 206 MW and 189 MW, respectively, in 2013.55
Figure 8. Annual Installed Capacity of Customers on NEM Tariff, HECO, HELCO, and MECO, 2001–201556
1.2.6 ICT Improvements and Deployment More active customer participation in electricity systems has been facilitated by the deployment of advanced information and communications technology (ICT). U.S. utilities have now installed over 50 million smart meters, which automatically measure and report electricity consumption in short time intervals.57 Smart meters will enable new rate designs and services, greater choice and enhanced utility monitoring of distribution systems. ICT improvements also now allow system operators to have greater control over generation and load, from smart inverters on distributed solar systems to programmable loads that respond to price signals. Improvements in computing power enable collection and analysis of vast amounts of data, and more sophisticated modeling and analysis.
1.2.7 Implications for Resource Planning These six drivers — environmental and energy policies, natural gas reliance and price uncertainty, declining renewable technology costs, flat or declining load growth, changing customer preferences, and ICT improvements and deployment — will challenge the traditional resource planning paradigm in several ways. They will:
55 Data are from State of Hawaii Department of Business, Economic Development, and Tourism and Hawaii State Energy Office, “Hawaii Energy Facts & Figures,” 2014, http://energy.hawaii.gov/wp-content/uploads/2014/11/HSEO_FF_Nov2014.pdf. 56 Data are from Hawaiian Electric Companies (2016). 57 IEI (2014).
0
20
40
60
80
100
120
200120022003200420052006200720082009201020112012201320142015
Inst
alle
d Ca
paci
ty o
f Cus
tom
ers o
n N
EM
Tarif
f (M
W)
MECO
HELCO
HECO
Future Electric Utility Regulation / Report No. 6 21
• Change the drivers of investment decisions. Investment decisions were historically driven primarily by incremental load growth and resource adequacy focused on capacity. Increasingly, environmental regulations, low-cost energy resources, customer preferences and investments, and risk management will drive investment decisions.
• Create higher uncertainty and risk. Due to changing regulations, costs, technology, demand patterns, and customer behavior, utilities now face more uncertainty, from a greater variety of sources, than at any time in the industry’s history.
• Increase links among planning and regulatory processes. The emergence of lower-cost distributed generation, in particular, creates important feedbacks among bulk system resource planning, transmission planning, distribution system planning and ratemaking.58 A combination of lower-cost customer-side storage and advanced energy management and metering systems would accentuate these feedbacks.
• Challenge long-standing assumptions. Long-standing rules-of-thumb in resource planning — from resource adequacy metrics to the treatment of distributed generation and demand-side resources — may require revisiting.
• Enable more sophisticated analysis but require new forms of transparency. ICT improvements and deployment will enable higher resolution data collection and more sophisticated models and analysis. At the same time, resource planners will need to balance increased sophistication with the continued need for transparency and comprehensibility.
• Require coherence between short- and long-term planning horizons. Ensuring least-cost compliance with public policy goals that have multi-decadal compliance periods may require greater attention to outlying years and a greater focus on longer-term transition.
58 In this report, we focus on resource planning, including the emerging role for distributed generation within the resource planning process. A number of jurisdictions (e.g., CA, NY, HI, MN) are increasingly focusing on the impact of distributed generation in the distribution system planning process and in the transmission planning process (e.g., CAISO, PJM, ISO-NE). California’s Distribution Resource Plans (DRPs) and New York’s Distributed System Implementation Plans (DSIPs), for example, recognize the role that distributed generation can play in driving a need for distribution system upgrades or deferring traditional distribution system investments. Going forward, more information from distribution system planning will need to be brought into resource planning, in terms of the costs and benefits of distributed generation. In turn, resource planning decisions will impact distribution planning, increasing the need to integrate resource planning and distribution planning processes.

Future Electric Utility Regulation / Report No. 6 22
2. Report Approach and Scope
2.1 Approach This report examines current and evolving resource planning practices in five areas that will shape resource planning over the next two decades:
1) Central-scale generation; 2) Distributed generation; 3) Demand-side resources; 4) Transmission; and 5) Uncertainty and risk management.
Based on a review of resource planning practices for 10 utilities, it addresses four main questions:
1) How are utilities, RTOs/ISOs and states currently addressing each of these areas in resource planning processes?
2) What key issues are emerging for resource planning in each area? 3) What kinds of planning practices in each area will enable the electricity industry to more
proactively respond to a changing industry paradigm? 4) What are key considerations for regulators going forward?
The analysis in this report draws primarily on reviews of utility, RTO/ISO and public agency resource planning documents, focusing on a set of utilities that captures some of the diversity in industry structure across the United States. Casting a wider net, rather than limiting the scope to vertically integrated utilities and formal IRPs, complicates the analysis but allows the conclusions to have broader relevance.
2.2 Utilities and Jurisdictions Reviewed The review covers 10 utilities operating in different contexts and structures, including:
• More traditional vertically integrated utilities (Duke Energy Carolinas, Florida Power and Light, Georgia Power Company, Hawaiian Electric Companies, PacifiCorp), which play a dominant role in the resource planning process;
• A federal power authority (Tennessee Valley Authority), which conducts resource planning on behalf of local distribution utilities;
• Regulated utilities in wholesale generation markets (Southern California Edison, Northern States Power Company), where resource planning responsibilities are divided among utilities, an RTO/ISO and public agencies;
• Regulated utilities in markets with wholesale and retail competition (Consolidated Edison of New York, PECO Energy Company), where RTOs/ISOs and public agencies often take on larger planning responsibilities, and utilities play a more limited role in resource planning for default service customers.
Future Electric Utility Regulation / Report No. 6 23
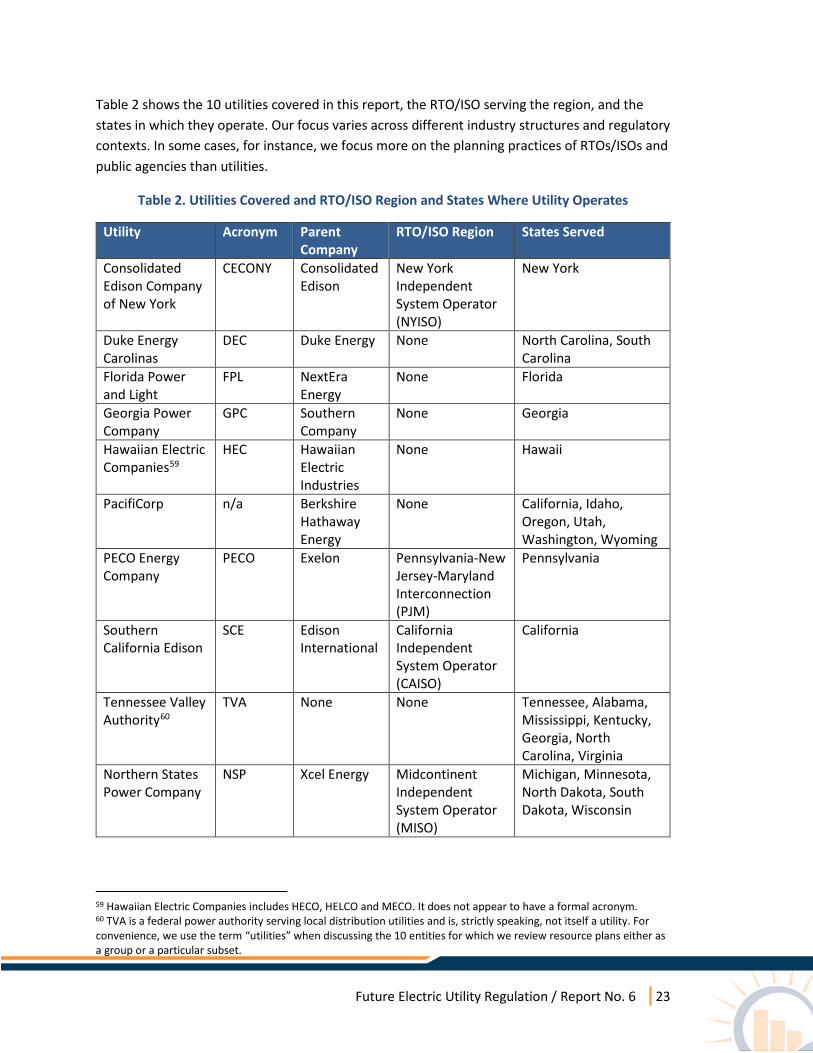
Table 2 shows the 10 utilities covered in this report, the RTO/ISO serving the region, and the states in which they operate. Our focus varies across different industry structures and regulatory contexts. In some cases, for instance, we focus more on the planning practices of RTOs/ISOs and public agencies than utilities.
Table 2. Utilities Covered and RTO/ISO Region and States Where Utility Operates
Utility Acronym Parent Company
RTO/ISO Region States Served
Consolidated Edison Company of New York
CECONY Consolidated Edison
New York Independent System Operator (NYISO)
New York
Duke Energy Carolinas
DEC Duke Energy None North Carolina, South Carolina
Florida Power and Light
FPL NextEra Energy
None Florida
Georgia Power Company
GPC Southern Company
None Georgia
Hawaiian Electric Companies59
HEC Hawaiian Electric Industries
None Hawaii
PacifiCorp n/a Berkshire Hathaway Energy
None California, Idaho, Oregon, Utah, Washington, Wyoming
PECO Energy Company
PECO Exelon Pennsylvania-New Jersey-Maryland Interconnection (PJM)
Pennsylvania
Southern California Edison
SCE Edison International
California Independent System Operator (CAISO)
California
Tennessee Valley Authority60
TVA None None Tennessee, Alabama, Mississippi, Kentucky, Georgia, North Carolina, Virginia
Northern States Power Company
NSP Xcel Energy Midcontinent Independent System Operator (MISO)
Michigan, Minnesota, North Dakota, South Dakota, Wisconsin
59 Hawaiian Electric Companies includes HECO, HELCO and MECO. It does not appear to have a formal acronym. 60 TVA is a federal power authority serving local distribution utilities and is, strictly speaking, not itself a utility. For convenience, we use the term “utilities” when discussing the 10 entities for which we review resource plans either as a group or a particular subset.
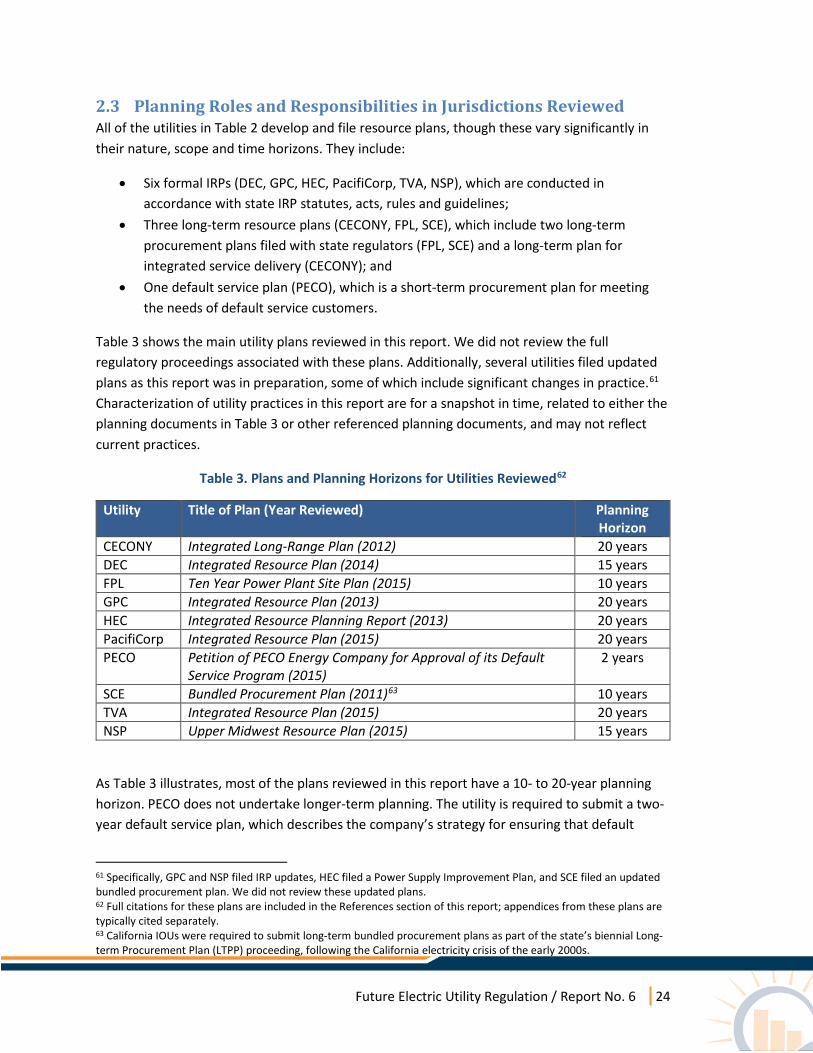
Future Electric Utility Regulation / Report No. 6 24
2.3 Planning Roles and Responsibilities in Jurisdictions Reviewed All of the utilities in Table 2 develop and file resource plans, though these vary significantly in their nature, scope and time horizons. They include:
• Six formal IRPs (DEC, GPC, HEC, PacifiCorp, TVA, NSP), which are conducted in accordance with state IRP statutes, acts, rules and guidelines;
• Three long-term resource plans (CECONY, FPL, SCE), which include two long-term procurement plans filed with state regulators (FPL, SCE) and a long-term plan for integrated service delivery (CECONY); and
• One default service plan (PECO), which is a short-term procurement plan for meeting the needs of default service customers.
Table 3 shows the main utility plans reviewed in this report. We did not review the full regulatory proceedings associated with these plans. Additionally, several utilities filed updated plans as this report was in preparation, some of which include significant changes in practice.61 Characterization of utility practices in this report are for a snapshot in time, related to either the planning documents in Table 3 or other referenced planning documents, and may not reflect current practices.
Table 3. Plans and Planning Horizons for Utilities Reviewed62
Utility Title of Plan (Year Reviewed) Planning Horizon
CECONY Integrated Long-Range Plan (2012) 20 years DEC Integrated Resource Plan (2014) 15 years FPL Ten Year Power Plant Site Plan (2015) 10 years GPC Integrated Resource Plan (2013) 20 years HEC Integrated Resource Planning Report (2013) 20 years PacifiCorp Integrated Resource Plan (2015) 20 years PECO Petition of PECO Energy Company for Approval of its Default
Service Program (2015) 2 years
SCE Bundled Procurement Plan (2011)63 10 years TVA Integrated Resource Plan (2015) 20 years NSP Upper Midwest Resource Plan (2015) 15 years
As Table 3 illustrates, most of the plans reviewed in this report have a 10- to 20-year planning horizon. PECO does not undertake longer-term planning. The utility is required to submit a two-year default service plan, which describes the company’s strategy for ensuring that default
61 Specifically, GPC and NSP filed IRP updates, HEC filed a Power Supply Improvement Plan, and SCE filed an updated bundled procurement plan. We did not review these updated plans. 62 Full citations for these plans are included in the References section of this report; appendices from these plans are typically cited separately. 63 California IOUs were required to submit long-term bundled procurement plans as part of the state’s biennial Long-term Procurement Plan (LTPP) proceeding, following the California electricity crisis of the early 2000s.
Future Electric Utility Regulation / Report No. 6 25
service customers have access to adequate electricity at least-cost over the following two years, and a five-year energy efficiency and conservation plan that describes the company’s strategy for meeting Pennsylvania’s energy efficiency standard.64
In California and New York, state agencies play an active role in resource planning. In California, the California Energy Commission (CEC) develops the load forecasts used by all parties in planning processes. The California Public Utilities Commission (CPUC) oversees short-term resource adequacy planning, long-term procurement planning, energy efficiency and distributed generation programs, and renewable energy planning and procurement. Over the past decade, investor-owned utilities’ role in the planning process was largely relegated to compliance planning within individual CPUC proceedings. Legislation passed in September 2015 requires the CPUC to develop an IRP process for all load serving entities (LSEs), commencing in 2017,65 which will, in principle, shift more comprehensive planning responsibility back to utilities.
In New York, the New York State Energy Research and Development Authority (NYSERDA) is responsible for renewable energy procurement and managing demand-side programs. Other bulk power system resource planning responsibilities reside with the NYISO. Distribution utilities, such as CECONY, are not required to submit procurement plans for default service, but play an active role in planning for investments in demand-side resources.66 New York’s Reforming the Energy Vision (REV) initiative aims to shift the state toward cleaner, more distributed energy resources by transforming utility business and regulatory models.67 REV implementation will likely have important implications for resource planning in the state.
MISO (NSP) and PJM (PECO) both have regional planning responsibilities. Both RTOs oversee regional reliability planning, allocate capacity obligations to participating LSEs, and administer forward capacity markets to meet residual local and system resource needs.68 MISO, PJM, CAISO and NYISO have transmission planning processes that intersect with resource planning, as described further in Section 3 of this report.
64 Pennsylvania’s Act 129 (2008) established electricity savings targets for distribution utilities over the period 2011 through 2020, which are being implemented through the Pennsylvania Public Utilities Commission’s Energy Efficiency and Conservation (EE&C) Program. The Program has three phases, the first two of which had three-year targets. The final and current phase has a five-year target, which corresponds to the planning horizon described here. 65 Senate Bill No. 350, “Clean Energy and Pollution Reduction Act of 2015,” https://leginfo.legislature.ca.gov/faces/billTextClient.xhtml?bill_id=201520160SB350. 66 The prudency of CECONY’s procurement strategy is reviewed in rate cases. 67 For more on the REV initiative, see http://www3.dps.ny.gov/W/PSCWeb.nsf/All/CC4F2EFA3A23551585257DEA007DCFE2?OpenDocument. 68 MISO’s tariff allows states to set planning reserve margins that are different than those established through its resource adequacy process. If states do not set their own planning reserve margin, MISO’s value is used as a default value.

Future Electric Utility Regulation / Report No. 6 26
3. Current Resource Planning Practices
3.1 Central-scale Generation
3.1.1 Background In terms of its implications for resource planning practices, the most important central-scale resource in the near- to medium-term future is renewable energy. A combination of federal environmental policies, state RPS targets and technology cost declines are driving higher penetrations of central-scale renewable energy, particularly solar PV and wind energy. Solar PV and wind generation differ from conventional thermal and hydropower resources in their physical and economic characteristics (see Appendix 1 for a detailed description), requiring changes in resource planning practices to better accommodate them.
Two changes are particularly important. First, investments in solar PV and wind capacity were historically driven by RPS targets, but are increasingly being driven by economics and environmental regulations. Incorporating solar PV and wind into a least-cost portfolio is requiring changes in evaluation techniques. Second, due to their variability and limited predictability, solar PV and wind impact the reliability and operation of power systems in ways that are different from conventional resources. Accurately incorporating these impacts into resource planning is also requiring new analytical techniques.
Future Electric Utility Regulation / Report No. 6 27
Non-Renewable Central-Scale Generation Resources in Resource Planning
Although central-scale renewable energy will likely have the largest impact on resource planning methods over the next decade, changes in regulation, economics and technology for other central-scale resources will also have important implications for resource planning outcomes. These changes include:
1. The level of, and uncertainty in, natural gas fuel prices; 2. More stringent environmental regulations on coal-fired power plants; and 3. Regulatory changes and technological breakthroughs for nuclear power plants.
As discussed in Section 1.2, natural gas price trends have a significant impact on resource investment decisions, affecting both their timing and cost-effectiveness. More stringent environmental regulations will affect the timing of retirement decisions for existing coal-fired units, as well as investment decisions for replacing their capacity and energy. Commercially viable carbon capture and sequestration could enable the development of new coal-fired units. However, without very high CO2 capture rates, their deployment may not be consistent with states’ long-term GHG goals.*
Resolving these longer-term transition issues is a critical nearer-term problem for resource planners. Given the long lifespans of generation and transmission infrastructure, much of what utilities and developers build over the next decade will still be operational in 2050, the target year for most states’ long-term GHG goals.
Advanced nuclear technologies have the potential to have a transformative impact on the electricity sector. These technologies — using new reactor designs and alternative coolants — promise to be safer, smaller and more modular, more reliable, and lower cost than the existing fleet of large, light water-cooled reactors in the United States. Commercialization of these technologies will likely require significant regulatory changes, greater financial certainty, and stronger political support, making their future uncertain.
A significant scale-up of nuclear power in the United States would have important implications for resource planning. U.S. nuclear plants are generally treated as non-dispatchable units, operating at or close to their rated capacity in all hours where they are available. Like solar and wind resources, this means that they could have higher integration costs at higher penetrations, requiring similar integration solutions — more regional coordination, transmission, energy storage and flexible loads. Accurately evaluating higher penetrations of nuclear energy thus requires modeling innovations that are similar to those needed for solar and wind energy.
* See, for instance, Williams et al. (2014).
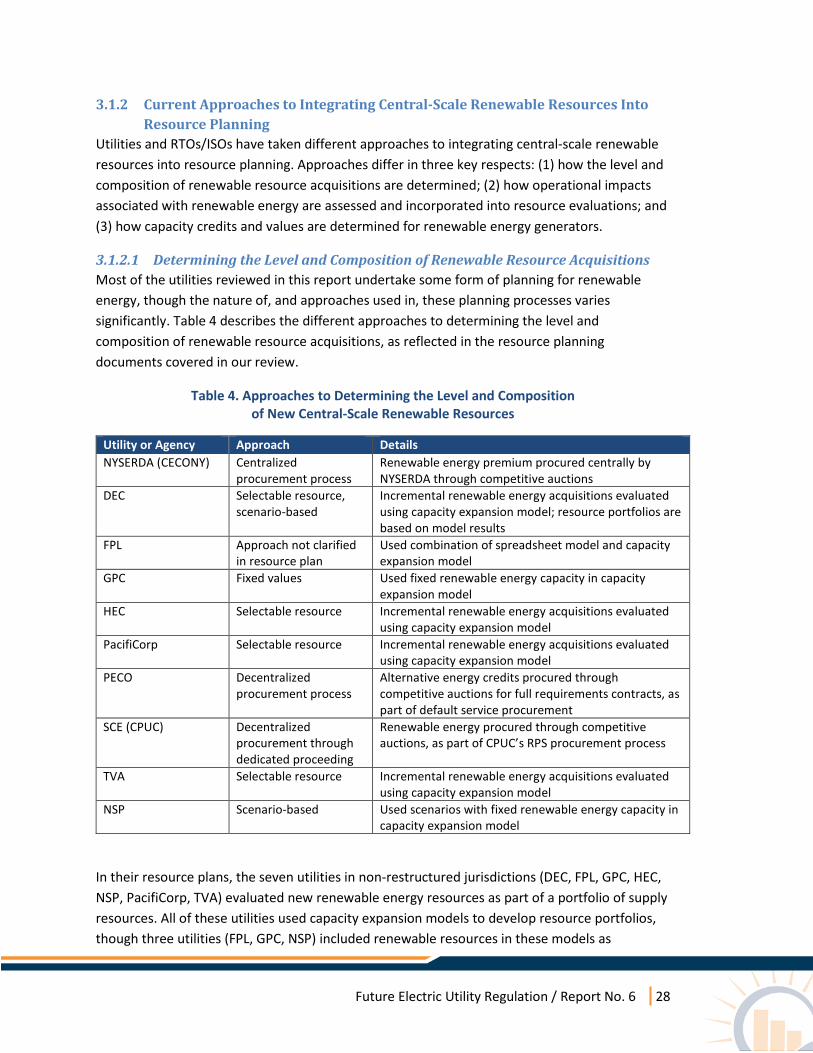
Future Electric Utility Regulation / Report No. 6 28
3.1.2 Current Approaches to Integrating Central-Scale Renewable Resources Into Resource Planning
Utilities and RTOs/ISOs have taken different approaches to integrating central-scale renewable resources into resource planning. Approaches differ in three key respects: (1) how the level and composition of renewable resource acquisitions are determined; (2) how operational impacts associated with renewable energy are assessed and incorporated into resource evaluations; and (3) how capacity credits and values are determined for renewable energy generators.
3.1.2.1 Determining the Level and Composition of Renewable Resource Acquisitions Most of the utilities reviewed in this report undertake some form of planning for renewable energy, though the nature of, and approaches used in, these planning processes varies significantly. Table 4 describes the different approaches to determining the level and composition of renewable resource acquisitions, as reflected in the resource planning documents covered in our review.
Table 4. Approaches to Determining the Level and Composition of New Central-Scale Renewable Resources
Utility or Agency Approach Details NYSERDA (CECONY) Centralized
procurement process Renewable energy premium procured centrally by NYSERDA through competitive auctions
DEC Selectable resource, scenario-based
Incremental renewable energy acquisitions evaluated using capacity expansion model; resource portfolios are based on model results
FPL Approach not clarified in resource plan
Used combination of spreadsheet model and capacity expansion model
GPC Fixed values Used fixed renewable energy capacity in capacity expansion model
HEC Selectable resource Incremental renewable energy acquisitions evaluated using capacity expansion model
PacifiCorp Selectable resource Incremental renewable energy acquisitions evaluated using capacity expansion model
PECO Decentralized procurement process
Alternative energy credits procured through competitive auctions for full requirements contracts, as part of default service procurement
SCE (CPUC) Decentralized procurement through dedicated proceeding
Renewable energy procured through competitive auctions, as part of CPUC’s RPS procurement process
TVA Selectable resource Incremental renewable energy acquisitions evaluated using capacity expansion model
NSP Scenario-based Used scenarios with fixed renewable energy capacity in capacity expansion model
In their resource plans, the seven utilities in non-restructured jurisdictions (DEC, FPL, GPC, HEC, NSP, PacifiCorp, TVA) evaluated new renewable energy resources as part of a portfolio of supply resources. All of these utilities used capacity expansion models to develop resource portfolios, though three utilities (FPL, GPC, NSP) included renewable resources in these models as

Future Electric Utility Regulation / Report No. 6 29
predetermined scenarios rather than as “selectable” resources — resources that the model selects because they are least-cost.69
With continued reductions in capital costs, and particularly with modest CO2 market prices (where applicable) or CO2 price adders (commonly used in resource planning models), solar and wind generation will become cost-effective options in least-cost expansion plans, beyond RPS requirements.70 This shift is reflected in some of the utility plans we reviewed. For instance, DEC found that solar energy became economical with combinations of moderate reductions in capital costs and a CO2 price, or with more significant reductions in capital costs and without a CO2 price. In its plan, FPL noted that, “the declining costs of PV modules have resulted, for the first time, in utility scale PV now being competitive on FPL’s system at specific, highly advantaged sites.”71
For utilities that treat solar and wind energy as selectable resources, these resources will grow as a share of resource portfolios as they become cost-effective. For those that do not, cost-effective solar and wind energy must be captured through separate studies or “high renewable” scenarios that examine the total revenue requirement of a portfolio with more wind and solar energy relative to one that has less. In some states, IRP guidelines require utilities to treat renewable energy as a selectable resource.72 The choice of capacity expansion model also plays a role in determining how renewable energy is treated in portfolio development.73
In restructured jurisdictions, planning for central-scale renewable energy occurs during procurement processes. In California (SCE), the CPUC oversees a dedicated RPS procurement proceeding, in which LSEs procure renewable energy through competitive auctions to meet the state’s RPS target.74 New York is unique among the states in Table 4, in that a state agency, NYSERDA, centrally procures renewable energy on behalf of utility customers, subject to a
69 A “predetermined scenario” approach incorporates a predetermined installed capacity of a resource, whereas a “selectable resource” approach selects the installed capacity of the resource based on total cost minimization. 70 Solar and wind energy may be cost-effective even when there is no load growth. In this case, the breakeven point for solar and wind energy occurs when the levelized cost of the solar or wind resource plus integration costs is less than the incremental cost of the resources they replace, including environmental costs. For instance, if all replaced resources are gas-fired units with an average net heat rate of 9,000 Btu/kWh, a $4/MMBtu delivered natural gas price, a $20/tCO2 price, and no incremental integration costs, the breakeven price for solar or wind as an “energy-only resource” will be $46/MWh. 71 FPL (2015, p. 9). 72 For instance, Oregon’s IRP Guideline 1(a) requires that “consistent assumptions and methods should be used for evaluation of all resources” (OPUC, 2007). 73 The three utilities that treat renewable energy generation as a selectable resource (DEC, PacifiCorp, TVA) use a linear programming (LP)/mixed integer programming (MIP) model to build generation portfolios. The remaining utilities use dynamic programming (DP) models for building portfolios. LP/MIP models assume perfect foresight, but by doing so they greatly simplify the number of potential solutions the model must evaluate. DP models solve sequentially (i.e., the solution in period 2 depends on the solution in period 1). Thus, they provide greater insight on path-dependent changes but require evaluating a larger number of potential solutions. As a result, DP models are not well suited to modeling renewable energy as a selectable resource. For a more detailed discussion of difficulties with treating capacity-limited renewable resources in DP models, see NSP (2015a, pp. 33–34). 74 For an overview of California RPS procurement plans, see CPUC (2014a).

Future Electric Utility Regulation / Report No. 6 30
maximum budget constraint.75 In Pennsylvania, PECO and other distribution companies procure alternative energy credits (AECs) to meet the state’s Alternative Energy Portfolio Standards (AEPS) requirements, as part of their default service procurement.76 In all three states, renewable energy investment is currently driven by RPS (or AEPS) standards, though in principle it could exceed these standards if renewable energy generation is cost competitive.
These three states — California, New York and Pennsylvania — represent very different approaches to determining the composition of renewable energy acquisitions. In California, LSEs procure the full value of renewable energy to meet the state’s RPS target through long-term contracts. Renewable energy contracts (and potentially energy storage) procured through the RPS proceeding have energy, capacity and ancillary services benefits. CAISO market revenues result in lower procurement costs.77 Ensuring a least-cost mix of renewable energy requires LSEs to evaluate these benefits, which they do through a common but differentiated “least-cost, best-fit” methodology.78
In New York, NYSERDA procures renewable premiums, the difference between renewable generation costs and NYISO wholesale market revenues, which are paid for through a system benefits charge on customer bills. Because a significant share of renewable generators’ revenues is tied to wholesale markets, planning responsibilities for ensuring a least-cost mix of renewable resources are, to a large extent, decentralized to generators. In Pennsylvania, PECO procures AECs as part of full requirements contracts to meet the demands of its default service customers. These contracts require suppliers to provide the capacity, energy, ancillary services, and AECs required to meet their share of PECO demand over the contract. This approach also decentralizes least-cost planning responsibilities to suppliers.
3.1.2.2 Assessing Operational Impacts from Renewable Generation The jurisdictions reviewed here are at different stages in terms of incorporating the operational impacts of renewable energy into their planning and procurement processes (Table 5). A number of utilities and RTOs/ISOs have supported separate renewable integration studies. Some utilities in non-restructured jurisdictions (DEC, PacifiCorp, NSP) incorporated solar and wind generation-specific fixed cost adders ($/MWh) from integration studies into the resource plans reviewed in this report. In New York and Pennsylvania, the onus for assessing and absorbing integration costs lies with generators rather than utilities. In California, utilities calculate
75 Specifically, “NYSERDA pays a production incentive to renewable electricity generators selected through competitive solicitations for the electricity they deliver for end use in New York. In exchange for receiving the production incentive, the renewable generator transfers to NYSERDA all rights and/or claims to the RPS Attributes associated with each MWh of renewable electricity generated, and guarantees delivery of the associated electricity to the New York State ratepayers.” http://www.nyserda.ny.gov/All-Programs/Programs/Main-Tier/History. For an overview of NYSERDA’s RPS program, see NYSERDA (2013). This approach will likely change under New York’s Clean Energy Standard, which became effective in August 2016. 76 For an overview of AEPS requirements and PECO’s procurement strategies, see PECO (2014a). 77 In California, LSEs schedule most renewable generation into the CAISO market and earn market revenues that reduce their procurement costs for energy and, to a lesser extent, ancillary services. Renewable generation reduces an LSE’s generation capacity costs by reducing its resource adequacy obligations. 78 CPUC (2004).
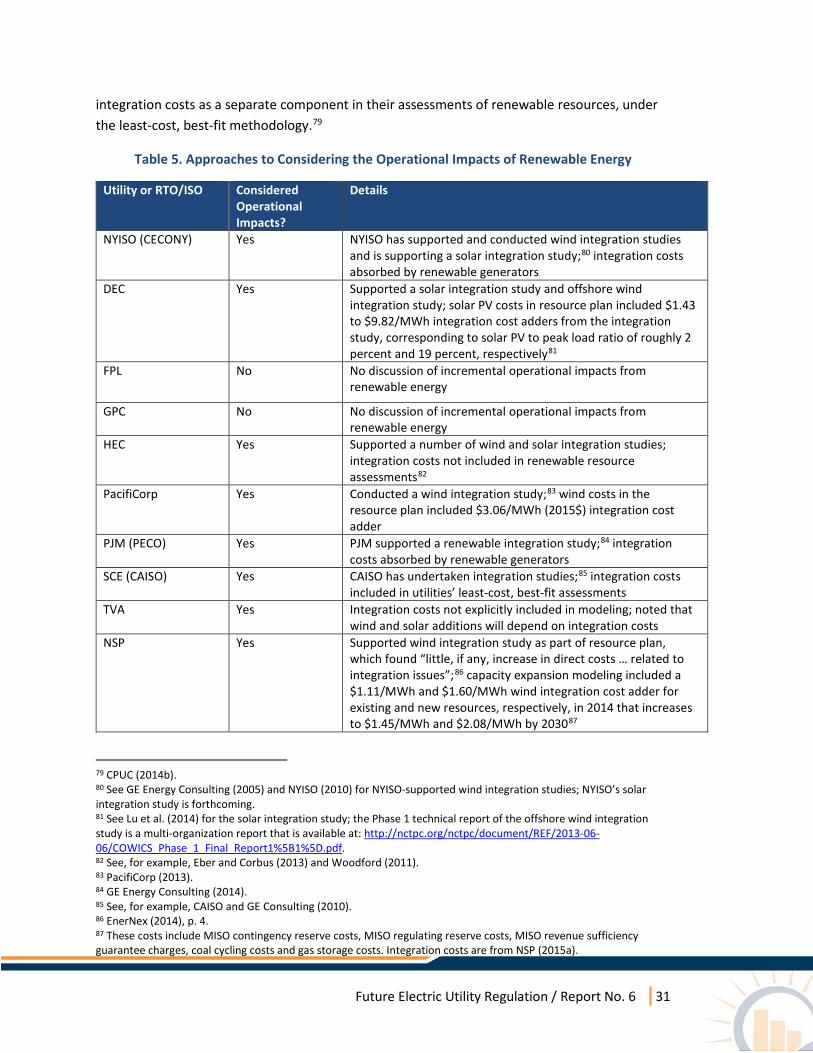
Future Electric Utility Regulation / Report No. 6 31
integration costs as a separate component in their assessments of renewable resources, under the least-cost, best-fit methodology.79
Table 5. Approaches to Considering the Operational Impacts of Renewable Energy
Utility or RTO/ISO Considered Operational Impacts?
Details
NYISO (CECONY) Yes NYISO has supported and conducted wind integration studies and is supporting a solar integration study;80 integration costs absorbed by renewable generators
DEC Yes Supported a solar integration study and offshore wind integration study; solar PV costs in resource plan included $1.43 to $9.82/MWh integration cost adders from the integration study, corresponding to solar PV to peak load ratio of roughly 2 percent and 19 percent, respectively81
FPL No No discussion of incremental operational impacts from renewable energy
GPC No No discussion of incremental operational impacts from renewable energy
HEC Yes Supported a number of wind and solar integration studies; integration costs not included in renewable resource assessments82
PacifiCorp Yes Conducted a wind integration study;83 wind costs in the resource plan included $3.06/MWh (2015$) integration cost adder
PJM (PECO) Yes PJM supported a renewable integration study;84 integration costs absorbed by renewable generators
SCE (CAISO) Yes CAISO has undertaken integration studies;85 integration costs included in utilities’ least-cost, best-fit assessments
TVA Yes Integration costs not explicitly included in modeling; noted that wind and solar additions will depend on integration costs
NSP Yes Supported wind integration study as part of resource plan, which found “little, if any, increase in direct costs … related to integration issues”;86 capacity expansion modeling included a $1.11/MWh and $1.60/MWh wind integration cost adder for existing and new resources, respectively, in 2014 that increases to $1.45/MWh and $2.08/MWh by 203087
79 CPUC (2014b). 80 See GE Energy Consulting (2005) and NYISO (2010) for NYISO-supported wind integration studies; NYISO’s solar integration study is forthcoming. 81 See Lu et al. (2014) for the solar integration study; the Phase 1 technical report of the offshore wind integration study is a multi-organization report that is available at: http://nctpc.org/nctpc/document/REF/2013-06-06/COWICS_Phase_1_Final_Report1%5B1%5D.pdf. 82 See, for example, Eber and Corbus (2013) and Woodford (2011). 83 PacifiCorp (2013). 84 GE Energy Consulting (2014). 85 See, for example, CAISO and GE Consulting (2010). 86 EnerNex (2014), p. 4. 87 These costs include MISO contingency reserve costs, MISO regulating reserve costs, MISO revenue sufficiency guarantee charges, coal cycling costs and gas storage costs. Integration costs are from NSP (2015a).
Future Electric Utility Regulation / Report No. 6 32
Most integration studies suggest that, at renewable energy penetrations that utilities are planning for over the next decade, integration costs will be negligible to low. 88 For instance, GE Energy Consulting’s renewable integration study for PJM found that “the PJM system, with adequate transmission expansion and additional regulating reserves, will not have any significant issues operating with up to 30 percent of its energy provided by wind and solar generation.”89 Section 4 discusses the challenges faced by California and Hawaii, which are moving more quickly than other states toward higher penetrations of renewable energy — 50 percent and 40 percent of sales, respectively, by 2030.
3.1.2.3 Determining the Capacity Credit and Value of Renewable Generators Utilities and RTOs/ISOs also differ in the methods they use to calculate the contribution of solar PV and wind to resource adequacy. Non-RTO utilities use these capacity credit values to determine how much solar PV and wind should count toward total resource adequacy needs in their resource plans. PJM, MISO and NYISO use these values to determine the eligible capacity of solar PV and wind generation in capacity markets. In California, utilities use these values to calculate the contribution of solar PV and wind to resource adequacy, as well as their capacity value in least-cost, best fit valuations under the state’s RPS program.
Across jurisdictions, there are four general approaches to calculating capacity credit values for solar PV and wind generation:90
• Rule-of-thumb — an approximate value based on values used in other jurisdictions; • Net capacity factor — solar PV and wind generation in peak demand periods, or hours
with highest loss-of-load probability (LOLP),91 divided by total net rated capacity during those periods;
• Exceedance probability — probability that a resource’s net capacity factor will exceed a specified level during peak demand periods; and
• Reliability-based — marginal impact of resource on local or system loss-of-load probability, with the effective load carrying capability (ELCC) as the most commonly used approach.
Table 6 shows the various approaches used by utilities and RTOs/ISOs in the planning documents reviewed in this report.
88 For an overview of the industry consensus on integration costs, see Milligan et al. (2015). 89 GE Energy Consulting (2014), pp. 6–7. 90 For an overview of approaches, see Madaeni et al. (2012). 91 LOLP is the probability that load exceeds available generation in a given hour.
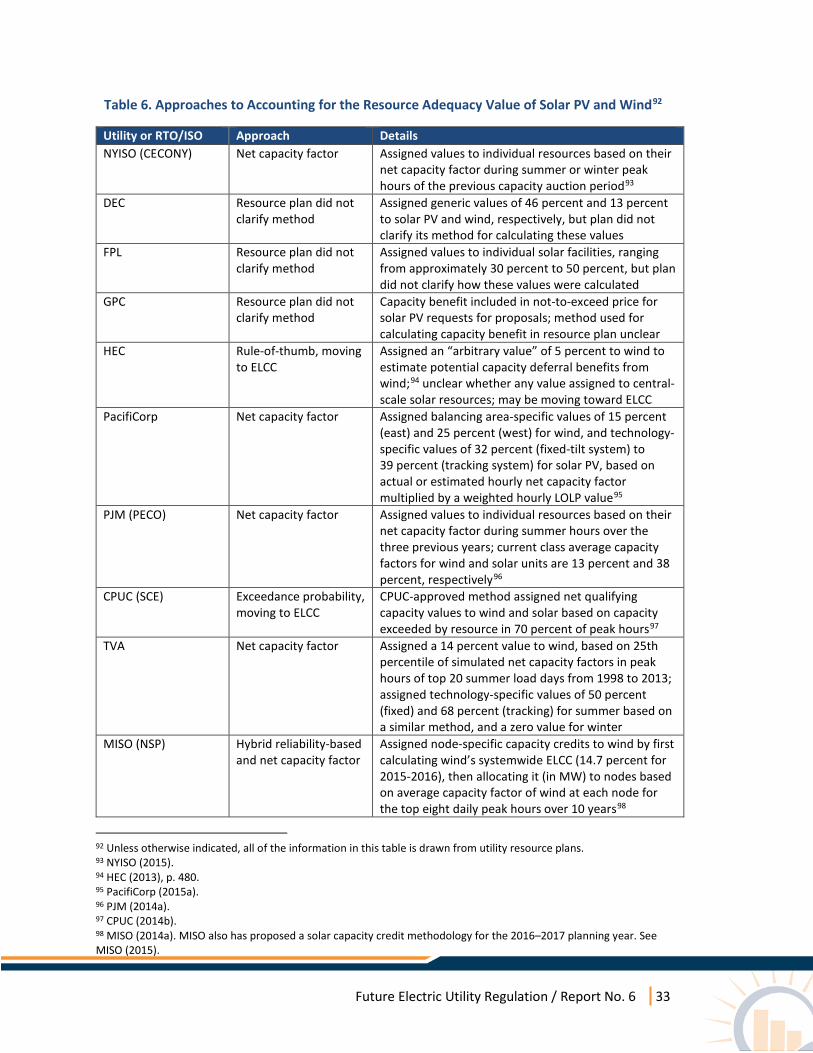
Future Electric Utility Regulation / Report No. 6 33
Table 6. Approaches to Accounting for the Resource Adequacy Value of Solar PV and Wind92
Utility or RTO/ISO Approach Details NYISO (CECONY) Net capacity factor Assigned values to individual resources based on their
net capacity factor during summer or winter peak hours of the previous capacity auction period93
DEC Resource plan did not clarify method
Assigned generic values of 46 percent and 13 percent to solar PV and wind, respectively, but plan did not clarify its method for calculating these values
FPL Resource plan did not clarify method
Assigned values to individual solar facilities, ranging from approximately 30 percent to 50 percent, but plan did not clarify how these values were calculated
GPC Resource plan did not clarify method
Capacity benefit included in not-to-exceed price for solar PV requests for proposals; method used for calculating capacity benefit in resource plan unclear
HEC Rule-of-thumb, moving to ELCC
Assigned an “arbitrary value” of 5 percent to wind to estimate potential capacity deferral benefits from wind;94 unclear whether any value assigned to central-scale solar resources; may be moving toward ELCC
PacifiCorp Net capacity factor Assigned balancing area-specific values of 15 percent (east) and 25 percent (west) for wind, and technology-specific values of 32 percent (fixed-tilt system) to 39 percent (tracking system) for solar PV, based on actual or estimated hourly net capacity factor multiplied by a weighted hourly LOLP value95
PJM (PECO) Net capacity factor Assigned values to individual resources based on their net capacity factor during summer hours over the three previous years; current class average capacity factors for wind and solar units are 13 percent and 38 percent, respectively96
CPUC (SCE) Exceedance probability, moving to ELCC
CPUC-approved method assigned net qualifying capacity values to wind and solar based on capacity exceeded by resource in 70 percent of peak hours97
TVA Net capacity factor Assigned a 14 percent value to wind, based on 25th percentile of simulated net capacity factors in peak hours of top 20 summer load days from 1998 to 2013; assigned technology-specific values of 50 percent (fixed) and 68 percent (tracking) for summer based on a similar method, and a zero value for winter
MISO (NSP) Hybrid reliability-based and net capacity factor
Assigned node-specific capacity credits to wind by first calculating wind’s systemwide ELCC (14.7 percent for 2015-2016), then allocating it (in MW) to nodes based on average capacity factor of wind at each node for the top eight daily peak hours over 10 years98
92 Unless otherwise indicated, all of the information in this table is drawn from utility resource plans. 93 NYISO (2015). 94 HEC (2013), p. 480. 95 PacifiCorp (2015a). 96 PJM (2014a). 97 CPUC (2014b). 98 MISO (2014a). MISO also has proposed a solar capacity credit methodology for the 2016–2017 planning year. See MISO (2015).
Future Electric Utility Regulation / Report No. 6 34
3.2 Distributed Generation
3.2.1 Background Rising interest and rapid growth in distributed generation are making it increasingly important to consider in resource planning. Distributed generation includes generating resources that are located near loads (often behind the customer meter, though not exclusively) and are small in size (generally smaller than 5 MW, with many smaller than even 10 kW).99 Distributed generation most frequently refers to distributed solar PV systems, combined heat and power (CHP), and reciprocating engines (i.e., backup generators), though it may also include other technologies.
Distributed generation has a number of unique characteristics that need to be considered in resource planning:
• The decision to adopt distributed generation is largely outside the direct control of utility planners, though utilities can indirectly influence adoption though retail rate design as described below. Similarly, utilities often do not have direct influence of the location of distributed generation.100
• The dispatch or generation profile of distributed generation is driven by factors like weather (e.g., solar PV) or heating needs (e.g., CHP) rather than the needs of the utility.
• Utilities and RTOs/ISOs may have limited controllability and even limited visibility of distributed generation.
One of the main challenges with incorporating distributed generation into utility planning is that many factors, some of which are uncertain, drive its adoption. These include the following:
• Customer preferences — for generating their own power versus buying all power from a utility.
• Retail rate design — the amount utility bills can be reduced with distributed generation depends on the availability of programs like net energy metering; the magnitude of a fixed customer charge; the presence and magnitude of tiered volumetric rates; the presence, magnitude and design of a demand charge; the
99 For example, the Department of Energy’s SunShot program defines solar PV rooftop systems of any size, and ground-mounted systems up to 5 MWAC, as distributed generation, regardless of whether electricity is delivered to the customer side or utility side of the electrical meter. However, these categories consist mostly of systems installed behind the customer meter. See Barbose et al. (2015). 100 In the cases where the utility is procuring distributed generation, it can directly influence the location through requirements outlined in its request for proposals. Utilities also can identify priority locations for utility-owned distributed generation.
Future Electric Utility Regulation / Report No. 6 35
applicability of standby charges;101 and expectations for changes in the level of utility rates.
• Technology performance and cost — the cost of distributed solar has fallen precipitously over the past 5 years. Similar cost reductions and performance improvements in other technologies will increase their attractiveness to customers.
• Incentives — utilities and state programs provide incentives for various kinds of distributed generation. Federal incentives are also important. For instance, the recently extended solar investment tax credit has a significant effect on the economics of distributed PV, and changes in the tax credit will shape adoption over time.
• New business models — third-party ownership of and new financing options for distributed generation reduce barriers for customers that cannot afford the upfront cost or who do not want to maintain a distributed system.
• PURPA — utilities in some areas purchase power from qualifying facilities, including renewables and CHP, at avoided cost rates under federal PURPA regulations.102
• Mandates — some state RPS rules require a certain portion of the RPS target to be met with distributed resources.
These two factors — unique characteristics and uncertain adoption — have a number of implications for resource planning. First, forecasts of the timing and quantity of customer adoption of distributed generation will have an increasingly important impact on utility resource plans. Thus, improving utility forecasts of customer adoption of distributed generation will grow in importance. The uncertainty in distributed generation adoption further complicates the planning task, though it is ultimately not dissimilar from the uncertainties associated with energy efficiency or natural gas prices.
In addition, utility resource planners will also need to ensure that the bulk power system will be able to operate reliably with the expected levels of distributed generation. Along the same lines, planners will need to be able to account for the changes distributed generation will have on the need for, or relative attractiveness of, different resource options. Finally, utility planners have the opportunity in the planning process to target distributed generation adoption such that it can produce the greatest benefit to all customers.
3.2.2 Approaches to Integrating Distributed Generation Into Resource Planning103 Nearly all of the utilities reviewed in this report treated the quantity of distributed generation in future years to be exogenous to the planning process. This means that, instead of using the planning process to determine how much distributed generation to anticipate or procure, the 101 Standby charges are charges levied by utilities on customers who operate onsite, non-emergency generation. They may include backup, supplemental, or economic replacement power and delivery services. See Selecky et al. (2014). 102 PURPA and associated FERC regulations encourage the development of efficient CHP and small renewable energy facilities by independent power producers. PURPA requires non-discriminatory interconnection and backup power policies and pricing. 103 For more information on existing practices and emerging best practices for integrating distributed generation into resource planning, see Mills et al. 2016.

Future Electric Utility Regulation / Report No. 6 36
utilities instead used separate forecasts of distributed generation to adjust their residual resource needs.104 Two exceptions are HEC and TVA, where distributed generation was treated both as an exogenous factor and as a selectable resource option in their capacity expansion modeling.105
The approaches used to integrate distributed generation into resource planning vary considerably across jurisdictions. Here we examine four key differences: (1) approaches to forecasting distributed generation and incorporating forecast uncertainty into planning; (2) methods for assessing system integration of distributed generation; (3) approaches to accounting for distributed generation in transmission planning; and (4) approaches to targeting distributed generation.
3.2.2.1 Forecasting Distributed Generation and Managing Forecast Uncertainty There are four general approaches to creating forecasts of distributed generation:
1) No Forecast. The utility does not create an independent forecast for its planning purposes.
2) Program Goals. The level of distributed generation in the forecast is based only on the utility program goals, without further adjustment based on expectations of customer preferences.
3) Single Forecast. The level of distributed generation in the forecast is based on a single projection of distributed generation adoption, based on customer preferences.
4) Multiple Forecasts. Multiple scenarios of distributed generation adoption are used in planning, based on uncertain factors that may impact customer preferences.
Table 7 shows the different approaches to distributed generation forecasting used by the 10 utilities in the resource plans reviewed in this report.
104 This is in contrast to recent distribution planning efforts, such as the California DRPs and the New York DSIPs, where attention is more directed at identifying opportunities for distributed generation to be deployed as a resource to defer distribution upgrades. 105 TVA included distributed PV on commercial buildings along with utility-scale PV as options to meet future needs. TVA assumed that distributed PV has a higher upfront cost than utility-scale solar and no other offsetting benefits of distributed generation were explicitly included in the model, leading to the finding that distributed PV is never more attractive than utility-scale PV.
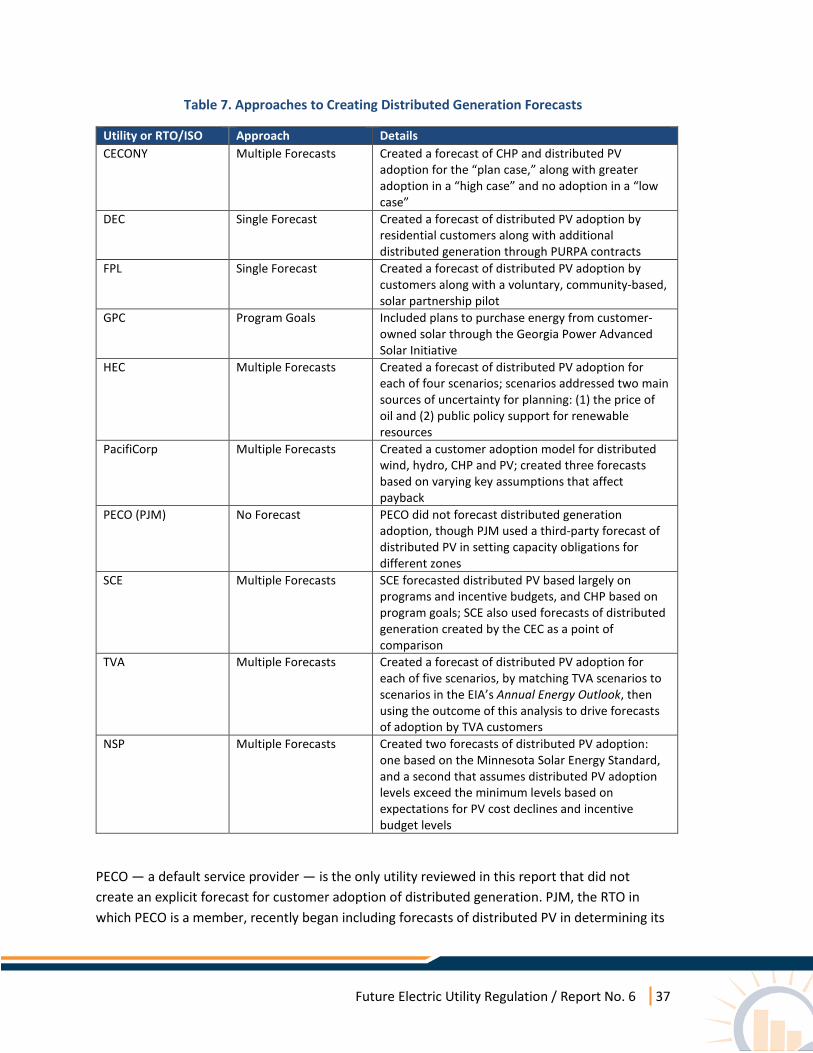
Future Electric Utility Regulation / Report No. 6 37
Table 7. Approaches to Creating Distributed Generation Forecasts
Utility or RTO/ISO Approach Details CECONY Multiple Forecasts Created a forecast of CHP and distributed PV
adoption for the “plan case,” along with greater adoption in a “high case” and no adoption in a “low case”
DEC Single Forecast Created a forecast of distributed PV adoption by residential customers along with additional distributed generation through PURPA contracts
FPL Single Forecast Created a forecast of distributed PV adoption by customers along with a voluntary, community-based, solar partnership pilot
GPC Program Goals Included plans to purchase energy from customer-owned solar through the Georgia Power Advanced Solar Initiative
HEC Multiple Forecasts Created a forecast of distributed PV adoption for each of four scenarios; scenarios addressed two main sources of uncertainty for planning: (1) the price of oil and (2) public policy support for renewable resources
PacifiCorp Multiple Forecasts Created a customer adoption model for distributed wind, hydro, CHP and PV; created three forecasts based on varying key assumptions that affect payback
PECO (PJM) No Forecast PECO did not forecast distributed generation adoption, though PJM used a third-party forecast of distributed PV in setting capacity obligations for different zones
SCE Multiple Forecasts SCE forecasted distributed PV based largely on programs and incentive budgets, and CHP based on program goals; SCE also used forecasts of distributed generation created by the CEC as a point of comparison
TVA Multiple Forecasts Created a forecast of distributed PV adoption for each of five scenarios, by matching TVA scenarios to scenarios in the EIA’s Annual Energy Outlook, then using the outcome of this analysis to drive forecasts of adoption by TVA customers
NSP Multiple Forecasts Created two forecasts of distributed PV adoption: one based on the Minnesota Solar Energy Standard, and a second that assumes distributed PV adoption levels exceed the minimum levels based on expectations for PV cost declines and incentive budget levels
PECO — a default service provider — is the only utility reviewed in this report that did not create an explicit forecast for customer adoption of distributed generation. PJM, the RTO in which PECO is a member, recently began including forecasts of distributed PV in determining its

Future Electric Utility Regulation / Report No. 6 38
zonal capacity obligations, or forecast pool requirement.106 An outside consultant generated distributed PV forecasts for PJM using a proprietary method.107
GPC did not directly forecast customer adoption of distributed generation, but instead used program goals in its planning process. DEC and FPL created a single forecast of distributed PV adoption. DEC’s forecast included both residential customers that adopt distributed PV and distributed generation installations that sign PURPA contracts. FPL’s forecast included a pilot program for a voluntary, community-based solar partnership.
The remaining utilities (CECONY, HEC, PacifiCorp, SCE, TVA and NSP) all created multiple forecasts of distributed generation adoption, though their forecasting methods varied. A common approach was to create forecasts that represent “what-if” scenarios where distributed generation adoption is consistent with other factors in the scenario. HEC, for example, considered oil prices and public support for renewables to be two of the biggest sources of uncertainty facing the utility. The utility created four scenarios that cover different potential outcomes (e.g., high oil prices and high public support). For each scenario, it created a distributed PV forecast that was consistent with the scenario (e.g., higher distributed PV adoption rates for scenarios with high public support).
TVA followed a similar approach to creating internally consistent scenarios, though it tied its increased distributed generation scenarios to scenario assumptions in the EIA’s Annual Energy Outlook and used outcomes from the EIA analysis to drive different forecasts of adoption by TVA customers. Alternatively, PacifiCorp created different forecasts based on a market diffusion model of adoption that used customers’ payback periods to drive adoption rates. PacifiCorp used the model to create three forecasts by varying key assumptions that impact the customer’s payback period (e.g., technology performance, cost, and future rates), thereby significantly changing the forecast of distributed generation adoption.
The utilities that created multiple distributed generation adoption forecasts had different ways of using the forecasts in the planning process. To some extent, these differences stem from differences in how utilities approach uncertainty and risk management. For example, CECONY created a single plan using a middle case distributed generation forecast, then used a high and low distributed generation case to establish “signposts” that could indicate if the actual conditions facing the utility were deviating significantly from the expected conditions used to make the plan. If such signposts were met, CECONY would need to revisit its plan under the new conditions.
More frequently, utilities created a new resource portfolio for each scenario with unique distributed generation forecasts. Several utilities (SCE, NSP and HEC) developed a plan for each scenario and then simply reported the costs and needs under each scenario. PacifiCorp used the different plans from each scenario to create a “long term acquisition path analysis.” This analysis
106 Falin (2015). 107 Shafer (2015).

Future Electric Utility Regulation / Report No. 6 39
established trigger events, including higher or lower sustained levels of distributed generation adoption, that would change PacifiCorp’s resource acquisition strategy. TVA created recommended resource ranges based on a scenario with a single forecast of distributed generation adoption, but then checked the robustness of its recommendation by examining alternative portfolios under scenarios that include more or less distributed generation.
3.2.2.2 Assessing System Integration of Distributed Generation To some degree, planners also used the resource planning process to ensure that the bulk power system will be able to integrate expected levels of distributed generation. In some cases, distributed generation was represented simply as a change to the annual energy or the peak demand (e.g., DEC, PECO). Other utilities (PacifiCorp, TVA) developed hourly load profiles that were then modified by hourly profiles of distributed generation to develop an hourly net load. The hourly net load was then used in capacity expansion or production cost models to evaluate the need and cost effectiveness of other resources.
Many utilities (CECONY, DEC, FPL, NSP, PECO, SCE, TVA) reported assigning a capacity credit to distributed generation facilities that is less than 100 percent of the nameplate capacity due to intermittency or lack of utility control. The range of capacity credits for distributed PV ranged from 19 percent to 46 percent of nameplate capacity. FPL and GPC report plans to study performance and grid integration of distributed generation through pilot projects, including colocation of distributed generation and storage at customer sites and company facilities. HEC, which has by far the highest penetration of customer-sited DPV, has conducted several detailed grid integration studies that include distributed PV to augment its resource planning process. Finally, NSP highlights plans to upgrade their distribution system in order to manage increasing customer interest in distributed generation.
3.2.2.3 Evaluating Cost-Effectiveness of Distributed Generation Planners can choose to invest in or incentivize investments in distributed generation to meet resource needs if it is deemed cost-effective. The approach used to test whether distributed generation is cost-effective differed by utility. Some utilities did not evaluate distributed generation as a resource option, citing the higher cost of distributed generation relative to traditional generation. FPL, for example, did not analyze distributed PV as a resource, based on its assessment that the higher capital and maintenance costs of distributed PV makes it twice as expensive as utility-scale PV.
Other utilities directly evaluated the cost-effectiveness of distributed generation within their resource plans, using a variety of approaches. CECONY’s approach suggests that CHP cost-effectiveness should be evaluated on a case-by-case basis. CECONY estimated the cost-effectiveness of CHP in different applications by comparing the cost of CHP to the cost of traditional utility infrastructure projects that would be avoided, such as building new transmission or area substations. Other New England states evaluate CHP alongside energy efficiency resources and provide CHP incentives as part of their energy efficiency plans.
Future Electric Utility Regulation / Report No. 6 40
NSP, alternatively, developed candidate portfolios within its resource plan that have varying quantities of distributed PV, including the cost of compensating customers through a solar tariff in its portfolio revenue requirement. The utility then examined the performance of each portfolio in terms of its revenue requirement. NSP examined portfolio costs with and without an assumed cost of carbon. NSP increased the amount of participation in various solar programs, including the community solar program, in the Preferred Plan relative to the Reference Plan. At the same time, the addition of distributed PV to the portfolio avoids other generation capacity and fuel. NSP accounted for the avoided losses of distributed PV when assessing its avoided costs, but did not model other, less quantifiable costs such as avoided transmission or distribution.
Finally, HEC and TVA used capacity expansion models to develop candidate portfolios and include distributed generation as a resource option that can be selected in the model. HEC included residential and commercial distributed generation systems as resource options in its capacity expansion model. TVA included small and large commercial distributed generation systems as resources in its capacity expansion model. Neither utility attempted to account for any additional impacts to the transmission and distribution system from the distributed generation.
3.2.2.4 Accounting for Distributed Generation in Transmission Planning Few of the planning documents reviewed in this report offered insight into the role of distributed generation in transmission planning. HEC was an exception. HEC used scenarios in its transmission evaluation that bookend the peak demand forecasts with a high distributed generation/low peak load scenario and a low distributed generation/high peak load scenario. Analysis on two of the islands found new transmission needs in the low distributed generation/high peak load scenario, with less or negligible new transmission needs in the high distributed generation/low peak load scenario.
3.2.2.5 Targeting Distributed Generation Given that most utilities treated distributed generation as exogenous to the planning process, few identified ways to target distributed generation deployment such that it maximizes system benefits. The limited examples of distributed generation targeting in resource planning came from TVA, CECONY and SCE. TVA is working with the Electric Power Research Institute to model locational-specific impacts of distributed PV on the distribution grid. TVA will use that analysis to identify preferential sites for deployment of solar at the levels recommended in its IRP. Since CECONY supplies both electricity and natural gas to customers, it considers opportunities for shifting demand from electricity to natural gas via targeted CHP installations. The utility identifies opportunities for CHP to reduce peak demand in order to defer electricity infrastructure investments, such as distribution substations. SCE similarly works with customers to identify opportunities to adopt distributed generation technologies like CHP, though SCE does not focus on system needs when reaching out to customers. Recent distribution system planning reform efforts, such as California’s Distribution Resource Plans and New York’s Distributed System Implementation Plans, focus much more directly on identifying opportunities
Future Electric Utility Regulation / Report No. 6 41
to target locations for distributed generation. ConEd’s Brooklyn/Queens Demand Management program aggregates load reductions from resources such as energy efficiency, voltage optimization and battery storage to defer the need for upgrades to subtransmission feeders in a constrained part of Con Edison’s distribution system.108
3.3 Demand-side Resources
3.3.1 Background Electric utilities have more than two decades of experience planning and administering utility customer-funded programs for demand-side resources — historically, consisting mainly of energy efficiency, demand response and energy conservation.109 Energy efficiency, demand response and energy conservation are different, though complementary, resources.
• Energy efficiency refers to “using less energy to provide the same service,”110 such as through lighting retrofits that reduce energy use while maintaining or improving the quality of illumination.
• Demand response refers to “changes in electric usage by demand-side resources from their normal consumption patterns in response to changes in the price of electricity over time, or to incentive payments designed to induce lower electricity use at times of high wholesale market prices or when system reliability is jeopardized.”111
• Energy conservation refers to temporary or sustained reductions in energy services in response to price signals, education and utility outreach.
Most utilities, and all of the utilities reviewed here, administer demand-side programs and include demand-side resources in their resource plans.112
Over the 2000s and 2010s, changes in market design have enabled demand response and energy efficiency to participate directly in wholesale markets. Demand response is now a standard resource in capacity, energy and ancillary services markets; energy efficiency resources are now eligible to bid into the PJM and ISO-NE forward capacity markets.113 Despite greater participation of these resources in markets, most utilities participating in RTOs/ISOs continue to administer and plan demand-side programs. For instance, the Pennsylvania PUC requires the state’s distribution companies, which operate within PJM, to develop energy efficiency and
108 See Future Electric Utility Report #4 at pp. 45–46 for a summary: https://emp.lbl.gov/sites/all/files/feur-4-20160518.pdf. 109 For more on the history and benefits of these programs, see DOE and EPA (2006) and SEE Action (2016). 110 See LBNL, “What is Energy Efficiency?” http://eetd.lbl.gov/ee/ee-1.html. 111 FERC, “Reports on Demand Response & Advanced Metering,” http://www.ferc.gov/industries/electric/indus-act/demand-response/dem-res-adv-metering.asp. 112 For an overview of state utility demand-side programs, see the American Council for an Energy-Efficient Economy’s (ACEEE’s) State and Local Policy Database, http://database.aceee.org/. 113 Cappers et al. (2010), Cappers et al. (2013), and Neme and Cowart (2014) discuss participation of demand-side resources in wholesale markets.
Future Electric Utility Regulation / Report No. 6 42
conservation plans to meet state targets for reductions in electricity consumption and peak demand.
3.3.2 Approaches to Integrating Demand-side Resources Into Resource Planning There has been a significant degree of convergence in processes and methods for evaluating energy efficiency and demand response resources across the United States. All the utilities reviewed here, for instance, conduct potential studies, develop portfolios, evaluate the cost-effectiveness of these portfolios, and do some form of evaluation, measurement and verification.114 All use the cost test framework first codified in California’s Standard Practice Manual to quantify costs and benefits to different parties and to develop an overall assessment of cost-effectiveness.115
There are, however, significant differences across jurisdictions in how the levels of investment in demand-side resources are determined, the extent to which price effects are included in resource planning, and the extent to which demand-side resources are evaluated as alternatives to transmission.
3.3.2.1 Determining the Level of Investment in Demand-side Resources Across utilities, there are generally three approaches to how the level of investment in demand-side resources is determined:
1) Savings Standard or Target. The utility plan seeks to meet a preset standard or target, though it may include scenarios for lower or higher savings levels.
2) Cost-effectiveness. The level of target savings in the utility plan is determined by cost-effective calculations, separate from the resource planning process.
3) Optimization. The level of target savings is determined by including demand-side resource cost curves in capacity expansion modeling.
Table 8 shows the different approaches used in the utility plans reviewed in this report.
114 In California, Florida, New York and Pennsylvania, potential studies are done at a statewide level and involve multiple utilities. 115 CEC and CPUC (2001). An initiative is underway to update the California Standard Practice Manual, in part to address the somewhat inconsistent ways that the cost-effectiveness tests are applied across jurisdictions and to include a public interest perspective (National Efficiency Screening Project, 2014). The National Efficiency Screening Project introduced an alternative Resource Value Framework that includes the following principles: determine if the resource is in the public interest, account for energy policy goals of a state, include symmetry in costs and benefits, include hard-to-quantify benefits, use transparent methods and assumptions, and be applicable to multiple resources (not just energy efficiency). A final “National Standard Practice Manual” is planned for release in April 2017.
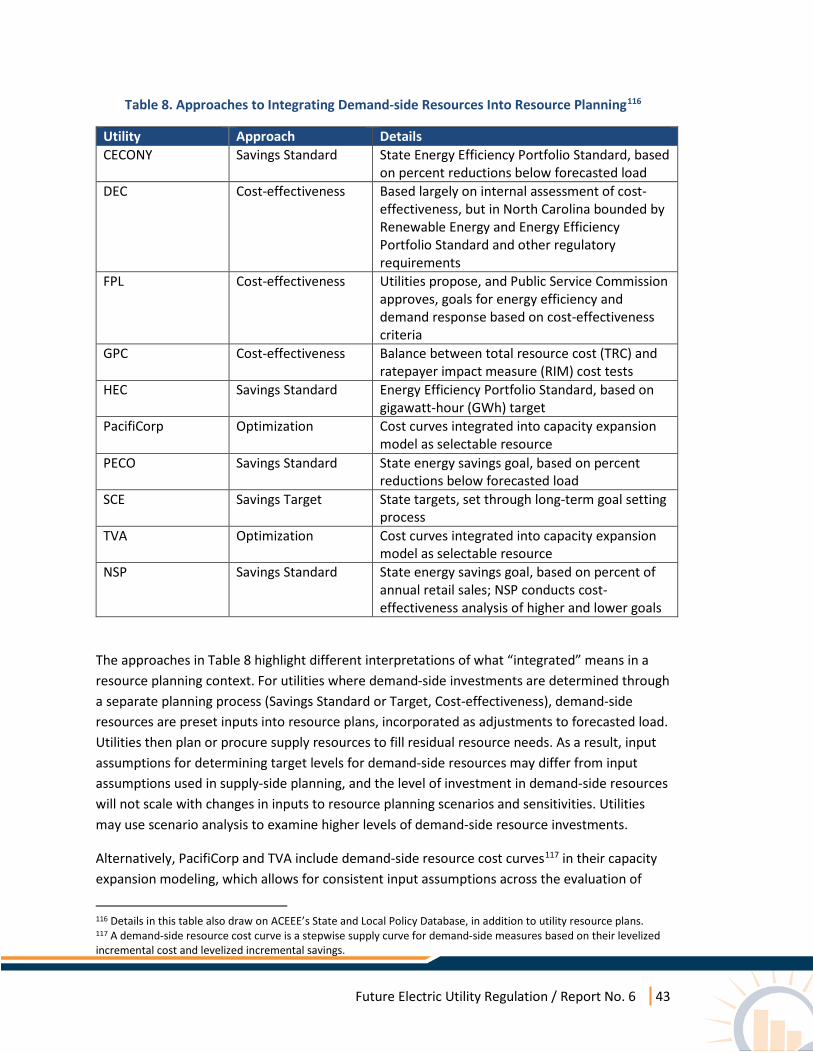
Future Electric Utility Regulation / Report No. 6 43
Table 8. Approaches to Integrating Demand-side Resources Into Resource Planning116
Utility Approach Details CECONY Savings Standard State Energy Efficiency Portfolio Standard, based
on percent reductions below forecasted load DEC Cost-effectiveness Based largely on internal assessment of cost-
effectiveness, but in North Carolina bounded by Renewable Energy and Energy Efficiency Portfolio Standard and other regulatory requirements
FPL Cost-effectiveness Utilities propose, and Public Service Commission approves, goals for energy efficiency and demand response based on cost-effectiveness criteria
GPC Cost-effectiveness Balance between total resource cost (TRC) and ratepayer impact measure (RIM) cost tests
HEC Savings Standard Energy Efficiency Portfolio Standard, based on gigawatt-hour (GWh) target
PacifiCorp Optimization Cost curves integrated into capacity expansion model as selectable resource
PECO Savings Standard State energy savings goal, based on percent reductions below forecasted load
SCE Savings Target State targets, set through long-term goal setting process
TVA Optimization Cost curves integrated into capacity expansion model as selectable resource
NSP Savings Standard State energy savings goal, based on percent of annual retail sales; NSP conducts cost-effectiveness analysis of higher and lower goals
The approaches in Table 8 highlight different interpretations of what “integrated” means in a resource planning context. For utilities where demand-side investments are determined through a separate planning process (Savings Standard or Target, Cost-effectiveness), demand-side resources are preset inputs into resource plans, incorporated as adjustments to forecasted load. Utilities then plan or procure supply resources to fill residual resource needs. As a result, input assumptions for determining target levels for demand-side resources may differ from input assumptions used in supply-side planning, and the level of investment in demand-side resources will not scale with changes in inputs to resource planning scenarios and sensitivities. Utilities may use scenario analysis to examine higher levels of demand-side resource investments.
Alternatively, PacifiCorp and TVA include demand-side resource cost curves117 in their capacity expansion modeling, which allows for consistent input assumptions across the evaluation of
116 Details in this table also draw on ACEEE’s State and Local Policy Database, in addition to utility resource plans. 117 A demand-side resource cost curve is a stepwise supply curve for demand-side measures based on their levelized incremental cost and levelized incremental savings.
Future Electric Utility Regulation / Report No. 6 44
different resources and a more rigorous framework for risk management. Meaningfully treating demand-side resources as selectable resources in capacity expansion models requires careful attention to methods and inputs.118 For instance, PacifiCorp evaluated 50,000 unique energy efficiency measures as part of its IRP, requiring some amount of aggregation to incorporate into cost curves that could be used in a capacity expansion model. In developing “price bundles” for aggregating measures, PacifiCorp had to ensure that averaging measures did not unduly affect their cost-effectiveness, for instance, by averaging more cost-effective measures with less cost-effective ones.119
For a number of jurisdictions in Table 8 (CA, FL, HI, MN, NY, PA), lawmakers, regulators and other public agencies play an important role in setting targets for demand-side resources. This places a large administrative and analytical burden on states to set targets that adequately reflect changing technology and fuel costs and manage longer-term risks to customers. In RTOs/ISOs, an additional challenge is that inputs into the planning process for demand-side resources depend on RTO/ISO market outcomes and utility procurement strategies, requiring a high degree of coordination among regulators, utilities and RTOs/ISOs.
PECO and PJM illustrate the importance of, and some of the difficulties in, coordination. Energy efficiency measures are often long-lived, requiring long-term forecasts of avoided costs to assess their cost-effectiveness. PECO’s approach to calculating avoided costs uses PJM wholesale market costs and price forecasts for the short-term, but requires a number of assumptions about the longer term that are not coordinated with PJM market forecasts: They do not necessarily reflect underlying trends in supply (e.g., resource mix), do not reflect structural changes in markets (e.g., load-resource balance years), and are not necessarily consistent with the values PJM uses in planning.120 Lack of coordination may decrease the accuracy of cost-effectiveness assessments for demand-side resources. PJM historically has not used state forecasts of energy efficiency program savings in its load forecasting and transmission planning processes. If the effects of these programs exceed savings that are embedded in historical data, PJM’s forecasts will tend to overstate capacity and energy needs.121
118 For best practices in estimating peak demand reductions from energy efficiency, see Northwest Power Conservation Council, March 2016, 7th Power Plan Report and Appendices, http://www.nwcouncil.org/energy/powerplan/7/plan/. 119 For more on the development of PacifiCorp’s demand-side management supply curves, see PacifiCorp (2015b), pp. 118–127. 120 More specifically, in its Energy Efficiency and Conservation Plan, PECO calculated avoided energy costs using near-term (2012–2016) monthly NYMEX PJM PECO Zone energy futures prices; a medium-term (2017–2021) forecast based on monthly NYMEX Henry Hub natural gas futures prices averaged over the course of a year and multiplied by the heat rate of a generic combustion turbine (CT, 10,450 Btu/kWh heat rate), with a correction factor based on the difference between 2012–2016 futures prices and 2012–2016 forecasts and converted to monthly electricity prices using the ratio between 2012–2016 annual and monthly electricity prices; and a longer-term (2022–2026) forecast using EIA AEO forecasts, the CT heat rate and correction factors. PECO calculated avoided capacity costs using PJM capacity market prices through 2014, then escalated May 2014 prices at the Bureau of Labor Statistics’ producer price index for electric power generation. See PECO (2014b). 121 For more on this issue, including PJM’s and other proposals to address it, see Faruqui et al. (2014), PJM (2015a), and Hurley and Peterson (2015).
Future Electric Utility Regulation / Report No. 6 45
3.3.2.2 Assessing Price Effects in Resource Planning Traditionally, utilities have included the impacts of retail rate changes on electricity demand in their load forecasts through proxy variables for fossil fuel prices, if at all. Of the utilities reviewed here, only PacifiCorp includes the effects of retail rate designs in its resource plan. PacifiCorp treats these price effects as a selectable resource, by translating potential (MW) and levelized cost ($/kW-yr) estimates into a supply curve. PacifiCorp’s analysis covers residential, commercial and irrigation time-of-use rates and critical peak pricing.
3.3.2.3 Evaluating Demand-Side Resources as an Alternative to Transmission and Distribution Investments
The lack of integration among planning processes for generation, demand-side resources, transmission, and distribution has led to more discrete approaches to assessing demand-side alternatives to transmission and distribution investments (“non-wires alternatives”). These assessments often take place outside the formal resource planning process, but influence resource planning decisions. Investments in resources to defer distribution investments, for instance, will have implications for bulk system resource needs. Since the 1990s, a number of utilities have conducted discrete assessments, or institutionalized assessment processes, to determine whether demand-side investments can defer major transmission or distribution investments.122
Among the utilities reviewed in this report, SCE and CECONY have regular processes to evaluate the potential for deferring distribution investments. These processes have been driven by a combination of company strategy and regulation. The CPUC requires utilities under its jurisdiction, including SCE, to file distribution resource plans that include an assessment of the potential for distribution system investment deferrals.123 CECONY has evaluated distribution system investment deferrals since the early 2000s as a means to offset localized load growth.124
122 For an overview, see Neme and Grevatt (2015), Stanton (2015), and Neme and Sedano (2012). 123 For more on the CPUC’s Distribution Resource Plan proceeding, see http://www.cpuc.ca.gov/General.aspx?id=5071. 124 Neme and Grevatt (2015).
Future Electric Utility Regulation / Report No. 6 46
3.4 Transmission
3.4.1 Background Transmission capacity expansion can provide six main resource values:
1) Local capacity. Within a balancing area, additional transmission capacity can alleviate congestion and reduce the need for new generation capacity to meet local resource adequacy requirements.
2) System capacity. Between balancing areas, additional transmission capacity can provide load diversity benefits125 and access to imports, reducing the need for new generation capacity to meet balancing area-wide resource adequacy requirements.
3) Lower cost energy. By facilitating access to lower cost generation and reducing line losses, additional transmission capacity can reduce energy costs, even in cases where a balancing area already has adequate resources. By facilitating access to exports, transmission can increase wholesale sales, with revenue benefitting utility customers.
4) Lower cost ancillary services. Additional transmission capacity can reduce both the amount and cost of required operating reserves, by reducing forecast errors, smoothing net load variability, enabling greater reserve sharing, and providing access to lower cost reserves.
5) Increased system flexibility. At higher renewable energy penetrations, additional transmission capacity can reduce renewable energy curtailment, by relaxing system ramping and minimum generation constraints.
6) Lower cost environmental compliance. By facilitating access to cleaner generation, additional transmission capacity can lower environmental compliance costs.
These benefits must be weighed against both the cost of transmission and the cost-effectiveness of alternatives. Integrating transmission into resource plans provides an avenue for making these kinds of comparisons.
Although the potential role of new transmission in resource planning has long been recognized, resource and transmission planning historically often have been separate processes, with limited coordination between them. This separation resulted, in part, from the technical complexity of the transmission system and the regulatory process surrounding it.126 It was also encouraged by FERC’s requirement for separation between transmission and marketing functions within utilities (Order 2004, issued in 2003),127 though FERC removed many of these barriers in a later rulemaking (Order 717, issued in 2008).128
125 Load diversity results when two or more balancing areas that differ in the timing of their peak demands increase interconnection capacity. Differences in the timing of peak demand mean that the coincident peak demand for the balancing areas together will be smaller than their individual peak demands. 126 Baldick and Kahn (1992). 127 FERC (2003). 128 FERC (2008).
Future Electric Utility Regulation / Report No. 6 47
Over the late 1990s and 2000s, participating utilities ceded varying degrees of control over transmission planning to RTOs and ISOs, creating three models for transmission planning:
• Model 1 — jurisdictional planning, where utilities that were not part of RTOs/ISOs continue to do their own resource and transmission planning, in some cases on behalf of network customers as well (Non-RTO West, Non-RTO Southeast)
• Model 2 — state-level transmission planning, where utilities that joined ISOs participate in the ISO’s transmission planning process (CAISO, ERCOT, NYISO)
• Model 3 — multistate transmission planning, where utilities that joined RTOs participate in the RTO’s transmission planning process (ISO-NE, MISO, PJM, SPP)
Federal regulation is pushing utilities and RTOs/ISOs toward a more regional approach to transmission planning, with a greater emphasis on reducing grid congestion and meeting policy goals. FERC Order 1000 (2011) required all FERC-jurisdictional utilities to participate in a regional planning process, all RTOs/ISOs to coordinate to identify cost-effective solutions to shared transmission needs, and all entities to develop a process for identifying and evaluating transmission driven by public policy needs.129
3.4.2 Approaches to Integrating Transmission Into Resource Planning Although the resource values of transmission capacity expansion are consistent across the three models described above, the extent to which, and the ways in which, transmission is integrated into resource planning differs among them. Within jurisdictional planning (Model 1), there are generally three approaches to addressing transmission in resource plans (Table 9):
• Fixed transmission. Fixed transmission topologies and capacities, the result of transmission plans, are inputs into the resource planning process. Resources from resource plans are inputs into transmission plans.
• Transmission sensitivities. Resource plans consider sensitivities with different predetermined transmission topologies and capacities, to determine if transmission expansion would result in lower costs.
• Simultaneous consideration. Additional transmission capacity is directly compared against other resources in resource plans — for instance, in a capacity expansion model.
129 FERC (2012).
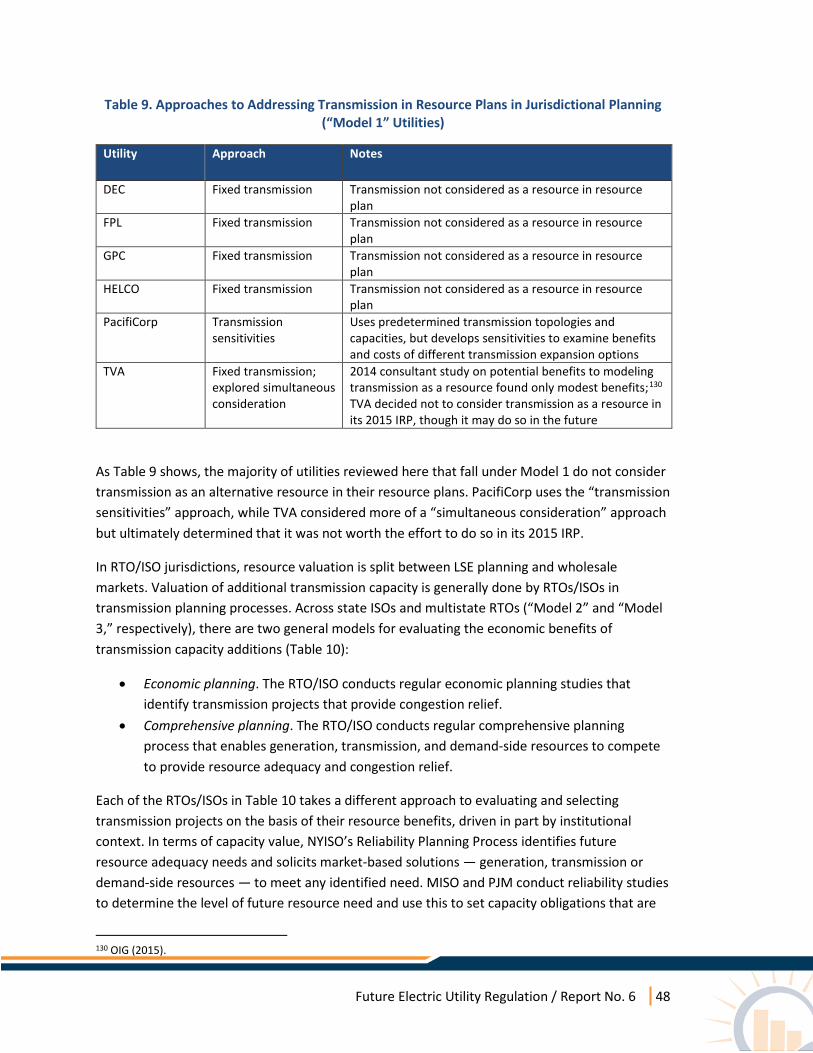
Future Electric Utility Regulation / Report No. 6 48
Table 9. Approaches to Addressing Transmission in Resource Plans in Jurisdictional Planning (“Model 1” Utilities)
Utility Approach Notes
DEC Fixed transmission Transmission not considered as a resource in resource plan
FPL Fixed transmission Transmission not considered as a resource in resource plan
GPC Fixed transmission Transmission not considered as a resource in resource plan
HELCO Fixed transmission Transmission not considered as a resource in resource plan
PacifiCorp Transmission sensitivities
Uses predetermined transmission topologies and capacities, but develops sensitivities to examine benefits and costs of different transmission expansion options
TVA Fixed transmission; explored simultaneous consideration
2014 consultant study on potential benefits to modeling transmission as a resource found only modest benefits;130 TVA decided not to consider transmission as a resource in its 2015 IRP, though it may do so in the future
As Table 9 shows, the majority of utilities reviewed here that fall under Model 1 do not consider transmission as an alternative resource in their resource plans. PacifiCorp uses the “transmission sensitivities” approach, while TVA considered more of a “simultaneous consideration” approach but ultimately determined that it was not worth the effort to do so in its 2015 IRP.
In RTO/ISO jurisdictions, resource valuation is split between LSE planning and wholesale markets. Valuation of additional transmission capacity is generally done by RTOs/ISOs in transmission planning processes. Across state ISOs and multistate RTOs (“Model 2” and “Model 3,” respectively), there are two general models for evaluating the economic benefits of transmission capacity additions (Table 10):
• Economic planning. The RTO/ISO conducts regular economic planning studies that identify transmission projects that provide congestion relief.
• Comprehensive planning. The RTO/ISO conducts regular comprehensive planning process that enables generation, transmission, and demand-side resources to compete to provide resource adequacy and congestion relief.
Each of the RTOs/ISOs in Table 10 takes a different approach to evaluating and selecting transmission projects on the basis of their resource benefits, driven in part by institutional context. In terms of capacity value, NYISO’s Reliability Planning Process identifies future resource adequacy needs and solicits market-based solutions — generation, transmission or demand-side resources — to meet any identified need. MISO and PJM conduct reliability studies to determine the level of future resource need and use this to set capacity obligations that are
130 OIG (2015).

Future Electric Utility Regulation / Report No. 6 49
satisfied in forward capacity markets. In PJM, qualifying transmission projects can bid into the capacity market, though transmission is treated differently than generation and demand-side resources.131 In MISO, transmission resources are not able to bid into the capacity market, and the capacity benefits of transmission additions are not accounted for in economic planning studies. CAISO does not have jurisdiction over resource adequacy, and its economic planning studies focus on congestion mitigation.132
All four of these RTOs/ISOs conduct economic planning studies, which typically focus on identifying transmission projects that reduce total energy costs by relieving transmission congestion. NYISO’s Congestion Assessment and Resource Integration Studies identify key congested areas, use generic resources to examine the cost-effectiveness of different options for congestion relief and, on the basis of the results, invite developers to submit specific projects for further study and regulated cost recovery. CAISO’s and MISO’s economic studies evaluate potential transmission projects largely on the basis of their incremental impact on production costs.133 PJM’s economic studies allow for integrated assessment of reliability upgrades and congestion benefits.134 For NYISO and PJM, where transmission is eligible to meet resource adequacy needs, capacity benefits are not integrated into economic studies.
131 Qualifying transmission upgrades receive the difference between resource clearing prices in source and sink locational delivery areas, which may be lower than the resource clearing price in either area. See PJM, “Qualifying Transmission Upgrades in RPM,” March 2014, https://www.pjm.com/~/media/committees-groups/committees/mic/20140604/20140604-item-09f-qualifying-transmission-upgrade-qtu-credit-requirement-education.ashx. 132 See CAISO (2015). CAISO’s Transmission Economic Analysis Methodology (TEAM) lists a number of potential benefits of transmission (CAISO 2004), but in practice CAISO’s economic studies focus on congestion mitigation. 133 MISO’s Multi Value Project planning process considers a larger range of resource benefits for public policy-driven transmission projects. See MISO (2012). 134 For a more detailed description, see PJM, “Market Efficiency,” http://www.pjm.com/planning/rtep-development/market-efficiency.aspx.

Future Electric Utility Regulation / Report No. 6 50
Table 10. Approaches to Addressing Resource Value of Transmission in Transmission Plans, State and Multistate RTO/ISO Regions (“Model 2” and “Model 3” Utilities)
RTO/ISO Approach Details NYISO (CECONY) Comprehensive
planning NYISO conducts a Comprehensive System Planning Process, consisting of four parts: (1) a Local Transmission Owner Planning Process, which identifies transmission projects needed for system security; (2) a Reliability Planning Process, which allows generation, transmission and demand-side resources to compete to meet identified longer-term resource needs; (3) Congestion Assessment and Resource Integration Studies, which identify the most congested areas of the NYISO system, evaluate the cost-effectiveness of generic alternatives — generation, transmission, and demand-side resources — to relieve congestion, and allow developers to submit proposed projects for evaluation; and (4) a Public Policy Transmission Planning Process, which identifies transmission needs driven by public policy requirements and allows proponents to submit projects to meet identified needs.135
CAISO (SCE) Economic planning CAISO’s Transmission Planning Process includes economic studies of congestion and identification of cost-effective transmission projects that alleviate congestion.136 CAISO’s planning process fixes transmission topology for the CPUC’s Long-term Procurement Plan, which identifies resource needs on a 10-year forward basis; resources identified through the procurement plan are inputs for transmission planning.137
MISO (NSP) Economic planning As part of Transmission Expansion Planning, MISO conducts a Market Congestion Planning Study that assesses the cost-effectiveness of potential transmission solutions that relieve nearer- and longer-term congestion.138 MISO’s Loss of Load Expectation Study sets the regional planning reserve margin and allocates capacity obligations to participating LSEs; transmission resources are not able to bid into MISO’s Planning Resource Auction.
PJM (PECO) Economic planning As part of the Regional Transmission Expansion Plan, PJM conducts a market efficiency analysis that examines reliability upgrades, new economic upgrades, or hybrid reliability-economic projects that cost-effectively relieve congestion.139 PJM’s Forecast Pool Requirement and Unforced Capacity Obligation processes set a regional planning reserve margin and allocate capacity to participating LSEs; qualifying transmission upgrades are allowed to participate in Reliability Pricing Model capacity auctions.
135 For a more detailed description of these processes, see NYISO (2014). 136 For more on CAISO’s economic studies, see CAISO (2015). 137 For a more detailed diagram of how California energy planning processes affect each other, see https://www.caiso.com/Documents/TPP-LTPP-IEPR_AlignmentDiagram.pdf. 138 For more detail on the Market Congestion Planning Study, see MISO (2014b). 139 For more on PJM’s economic studies, see PJM (2014b).
Future Electric Utility Regulation / Report No. 6 51
None of the approaches described in Table 9 and Table 10 is truly “integrated,” in the sense that it facilitates direct economic comparisons between transmission and other supply- and demand-side resources in terms of their ability to meet reliability, economic or public policy objectives. The planning approaches described above fall into one of three categories: (1) they do not value any of the resource benefits of transmission, as described at the beginning of Section 3.4.1; (2) they only value congestion mitigation benefits of transmission; or (3) they value a number of its benefits, but in separate processes that are never integrated and may not facilitate an overall portfolio of transmission investments that reduce total system costs and manage risks. Additionally, regional utilities and RTOs may not be able to optimize coordination between transmission and resource planning across states, due to jurisdictional constraints.140
3.5 Uncertainty and Risk Management
3.5.1 Background The electricity industry has always faced uncertainty and risk from a number of sources — from interest rates to fuel costs to environmental policy. Indeed, the need to better manage uncertainty and risk was an important driver behind the emergence of resource planning in the 1980s (see Section 1.1.1). Industry restructuring in the 1990s, where it occurred, changed the nature and allocation of risk in the electricity industry. It shifted utilities’ role from generation ownership to procurement, as providers of last resort, and from managing fuel price risks to managing electricity market price risks. In areas with competitive retail sectors, load migration presented a major new source of risk.
In organized markets, the transfer of some resource adequacy, system security and transmission planning responsibilities to RTOs/ISOs has required these organizations to take a more active role in planning for uncertainty, in collaboration with and in some ways on behalf of market participants. Risk management responsibilities, however, ultimately rest with market participants.
Improvements in computing power over the 1990s and 2000s greatly enhanced tools to manage uncertainty and risk in resource planning. Utilities and RTOs/ISOs are now able to use computers to conduct sophisticated uncertainty analyses that would have been impossible three decades ago. The ability to undertake more systematic uncertainty and risk analysis has led to a gradual shift in focus in resource planning cost metrics, from an emphasis on “least-cost” to a growing emphasis on expected cost and cost variance. The choice of metrics, and how risk and uncertainty analyses are structured, presented and used varies significantly among jurisdictions, driven in large part by regulatory requirements and stakeholder engagement.
Whether utilities or market operators operate in a single state or across multiple states has an important influence on the complexities of and opportunities for risk management. For instance,
140 In particular, states have jurisdiction over the siting and permitting of transmission lines. For an overview of some of the challenges that jurisdictional issues have historically posed for interstate transmission development, see NCEP (2008).

Future Electric Utility Regulation / Report No. 6 52
utilities operating across multiple states may be required to comply with several different environmental and energy policies. Regional approaches to compliance with environmental regulations may be lower cost and lower risk, but require individual state approval and buy-in. For example, both MISO and PJM have published analyses arguing that a regional approach to Clean Power Plan compliance would reduce costs,141 but this requires the consent and coordination of state governments.
Investment cycles play an important role in risk and risk management. Different resources have different lead times and expected lifetimes (Figure 9), both of which affect utility costs. Resources with longer lead times run the risk of not being needed and transferring non-performance risk to ratepayers, as occurred in a number of U.S. states in the 1980s.142 Resources with longer lifetimes have higher “tail” risk that significant changes in technology, costs, markets, and regulation will make them uneconomic decades into the future. Resources with long lead times and lifetimes, which tend to be baseload generation and transmission, may be reasonable investments, but planning practices should fully account for their benefits, costs and risks.
141 MISO (2014c) and PJM (2015b). 142 See Kahn (1988).
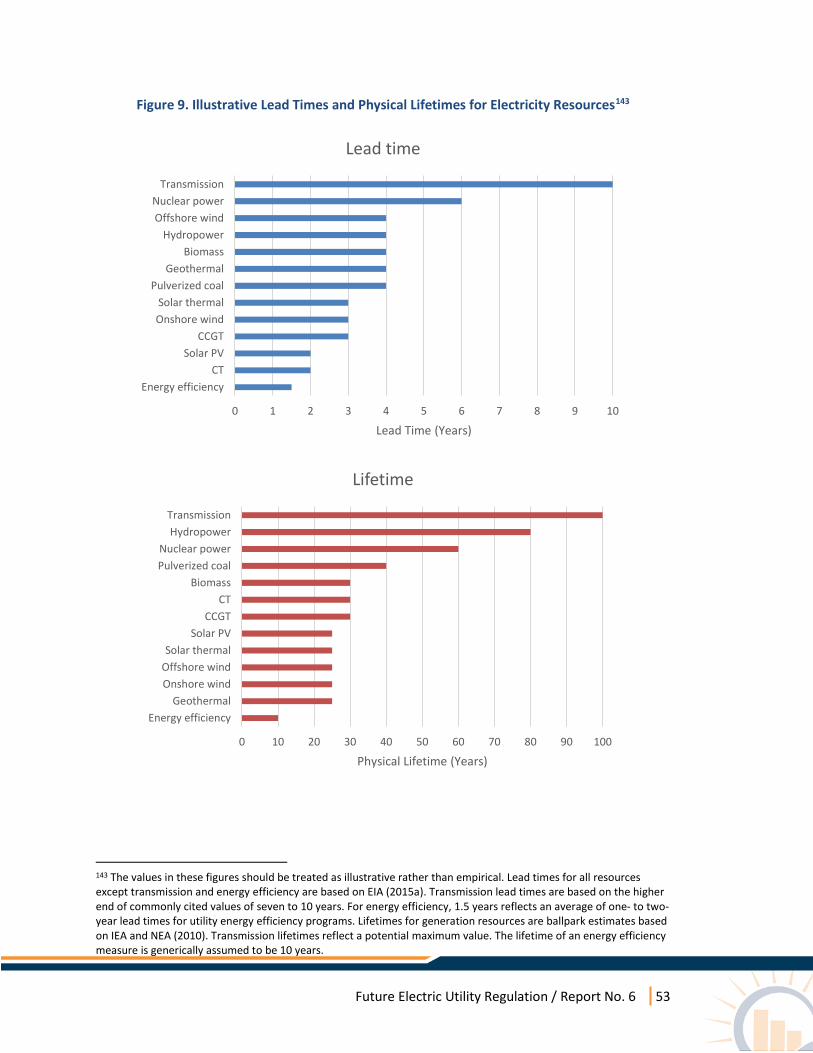
Future Electric Utility Regulation / Report No. 6 53
Figure 9. Illustrative Lead Times and Physical Lifetimes for Electricity Resources143
143 The values in these figures should be treated as illustrative rather than empirical. Lead times for all resources except transmission and energy efficiency are based on EIA (2015a). Transmission lead times are based on the higher end of commonly cited values of seven to 10 years. For energy efficiency, 1.5 years reflects an average of one- to two-year lead times for utility energy efficiency programs. Lifetimes for generation resources are ballpark estimates based on IEA and NEA (2010). Transmission lifetimes reflect a potential maximum value. The lifetime of an energy efficiency measure is generically assumed to be 10 years.
0 1 2 3 4 5 6 7 8 9 10
Energy efficiencyCT
Solar PVCCGT
Onshore windSolar thermal
Pulverized coalGeothermal
BiomassHydropower
Offshore windNuclear power
Transmission
Lead Time (Years)
Lead time
0 10 20 30 40 50 60 70 80 90 100
Energy efficiencyGeothermal
Onshore windOffshore windSolar thermal
Solar PVCCGT
CTBiomass
Pulverized coalNuclear power
HydropowerTransmission
Physical Lifetime (Years)
Lifetime

Future Electric Utility Regulation / Report No. 6 54
3.5.2 Current Approaches to Integrating Uncertainty and Risk Analysis Into Resource Planning
All utilities in the non-restructured jurisdictions (DEC, FPL, GPC, HEC, PacifiCorp, TVA, NSP) conducted some form of uncertainty analysis in their resource plans, in order to compare potential resource portfolios. However, not all of them undertook systematic risk analysis. In the restructured jurisdictions, utilities’ approach to risk management varies across procurement models. In both cases, uncertainty and risk analyses differ in the kinds of uncertainties and risks that are considered, approaches to quantifying uncertainty and risk and reporting the results, and strategic approaches to addressing longer-term compliance with environmental and energy policies.
3.5.2.1 Considering Different Sources of Uncertainty Utilities in restructured and non-restructured jurisdictions take very different approaches to uncertainty and risk analysis. Utilities in non-restructured jurisdictions reviewed in this report were relatively consistent about the kinds of uncertainty considered in their resource plans (Table 11).
Differences stem primarily from regulatory and resource contexts or are distinguishable only at a higher level of detail than the variables listed in Table 11.144 For instance, utilities took different approaches to modeling wholesale market uncertainty, depending on market exposure. Some utilities considered capital cost scenarios in which renewable tax credits are not extended (e.g., PacifiCorp), while others did not (e.g., DEC). NSP, PacifiCorp and TVA were unique among utilities in Table 11 in that they made many of the input assumptions in their uncertainty analysis publicly available in their resource planning documents.
144 Wilkerson et al. (2014) provide an overview of uncertainties considered by planners across the Western United States.
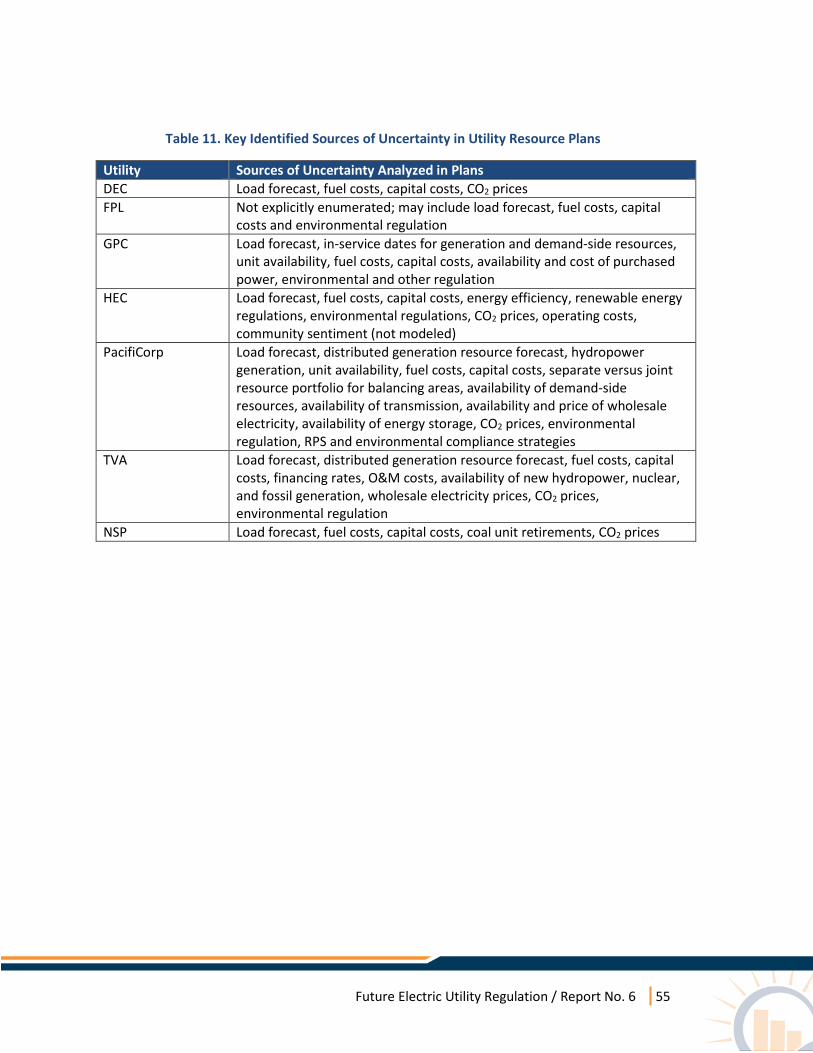
Future Electric Utility Regulation / Report No. 6 55
Table 11. Key Identified Sources of Uncertainty in Utility Resource Plans
Utility Sources of Uncertainty Analyzed in Plans DEC Load forecast, fuel costs, capital costs, CO2 prices FPL Not explicitly enumerated; may include load forecast, fuel costs, capital
costs and environmental regulation GPC Load forecast, in-service dates for generation and demand-side resources,
unit availability, fuel costs, capital costs, availability and cost of purchased power, environmental and other regulation
HEC Load forecast, fuel costs, capital costs, energy efficiency, renewable energy regulations, environmental regulations, CO2 prices, operating costs, community sentiment (not modeled)
PacifiCorp Load forecast, distributed generation resource forecast, hydropower generation, unit availability, fuel costs, capital costs, separate versus joint resource portfolio for balancing areas, availability of demand-side resources, availability of transmission, availability and price of wholesale electricity, availability of energy storage, CO2 prices, environmental regulation, RPS and environmental compliance strategies
TVA Load forecast, distributed generation resource forecast, fuel costs, capital costs, financing rates, O&M costs, availability of new hydropower, nuclear, and fossil generation, wholesale electricity prices, CO2 prices, environmental regulation
NSP Load forecast, fuel costs, capital costs, coal unit retirements, CO2 prices
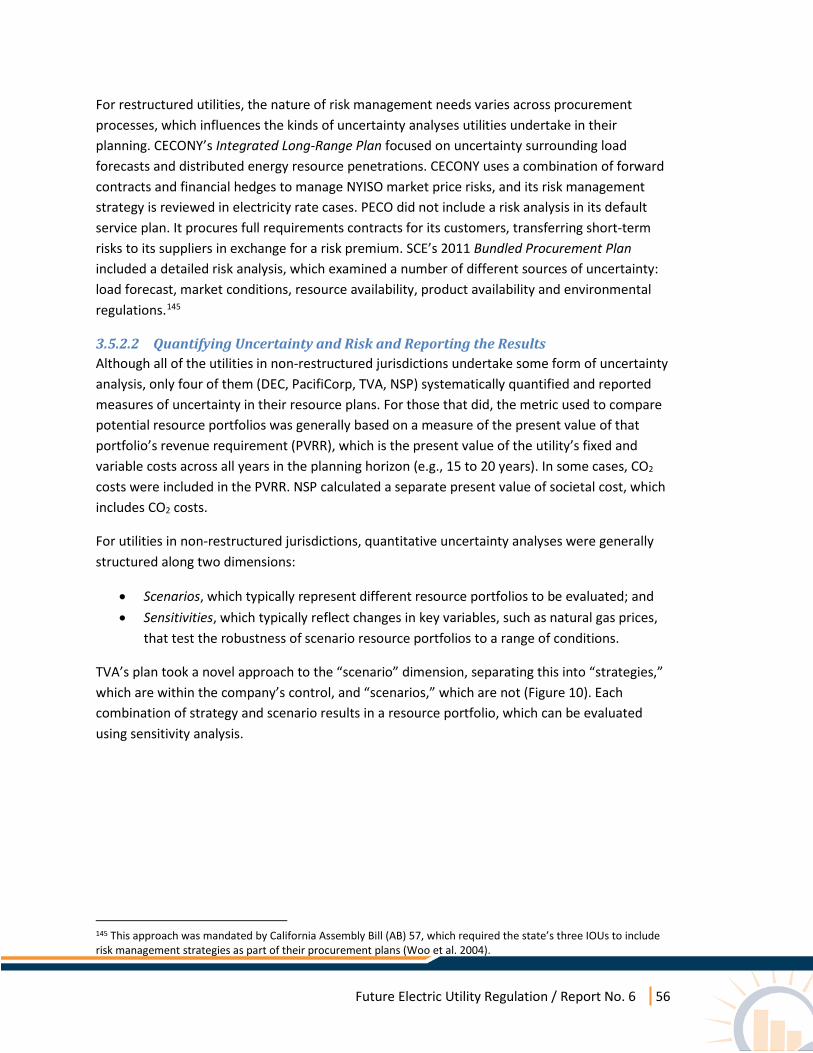
Future Electric Utility Regulation / Report No. 6 56
For restructured utilities, the nature of risk management needs varies across procurement processes, which influences the kinds of uncertainty analyses utilities undertake in their planning. CECONY’s Integrated Long-Range Plan focused on uncertainty surrounding load forecasts and distributed energy resource penetrations. CECONY uses a combination of forward contracts and financial hedges to manage NYISO market price risks, and its risk management strategy is reviewed in electricity rate cases. PECO did not include a risk analysis in its default service plan. It procures full requirements contracts for its customers, transferring short-term risks to its suppliers in exchange for a risk premium. SCE’s 2011 Bundled Procurement Plan included a detailed risk analysis, which examined a number of different sources of uncertainty: load forecast, market conditions, resource availability, product availability and environmental regulations.145
3.5.2.2 Quantifying Uncertainty and Risk and Reporting the Results Although all of the utilities in non-restructured jurisdictions undertake some form of uncertainty analysis, only four of them (DEC, PacifiCorp, TVA, NSP) systematically quantified and reported measures of uncertainty in their resource plans. For those that did, the metric used to compare potential resource portfolios was generally based on a measure of the present value of that portfolio’s revenue requirement (PVRR), which is the present value of the utility’s fixed and variable costs across all years in the planning horizon (e.g., 15 to 20 years). In some cases, CO2 costs were included in the PVRR. NSP calculated a separate present value of societal cost, which includes CO2 costs.
For utilities in non-restructured jurisdictions, quantitative uncertainty analyses were generally structured along two dimensions:
• Scenarios, which typically represent different resource portfolios to be evaluated; and • Sensitivities, which typically reflect changes in key variables, such as natural gas prices,
that test the robustness of scenario resource portfolios to a range of conditions.
TVA’s plan took a novel approach to the “scenario” dimension, separating this into “strategies,” which are within the company’s control, and “scenarios,” which are not (Figure 10). Each combination of strategy and scenario results in a resource portfolio, which can be evaluated using sensitivity analysis.
145 This approach was mandated by California Assembly Bill (AB) 57, which required the state’s three IOUs to include risk management strategies as part of their procurement plans (Woo et al. 2004).
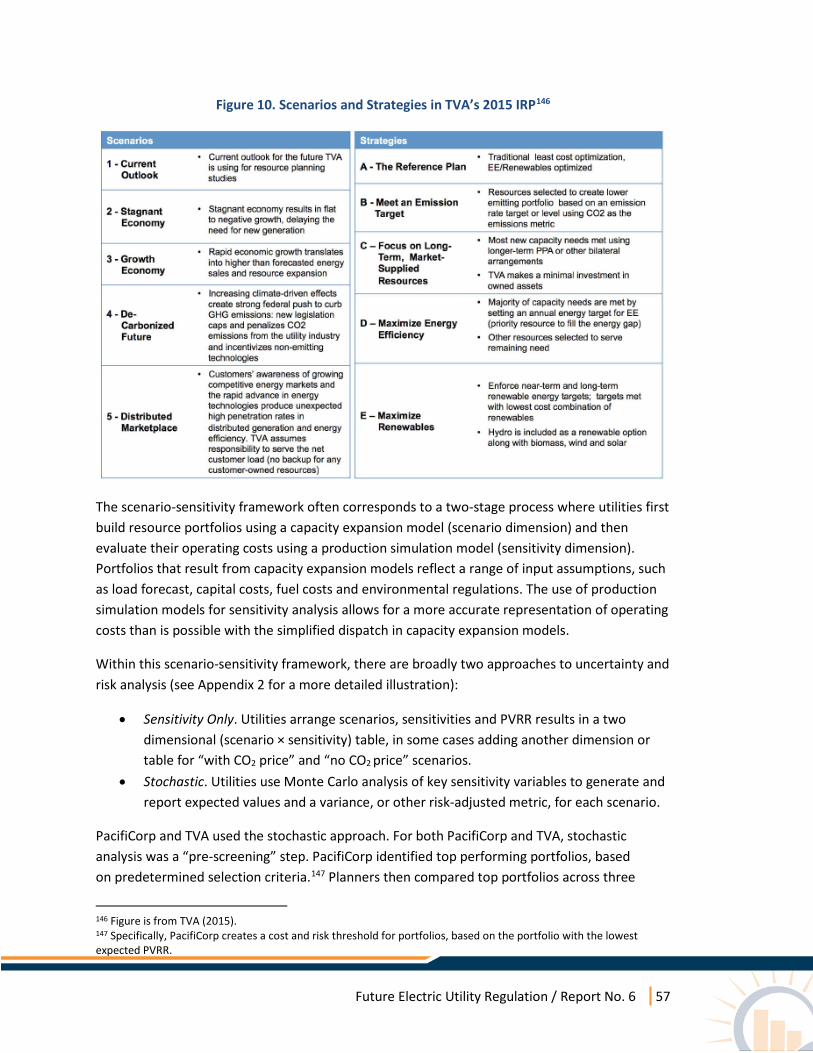
Future Electric Utility Regulation / Report No. 6 57
Figure 10. Scenarios and Strategies in TVA’s 2015 IRP146
The scenario-sensitivity framework often corresponds to a two-stage process where utilities first build resource portfolios using a capacity expansion model (scenario dimension) and then evaluate their operating costs using a production simulation model (sensitivity dimension). Portfolios that result from capacity expansion models reflect a range of input assumptions, such as load forecast, capital costs, fuel costs and environmental regulations. The use of production simulation models for sensitivity analysis allows for a more accurate representation of operating costs than is possible with the simplified dispatch in capacity expansion models.
Within this scenario-sensitivity framework, there are broadly two approaches to uncertainty and risk analysis (see Appendix 2 for a more detailed illustration):
• Sensitivity Only. Utilities arrange scenarios, sensitivities and PVRR results in a two dimensional (scenario × sensitivity) table, in some cases adding another dimension or table for “with CO2 price” and “no CO2 price” scenarios.
• Stochastic. Utilities use Monte Carlo analysis of key sensitivity variables to generate and report expected values and a variance, or other risk-adjusted metric, for each scenario.
PacifiCorp and TVA used the stochastic approach. For both PacifiCorp and TVA, stochastic analysis was a “pre-screening” step. PacifiCorp identified top performing portfolios, based on predetermined selection criteria.147 Planners then compared top portfolios across three
146 Figure is from TVA (2015). 147 Specifically, PacifiCorp creates a cost and risk threshold for portfolios, based on the portfolio with the lowest expected PVRR.
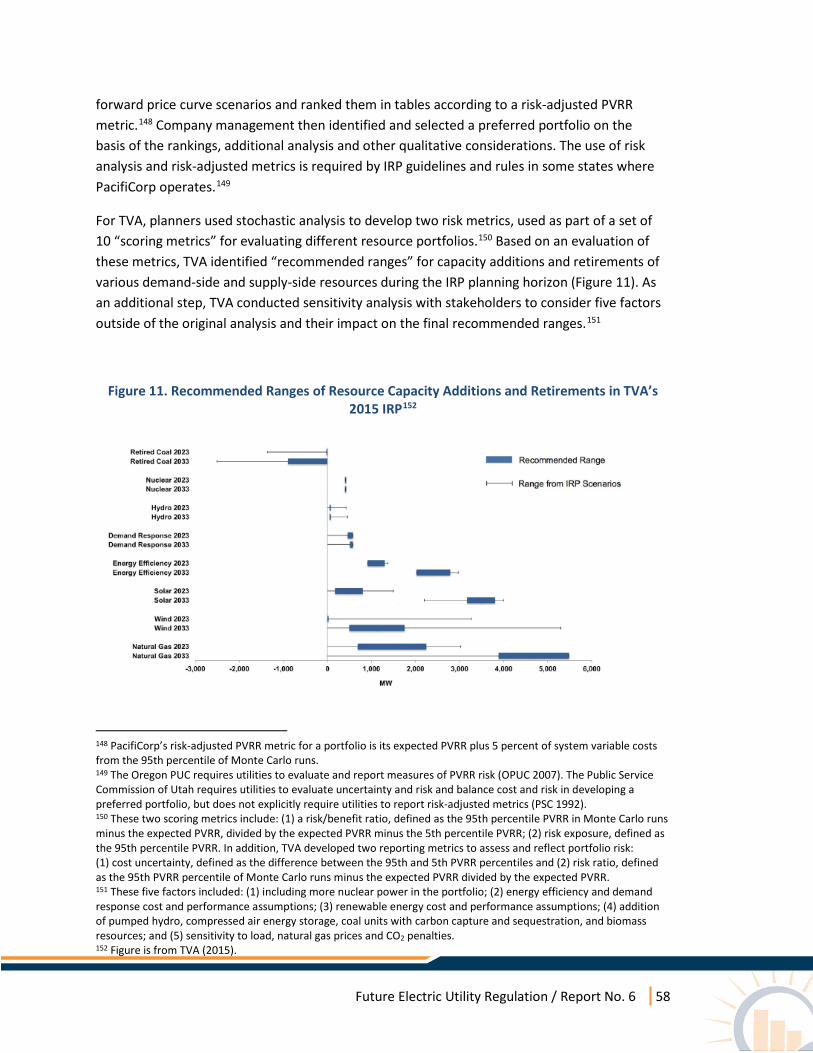
Future Electric Utility Regulation / Report No. 6 58
forward price curve scenarios and ranked them in tables according to a risk-adjusted PVRR metric.148 Company management then identified and selected a preferred portfolio on the basis of the rankings, additional analysis and other qualitative considerations. The use of risk analysis and risk-adjusted metrics is required by IRP guidelines and rules in some states where PacifiCorp operates.149
For TVA, planners used stochastic analysis to develop two risk metrics, used as part of a set of 10 “scoring metrics” for evaluating different resource portfolios.150 Based on an evaluation of these metrics, TVA identified “recommended ranges” for capacity additions and retirements of various demand-side and supply-side resources during the IRP planning horizon (Figure 11). As an additional step, TVA conducted sensitivity analysis with stakeholders to consider five factors outside of the original analysis and their impact on the final recommended ranges.151
Figure 11. Recommended Ranges of Resource Capacity Additions and Retirements in TVA’s 2015 IRP152
148 PacifiCorp’s risk-adjusted PVRR metric for a portfolio is its expected PVRR plus 5 percent of system variable costs from the 95th percentile of Monte Carlo runs. 149 The Oregon PUC requires utilities to evaluate and report measures of PVRR risk (OPUC 2007). The Public Service Commission of Utah requires utilities to evaluate uncertainty and risk and balance cost and risk in developing a preferred portfolio, but does not explicitly require utilities to report risk-adjusted metrics (PSC 1992). 150 These two scoring metrics include: (1) a risk/benefit ratio, defined as the 95th percentile PVRR in Monte Carlo runs minus the expected PVRR, divided by the expected PVRR minus the 5th percentile PVRR; (2) risk exposure, defined as the 95th percentile PVRR. In addition, TVA developed two reporting metrics to assess and reflect portfolio risk: (1) cost uncertainty, defined as the difference between the 95th and 5th PVRR percentiles and (2) risk ratio, defined as the 95th PVRR percentile of Monte Carlo runs minus the expected PVRR divided by the expected PVRR. 151 These five factors included: (1) including more nuclear power in the portfolio; (2) energy efficiency and demand response cost and performance assumptions; (3) renewable energy cost and performance assumptions; (4) addition of pumped hydro, compressed air energy storage, coal units with carbon capture and sequestration, and biomass resources; and (5) sensitivity to load, natural gas prices and CO2 penalties. 152 Figure is from TVA (2015).
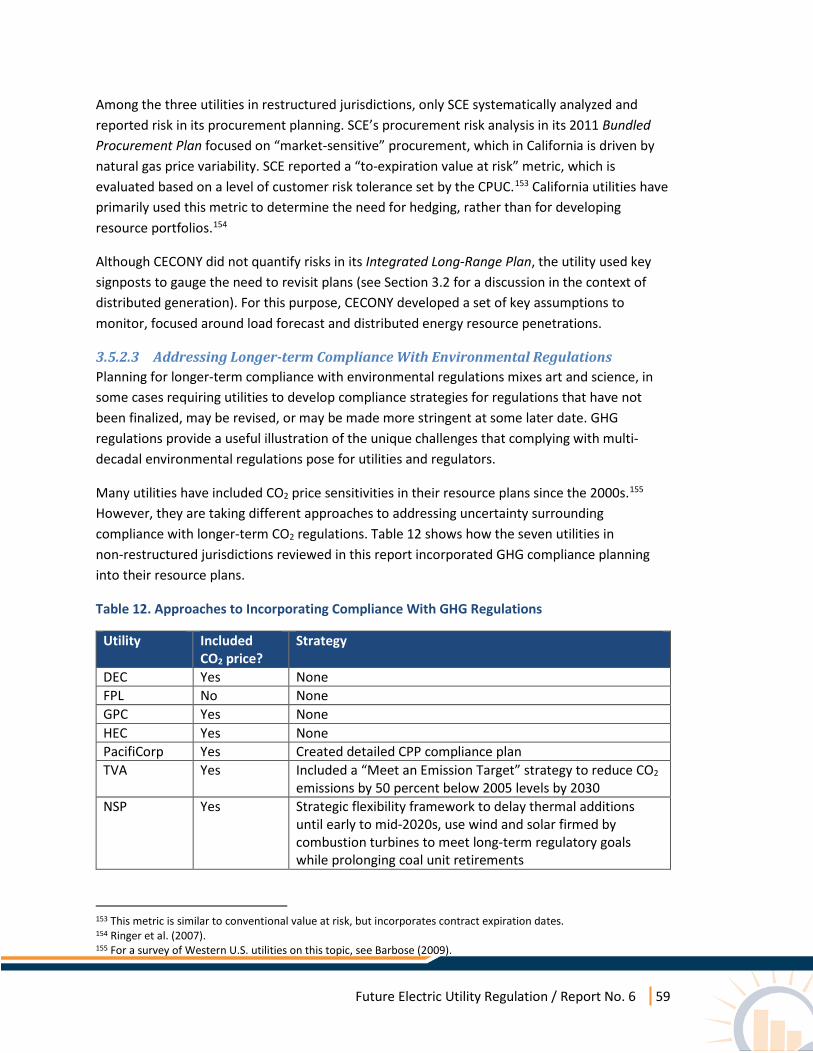
Future Electric Utility Regulation / Report No. 6 59
Among the three utilities in restructured jurisdictions, only SCE systematically analyzed and reported risk in its procurement planning. SCE’s procurement risk analysis in its 2011 Bundled Procurement Plan focused on “market-sensitive” procurement, which in California is driven by natural gas price variability. SCE reported a “to-expiration value at risk” metric, which is evaluated based on a level of customer risk tolerance set by the CPUC.153 California utilities have primarily used this metric to determine the need for hedging, rather than for developing resource portfolios.154
Although CECONY did not quantify risks in its Integrated Long-Range Plan, the utility used key signposts to gauge the need to revisit plans (see Section 3.2 for a discussion in the context of distributed generation). For this purpose, CECONY developed a set of key assumptions to monitor, focused around load forecast and distributed energy resource penetrations.
3.5.2.3 Addressing Longer-term Compliance With Environmental Regulations Planning for longer-term compliance with environmental regulations mixes art and science, in some cases requiring utilities to develop compliance strategies for regulations that have not been finalized, may be revised, or may be made more stringent at some later date. GHG regulations provide a useful illustration of the unique challenges that complying with multi-decadal environmental regulations pose for utilities and regulators.
Many utilities have included CO2 price sensitivities in their resource plans since the 2000s.155 However, they are taking different approaches to addressing uncertainty surrounding compliance with longer-term CO2 regulations. Table 12 shows how the seven utilities in non-restructured jurisdictions reviewed in this report incorporated GHG compliance planning into their resource plans.
Table 12. Approaches to Incorporating Compliance With GHG Regulations
Utility Included CO2 price?
Strategy
DEC Yes None FPL No None GPC Yes None HEC Yes None PacifiCorp Yes Created detailed CPP compliance plan TVA Yes Included a “Meet an Emission Target” strategy to reduce CO2
emissions by 50 percent below 2005 levels by 2030 NSP Yes Strategic flexibility framework to delay thermal additions
until early to mid-2020s, use wind and solar firmed by combustion turbines to meet long-term regulatory goals while prolonging coal unit retirements
153 This metric is similar to conventional value at risk, but incorporates contract expiration dates. 154 Ringer et al. (2007). 155 For a survey of Western U.S. utilities on this topic, see Barbose (2009).

Future Electric Utility Regulation / Report No. 6 60
Six of the seven utilities included CO2 prices in resource portfolio development and selection, but only three examined long-term strategies for compliance with CO2 regulations. PacifiCorp mapped out a detailed plan for state-by-state Clean Power Plan compliance in its 2015 IRP, even though the rule had not yet been finalized. TVA did not explicitly model compliance with the Clean Power Plan in its 2015 IRP, but modeled a strategy for meeting a 50 percent reduction in year 2005 CO2 emissions by 2033, consistent with an 80 percent reduction in emissions by 2050. NSP’s plan was oriented around “strategic flexibility,” which sought to achieve significant reductions in CO2 emissions — 40 percent below 2005 by 2030 — while delaying coal unit retirements and reducing exposure to natural gas price volatility.
None of the utilities in restructured jurisdictions conducted assessments of long-term compliance with GHG regulations. CECONY’s and PECO’s supply-side procurement horizons are less than three years. CECONY does not procure renewable energy, though it has a long-term, integrated planning process for demand-side resource investments. PECO procures both renewable energy and demand-side resources to meet state targets. SCE has a longer procurement horizon, though its procurement of different kinds of resources is spread over a number of individual CPUC proceedings. This fracturing of procurement presents a challenge to longer-term GHG compliance.
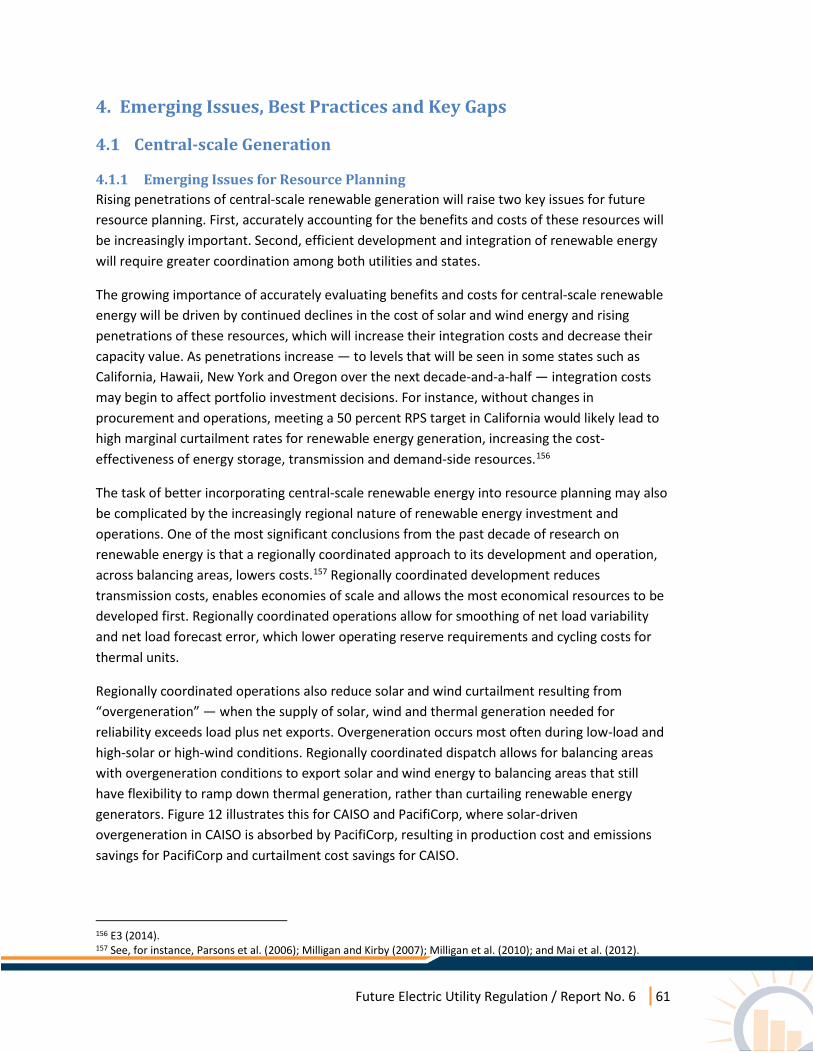
Future Electric Utility Regulation / Report No. 6 61
4. Emerging Issues, Best Practices and Key Gaps
4.1 Central-scale Generation
4.1.1 Emerging Issues for Resource Planning Rising penetrations of central-scale renewable generation will raise two key issues for future resource planning. First, accurately accounting for the benefits and costs of these resources will be increasingly important. Second, efficient development and integration of renewable energy will require greater coordination among both utilities and states.
The growing importance of accurately evaluating benefits and costs for central-scale renewable energy will be driven by continued declines in the cost of solar and wind energy and rising penetrations of these resources, which will increase their integration costs and decrease their capacity value. As penetrations increase — to levels that will be seen in some states such as California, Hawaii, New York and Oregon over the next decade-and-a-half — integration costs may begin to affect portfolio investment decisions. For instance, without changes in procurement and operations, meeting a 50 percent RPS target in California would likely lead to high marginal curtailment rates for renewable energy generation, increasing the cost-effectiveness of energy storage, transmission and demand-side resources.156
The task of better incorporating central-scale renewable energy into resource planning may also be complicated by the increasingly regional nature of renewable energy investment and operations. One of the most significant conclusions from the past decade of research on renewable energy is that a regionally coordinated approach to its development and operation, across balancing areas, lowers costs.157 Regionally coordinated development reduces transmission costs, enables economies of scale and allows the most economical resources to be developed first. Regionally coordinated operations allow for smoothing of net load variability and net load forecast error, which lower operating reserve requirements and cycling costs for thermal units.
Regionally coordinated operations also reduce solar and wind curtailment resulting from “overgeneration” — when the supply of solar, wind and thermal generation needed for reliability exceeds load plus net exports. Overgeneration occurs most often during low-load and high-solar or high-wind conditions. Regionally coordinated dispatch allows for balancing areas with overgeneration conditions to export solar and wind energy to balancing areas that still have flexibility to ramp down thermal generation, rather than curtailing renewable energy generators. Figure 12 illustrates this for CAISO and PacifiCorp, where solar-driven overgeneration in CAISO is absorbed by PacifiCorp, resulting in production cost and emissions savings for PacifiCorp and curtailment cost savings for CAISO.
156 E3 (2014). 157 See, for instance, Parsons et al. (2006); Milligan and Kirby (2007); Milligan et al. (2010); and Mai et al. (2012).
Future Electric Utility Regulation / Report No. 6 62
Figure 12. Reduced Solar Curtailment in CAISO Through Export Capability to PacifiCorp158
The development of a Western Energy Imbalance Market and current discussions between CAISO and PacifiCorp on a regional system operator covering their balancing areas are illustrative of a trend toward greater regional coordination among utilities in the United States, driven in large part by renewable energy integration needs.159
4.1.2 Emerging Best Practices and Key Gaps
4.1.2.1 Accurately Accounting for Renewable Energy Benefits and Costs The need for more accurate accounting for renewable energy benefits and costs applies in all of the three areas discussed in Section 3.1 — how the level and composition of renewable resource acquisitions are determined, how operational impacts from renewable energy are assessed and incorporated into resource evaluations, and how capacity credits and value are determined for renewable generators.
For utilities in non-restructured jurisdictions, accurately evaluating renewable energy is predominantly a modeling challenge. Four of the utilities reviewed in this report (DEC, HEC, PacifiCorp and TVA) treated renewable energy resources as selectable in their capacity 158 Figure is from E3 (2015). 159 See E3 (2013) and E3 (2015). The Western Energy Imbalance Market (EIM) began operations between CAISO and PacifiCorp, its two founding members, in November 2014. As of mid-2016 one other utility, NV Energy, had joined the EIM. Arizona Public Service and Puget Sound Energy are scheduled to join later in 2016, Portland General Electric is scheduled to join in 2017, and Idaho Power is scheduled to join in 2018. For more on the Western EIM, see https://www.caiso.com/informed/Pages/EIMOverview/Default.aspx.

Future Electric Utility Regulation / Report No. 6 63
expansion modeling. This approach allows renewable resources to optimally scale with changes in cost and regulatory requirements. As renewable energy penetrations are increasingly driven by economics and environmental regulation rather than by RPS targets, this approach will enable a more cost-effective level and mix of renewable energy.
Current resource planning models are still limited in their ability to capture the operating characteristics of solar and wind generation.160 In capacity expansion models, these limitations influence the development of portfolios; in production simulation models, they mainly affect sensitivity analysis and the selection of a preferred portfolio. At lower penetrations of solar and wind energy, the effects of modeling limitations are likely to be small, because integration costs are projected to be small. At higher penetrations, current modeling limitations will become much more important. Thus, improving resource planning models should be a priority for states anticipating higher levels of solar and wind generation.
More accurately accounting for renewable energy benefits and costs requires striking a balance between more computationally intensive methods on the one hand, and human and financial resource limitations and the need for transparency on the other. An important area of work will thus be to determine where more detail and sophistication in planning models will meaningfully influence investment and procurement outcomes.
Utility modeling of renewable energy is influenced, at least indirectly, through resource planning guidelines. For instance, regulators can require that utilities evaluate comparable resources using consistent methods, as in Oregon’s case, which requires more consistent treatment between conventional thermal and renewable generation. Improving resource planning models themselves is likely to require an industry-wide effort, supported by regulatory commissions and utilities.
For utilities in restructured jurisdictions, evaluation of renewable energy and its operational impacts occurs mainly through procurement processes. The three relevant jurisdictions reviewed here have very different approaches to renewable energy procurement, each of which has strengths and weaknesses. California’s approach, where LSEs sign full-value contracts with developers based on a least-cost, best-fit ranking (see Section 3.1), provides greater certainty to renewable energy developers and allocates market risks to customers by requiring LSEs to assess the incremental system benefits and costs of renewable energy projects. New York’s and Pennsylvania’s approaches allocate valuation and market risks to generators, but provide less certainty to developers. California’s approach requires utilities to evaluate the benefits and costs of individual renewable energy bids, to ensure a least-cost mix of renewable resources. New York and Pennsylvania allocate this planning responsibility to generators.
160 For an overview of the challenges of incorporating solar generation into capacity expansion models, see Sullivan et al. (2014). For an overview of the challenges of and possible approaches to accounting for the probabilistic nature of solar and wind resources in resource planning models, see Milligan et al. (2012).
Future Electric Utility Regulation / Report No. 6 64
All three states currently use RPS or AEPS targets to drive renewable energy procurement. Over the longer term, however, markets and environmental regulations will likely be the primary drivers. This raises two questions: (1) whether short-term procurement horizons in restructured markets (e.g., in New York, Pennsylvania) will be able to support renewable energy development, and (2) how states in regional markets (e.g., Pennsylvania) resolve the tension between state-focused compliance with environmental regulations and the regional nature of electricity operations in RTO markets.
In both restructured and non-restructured jurisdictions, there has been a move toward reliability-based (e.g., ELCC) and net capacity factor methods for evaluating the capacity credit value of solar and wind energy. Although reliability-based methods are more computationally intensive, they are more accurate and capture the declining capacity value of these resources at higher penetrations. Going forward, utilities, regulators and RTOs/ISOs will need to weigh the potential increase in accuracy against its cost. For utilities that do not have rigorous, consistent methods for calculating solar and wind capacity credits, shifting to one of these two methods should be a priority. Such a shift can be encouraged by regulatory guidelines.
4.1.2.2 Efficiently Developing and Integrating Renewable Energy Through Regional Coordination
In non-RTO regions, greater regional coordination among balancing areas will have important implications for the treatment of renewable generation in resource planning. It will affect renewable energy costs, by enabling development of lower cost resources; solar and wind integration costs, by enabling region-wide balancing of these resources; and, with deeper coordination, the contribution of renewable energy to reliability needs. These, in turn, will affect the level and mix of renewable energy in resource plans. The potential for greater regional coordination in non-RTO regions, and more specifically how it will affect resource planning, remain uncertain.
4.2 Distributed Generation
4.2.1 Emerging Issues for Resource Planning The potential for rapid adoption of distribution generation will require utilities and RTOs/ISOs to better integrate it into their planning processes. Doing so will require improved forecasting, strategies for addressing forecast uncertainty, enhanced methods for assessing integration needs, and, for distribution utilities, enhanced methods for evaluation and targeting.
Higher penetrations of distributed generation have extensive implications for utility resource planning. Utility investment needs are shaped by customer adoption of distributed generation in a number of ways. Distributed generation can reduce peak demand and defer the need to build central-scale generation or invest in transmission and distribution infrastructure. It can also change the shape of utility loads, which in turn may impact the relative attractiveness of different utility resource options. Conversely, distributed generation may trigger new investments in infrastructure to manage changes in power flows on distribution systems or to
Future Electric Utility Regulation / Report No. 6 65
provide increased flexibility. Resource planning provides an integrated process to manage these impacts.
A key challenge associated with distributed generation that utilities will need to address is that distributed generation adoption is driven by customer preferences and retail rate designs that typically are addressed though processes outside of resource planning. As a result, distributed generation introduces a new source of uncertainty into resource planning. As with other sources of uncertainty, utilities will need to establish a process for making the best decisions with available information.
As the cost of distributed generation technologies continues to fall, utility investments in distributed generation, or programs that target where on the utility system customer-hosted distributed generation would be more beneficial, may become a cost-effective means of deferring distribution system upgrades. The costs and the benefits of distributed generation need to be better understood to help utilities make such decisions.
Comprehensive assessment of distributed generation may extend beyond traditional resource planning to include evaluating cost-effectiveness; estimating cost-shifting and rate impacts using a transparent, long-term rate impact analysis; and testing various distributed generation penetration rates using customer payback models. With the results of all three of these quantitative analyses, utilities, regulators and stakeholders can weigh the net benefits and cost-shifting associated with distributed generation development.
4.2.2 Emerging Best Practices and Key Gaps
4.2.2.1 Forecasting Distributed Generation Adoption and Incorporating Forecast Uncertainty
As adoption of distributed generation technologies is largely dependent on customer decision making, utilities are beginning to generate adoption forecasts using models of customer adoption behavior. The market diffusion model used in PacifiCorp’s resource plan provides one example of such an approach. In these models, customer payback — how long it takes customers to recover their initial investment — drives adoption.161 Models can dynamically incorporate reductions in technology costs and incentives over time, as well as changes in retail rates that result from adoption, which in turn influence future adoption. Furthermore, customer adoption models could be used by utility resource planners to link changes to rate design to changes in distributed generation adoption. Although market diffusion models are being increasingly used to forecast distributed PV, these models need to be better validated to improve their accuracy.
Given the inherent uncertainty in distributed generation forecasts, utilities are developing new approaches to ensuring that resource planning decisions are robust to uncertainty. One
161 More specifically, customer payback determines the market saturation level, and in some cases the shape, of an S-curve. For more on the use of market diffusion models to forecast distributed PV adoption, see Denholm et al. (2009).
Future Electric Utility Regulation / Report No. 6 66
approach is to develop a resource plan that is optimal for each scenario of distributed generation adoption, using a capacity expansion model, in order to determine if or when the preferred resource plan would significantly change. These different plans can then be used to identify triggers for revising the resource plan when the rate of distributed generation adoption is sufficiently different from expected. One example of this approach is PacifiCorp’s acquisition path analysis, which identifies the components of its near term and long term plan that would need to change in response to significantly higher or lower than anticipated levels of distributed generation adoption. This sort of analysis allows utilities and regulators to answer the question: How much would distributed generation adoption need to change from expected levels before it would impact the recommended action plan?
4.2.2.2 Integrating Distributed Generation into Bulk Power Systems To some degree, the resource planning process is also being used to ensure that bulk power systems will be able to integrate expected levels of distributed generation. Some utilities used hourly distributed generation profiles to create an hourly net load that is then used to evaluate resource options in capacity expansion models and production cost models. These models can be augmented with more detailed grid integration studies where appropriate.
4.2.2.3 Evaluating Cost-Effectiveness of Distributed Generation Distributed generation is a resource option that can be proactively deployed to meet future needs. For utilities that use capacity expansion models to develop resource portfolios, distributed generation should be included as one resource option. Similarly, in the case of utilities that manually develop resource portfolios, candidate portfolios with increased distributed generation should be evaluated. The challenge will be in deciding how to represent different types of distributed generation as a resource option and distinguish them from conventional resources located on the bulk power system.
The representation of distributed generation within the capacity expansion models should account for any avoided losses or deferral of transmission or distribution investments. For utilities that do not use capacity expansion models, distributed generation can be added to candidate portfolios, along with commensurate increases in the portfolio costs from distributed generation programs and decreases in the portfolio costs from displacing other generation and transmission and distribution investments.
Cost-effectiveness tests can be used to screen potential distributed generation applications. In the context of resource planning, relevant tests include:
• The utility cost test, which indicates the extent to which distributed generation will reduce the utility’s revenue requirements;
• The total resource cost test, which indicates the extent to which distributed generation will reduce the total costs to the utility system and the host customer;162
162 Host customers are always better off (including monetary and non-monetary benefits). Otherwise, they would not install the distributed generation.
Future Electric Utility Regulation / Report No. 6 67
• The societal cost test, which indicates the extent to which distributed generation will reduce total costs to society, including externalities; and
• The ratepayer impact measure test, which indicates the degree to which distributed generation impacts the bills of nonparticipants.
The utility cost test, the total resource cost test, or the societal cost test focus more on overall cost-effectiveness and thus are most appropriate for cost-effectiveness screening for IRPs. The ratepayer impact measure test focuses more on distributional issues between participants and nonparticipants and thus is less applicable to IRPs.
Increasingly, distributed generation is included as a resource option in bulk system resource plans. Determining the cost-effectiveness of distributed generation requires bringing information from distribution planning into resource plans. Similarly, evaluation of resources to meet needs in distribution planning will depend on the impacts of these resources on the bulk system. New planning procedures or better integration of existing planning processes may be required.163 Examples of activities at the forefront of improving the integration of distribution generation and bulk system planning include New York’s Distributed System Implementation Plans, California’s Distribution Resource Plans and Integrated Distributed Energy Resources proceeding, and Hawaii’s Distributed Generation Interconnection Plan and Power Supply Improvement Plans.
4.2.2.4 Targeting Distributed Generation The bulk system benefits of distributed generation are both location and time specific. Distributed generation will be most valuable to the system when it reduces load in areas of the grid that are congested, as highlighted by CECONY, and during times when little excess generation capacity exists. Through rate designs and targeting of incentives, utilities can help to guide adoption of distributed generation, to focus on areas that have high system value. Targeting, in turn, will have implications for the amount and mix of central-scale and other demand-side resources that utilities identify in their resource plans.
In some states, including California and New York, utilities are evaluating the potential for investing in distributed generation as a means to defer distribution system investments. Distributed generation used as a distribution-level resource will also have bulk system implications, by reducing utilities’ capacity and energy needs and decreasing emissions. Targeting the location of distributed generation will require greater coordination of resource planning and distribution planning. Greater coordination will include better alignment of assumptions and scenarios among different planning processes.
163 Lindl et al. 2013; De Martini and Kristov 2015.
Future Electric Utility Regulation / Report No. 6 68
4.3 Demand-side Resources
4.3.1 Emerging Issues for Resource Planning Changes in generation costs, new environmental regulations, and technology improvements will require utilities and regulators to give greater attention to demand-side resources in resource planning. This will include renewed efforts to better integrate demand-side resources into supply planning, as well as efforts to better understand price-responsive loads.
The value of demand-side resources will likely increase over the next decade, driven by three factors: (1) natural gas price uncertainty; (2) higher capital and integration costs associated with increasing levels of renewable energy; and (3) environmental compliance requirements. Demand-side resources have high option value during transition periods, when generation costs are uncertain and utilities face long-term structural risks from technological change and environmental regulation.
New opportunities are opening up for demand-side resources, enabled by new kinds of resources, information technology, new business models, and participation in wholesale markets. New demand-side resources, such as distribution-level energy storage and electric vehicles, may be able to provide significant energy, capacity and ancillary services value to the bulk system, but their benefits and costs are not yet well understood. New information and communications technologies and third-party aggregation of demand-side resources allow system operators greater real-time control over responsive load, distribution-level storage and electric vehicles. This combination will enable price-responsive demand to more actively participate in utility programs or wholesale markets as a dispatchable resource.
The business case for demand-side resources will be strengthened by three nearer- and longer-term developments:
1) In January 2016 the Supreme Court upheld FERC Order 745 (2011),164 which paved the way for “economic” demand response to participate in wholesale markets. This decision removes the uncertainty surrounding participation of demand-side resources in wholesale markets and enables their continued evolution outside of utility programs.
2) New, more dynamic, time-varying rate designs will improve the economics of targeted energy efficiency, demand response, distributed energy storage and electric vehicles.
3) Greater integration between bulk system and distribution planning and resource evaluation will open up new sources of potential value for demand-side resources. The value of distributed energy resources in deferring distribution system upgrades has long been recognized.165 Increasing focus on distributed energy resources, largely driven by distributed generation, is renewing interest in using these resources to defer distribution system investments, resulting in savings for utility customers.
164 FERC (2011). 165 See, for instance, Feinstein et al. (1997).

Future Electric Utility Regulation / Report No. 6 69
With changing system costs, increased risks to utilities and new opportunities, a more integrated approach to evaluating and selecting demand-side resources will become increasingly important. If evaluation of demand-side resources is not well integrated with generation, transmission and distribution system cost forecasts, the level of utility customer-funded investments in demand-side resources will be too low, too high or not sufficiently targeted in space and time, relative to what is cost-effective. If evaluation is not well integrated across demand-side resources, utility customer-funded programs may invest too much overall or invest in the “wrong” resources, relative to what is cost-effective.
A combination of factors — compliance with environmental regulations, state and federal energy policies, and the need to upgrade and replace aging transmission and distribution infrastructure — will put upward pressure on retail rates, which may lead to reduced electricity demand over the longer term. New rate designs, driven by rising penetrations of distributed PV, will have implications for resource planning because of their impacts on the timing of electricity demand.
4.3.2 Emerging Best Practices
4.3.2.1 Integrating Demand-side Resources in Resource Planning For utilities in non-restructured jurisdictions, integration of demand-side resources into planning occurs primarily through the development of resource portfolios. PacifiCorp and TVA treated demand-side resources as selectable resources in their capacity expansion modeling, which enabled the level and composition of demand-side resource investments to vary with input assumptions, such as generation costs and CO2 price allowances (Figure 13). The scenario-based approach used by most other utilities provides a coarse alternative, but does not allow direct trade-offs between investment decisions (e.g., renewable energy versus energy efficiency) or isolate the value of different demand-side resources.
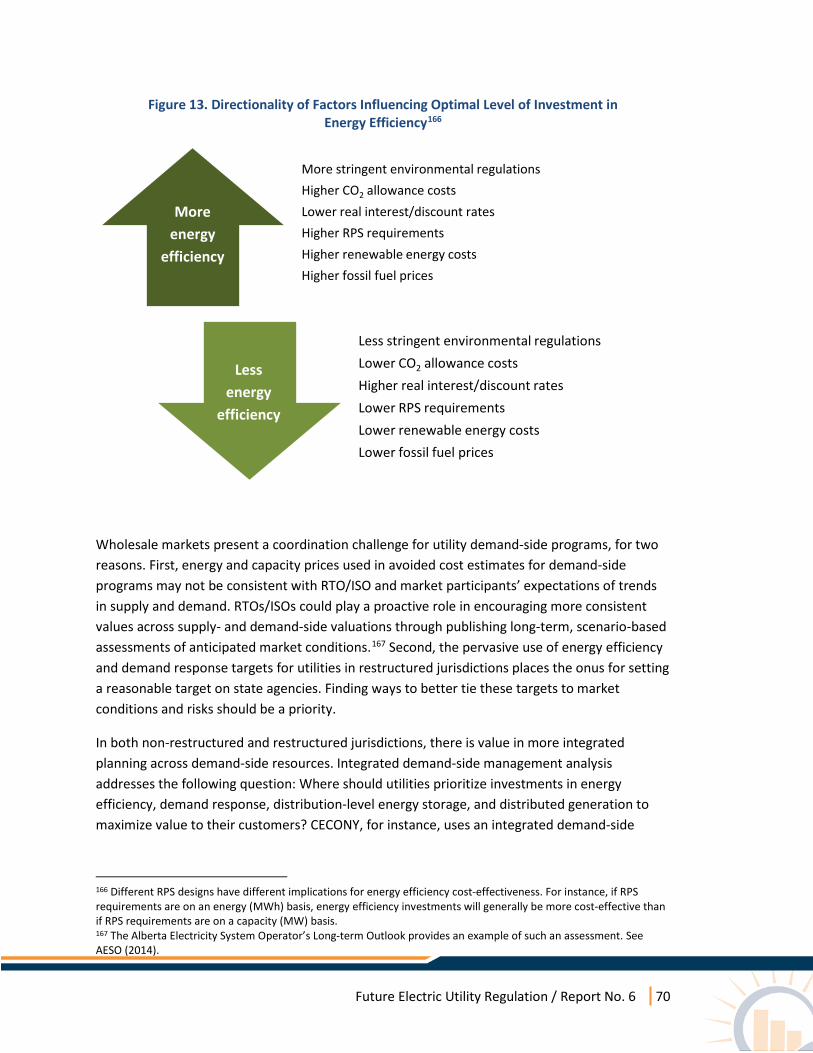
Future Electric Utility Regulation / Report No. 6 70
Figure 13. Directionality of Factors Influencing Optimal Level of Investment in Energy Efficiency166
Wholesale markets present a coordination challenge for utility demand-side programs, for two reasons. First, energy and capacity prices used in avoided cost estimates for demand-side programs may not be consistent with RTO/ISO and market participants’ expectations of trends in supply and demand. RTOs/ISOs could play a proactive role in encouraging more consistent values across supply- and demand-side valuations through publishing long-term, scenario-based assessments of anticipated market conditions.167 Second, the pervasive use of energy efficiency and demand response targets for utilities in restructured jurisdictions places the onus for setting a reasonable target on state agencies. Finding ways to better tie these targets to market conditions and risks should be a priority.
In both non-restructured and restructured jurisdictions, there is value in more integrated planning across demand-side resources. Integrated demand-side management analysis addresses the following question: Where should utilities prioritize investments in energy efficiency, demand response, distribution-level energy storage, and distributed generation to maximize value to their customers? CECONY, for instance, uses an integrated demand-side
166 Different RPS designs have different implications for energy efficiency cost-effectiveness. For instance, if RPS requirements are on an energy (MWh) basis, energy efficiency investments will generally be more cost-effective than if RPS requirements are on a capacity (MW) basis. 167 The Alberta Electricity System Operator’s Long-term Outlook provides an example of such an assessment. See AESO (2014).
More stringent environmental regulationsHigher CO2 allowance costsLower real interest/discount ratesHigher RPS requirementsHigher renewable energy costsHigher fossil fuel prices
Less stringent environmental regulationsLower CO2 allowance costsHigher real interest/discount ratesLower RPS requirementsLower renewable energy costsLower fossil fuel prices
More energy
efficiency
Less energy
efficiency
Future Electric Utility Regulation / Report No. 6 71
management model to identify and target demand-side resource investments.168 In principle, capacity expansion models could enable more integrated analysis among demand-side resources, but would require greater incorporation of local avoided costs.
With a growing number of demand-side resources, utilities will be challenged to integrate the distribution-level benefits of demand-side resources into their resource plans. California’s requirement for LSEs to conduct IRPs may provide a template for doing so, by tying together utilities’ distribution resource planning with longer-term procurement planning.
4.3.2.2 Better Understanding Price-Responsiveness Over the longer term, rising retail rates and new rate designs may reshape the kinds and load impacts of demand-side resources, particularly price-responsive loads. New York’s REV initiative, for instance, aims to drive investment in distributed energy resources through more efficient wholesale and retail pricing. Incorporating the impacts of rate design changes and price-responsive technologies into resource plans will require a better understanding of price-responsive behavior. In the nearer term, pilots can help to improve understanding. San Diego Gas & Electric, for instance, is currently undertaking a pilot to understand electric vehicle charging behavior under dynamic rates.169
4.4 Transmission
4.4.1 Emerging Issues for Resource Planning The same three factors that will drive higher values of demand-side resources — natural gas price uncertainty, rising renewable energy penetrations, and environmental compliance — will also increase the value of transmission expansion over the next two decades. Reflecting this value in transmission investment decisions will require closer coordination between transmission planning and resource planning.
In areas with higher penetrations of solar and wind generation, transmission will have growing value in enabling transmission-constrained regions to export solar and wind energy rather than having to curtail it. In this case, the benefits of transmission expansion are reduced renewable curtailment and variable cost savings from backing down thermal generation. These cost savings are, on their own, unlikely to be sufficient to justify new transmission projects, underscoring the importance of having an approach and process that evaluates and aggregates the different benefits of transmission.
To achieve closer coordination of resource and transmission planning, utilities in non-RTO/ISO regions can better integrate transmission into capacity expansion modeling. For utilities in RTO/ISO regions, integration requires coordination among resource adequacy planning, capacity markets, energy markets and transmission planning.
168 For more on CECONY’s integrated demand-side management model, see Harrington (2015). 169 For the decision approving this pilot, see CPUC (2016).

Future Electric Utility Regulation / Report No. 6 72
Over the longer term, FERC Order 1000 may have implications for resource planning, by encouraging the development of interstate and interregional transmission. Expanded interconnection affects utility resource needs, resource costs and requirements for environmental compliance. In the near term, the implications of Order 1000 for resource planning are uncertain.
4.4.2 Emerging Best Practices and Key Gaps TVA is the only non-RTO region utility reviewed in this report that has attempted to model transmission as a resource in its resource planning process, though it concluded that doing so was not worth the effort. PacifiCorp’s resource plan examined sensitivities with different transmission topologies, which allowed for identification of cost-effective new transmission, though it did not allow transmission to directly “compete” with other resources. How to appropriately integrate transmission as a resource in IRPs is an ongoing question.
All of the RTOs/ISOs reviewed here undertake economic studies to identify economic transmission expansion that reduces congestion. Congestion mitigation is, however, one among a number of benefits of transmission. PJM and NYISO allow transmission to compete with other resources in meeting peak capacity needs, though these processes are separate from their economic studies. Expanding the scope of benefits analysis in economic studies beyond production cost savings would allow RTOs/ISOs to more accurately capture the resource benefits of transmission. To ensure least-cost outcomes, more comprehensive evaluation of transmission benefits should be complemented by processes that consider non-wires alternatives.170
More accurately valuing transmission will also require new approaches and methods. For instance, CAISO’s transmission economic assessment methodology, developed in 2004, explicitly recognized the value of transmission in providing insurance against low-probability/high-cost outcomes.171 However, the industry still lacks a standard approach for assessing risk mitigation benefits.172 The question of how to accurately value the flexibility benefits of transmission will also become more important over the next two decades. Modeling these benefits requires the development of more sophisticated production simulation models that capture the probabilistic nature of solar and wind, as discussed in Appendix 1.
4.5 Uncertainty and Risk Management
4.5.1 Emerging Issues for Resource Planning Over the next two decades, the electricity industry will face uncertainty that is unprecedented both in its scale and scope. In resource plans, two key practices will assist utilities and regulators to address the risks posed by rising uncertainty: (1) using risk-adjusted metrics and (2) developing strategies for longer-term environmental compliance.
170 For a more in-depth discussion, see Chang et al. (2013). 171 CAISO (2004). 172 For a discussion of the risk mitigation benefits of long-distance transmission in Alberta, see Woo et al. (2012).

Future Electric Utility Regulation / Report No. 6 73
Increases in uncertainty and risk in the electricity industry are being driven by a number of interrelated factors, including federal and state environmental regulations; natural gas price uncertainty; load forecast uncertainty; future cost trajectories for central-scale solar and wind generation; future cost trajectories and regulatory constraints for new nuclear reactor technologies; future cost trajectories, regulatory frameworks and business models for distributed generation; and future cost trajectories, regulatory frameworks, and business models for transmission-level, distribution-level and customer-sited energy storage.
Federal and state environmental regulations represent a broad source of uncertainty and risk for utilities. Federal air quality, water and waste regulations may require retirement or retrofit of a significant number of existing fossil fuel-fired generators. Federal climate policy may require significant changes in generation mix. Meanwhile, a number of states have set goals of reducing economy-wide GHG emissions by 60 percent to 80 percent below base year (e.g., 1990 or 2005) levels by 2050, which would require at least commensurate reductions in the electricity sector.
Over the next decade, the most important structural change engendered by these regulations will be a reduction in coal-fired generation, replaced by a combination of renewable and natural gas-fired generation. This shift is, in many ways, an extension of current trends.173 Longer-term compliance with environmental regulations already has implications for investment decision making, given the long-lived nature of electricity sector infrastructure.
The longer planning horizons consistent with longer-term environmental regulations are at odds with a general trend in the industry, which has been toward shorter-term planning horizons. Additionally, compliance with GHG regulations will require significant new investments in generation that has no net CO2 emissions — currently renewable and nuclear energy, which are both capital-intensive resources. In tandem, these developments raise two questions for resource planning, particularly in restructured jurisdictions:
1) Will shorter planning and procurement windows lead to efficient outcomes, if constrained by longer-term regulatory requirements?
2) Will current planning processes, procurement designs, and markets encourage investment levels that are sufficient to maintain reliability and comply with environmental regulations?
Risk is not something to be strictly minimized — it has upsides and downsides.174 Within a more uncertain and risky electricity industry there will be new opportunities for utilities and their customers. For regulators, the key will be to assess risk, and encourage utilities to manage it, in ways that balance risk and reward across a range of possible future events.
173 EIA (2015b). 174 For a discussion, see Beecher and Kihm (2016).
Future Electric Utility Regulation / Report No. 6 74
4.5.2 Emerging Best Practices and Key Gaps
4.5.2.1 Incorporating Risk-adjusted Metrics The use of risk-adjusted metrics, such as TVA’s risk/benefit ratio and risk exposure metrics (see Section 3.5.2.2), provides a more rigorous approach to risk assessment than the more commonly used combination of scenarios and limited sensitivity analysis. If properly structured, the use of risk-adjusted metrics enables utilities, regulators and other stakeholders to identify investment and procurement strategies that have low costs and are robust across a large number of possible scenarios. In an era of heightened uncertainty, the use of risk-adjusted metrics will become increasingly valuable as a tool for regulators and stakeholders to ensure that utilities are proactively managing risks associated with load forecasts, capital costs, fuel costs and market prices. For utilities, use of risk-adjusted metrics can reduce the risk of disallowance.
None of the utilities in restructured jurisdictions reviewed in this report conducts comprehensive portfolio risk analysis, an assessment that includes all of the demand-side and supply-side resources in a utility’s portfolio. In part, this stems from procurement designs, which are generally focused on short-term market risk and include hedging strategies. However, it also stems from the fragmentation of markets and policy-driven resources. In California and New York, for instance, responsibilities and processes for evaluating and procuring different resources — demand-side resources, renewable energy, fossil fuel, hydropower and nuclear resources — are spread across markets and regulatory proceedings, making comprehensive risk analysis difficult. By requiring an integrated procurement strategy, California’s new IRP requirement may encourage the development of a more comprehensive approach to risk analysis and long-term risk management for regulated utilities in the state.
The use of uncertainty analysis and risk-adjusted metrics does not obviate the need for judgment on the part of utilities and regulators. The quality and effectiveness of uncertainty and risk analyses in resource planning depends on clear regulatory guidance on policy goals; well-structured scenarios and sensitivities that reflect ranges of possible outcomes (e.g., very low or very high natural gas prices) and provide a robust framework for understanding interactive effects between different sources of uncertainty (e.g., natural gas prices and solar technology costs); a clear framework for utility executives, regulators and other stakeholders to understand and evaluate the risk-reward trade-offs among different investment strategies; and a transparent, consensus strategy among utilities, regulators and stakeholders for how the results of uncertainty and risk analysis will be used to identify a preferred plan.
4.5.2.2 Developing Strategies for Longer-term Environmental Compliance NSP, PacifiCorp and TVA’s IRPs illustrate novel — and different — approaches to incorporating the longer-term uncertainty associated with environmental regulations. NSP’s approach attempted to preserve flexibility while being sensitive to regulatory requirements in outlying years. PacifiCorp’s approach focused on systematically understanding the benefits, costs and risks of a number of different compliance strategies. TVA explored emission reduction strategies

Future Electric Utility Regulation / Report No. 6 75
that were consistent with longer-term targets beyond planning or compliance horizons. All of these approaches are illustrative of a shift to more thoughtful qualitative and quantitative environmental compliance strategies and a greater focus on longer-term transition.
Compliance with longer-term environmental regulations may present additional challenges for restructured jurisdictions, particularly in regional markets. These challenges stem from the fragmented nature of procurement for policy-driven resources, the multistate nature of regional markets and, in states with competitive retail markets, shorter-term procurement horizons. There are a number of potential solutions to these challenges, from regional CO2 markets (Regional Greenhouse Gas Initiative states) to more integrated planning processes (California) to fundamental pricing reforms (New York). However, as California and New York have shown, developing these solutions requires proactive strategies that are based on a critical review of existing resource procurement processes.
Future Electric Utility Regulation / Report No. 6 76
5. Summary and Considerations for Regulators The electricity industry is at the beginning of a gradual but significant transformation, from an era characterized by central-scale thermal generation and analog electric meters to one characterized by more diverse kinds and scales of generation technologies and greater deployment of digital information and communications technologies. Over time, this transformation will drive a paradigm shift in electricity resource planning, changing long-standing assumptions and requiring new approaches and methods.
Even as the electricity industry changes, resource planning will continue to play an important role. The two primary functions of resource planning — guiding resource investments to meet bulk system reliability and public policy goals, and ensuring that regulated utilities make prudent decisions in the public interest — will grow in importance over the next two decades. Ensuring consistent evaluation among comparable resources, a central goal of IRP, will also increase in importance. This is equally true for restructured jurisdictions, where resource evaluation is divided among utilities, non-utility suppliers, RTOs/ISOs and state agencies.
This report surveys the future of electricity resource planning, by examining emerging issues and evolving practices in five areas that will shape the future of planning:
1) Central-scale generation; 2) Distributed generation; 3) Demand-side resources; 4) Transmission; and 5) Uncertainty and risk management.
This section provides a summary of each area, synthesizing the material in the report. It concludes by distilling a list of key considerations for regulators on the future of resource planning.
5.1 Summary
5.1.1 Central-scale Generation Among central-scale resources, renewable energy will have the most important impact on resource planning practices in the near- to medium-term future. Central-scale renewable energy generation, and solar and wind generation in particular, have very different operating and economic characteristics than conventional thermal and hydropower resources. Integrating renewable resources into resource planning is requiring new approaches and methods.
Currently, utility approaches and methods vary in three main ways: (1) how to determine the level and composition of renewable energy acquisitions; (2) how to assess and incorporate the operational impacts associated with renewable energy, such as higher operating reserve requirements, more frequent cycling of thermal generation, and renewable energy curtailment into resource evaluations; and (3) how to determine the contribution of renewable energy generators to resource adequacy.
Future Electric Utility Regulation / Report No. 6 77
Historically, renewable energy investment in the United States has been driven primarily by RPS targets. With continued declines in renewable energy cost and stricter environmental regulations, investment in renewable energy will increasingly be driven by economics and environmental compliance needs. Rising penetrations of renewable energy generation will have two main implications for resource planning: (1) the need to better account for renewable energy’s benefits and costs in resource planning models, in all three of the areas discussed in the preceding paragraph, so renewable energy generation can compete directly with other resources, and (2) the need for greater regional coordination in resource planning, resulting from increased regional coordination in renewable resource development and system operations.
5.1.2 Distributed Generation Rapid growth in distributed generation, and distributed PV in particular, is making it increasingly important to consider in resource planning. Distributed generation has a number of unique characteristics. Customer adoption of distributed generation depends in large part on retail rate design and interconnection processes, and utilities may have limited direct control over its adoption; its output is often driven by weather and, for CHP, customer needs for heat or steam; and utilities and RTOs/ISOs may have limited ability to control or even “see” distributed generation output.
These unique characteristics have a number of implications for resource planning. First, forecasts of distributed generation adoption will play an increasingly important role in planning, both for utilities and RTOs/ISOs. Second, utility and RTO/ISO planners will increasingly need to assess the operational impacts of distributed generation in their planning processes. Third, resource planning can provide a platform for more integrated evaluation of distributed generation, for the purpose of better targeting it to maximize its value.
Utilities and RTOs/ISOs are at different stages of working through these implications. As they do, it is important that they incorporate the adoption uncertainty associated with distributed generation into their planning processes. Innovative approaches to incorporating adoption uncertainty include the use of “signposts” (CECONY) or “triggers” (PacifiCorp), which require plans to be reassessed when the price of distributed generation falls below a threshold level.
5.1.3 Demand-side Resources Most utilities in the United States administer utility customer-funded programs for demand-side resources, focused on energy efficiency and demand response. In general, planning for demand-side resources is still not well integrated with supply-side planning. Many utility programs are driven by fixed savings targets or budgets. This means that investments in demand-side resources do not scale with changes in utility costs or risks.
The value of demand-side resources is likely to increase over the near- to medium-term future, driven by federal and state environmental regulations, natural gas price uncertainty, and the cost of complying with RPS targets. Accurately accounting for this higher value will require
Future Electric Utility Regulation / Report No. 6 78
better integration between demand-side and supply-side planning. More recent innovations, such as the inclusion of demand-side resources in capacity expansion models as selectable resources (PacifiCorp, TVA) or New York’s REV initiative, may provide a foundation for future efforts.
The emergence of new demand-side resources, such as distribution-level energy storage and electric vehicles, has longer-term implications for resource planning. These new technologies are being enabled by declining costs, legislative or regulatory requirements, rate designs, improvements in information technology, new utility business models and third-party aggregators. In addition, new technologies offer the promise of more demand response resources, including price-responsive loads and direct system operator control. Incorporating them into resource planning will require a better understanding of price-responsive behavior and dispatchability, which could be acquired through the use of utility pilot programs.
5.1.4 Transmission Transmission planning has never been particularly well integrated with resource planning, in the sense that transmission can be used as a substitute for generation resources to meet reliability, cost and environmental objectives. Utilities typically do not evaluate the resource benefits of new transmission in IRPs. RTOs and ISOs, which oversee transmission planning in their regions, undertake economic studies that identify cost-effective transmission expansion on the basis of production cost savings. However, these savings account for only a portion of the benefits of new transmission.
Like demand-side resources, the value of transmission is likely to increase over the coming decades, strengthening the rationale for more integrated assessment of its benefits. For non-RTO regions, accounting for the resource benefits of new transmission will require innovative approaches and greater coordination among utilities. For RTOs/ISOs, it will require expanding the scope of economic studies to include a more comprehensive set of benefits. In both cases, efforts to better value transmission should be complemented by processes that evaluate non-wire alternatives.
In regions with higher penetrations of solar and wind resources, transmission expansion can also play an important role in reducing the integration costs associated with these resources. Accurately capturing these benefits will require improvements in resource planning models.
5.1.5 Uncertainty and Risk Management Over the next two decades, the electricity industry will face unprecedented uncertainty, generating both familiar risks, such as fuel price risk, and new risks, such as those associated with rapid adoption of distributed generation. Environmental regulations will be a broad source of uncertainty and risk for utilities.
Utilities currently take very different approaches to risk analysis and management. Among the non-restructured jurisdictions reviewed in this report, only two utilities (PacifiCorp, TVA) calculated and report risk-adjusted measures of cost in their resource plans. With growing

Future Electric Utility Regulation / Report No. 6 79
uncertainty and risk, state regulators should encourage utilities to conduct more detailed sensitivity analysis and report risk-adjusted metrics. Three utilities (PacifiCorp, NSP, TVA) developed explicit strategies for addressing longer-term environmental regulations, which state regulators should consider encouraging other utilities to do as a best practice.
Utilities in restructured jurisdictions will face challenges in managing portfolio risk and longer-term environmental compliance risks. This challenge stems, in part, from the fragmentation of market and policy-driven resource procurement. In the case of environmental compliance, it also stems from the multistate nature of regional markets and, in areas with competitive retail markets, the short-term nature of procurement horizons. California’s IRP mandate and New York’s REV initiative may encourage innovation in utility risk management tools for partially or fully restructured states.
5.2 Considerations for Regulators Based on common themes across these five areas, we identify 10 implications for future resource planning that will require greater consideration from regulators. They include the need for:
1) More integrated approaches to resource evaluation and acquisition; 2) More comprehensive consideration of investment drivers; 3) More accurate representation of solar and wind generation in resource planning
models; 4) Greater attention to customer behavior, retail rate designs and the distribution system
in resource planning; 5) Risk analysis and use of risk-adjusted metrics; 6) Balancing precision and transparency in planning models; 7) Coherence between planning and long-term policies and regulations; 8) Deeper expertise at state regulatory commissions and energy agencies; 9) Exploring new opportunities for information sharing and collaboration; and 10) Regional coordination in resource planning.
Each of these is described in greater detail below.
More integrated approaches to resource evaluation and acquisition. The potential for significant changes in the electricity industry — driven by technological innovation, fuel price uncertainty and environmental regulations — should encourage renewed efforts to better integrate the evaluation and acquisition of various kinds of resources. For regulators, the implications vary by type of jurisdiction. In non-RTO jurisdictions, integrated evaluation implies, at a minimum, ensuring consistency between the inputs used in planning processes for conventional thermal generation, renewable energy generation, nuclear generation, distributed energy generation, demand-side resources and transmission. More rigorously, regulators can encourage utilities to use consistent methods to evaluate resources and ensure that all resources are incorporated into a comprehensive risk analysis. Of the non-RTO resource plans
Future Electric Utility Regulation / Report No. 6 80
reviewed in this report, PacifiCorp’s and TVA’s plans provide the best examples of integrated resource evaluation.
In wholesale markets, more integrated resource evaluation and acquisition can be partially accomplished by enabling central-scale renewable energy generation, distributed generation, and non-generation resources to participate in capacity, energy and ancillary services markets. Ensuring that this leads to least-cost solutions, however, requires a critical review of the intersection between wholesale markets and planning processes. For instance, RTO/ISO evaluations of new transmission lines based solely on their economic benefits generally exclude a subset of environmental and social benefits. Additionally, only three RTO/ISO wholesale markets (CAISO, ISO-NE, NYISO) incorporate CO2 market prices, and these prices may not adequately capture state policy goals or regulatory risk preferences. To address this gap, many states in organized markets have additional targets for utility procurement of renewable energy and energy efficiency. Setting these targets requires close coordination among state agency planning, utility planning, RTO/ISO planning, and wholesale market forecasts. California’s recent mandate for the state’s LSEs to undertake integrated resource plans provides a timely experiment on how integrated resource evaluation and acquisition might be undertaken in the context of a restructured utility operating under aggressive state policy goals.
More comprehensive consideration of investment drivers. Resource planning has historically been oriented around resource adequacy as the key driver for investment in new resources. Increasingly, this orientation will expand to incorporate a greater emphasis on energy costs, environmental compliance, and risk management as investment drivers, in addition to resource adequacy. Solar and wind generation, for instance, may be cost-effective on an energy cost or environmental basis even if they do not add peak capacity to an electricity system. In non-restructured jurisdictions, state regulators can encourage utilities to consider a broader range of investment drivers through more integrated resource evaluation and comprehensive risk analysis. In restructured jurisdictions, state regulators will need to strike a balance between wholesale markets and state targets for public policy resources, and ensure closer coordination between them.
More accurate representation of solar and wind generation in resource planning models. Resource planning models are still limited in their ability to capture the unique operating characteristics of solar and wind generation. In utility resource plans, these limitations influence the development of resource portfolios and the selection of a preferred portfolio. In RTO/ISO transmission planning, these modeling limitations affect the identification of cost-effective transmission. At low to moderate penetrations of these resources, integration costs are expected to be low, and modeling limitations will likely have a lesser impact on resource planning outcomes. As penetrations increase to higher levels, modeling limitations will have a more material impact on resource acquisition decisions. Improving resource planning models will likely require an industry-wide effort, though state regulators can support this effort by encouraging utilities to use state-of-the-art modeling practices.

Future Electric Utility Regulation / Report No. 6 81
Greater attention to customer behavior, retail rate designs and the distribution system in resource planning. The emergence of lower-cost distributed generation, customer-sited energy storage, electric vehicles, and price-responsive loads will likely strengthen the relationship among utility resource acquisition decisions, retail rates, and adoption of distributed energy technologies. Customer behavior, ratemaking and rate design, and distribution system planning are generally external to the resource planning process. Over the longer term, continuing to treat them separately from bulk system planning will unnecessarily increase risks for utilities, by ignoring the implications in utility investment decisions. Steps to better integrate customer behavior, ratemaking and distribution planning into resource planning include encouraging utilities to forecast adoption of distributed energy resources and include these forecasts in resource plans, to explore mechanisms to better coordinate distribution and bulk system planning;175 and to examine the impacts of alternative rate designs in resource plans. Methods in all of these areas can be enhanced through information sharing and collaboration among utilities and regulators.
Risk analysis and use of risk-adjusted metrics. Despite the growing risks facing the electricity industry, many utilities do not undertake rigorous risk analysis as part of their resource plans. Given the potential for significantly different outcomes under different scenarios of demand, costs, technology and regulations, state regulators should encourage utilities to incorporate rigorous risk analysis and include risk-adjusted metrics in their resource planning.176 While there are a number of different approaches to structuring scenario and sensitivity analysis to support risk assessment, the best of these provide regulators and stakeholders with insight into how changes in key variables, such as natural gas prices, affect evaluation metrics, such as expected cost or cost variance, and ultimately investment or procurement strategies. Among the non-RTO resource plans reviewed in this report, PacifiCorp’s and TVA’s provide best-in-class examples of risk analysis and risk-adjusted metrics (see Section 3.5).
An additional consideration for uncertainty and risk analysis is how it is used in the resource planning process. Essentially, how can resource plans balance the need for rigorous risk analysis, addressing regulator and stakeholder concerns, while providing utilities with sufficient flexibility to respond to changing conditions? A number of innovative responses to this question are emerging. TVA’s “strategic direction” or NSP’s “strategic flexibility” framework provide examples of approaches to address long-term uncertainty. PacifiCorp’s use of triggers and CECONY’s use of signposts provide examples of approaches to respond to changes in conditions over time (see Section 3.2). Across different areas in the resource planning process, there are a growing number of frameworks and decision tools that are available to assist regulators in understanding and assessing risk.177
175 For a more detailed discussion of issues and approaches for integrating distribution system, distributed energy resources, and bulk system planning, see De Martini and Kristov (2015) and EPRI (2015). 176 Binz et al. (2012). 177 For an overview specific to public utility regulation, see Beecher and Kihm (2016).

Future Electric Utility Regulation / Report No. 6 82
Balancing precision and transparency in resource planning models. Improvements in data collection and computing power will enable higher resolution and more rigorous modeling of renewable energy, distribution systems, and uncertainty and risk in resource planning. As resource modeling becomes more computationally intensive, however, there is a risk that it also becomes more inscrutable. Balancing new opportunities for modeling accuracy and precision with the continued need for transparency will require (1) determining where greater modeling complexity is meaningful and (2) the continued use of simpler screening tools in parallel with more complicated models. State regulators can support this balance by encouraging utilities to be transparent about assumptions and methods and to provide stakeholders with clear insights into the key factors driving modeling results.
Coherence between planning and long-term policies and regulations. Many federal and state policies and regulations have multi-decadal compliance horizons. For example, a number of states have long-term GHG reduction goals that extend to 2050. For GHG and other environmental regulations, compliance periods are often in the outlying years or extend beyond utility resource plans. This suggests the need for greater coherence between resource planning and the longer-term nature of public policy goals, as well as a greater focus on long-term transition in resource plans. In non-restructured jurisdictions, some utilities (NSP, TVA) are beginning to explicitly address longer-term transition issues in their resource plans. This practice is useful for identifying and addressing longer-term risks, and regulators can encourage this approach. Restructured jurisdictions face a challenge in aligning long-term policy goals with utilities’ shorter-term resource procurement horizons. To better align policy goals and procurement, state agencies can review existing procurement processes and assess whether they will support longer-term compliance with policy goals, as is occurring in California and New York.
Deeper expertise at state regulatory commissions and energy agencies. The increasing scope and complexity of resource planning problems, as described in sections 3 and 4 of this report, will require expanding the breadth and depth of economics and engineering expertise at state regulatory commissions and, where applicable, state energy agencies. Regulatory commissions and energy agencies make important decisions that guide and influence resource planning, including the development of planning rules and guidelines, design or implementation of procurement processes, development of planning inputs, review of filed resource plans, consideration of resource plans in procurement proceedings and rate cases, and setting and implementation of state targets for demand-side resources and renewable energy. The quality of these and other decisions is strongly shaped by commission and agency expertise. How to build adequate expertise within regulatory commissions and state energy agencies to proactively respond to future challenges in the electricity industry should be a near-term conversation among state lawmakers, regulatory commissions, utilities and stakeholders.
Exploring new opportunities for information sharing and collaboration. As this report illustrates, there is a significant amount of diversity in resource planning practices across the country. Procedural and methodological approaches to the planning process vary widely among

Future Electric Utility Regulation / Report No. 6 83
states. Assumptions in planning models also vary significantly among utilities. As the electricity industry changes and responds to a more uncertain operating environment, information sharing and collaboration among states can lead to greater convergence in planning assumptions and methods and provide a valuable reference for state regulators. New tools are emerging to facilitate the sharing of resource planning information. For instance, Berkeley Lab’s Resource Planning Portal provides a means to standardize, benchmark, and better coordinate planning assumptions.178 On approaches and methods, there remains significant potential for collaboration among regulators, utilities and RTOs/ISOs to develop the next generation of planning frameworks, commercial models and customized tools.
Regional coordination in resource planning. A number of drivers — including the benefits of regional coordination for integrating renewable energy, benefits of cooperation in complying with environmental standards, and federal requirements for regional coordination in transmission planning (FERC Order 1000) — are strengthening the rationale for a more regionally coordinated approach to resource planning. In some cases, coordination may be facilitated through RTOs, the North American Electric Reliability Corporation’s regional entities (e.g., the Western Electricity Coordinating Council), regional state committees, and other existing entities. In others, it may require the creation of new institutions and processes.
178 For more on the Resource Planning Portal, see http://resourceplanning.lbl.gov/.

Future Electric Utility Regulation / Report No. 6 84
References Alberta Electric System Operator (AESO) (2014) 2014 Long-term Outlook. AESO.
Aspen Environmental Group (AEG) and Energy and Environmental Economics (E3) (2008) “Survey of Utility Resource Planning and Procurement Practices for Application to Long-Term Procurement Planning in California,” prepared for the California Public Utilities Commission.
Baldick, Ross and Ed Kahn (1992) Transmission Planning in the Era of Integrated Resource Planning: A Survey of Recent Cases. Lawrence Berkeley National Laboratory.
Barbose, Galen (2009) Managing Carbon Regulatory Risk in Utility Resource Planning: Current Practices in the Western United States. Lawrence Berkeley National Laboratory.
Barbose, Galen, Naim Darghouth, Dev Millstein, Mike Spears, Ryan Wiser, Michael Buckley, Rebecca Widiss, and Nick Grue (2015) Tracking the Sun VIII: The Installed Price of Residential and Non-Residential Photovoltaic Systems in the United States. Lawrence Berkeley National Laboratory.
Beecher, Janice A. and Steven G. Kihm (2016) Risk Principles for Public Utility Regulators. East Lansing: Michigan State University Press.
Binz, Ron, Richard Sedano, Denise Furey, and Dan Mullen (2012) Practicing Risk-Aware Electricity Regulation: What Every State Regulator Needs to Know. CERES.
Bolinger, Mark and Joachim Seel (2015) Utility-Scale Solar 2014: An Empirical Analysis of Project Cost, Performance, and Pricing Trends in the United States. Lawrence Berkeley National Laboratory.
Bolinger, Mark and Ryan Wiser (2009) The Value of Renewable Energy as a Hedge Against Fuel Price Risk: Analytic Contributions from Economic and Finance Theory. Lawrence Berkeley National Laboratory.
California Energy Commission (CEC) and California Public Utilities Commission (CPUC) (2001) California Standard Practice Manual: Economic Analysis of Demand-side Programs and Projects. CEC and CPUC.
CAISO (California Independent System Operator) (2004) Transmission Economic Assessment Methodology (TEAM). CAISO.
CAISO (2015) 2014–2015 Transmission Plan. CAISO.
CAISO and GE Energy Consulting (2010) Integration of Renewable Resources: Operational Requirements and Generation Fleet Capability at 20% RPS. CAISO.
Cappers, Peter, Charles Goldman, and David Kathan (2010) “Demand response in U.S. electricity markets: Empirical evidence.” Energy 35.4: 1526–1535.
Cappers, Peter, Jason MacDonald, and Charles Goldman (2013) Market and Policy Barriers for Demand Response Providing Ancillary Services in U.S. Markets. Lawrence Berkeley National Laboratory, LBNL-6155E.
Carden, Kevin, Nick Wintermantel, and Johannes Pfeifenberger (2011) The Economics of Resource Adequacy Planning: Why Reserve Margins Are Not Just About Keeping the Lights On. National Regulatory Research Institute.

Future Electric Utility Regulation / Report No. 6 85
CECONY (Consolidated Edison Company of New York) (2012) Integrated Long-Range Plan. New York, NY: CECONY.
Chang, Judy W., Johannes P. Pfeifenberger, and J. Michael Hagerty (2013) The Benefits of Electric Transmission: Identifying and Analyzing the Value of Investments. The Brattle Group and WIRES.
Chupka, Marc, Dean Murphy, and Samuel Newell (2008 ) “Reviving Integrated Resource Planning for Electric Utilities: New Challenges and Innovative Approaches.” Energy: Current Topics in Energy Markets & Regulation. The Brattle Group.
Coughlin, Jason, Jennifer Grove, Linda Irvine, Janet F. Jacobs, Sarah Johnson Phillips, Leslie Moynihan, and Joseph Wiedman (2010) A Guide to Community Solar: Utility, Private, and Non-profit Project Development. United States Department of Energy.
CPUC (California Public Utilities Commission) (2004) Opinion Adopting Criteria for the Selection of Least-cost and Best-fit Renewable Resources. Decision 04-07-029. CPUC.
CPUC (2014a) Decision Conditionally Accepting 2014 Renewables Portfolio Standard Procurement Plans and an Off-year Supplement to 2013 Integrated Resource Plan. Decision 14-11-042. CPUC.
CPUC (2014b) Energy Division Staff Proposals Regarding Resource Adequacy (RA) Program Refinements. CPUC.
CPUC (2016). Decision Regarding Underlying Vehicle Grid Integration Application and Motion to Adopt Settlement Agreement. Rulemaking 13-11-007. CPUC.
De Martini, Paul, and Lorenzo Kristov (2015) “Distribution Systems in a High Distributed Energy Resources Future: Planning, Market Design, Operation and Oversight.” Future Electric Utility Regulation series. Lawrence Berkeley National Laboratory.
Denholm, Paul, Easan Drury, and Robert Margolis (2009) The Solar Deployment System (SolarDS) Model: Documentation and Sample Results. National Renewable Energy Laboratory (NREL).
Dennis, Jeff, Suedeen Kelly, Robert Nordhaus, and Douglas Smith (Forthcoming) Federal/State Jurisdictional Split: Implications for Emerging Electricity Technologies. Lawrence Berkeley National Laboratory.
DOE (United States Department of Energy) and EPA (United States Environmental Protection Agency) (2006) National Action Plan for Energy Efficiency. DOE and EPA.
Duke Energy Carolinas (DEC) (2014) Integrated Resource Plan. DEC.
E3 (2013) PacifiCorp-ISO Energy Imbalance Market Benefits. E3.
E3 (2014) Investigating a Higher Renewables Portfolio Standard in California. E3.
E3 (2015) (Energy and Environmental Economics). Regional Coordination in the West: Benefits of PacifiCorp and California ISO Integration. E3.
Future Electric Utility Regulation / Report No. 6 86
Eber, Kevin and David Corbus (2013) Hawaii Solar Integration Study. National Renewable Energy Laboratory.
EIA (U.S. Energy Information Administration) (2016a) Annual Energy Outlook 2015. EIA.
EIA (2016b) July 2016 Monthly Energy Review. EIA.
EIA (2015a) Electricity Market Module. EIA
EIA. December 2015 Monthly Energy Review. EIA, 2015a.
EIA (2015b) Analysis of the Impacts of the Clean Power Plan. EIA.
Ela, Erik, Michael Milligan, and Brendan Kirby (2011) Operating Reserves and Variable Generation: A comprehensive review of current strategies, studies, and fundamental research on the impact that increased penetration of variable renewable generation has on power system operating reserves. NREL.
Electric Power Research Institute (EPRI) (2015) Integrating Distributed Energy Resources Into Electricity Resource Planning: Current Practices and Emerging Issues. EPRI.
EnerNex (2014) NSP Wind Integration Study. Appendix M of NSP’s Upper Midwest Resource Plan. EnerNex.
EPA (U.S. Environmental Protection Agency) (2012) “Regional Haze: Revisions to Provisions Governing Alternatives to Source-Specific Best Available Retrofit Technology (BART) Determinations, Limited SIP Disapprovals, and Federal Implementation Plans (Final Rule).” Federal Register 77.110: 33642–33659.
EPA (2014) “National Pollutant Discharge Elimination System—Final Regulations To Establish Requirements for Cooling Water Intake Structures at Existing Facilities and Amend Requirements at Phase I Facilities (Final Rule).” Federal Register 79.158: 48300–48439.
EPA (2015a) Energy and Environment Guide to Action: State Policies and Best Practices for Advancing Energy Efficiency, Renewable Energy, and Combined Heat and Power, 2015 Edition.
EPA (2015b) “National Emission Standards for Hazardous Air Pollutants From Coal- and Oil-Fired Electric Utility Steam Generating Units and Standards of Performance for Fossil-Fuel-Fired Electric Utility, Industrial-Commercial-Institutional, and Small Industrial-Commercial-Institutional Steam Generating Units; Revisions (Proposed Rule).” Federal Register 80.31): 8441–8484.
EPA (2015c) “Technical Amendments to the Hazardous and Solid Waste Management System; Disposal of Coal Combustion Residuals From Electric Utilities—Correction of the Effective Date (Final Rule).” Federal Register 80.127: 37988–37992.
EPA (2015d) “Cross-State Air Pollution Rule Update for the 2008 Ozone NAAQS (Proposed Rules).” Federal Register 80.232: 75706–75778. EPA finalized this rule on September 7, 2016. See https://www.epa.gov/airmarkets/final-cross-state-air-pollution-rule-update .
EPA (2015e) “Standards of Performance for Greenhouse Gas Emissions From New, Modified, and Reconstructed Stationary Sources: Electric Utility Generating Units (Final Rule).” Federal Register 80.205: 64510–64660.

Future Electric Utility Regulation / Report No. 6 87
EPA (2015f) “Carbon Pollution Emission Guidelines for Existing Stationary Sources: Electric Utility Generating Units (Final Rule).” Federal Register 80.205: 64661–65120.
Eto, Joseph H. and Charles A. Goldman (1993) The Role of Public Power Utilities in Promoting Customer Energy Efficiency: Examples from the United States. Lawrence Berkeley National Laboratory.
Falin, Tom (2015) “Manual 19 Changes: Distributed Solar Generation in the Long-Term Load Forecast.” PJM Presentation, December.
Faruqui, Ahmad, Sanem Sergici, and Kathleen Spees (2014) Quantifying the Amount and Economic Impacts of Missing Energy Efficiency in PJM’s Load Forecast. The Brattle Group.
Feinstein, Charles D., Ren Orans, and Stephen W. Chapel (1997) “The Distributed Utility: A New Electric Utility Planning and Pricing Paradigm.” Annual Review of Energy and the Environment 22: 155–185.
FERC (Federal Energy Regulatory Commission) (1996a) Promoting Wholesale Competition Through Open Access Non-discriminatory Transmission Services by Public Utilities. Order No. 888. Docket No. RM95-8-000.
FERC (1996b) Open Access Same-Time Information System (formerly Real-Time Information Networks) and Standards of Conduct. Order No. 889. Docket No. RM95-9-000.
FERC (1999) Regional Transmission Organizations. Order No. 2000. Docket No. RM99-2-000.
FERC (2003) Standards of Conduct for Transmission Providers. Order No. 2004. Docket No. RM01-10-000.
FERC (2008) Standards of Conduct for Transmission Providers. Order No. 717. Docket No. RM07-1-000.
FERC (2011) Demand Response Compensation in Organized Wholesale Energy Markets. Order No. 745. Docket No. RM10-17-000.
FERC (2012) Transmission Planning and Cost Allocation by Transmission Owning and Operating Public Utilities. Order No. 1000-A. Docket No. RM10-23-001.
Florida Power & Light (FPL) (2015) Ten Year Power Plant Site Plan 2015-2024. FPL.
Fox-Penner, Peter (1998) Electric Utility Restructuring: A Guide to the Competitive Era. Public Utilities Reports, Inc.
Fraunhofer ISE (2015) Current and Future Cost of Photovoltaics. Long-term Scenarios for Market Development, System Prices and LCOE of Utility-Scale PV Systems. Agora Energiewende.
GE Energy Consulting (2005) The Effects of Integrating Wind Power on Transmission System Planning, Reliability and Operations. GE.
GE Energy Consulting (2014) PJM Renewable Integration Study. GE.
Georgia Power Company (GPC) (2013) Georgia Power Company’s 2013 Integrated Resource Plan and Application for Decertification of Plant Branch Units 3 and 4, Plant McManus Units 1 and 2, Plant Kraft Units 1–4, Plant Yates Units 1–5, Plant Boulevard Units 2 and 3, and Plant Bowen Unit 6. GPC.

Future Electric Utility Regulation / Report No. 6 88
Harrington, Michael (2015) “Con Edison’s Integrated Demand Side Management Potential Model.” Presentation at the ACEEE National Conference on Energy Efficiency as a Resource, September 21.
HEC (2013) 2013 Integrated Resource Planning Report. Hawaiian Electric Companies.
HEC (Hawaiian Electric Companies) (2016) Net Energy Metering Status Report 2015. Hawaiian Electric Companies.
Hirst, Eric (1992) A Good Integrated Resource Plan: Guidelines for Electric Utilities and Regulators. Oak Ridge National Laboratory.
Hirst, Eric and Charles Goldman (1991) “Creating the Future: Integrated Resource Planning for Electric Utilities.” Annual Review of Energy and the Environment 16: 91–121.
Hurley, Doug and Paul Peterson (2015) Forecasting Energy Efficiency. Presentation to PJM Load Analysis Subcommittee. Synapse Energy Economics.
Independent System Operator New England (ISO-NE) (2015) “ISO New England’s Response to Pilgrim Nuclear Power Plant Retirement Request.” Press Release, October 13.
Institute for Electric Innovation (2014). Utility-scale Smart Meter Deployments: Building Block of the Evolving Power Grid. Edison Electric Institute.
International Energy Agency (IEA) and Nuclear Energy Agency (NEA) (2010) Projected Costs of Generating Electricity, 2010 Edition. OECD.
Kahn, Edward (1988) Electric Utility Planning & Regulation. American Council for an Energy Efficient Economy.
Lindl, Tim, Kevin Fox, Abraham Ellis, and Robert Broderick (2013) “Integrated Distribution Planning Concept Paper: A Proactive Approach for Accommodating High Penetrations of Distributed Generation Resources.” Interstate Renewable Energy Council.
Lu, S., M. Warwick, N. Samaan, J. Fuller, D. Meng, R. Diao, F. Chassin, T. Nguyen, Y. Zhang, C. Jin, and B. Vyakaranam (2014) Duke Energy Photovoltaic Integration Study: Carolinas Service Areas. Pacific Northwest National Laboratory.
Madaeni, Seyed Hossein, Ramteen Sioshansi, and Paul Denholm (2012) Comparison of Capacity Value Methods for Photovoltaics in the Western United States. NREL.
Mai, Trieu, Debra Sandor, Ryan Wiser, and Thomas Schneider (2012) Renewable Electricity Futures Study: Executive Summary. NREL.
MISO (Midcontinent Independent System Operator) (2012) Multi Value Project Portfolio: Results and Analyses. MISO.
MISO (2014a) Planning Year 2015–2016 Wind Capacity Credit. MISO.
Midcontinent Independent System Operator (MISO) (2014b) MISO North/Central Market Congestion Planning Study. MISO.

Future Electric Utility Regulation / Report No. 6 89
MISO (2014c) GHG Regulation Impact Analysis – Initial Study Results. MISO.
MISO (2015) MISO Solar Capacity Credit. MISO.
Milligan, Michael, Brendan Kirby, Thomas Acker, Mark Ahlstrom, Bethany Frew, Michael Goggin, Warren Lasher, Melinda Marquis, and Dale Osborn (2015) Review and Status of Wind Integration and Transmission in the United States: Key Issues and Lessons Learned. National Renewable Energy Laboratory.
Milligan, Michael and Brendan Kirby (2007) Impact of Balancing Areas Size, Obligation Sharing, and Ramping Capability on Wind Integration. National Renewable Energy Laboratory.
Milligan, Michael, Pearl Donohoo, and Mark O’Malley (2012) Stochastic Methods for Planning and Operating Power Systems with Large Amounts of Wind and Solar Power. National Renewable Energy Laboratory.
Milligan, Michael, Erik Ela, Bri-Mathias Hodge, Brendan Kirby (consultant) and Debra Lew, National Renewable Energy Laboratory; Charlton Clark, Jennifer DeCesaro and Kevin Lynn, U.S. Department of Energy (DOE) (2011) Cost-Causation and Integration Cost Analysis for Variable Generation, NREL/TP-5500-51860.
Milligan, Michael, Brendan Kirby, and Stephen Beuning (2010) Combining Balancing Areas’ Variability: Impacts on Wind Integration in the Western Interconnection. NREL.
Mills, Andrew and Ryan Wiser (2012) An Evaluation of Solar Valuation Methods Used in Utility Planning and Procurement Processes. Lawrence Berkeley National Laboratory, LBNL-5933E.
Mills, Andrew and Ryan Wiser (2014) Strategies for Mitigating the Reduction in Economic Value of Variable Generation with Increasing Penetration Levels. Lawrence Berkeley National Laboratory, LBNL-6590E.
Mills, Andrew, Galen Barbose, Joachim Seel, Changgui Dong, Trieu Mai, Ben Sigrin and Jarett Zuboy (2016) Planning for a Distributed Disruption: Innovative Practices for Incorporating Distributed Solar Into Utility Planning. Lawrence Berkeley National Laboratory, LBNL-1006047.
Mitchell, Cynthia (1992) “Integrated Resource Planning Survey: Where the States Stand.” The Electricity Journal 5.4: 10–15.
The National Council on Electricity Policy (NCEP) (2008) Coordinating Interstate Electric Transmission Siting: An Introduction to the Debate. NCEP.
The National Energy Efficiency Screening Project (2014). “The Resource Value Framework: Reforming Energy Efficiency Cost-Effectiveness Screening.”
Neme, Chris and Jim Grevatt (2015) Energy Efficiency as a T&D Resource: Lessons from Recent U.S. Efforts to Use Geographically Targeted Efficiency Programs to Defer T&D Investments. Northeast Energy Efficiency Partnerships.
Neme, Chris and Richard Cowart (2014) Energy Efficiency Participation in Electricity Capacity Markets – The US Experience. RAP.
Future Electric Utility Regulation / Report No. 6 90
Neme, Chris and Rich Sedano (2012) US Experience with Efficiency As a Transmission and Distribution System Resource. RAP.
NSP (Northern States Power Company) (2015a) Upper Midwest Resource Plan 2016 – 2030: Appendix J, Strategist Modeling and Outputs.
NSP (2015b) Upper Midwest Resource Plan 2016–2030.
NYISO (2010) Growing Wind: Final Report of the NYISO 2010 Wind Generation Study. NYISO.
NYISO (2014) Reliability Planning Process Manual. NYISO.
NYISO (New York Independent System Operator) (2015) Installed Capacity Manual. NYISO.
New York State Energy Research and Development Authority (NYSERDA) (2013) NYSERDA Renewable Portfolio Standard Main Tier 2013 Program Review.
Office of the Inspector General (OIG), Tennessee Valley Authority (2015) Audit Report: Integrated Resource Planning Process.
Oregon Public Utility Commission (OPUC) (2007) Investigated into Integrated Resource Planning. Order No. 07-002.
PacifiCorp (2013) 2012 Wind Integration Resource Study. PacifiCorp.
PacifiCorp (2015a) 2015 Integrated Resource Plan: Volume II – Appendices. PacifiCorp.
PacifiCorp (2015b) 2015 Integrated Resource Plan: Volume I. PacifiCorp.
Parsons, Brian, Michael Milligan, J. Charles Smith, Edgar DeMeo, Brett Oakleaf, Kenneth Wolf, Matt Schuerger, Robert Zavadil, Mark Ahlstrom, and Dora Yen Nakafuji (2006) Grid Impacts of Wind Power Variability: Recent Assessments from a Variety of Utilities in the United States. NREL.
PECO Energy Company (PECO) (2014a) “Petition of PECO Energy Company for Approval to Procure Tier II Alternative Energy Credits Through Independent Brokers.” Pennsylvania Public Utility Commission Public Meeting, P-2014-2408725, April 23.
PECO (2014b) PECO Program Years 2013–2015 Act 129 – Phase II Energy Efficiency and Conservation Plan. PECO.
PECO (2014c) “Petition of PECO Energy Company for Approval of its Default Service Plan for the Period from June 1, 2015 through May 31, 2017.” Pennsylvania Public Utility Commission Docket No. P-2014-.
PJM (2014a) Rules and Procedures for Determination of Generating Capability. PJM Manual 21. PJM.
PJM (2014b) Market Efficiency Study Process and Project Evaluation Training.
PJM (2015a) Follow-up Analysis of Proposed Changes to the PJM Load Forecast Model. PJM.
PJM (2015b) PJM Interconnection Economic Analysis of the EPA Clean Power Plan Proposal. PJM.

Future Electric Utility Regulation / Report No. 6 91
Public Service Commission of Utah (PSC) (1992) Report and Order on Standards and Guidelines. Docket No. 90-2035-01.
Regulatory Assistance Project (RAP) (2013) Electricity Regulation in the US: A Guide. RAP.
Ringer, Mike, David Vidaver, Steven Ostrover, and Serkhan Bahceci (2007) Portfolio Analysis and its Potential Application to Utility Long-term Planning. CEC-200-2007-012SD. California Energy Commission (CEC).
Satchwell, Andrew, and Ryan Hledik (2013) Analytical Frameworks to Incorporate Demand Response in Long-term Resource Planning. Lawrence Berkeley National Laboratory, LBNL-6546E.
Selecky, James, Kathryn Iverson, Ali Al-Jabir, Lisa Schwartz, Richard Sedano, and Patricia Garland (2014) Standby Rates for Combined Heat and Power Systems: Economic Analysis and Recommendations for Five States. RAP.
Shafer, Wade (2015) Solar PV Capacity Addition Forecast for PJM States: Summary report. HIS Energy.
Siegrist, Carl R., Bianca Barth, Becky Campbell, Bart Krishnamoorthy, and Mike Taylor (2013) Utility Community Solar Handbook: Understanding and Supporting Utility Program Development. Solar Electric Power Association.
Southern California Edison (SCE) (2011) AB57 Bundled Procurement Plan. SCE.
Stanton, Tom (2015) Getting the Signals Straight: Modeling, Planning, and Implementing Non-Transmission Alternatives. National Regulatory Research Institute.
SEE Action (State and Local Energy Efficiency Action Network) (2011) Using Integrated Resource Planning to Encourage Investment in Cost-Effective Energy Efficiency Measures. Prepared by John Shenot, Regulatory Assistance Project. DOE.
SEE Action (2016) SEE Action Guide for States: Energy Efficiency as a Least-Cost Strategy to Reduce Greenhouse Gases and Air Pollution and Meet Energy Needs in the Power Sector. Prepared by Lisa Schwartz, Greg Leventis, Steven R. Schiller, and Emily Martin Fadrhonc of Lawrence Berkeley National Laboratory, with assistance by John Shenot, Ken Colburn and Chris James of the Regulatory Assistance Project and Johanna Zetterberg and Molly Roy of U.S. Department of Energy.
Sterling, John, Joyce McLaren, Mike Taylor, and Karlynn Cory (2013) Treatment of Solar Generation in Electric Utility Resource Planning. National Renewable Energy Laboratory.
Sullivan, Patrick, Kelly Eurek, and Robert Margolis (2014) Advanced Methods for Incorporating Solar Energy Technologies into Electric Sector Capacity-expansion Models: Literature Review and Analysis. NREL.
Tennessee Valley Authority (TVA) (2015) Integrated Resource Plan: 2015 Final Report. Knoxville, TN.
Wilkerson, Jordan, Peter Larsen, and Galen Barbose (2014) “Survey of Western U.S. Electric Utility Resource Plans.” Energy Policy 66: 90–103.

Future Electric Utility Regulation / Report No. 6 92
Williams, James H., Benjamin Haley, Fredrich Kahrl, Jack Moore, Andrew D. Jones, Margaret S. Torn, and Haewon McJeon (2014) Pathways to Deep Decarbonization in the United States. Sustainable Development Solutions Network and the Institute for Sustainable Development and International Relations.
Wilson, Rachel and Bruce Biewald (2013) Best Practices in Electric Utility Integrated Resource Planning: Examples of State Regulations and Recent Utility Plans. RAP.
Wilson, Rachel and Paul Peterson (2011) A Brief Survey of State Integrated Resource Planning Rules and Requirements. Cambridge, MA: Synapse Energy Economics.
Wiser, Ryan and Mark Bolinger (secondary authors: Barbose, Galen L., Naïm R. Darghouth, Ben Hoen, Andrew D. Mills, Kristina Hamachi LaCommare, Dev Millstein, Dana Hansen, Kevin Porter, Rebecca Widiss, Michael Buckley, Frank Oteri, Aaron Smith, and Suzanne Tegen) (2015) 2014 Wind Technologies Market Report. Lawrence Berkeley National Laboratory, LBNL-188167.
Woo, Chi-Keung, Rouslan I. Karimov, and Ira Horowitz (2004) “Managing electricity procurement cost and risk by a local distribution company.” Energy Policy 32: 635–645.
Woo, Chi-Keung, Hao Liu, Fredrich Kahrl, Nick Schlag, Jack Moore, and Arne Olson (2012) “Assessing the Economic Value of Transmission in Alberta’s Restructured Electricity Market.” The Electricity Journal 25: 68–80.
Woodford, Dennis (2011) Oahu Wind Integration and Transmission Study (OWITS): Hawaiian Islands Transmission Interconnection Project. National Renewable Energy Laboratory.
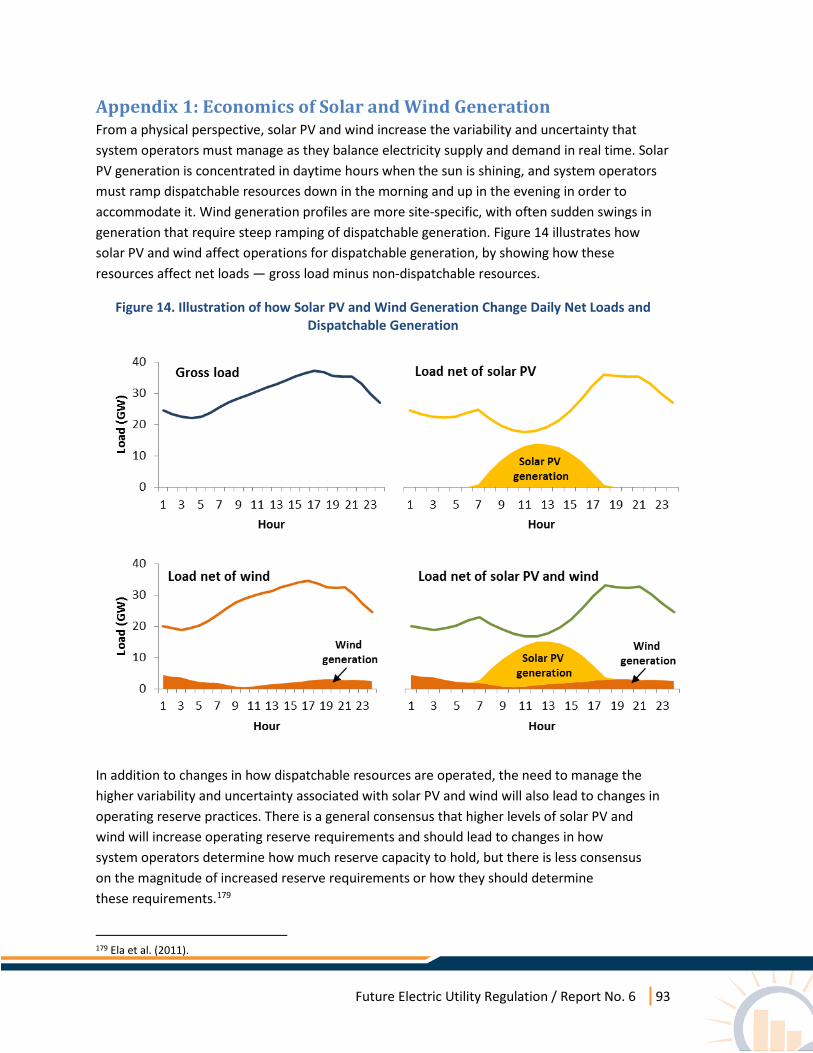
Future Electric Utility Regulation / Report No. 6 93
Appendix 1: Economics of Solar and Wind Generation From a physical perspective, solar PV and wind increase the variability and uncertainty that system operators must manage as they balance electricity supply and demand in real time. Solar PV generation is concentrated in daytime hours when the sun is shining, and system operators must ramp dispatchable resources down in the morning and up in the evening in order to accommodate it. Wind generation profiles are more site-specific, with often sudden swings in generation that require steep ramping of dispatchable generation. Figure 14 illustrates how solar PV and wind affect operations for dispatchable generation, by showing how these resources affect net loads — gross load minus non-dispatchable resources.
Figure 14. Illustration of how Solar PV and Wind Generation Change Daily Net Loads and Dispatchable Generation
In addition to changes in how dispatchable resources are operated, the need to manage the higher variability and uncertainty associated with solar PV and wind will also lead to changes in operating reserve practices. There is a general consensus that higher levels of solar PV and wind will increase operating reserve requirements and should lead to changes in how system operators determine how much reserve capacity to hold, but there is less consensus on the magnitude of increased reserve requirements or how they should determine these requirements.179
179 Ela et al. (2011).
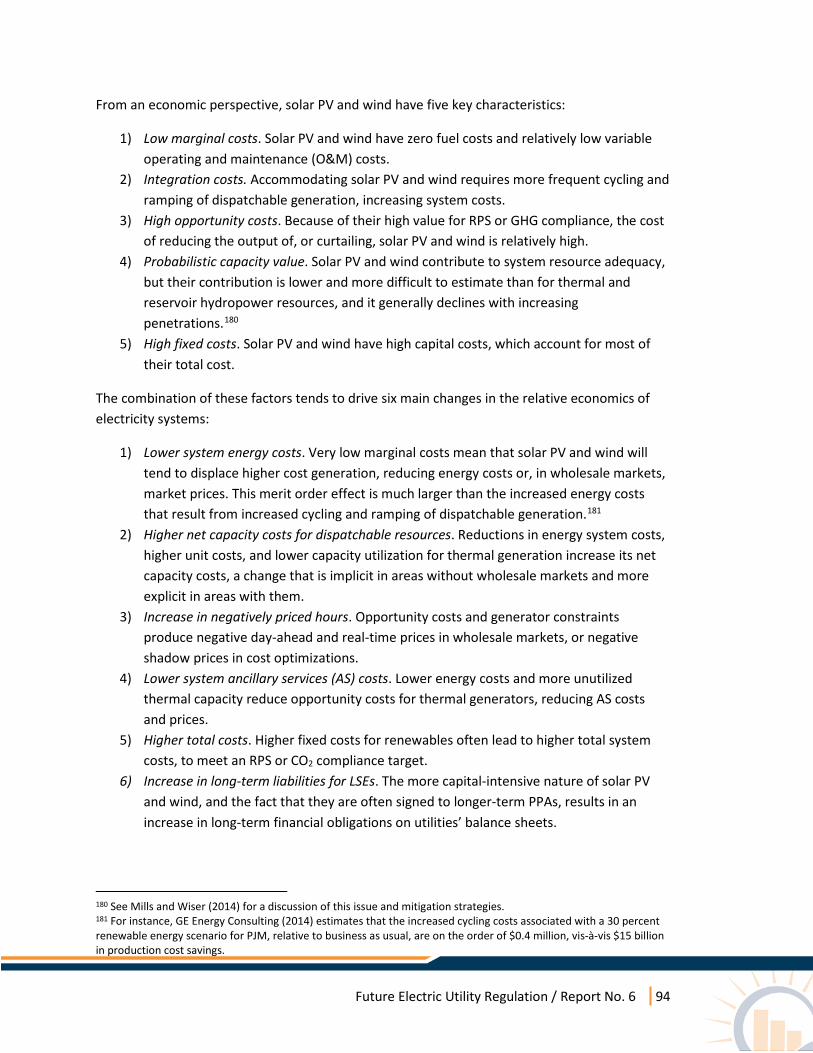
Future Electric Utility Regulation / Report No. 6 94
From an economic perspective, solar PV and wind have five key characteristics:
1) Low marginal costs. Solar PV and wind have zero fuel costs and relatively low variable operating and maintenance (O&M) costs.
2) Integration costs. Accommodating solar PV and wind requires more frequent cycling and ramping of dispatchable generation, increasing system costs.
3) High opportunity costs. Because of their high value for RPS or GHG compliance, the cost of reducing the output of, or curtailing, solar PV and wind is relatively high.
4) Probabilistic capacity value. Solar PV and wind contribute to system resource adequacy, but their contribution is lower and more difficult to estimate than for thermal and reservoir hydropower resources, and it generally declines with increasing penetrations.180
5) High fixed costs. Solar PV and wind have high capital costs, which account for most of their total cost.
The combination of these factors tends to drive six main changes in the relative economics of electricity systems:
1) Lower system energy costs. Very low marginal costs mean that solar PV and wind will tend to displace higher cost generation, reducing energy costs or, in wholesale markets, market prices. This merit order effect is much larger than the increased energy costs that result from increased cycling and ramping of dispatchable generation.181
2) Higher net capacity costs for dispatchable resources. Reductions in energy system costs, higher unit costs, and lower capacity utilization for thermal generation increase its net capacity costs, a change that is implicit in areas without wholesale markets and more explicit in areas with them.
3) Increase in negatively priced hours. Opportunity costs and generator constraints produce negative day-ahead and real-time prices in wholesale markets, or negative shadow prices in cost optimizations.
4) Lower system ancillary services (AS) costs. Lower energy costs and more unutilized thermal capacity reduce opportunity costs for thermal generators, reducing AS costs and prices.
5) Higher total costs. Higher fixed costs for renewables often lead to higher total system costs, to meet an RPS or CO2 compliance target.
6) Increase in long-term liabilities for LSEs. The more capital-intensive nature of solar PV and wind, and the fact that they are often signed to longer-term PPAs, results in an increase in long-term financial obligations on utilities’ balance sheets.
180 See Mills and Wiser (2014) for a discussion of this issue and mitigation strategies. 181 For instance, GE Energy Consulting (2014) estimates that the increased cycling costs associated with a 30 percent renewable energy scenario for PJM, relative to business as usual, are on the order of $0.4 million, vis-à-vis $15 billion in production cost savings.
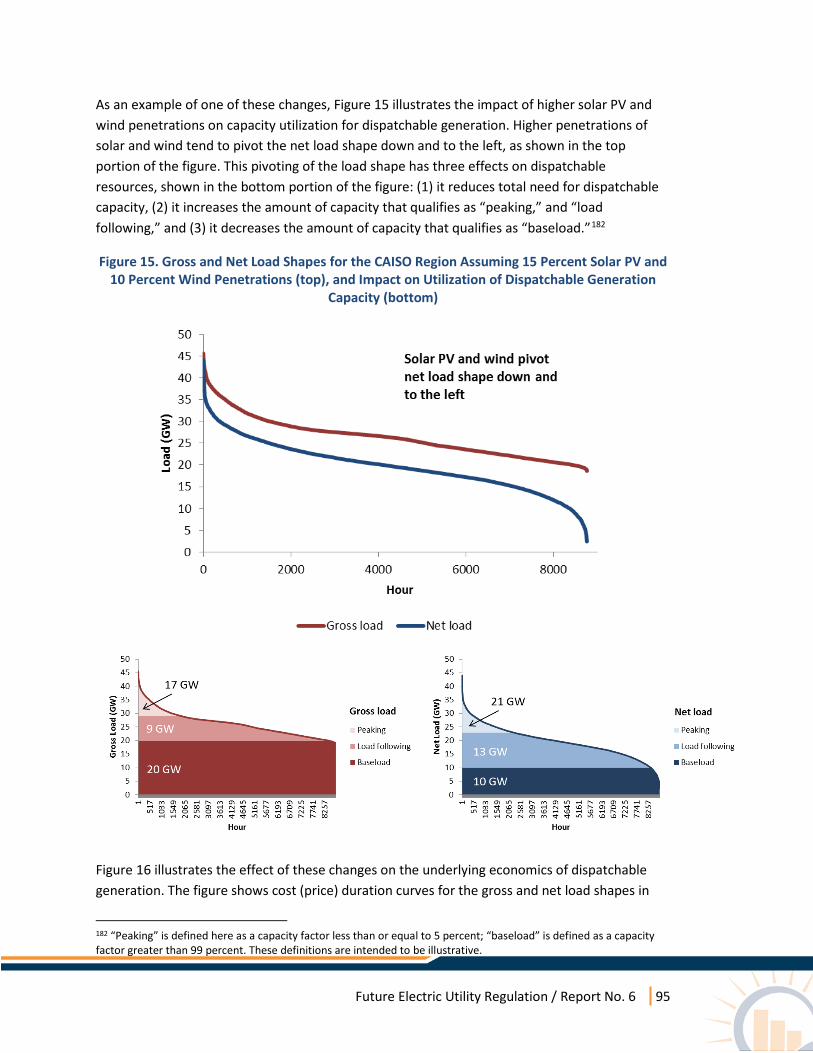
Future Electric Utility Regulation / Report No. 6 95
As an example of one of these changes, Figure 15 illustrates the impact of higher solar PV and wind penetrations on capacity utilization for dispatchable generation. Higher penetrations of solar and wind tend to pivot the net load shape down and to the left, as shown in the top portion of the figure. This pivoting of the load shape has three effects on dispatchable resources, shown in the bottom portion of the figure: (1) it reduces total need for dispatchable capacity, (2) it increases the amount of capacity that qualifies as “peaking,” and “load following,” and (3) it decreases the amount of capacity that qualifies as “baseload.”182
Figure 15. Gross and Net Load Shapes for the CAISO Region Assuming 15 Percent Solar PV and 10 Percent Wind Penetrations (top), and Impact on Utilization of Dispatchable Generation
Capacity (bottom)
Figure 16 illustrates the effect of these changes on the underlying economics of dispatchable generation. The figure shows cost (price) duration curves for the gross and net load shapes in
182 “Peaking” is defined here as a capacity factor less than or equal to 5 percent; “baseload” is defined as a capacity factor greater than 99 percent. These definitions are intended to be illustrative.
Future Electric Utility Regulation / Report No. 6 96
Figure 15, assuming, for simplicity, that all dispatchable needs are met with a single vintage of combined cycle gas turbine.183 For most hours, differences in underlying hourly costs between the two shapes are minimal, but during extreme scarcity hours (< 100 hours per year) these differences become substantial. As a result, the generation-weighted cost (price) of capacity is 3.5-fold higher for the net load shape than the gross load shape. These changes greatly increase the capacity value of targeted energy efficiency, demand response, price responsive load and transmission.
Figure 16. Cost Duration Curves for Gross and Net Load Shapes
Both the physical and economic characteristics described above make economic assessment of renewable resources more difficult than assessment of conventional resources. The value of renewable resources is strongly shaped by integration costs, defined here as the incremental change in system costs with an incremental addition of generating capacity. These costs include:
1) additional fuel and O&M costs from cycling and ramping of dispatchable generation, 2) additional operating reserve costs, (3) additional grid congestion costs, and (4)
renewable energy curtailment costs. All forms of generation, from nuclear to coal to wind, may have integration costs.184
For renewable energy, integration costs are more difficult to calculate because they are driven by the probabilistic and intermittent nature of solar and wind generation, operating constraints of other generation resources, and transmission constraints. Traditional resource planning
183 This CCGT is assumed to have an all-in capacity cost (gross cost of new entry) of $150/kW-yr and an energy price of $40/MWh. 184 See Milligan et al. 2011.

Future Electric Utility Regulation / Report No. 6 97
models are often limited in their ability to capture these characteristics. Capacity expansion models only include a snapshot of dispatch (e.g., representative weeks), with limited representation of system constraints. Production simulation models used in resource planning typically have at least hourly dispatch and greater representation of generator and transmission constraints, but do not account for all constraints and often use deterministic hourly resource profiles for wind and solar generation.
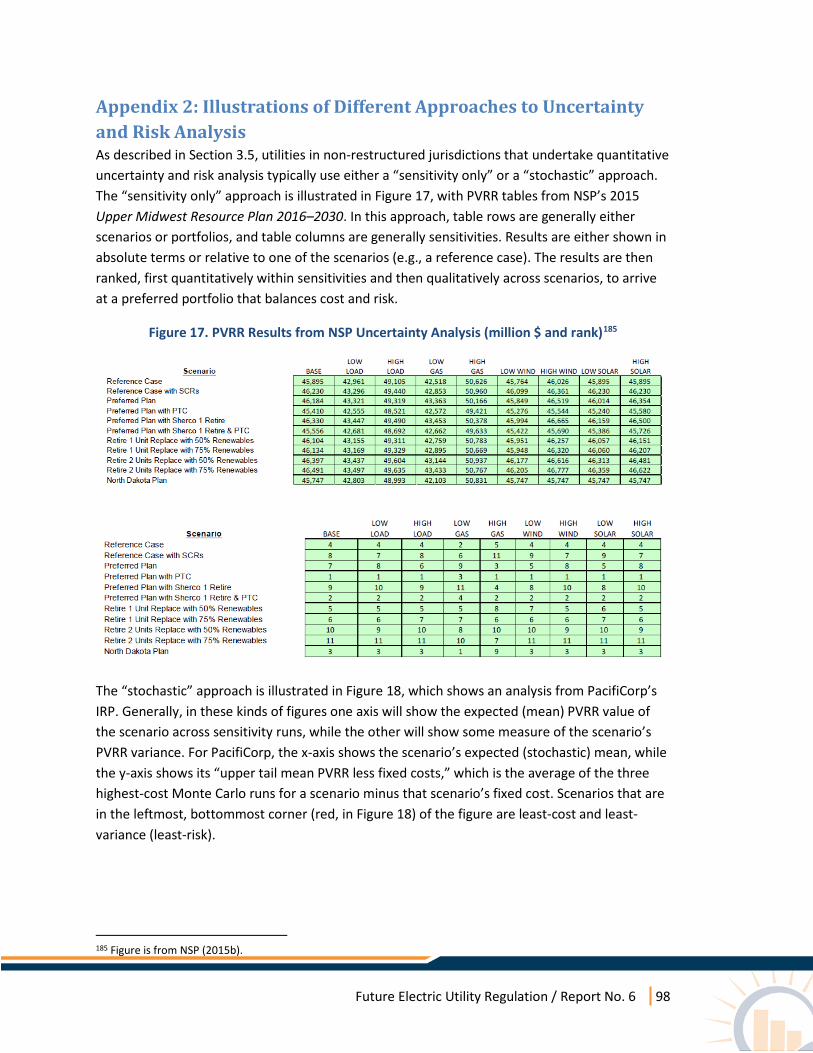
Future Electric Utility Regulation / Report No. 6 98
Appendix 2: Illustrations of Different Approaches to Uncertainty and Risk Analysis As described in Section 3.5, utilities in non-restructured jurisdictions that undertake quantitative uncertainty and risk analysis typically use either a “sensitivity only” or a “stochastic” approach. The “sensitivity only” approach is illustrated in Figure 17, with PVRR tables from NSP’s 2015 Upper Midwest Resource Plan 2016–2030. In this approach, table rows are generally either scenarios or portfolios, and table columns are generally sensitivities. Results are either shown in absolute terms or relative to one of the scenarios (e.g., a reference case). The results are then ranked, first quantitatively within sensitivities and then qualitatively across scenarios, to arrive at a preferred portfolio that balances cost and risk.
Figure 17. PVRR Results from NSP Uncertainty Analysis (million $ and rank)185
The “stochastic” approach is illustrated in Figure 18, which shows an analysis from PacifiCorp’s IRP. Generally, in these kinds of figures one axis will show the expected (mean) PVRR value of the scenario across sensitivity runs, while the other will show some measure of the scenario’s PVRR variance. For PacifiCorp, the x-axis shows the scenario’s expected (stochastic) mean, while the y-axis shows its “upper tail mean PVRR less fixed costs,” which is the average of the three highest-cost Monte Carlo runs for a scenario minus that scenario’s fixed cost. Scenarios that are in the leftmost, bottommost corner (red, in Figure 18) of the figure are least-cost and least-variance (least-risk).
185 Figure is from NSP (2015b).
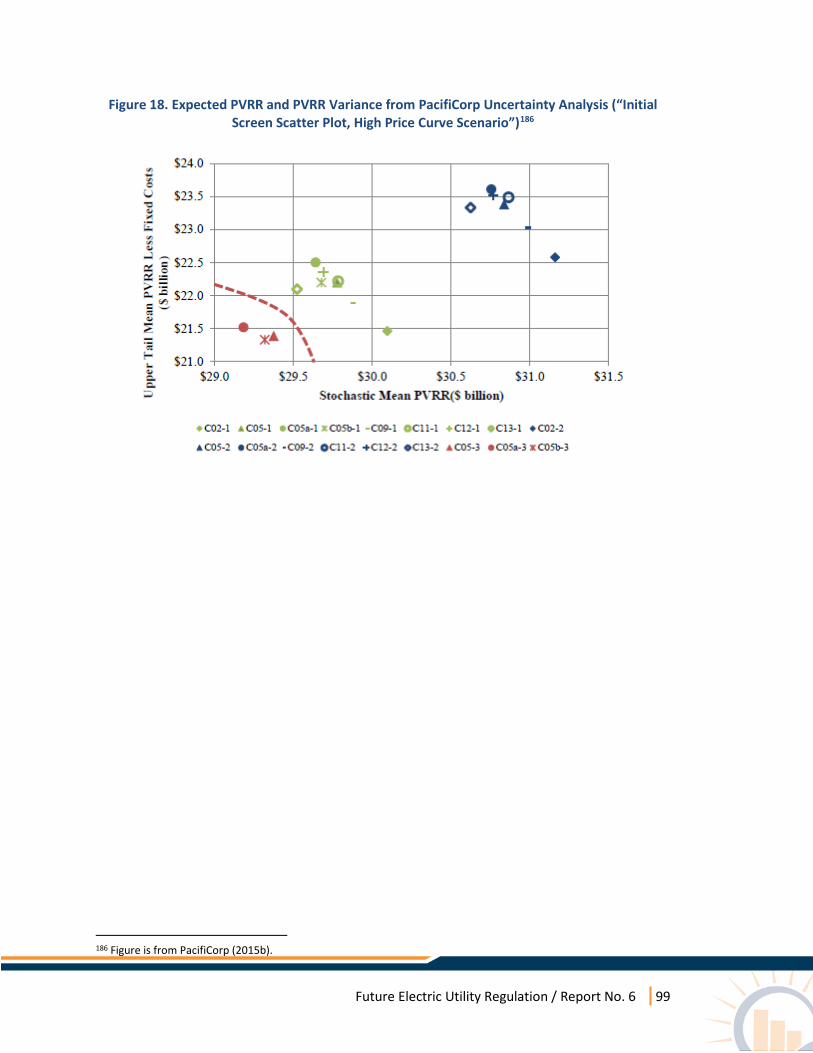
Future Electric Utility Regulation / Report No. 6 99
Figure 18. Expected PVRR and PVRR Variance from PacifiCorp Uncertainty Analysis (“Initial Screen Scatter Plot, High Price Curve Scenario”)186
186 Figure is from PacifiCorp (2015b).