the future of icu informatics - case western reserve ...case.edu/med/bioinformatics/future of icu...
TRANSCRIPT

NEUROCRITICAL CARE PROGRAM
UCSF
The Future of ICU InformaticsThe Future of ICU Informatics
J. Claude Hemphill III, MD, MASJ. Claude Hemphill III, MD, MAS
Associate Professor of Clinical Neurology and Associate Professor of Clinical Neurology and Neurological SurgeryNeurological Surgery
University of California, San FranciscoUniversity of California, San FranciscoDirector, Neurocritical CareDirector, Neurocritical Care
San Francisco General HospitalSan Francisco General Hospital
DisclosuresResearch Support: NIH/NINDS, Novo NordiskConsulting: Astra Zeneca, MedivanceStock options: Cardium Therapeutics (Innercool Therapies), Ornim

Neuromonitoring in NICUNeuromonitoring in NICU
Monitoring of neurologic function Monitoring of neurologic function in patients at high risk forin patients at high risk for
––Primary brain injuryPrimary brain injury from procedure or conditionfrom procedure or condition
––Secondary brain injury Secondary brain injury after a prior neurologic insultafter a prior neurologic insult
The primary focus of Neurocritical Care for CNS problems is the prevention, identification, and treatment of secondary brain injury.

Scope of ProblemScope of Problem
Primary Brain InjuryPrimary Brain Injury•• Ischemic strokeIschemic stroke•• TraumaTrauma•• SAHSAH•• ICHICH•• During and postDuring and post--
procedureprocedure–– EndovascularEndovascular–– SurgicalSurgical
Secondary Brain InjurySecondary Brain Injury•• Ischemic strokeIschemic stroke•• TraumaTrauma•• SAHSAH•• ICHICH•• Status epilepticus?Status epilepticus?•• Meningitis, Meningitis,
encephalitis?encephalitis?
Neuromonitoring in NICUNeuromonitoring in NICU
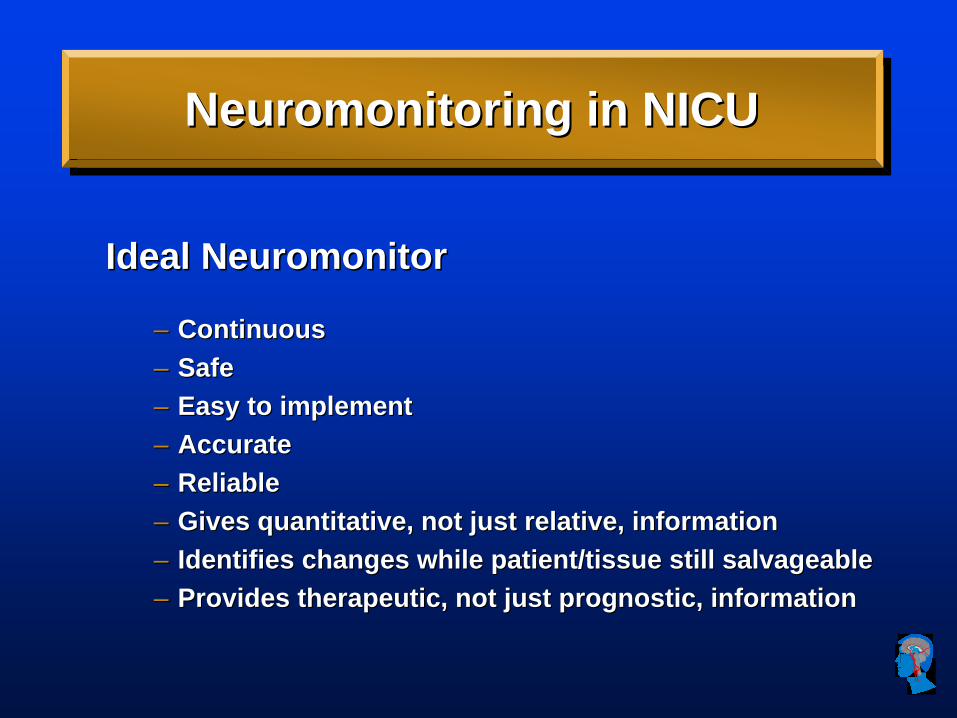
Ideal Ideal NeuromonitorNeuromonitor
–– ContinuousContinuous–– SafeSafe–– Easy to implementEasy to implement–– AccurateAccurate–– ReliableReliable–– Gives quantitative, not just relative, informationGives quantitative, not just relative, information–– Identifies changes while patient/tissue still salvageableIdentifies changes while patient/tissue still salvageable–– Provides therapeutic, not just prognostic, informationProvides therapeutic, not just prognostic, information

Categories of Categories of NeuromonitorsNeuromonitors
•• ClinicalClinical–– Neurologic examinationNeurologic examination
•• PhysiologicPhysiologic–– Pressure Pressure -- ICP, BPICP, BP–– Flow Flow -- CBF, TCDCBF, TCD–– Electrical Electrical -- EEG, EPEEG, EP
•• MetabolicMetabolic–– Oxygen Oxygen –– PPbtbt OO22 , S, Sjj VOVO22
–– Metabolites Metabolites -- microdialysismicrodialysis

What Happens in the NeuroICU Today?What Happens in the NeuroICU Today?
Physiology Matters

Secondary Brain Insults (SBIs)Secondary Brain Insults (SBIs)
•• Exacerbate injury in vulnerable cellsExacerbate injury in vulnerable cells•• Decreased substrate deliveryDecreased substrate delivery
–– HypotensionHypotension–– HypoxiaHypoxia
•• Increased metabolismIncreased metabolism–– FeverFever–– SeizuresSeizures
•• Worsen hemorrhage or edemaWorsen hemorrhage or edema–– HypertensionHypertension
•• Cellular toxicityCellular toxicity–– HyperglycemiaHyperglycemia

Does this Drive NeuroICU Care?Does this Drive NeuroICU Care?
•• Ischemic strokeIschemic stroke–– Hypotension Hypotension –– worsened ischemiaworsened ischemia–– Hypertension Hypertension –– brain hemorrhage (brain hemorrhage (espesp after tafter t--PA)PA)–– FeverFever–– HyperglycemiaHyperglycemia
•• Subarachnoid hemorrhageSubarachnoid hemorrhage–– Hypertension Hypertension –– aneurysm reaneurysm re--rupturerupture–– Hypotension Hypotension –– ischemia from vasospasmischemia from vasospasm
•• Intracerebral hemorrhageIntracerebral hemorrhage–– Hypertension Hypertension –– hematoma expansionhematoma expansion
•• Traumatic brain injuryTraumatic brain injury–– Hypotension, hypoxia, elevated ICP, feverHypotension, hypoxia, elevated ICP, fever

Heart rateBlood pressureOxygen saturation
Pulmonary artery pressureIntracranial pressureTemperature
Nursing DocumentationMedicationsTreatmentsIntake OutputVital signsBlood productsIV fluids
Tissue oxygen
Inspired oxygenTidal volumePeak pressure
End expiratory pressureRespiratory rateVentilation mode
Cardiac outputJugular venous saturation
Sedation level
ICP wave
This is a data intense environment

NeuroICU NeuroICU ““Data ManagementData Management””
•• Large amounts of continuous complex data Large amounts of continuous complex data require robust tools for storage, reporting, require robust tools for storage, reporting, and analysis (for any line of work)and analysis (for any line of work)
•• Routine problem now for corporate, industrial, Routine problem now for corporate, industrial, financial worldfinancial world
•• WeWe’’re dealing with the most important thing in re dealing with the most important thing in the worldthe world
–– Human lifeHuman life–– The brainThe brain
•• So how are we doing?So how are we doing?

What do we do with all this data?What do we do with all this data?
•• Monitoring has advanced Monitoring has advanced tremendously since the origins tremendously since the origins of critical care in the 1960sof critical care in the 1960s
•• We look at the data in basically We look at the data in basically the same waythe same way

ICU OrdersICU Orders
••
Call HO if temp > 38.5Call HO if temp > 38.5OOCC••
Call HO if SBP > 180 mmHgCall HO if SBP > 180 mmHg
••
Call HO if SBP < 90 mmHgCall HO if SBP < 90 mmHg••
Call HO if ICP > 20 mmHgCall HO if ICP > 20 mmHg
••
Call HO if OCall HO if O22
sat < 93%sat < 93%••
Call HO if glucose > 200 mg/dlCall HO if glucose > 200 mg/dl
••
Call HO if PCall HO if Pbtbt
OO22
< 15 mmHg< 15 mmHg••
Call HO if SCall HO if Sjj
VOVO22
< 50%< 50%
Treating thresholds one at a time;Keeping it between the lines

Looking at ICU Data BedsideLooking at ICU Data Bedside
Paper charts in most ICUs, electronic charts in some

Rounding in the NeuroICU TodayRounding in the NeuroICU Today

ICUInformatics
2008

HO (or attending) to BedsideHO (or attending) to Bedside
•• Treat the momentTreat the moment–– Order for intervention targeting single parameterOrder for intervention targeting single parameter
»» Tylenol for T > 38.5Tylenol for T > 38.5ooCC»» LabetalolLabetalol for SBP > 180 mmHgfor SBP > 180 mmHg»» Fluid bolus or Fluid bolus or pressorspressors for SBP < 90 mmHgfor SBP < 90 mmHg»» MannitolMannitol for ICP > 25 mmHgfor ICP > 25 mmHg
•• Review of nursing bedside chart for trendsReview of nursing bedside chart for trends•• Usually no attention to relationship among Usually no attention to relationship among
parameters (ICP, MAP, Pparameters (ICP, MAP, Pbtbt OO22 , temp, , temp, glucgluc))–– Experience of practitionerExperience of practitioner–– Data not manageableData not manageable

This is good, right?This is good, right?
Pharmacokinetics & dose-response relationships
Multivariable regression models of disease prediction
Gene expression microarrays and bioinformatic analyses

So WhatSo What’’s the Problem?s the Problem?
•• Some of what we donSome of what we don’’t knowt know
1)1) Do SBIs have a doseDo SBIs have a dose--response relationship with response relationship with outcome?outcome?
2)2) We treat We treat univariateunivariate in a multivariate worldin a multivariate worldInteraction and relationship between various Interaction and relationship between various physiologic parameters?physiologic parameters?Event signatures?Event signatures?
3)3) How do we integrate new measures (e.g. PHow do we integrate new measures (e.g. Pbtbt OO22 )?)?4)4) How often do we need to collect physiologic data How often do we need to collect physiologic data
to optimize patient care?to optimize patient care?
This is complicated

Is more worse?Is more worse?
•• DoseDose--response relationship between SBIs response relationship between SBIs and outcome makes intuitive senseand outcome makes intuitive sense
•• WhatWhat’’s a s a ““dosedose”” of of …… ??–– FeverFever–– HypotensionHypotension–– HypoxiaHypoxia–– Elevated ICPElevated ICP–– HyperglycemiaHyperglycemia

Secondary Brain Insults and OutcomeSecondary Brain Insults and Outcome
•• Any occurrenceAny occurrence–– TCDB: hypotension or hypoxiaTCDB: hypotension or hypoxia–– Fever at hospital admission: ICH and ischemic strokeFever at hospital admission: ICH and ischemic stroke–– Hyperglycemia at hospital admission: ischemic strokeHyperglycemia at hospital admission: ischemic stroke–– High BP at admission (in diabetics): ICH expansionHigh BP at admission (in diabetics): ICH expansion
•• Number of occurrencesNumber of occurrences–– Jugular venous oxygen Jugular venous oxygen
desaturationsdesaturations (< 50% for > 10 min)(< 50% for > 10 min)
•• Duration (or % time) above a thresholdDuration (or % time) above a threshold–– TCDB: ICPTCDB: ICP–– Fever: ICHFever: ICH
01020304050607080
No Desats 1 Desat MultipleDesats
Good/ModSevere/VegDead
Robertson, Neurotrauma, 1996
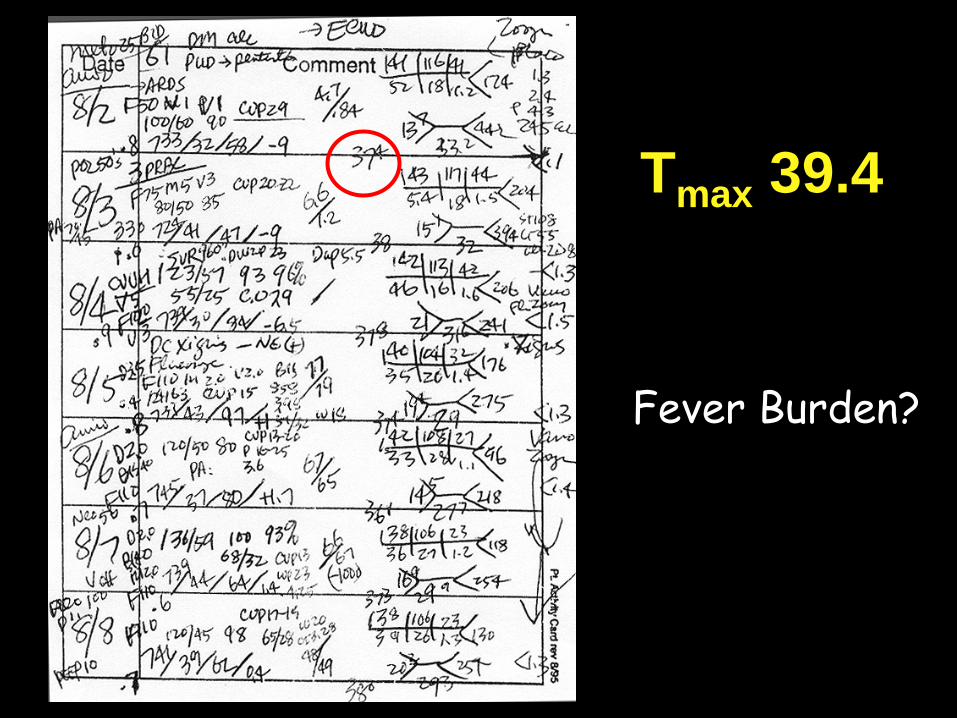
Tmax 39.4
Fever Burden?

Borrowing from PharmacokineticsBorrowing from Pharmacokinetics
•• ““DoseDose”” is area under the curve (AUC)is area under the curve (AUC)
35
35.5
36
36.5
37
37.5
38
38.5
39
39.5
0 20 40 60 80 100 120 140 160
Hours from Hospital Admission
Bod
y Te
mpe
ratu
re

+
Does It Matter How we Define Dose?Does It Matter How we Define Dose?
SBI Odds Ratio 95% CI PAny hypotension (n=26) 3.39 1.34-8.56 .009
1 episode of hypotension 2.05 0.67-6.23 0.21
≥
2 episodes of hypotension 8.07 1.63-39.9 0.01
Minimal dose hypotension (< 1 mmHg*minute)
1.35 0.28-6.4 0.71
Moderate dose hypotension (1-100 mmHg*minutes)
3.14 0.85-11.6 0.087
High dose hypotension (> 100 mmHg*minutes)
12.55 1.5-107 0.021
Impact of ED episodes and dose of hypotension on risk of in-hospital death after severe TBI (n=107)
*
* Manley, Arch Surg, 2001 +Barton, Acad Emerg Med, 2005

MannitolMannitol DoseDose--ResponseResponse

Bland-Altman Plot – Difference v. Mean
How Often Do We Need to Collect this Data?How Often Do We Need to Collect this Data?
•• Current standardCurrent standard–– Paper chart Paper chart -- Q 1 hour Q 1 hour
and as neededand as needed–– CareVue (electronic CareVue (electronic
medical record) medical record) –– up to Q 15 minup to Q 15 min
•• Study comparing Q 1 min Study comparing Q 1 min v. medical record (MR) for v. medical record (MR) for SBI identification and SBI identification and dose (n=16; 72 hours dose (n=16; 72 hours each)each)
ICP > 20
Subject# of Events AUC in mmHg.min
Q 1 min MR Q 1 min MR
1 1 1 0.5 0.1
2 10 6 13.8 9.8
3 1 0 6.1 0
6 2 10 3.0 3.0
7 9 5 76.6 73.7
8 0 1 0 0.1
9 0 1 0 1.5
10 21 12 22.1 25.6
11 0 0 0 0
12 0 14 0 25.9
13 0 0 0 0
14 7 76 4.3 33.6
15 1 11 0.4 8.5
16 4 4 7.6 13.5
17 40 23 59.9 73.7
Hemphill, Physiological Measurement, 2005

NICU Data Acquisition 2003NICU Data Acquisition 2003
•• Independent CPUIndependent CPU•• Multiple serial portsMultiple serial ports
–– Overhead monitor Overhead monitor (Philips)(Philips)
–– Ventilator (Ventilator (DraegerDraeger))–– Brain OBrain O22 (Licox)(Licox)–– CBF (CBF (HemedexHemedex))
•• Data timeData time--synchedsynched•• Operator must initiate Operator must initiate
data acquisitiondata acquisition

Physiology Cluster Analysis
Pbt
O2ETCO2
SBPDBP
MAP
Self-organizing map reduces high-dimensional information to a two-dimensional grid

Borrowing from GenomicsBorrowing from Genomics
Self-organizing Map Distance Map Projection
Cluster analysis of microdialysis data (26 patients) -Nelson, Crit Care Med, 2004

State 1 State 2 State 3 State 4 States 5,6 State 7
PHYSIOLOGIC SIGNATURES
Pattern Recognition

Some Obvious ProblemsSome Obvious Problems
•• If this were easy, it would have been done a long time ago.If this were easy, it would have been done a long time ago.
•• Data cleaningData cleaning–– Bedside charts are Bedside charts are ““cleanedcleaned”” at the time of entryat the time of entry–– Major problem for continuous physiological dataMajor problem for continuous physiological data–– Need automatic cleaning algorithmsNeed automatic cleaning algorithms
•• Interoperability of systemsInteroperability of systems–– Devices (and their exported data) are often proprietaryDevices (and their exported data) are often proprietary–– Physiological, text, and other data in separate systemsPhysiological, text, and other data in separate systems–– Data not in common language across institutions or systemsData not in common language across institutions or systems

““Hospital InformaticsHospital Informatics”” 20082008
•• To most people, hospital informatics meansTo most people, hospital informatics means–– Electronic Medical Records (EMR)Electronic Medical Records (EMR)–– Computerized Order Entry (CPOE)Computerized Order Entry (CPOE)–– Billing softwareBilling software–– Records to satisfy regulatory requirements (e.g. JCAHO)Records to satisfy regulatory requirements (e.g. JCAHO)
•• This is not what This is not what ““informaticsinformatics”” meant in the meant in the Human Genome Project.Human Genome Project.
•• GE, Philips, SiemensGE, Philips, Siemens–– Will try to sell you their off the shelf system and tell you itsWill try to sell you their off the shelf system and tell you its
what you needwhat you need–– DonDon’’t believe themt believe them

Too ComplicatedToo Complicated…… Who Cares?Who Cares?
• First report from INSTITUTE OF MEDICINE Committee on Quality of Health Care in America
• Future reports: – re-designing the health care
delivery system for the 21st Century
– aligning financial incentives to reward quality care
– critical role of information technology as a tool for measuring and understanding quality

Learning Lessons from History Learning Lessons from History -- CTCT
•• First CT machineFirst CT machine–– 9 days to scan an object9 days to scan an object–– 21 hours to computer process 21 hours to computer process
informationinformation
•• Sir Godfrey Hounsfield Sir Godfrey Hounsfield –– Nobel prize speech 1979Nobel prize speech 1979
–– ““When I investigated the advantages When I investigated the advantages (of CT scanning) over conventional x(of CT scanning) over conventional x-- ray techniques, it became apparent ray techniques, it became apparent that the conventional methods were that the conventional methods were not making full use of all the not making full use of all the information that xinformation that x--rays could give.rays could give.””
Beckmann. British Journal of Radiology 2006
EvidenceEvidence--based Neurocritical Carebased Neurocritical Care
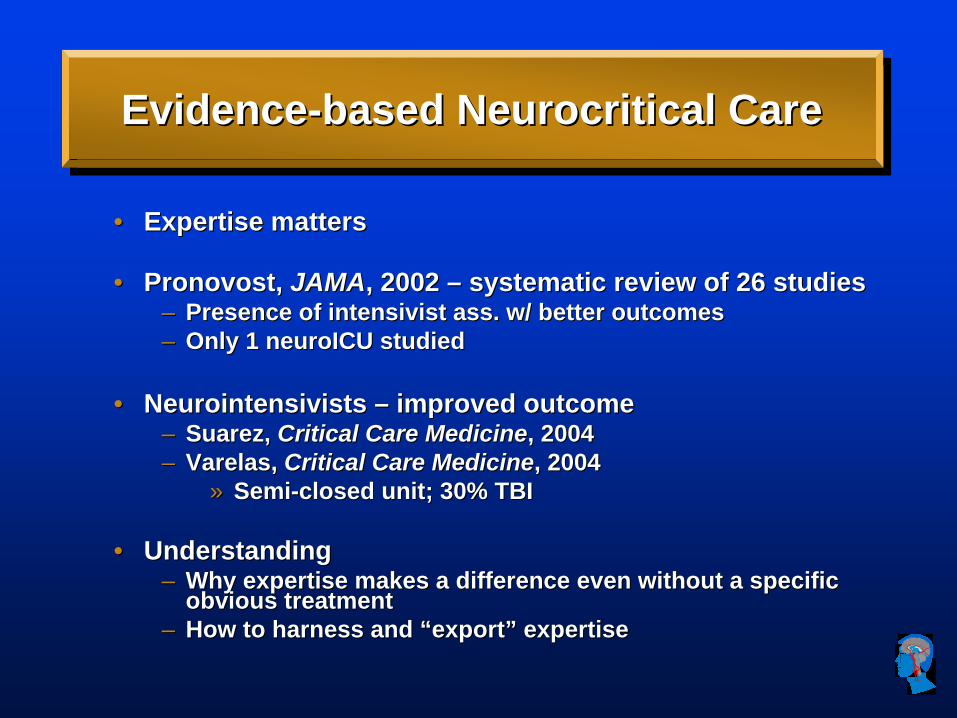
•• Expertise mattersExpertise matters
•• PronovostPronovost, , JAMAJAMA, 2002 , 2002 –– systematic review of 26 studiessystematic review of 26 studies–– Presence of Presence of intensivistintensivist ass. w/ better outcomesass. w/ better outcomes–– Only 1 neuroICU studiedOnly 1 neuroICU studied
•• NeurointensivistsNeurointensivists –– improved outcomeimproved outcome–– Suarez, Suarez, Critical Care MedicineCritical Care Medicine, 2004, 2004–– VarelasVarelas, , Critical Care MedicineCritical Care Medicine, 2004, 2004
»» SemiSemi--closed unit; 30% TBIclosed unit; 30% TBI
•• UnderstandingUnderstanding–– Why expertise makes a difference even without a specific Why expertise makes a difference even without a specific
obvious treatmentobvious treatment–– How to harness and How to harness and ““exportexport”” expertiseexpertise

Neurocritical Care Database/Informatics
GOALSGOALS
1)1) Identify physiological signatures to diagnose patients and Identify physiological signatures to diagnose patients and predict outcomespredict outcomes
2)2) Use realUse real--time data to rationally drive clinical decisions and time data to rationally drive clinical decisions and treatment based on the specific physiologic abnormalitytreatment based on the specific physiologic abnormality
3)3) Determine dosage and delivery for commonly used NICU Determine dosage and delivery for commonly used NICU medicationsmedications
4)4) Suggest new clinicallySuggest new clinically--relevant experimental research modelsrelevant experimental research models
5)5) Develop userDevelop user--friendly friendly ““behind the scenesbehind the scenes”” data analysis that data analysis that aids interpretability and clinical applicability aids interpretability and clinical applicability

NeuroICU Physiological InformaticsNeuroICU Physiological Informatics
•• Collaborative ProjectCollaborative Project–– Admit it: this is beyond bedside cliniciansAdmit it: this is beyond bedside clinicians–– Clinicians, computer scientists, informatics, Clinicians, computer scientists, informatics,
industryindustry
•• UC Discovery GrantUC Discovery Grant–– Pilot project between UCSF, UC Berkeley, IntelPilot project between UCSF, UC Berkeley, Intel–– Two years: develop data warehouse methods, Two years: develop data warehouse methods,
pilot data analysispilot data analysis–– Expand to multiExpand to multi--center project (will require large center project (will require large
numbers of patients with longnumbers of patients with long--term outcome)term outcome)
•• NIH/NINDS SBIR NIH/NINDS SBIR –– Scott Winterstein, PhDScott Winterstein, PhD–– Data acquisition methodology and device libraryData acquisition methodology and device library

NICU Data Acquisition 2008NICU Data Acquisition 2008
•• The primary data are:The primary data are:1.1. Bedside physiological data (Bedside physiological data (AristeinAristein--””homemadehomemade””))2.2. ICU Patient Care Chart (ICU Patient Care Chart (CarevueCarevue--Philips)Philips)3.3. Lifetime Clinical Record (Lifetime Clinical Record (InvisionInvision--Siemens)Siemens)
•• No kiosk No kiosk –– each bed with networked data acquisitioneach bed with networked data acquisition•• Bedside physiological data collected continuously Bedside physiological data collected continuously
(Q1 minute) and automatically into Data Registry (Q1 minute) and automatically into Data Registry ServerServer
•• Must have contextual data (e.g. medications and Must have contextual data (e.g. medications and timing) in order to make sense timing) in order to make sense of physiological dataof physiological data

The Future of ICU InformaticsThe Future of ICU Informatics
•• NeuroICU monitoring tools have advanced beyond our NeuroICU monitoring tools have advanced beyond our current ability to understand how to use themcurrent ability to understand how to use them
•• This is due to the disconnect between data This is due to the disconnect between data generationgeneration and and data data analysisanalysis
•• Advances in realAdvances in real--time usertime user--friendly data analysis must friendly data analysis must accompany advances in neuromonitoring techniquesaccompany advances in neuromonitoring techniques
•• This will be a This will be a ““long haullong haul””•• This is a largeThis is a large--scale collaborative effort across institutionsscale collaborative effort across institutions•• Avoid the temptations toAvoid the temptations to
–– Be impatient and give upBe impatient and give up–– Assume the data we want is easily obtained/acquiredAssume the data we want is easily obtained/acquired–– Expect big answers right awayExpect big answers right away–– Read too much into early simple analysesRead too much into early simple analyses–– Assume large companies will provide us with the solutionsAssume large companies will provide us with the solutions

UCSF NeurosurgeryGeoff Manley, MD, PhD
Diane Morabito, RN MPHGuy Rosenthal, MDMichele Meeker, RN
Scott Winterstein, PhD
Acknowledgements
UCSF NeuroradiologyPratik
Mukherjee, MD PhDAlisa Gean, MD
Brain Trauma FoundationJam Ghajar, MD PhD
UCSF NeurologyWade Smith, MD,PhD
UCSF Medical InformaticsMarco Sorani
UC Berkeley Computer ScienceStuart RussellNorm Aleks
Intel CorporationDoug BuschKevin Conlon
UC Berkeley Neuroscience InstituteRobert Knight, MD
NIH R01NS050173, CDC R49CE000460, NIH K23NS041240 , NIH U10NS058931,
NIH R43NS056639 , UC Discovery Program, McDonnell-Pew Foundation

Neurocritical CareCopyright © 2007 Humana Press Inc.All rights of any nature whatsoever are reserved.ISSN 1541-6933/06/4:1–9 ISSN 1556-0961 (Online)
*Correspondence and reprint requests to:
Geoffrey T. ManleyUniversity of California, San Francisco1001 Potrero Avenue Room 101San Francisco, CA 94110.
E-mail:[email protected]
Frequent monitoring of physiological vital signs is standard of care in the intensive care unit (ICU). Most patients admitted to an ICU are connected to at least one continuous monitor, such as an electrocardiogram or a pulse oximeter. Blood pressure and tem-perature may be measured intermittently or continuously. Depending on the patient’s
AbstractIntroduction: A fundamental purpose of neurocritical care is the management of secondary brain injury. This is often accomplished by monitoring and managing individual patient parameters including physiological vital signs. Yet, the ability to record physiological data exceeds our ability to fully integrate it into patient care. We propose that advances in monitoring must be accompanied by advances in methods of high-frequency, multivariate data analysis that integrate the multiple processes occurring in critically ill patients.
Methods: We describe initial work in the emerging field of physiological informatics in critical care medicine. We analyzed data on 23 patients with brain injury from our Neurotrauma and Critical Care Database, which contains more than 20 physiological parameters recorded automatically at one-minute intervals via bedside monitors connected to standard personal computers. We performed exploratory data analysis, studied two patient cases in detail, and implemented a data-driven classification approach using hierarchical clustering.
Results: In this study, we present challenges and opportunities for high-frequency multimodal monitoring to quantitatively detect secondary brain insults, and develop clustering methodology to construct multivariate physiological data “profiles” to classify patients for diagnosis and treatment.
Conclusions: Recording of many physiological variables across multiple patients is feasible and can lead to new clinical insights. Computational and analytical methods previously used primarily for basic science may have clinical relevance and can potentially be adapted to provide physicians with improved ability to integrate complex information for decision making in neurocritical care.
Key Words: Traumatic brain injury; intensive care; physiological monitoring; intracranial pressure; hierarchical clustering.
(Neurocrit. Care 2007;06:1–8)
New Approaches to Physiological Informatics in Neurocritical CareMarco D. Sorani,1 J. Claude Hemphill III,2,5 Diane Morabito,3,5 Guy Rosenthal,4,5 and Geoffrey T. Manley4,5,*
1Program in Biological & Medical Informatics, 2Department of Neurology, 3Department of Surgery, and 4Department of Neurosurgery, University of California, San Francisco, 5San Francisco Injury Center
specific diagnosis and severity of injury, additional monitors are placed (e.g., intra-cranial pressure (ICP) monitor, central venous pressure monitor, pulmonary artery catheter, jugular venous oxygen catheter, brain tissue oxygen probe, end-tidal carbon dioxide monitor). This process often results in continuous monitoring of a dozen or more
Original Article

Sorani et al.
Neurocritical Care ♦ Volume 7, 2007
clinical variables, with real-time values displayed on bedside or overhead computer monitors for visualization by nurses and physicians (1–3). However, the ability to acquire this data has outstripped the ability to record, process, and integrate this high volume of information into routine patient care.
Monitoring Meets InformaticsA fundamental purpose of neurocritical care monitoring is
to prevent secondary brain injury by identifying and treating insults such as hypotension, hypoxia, fever, and elevated ICP. Unfortunately, current methods of evaluating the data acquired during monitoring rely on the relatively simplistic identification of events, often indicated by an alarm, when a predetermined threshold is crossed. This approach leaves open many questions. For example, what is hypotension? Is it a single event below some threshold (e.g., mean arterial pres-sure [MAP] < 90 mmHg)? How does one pick the threshold? Additionally, how do clinicians even know that these events have occurred? Even though continuous physiological data is often being generated, this information is almost always recorded intermittently, often hourly, in medical records with no data on duration of events. Typically, this is the only infor-mation available for physician review on rounds. Many re-ports have used relatively gross descriptors such as whether an event occurred, or, at most, how many times it occurred. In contrast, Struchen et al. studied the relationship between out-come and duration of adverse physiological events, defined as variables such as ICP, MAP, and cerebral perfusion pressure (CPP) exceeding certain thresholds, and found that duration of events accounted for a significant portion of the variance in Disability Rating Scale scores (4).
Despite the availability of multimodal monitoring, detec-tion of potential insults is performed by asking separate, uni-variate questions rather than by integrating and interpreting the multivariate patient situation. Routine ICU orders often focus on individual physiological parameters. For example, “Call physician for ICP > 20 mmHg.” Although treatment thresholds, protocols, and management styles may vary among institutions, this general paradigm holds. Adequate management is assumed if individual parameters of interest are maintained between commonly accepted upper and lower thresholds. This univariate approach does not reflect the phys-iological complexity of the patient with severe injury. For example, alteration of respiratory rate may affect multiple parameters such as arterial blood gas values, ICP, and brain tissue oxygenation. Although clinicians are aware of these physiological complexities, which were the impetus for insti-tuting multimodal monitoring, few tools have been developed to electronically store, integrate, and analyze this multidimen-sional information.
Advances in the use of biostatistics and informatics have fundamentally altered the way information is examined in many aspects of medical care and human biology. For exam-ple, the use of multivariable regression techniques to assess the impact of several factors that may jointly influence a parameter of interest such as patient outcome is now standard in epidemiology. The field of human genetics has also been revolutionized by advances in informatics. In fact, one of the necessary aspects of the Human Genome Project has been the development of new bioinformatics approaches that allow
the study of the complex interactions of multiple genes. Wecan now analyze microarray data by using methods such as hierarchical clustering to identify patterns relevant to molecu-lar biology. More broadly, however, bioinformatics (including buzzwords like pattern analysis and data mining) can be thought of as a set of computational and quantitative methods that are applicable not only to basic science but also to physio-logical data analysis and to clinical decision making. Significant amounts of multivariate data are now being generated in the ICU, and computer algorithms are increasingly being adapted to provide clinicians with capabilities to predict, diagnose, and treat (5,6). We expect that in neurocritical care, just as in epide-miology and human genetics, the interaction of multiple parameters is more relevant than any individual factor. Wesuspect that the reason this has not been explored more exten-sively is because the analytical tools for studying complex physiological interactions have not been available.
This manuscript develops the idea that advances in neuro-critical care monitoring must be accompanied by advances in methods of analyzing the data being captured. Furthermore, these new methods must take into account the complex in-teraction of multiple processes occurring in the critically ill patient rather than viewing them as mutually exclusive. Our aims were (1) to present challenges and opportunities for high-frequency multimodal monitoring to quantitatively detect secondary brain insults, and (2) to develop clustering methodology to construct multivariate physiological data “profiles” to classify patients for diagnosis and treatment.
A Multivariate Approach to Continuous Data Analysis
San Francisco General Hospital (SFGH) is an acute care hospital operated by the City and County of San Francisco. The SFGH Neurotrauma and Critical Care Database contains physiological and nursing care data as well as demographic information. The main hardware components of the system are bedside monitors connected to a standard personal com-puter via serial cables. Such a system is not entirely unique. Goldstein et al. described a real-time, continuous physiologi-cal data acquisition system for a 16-bed ICU for the study of parametric and waveform data (7). We capture over 20 physi-ological variables (Table 1), plus date, time, and optional com-ments. Data is collected automatically at 1-minute intervals and is output into text files. In addition to reliable data cap-ture, however, we also place an emphasis on multivariate data analysis. Quantitative analysis can be used to answer ques-tions related to measurement, classification, or prediction for diagnosis and treatment. The choice of analytical methods depends on the type of question. For example, descriptive statistics can measure variables and help to frame biomedical questions, whereas clustering can be used for classification. During this study, caregivers did not have access to the analy-ses or the full data set we describe.
We performed exploratory analysis retrospectively on a sample high-frequency data set from patients with traumatic brain injury (TBI) to visualize and describe the large amounts of physiological data generated in the ICU. Data analysis was performed using SPSS v13 (SPSS Inc., Chicago, IL). We used descriptive statistics to determine ranges and distributions of the physiological variables in Table 1. Data was collected from

New Approaches to Phsyiological Informatics
Neurocritical Care ♦ Volume 7, 2007
23 patients every minute for a median of 7 days (mean ± s.d.: 5.7 ± 2.3). The median duration of observation per patient was 8453 minutes (8518 ± 7554). Collection was performed using Viridia bedside monitors (Philips), Licox tissue oxygen moni-tors (Integra NeuroSciences), and Draeger ventilators and required no intervention outside of standard clinical care. Monitoring data was integrated by a middleware software backbone (Aristein Bioinformatics). Not all patients admitted with TBI met our monitoring protocol. Those that did were continuously monitored only if a bed with the appropriate monitoring infrastructure was available. An additional design constraint that reduced our patient sample was the desire to continuously monitor patients for 1 week rather than to trun-cate their monitoring period simply to connect the next patient. Collected data included occasional spurious or missing values caused by system problems, cable disconnection, or other technical issues. To address this issue, we constructed 23 patient files with raw data and cleaned them according to simple rules: we did not delete outliers, but data such as heart rate equal to zero and unrealistically high ICP were ignored during analysis.
The concept of multivariate data classification involves using quantitative algorithms to separate subjects into two or more categories according to their features. Clustering can be used to divide data into a hierarchy. The traditional represen-tation of this hierarchy is a tree, with a single cluster contain-ing every subject at the beginning and individual subjects arranged in groups at the end (Figure 1). In contrast to a more knowledge-based approach like an expert system, hierarchical clustering is primarily data-driven. Advantages of knowledge-based approaches include the benefits of clinical intuition, whereas advantages of data-driven approaches include the unbiased discovery of unexpected relationships. The variables used in the cluster analysis were chosen based on the current
monitoring capabilities in our ICU, the variables that we believed a priori might be important, and the variables for which sufficient data was captured. We used median values of physiological parameters for each patient from their entire ICU stay based on measures acquired every minute. Using Cluster v2.11, we log-transformed our physiological data, centered the data set around patient and variable medians, and normalized values. Data was then clustered using average linkage hierarchical clustering. The ICU physiological data was arranged into a two-dimensional grid with similar patients and correlated variables next to each other (8) by creating a “heat map” and cluster tree (Figure 2) using TreeView v1.6 (Cluster and TreeView can be found at http://rana.lbl.gov/EisenSoftware.htm). Such a heat map is more commonly used to display gene expression data. Whereas gene expres-sion heat maps display up- or down-regulation of many genes across many samples (tissues, patients) or time periods, we are displaying high or low values of many physiological measures across many patients. The clusters represent correlations between subjects. Red areas indicate high values whereas green areas indicate low values. The heat map is a compact, intuitive way to visualize a moderately large data set (18 vari-ables across, 23 patients down). We described the patient clus-ters according to clinical measures such as Glasgow Coma Score (GCS) and Injury Severity Score (ISS) which were re-corded once per patient.
Exploratory AnalysisWe first performed exploratory analysis on the data set. We
captured heart rate, CPP, arterial blood pressure (ABP) values, and ICP for all patients (Table 2). We also captured brain tissue oxygen tension (PbrO2), brain temperature, and respiratory parameters (plateau pressure, tidal volume, minute ventila-tion, and respiratory rate) for nearly all (78–91%) patients.
Table 1 Physiological Variables Included in the SFGH Neurotrauma and Critical Care Database
Monitored physiological parameters
Source Variable Definition
Viridia bedside monitor MAP mean arterial blood pressureABP – systolic systolic arterial blood pressureABP – diastolic diastolic arterial blood pressureICP intracranial pressureETCO2 end tidal CO2
SvO2 oxygen saturation of venous blood from brainHR heart rateCPP cerebral perfusion pressureSpO2 oxygen saturation in capillariesCore Temp body temperature
Licox tissue oxygen monitor PBrO2 brain tissue oxygenBrain Temp brain tissue temperature
Draeger ventilator Plateau pressure pressure applied to small airways and alveoliPEEP breathing pressure positive pressure applied at the end of expirationPeak breathing pressure pressure measured by ventilator in major airwaysTidal volume lung volume during normal breathSpontaneous minute volume tidal volume x respiratory rate - (patient breathing)Minute ventilation tidal volume x respiratory rate - (ventilator)Respiratory rate respiratory rate
Inspired O2 fraction of inspired oxygen

Sorani et al.
Neurocritical Care ♦ Volume 7, 2007
Median values within each patient time course were computed for all variables. Heart rate medians generally ranged between 60 and 110 beats per minute across patients, CPP ranged be-
tween 70 and 100 mmHg, MAP ranged between 80 and 110 mmHg, and ICP ranged between 5 and 15 mmHg with some high outliers (Figure 3). Of the variables with incomplete col-lection, PbrO2 ranged between 10 and 60 mmHg with somehigh outliers, plateau pressure ranged between 10 and 30mmHg, tidal volume ranged between 0.5 and 0.75 L, minuteventilation ranged between 7 and 15 L per minute with somehigh outliers, and respiratory rate ranged between 10 and 30breaths per minute with some high outliers. We also computedmeans, standard deviations, and estimates of distribution sym-metry such as skew and kurtosis. These physiological dataranges can be helpful in determining “typical” and “crisis” pe-riods in the patient with severe injury. We found that other vari-ables were not as informative for analysis because values werebasically constant. For example, peak end expiratory pressure(PEEP) was typically 5 cm H2O, fraction of inspired oxygen wastypically 0.4, and SpO2 was almost always 100%. We also saw,as expected, that respiratory variables were correlated witheach other as were hemodynamic variables (data not shown).
The potential benefits of applying informatics to exploratory analysis of continuous, high-frequency physiological ICU data are illustrated by two patient cases. Patient A was a 40-year-old man who suffered a head injury after a fall from a ladder. On arrival, his GCS was 7, and he had one nonreactive pupil. Visual inspection of the patient’s entire ICP time course (Figure 4A) indicates that ICP was usually less than 20 mmHg despite a
Fig. 1. A schematic example of classification, where an initial group of disparate subjects is divided into smaller groups of more similar subjects.
Fig. 2. Heat map of physiological variables.The heat map is labeled with the hierarchical cluster tree of variables and the three groups of patients, named A, B, and C.

New Approaches to Phsyiological Informatics
Neurocritical Care ♦ Volume 7, 2007
period of raised ICP on day 4 (approximately 3500–4100 min-utes) and increased ICP volatility on day 6 (beginning at ap-proximately 6000 minutes; Figure 4B). Nursing documentation shows that on day 4 in the mid-morning, cerebrospinal fluid (CSF) was being drained at least four times per hour. Thus, nursing documentation in conjunction with high-resolution physiological data is critical to explain this patient’s physiolog-ical course. This patient’s ICP was greater than 20 mmHg for only 5.4% of the total monitoring time. Such measurement demonstrates how continuous data can be used beyond sum-mary data to determine the dose (i.e., degree, duration, and fre-quency) of events likely to contribute to the severity of second-ary brain injury. Patient A was in the ICU for 18 days and was discharged to a rehabilitation facility with a Glasgow Outcome Score Extended (GOS-E) of 4 (upper severe disability).
Patient B was a 47-year-old male injured in an industrial ac-cident. His GCS was 9, and he was intubated on arrival. As seen by the total ICP time course for this patient (Figure 4C), ICP over the first 6000 minutes (100 hours) of observation was frequently near or greater than 20 mmHg (15.4 ± 7.2 mmHg). There followed a period (approximately 1500 minutes in dura-tion) during which ICP fell to 11.5 ± 7.9 mmHg. This was fol-
lowed by another period (approximately 200 minutes; Figure 4D) during which ICP rose to 23.0 ± 8.3 mmHg. During this period, even though the variance was “typical” for this patient, sharp ICP spikes could be observed, and ICP was generally greater than in the “volatile” period for Patient A (Figure 4B). It is noteworthy that hourly recording of ICP values in the bed-side nursing chart (as is often done in routine care) would un-derestimate the true ICP during this time period. To illustrate, the ICP values for 3 consecutive hours during this period were 20, 17, and 17 mmHg, which would suggest to a physician re-viewing this chart on rounds that the patient’s ICP was within an acceptable range. However, such hourly measurements do not reflect the many ICP readings greater than 20 mmHg and several readings greater than 30 mmHg. In the final period of observation of approximately 3000 minutes, ICP fell slightly–and this time showed far less variability–to 18.6 ± 3.7 mmHg. Ultimately, he required a hemicraniectomy and right frontal lobectomy. This patient’s ICP was greater than 20 mmHg for 24.7% of the monitoring time, nearly five times the amount for Patient A. This type of data integration over time indicates the severity of his patient’s injury and would suggest a commen-surate treatment response. Patient B was in the ICU for 19 days, and his total hospital length of stay was 31 days. He was discharged to rehab with a GOS-E of 2 (vegetative).
Classification AnalysisUsing hierarchical clustering, the 23 patients were assigned
to three groups. The seven patients in Group A include those whose respiratory and blood pressure values were lowest (Figure 2) and those with the worst outcomes. Specifically, only three patients in the total sample of 23 died, but twoof them were in Group A; two patients in the total samplewere vegetative, and both were in Group A. As such, ourapproach potentially appears to be predictive of outcome based on clustering of physiological data. Group A included the youngest patients (average age, 34.3 ± 14.4) with the lowest average arrival GCS motor score (3.6 ± 1.9) and average ISS (21.9 ± 6.6) (9). The 10 patients in Group B included those with
Table 2 Table of Ranges in Values of 14 Variables of Interest for 23 Patients
Ranges of selected physiological parameters
10th pctile 10th pctile Median Median 90th pctile 90th pctile
Low High Low High Low High
MAP (mmHg) 70 97 82 111 96 129ABP – systolic (mmHg) 105 158 127 177 144 201ABP – diastolic (mmHg) 53 76 64 86 75 104ICP (mmHg) 1 11 4 17 9 24Heart rate (beats/minute) 41 82 59 112 65 131CPP (mmHg) 62 84 66 99 85 115PBrO2 (mmHg) 6.7 35.1 8.8 59.45 23.4 100Brain temp (°C) 31.2 38.2 31.8 38.6 32.5 39.4Core temp (°C) 34.2 37.6 35.8 38.2 36.7 39.3Plateau pressure (mmHg) 9 23 11 30 15 42Peak breathing pressure (mmHg) 11 36 11 44 16 47Tidal volume (L) 0.16 0.71 0.5 0.76 0.53 0.84Minute ventilation (L/minute) 6.3 10.7 7.3 15.7 8.7 20.9Respiratory rate (breaths/minute) 10 17 12 31 13 34
Fig. 3. The range of ICP values observed within and across 22 patients. Patient 13 is not included because of technical issues with ICP monitoring.

Sorani et al.
Neurocritical Care ♦ Volume 7, 2007
higher blood pressure and CPP and were, on average, the oldest (44.3 ± 17.0) and had the highest ISS (30.3 ± 11.3). The six patients in Group C had the highest average arrival motor score (5.2 ± 1.3) and the highest values for respiratory rate, pla-teau pressure, and peak breathing pressure.
These patient profiles are complex, and to our knowledge,this is the first effort to fully integrate a multivariate data setto construct patient profiles that could ultimately be used in di-agnosis and treatment. The division of patients into threegroups is not definitive; with more physiological or demo-graphic data, the patients could be divided into more, smaller,and perhaps even different groups. However, the three groupswe describe are robust for this physiological data set insofar asthey are quantitatively validated by independent, demographicand clinical data. Cluster analysis demonstrates that even pa-tients that are similar in many respects (treatment protocols,etc.) are different in other ways, and it is this insight that we arelooking for. By its nature, the execution of a clustering algo-rithm will always produce one or more clusters. However, from
the tree of physiological variables, several clusters emerge asexpected (based on known physiological relationships), andserve as internal controls: for example, systolic blood pressure,diastolic blood pressure, and MAP values cluster together(Figure 2). PbrO2 and end-tidal CO2 (ETCO2) also cluster, consis-tent with the known relationship between CO2, cerebral bloodflow, and PbrO2. Because clustering physiological data is a newapproach, the high degree of correlation where it is expectedrepresents validation of the methodology. Analysis of a morerestricted set of noninterrelated variables would risk missingunexpected relationships. In fact, other clusters emerge that areunanticipated. For example, in this dataset ICP clusters with in-spired oxygen. Upon review of the physiological data and nurs-ing documentation, we noticed instances in which ICP spikedwhen inspired oxygen was raised to 100% while the patientwas being suctioned. This has led to modification of our clinicalpractice during suctioning. The clustering of core temperaturewith SpO2 and heart rate with PEEP may not be informative,because SpO2 and PEEP were both essentially constant.
Fig. 4. Multiple ICP time series scatterplots for two patients. (A) ICP time course over the entire monitoring period for Patient A indicates some high outliers, with a period of raised ICP on day 4 (at approximately 3500 minutes). ICP is usually below the 20 mmHg reference line.The narrow dashed line box from 6300 to 6500 minutes indicates the period expanded in panel B. (B) Slightly increased ICP volatility on day 6 (at approximately 6300 minutes).This graph depicts the potential effect on interpretation when continuous data is only recorded at hourly intervals. Increased ICP volatility might not have been noticed had ICP values only been recorded hourly. (C) ICP time course for Patient B.The dashed box from 8000 to 8200 minutes indicates the period expanded in panel D. (D) A period of 200 minutes during which ICP was 15 ± 6 mmHg. Even though the variance was “typical” for this patient, sharp ICP spikes could be observed, and ICP was generally greater than in Patient A’s “volatile.”

New Approaches to Phsyiological Informatics
Neurocritical Care ♦ Volume 7, 2007
The heat map is a quantitative, high-throughput, and visu-ally intuitive way to group patients and possibly associate them with diagnoses or treatment strategies. This approach has potential clinical significance in the possibility of identify-ing new patients who, based on multiple characteristics, are at risk to experience complications or worsened outcome. In this manner, ongoing refinement of physiological profiles could be used to target specific treatments. Future studies will be needed on larger patient samples to determine statistical sig-nificance and potential for translation to the bedside.
The State of the Art and Future DirectionsOur aims were (1) to present challenges and opportunities
for high-frequency multimodal monitoring to quantitatively detect secondary brain insults, and (2) to develop clustering methodology to construct multivariate physiological data “profiles” to classify patients for diagnosis and treatment. Wefirst presented issues of continuous data summarization, visu-alization, and integration with nursing documentation. Wethen presented the first application of hierarchical clustering to construct physiological data profiles for patient classifica-tion, diagnosis, and treatment. These initial efforts are among the first to begin to integrate multivariate, continuous data analysis into acute care, and they elucidate the complexities of ICU informatics, from reliable data capture to useful interpre-tation. Future hypothesis-driven, prospective approaches must address quantitative and clinical issues together, not independently, to answer questions about clinical care that is optimized for individual patients.
Prior studies have employed exploratory data analysis in neurocritical care. Jones et al. examined time series MAP, ICP, and CPP data and related their variability to outcome. Their data were displayed on polygraphs, and patterns were de-scribed to help interpret the data produced at the bedside (10).In other studies, Cifu et al. have used various statistical meth-ods to study post-acute functional outcome after brain injury (11–14). Worldwide, several groups have developed free, gen-eralizable software resources to enable more powerful analy-sis specifically tailored to physiological data. These include PhysioToolkit from the National Institutes of Health (NIH) National Center for Research Resources, Scilab from the French Institut National de Recherche en Informatique et en Automatique, TISEAN from the Max Planck Institut in Germany, ICM+ from the University of Cambridge, and HRV Analysis from the University of Kuopio in Finland.
Classification methods have seen limited use in the ICU but could potentially be applied to a wide variety of problems. For example, Stuss et al. evaluated the ability of measures of initial injury severity, tests of attention, and demographic characteris-tics to predict recovery of memory in patients with TBI using classification and decision tree analysis. They identified four groups of patients and concluded that approaches that take into account multiple measures provide a more sensitive pre-dictive index (15). Similarly, Andrews et al. compared results of logistic regression with those of tree analysis of a head-injury data set including a range of secondary insults and 12-month outcomes. They found, perhaps not surprisingly, that tree anal-ysis confirmed some regression results and challenged others (16). Other groups have conducted similar studies (17–20).
Potential downsides exist to pursuing more complete data acquisition and processing; among them, the difficulty in in-terpreting the vast amount of data that is acquired. With all the parameters continuously collected and the issues that occur in an ICU that may corrupt information (e.g., transducers being zeroed, ventriculostomies being opened for drainage, patients being turned, monitor disconnections for transport to imaging studies and procedures), there is great potential for data over-load and false information. Thus, fundamental goals of any physiological informatics approach must be to ensure reliabil-ity of the data, avoid collecting and processing large volumes of “meaningless” data, and establish relationships between physiological data and clinical events. All this must be done with output that is user-friendly and enhances the ability of the clinician to care for patients, rather than detracts from patient care. This is not a task for clinicians alone. At our institution, we have developed a collaboration between our clinicians, bioinformaticians, and computer scientists with the goal of addressing these complex and novel issues.
Neurotrauma physicians have been caring for critically in-jured patients for decades. We recognize the value of clinical ex-pertise. Yet it is often difficult to formalize how this expertise isgained, other than through “experience.” As critical care infor-matics evolves, it is important to determine if it aids decisionmaking regardless of the level of practitioner experience, stan-dardizes care, serves as a training resource for junior clinicians,or provides better information access even without making spe-cific recommendations. These are controversial areas. We haveshown that Q1 minute data capture of many variables acrossmany patients is feasible and can potentially lead to new clini-cal insights. Data visualization and use of descriptive statisticsare good first steps in physiological data analysis. However,visualization of large time spans of data for even moderatenumbers of concurrent variables often becomes overwhelming,even after normalization, so computational methods such ashierarchical clustering can be useful for patient classification.
The potential benefits of neurocritical care informatics are alluring because improvements to the nature and timing of interventions could reduce secondary injury, long-term dis-ability, and death. The lessons of epidemiology and human genetics indicate that powerful statistical and informatics tools can significantly extend knowledge in those fields. Webelieve that the future of neurocritical care lies not just in de-veloping new monitors, but in the ability to more fully under-stand the information that we already have.
AcknowledgmentsWe thank the nurses, respiratory therapists, physicians, and
administrators at San Francisco General Hospital for assis-tance with the critical care informatics project. This work was supported by NIH grants 5F31NS049691(MDS), NS050173 (GTM), and the UCSF Brain and Spinal Injury Center.
References1. Czosnyka M, Pickard JD. Monitoring and interpretation of
in tracranial pressure. J Neurol Neurosurg Psychiatry 2004;75: 813–821.
2. Kett-White R, Hutchinson PJ, Czosnyka M, Boniface S, Pickard JD, Kirkpatrick PJ. Multi-modal monitoring of acute brain injury. Adv Tech Stand Neurosurg 2002;27:87–134.

Sorani et al.
Neurocritical Care ♦ Volume , 2007
3. Czosnyka M, Whitehouse H, Smielewski P, Kirkpatrick P, Guazzo EP, Pickard JD. Computer supported multimodal bed-side moni-toring for neuro intensive care. Int J Clin Monit Comput 1994;11:223–232.
4. Struchen MA, Hannay HJ, Contant CF, Robertson CS. The rela-tion between acute physiological variables and outcome on the Glasgow Outcome Scale and Disability Rating Scale following severe traumatic brain injury. J Neurotrauma 2001;18:115–125.
5. Kapetanovic IM, Rosenfeld S. Overview of commonly used bio-informatics methods and their applications. Ann N Y Acad Sci 2004;1020:10–21.
6. Kim JH. Bioinformatics and genomic medicine. Genet Med 2002;4(6 Suppl):62S–65S.
7. Goldstein B, McNames J, McDonald BA, et al. Physiologic data acquisition system and database for the study of disease dynamics in the intensive care unit. Crit Care Med 2003;31:433–441.
8. Nelson DW, Bellander BM, Maccallum RM, et al. Cerebral microdialysis of patients with severe traumatic brain injury exhibits highly individualistic patterns as visualized by cluster analysis with self-organizing maps. Crit Care Med 2004;32:2428–2436.
9. Baker SP, O‘Neill B, Haddon W Jr, Long WB. The injury severity score: a method for describing patients with multiple injuries and evaluating emergency care. J Trauma 1974;14:187–196.
10. Jones PA, Minns RA, Lo TY, Andrews PJ, Taylor GS, Ali S. Graph-ical display of variability and inter-relationships of pressure sig-nals in children with traumatic brain injury. Physiol Meas 2003;24:201–211.
11. Marwitz JH, Cifu DX, Englander J, High WM Jr. A multi-center analysis of rehospitalizations five years after brain injury. J Head Trauma Rehabil 2001;16:307–317.
12. Burnett DM, Silver TM, Kolakowsky-Hayner SA, Cifu DX. Func-tional outcome for African Americans and Hispanics treated at a traumatic brain injury model systems centre. Brain Inj 2000;14:713–718.
13. Cifu DX, Keyser-Marcus L, Lopez E, et al. Acute predictors of successful return to work 1 year after traumatic brain injury: a multicenter analysis. Arch Phys Med Rehabil 1997;78:125–131.
14. Cifu DX, Kreutzer JS, Marwitz JH, Rosenthal M, Englander J, High W. Functional outcomes of older adults with traumatic brain injury: a prospective, multicenter analysis. Arch Phys Med Rehabil 1996;77:883–888.
15. Stuss DT, Binns MA, Carruth FG, et al. Prediction of recovery of continuous memory after traumatic brain injury. Neurology 2000;54:1337–1344.
16. Andrews PJ, Sleeman DH, Statham PF, et al. Predicting recovery in patients suffering from traumatic brain injury by using admis-sion variables and physiological data: a comparison between decision tree analysis and logistic regression. J Neurosurg 2002;97:326–336.
17. Temkin NR, Holubkov R, Machamer JE, Winn HR, Dikmen SS.Classification and regression trees (CART) for prediction of func-tion at 1 year following head trauma. J Neurosurg 1995;82:764–771.
18. Kentala E, Viikki K, Pyykko I, Juhola M. Production of diagnostic rules from a neurotologic database with decision trees. Ann Otol Rhinol Laryngol 2000;109:170–176.
19. Herskovits EH, Gerring JP. Application of a data-mining method based on Bayesian networks to lesion-deficit analysis. Neuroim-age 2003;19:1664–1673.
20. Salvador R, Suckling J, Coleman MR, Pickard JD, Menon D, Bullmore E. Neurophysiological architecture of functional magnetic resonance images of human brain. Cereb Cortex 2005;15:1332–1342.
7