the future of pediatrics in oregon – the role of the pediatric academic health center (ahc) h....
TRANSCRIPT

The Future of Pediatrics in Oregon – the Role of the Pediatric Academic Health Center (AHC)
H. Stacy Nicholson, MD, MPHChair, Department of PediatricsPhysician-in-Chief,
Doernbecher Children’s Hospital
10/16/2010

Disclosure
• No ties to Industry• 5K12 HD 057588 (Child Health Research
Center) PI: Nicholson

Pediatric Chair’s View of Reality
Chevalier, J Pediatr 151:557-558, 2007

Faculty Member’s View
Chevalier, J Pediatr 151:557-558, 2007

Academics – Then vs. Now1970s – 1980s
• “profess”or• “teaching rounds” 3
times per week• Residents and students
were the primary physicians
• Limited supervision• Solid state funding
Today• Clinical FTE defined by
subtraction• ↑ Productivity
demands– wRVU / CFTE– Research funding
• ↑ supervision• ↑ direct care by faculty• ↓ state funding

$132,519$123,553
$107,600 $107,897 $111,897
$95,978$85,779
$73,337$82,234
$73,311
-
50,000
100,000
150,000
200,000
91-93 93-95 95-97 97-99 99-01 01-03 03-05 05-07 07-09 09-11
State Appropriation (in Thousands)
$209,531
Represents the value of 91-93 State Appropriation stated in current dollars
OHSU State Funding: 1991 - 2011

Academic Pediatrics in USA – Issues• ↑ part-time faculty
• ↑ Pressure for Increased Productivity– Tied to compensation
• Mission Competition: Care, teaching, research• Financial
– ↓ state funding– ↓endowments
• Resident Duty Hours / R3P– ↑ clinical work by faculty– Changing composition of ‘teams’– ↑ ‘flexibility’– ↓ hours (Pl1s limited to 16 hours in FY12)

Academic Pediatrics in USA
• Issues (cont’d)– Workforce
• Shortage of subspecialists• Maldistribution of Providers – rural vs. urban
– Reimbursement• Pediatric reimbursement lower than for adult
– Medicaid reimbursement below Medicare
• ‘Cognitive’ specialties have lower reimbursement• Universal Coverage / Health Care Reform
– Medical Home

Decreased Funding for Ped Research
• Pediatric Research funded by NIH– 1994 14.1%– 2000 12.6%– 2005 11.3%
• Pediatric Research in top science journals (Science, Nature, PNAS, J Clin Invest, NEJM)– Declined by 35% from 2000 to 2006
• Children are 25% of the US population

Academic Pediatrics in Oregon• OHSU is Oregon’s Academic Health Center (AHC)
– ‘top 20’ medical school• Very Competitive Environment in Pediatrics
– 4 health systems compete in metro PDX• Competition can make you stronger (+)• Fragmentation of Care (-)• Potential negative impact on recruitment (-)• Potential negative impact on payment from insurers (-)
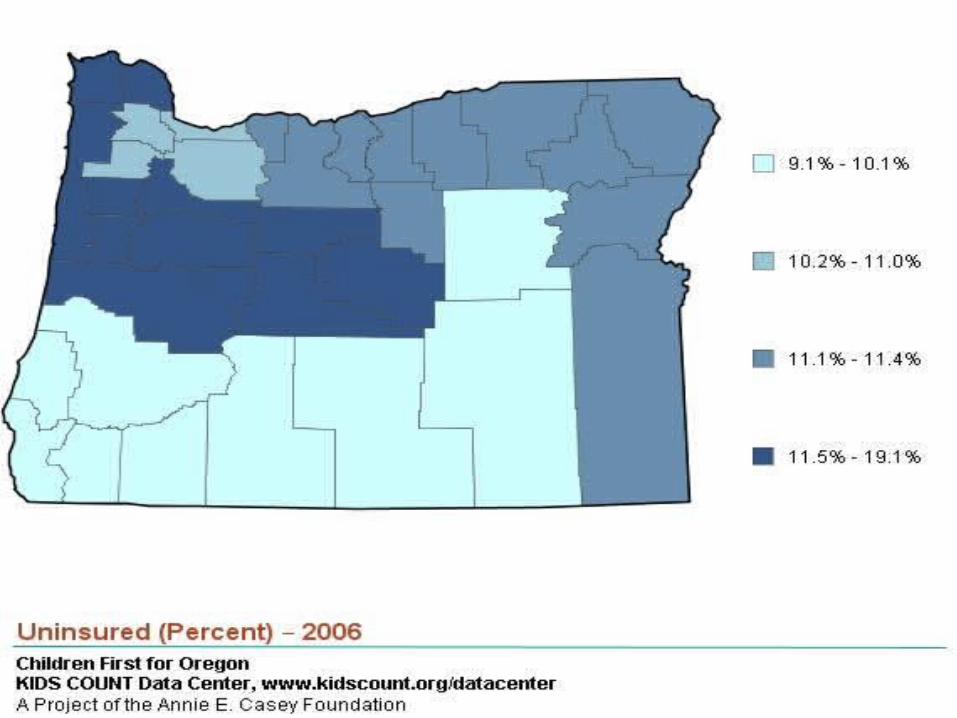
• Urban vs. Rural– Distance to subspecialty pediatrics a barrier to access

OHSU – YOUR ACADEMIC HEALTH CENTER
Focusing on DCH and the Department of Pediatrics

Patient Care:
We will be the pediatric and adolescent healthcare provider of choice for our
region.
To enhance the health and well-being of children and adolescents by ensuring
excellence in patient care, education, research, and
advocacy.
Department of Pediatrics: ‘07 Strategic Plan
Education:
We will be a leader for excellence in education, the cornerstone of our
patient care, research, and advocacy efforts.
Research:
We will be a leading center for child health research, encompassing basic,
clinical, translational, and health services research programs.
Advocacy:
We will be a strong voice for the health and welfare of children.
VISION:
1) Build a sustainable educational environment that attracts top candidates, cultivates knowledge, and achieves superior outcomes.
4) Develop, recruit, and retain the best faculty and staff.
2) Grow focused areas of research excellence, building upon existing research strengths in the Department and at OHSU.
3) Enhance healthcare access and improve service to patients and referring providers.
5) Solidify the financial position of the Department.
6) Develop partnerships with the community to further our education, research, and patient care missions.
7) Reduce health care inequities among children and adolescents in our region.
GOALS:
MISSION:
VALUES:
Respect & Integrity CompassionInnovation &
DiscoveryPatient & Family
CenteredAccountability & Transparency
Collaboration

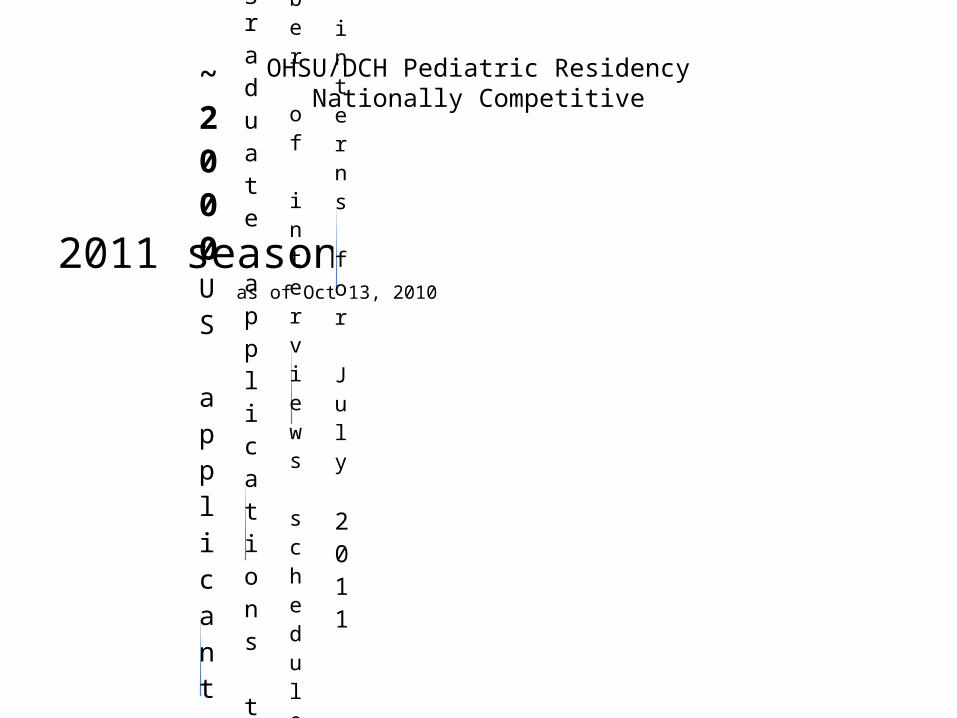
OHSU/DCH Pediatric ResidencyNationally Competitive
2011 season as of Oct 13, 2010
>13New interns for July 2011
180 Number of interviews scheduled at OHSU
631Number of US graduate applications to OHSU Pediatric residency
~2000US applicants to pediatrics

DCH Residents are Great on Day 1
• Current intern class (class of 2013)– Average USMLE step 1 score = 225
• Average all peds applicants = 219• Minimum pass = 188
– Average USMLE step 2 score = 237• Average all peds applicants = 229• Minimum pass = 184
– % AOA = 23 %• All peds applicants % = 12%

ABP Pediatric Training Program Pass Rates
DCH Graduates are Great on Day 1
• American Board of Pediatrics Certification Exam– Last 2 years pass rate = 100%– Overall pass rate (2007-2009) = 98%– Of 189 programs, the number of programs with
better pass rate than OHSU= 1• Mass General = 100% pass rate (94% of eligible took exam)• Mayo Clinic = 98% pass rate (100% of eligible took exam)

Changing Career Choices by Grads
OHSU/DCH Pediatric ResidencyNationally Competitive
2011 season as of Oct 13, 2010
??New interns for July 2011
180 Number of interviews scheduled at OHSU
631Number of US graduate applications to OHSU Pediatric residency
~2000US applicants to pediatrics

Department of Pediatrics Research Awards & Indirect Costs: Past 7 Years
FY04 FY05 FY06 FY07 FY08 FY09 FY10*0
2,000,000
4,000,000
6,000,000
8,000,000
10,000,000
12,000,000
14,000,000
16,000,000
18,000,000
0
500,000
1,000,000
1,500,000
2,000,000
2,500,000
3,000,000
3,500,000
Dept of Pediatrics - Overall Research Productivity - Awards Received vs Budgeted IDC
Total Awards - Direct + IDCBudgeted IDC
Aw
ards
Rec
eive
d ($
)
IDC
($)
*NOTE: FY10 Data is Estimated thru the end of the Fiscal Year

OREGON – A FEW REMARKS ABOUT CHILD HEALTH

Healthy Kids (OR)
• Insurance tax (1%): $105M over 2 years• $240M in matching federal funds
– 80,000 uninsured kids to get coverage by 6/11• Hospital tax (up to 5.5%):
– 35,000 uninsured adults to get coverage• OR – 1 of 12 states to guarantee universal
coverage for kids– But…………. Coverage does not equal access.
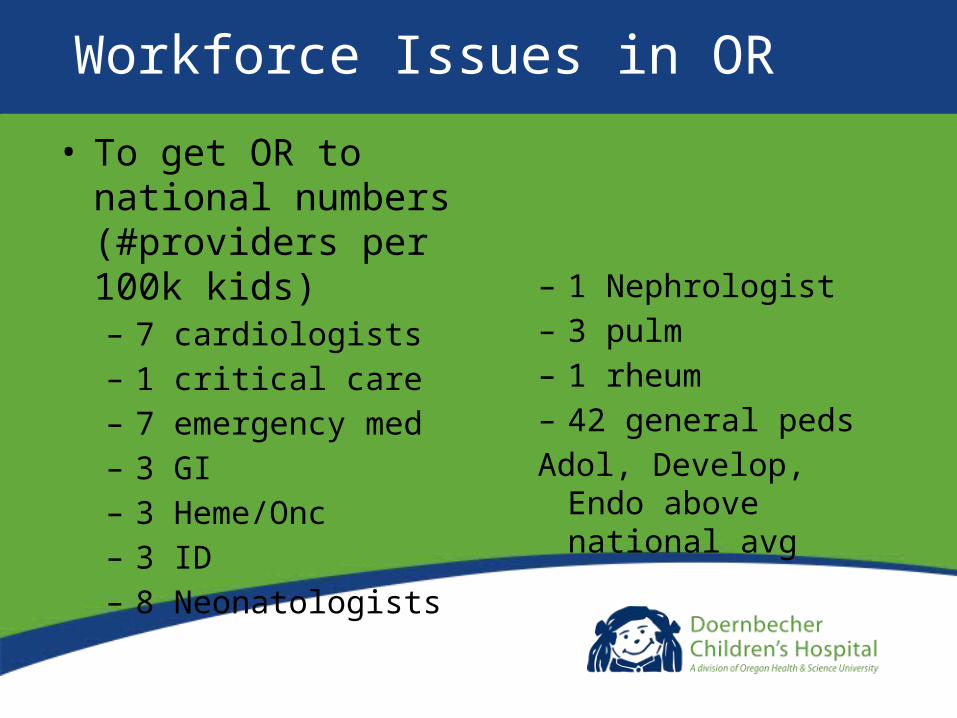
Workforce Issues in OR
• To get OR to national numbers (#providers per 100k kids)– 7 cardiologists– 1 critical care– 7 emergency med– 3 GI– 3 Heme/Onc– 3 ID– 8 Neonatologists
– 1 Nephrologist– 3 pulm– 1 rheum– 42 general pedsAdol, Develop, Endo above
national avg

Impact of Recent Depression on OR Families & Children
Jan-Jun ‘08 Jul-Dec ‘08 Jan-Jun ‘09 Jul-Dec ‘09 Jan-Jun ‘10
Metro PDX 11,621 11,268 11,181 11,138 10,102
Oregon 24,991 24,505 23,892 23,783 21,907
Lower Birth Rates
Persistent High UnemploymentJuly, 2009 July, 2010 Change
USA 9.4% 9.5% + 0.1%
Oregon 11.4% 10.6% - 0.8%
Washington 9.2% 8.9% - 0.3%

20002002
20042006
2008
0
5
10
15
20
25
OregonWashington
OVERALL RANKINGS OVER TIME
Source: 2010 Annie E. Casey Foundation Kids Count Data Book
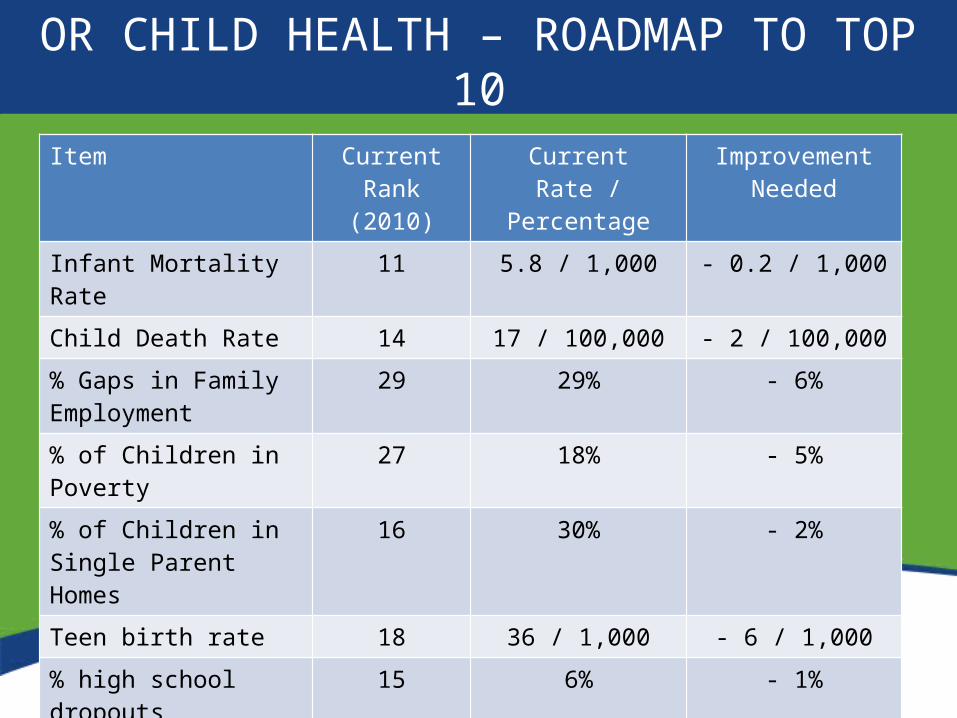
OR CHILD HEALTH – ROADMAP TO TOP 10Item Current Rank
(2010)Current Rate /
PercentageImprovement
NeededInfant Mortality Rate 11 5.8 / 1,000 - 0.2 / 1,000
Child Death Rate 14 17 / 100,000 - 2 / 100,000
% Gaps in Family Employment
29 29% - 6%
% of Children in Poverty 27 18% - 5%
% of Children in Single Parent Homes
16 30% - 2%
Teen birth rate 18 36 / 1,000 - 6 / 1,000
% high school dropouts 15 6% - 1%
% dropouts not employed 34 9% - 3%

Rate of Return to Investment in Human Capital
High Gains
Low Gains
0Age
JJ Heckman, 2000
High Gains
Low Gains
Age
JJ Heckman, 2000

HEALTH CARE REFORM

Real Health Care Reform• Providers work at the top of their license / training
– Primary care / prevention work will be increasingly done by non-MDs– PCPs will see sicker kids and take on more routine subspecialty care
(CSHCN, Chronic disease, etc.)– Subspecialists
• Work more closely with PCPs• Only see the most complicated patients / provide treatment
• Patients & Families – the most underutilized resource in healthcare– Electronic data will enable clinical decisions
• Systems and Networks will replace older business models• Roadmap from here to there?
Christensen, Clayton, The Innovator’s Prescription, 2009

Concluding Remarks
• Oregon – the Goldilocks State– ~ 4 million people– ~ 1 million kids– Significant barriers to care access
• SES – rural & frontier populations• Geographic
• We can show the USA how to take better care of kids– By working together in care delivery– By working together in advocacy

The Future of Pediatrics in Oregon – the Role of the Pediatric Academic Health Center (AHC)
H. Stacy Nicholson, MD, MPHChair, Department of PediatricsPhysician-in-Chief,
Doernbecher Children’s Hospital
10/16/2010