the future role of middle leaders in secondary schools - … leaders in secondary schools.pdf · a...
TRANSCRIPT

© National College for School Leadership 2003 1
��`
The future role of middle leaders in secondary schools
A survey of middle leaders in secondary schools in England Christine Wise and Nigel Bennett, Centre for Educational Policy and Management, Open University
Contents Organisation of the report 2 Elaboration of the key issues for study 2 Details of the survey and methods 2 Returns 3 The middle leader post 6 The individual and their career 19 Influences over decisions 22 Expectations of the role 25 Priorities of the middle leaders 35 Concluding comments 40 References 43
© National College for School Leadership 2003 2
Organisation of the report The report will begin by looking at the context for the survey and then the methodological issues. This will be followed by a consideration of the returns and their potential impact on the validity of the outcomes. The report will then loosely follow the pattern of the questionnaire looking first at the middle leader post and its context within the school, the middle leader and their career, the influences that affect their decision-making, the expectations of their role and their priorities before finishing with some concluding remarks. Throughout the report there are no statistics used beyond simple descriptive statistics. This has been done to aid the reading of the report. More analytical statistics have been added in Appendix 2 for those that wish to consider them.
Elaboration of the key issues for study The survey was completed by postal questionnaire and was intended to gather information on how middle leaders of academic, cross-curricular and pastoral areas in secondary schools in England perceive their role. It is seven years since similar data were collected and since then much has changed both in schools and the wider world. It was planned to find out to what extent the expectations of middle leaders have reflected those changes. In particular it was hoped to understand the extent of their awareness of their role in whole school issues, the development of their staff and monitoring of teaching and learning. This information will help leaders of education and training for these professionals, and those responsible for their development, better plan their provision.
Details of the survey and methods The survey was completed alongside substantial case study research which has been funded by the Centre for Educational Policy and Management (CEPAM) at the Open University. The case studies involved interviewing a number of middle leaders in a school along with their senior manager and a team member. There was also the analysis of various documents from each school. The interview schedule for the case studies is closely tied to the questionnaire used for this postal survey (Appendix 1) and so it may be possible to illustrate qualitatively some of the numerical outcomes of this survey in a later report. The sample of schools was 1,648, which was half of all secondary schools in England as counted on the list supplied by the National College for School Leadership (NCSL) in 2002. They were selected by taking every other school listed, avoiding those that were participating as case study schools. Within the list the schools were loosely grouped in former local education authority (LEA) boundaries with new schools placed at the end of the list so there was good geographical coverage and also inclusion of newer or reorganised schools. The questionnaire is based on one used successfully seven years ago by Wise (1999) as part of her PhD research. That research covered all the secondary schools in three LEAs. Using a virtually unchanged format means that the analysis of these data can be compared with data from the earlier questionnaires to assess change within the last seven years. In that survey at least one response was received from 74.5% of the schools and from 47% of the middle leaders surveyed. The questionnaire was adjusted slightly for this survey, to take account of the inclusion of pastoral leaders as well as changes in terminology since the last one was

© National College for School Leadership 2003 3
completed. The questionnaire was piloted with a range of academic, pastoral, cross-curricular staff and special educational needs co-ordinators (SENCOs) in two schools. This allowed for an estimate of completion time to be gathered and included in the letter although some participants found it took much longer than this estimate. The letter to each middle leader pointed out the possibility of the survey giving voice to their concerns. It was hoped that this would increase the return rate. The letter made no reference to NCSL. Each school received, via the head, six questionnaires for the different types of middle leader identified to be distributed by the head. These were:
• a leader of a major single subject area • a leader of an area where the subjects are closely related • a leader of an area where the subjects are not closely related • a leader of a cross-curricular area of the curriculum • the SENCO • a leader of a pastoral area
The head decided which particular individual would receive the questionnaire of each type. This allowed for the circumstances of each school to be better accommodated for example those new to post, those absent through ill health and those too overworked to be able to respond, could be avoided. Each questionnaire was sent out in a sealed envelope which also contained a letter to the middle leader plus a reply paid envelope for return direct to the survey team. The headteacher also received a letter and a shorter questionnaire and reply paid envelope. The middle leader questionnaires were a different colour for each type of leader to aid the analysis. The questionnaires have a school code so that returns from the same school can be linked for certain parts of the analysis.
Returns There was not a good return rate overall. A number of schools made contact to explain their non-participation, others simply returned the mailing. Reasons for non-participation ranged from preparing for inspection, undergoing inspection, recovering from inspection to wishing to reduce workload on middle leaders, avoiding unnecessary paperwork, too many surveys received and concerns that it might detract from ongoing work with middle leaders in school. It was particularly interesting that some schools gave special measures or serious weaknesses as a reason for not taking part whilst other schools in the same position asked for permission to circulate the questionnaire more widely for internal purposes as a development exercise. Some returns had to be ignored because they were from individuals on the leadership spine either as assistant heads, deputy heads or advanced skills teachers. It was decided that these individuals should be removed from the statistical analysis as their circumstances within the whole school environment are different and would be more likely to receive professional development and training associated with their senior posts rather than with their ongoing departmental responsibilities. It is interesting to note, though, that many teachers grappling with the demands of middle leadership are in fact senior leaders within the school. The 1,471 valid returns received amounted to only 16.8% of the available sample of middle leaders, but there was at least one response from 757 schools which is 45.9% of the schools sampled and effectively almost one quarter of the secondary schools in England. These cover a range of middle leaders as shown in Table 1 which shows the number of returns and the overall percentage of those returns for each of the

© National College for School Leadership 2003 4
types of middle leader. For the remainder of this survey and its discussion we will use the middle leaders’ definitions of the category of their role.
Category of middle leader according to head Number of returns Percentage of returns
Head of a major single subject 251 17.1
Head of area where the subjects are closely related 242 16.5
Head of area where the subjects are not closely related 184 12.5
A cross-curricular co-ordinator 167 11.4
Special educational needs co-ordinator 388 26.4
A leader of a pastoral area. 239 16.2
Total 1471 100.0
Table 1: Distribution of returns according to the category of respondent decided by head It is notable that there was a much larger proportion of SENCOs submitted returns than other categories and from a number of their written comments were pleased to be asked about their role and its tensions. Otherwise the distribution of schools was much as might be expected but does add validity to the survey because the sample can be seen to reflect typicality. From Table 2 it can be seen that the vast majority of secondary schools responding catered for 11 to 16 years olds or 11 to 18 year olds.
Age of students catered for. Number of returns Percentage of returns
9–13 1 0.111–14 13 0.911–16 605 41.111–18 739 50.212–18 20 1.413–18 50 3.414–18 19 1.3Other 24 1.6Total 1471 100.0
Table 2: Age range of students within schools where middle leaders made returns
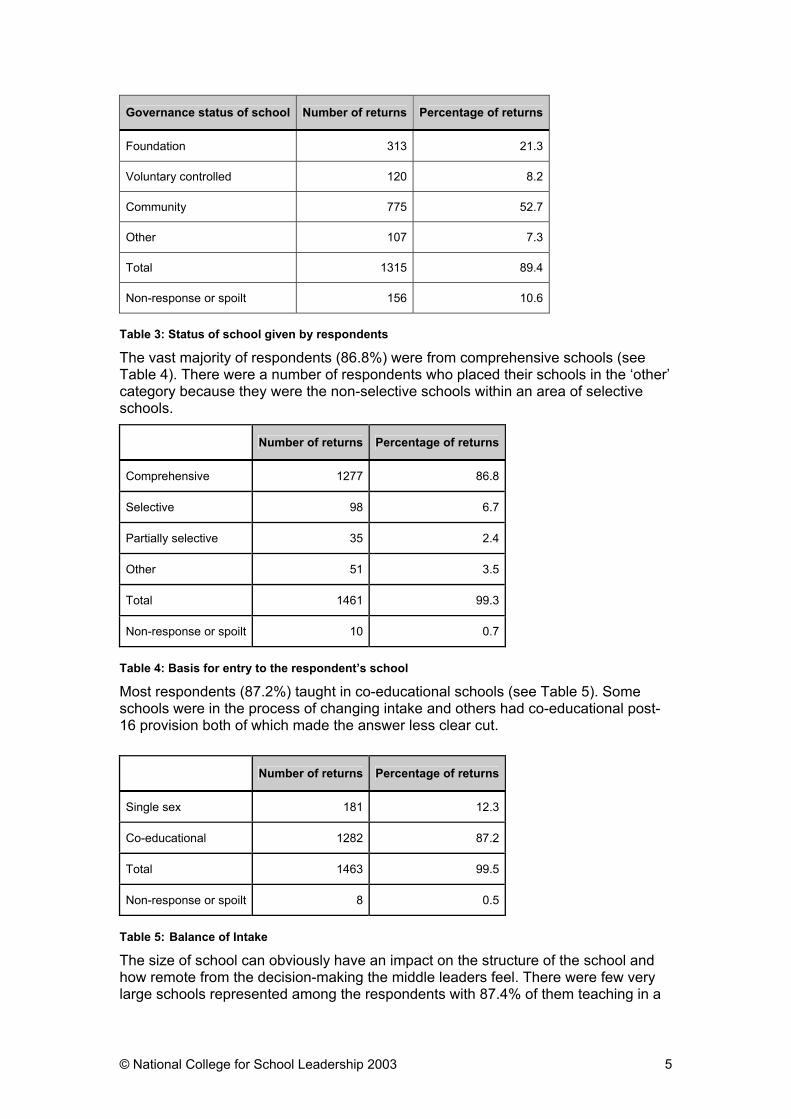
The status of the school, that is its system of governance, caused many middle leaders difficulty with many marking their school as ‘other’ when they were clearly LEA-funded community schools. These were corrected where it was possible through considering other responses from the school or knowledge of the school so that a truer picture of the types of school responding is achieved (see Table 3). Most of those in the ‘other’ category are in fact voluntary aided schools. In addition, many respondents indicated specialist status as a form of governance. It is possible that many middle leaders did not understand the question or that a large number of them do not know the governance status of their school. As this affects who their employer is, their terms and conditions of employment, their relationships with LEA staff and suppliers as well as how they are expected to react to government initiatives it is potentially a very important missing piece of information.
© National College for School Leadership 2003 5
Governance status of school Number of returns Percentage of returns
Foundation 313 21.3
Voluntary controlled 120 8.2
Community 775 52.7
Other 107 7.3
Total 1315 89.4
Non-response or spoilt 156 10.6
Table 3: Status of school given by respondents
The vast majority of respondents (86.8%) were from comprehensive schools (see Table 4). There were a number of respondents who placed their schools in the ‘other’ category because they were the non-selective schools within an area of selective schools.
Number of returns Percentage of returns
Comprehensive 1277 86.8
Selective 98 6.7
Partially selective 35 2.4
Other 51 3.5
Total 1461 99.3
Non-response or spoilt 10 0.7
Table 4: Basis for entry to the respondent’s school
Most respondents (87.2%) taught in co-educational schools (see Table 5). Some schools were in the process of changing intake and others had co-educational post-16 provision both of which made the answer less clear cut.
Number of returns Percentage of returns
Single sex 181 12.3
Co-educational 1282 87.2
Total 1463 99.5
Non-response or spoilt 8 0.5
Table 5: Balance of Intake
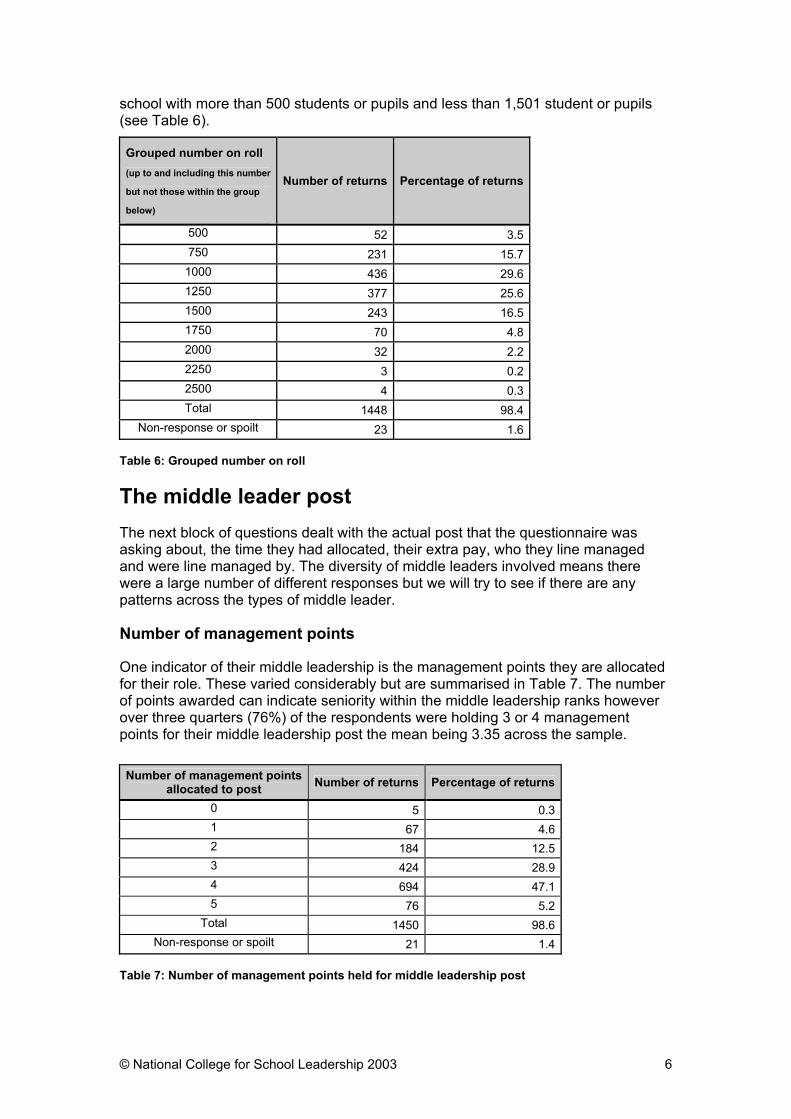
The size of school can obviously have an impact on the structure of the school and how remote from the decision-making the middle leaders feel. There were few very large schools represented among the respondents with 87.4% of them teaching in a
© National College for School Leadership 2003 6
school with more than 500 students or pupils and less than 1,501 student or pupils (see Table 6).
Grouped number on roll (up to and including this number
but not those within the group
below)
Number of returns Percentage of returns
500 52 3.5750 231 15.7
1000 436 29.61250 377 25.61500 243 16.51750 70 4.82000 32 2.22250 3 0.22500 4 0.3Total 1448 98.4
Non-response or spoilt 23 1.6 Table 6: Grouped number on roll
The middle leader post The next block of questions dealt with the actual post that the questionnaire was asking about, the time they had allocated, their extra pay, who they line managed and were line managed by. The diversity of middle leaders involved means there were a large number of different responses but we will try to see if there are any patterns across the types of middle leader.
Number of management points
One indicator of their middle leadership is the management points they are allocated for their role. These varied considerably but are summarised in Table 7. The number of points awarded can indicate seniority within the middle leadership ranks however over three quarters (76%) of the respondents were holding 3 or 4 management points for their middle leadership post the mean being 3.35 across the sample. Number of management points
allocated to post Number of returns Percentage of returns
0 5 0.31 67 4.62 184 12.53 424 28.94 694 47.15 76 5.2
Total 1450 98.6Non-response or spoilt 21 1.4
Table 7: Number of management points held for middle leadership post
© National College for School Leadership 2003 7
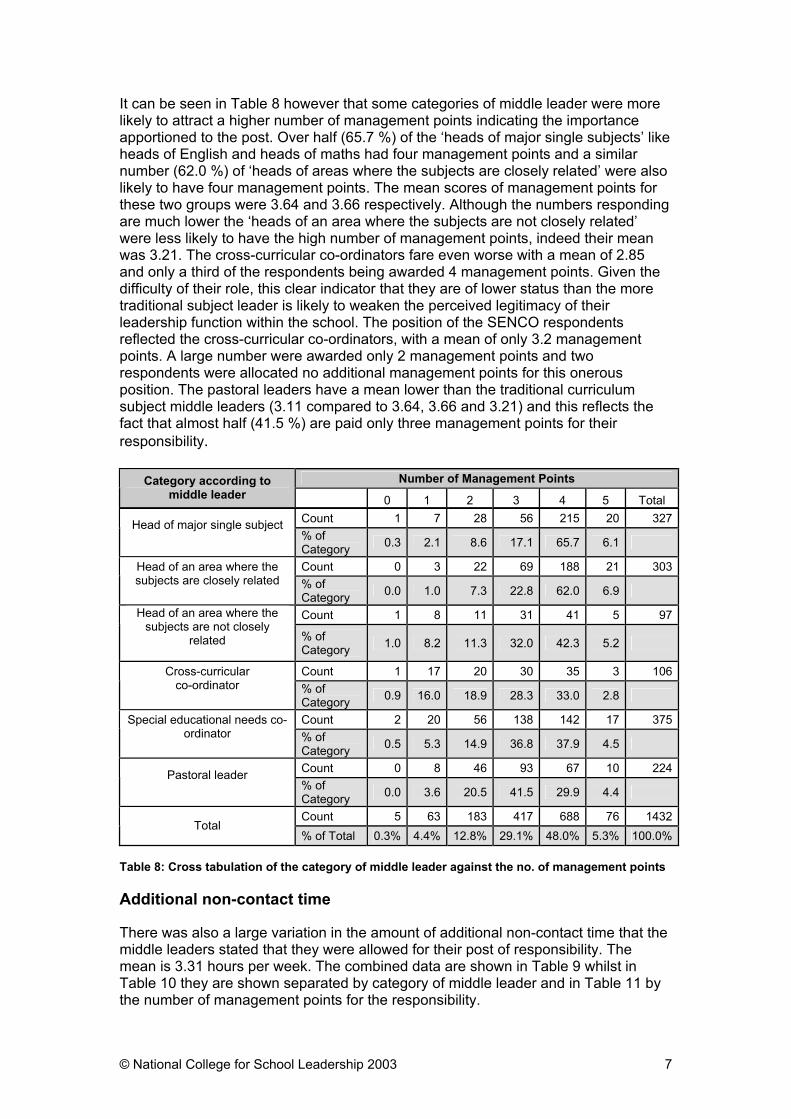
It can be seen in Table 8 however that some categories of middle leader were more likely to attract a higher number of management points indicating the importance apportioned to the post. Over half (65.7 %) of the ‘heads of major single subjects’ like heads of English and heads of maths had four management points and a similar number (62.0 %) of ‘heads of areas where the subjects are closely related’ were also likely to have four management points. The mean scores of management points for these two groups were 3.64 and 3.66 respectively. Although the numbers responding are much lower the ‘heads of an area where the subjects are not closely related’ were less likely to have the high number of management points, indeed their mean was 3.21. The cross-curricular co-ordinators fare even worse with a mean of 2.85 and only a third of the respondents being awarded 4 management points. Given the difficulty of their role, this clear indicator that they are of lower status than the more traditional subject leader is likely to weaken the perceived legitimacy of their leadership function within the school. The position of the SENCO respondents reflected the cross-curricular co-ordinators, with a mean of only 3.2 management points. A large number were awarded only 2 management points and two respondents were allocated no additional management points for this onerous position. The pastoral leaders have a mean lower than the traditional curriculum subject middle leaders (3.11 compared to 3.64, 3.66 and 3.21) and this reflects the fact that almost half (41.5 %) are paid only three management points for their responsibility.
Number of Management Points Category according to middle leader 0 1 2 3 4 5 Total
Count 1 7 28 56 215 20 327Head of major single subject % of
Category 0.3 2.1 8.6 17.1 65.7 6.1
Count 0 3 22 69 188 21 303Head of an area where the subjects are closely related
% of Category 0.0 1.0 7.3 22.8 62.0 6.9
Count 1 8 11 31 41 5 97Head of an area where the subjects are not closely
related
% of Category 1.0 8.2 11.3 32.0 42.3 5.2
Count 1 17 20 30 35 3 106Cross-curricular co-ordinator
% of Category 0.9 16.0 18.9 28.3 33.0 2.8
Count 2 20 56 138 142 17 375Special educational needs co-ordinator
% of Category 0.5 5.3 14.9 36.8 37.9 4.5
Count 0 8 46 93 67 10 224Pastoral leader % of
Category 0.0 3.6 20.5 41.5 29.9 4.4
Count 5 63 183 417 688 76 1432Total
% of Total 0.3% 4.4% 12.8% 29.1% 48.0% 5.3% 100.0% Table 8: Cross tabulation of the category of middle leader against the no. of management points
Additional non-contact time
There was also a large variation in the amount of additional non-contact time that the middle leaders stated that they were allowed for their post of responsibility. The mean is 3.31 hours per week. The combined data are shown in Table 9 whilst in Table 10 they are shown separated by category of middle leader and in Table 11 by the number of management points for the responsibility.
© National College for School Leadership 2003 8
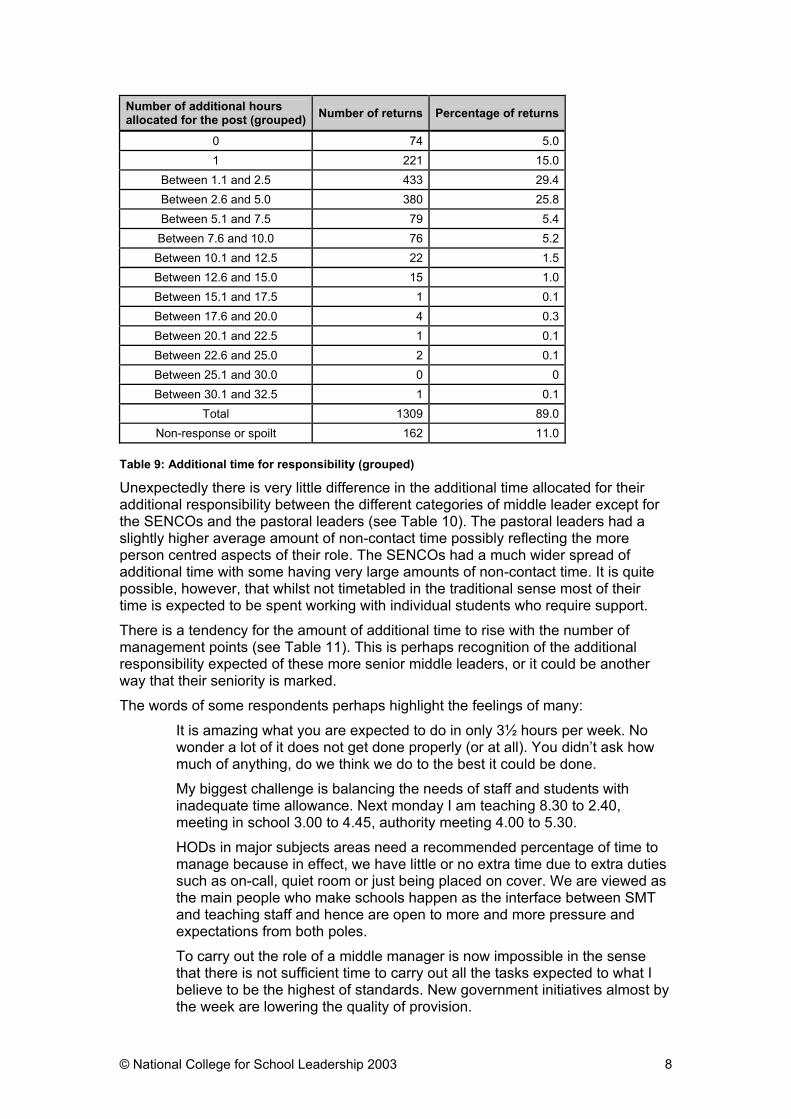
Number of additional hours allocated for the post (grouped) Number of returns Percentage of returns
0 74 5.01 221 15.0
Between 1.1 and 2.5 433 29.4Between 2.6 and 5.0 380 25.8Between 5.1 and 7.5 79 5.4
Between 7.6 and 10.0 76 5.2Between 10.1 and 12.5 22 1.5Between 12.6 and 15.0 15 1.0Between 15.1 and 17.5 1 0.1Between 17.6 and 20.0 4 0.3Between 20.1 and 22.5 1 0.1Between 22.6 and 25.0 2 0.1Between 25.1 and 30.0 0 0Between 30.1 and 32.5 1 0.1
Total 1309 89.0Non-response or spoilt 162 11.0
Table 9: Additional time for responsibility (grouped)
Unexpectedly there is very little difference in the additional time allocated for their additional responsibility between the different categories of middle leader except for the SENCOs and the pastoral leaders (see Table 10). The pastoral leaders had a slightly higher average amount of non-contact time possibly reflecting the more person centred aspects of their role. The SENCOs had a much wider spread of additional time with some having very large amounts of non-contact time. It is quite possible, however, that whilst not timetabled in the traditional sense most of their time is expected to be spent working with individual students who require support. There is a tendency for the amount of additional time to rise with the number of management points (see Table 11). This is perhaps recognition of the additional responsibility expected of these more senior middle leaders, or it could be another way that their seniority is marked. The words of some respondents perhaps highlight the feelings of many:
It is amazing what you are expected to do in only 3½ hours per week. No wonder a lot of it does not get done properly (or at all). You didn’t ask how much of anything, do we think we do to the best it could be done. My biggest challenge is balancing the needs of staff and students with inadequate time allowance. Next monday I am teaching 8.30 to 2.40, meeting in school 3.00 to 4.45, authority meeting 4.00 to 5.30. HODs in major subjects areas need a recommended percentage of time to manage because in effect, we have little or no extra time due to extra duties such as on-call, quiet room or just being placed on cover. We are viewed as the main people who make schools happen as the interface between SMT and teaching staff and hence are open to more and more pressure and expectations from both poles. To carry out the role of a middle manager is now impossible in the sense that there is not sufficient time to carry out all the tasks expected to what I believe to be the highest of standards. New government initiatives almost by the week are lowering the quality of provision.

© National College for School Leadership 2003 9
The main problem facing middle leaders is that the expectations and realities of the role is not matched by time made available. Ancillary staff are not the answer. As long as teachers and managers are pressed for time and ancillary help is minimal, which is all we can expect, we will always be prey to the 'it's quicker to do it myself' syndrome because interface time are never put into the equation - catch 22!
Additional time allocated for middle leadership responsibility (grouped) Category according to middle leader 0 1.0 2.5 5.0 7.5 10.0 12.5 15.0 17.5 20.0 22.5 25.0 32.5
Count 21 73 137 69 9 1 1 311Head of a major single subject
% within category 6.8 23.5 44.1 22.2 2.9 0.3 0.3
Count 11 62 123 69 10 3 278Head of an area where the subjects are closely related
% within category 4.0 22.3 44.2 24.8 3.6 1.1
Count 5 25 32 25 3 1 91Head of an area where the subjects are not closely related
% within category 5.5 27.5 35.2 27.5 3.3 1.1
Count 16 20 34 23 4 3 100Cross- curricular co-ordinator
% within category 16.0 20.0 34.0 23.0 4.0 3.0
Count 15 20 49 98 33 50 17 15 1 4 1 1 1 305Special educational needs co-ordinator
% within category 4.9 6.6 16.1 32.1 10.8 16.4 5.6 4.9 0.3 1.3 0.3 0.3 0.3
Count 5 15 53 91 20 17 5 206Pastoral leader % within
category 2.4 7.3 25.7 44.2 9.7 8.3 2.4
Count 73 215 428 375 79 75 22 15 1 4 1 2 1 1291 Total % within
category 5.7 16.7 33.2 29.0 6.1 5.8 1.7 1.2 0.1 0.3 0.1 0.2 0.1
Table 10: Cross tabulation of category of middle leader against additional time for the responsibility

© National College for School Leadership 2003 10
No of management points
0 1 2 3 4 5 Total Count 1 14 11 18 26 4 74
0 % within no. of mgt points 20.0 22.6 6.5 4.7 4.2 6.3
Count 1 23 40 60 91 4 2191
% within no. of mgt points 20.0 37.1 23.8 15.7 14.7 6.3
Count 2 15 55 123 225 9 429Between 1.1 and 2.5
% within no. of mgt points 40.0 24.2 32.7 31.9 36.4 14.3
Count 1 8 39 112 191 28 379Between 2.6 and 5.0
% within no. of mgt points 20.0 12.9 23.2 29.3 30.9 44.4
Count 8 26 37 8 79Between 5.1 and 7.5
% within no. of mgt points 4.8 6.8 5.8 12.7
Count 1 10 23 33 9 76Between 7.6 and 10.0
% within no. of mgt points 1.6 6.0 6.0 5.3 14.3
Count 4 7 10 21Between 10.1 and 12.5
% within no. of mgt points 2.4 1.8 1.5
Count 1 10 3 1 15Between 12.6 and 15.0
% within no. of mgt points 1.6 2.6 0.5 1.6
Count 1 1Between 15.1 and 17.5
% within no. of mgt points 0.2
Count 1 2 1 4Between 17.6 and 20.0
% within no. of mgt points 0.6 0.5 0.2
Count 2 2 4More than 20.0
% within no. of mgt points 0.6 0.4
Add
ition
al ti
me
for r
espo
nsib
ility
in h
ours
(gro
uped
)
Total Count 5 62 168 382 618 63 1301 Table 11: Cross tabulation of additional time allocated for responsibility against number of management points for responsibility
Line management
This section discusses line management from the two perspectives, being line managed and line managing the area team. Middle leaders gave a variety of names to their line manager, whom we sought to place into one of four categories as shown in Table 12. It was not always clear which category the line manager should be attributed to hence the large number that appears within the ‘Other’ category. It was hoped to be able to do a comparison between who the middle leaders perceived as their line manager and who their heads indicated as their line manager but the variable quality of the data received has made this impossible. Where comparison was possible there was evidence of difference between the perceptions of the middle leaders and their headteachers.

© National College for School Leadership 2003 11
Line manager according to middle leader
Number of returns Percentage of returns
Head 172 11.7Deputy 754 51.3Assistant head 296 20.1Member of senior management or leadership team 92 6.3
Other 111 7.5Not sure 23 1.6Total 1450 98.6Missing, unclear or spoilt 23 1.5
Table 12: Line manager according to middle leader
Middle leaders were asked how many staff worked within their area of responsibility full time or part time, and which of the teachers who worked for them part time had their main teaching responsibility elsewhere. The heads of subject department had no difficulty with these questions, but there were some respondents – cross curricular co-ordinators, SENCOs and pastoral heads, for whom this question posed problems. For example, one cross-curricular co-ordinator was responsible for the Gifted and Talented Programme. All the teaching staff were working within her area of responsibility in all of their lessons, but this is not the same level or type of responsibility as other middle leaders would have for staff teaching within their subject area. The spread of staff working within the areas of the middle leaders for all of their time is shown in Table 13 as is the number of teaching staff working there for part of their time. This latter circumstance could either be because they were working part-time in the school or because their teaching was across two or more areas. The table also shows the number of teaching staff who have their main teaching elsewhere, that is out of the middle leader’s area of responsibility.
Number of teaching staff
(grouped)
Number of staff working
full time in area
Percentage of returns
Number of staff working part time in
area
Percentage of returns
Number of staff working part time in area whose
main teaching is outside
area.
Percentage of returns
0 130 10.7 101 8.5 390 33.51 118 9.7 300 25.3 270 23.22 95 7.8 228 19.3 152 13.1
2.1 to 5 356 29.3 325 27.4 167 14.45.1 to 10 423 34.8 134 11.3 104 8.910.1 to 15 72 5.9 38 3.2 30 2.615.1 to 20 16 1.3 18 1.5 17 1.520.1 to 25 4 0.3 8 0.7 4 0.325.1 to 30 1 0.1 12 1.0 13 1.1
More than 30 2 0.2 20 1.7 16 1.4Total 1217 100.1 1184 99.9 1163 100.0
Missing or spoilt entries 254 287 306
Table 13: Distribution of staff teaching commitments in responsibility area (grouped)
© National College for School Leadership 2003 12
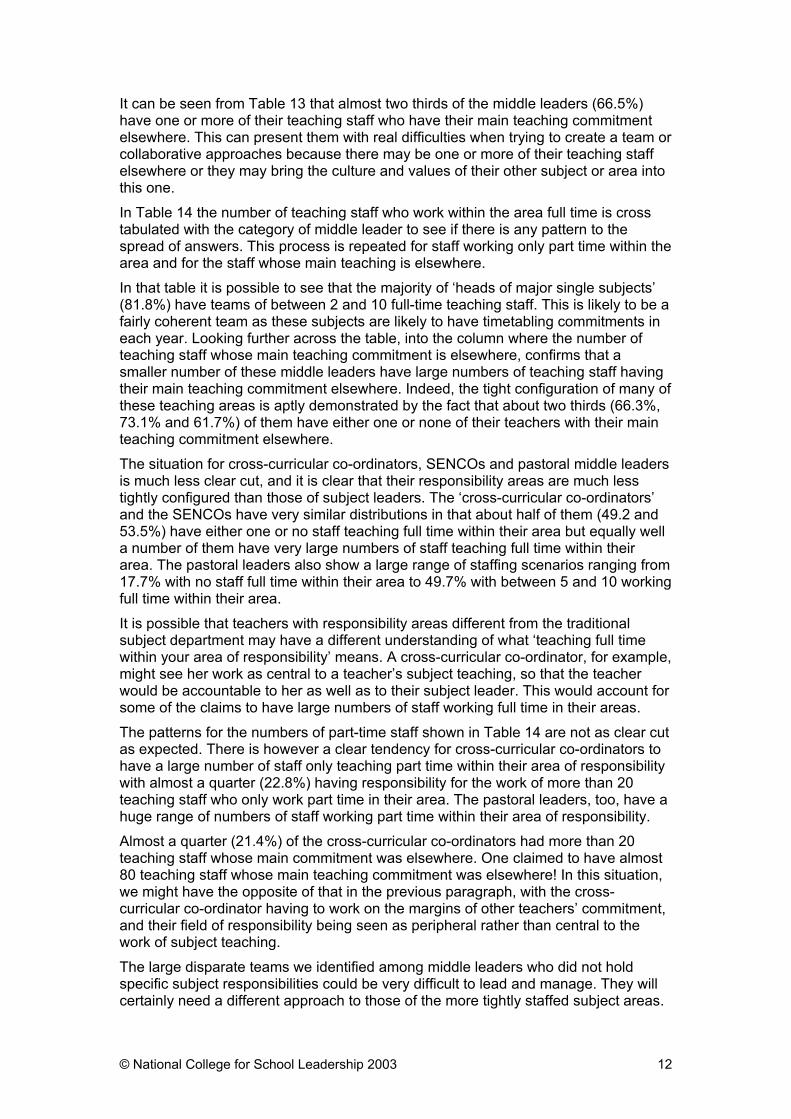
It can be seen from Table 13 that almost two thirds of the middle leaders (66.5%) have one or more of their teaching staff who have their main teaching commitment elsewhere. This can present them with real difficulties when trying to create a team or collaborative approaches because there may be one or more of their teaching staff elsewhere or they may bring the culture and values of their other subject or area into this one. In Table 14 the number of teaching staff who work within the area full time is cross tabulated with the category of middle leader to see if there is any pattern to the spread of answers. This process is repeated for staff working only part time within the area and for the staff whose main teaching is elsewhere. In that table it is possible to see that the majority of ‘heads of major single subjects’ (81.8%) have teams of between 2 and 10 full-time teaching staff. This is likely to be a fairly coherent team as these subjects are likely to have timetabling commitments in each year. Looking further across the table, into the column where the number of teaching staff whose main teaching commitment is elsewhere, confirms that a smaller number of these middle leaders have large numbers of teaching staff having their main teaching commitment elsewhere. Indeed, the tight configuration of many of these teaching areas is aptly demonstrated by the fact that about two thirds (66.3%, 73.1% and 61.7%) of them have either one or none of their teachers with their main teaching commitment elsewhere. The situation for cross-curricular co-ordinators, SENCOs and pastoral middle leaders is much less clear cut, and it is clear that their responsibility areas are much less tightly configured than those of subject leaders. The ‘cross-curricular co-ordinators’ and the SENCOs have very similar distributions in that about half of them (49.2 and 53.5%) have either one or no staff teaching full time within their area but equally well a number of them have very large numbers of staff teaching full time within their area. The pastoral leaders also show a large range of staffing scenarios ranging from 17.7% with no staff full time within their area to 49.7% with between 5 and 10 working full time within their area. It is possible that teachers with responsibility areas different from the traditional subject department may have a different understanding of what ‘teaching full time within your area of responsibility’ means. A cross-curricular co-ordinator, for example, might see her work as central to a teacher’s subject teaching, so that the teacher would be accountable to her as well as to their subject leader. This would account for some of the claims to have large numbers of staff working full time in their areas. The patterns for the numbers of part-time staff shown in Table 14 are not as clear cut as expected. There is however a clear tendency for cross-curricular co-ordinators to have a large number of staff only teaching part time within their area of responsibility with almost a quarter (22.8%) having responsibility for the work of more than 20 teaching staff who only work part time in their area. The pastoral leaders, too, have a huge range of numbers of staff working part time within their area of responsibility. Almost a quarter (21.4%) of the cross-curricular co-ordinators had more than 20 teaching staff whose main commitment was elsewhere. One claimed to have almost 80 teaching staff whose main teaching commitment was elsewhere! In this situation, we might have the opposite of that in the previous paragraph, with the cross-curricular co-ordinator having to work on the margins of other teachers’ commitment, and their field of responsibility being seen as peripheral rather than central to the work of subject teaching. The large disparate teams we identified among middle leaders who did not hold specific subject responsibilities could be very difficult to lead and manage. They will certainly need a different approach to those of the more tightly staffed subject areas.

© National College for School Leadership 2003 13
There will be a mix of values and cultures, limited time and commitment to name but a few issues. Middle leaders in these categories may need to develop different leadership skills from those of their more traditional subject leaders, and training and development provision of these middle leaders would need to take this into account. This is supported by the words of one SENCO respondent:
Learning support is cross key stage and cross curricular. In many ways it is a bizarre existence being a department of 10 with just 1.5 teachers and 8 teaching assistants. We are all things to all people in the school and use our skill and experience to respond to school events on a sometimes minute by minute time scale. The effectiveness is hard to quantify but nevertheless tangible.

© National College for School Leadership 2003 14
Category of middle leader
Major single subject Area where the
subjects are closely related
Area where the subjects are not closely
related
Cross-curricular co-ordinator SENCO Pastoral leader
Proportion of teaching time in area F/T P/T else F/T P/T else F/T P/T else F/T P/T else F/T P/T else F/T P/T else Count 1 17 114 2 17 131 3 3 20 21 4 12 77 43 101 26 15 9
0 % within category
0.3 6.4 37.6 0.7 6.6 49.6 3.2 3.5 23.3 32.3 4.6 15.0 28.2 14.8 37.8 17.7 9.7 6.0
Count 19 79 87 8 79 62 6 21 33 11 11 10 69 85 64 4 19 10 1 % within
category 5.9 26.8 28.7 2.7 30.6 23.5 6.4 24.4 38.4 16.9 12.6 12.5 25.3 29.2 24.0 2.7 12.3 6.7
Count 23 71 51 16 62 31 8 19 10 4 6 6 39 56 44 2 13 8 2 % within
category 7.1 24.1 16.8 5.3 24.0 11.7 8.5 22.1 11.6 6.2 6.9 7.5 14.3 19.2 16.5 1.4 8.4 5.4
Count 120 105 42 100 82 35 31 33 19 15 17 14 62 66 30 24 20 26 2.1 to 5.0 % within
category 37.2 35.6 13.9 33.2 31.8 13.3 33.0 38.4 22.1 23.1 19.5 17.5 22.7 22.7 11.2 16.3 12.9 17.4
Count 144 17 6 139 12 2 33 5 3 10 18 13 18 25 17 73 56 60 5.1 to 10.0 % within
category 44.6 5.8 2.0 46.2 4.7 0.8 35.1 5.8 3.5 15.4 20.7 16.3 6.6 8.6 6.4 49.7 36.1 40.3
Count 15 2 1 31 2 10 3 2 8 5 5 5 4 9 18 20 10.1 to 15.0 % within
category 4.6 0.7 0.3 10.3 0.8 10.6 3.5 3.1 9.2 6.3 1.8 1.7 1.5 6.1 11.6 13.4
Count 1 1 3 1 1 2 1 1 3 3 3 4 3 7 6 8 15.1 to20.0 % within
category 0.3 0.3 1.0 0.4 0.4 2.1 1.2 1.5 3.4 3.8 1.1 1.4 1.1 4.8 3.9 5.4
Count 1 1 1 2 3 2 1 1 1 1 20 17 7 4 2 8 8 More than 20.0 % within
category 0.3 0.3 0.3 0.6 1.2 0.8 1.1 1.2 1.2 1.5 22.8 21.4 2.3 1.5 1.4 5.0 5.3
Num
ber o
f tea
chin
g st
aff w
orki
ng in
are
a (g
roup
ed)
Total Count 323 295 303 301 258 264 94 86 86 65 87 80 273 291 267 147 155 149 Table 14: Cross tabulation of the numbers (grouped) teaching staff working in the area full-time, for part of their time and who have the majority of their work elsewhere against category of middle leader
© National College for School Leadership 2003 15
Category of middle leader
Major single subject Area where the
subjects are closely related
Area where the subjects are not closely
related
Cross-curricular co-ordinator SENCO Pastoral leader
Proportion of time working in area F/T P/T else F/T P/T else F/T P/T else F/T P/T else F/T P/T else F/T P/T else Count 142 66 61 76 71 107 43 19 20 31 23 18 7 47 218 75 61 48 0 % within category
63.7 23.2 28.0 31.5 30.2 50.7 64.2 24.1 31.3 55.4 30.3 29.0 1.9 21.3 76.5 60.5 43.3 42.9
Count 43 45 33 59 55 50 14 19 17 9 17 19 13 62 45 26 25 18 1 % within category
19.3 15.8 15.1 24.5 23.4 23.7 20.9 24.1 26.6 16.1 22.4 30.6 3.6 28.1 15.8 21.0 17.7 16.1
Count 27 37 30 51 40 17 8 15 7 8 16 10 15 21 12 11 27 19 2 % within category
12.1 13.0 13.8 21.2 17.0 8.1 11.9 19.0 10.9 14.3 21.1 16.1 4.2 9.5 4.2 8.9 19.1 17.0
Count 8 89 69 54 54 27 1 22 17 5 8 7 64 43 6 9 21 20 2.1 to 5.0 % within category
3.6 31.2 31.7 22.4 23.0 12.8 1.5 27.8 26.6 8.9 10.5 11.3 17.8 19.5 2.1 7.3 14.9 17.9
Count 3 38 21 1 11 7 1 2 1 2 9 6 133 32 2 1 5 5 5.1 to 10.0 % within category
1.3 13.3 9.6 0.4 4.7 3.3 1.5 2.5 1.6 3.6 11.8 9.7 37.0 14.5 0.7 0.8 3.5 4.5
Count 8 2 1 1 1 1 1 86 8 1 1 1 10.1 to 15.0 % within
category 2.8 0.9 0.4 0.5 1.3 1.6 1.8 24.0 3.6 0.4 0.8 0.7
Count 2 2 3 2 1 1 3 2 21 7 1 1 1 15.1 to 20.0 % within
category 0.7 0.9 1.3 0.9 1.3 1.6 3.9 3.2 5.8 3.2 0.4 0.7 0.9
Count 20 1 1 1 More than 20.0 % within
category 5.7 0.5 0.8 0.9
Num
ber o
f non
-teac
hing
, anc
illar
y or
sup
port
sta
ff w
orki
ng in
ar
ea
Total Count 223 285 218 241 235 211 67 79 64 56 76 62 359 221 285 124 141 112 Table 15: Cross tabulation of the numbers (grouped) of non-teaching, support or ancillary staff working in the area full-time, for part of their time and who have the majority of their work elsewhere

© National College for School Leadership 2003 16
In Table 15 the distribution of non-teaching, support or ancillary staff working in the areas of the middle leaders is shown against the category of middle leader. They are split for each category into those who work full time within the area, part time within the area and the number whose main working commitment is elsewhere. The allocation of this category of staff to a subject area is often related to the technical nature of the subject as well as to the level of in-class support required by the students. As might be expected the category of middle leader with the largest number of staff within this category is the SENCO. These staff require a different style of line management and higher levels of support than teaching staff and so the line management responsibility for some of these SENCOs is huge.
Category of area according to middle leader
Major single
subject
Area where the subjects
are closely related
Area where the subjects are not closely related
Cross- curricular
co-ordinator
Special Educational Needs
Co-ordinator
Pastoral leader Total
Count 14 7 4 31 64 70 190 0 % within
category 4.3 2.4 4.1 34.1 20.2 38.3 14.6
Count 10 14 9 10 65 20 128 1 % within
category 3.1 4.8 9.3 11.0 20.5 10.9 9.8
Count 36 39 20 16 72 20 203 2 % within
category 11.1 13.3 20.6 17.6 22.7 10.9 15.6
Count 218 186 56 26 85 32 603 2.1 to 5.0
% within category 67.5 63.3 57.7 28.6 26.8 17.5 46.2
Count 41 43 7 2 9 27 129 5.1 to 10.0
% within category 12.7 14.6 7.2 2.2 2.8 14.8 9.9
Count 3 3 1 3 9 6 25 10.1 to 15.0
% within category 0.9 1.0 1.0 3.3 2.8 3.3 1.9
Count 5 1 6 15.1 to 20.0
% within category 1.6 0.5 0.5
Count 1 2 3 8 7 121 More than 20.0
% within category 0.3 0.6 3.3 2.4 3.6 1.9
Num
ber o
f sta
ff pe
rfor
man
ce m
anag
ed
Total Count 323 294 97 91 317 183 1305
Table 16: Cross tabulation of number of staff performance managed against category of middle leader
Despite the appearance of a great spread there is an element of similarity between the various categories of middle leader with regard to performance management. The first three categories have about three quarters (78.6%, 76.6% and 78.3%) of their respondents responsible for the performance management of between 2 and 5 teaching staff. The cross-curricular co-ordinators and the SENCOs have more middle leaders with a lower level of responsibility for performance management. However there are huge differences masked by the grouping. There were two
© National College for School Leadership 2003 17
SENCOs who claimed to have responsibility for the performance management of 60, one for 70 and one for 80 teachers. This is a huge responsibility and would need careful and sophisticated management but there is the possibility that they meant they had an input to the performance management of these staff rather than sole responsibility for it.
Additional responsibilities
Just over half (51.3%) of the middle leaders claimed to have additional responsibilities over and above those expected as part of the role for which they were answering. Given that lack of time is a frequently voiced concern (Wise, 2001; Earley and Fletcher-Campbell, 1989) and the low non-contact time some middle leaders are allocated according to this survey there must be a considerable amount of role strain for these people. Examples of the extra duties include: co-ordination of teaching and learning group; professional tutor; in charge of Youth Award; assistant in ICT; responsibility for ITT; KS3 strategy manager and primary liaison; literacy co-ordinator; designated child protection teacher and connexions links; staff induction, NQT induction, assist with timetabling and KS3 assessment.
Time spent with individual students
The amount of time spent counselling or meeting with individual students or young people varies but the majority (67.4%) of middle leaders spend between one and five hours with individual students. The mean time is 3.44 hours which is similar to the mean of additional non-contact time (see Table 11).
As would be expected the amount of time spent with individual students varied between the different categories of middle leaders (see Table 17). The three predominately subject based middle leaders claimed to spend very similar amounts of time with individual students. The cross-curricular co-ordinators spent slightly more time on average, the SENCOs and the pastoral leaders spent considerably more time with individuals. This is to be expected given their particular roles but whereas only 62.3% of SENCOs and 64.6% of pastoral leaders claim to have more than 2½ hours allocated for their responsibility, 71.2% of SENCOs and 76% of pastoral leaders claim to spend more than 2½ hours with individual students. This means that some of them must be encroaching on their personal time.

© National College for School Leadership 2003 18
Time spent with individual students
0 1.0 2.5 5.0 7.5 10.0 12.5 15.0 17.5 20.0 More than 20.0
Total
Count 23 92 96 63 6 7 1 1 289Head of a major single subject
% within category 8.0 31.8 33.2 21.8 2.1 2.4 0.3 0.3
Count 26 100 87 41 4 3 1 1 1 264Head of an area where the subjects are closely related
% within category 9.8 37.9 33.0 15.5 1.5 1.1 0.4 0.4 0.4
Count 4 30 32 20 4 1 91Head of an area where the subjects
are not closely related
% within category 4.4 33.0 35.2 22.0 4.4 1.1
Count 11 21 27 22 3 1 85Cross-curricular co-ordinator
% within category 12.9 24.7 31.8 25.9 3.5 1.2
Count 10 34 48 127 28 48 7 11 2 4 319Special educational needs co-ordinator
% within category 3.1 10.7 15.0 39.8 8.8 15.0 2.2 3.4 0.6 1.2
Count 1 8 39 93 22 23 3 6 1 3 1 200Pastoral leader % within
category 0.5 4.0 19.5 46.5 11.0 11.5 1.5 3.0 0.5 1.5 0.5
Count 75 285 329 366 67 83 12 18 1 6 6 1248
Cat
egor
y ac
cord
ing
to m
iddl
e le
ader
Total % within category 6.0 22.8 26.4 29.3 5.4 6.7 1.0 1.4 0.1 0.5 0.5 100.0
Table 17: Cross tabulation of the category of the middle leader against the time spent with individual students
However, it is not just the SENCOs and pastoral leaders for whom this is a problem. As can be seen in Table 18, there are a large number of middle leaders (32.4 % of the respondents) who claim to spend longer counselling and working with individual students than they are allocated in non-contact time for this responsibility. The shaded area of the table indicates when staff have claimed to spend more than their allocated non-contact time dealing with individual students. The table demonstrates that not only are middle leaders using personal time for these meetings but they have little time left for the other aspects of their role. Time in hours spent with individual students in hours (grouped)
0 1.0 2.5 5.0 7.5 10.0 12.5 15.0 17.5 20.0Greater than
20 hours Total 0 8 12 20 16 1 3 1 1 62
1.0 13 62 63 40 9 7 2 1 197 2.5 33 116 105 97 8 9 2 1 2 1 374 5.0 14 68 95 104 25 23 3 3 1 1 337 7.5 1 12 12 34 5 4 2 70
10.0 1 5 13 24 9 10 1 5 1 69 12.5 1 1 3 11 1 2 1 20 15.0 1 4 1 6 1 1 14 17.5 1 1 20.0 1 1 1 3
Greater than 20 hours 1 1 1 3 A
dditi
onal
tim
e in
hou
rs a
lloca
ted
for
resp
onsi
bilit
y (g
roup
ed)
Total 71 276 312 332 60 67 9 14 1 4 4 1150 Table 18: Cross tabulation of the additional time allocated for the responsibility in hours against the time spent in hours with individual students

© National College for School Leadership 2003 19
The individual and their career Having gained a picture of the leadership and management responsibilities of the middle leaders who responded to the survey we now attempt to gather a picture of how they might have gained the knowledge to carry out these responsibilities. The first, and often considered the most legitimate, source of knowledge is experience. Table 19 shows how many years it was since the middle leader respondents had begun teaching. A quick glance down the entries for the secondary question of how long they had actually been teaching, thus allowing for career breaks, showed that very few had had a break from teaching.
Number of years since began teaching (grouped) Number of returns Percentage of returns
Up to 2.5 8 0.52.6 to 5.0 84 5.75.1 to 7.5 103 7.07.6 to 10.0 163 11.110.1 to 15.0 164 11.115.1 to 20.0 166 11.320.1 to 25.0 268 18.225.1 to 30.0 329 22.430.1 to 35.0 153 10.435.1 to 40.0 20 1.440.1 to 45.0 1 0.1Total 1459 99.2Missing or spoilt 12 .8
Table 19: Number of years since began teaching (grouped)
Most of the respondents had been in teaching for some time with only 13.2% having been teaching for 7½ years or less. Almost two thirds of the teachers (63.8%) had begun teaching before the 1988 Education Act, which means that they have had to accommodate a great many changes. However many of these will have been promoted after the 1988 ERA because only 9.4% have been in post for more than 15 years, whereas 34.1% have been in post for two years of less, and a further 24.7 for less than five years. Since our sample represents the full range of professional age and experience, this would suggest that there is a constant movement of staff who hold promoted posts. The qualification on entry to teaching (see Table 20) provides a useful insight into the amount of education training and development the teachers might have had prior to entry. With the Cert Ed and BEd being three and sometimes four year courses there was and is more input on education theory and practice. The distribution of such dedicated teaching qualifications across the categories of middle leader is not even, however. There was a higher proportion of SENCOs who had entered teaching with such a qualification than any of the other categories. At the other end of the spectrum, Category 1 and 2 middle leaders were much more likely to have entered teaching with a PGCE having completed their degree in their specialist subject. Only just over a quarter (28.6 and 27.1%) were likely to have a BEd or CertEd on entry to teaching. There has been a change in the pattern of entry qualifications since the survey done in 1996 and reported in 1999 (Wise, 1999). At that time there was a much larger proportion of ‘heads of areas where the subjects are not closely related’ and ‘cross-curricular co-ordinators’ had dedicated teaching qualifications such as BEds and CertEds (70.4% and 69.1%).

© National College for School Leadership 2003 20
Head of a major single
subject
Head of an area where
the subjects
are closely related
Head of an area where
the subjects are not closely related
Cross- curricular
co-ordinator
Special educational needs co-ordinator
Pastoral leader
No professional qualifications
No professional qualifications 0 0.3 0 0 0.5 1.8
Degree 4.3 5.0 1.0 4.7 7.4 1.3
Higher degree 1.4 1.0 2.0 0 0.3 0.9
Percentage with no professional qualifications 5.7 6.3 3.0 4.7 8.2 4.0
Dedicated teaching qualification
Certificate in Education 12.8 (6.1)
14.2 (20.5)
20.2 (38.6)
19.8 (54.8) 35.7 20.4
BEd 15.8 (18.4)
12.9 (9.1)
21.2 (31.8)
18.9 (14.3) 23.2 25.7
Percentage with dedicated teaching qualifications
28.6 (24.5)
27.1 (29.6)
41.2 (70.4)
38.7 (69.1) 58.9 46.1
Post Graduate Certificate of Education (PGCE)
Degree + PGCE 55.9 (67.3)
55.4 (59.1)
40.4 (20.5)
46.2 (28.6) 31.8 41.6
Higher degree + PGCE 7.6 (2.0)
9.9 (2.3)
13.1 (0)
9.4 (2.4) 3.6 6.2
Percentage with PGCE 63.5 (69.3)
65.3 (61.4)
53.5 (20.5)
55.6 (31.0) 35.4 47.8
Other
Qua
lific
atio
ns o
n en
try
to te
achi
ng
Percentage with other qualifications 30.0 13.3 6.7 3.3 30.0 16.7
Table 20: Cross tabulation of qualification on entry to teaching against category of middle leader (1465 valid returns, 1996 data in parentheses) Rather more than half of the respondents have gained further qualifications since entering teaching (see Table 21). This is quite an extraordinary investment in their own development and learning. However, further inspection of the data found that those who entered teaching with no professional qualifications or a Certificate in Education (Cert Ed) almost a third (30.1%) had not taken any further qualifications. This may have implications for their further training as they have not studied at degree level so assumptions about teaching being a graduate profession and aiming training at this audience may well be misguided for a number of middle leaders (6.5%).

© National College for School Leadership 2003 21
Number of returns Percentage of returns
As on entry 679 46.2 First degree 150 10.2 Further degree 28 1.9 Advanced work in education 201 13.7 Higher degree 96 6.5 Further higher degree 30 2.0 Higher degree directly related to education 160 10.9 Other 107 7.3 Total 1453 98.8 Missing or spoilt 20 1.4
Table 21: Highest qualification now
However, it would appear that very little of this extra qualification is related to leadership and management with only 27.6% of all the training claimed in these areas being completed as part of a qualification course (see Table 22). The pattern of leadership and management training has changed little since the survey done in 1996 (Wise, 1999) except perhaps that there has been a reduction in the ‘other’ types of training.
Type of training Percentage of responses claiming to have
completed training in this way (some respondents will have indicated more than
one). No leadership and management training 12.4 (15.4)
School based training of less than one day 21.8 (28.5) School based training of one day or more 29.0 (24.9)
School based training as part of an INSET day 32.3 (29.4) Out of school course for less than one day 39.5 (26.7) Out of school course for one day or more 45.5 (39.4)
Part of a qualification course at less than master’s level 12.2 (12.2)
Part of a qualification course at master’s level or higher 15.4 (19.5)
Other types 3.4 (11.8) Table 22: Types of training undertaken in leadership and management (1996 survey percentages in parentheses)
The need for training and retraining is highlighted by one respondent: The whole area of being a middle manager has changed since I started doing the job 10 years ago. I feel a refresher training course is needed every 4 to 5 years to renew enthusiasm and ensure that middle managers are not forgotten. It is middle managers who carry out the change within a school. Without sound middle managers the school will fail.
© National College for School Leadership 2003 22
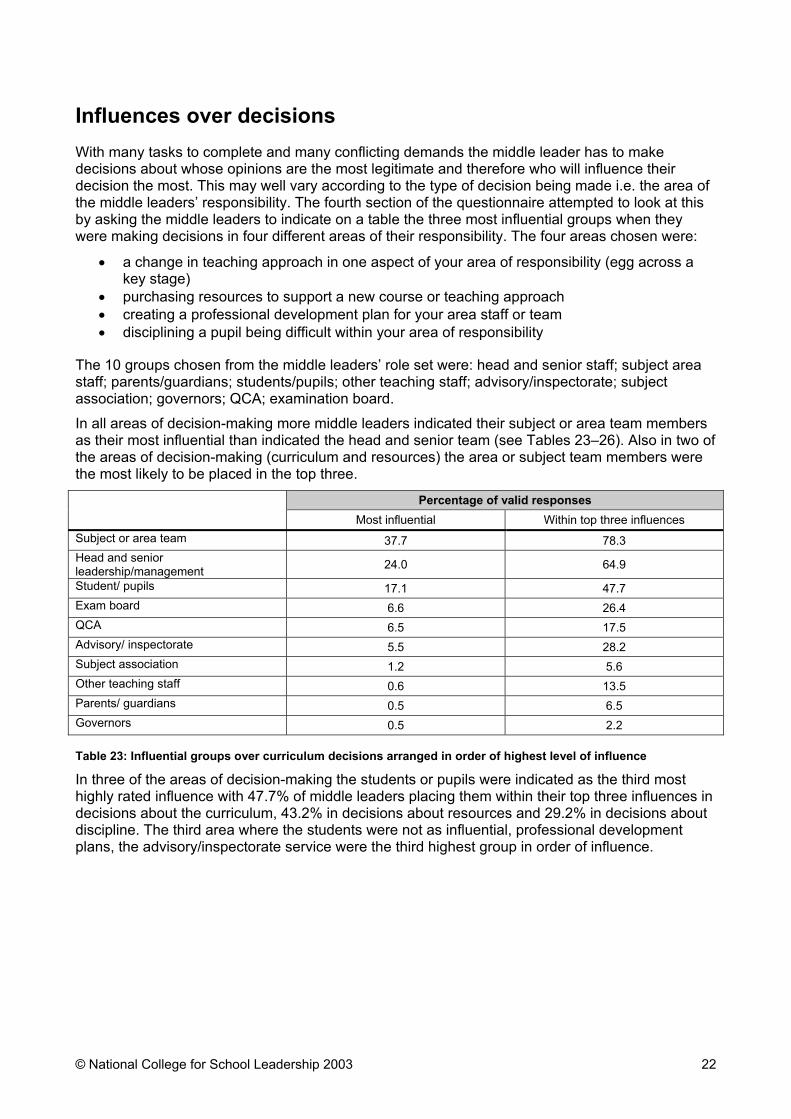
Influences over decisions With many tasks to complete and many conflicting demands the middle leader has to make decisions about whose opinions are the most legitimate and therefore who will influence their decision the most. This may well vary according to the type of decision being made i.e. the area of the middle leaders’ responsibility. The fourth section of the questionnaire attempted to look at this by asking the middle leaders to indicate on a table the three most influential groups when they were making decisions in four different areas of their responsibility. The four areas chosen were:
• a change in teaching approach in one aspect of your area of responsibility (egg across a key stage)
• purchasing resources to support a new course or teaching approach • creating a professional development plan for your area staff or team • disciplining a pupil being difficult within your area of responsibility
The 10 groups chosen from the middle leaders’ role set were: head and senior staff; subject area staff; parents/guardians; students/pupils; other teaching staff; advisory/inspectorate; subject association; governors; QCA; examination board. In all areas of decision-making more middle leaders indicated their subject or area team members as their most influential than indicated the head and senior team (see Tables 23–26). Also in two of the areas of decision-making (curriculum and resources) the area or subject team members were the most likely to be placed in the top three.
Percentage of valid responses
Most influential Within top three influences Subject or area team 37.7 78.3 Head and senior leadership/management 24.0 64.9
Student/ pupils 17.1 47.7 Exam board 6.6 26.4 QCA 6.5 17.5 Advisory/ inspectorate 5.5 28.2 Subject association 1.2 5.6 Other teaching staff 0.6 13.5 Parents/ guardians 0.5 6.5 Governors 0.5 2.2 Table 23: Influential groups over curriculum decisions arranged in order of highest level of influence
In three of the areas of decision-making the students or pupils were indicated as the third most highly rated influence with 47.7% of middle leaders placing them within their top three influences in decisions about the curriculum, 43.2% in decisions about resources and 29.2% in decisions about discipline. The third area where the students were not as influential, professional development plans, the advisory/inspectorate service were the third highest group in order of influence.

© National College for School Leadership 2003 23
Percentage of valid responses
Most influential Within top three influences Subject or area team 52.6 86.3 Head and senior leadership/management 26.3 62.5 Student/ pupils 12.3 43.2 Exam board 3.4 22.3 Advisory/ inspectorate 1.2 18.2 Subject association 1.2 11.0 QCA 1.2 5.2 Other teaching staff 1.1 16.4 Parents/ guardians 0.4 8.9 Governors 0.4 2.6 Table 24: Influential groups over resource decisions arranged in order of highest level of influence
It is interesting to note the position of the ‘other teaching staff’ in the various decision-making areas. These might include the SENCO, a cross curricular co-ordinator like an ICT or literacy co-ordinator or simply staff from another teaching area. In decisions about the curriculum and resources they are very low, appearing higher up the table when considering decisions about the professional development plan and placed fourth in matters of discipline. There may be clear reasons for this connected to expertise in the case of the professional development plan or maybe pastoral responsibility in the case of the discipline decisions. What is clear is that the influence of teaching staff outside the curriculum or subject area are likely to have to prove legitimacy before they are able to influence decisions in another area of the curriculum.
Percentage of valid responses
Most influential Within top three influences Subject or area team 47.6 82.9 Head and senior leadership/management 41.3 94.2
Advisory/ inspectorate 3.4 32.9 Student/ pupils 3.3 20.7 Other teaching staff 1.6 19.9 Exam board 1.3 10.0 Subject association 0.5 6.0 QCA 0.4 3.4 Parents/ guardians 0.3 2.2 Governors 0.1 9.1 Table 25: Influential groups over professional development decisions arranged in order of highest level of influence
Despite the supposed increase in influence of parents by various government acts and decrees they are clearly still very low in the order of influences except in matters of discipline. Less than 10% of middle leaders would consider them an influence in the other three decision-making areas.
© National College for School Leadership 2003 24
Percentage of valid responses
Most influential Within top three influences Subject or area team 43.9 72.3 Head and senior leadership/management 33.1 88.2
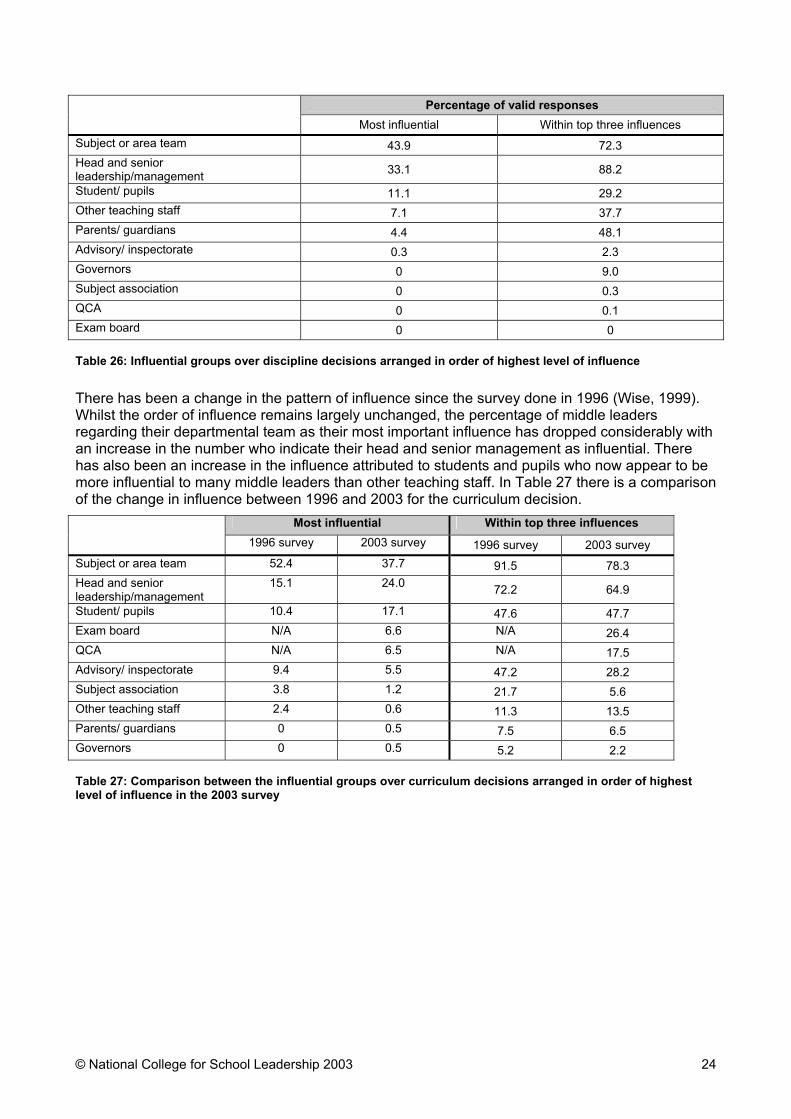
Student/ pupils 11.1 29.2 Other teaching staff 7.1 37.7 Parents/ guardians 4.4 48.1 Advisory/ inspectorate 0.3 2.3 Governors 0 9.0 Subject association 0 0.3 QCA 0 0.1 Exam board 0 0 Table 26: Influential groups over discipline decisions arranged in order of highest level of influence
There has been a change in the pattern of influence since the survey done in 1996 (Wise, 1999). Whilst the order of influence remains largely unchanged, the percentage of middle leaders regarding their departmental team as their most important influence has dropped considerably with an increase in the number who indicate their head and senior management as influential. There has also been an increase in the influence attributed to students and pupils who now appear to be more influential to many middle leaders than other teaching staff. In Table 27 there is a comparison of the change in influence between 1996 and 2003 for the curriculum decision.
Most influential Within top three influences 1996 survey 2003 survey 1996 survey 2003 survey
Subject or area team 52.4 37.7 91.5 78.3 Head and senior leadership/management
15.1 24.0 72.2 64.9
Student/ pupils 10.4 17.1 47.6 47.7 Exam board N/A 6.6 N/A 26.4 QCA N/A 6.5 N/A 17.5 Advisory/ inspectorate 9.4 5.5 47.2 28.2 Subject association 3.8 1.2 21.7 5.6 Other teaching staff 2.4 0.6 11.3 13.5 Parents/ guardians 0 0.5 7.5 6.5 Governors 0 0.5 5.2 2.2 Table 27: Comparison between the influential groups over curriculum decisions arranged in order of highest level of influence in the 2003 survey

National College for School Leadership
25
However the different groups surveyed in 2003 may have had an influence on this change. Considering the curriculum decision again, the first three influential groups are considered along with the category of middle leader in Table 28.
Head of a major single
subject
Head of an area where
the subjects
are closely related
Head of an area
where the subjects are not closely related
Cross- curricular
co-ordinator
Special educational needs co-ordinator
Pastoral leader
Subject or area team 45.1 46.5 57.0 29.1 24.6 27.6
Head and senior leadership/management 8.6 17.1 15.1 19.0 39.4 42.1
Student/ pupils 14.0 12.0 17.4 26.6 22.1 15.9
Table 28: Comparison between the top three most influential groups over curriculum decisions against the category of middle leader.
It can be seen in Table 28 that the influence of the subject area team varies across the categories. It is possible that the more diffuse team identified earlier in the responsibility areas of the cross-curricular co-ordinators, SENCOs and pastoral leaders leads them to accept influence from elsewhere. Also these middle leaders had a large number of staff whose main teaching commitment was elsewhere and who may not be subject specialists therefore having less legitimacy for influence. These are all matters that would bear further examination. In the next section we examine the impact of these changes on the role that middle leaders see themselves fulfilling. Do they follow what they perceive to be the expectations of their senior managers, or are those of their team members more influential?
Expectations of the role The concept of role can be defined as what an individual – the ‘role holder’ – understands their job to be. One aspect of this is derived from formal requirements such as their job description, but much more important is what the role holder perceives as the expectations of a range of different people with whom they interact when carrying out their job – their ‘role set’ – as examined above in the influences section. Some of these expectations might be stated explicitly, whilst others are inferred by the role holder from the actions of members of their role set. Some members of the role set will not be aware that they are communicating role expectations and the role holder may not always view others’ expectations as legitimate. ‘Non-legitimate’ expectations will have very little influence on the enacted role. Some of the expectations are those that the role holder brought with them to the post through their experience, values and beliefs. Their own personality will also have an impact on how they enact the role given the various expectations for example their willingness to please others.
Clearly, when an individual is subject to a range of expectations, deriving from formal requirements, a range of colleagues, and their personal experience and value system, it is likely that there will be conflicting expectations that the role holder has to resolve in order for them to be able carry out their work. This is referred to as ‘role strain’ or ‘role conflict’, and can create significant problems for the role holder.

National College for School Leadership
26
Within the questionnaire there were a number of ways in which we tried to gather information about how the middle leaders perceived their role. They were asked to indicate against a list of tasks commonly carried out by the different categories of middle leaders those which they perceived as expected of them by their head or senior leaders and managers. They were also asked to indicate on an identical list those that they perceived as their responsibility and on yet another identical list those they perceived as expected by their team members. It is often the case that the expectations of the various groups within the role holder’s role set (influential groups) are not compatible. This is known as role conflict or role strain depending on the perspective. It is this data that we will look at in this section. In a later section we will look at the data related to which tasks the middle leaders gave a high priority from a list of tasks that they might be expected to do. The heads or principals were also asked to indicate on an identical list those tasks that they expected of their middle leaders. Not all heads returned this sheet so the number of valid responses on this aspect is lower but there are still 807 responses to compare. The tasks are grouped here according to the classification developed by Wise (1999) which categorises tasks into four quadrants created by using two axes, one moving from tasks having an individual perspective to those having a wider community perspective and the other moving from paperwork type tasks to those involving people. This quadrant is illustrated in Figure 1.
Figure 1: Classification of tasks from Wise (1999) The tasks were not presented in the questionnaire divided in this way. They were mixed with no indication of the classification. Other research would suggest (Wise, 1999) that, when asked, the middle leaders are most likely to state that the academic and educational tasks are at the centre of their role but when pushed for time are most likely to complete the administrative tasks because these are the most visible aspects of their role to others outside their area.
Tasks about wider community
Tasks about people
Tasks about individuals
Tasks about things
Academic
Educational Managerial
Administrative
National College for School Leadership
27
The respondents also explained that some of the tasks were delegated but accepted that they remained their responsibility:
I delegate some of these but ultimately they are my responsibility. Some of these are delegated with consent of person delegated to do them. My departmental colleagues expect to be involved in most of these activities so responsibility is shared. While my team see that I have overall responsibility for these areas they do not regard them as my job. I delegate, they have career development, but the final responsibility is mine.
There was also one comment that related to the unreasonable expectations of others: You missed walking on water which my colleagues expect me to as does my senior colleagues.
Academic tasks
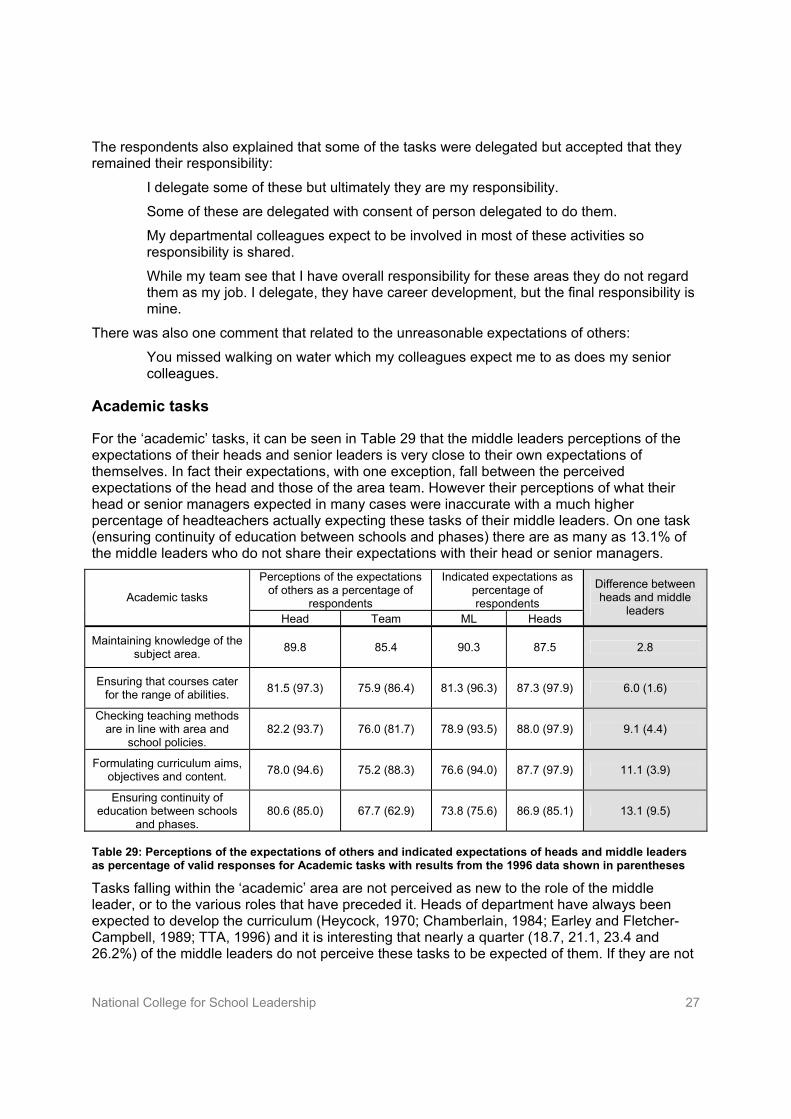
For the ‘academic’ tasks, it can be seen in Table 29 that the middle leaders perceptions of the expectations of their heads and senior leaders is very close to their own expectations of themselves. In fact their expectations, with one exception, fall between the perceived expectations of the head and those of the area team. However their perceptions of what their head or senior managers expected in many cases were inaccurate with a much higher percentage of headteachers actually expecting these tasks of their middle leaders. On one task (ensuring continuity of education between schools and phases) there are as many as 13.1% of the middle leaders who do not share their expectations with their head or senior managers.
Perceptions of the expectations of others as a percentage of
respondents
Indicated expectations as percentage of respondents Academic tasks
Head Team ML Heads
Difference between heads and middle
leaders
Maintaining knowledge of the subject area. 89.8 85.4 90.3 87.5 2.8
Ensuring that courses cater for the range of abilities. 81.5 (97.3) 75.9 (86.4) 81.3 (96.3) 87.3 (97.9) 6.0 (1.6)
Checking teaching methods are in line with area and
school policies. 82.2 (93.7) 76.0 (81.7) 78.9 (93.5) 88.0 (97.9) 9.1 (4.4)
Formulating curriculum aims, objectives and content. 78.0 (94.6) 75.2 (88.3) 76.6 (94.0) 87.7 (97.9) 11.1 (3.9)
Ensuring continuity of education between schools
and phases. 80.6 (85.0) 67.7 (62.9) 73.8 (75.6) 86.9 (85.1) 13.1 (9.5)
Table 29: Perceptions of the expectations of others and indicated expectations of heads and middle leaders as percentage of valid responses for Academic tasks with results from the 1996 data shown in parentheses
Tasks falling within the ‘academic’ area are not perceived as new to the role of the middle leader, or to the various roles that have preceded it. Heads of department have always been expected to develop the curriculum (Heycock, 1970; Chamberlain, 1984; Earley and Fletcher-Campbell, 1989; TTA, 1996) and it is interesting that nearly a quarter (18.7, 21.1, 23.4 and 26.2%) of the middle leaders do not perceive these tasks to be expected of them. If they are not
National College for School Leadership
28
responsible for checking that the teaching in their department or area is in line with area and school policies then who is?
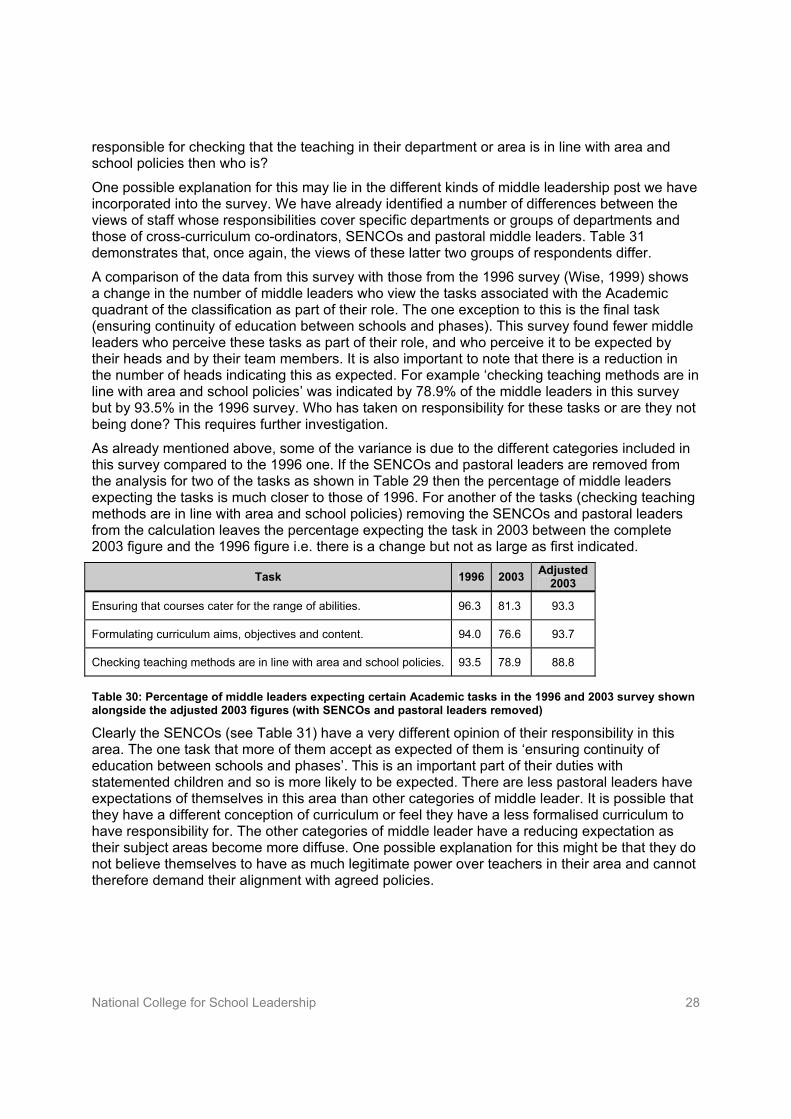
One possible explanation for this may lie in the different kinds of middle leadership post we have incorporated into the survey. We have already identified a number of differences between the views of staff whose responsibilities cover specific departments or groups of departments and those of cross-curriculum co-ordinators, SENCOs and pastoral middle leaders. Table 31 demonstrates that, once again, the views of these latter two groups of respondents differ. A comparison of the data from this survey with those from the 1996 survey (Wise, 1999) shows a change in the number of middle leaders who view the tasks associated with the Academic quadrant of the classification as part of their role. The one exception to this is the final task (ensuring continuity of education between schools and phases). This survey found fewer middle leaders who perceive these tasks as part of their role, and who perceive it to be expected by their heads and by their team members. It is also important to note that there is a reduction in the number of heads indicating this as expected. For example ‘checking teaching methods are in line with area and school policies’ was indicated by 78.9% of the middle leaders in this survey but by 93.5% in the 1996 survey. Who has taken on responsibility for these tasks or are they not being done? This requires further investigation. As already mentioned above, some of the variance is due to the different categories included in this survey compared to the 1996 one. If the SENCOs and pastoral leaders are removed from the analysis for two of the tasks as shown in Table 29 then the percentage of middle leaders expecting the tasks is much closer to those of 1996. For another of the tasks (checking teaching methods are in line with area and school policies) removing the SENCOs and pastoral leaders from the calculation leaves the percentage expecting the task in 2003 between the complete 2003 figure and the 1996 figure i.e. there is a change but not as large as first indicated.
Task 1996 2003 Adjusted 2003
Ensuring that courses cater for the range of abilities. 96.3 81.3 93.3
Formulating curriculum aims, objectives and content. 94.0 76.6 93.7
Checking teaching methods are in line with area and school policies. 93.5 78.9 88.8
Table 30: Percentage of middle leaders expecting certain Academic tasks in the 1996 and 2003 survey shown alongside the adjusted 2003 figures (with SENCOs and pastoral leaders removed)
Clearly the SENCOs (see Table 31) have a very different opinion of their responsibility in this area. The one task that more of them accept as expected of them is ‘ensuring continuity of education between schools and phases’. This is an important part of their duties with statemented children and so is more likely to be expected. There are less pastoral leaders have expectations of themselves in this area than other categories of middle leader. It is possible that they have a different conception of curriculum or feel they have a less formalised curriculum to have responsibility for. The other categories of middle leader have a reducing expectation as their subject areas become more diffuse. One possible explanation for this might be that they do not believe themselves to have as much legitimate power over teachers in their area and cannot therefore demand their alignment with agreed policies.

National College for School Leadership
29
Task Head of a major single
subject
Head of an area where
the subjects
are closely related
Head of an area
where the subjects are not closely related
Cross- curricular
co-ordinator
Special educational needs co-ordinator
Pastoral leader
Maintaining knowledge of the subject area. 96.6 94.4 98.0 94.2 90.6 69.9
Ensuring that courses cater for the range of abilities. 93.9 93.7 94.9 88.3 75.9 48.2
Checking teaching methods are in line with area and school policies. 91.2 89.0 86.9 82.5 54.0 79.0
Formulating curriculum aims, objectives and content. 95.7 92.7 90.9 93.2 60.6 40.7
Ensuring continuity of education between schools and phases. 73.5 65.1 63.6 72.8 85.0 73.0
Table 31: Percentage of the different categories of middle leader who indicated that they expected the tasks in the ‘academic’ quadrant
Administrative tasks
The tasks in the questionnaire that represented the administrative quadrant cover issues of resourcing and record-keeping. There is a tendency for the middle leaders expectations to align with those of their team with a small percentage more expecting this task of themselves than perceive it as expected by their team members. There is one exception and that is the task ‘ensuring teaching rooms are suitable and offer adequate resources’ which only 61.9% perceive as expected by their team and yet 72.3% view this as part of their role.
Perceptions of the expectations
of others as a percentage of respondents
Indicated expectations as percentage of respondents Administrative Tasks
Head Team ML Heads
Difference between heads and middle
leaders
Making decisions about what resources to buy. 91.0 (95.5) 87.6 (86.9) 84.9 (94.0) 90.5 (100.0) 5.6 (6.0)
Maintaining records of schemes of work and minutes
of meetings. 91.8 (98.2) 79.5 (93.0) 83.7 (92.6) 88.0 (97.9) 4.3 (5.3)
Maintaining records of classroom observations. 84.8 74.6 75.6 87.7 12.1
Organising the storage of area resources. 86.5 (92.3) 66.8 (78.9) 74.2 (81.1) 81.2 (97.9) 7.0 (16.8)
Ensuring teaching rooms are suitable and offer adequate
resources. 76.2 (90.5) 61.9 (80.8) 72.3 (81.6) 80.1 (95.7) 7.8 (14.1)
Table 32: Perceptions of the expectations of others and indicated expectations of heads and middle leaders as percentage of valid responses for administrative tasks with results from the 1996 data shown in parentheses
This is an area where the responsibilities are likely to change with the implementation of the new workload agreement, under which many routine administrative tasks will be given to support or ancillary staff. The difference between the heads’ actual expectation and the middle leaders’
National College for School Leadership
30
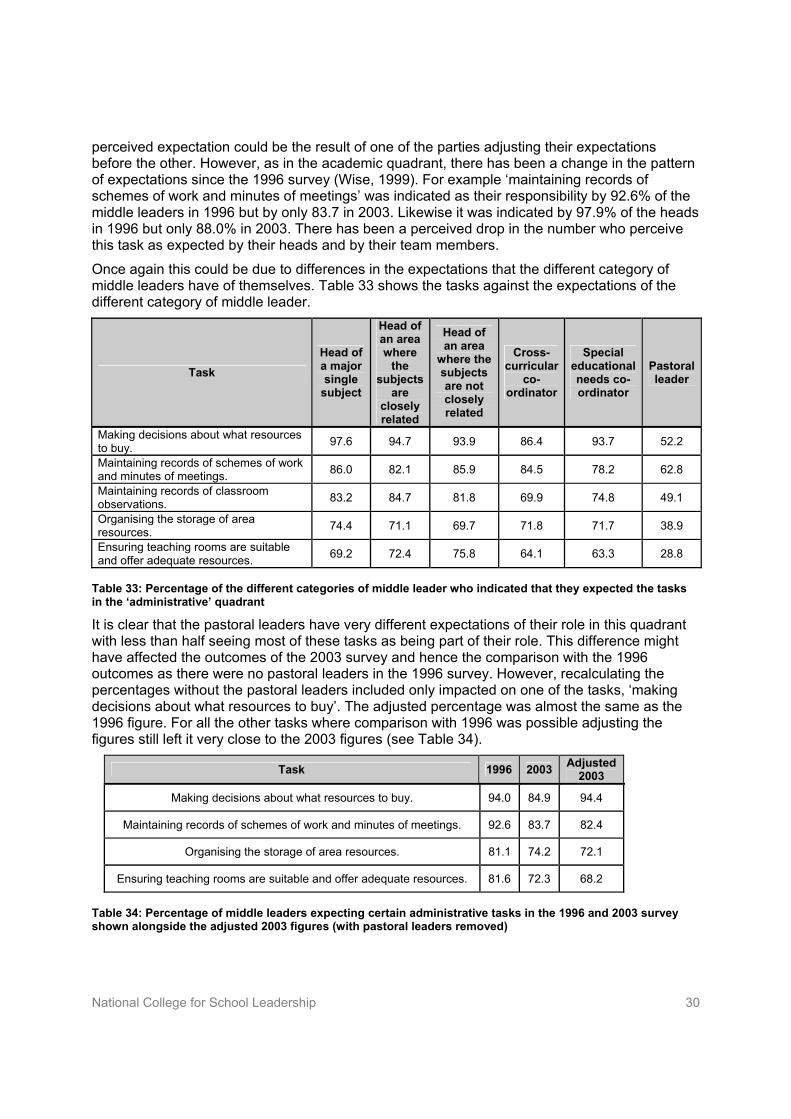
perceived expectation could be the result of one of the parties adjusting their expectations before the other. However, as in the academic quadrant, there has been a change in the pattern of expectations since the 1996 survey (Wise, 1999). For example ‘maintaining records of schemes of work and minutes of meetings’ was indicated as their responsibility by 92.6% of the middle leaders in 1996 but by only 83.7 in 2003. Likewise it was indicated by 97.9% of the heads in 1996 but only 88.0% in 2003. There has been a perceived drop in the number who perceive this task as expected by their heads and by their team members. Once again this could be due to differences in the expectations that the different category of middle leaders have of themselves. Table 33 shows the tasks against the expectations of the different category of middle leader.
Task Head of a major single
subject
Head of an area where
the subjects
are closely related
Head of an area
where the subjects are not closely related
Cross- curricular
co-ordinator
Special educational needs co-ordinator
Pastoral leader
Making decisions about what resources to buy. 97.6 94.7 93.9 86.4 93.7 52.2
Maintaining records of schemes of work and minutes of meetings. 86.0 82.1 85.9 84.5 78.2 62.8
Maintaining records of classroom observations. 83.2 84.7 81.8 69.9 74.8 49.1
Organising the storage of area resources. 74.4 71.1 69.7 71.8 71.7 38.9
Ensuring teaching rooms are suitable and offer adequate resources. 69.2 72.4 75.8 64.1 63.3 28.8
Table 33: Percentage of the different categories of middle leader who indicated that they expected the tasks in the ‘administrative’ quadrant
It is clear that the pastoral leaders have very different expectations of their role in this quadrant with less than half seeing most of these tasks as being part of their role. This difference might have affected the outcomes of the 2003 survey and hence the comparison with the 1996 outcomes as there were no pastoral leaders in the 1996 survey. However, recalculating the percentages without the pastoral leaders included only impacted on one of the tasks, ‘making decisions about what resources to buy’. The adjusted percentage was almost the same as the 1996 figure. For all the other tasks where comparison with 1996 was possible adjusting the figures still left it very close to the 2003 figures (see Table 34).
Task 1996 2003 Adjusted 2003
Making decisions about what resources to buy. 94.0 84.9 94.4
Maintaining records of schemes of work and minutes of meetings. 92.6 83.7 82.4
Organising the storage of area resources. 81.1 74.2 72.1
Ensuring teaching rooms are suitable and offer adequate resources. 81.6 72.3 68.2
Table 34: Percentage of middle leaders expecting certain administrative tasks in the 1996 and 2003 survey shown alongside the adjusted 2003 figures (with pastoral leaders removed)

National College for School Leadership
31
Managerial tasks
Table 35 shows the reaction to the tasks in the managerial quadrant. These are the people centred tasks to do with the staff. The literature (Straker, 1984; Earley and Fletcher-Campbell, 1989; Bennett, 1991;Glover, 1994) would suggest that these are the tasks that the middle leaders do not complete and in many cases do not perceive them to be their responsibility. These are tasks that have gradually become the responsibility of the middle leader as expectations have changed over recent years and their role has changed from managing a subject to leading and managing a team. Those middle leaders who have been in post for a long time will have needed to adapt their thinking about their role to incorporate these expectations or maybe they haven’t.
Perceptions of the expectations of others as a percentage of respondents
Indicated expectations as percentage of respondents Tasks
Head Team ML Heads
Difference between heads and middle
leaders
Keeping staff within area informed of whole school
matters & encouraging debate. 91.2 (91.9) 84.4 (88.7) 88.1 (90.3) 93.2 (97.9) 5.1 (7.6)
Monitoring the teaching of staff whilst working in your area. 92.5 (95.5) 90.4 (83.6) 84.8 (91.7) 91.6 (95.7) 6.8 (4.0)
Inducting new staff. 88.3 (91.4) 81.3 (86.4) 83.7 (88.0) 95.0 (93.6) 11.3 (5.6)
Leading and/or promoting the development of area staff’s
professional abilities. 86.3 (92.3) 80.5 (82.2) 82.1 (88.9) 93.1 (97.9) 11.0 (9.0)
Providing support for colleagues facing disciplinary problems in
their teaching. 67.4 67.0 73.7 87.7 14.0
Table 35: Perceptions of the expectations of others and indicated perceptions of heads and middle leaders as percentage of valid responses for Managerial tasks with results from the 1996 data shown in parentheses
There is in fact, unlike in earlier quadrants, very little change from the survey in 1996. For example ‘keeping staff within area informed of whole school matters and encouraging debate’ was indicated by 91.7% of middle leaders in 1996 and only 88.1% in 2003. Their heads have also reduced their expectations as there was 95.7% expected this task to be completed as part of the middle leaders’ role in 1996 but only 93.2% in 2003. These changes are very small and not what might have been expected, given the effort and publicity that has been given to the leadership and management needed from teachers working at this level within the school’s hierarchy.
There are some interesting variations shown in Table 35. For example, despite 90.4% of the middle leaders perceiving that their team expected them to monitor teaching and 92.5% perceiving their head also expected this only 84.8% saw it as their responsibility. In fact their perceptions of their head’s viewpoint were very accurate.
There was a big difference between the middle leaders perceptions and reality with regard to the induction of new staff which the heads were almost unanimous (91%) in expecting. It is possible that there is a difference in perception about what this task was to encompass as most schools have an induction process which includes an introduction to whole school systems which the middle leaders might reasonably expect to be someone else’s responsibility and hence not indicate. It will be important for definitions of induction and boundaries of responsibility to be clarified.

National College for School Leadership
32
The task ‘providing support for colleagues facing disciplinary problems in their teaching’ highlighted yet another area of potentially weak communication of role. Just over one quarter of middle leaders (26.3%) do not perceive this task as being their responsibility and 33% do not perceive it as expected by their team. However there are 20.3% who hold a different perception of their responsibility for this area to that they perceive their head has; whilst only 67.4% perceive this as expected by their head and senior management, 87.7% of their heads expected this of the middle leaders. Is this difference related to the category of middle leader? Table 36 considers this along with the other managerial tasks.
Task Head of a
major single subject
Head of an area
where the subjects
are closely related
Head of an area
where the subjects are not closely related
Cross- curricular
co-ordinator
Special educational needs co-ordinator
Pastoral leader
Keeping staff within area informed of whole school matters and encouraging debate. 84.8 80.4 84.8 71.8 90.0 86.3
Monitoring the teaching of staff whilst working in your area. 98.5 96.7 97.0 84.5 87.8 74.3
Inducting new staff. 76.8 83.4 79.8 68.9 89.5 78.3
Leading and/or promoting the development of area staff’s professional abilities. 85.7 84.7 77.8 77.7 85.8 61.9
Providing support for colleagues facing disciplinary problems in their teaching. 77.4 76.4 69.7 55.3 56.7 61.5
Table 36: Percentage of the different categories of middle leader who indicated that they expected the tasks in the ‘managerial’ quadrant
Once again it can be seen that the more diffuse the middle leaders’ responsibility the less likely they are to see ‘providing support for colleagues facing disciplinary problems in their teaching’ as their responsibility. It is possible that the cross-curricular co-ordinator would expect the middle leader of the subject within which their area of responsibility was being covered to offer the support egg where ICT is being taught through English the head of English would be responsible for the support. Likewise with the SENCO although they might expect to offer support where the student was one with whom they had joint responsibility through the Special Needs Register for example. There are two tasks (‘monitoring the teaching of staff whilst working in your area’ and ‘leading and/or promoting the development of area staff’s professional abilities’) where a number of the pastoral leaders can be seen to have different expectations to the other middle leaders. The first of these has an impact on the overall percentage and if this is recalculated ignoring the pastoral leaders’ expectations it is 93.3% and much closer to the 1996 survey figure. For the other task the elimination of the pastoral leaders has very little impact on the overall percentage.

National College for School Leadership
33
Perceptions of the expectations of others as
a percentage of respondents
Indicated expectations as percentage of respondents Educational Tasks
Head Team ML Heads
Difference between heads
and middle leaders
Organising the testing of pupil attainment. 85.5 (91.9) 80.8 (79.3) 80.7 (86.6) 85.7 (97.9) 5.0 (11.3)
Providing support to pupils facing personal difficulties that affect their
school work and behaviour. 80.1 73.2 75.0 70.6 -4.4
Monitoring classes’ progress through syllabuses or schemes of
work. 78.8 (92.3) 76.8 (82.6) 74.0 (91.7) 90.2 (100.0) 16.2 (8.3)
Deployment of pupils into teaching groups. 75.3 (84.1) 71.3 (82.6) 73.4 (83.4) 87.8 (100.0) 14.4 (16.6)
Implementing a homework policy. 77.0 (90.0) 66.4 (72.8) 64.0 (80.2) 95.2 (100.0) 31.2 (19.8)
Table 37: Perceptions of the expectations of others and indicated perceptions of heads and middle leaders as percentage of valid responses for Educational tasks with results from the 1996 data shown in parentheses
Table 37 shows the perceptions and actual expectations of middle leaders for the educational tasks. This quadrant covers those tasks that are to do with the individual students, the person side of the role. This is the area that in many ways the middle leader will have been trained for through their qualification as a teacher, it is much closer to what many would consider the core task. The expectations that the middle leaders have of themselves is very closely aligned to those they perceive their team members having of them. Whilst there was virtual agreement about the ‘organising the testing of pupil attainment’ we found that not as many heads expected their middle leaders to be involved in the second task, ‘providing support to pupils facing personal difficulties that affect their school work and behaviour’, as the middle leaders perceived. There has been a reduction in the indicated number of middle leaders who expect these tasks to form part of their role over the 1996 survey (Wise, 1999). In 1996 ‘monitoring classes’ progress through syllabuses or schemes of work’ was indicated as part of their role by 91.7% of middle leaders and 100% of their heads. In 2003 the figures are 74.0 and 90.2% respectively. There has been a smaller reduction in their perceived expectations of the team members and senior management.
For the remainder of the tasks in this quadrant in this survey there was a large difference between the expectations of the middle leaders and the heads. Many middle leaders were not aware that their heads expected these tasks of them. It is possible again that there could be differences between the different categories of middle leader.
Table 38 demonstrates that there are some huge differences in expectation of their role between the leaders of the more academic subjects and the SENCOs or pastoral leaders and sometimes the cross-curricular co-ordinators. The major single subject leaders clearly do expect to monitor classes’ progress and in fact a high number of the first four categories see this as being part of their role. These categories are in much better agreement with their heads (90.2% indicated this as expected). However, it might be difficult for a SENCO, often with few whole classes to teach, to see how they can monitor classes’ progress. On the other hand there is an argument that says they need to do this on a wider scale so that they know how and when best to help their students.

National College for School Leadership
34
Head of a major single
subject
Head of an area where
the subjects
are closely related
Head of an area
where the subjects are not closely related
Cross- curricular
co-ordinator
Special educational needs co-ordinator
Pastoral leader
Organising the testing of pupil attainment. 87.8 89.7 77.8 74.8 93.4 41.2
Providing support to pupils facing personal difficulties that affect their
school work and behaviour. 58.2 54.5 65.7 62.1 94.2 94.7
Monitoring classes’ progress through syllabuses or schemes of work. 97.0 93.7 88.9 81.6 55.9 52.7
Deployment of pupils into teaching groups. 89.9 83.4 64.6 56.3 59.1 59.7
Implementing a homework policy. 81.1 84.1 82.8 61.2 39.1 62.4
Table 38: Percentage of the different categories of middle leader who indicated that they expected the tasks in the ‘educational’ quadrant
The pastoral leader might be in a different position in different schools. Certainly where they are also leader of a ‘pastoral curriculum’ which includes work done in tutorial or form time they should have the same responsibility as any other middle leader but clearly they do not see it that way. For ‘deployment of pupils into teaching groups’ there is again a marked difference between the different categories of middle leader. Only the first two categories have a similar number of middle leaders as heads (87.8%) selecting this as an expected part of their role. This time the category ‘head of an area where the subjects are not closely related’ has a low percentage of middle leaders who see this as their responsibility. This could be because these are frequently disparate subjects who have a number of subject leaders within them who might carry out this task. It is also possible that the nature of these areas is that they are made up of a number of small subjects such that the groups are decided by timetabling decisions rather than within the area itself. It is easy to see how the cross-curricular co-ordinator would simply have to work with the choices made by others as with the SENCO although some SENCOs would expect to have a say in the placing of a child with special needs within a class.
‘Providing support to pupils facing personal difficulties that affect their school work and behaviour’ is an area that the SENCOs see as being quite clearly within their perception of their role. This is understandable with so much of their role being about students who do not fit the norm and have difficulties in one way or another. The pastoral leaders likewise consider this an integral part of their role. ‘Implementing a homework policy’ once again shows a large difference across the six categories of middle leader and would appear to be a task where the middle leaders are not fully aware or are ignoring their head’s opinion because 95.2% of the heads that responded indicated this as expected of their middle leaders. Whilst a large number of middle leaders from the first three categories accept this there is still a big difference. It may be that in many schools the cross-curricular co-ordinator and the SENCO do not directly set homework, however, certainly the

National College for School Leadership
35
SENCO would have a responsibility to enable the teachers to implement the policy in an appropriate way for the students within their area. Equally the pastoral leader might not actually be setting homework but might be involved in aiding the implementation by overseeing the checking of homework diaries or a similar task.
The differences across the categories are sufficient to effect the overall percentage. It is not sensible to remove the pastoral leaders expectations or the SENCOs expectations in every case but Table 39 shows the effect of removing them on the apparent change in opinion of the academic middle leaders.
Task 1996 2003 Adjusted
2003 Removed
Organising the testing of pupil attainment. 86.6 80.7 88.1 pastoral
Monitoring classes’ progress through syllabuses or schemes of work. 91.7 74.0 92.9 pastoral & SENCO
Implementing a homework policy. 80.2 64.0 76.2 SENCO
Table 39: Percentage of middle leaders expecting certain educational tasks in the 1996 and 2003 survey shown alongside the adjusted 2003 figures
It can been seen that in these three tasks there has not been such a dramatic change in the expectations of the middle leaders once the distorting effect of the pastoral leaders and SENCOs have been removed.
Overall there has been a drop in the number of tasks that appear to be expected by both the middle leaders and their heads compared to the 1996 survey. It is not possible to say whether there has been a move to reduce the number of tasks expected of middle leaders to ‘declutter’ the role and reduce the amount of role strain or whether these tasks have been removed but replaced by others. These tasks would appear to be as relevant to the role today as they were in 1996 however and this needs further investigation.
Priorities of the middle leaders The middle leaders were also given a list of 12 tasks and asked to rank them in importance as if it was November in a normal school year. There were various comments about there never being a normal school year and many being of equal importance but the hope was that when pressured to attach a ranking to a list of tasks those that the middle leader believed were the most important part of their role would be ranked the highest. However before looking at the statistics it is worth considering some of the comments of the respondents.
These change day-to-day. A member of staff phoning in sick changes everything. What was planned for non-contact time gets thrown out of the window. Discipline problems generated by the absence of staff can lead to lunch hours being lost, letters having to be written, pastoral staff consulted etc. The admin associated with modular exams – entries, re-entries, absences, co-ordinating Y10 and Y11 entries and re-entries, analysis of results, is ridiculous. Constant syllabus changes mean that schemes of work are always out of date are never fully developed. Ludicrous statistical analysis are use to pressurise us. The change from Free School Meals percentages to KS2 attainment as a basis for measuring value added at KS3 moved us from the top 5% of schools to be bottom 5% in one go. The biggest frustration is the constant interference and comment from outside agencies and agents…
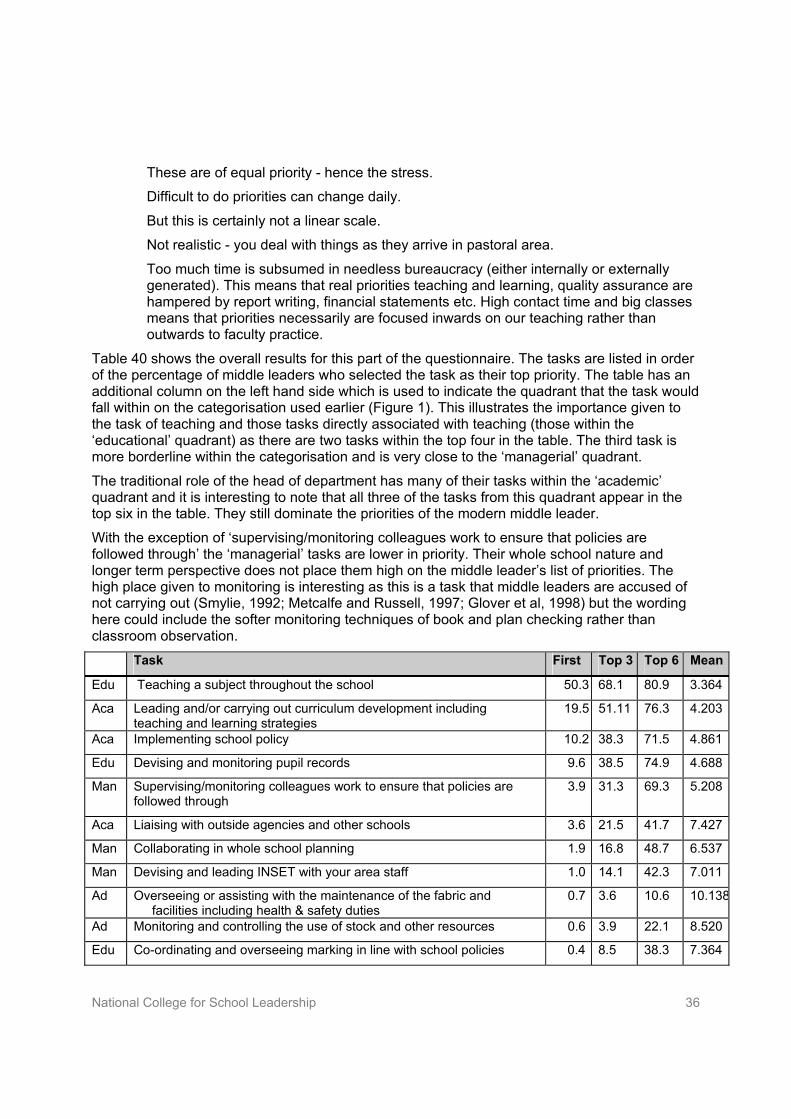
National College for School Leadership
36
These are of equal priority - hence the stress. Difficult to do priorities can change daily.
But this is certainly not a linear scale. Not realistic - you deal with things as they arrive in pastoral area.
Too much time is subsumed in needless bureaucracy (either internally or externally generated). This means that real priorities teaching and learning, quality assurance are hampered by report writing, financial statements etc. High contact time and big classes means that priorities necessarily are focused inwards on our teaching rather than outwards to faculty practice.
Table 40 shows the overall results for this part of the questionnaire. The tasks are listed in order of the percentage of middle leaders who selected the task as their top priority. The table has an additional column on the left hand side which is used to indicate the quadrant that the task would fall within on the categorisation used earlier (Figure 1). This illustrates the importance given to the task of teaching and those tasks directly associated with teaching (those within the ‘educational’ quadrant) as there are two tasks within the top four in the table. The third task is more borderline within the categorisation and is very close to the ‘managerial’ quadrant.
The traditional role of the head of department has many of their tasks within the ‘academic’ quadrant and it is interesting to note that all three of the tasks from this quadrant appear in the top six in the table. They still dominate the priorities of the modern middle leader. With the exception of ‘supervising/monitoring colleagues work to ensure that policies are followed through’ the ‘managerial’ tasks are lower in priority. Their whole school nature and longer term perspective does not place them high on the middle leader’s list of priorities. The high place given to monitoring is interesting as this is a task that middle leaders are accused of not carrying out (Smylie, 1992; Metcalfe and Russell, 1997; Glover et al, 1998) but the wording here could include the softer monitoring techniques of book and plan checking rather than classroom observation. Task First Top 3 Top 6 Mean
Edu Teaching a subject throughout the school 50.3 68.1 80.9 3.364
Aca Leading and/or carrying out curriculum development including teaching and learning strategies
19.5 51.11 76.3 4.203
Aca Implementing school policy 10.2 38.3 71.5 4.861
Edu Devising and monitoring pupil records 9.6 38.5 74.9 4.688
Man Supervising/monitoring colleagues work to ensure that policies are followed through
3.9 31.3 69.3 5.208
Aca Liaising with outside agencies and other schools 3.6 21.5 41.7 7.427
Man Collaborating in whole school planning 1.9 16.8 48.7 6.537
Man Devising and leading INSET with your area staff 1.0 14.1 42.3 7.011
Ad Overseeing or assisting with the maintenance of the fabric and facilities including health & safety duties
0.7 3.6 10.6 10.138
Ad Monitoring and controlling the use of stock and other resources 0.6 3.9 22.1 8.520
Edu Co-ordinating and overseeing marking in line with school policies 0.4 8.5 38.3 7.364
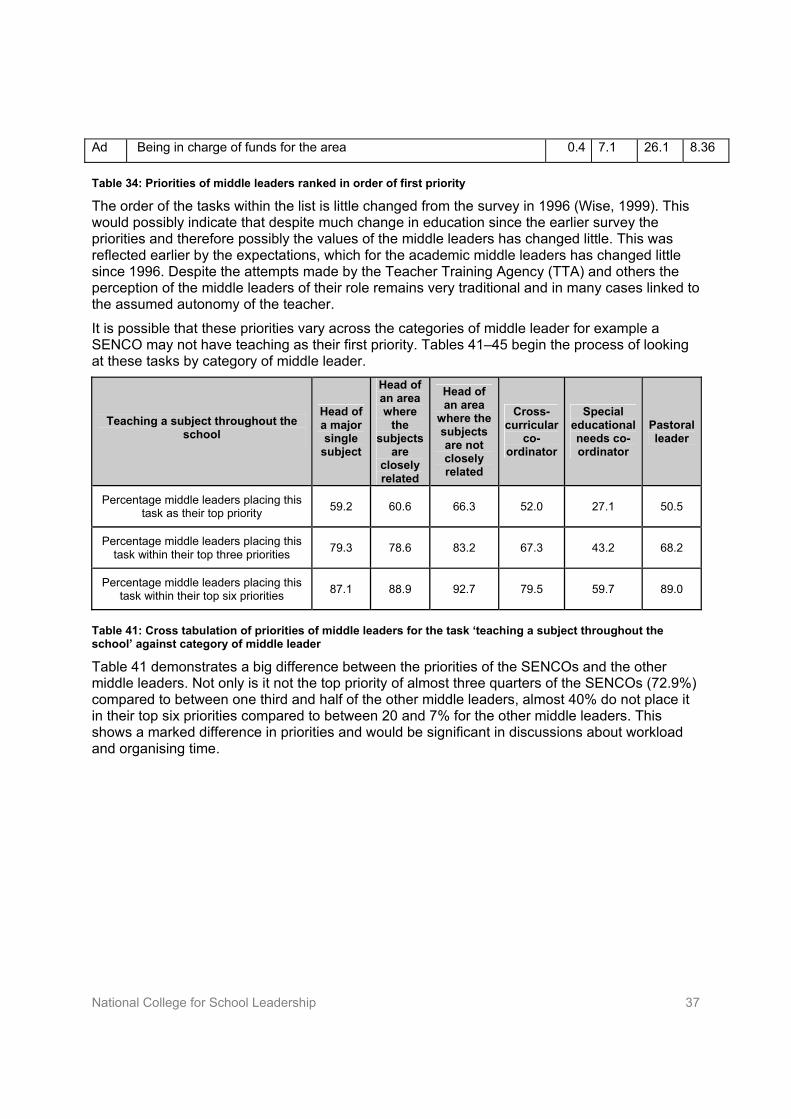
National College for School Leadership
37
Ad Being in charge of funds for the area 0.4 7.1 26.1 8.36
Table 34: Priorities of middle leaders ranked in order of first priority
The order of the tasks within the list is little changed from the survey in 1996 (Wise, 1999). This would possibly indicate that despite much change in education since the earlier survey the priorities and therefore possibly the values of the middle leaders has changed little. This was reflected earlier by the expectations, which for the academic middle leaders has changed little since 1996. Despite the attempts made by the Teacher Training Agency (TTA) and others the perception of the middle leaders of their role remains very traditional and in many cases linked to the assumed autonomy of the teacher.
It is possible that these priorities vary across the categories of middle leader for example a SENCO may not have teaching as their first priority. Tables 41–45 begin the process of looking at these tasks by category of middle leader.
Teaching a subject throughout the school
Head of a major single
subject
Head of an area where
the subjects
are closely related
Head of an area
where the subjects are not closely related
Cross- curricular
co-ordinator
Special educational needs co-ordinator
Pastoral leader
Percentage middle leaders placing this task as their top priority 59.2 60.6 66.3 52.0 27.1 50.5
Percentage middle leaders placing this task within their top three priorities 79.3 78.6 83.2 67.3 43.2 68.2
Percentage middle leaders placing this task within their top six priorities 87.1 88.9 92.7 79.5 59.7 89.0
Table 41: Cross tabulation of priorities of middle leaders for the task ‘teaching a subject throughout the school’ against category of middle leader Table 41 demonstrates a big difference between the priorities of the SENCOs and the other middle leaders. Not only is it not the top priority of almost three quarters of the SENCOs (72.9%) compared to between one third and half of the other middle leaders, almost 40% do not place it in their top six priorities compared to between 20 and 7% for the other middle leaders. This shows a marked difference in priorities and would be significant in discussions about workload and organising time.
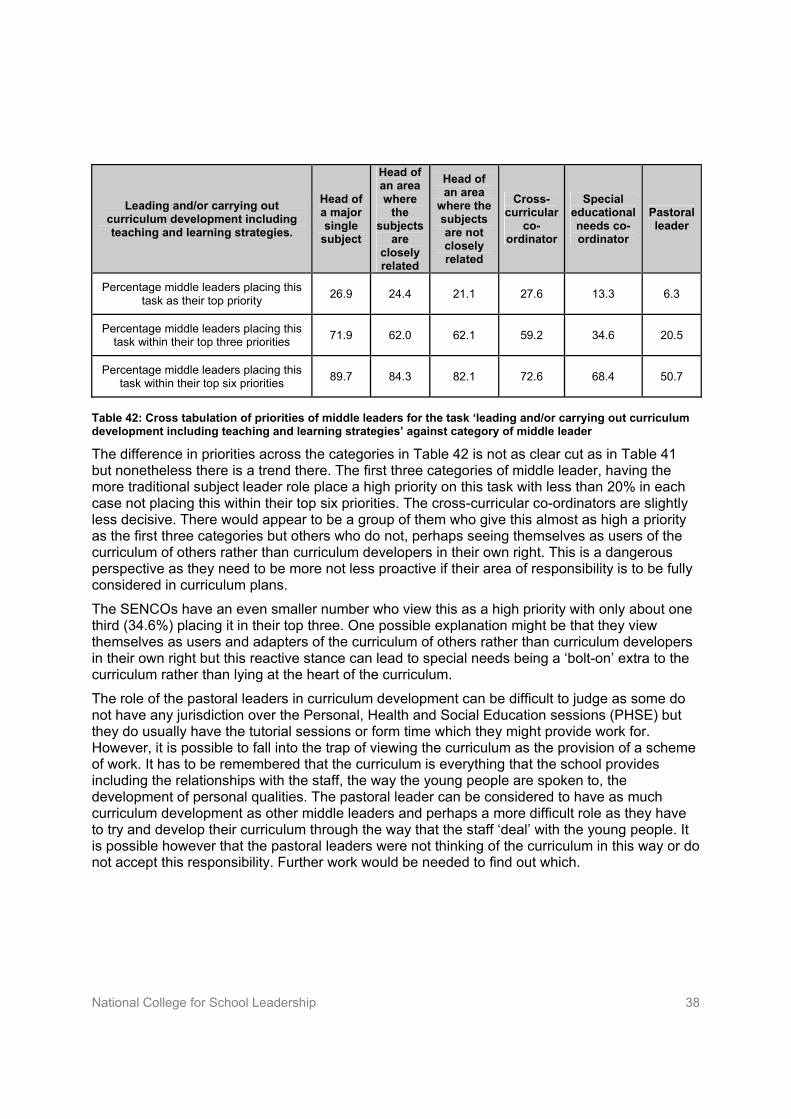
National College for School Leadership
38
Leading and/or carrying out curriculum development including teaching and learning strategies.
Head of a major single
subject
Head of an area where
the subjects
are closely related
Head of an area
where the subjects are not closely related
Cross- curricular
co-ordinator
Special educational needs co-ordinator
Pastoral leader
Percentage middle leaders placing this task as their top priority 26.9 24.4 21.1 27.6 13.3 6.3
Percentage middle leaders placing this task within their top three priorities 71.9 62.0 62.1 59.2 34.6 20.5
Percentage middle leaders placing this task within their top six priorities 89.7 84.3 82.1 72.6 68.4 50.7
Table 42: Cross tabulation of priorities of middle leaders for the task ‘leading and/or carrying out curriculum development including teaching and learning strategies’ against category of middle leader The difference in priorities across the categories in Table 42 is not as clear cut as in Table 41 but nonetheless there is a trend there. The first three categories of middle leader, having the more traditional subject leader role place a high priority on this task with less than 20% in each case not placing this within their top six priorities. The cross-curricular co-ordinators are slightly less decisive. There would appear to be a group of them who give this almost as high a priority as the first three categories but others who do not, perhaps seeing themselves as users of the curriculum of others rather than curriculum developers in their own right. This is a dangerous perspective as they need to be more not less proactive if their area of responsibility is to be fully considered in curriculum plans. The SENCOs have an even smaller number who view this as a high priority with only about one third (34.6%) placing it in their top three. One possible explanation might be that they view themselves as users and adapters of the curriculum of others rather than curriculum developers in their own right but this reactive stance can lead to special needs being a ‘bolt-on’ extra to the curriculum rather than lying at the heart of the curriculum. The role of the pastoral leaders in curriculum development can be difficult to judge as some do not have any jurisdiction over the Personal, Health and Social Education sessions (PHSE) but they do usually have the tutorial sessions or form time which they might provide work for. However, it is possible to fall into the trap of viewing the curriculum as the provision of a scheme of work. It has to be remembered that the curriculum is everything that the school provides including the relationships with the staff, the way the young people are spoken to, the development of personal qualities. The pastoral leader can be considered to have as much curriculum development as other middle leaders and perhaps a more difficult role as they have to try and develop their curriculum through the way that the staff ‘deal’ with the young people. It is possible however that the pastoral leaders were not thinking of the curriculum in this way or do not accept this responsibility. Further work would be needed to find out which.
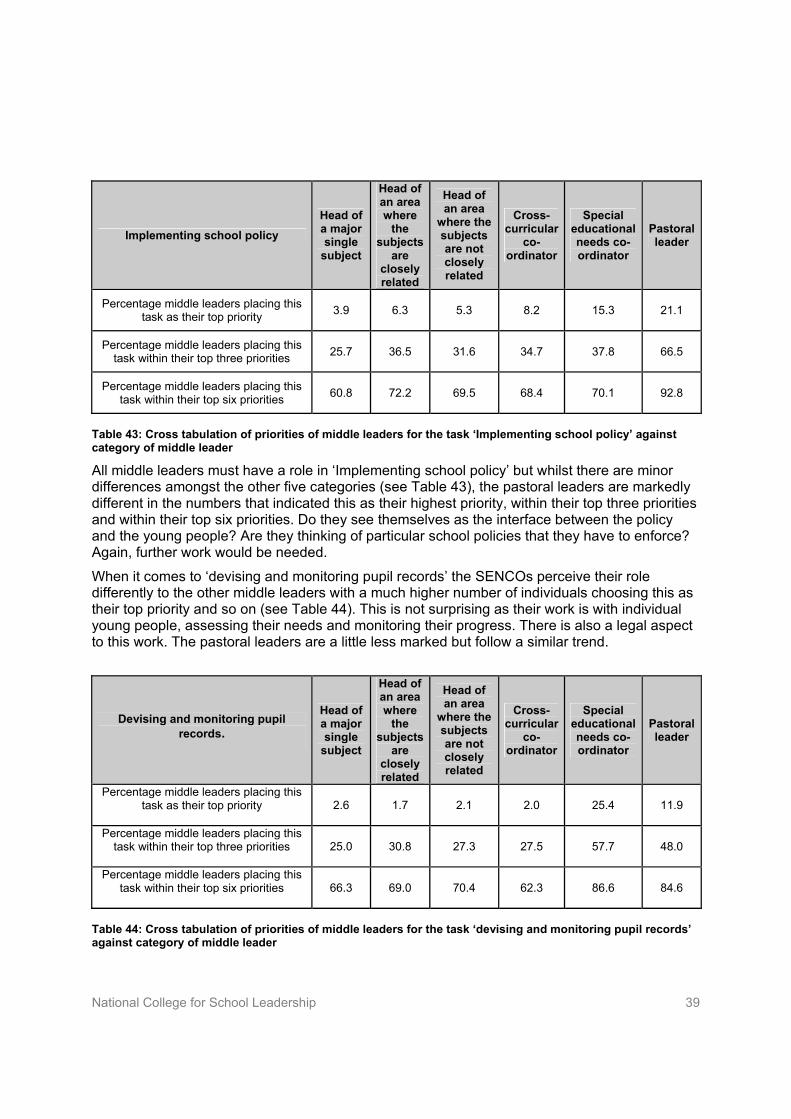
National College for School Leadership
39
Implementing school policy Head of a major single
subject
Head of an area where
the subjects
are closely related
Head of an area
where the subjects are not closely related
Cross- curricular
co-ordinator
Special educational needs co-ordinator
Pastoral leader
Percentage middle leaders placing this task as their top priority 3.9 6.3 5.3 8.2 15.3 21.1
Percentage middle leaders placing this task within their top three priorities 25.7 36.5 31.6 34.7 37.8 66.5
Percentage middle leaders placing this task within their top six priorities 60.8 72.2 69.5 68.4 70.1 92.8
Table 43: Cross tabulation of priorities of middle leaders for the task ‘Implementing school policy’ against category of middle leader
All middle leaders must have a role in ‘Implementing school policy’ but whilst there are minor differences amongst the other five categories (see Table 43), the pastoral leaders are markedly different in the numbers that indicated this as their highest priority, within their top three priorities and within their top six priorities. Do they see themselves as the interface between the policy and the young people? Are they thinking of particular school policies that they have to enforce? Again, further work would be needed.
When it comes to ‘devising and monitoring pupil records’ the SENCOs perceive their role differently to the other middle leaders with a much higher number of individuals choosing this as their top priority and so on (see Table 44). This is not surprising as their work is with individual young people, assessing their needs and monitoring their progress. There is also a legal aspect to this work. The pastoral leaders are a little less marked but follow a similar trend.
Devising and monitoring pupil records.
Head of a major single
subject
Head of an area where
the subjects
are closely related
Head of an area
where the subjects are not closely related
Cross- curricular
co-ordinator
Special educational needs co-ordinator
Pastoral leader
Percentage middle leaders placing this task as their top priority 2.6 1.7 2.1 2.0 25.4 11.9
Percentage middle leaders placing this task within their top three priorities 25.0 30.8 27.3 27.5 57.7 48.0
Percentage middle leaders placing this task within their top six priorities 66.3 69.0 70.4 62.3 86.6 84.6
Table 44: Cross tabulation of priorities of middle leaders for the task ‘devising and monitoring pupil records’ against category of middle leader
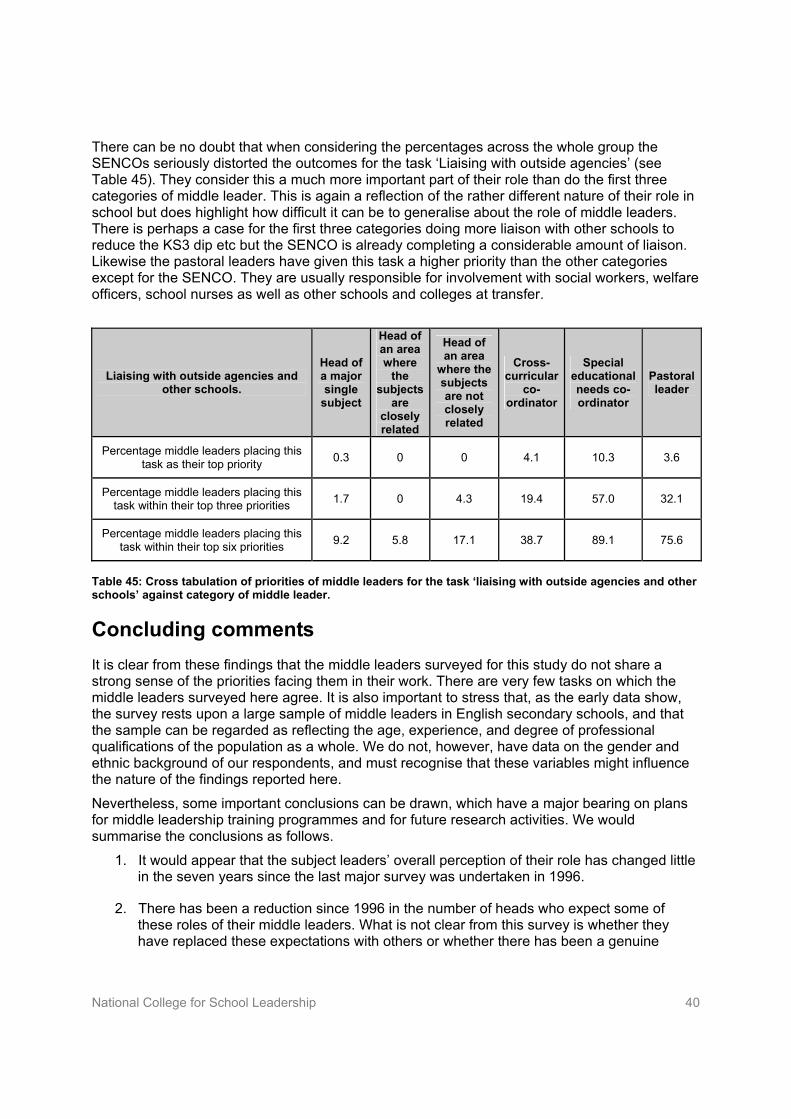
National College for School Leadership
40
There can be no doubt that when considering the percentages across the whole group the SENCOs seriously distorted the outcomes for the task ‘Liaising with outside agencies’ (see Table 45). They consider this a much more important part of their role than do the first three categories of middle leader. This is again a reflection of the rather different nature of their role in school but does highlight how difficult it can be to generalise about the role of middle leaders. There is perhaps a case for the first three categories doing more liaison with other schools to reduce the KS3 dip etc but the SENCO is already completing a considerable amount of liaison. Likewise the pastoral leaders have given this task a higher priority than the other categories except for the SENCO. They are usually responsible for involvement with social workers, welfare officers, school nurses as well as other schools and colleges at transfer.
Liaising with outside agencies and other schools.
Head of a major single
subject
Head of an area where
the subjects
are closely related
Head of an area
where the subjects are not closely related
Cross- curricular
co-ordinator
Special educational needs co-ordinator
Pastoral leader
Percentage middle leaders placing this task as their top priority 0.3 0 0 4.1 10.3 3.6
Percentage middle leaders placing this task within their top three priorities 1.7 0 4.3 19.4 57.0 32.1
Percentage middle leaders placing this task within their top six priorities 9.2 5.8 17.1 38.7 89.1 75.6
Table 45: Cross tabulation of priorities of middle leaders for the task ‘liaising with outside agencies and other schools’ against category of middle leader.
Concluding comments It is clear from these findings that the middle leaders surveyed for this study do not share a strong sense of the priorities facing them in their work. There are very few tasks on which the middle leaders surveyed here agree. It is also important to stress that, as the early data show, the survey rests upon a large sample of middle leaders in English secondary schools, and that the sample can be regarded as reflecting the age, experience, and degree of professional qualifications of the population as a whole. We do not, however, have data on the gender and ethnic background of our respondents, and must recognise that these variables might influence the nature of the findings reported here. Nevertheless, some important conclusions can be drawn, which have a major bearing on plans for middle leadership training programmes and for future research activities. We would summarise the conclusions as follows.
1. It would appear that the subject leaders’ overall perception of their role has changed little in the seven years since the last major survey was undertaken in 1996.
2. There has been a reduction since 1996 in the number of heads who expect some of these roles of their middle leaders. What is not clear from this survey is whether they have replaced these expectations with others or whether there has been a genuine
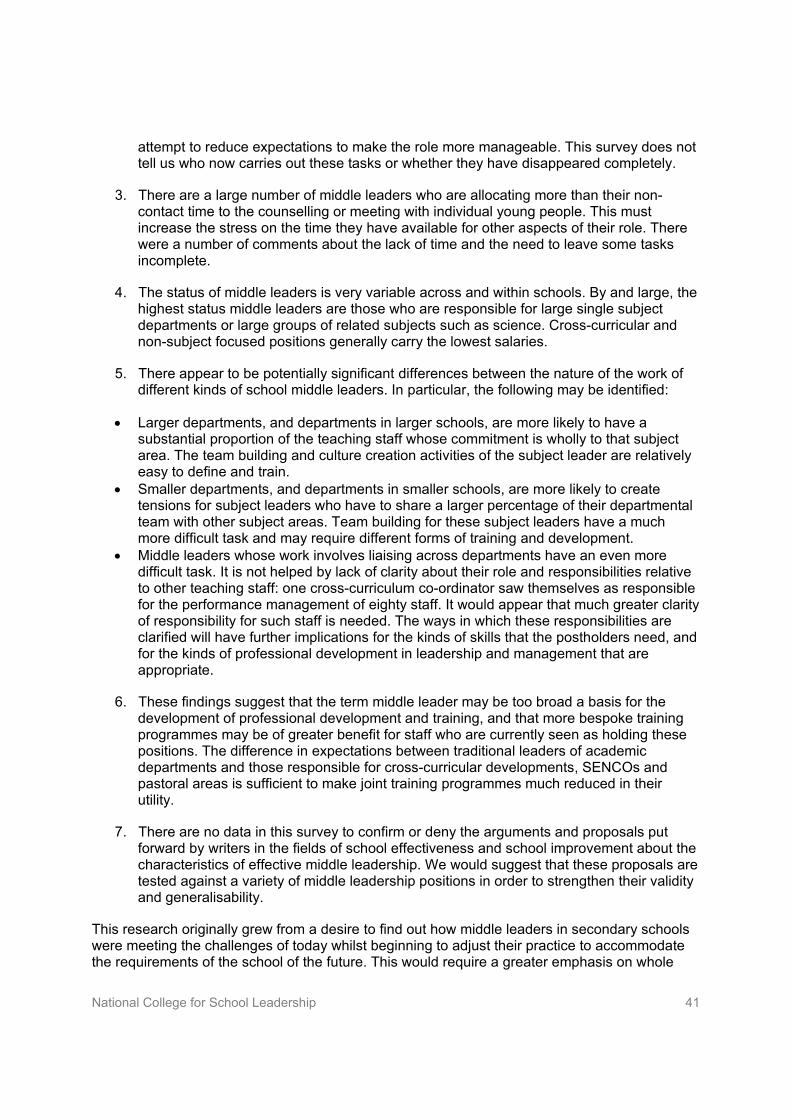
National College for School Leadership
41
attempt to reduce expectations to make the role more manageable. This survey does not tell us who now carries out these tasks or whether they have disappeared completely.
3. There are a large number of middle leaders who are allocating more than their non-contact time to the counselling or meeting with individual young people. This must increase the stress on the time they have available for other aspects of their role. There were a number of comments about the lack of time and the need to leave some tasks incomplete.
4. The status of middle leaders is very variable across and within schools. By and large, the highest status middle leaders are those who are responsible for large single subject departments or large groups of related subjects such as science. Cross-curricular and non-subject focused positions generally carry the lowest salaries.
5. There appear to be potentially significant differences between the nature of the work of different kinds of school middle leaders. In particular, the following may be identified:
• Larger departments, and departments in larger schools, are more likely to have a substantial proportion of the teaching staff whose commitment is wholly to that subject area. The team building and culture creation activities of the subject leader are relatively easy to define and train.
• Smaller departments, and departments in smaller schools, are more likely to create tensions for subject leaders who have to share a larger percentage of their departmental team with other subject areas. Team building for these subject leaders have a much more difficult task and may require different forms of training and development.
• Middle leaders whose work involves liaising across departments have an even more difficult task. It is not helped by lack of clarity about their role and responsibilities relative to other teaching staff: one cross-curriculum co-ordinator saw themselves as responsible for the performance management of eighty staff. It would appear that much greater clarity of responsibility for such staff is needed. The ways in which these responsibilities are clarified will have further implications for the kinds of skills that the postholders need, and for the kinds of professional development in leadership and management that are appropriate.
6. These findings suggest that the term middle leader may be too broad a basis for the development of professional development and training, and that more bespoke training programmes may be of greater benefit for staff who are currently seen as holding these positions. The difference in expectations between traditional leaders of academic departments and those responsible for cross-curricular developments, SENCOs and pastoral areas is sufficient to make joint training programmes much reduced in their utility.
7. There are no data in this survey to confirm or deny the arguments and proposals put forward by writers in the fields of school effectiveness and school improvement about the characteristics of effective middle leadership. We would suggest that these proposals are tested against a variety of middle leadership positions in order to strengthen their validity and generalisability.
This research originally grew from a desire to find out how middle leaders in secondary schools were meeting the challenges of today whilst beginning to adjust their practice to accommodate the requirements of the school of the future. This would require a greater emphasis on whole

National College for School Leadership
42
school development and viewing the curriculum as a whole experience rather than a segmentised subject based routine. There would also be greater emphasis on team working across and between subjects rather than balkanised subject areas. Neither of these tendencies is apparent in the survey. If anything the subjects have become more isolated and reduced their whole school emphasis. The education, training and legislation that has taken place over the last seven years appears to have had little impact on the role of middle leaders as they perceive it and there is no evidence that they are any better prepared for the school of the future which is rapidly approaching.
7 July 2003

National College for School Leadership
43
References Bennett, N D, 1991, Continuity and change in school practice: a study of the influences affecting secondary school teachers’ work and of the role of local and national policies within them, Brunel University, Department of Government, PhD thesis Chamberlain, R N, 1984, The Comprehensive Head of Department, Aspects of Education, 33, pp18–25 Earley, P and Fletcher-Campbell, F, 1989, The time to manage: department and faculty heads at work, London, NFER/Routledge
Glover, D, 1994, Ofsted and Middle Management, Research Report to Centre for Educational Policy and Management, Milton Keynes, The Open University Glover, D, Gleeson, D, Gough, G and Johnson, M, 1998, The Meaning of Management: The development needs of middle managers in secondary schools, Educational Management and Administration, 26, 3, pp279–92
Heycock, C, 1970, A Study of Some Aspects of the Internal Organisation and Management of the Mixed All-through Comprehensive School with Eight Hundred or More Pupils, Port Talbot, Sceptre Publishing Metcalfe, C and Russell, S, 1997, The Role of Subject Leaders in Monitoring the Work of Teachers in Secondary Schools: the quest for consistency? Paper presented at BERA, York, 11–14 September
Smylie, M, 1992, Teachers Reports of the Interactions with Teacher Leaders Concerning Classroom Instruction, Elementary School Journal, 93, 1, pp85–98
Straker, N, 1984, The teaching load of a head of mathematics and consequent effects on the department, School Organisation, 4, 3, pp221–29 Teacher Training Agency, 1996, Consultation Paper on Standards and a National Professional Qualification for Subject Leaders, Teacher Training Agency
Wise, C S, 1999, The Role of Academic Middle Managers in Secondary Schools, unpublished PhD thesis, University Of Leicester Wise, C, 2001, The Monitoring Role of the Academic Middle Manager in Secondary Schools, Educational Management and Administration, 29, 3, pp333–41