the future we want:clews nexus framework for global sustainable development
TRANSCRIPT

Presentation By
Abhivyakti Vajpeyi
CLEWs
ForGlobal Sustainable Development
C
L
E
W FRAMEWORK

THE FUTURE WE WANT
What kind of world would you
like to see for yourself, your children and
grandchildren in 2050?
2

Building the Common Future We Want
“Eliminating poverty and hunger; feeding, nurturing, housing, educating and employing 9 billion people; securing peace, security and freedom; and preserving the Earth’s life support systems in the next two generations”
3

Global Sustainable Development 4
Defining Sustainable Development
"Development that meets the needs of the present without compromising the ability of future generations to meet their own needs.“
— World Commission on Environment and Development’s (the Brundtland Commission)
5

Sustainable Development : Key Concepts 6

Sustainable Development : Growing Demand
The picture is simple and stark. Given growing global demands, the world’s resources of water, land and energy are relatively scarce; the use of each affects demand for the others; and the use of all affects the climate.
1.6
1.1 Billion People Without Safe Water
Billion People Without Electricity
Those, together with biofuel crops competing with food crops for land, recently caused food prices to spike beyond the reach of many of the world’s poor
• Need for more cultivated land drives deforestation.
• Energy prices are high.• Anthropogenic greenhouse gas emissions
(GHGs) continue to rise. • High oil prices in turn mean high transport
costs.
7

The Limits to Growth
In the early 1970s, the analysis was of little use to national policy makers because it had a very coarse geographical resolution.
It conceptualized & modeled the world as a whole, rather than a country or local area.
It did not account for changes in technology, knowledge or behavior; and it did not account adequately for the effects of price changes.
8

Second Approach
.Second approach, developed around the same time to analyse the provision of energy services, focused on five connected resources: water, energy, land, materials and manpower (WELMM).
However, this approach was never developed into a manageable software package that could be used for country analysis.
9
Systems Approach
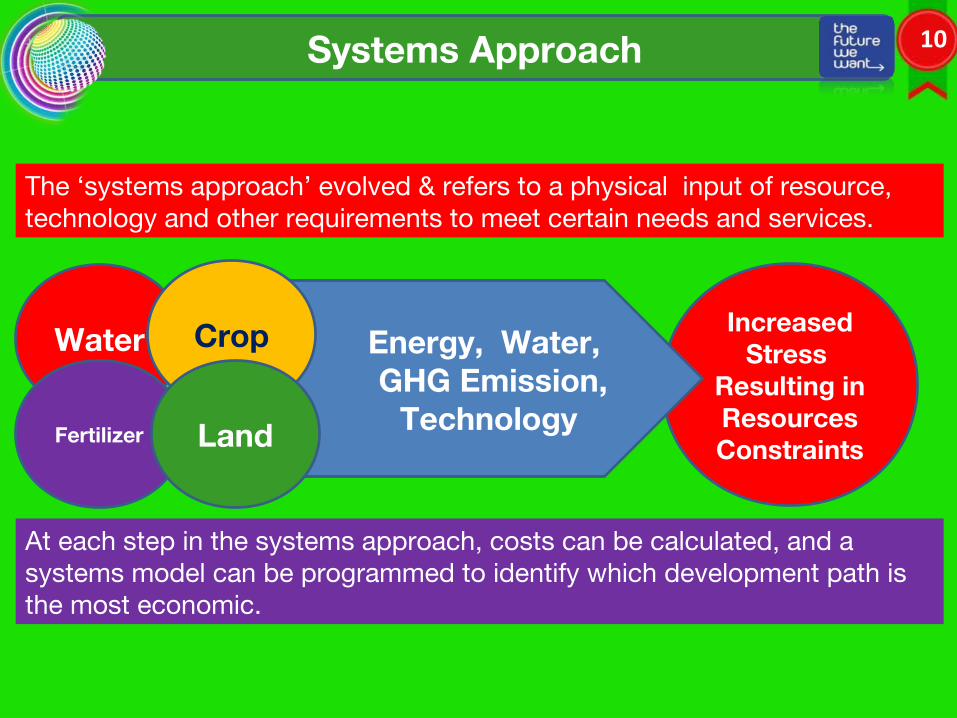
The ‘systems approach’ evolved & refers to a physical input of resource, technology and other requirements to meet certain needs and services.
At each step in the systems approach, costs can be calculated, and a systems model can be programmed to identify which development path is the most economic.
Water
Fertilizer
Increased Stress
Resulting in Resources Constraints
Energy, Water, GHG Emission,
Technology
Crop
Land
10

The NEXUS Approach
The Time has come to
Reconnect Science and
Policy
11

CLEW Nexus
To Address these interdependencies better methods and models are needed that consider all the linkages among climate, land, energy and water (CLEW).
12

13

CLEWS Model : Enhanced Approaches
Key Improvements over Existing Approaches Include
14

CLEWs Model : Advantages
CLEWs Tool helps
Decision Makers
Assess different
technological options with
diverse benefits and disadvantages
Estimate the impacts of different
development scenarios
Analyse and
evaluate policies
15

CLEWs Challenges : COLUMBIA
The United Nations Environment Programme (UNEP) expects frequency of weather and climate extremes. 2050
REGIONAL IMPACTS
•Changes in the composition of ecosystems and biome distribution; •Reduced water availability and hydropower generation; •Increasing desertification; •aridity; •crop pests and diseases
COLUMBIA WILL FACE•Hydropower shortages caused partly by increased El Niño events, •Reduction in agricultural activity •Increased import of fuels for electricity generation. Such fuels are expensive, and, particularly in a volatile market, increased imports reduce the country’s energy security.
16

CLEWs Challenges : SOUTH AFRICA
90%40%
country lies within arid, semi-arid or dry sub-humid zones continent’s largest exporter of
agricultural productsrequires large quantities of electricity to pump irrigation water
supplies Africa’s electricity
Coal & Gold Exports To World
Power Shortages in 2007 forced gold prices to increase globally by 5% as a result of a cost increase.Further, increases in power supplies will require more water & will reduce agriculture output. Expanding cultivation of marginal lands for maize, & overharvesting of fuel wood by the poor, will also accelerate desertification. .
Inadequate investments in new electricity generating capacity is estimated to cost billions.Power shortages affect the international supply of commodities
17

CLEWs Challenges : UGANDA
9% Ugandans have electricity access
93% of country’s energy needs suppliedby wood
20% Urban Population
53% Rural population
No Access to Pure Safe Drinking Water
• Wetlands drained for agricultural use.
• Nation’s water supply threatened by toxic industrial pollutants.
• Mercury from mining has been found in the water supply
Environmental Stresses•Overgrazing, •Deforestation
• Low Productivity Agricultural Practices
, Soil Erosion
Uncoordinated Development-Increased Environmental Stresses
UGANDA
18

Interconnected Issues –Isolated Planning: Punjab
1.5% Land of India
400 million PoorIndians Feeded
50% of Total Wheat & Rice Foodgrain Purchased by Government
15–20% of India’s Total Electricity Use
Farmers in Punjab pay No Electricity Bills
Farmers are pumping aquifers faster than their replenishment. Water levels drop-Pumping increased-sapping on fragile & overtaxed electricity grid. Farmers run their pumps with abandon- Water level further depletes-requires ever more electricity to maintain irrigation water
19

CLEWs : LAND Scenario
Typical Land Uses
Biofuel
Crops for food
Roads,
Dams
infrastructure
Grazing of livestock
Habitations
Quantity of available land is limited
20

CLEWs : LAND Scenario
4 Categories of Land that has potential for cultivation
The quantity of cultivable land increases as either forests are cleared or marginal lands and deserts are made cultivatable by irrigation and fertilization.
Deserts Marginal Land
Cultivable Land Forests & Natural Vegetation
21

CLEWs : LAND Scenario
Depending on the crop, annual rainfall and quality and type of soil, different amounts of irrigation, fertilizer and land are required, with the production of each of these inputs having important impacts in turn, for example increased energy use and associated emissions.
22

CLEWs : LAND Scenario
• Overgrazing
As dense vegetation and forests contain substantial carbon in wood, are cleared for crops, significant amounts of carbon can be released to the atmosphere.
Poor Practices Lead To Land Damages
• Fuel Wood Harvesting
• Over-cropping
23

CLEWs : WATER Scenario
WATER
Desalination Using Energy
For Evaporation
Reverse Osmosis
Local precipitation
fills river basins and lakes with fresh water
Groundwater can be
mined. Water is pumped
ENERGY REQUIREMENTS GET STRESSED
24

CLEWs : WATER Scenario 25
Water has a particularly important role to play in agriculture. In arid developing countries, irrigation can account for as much as 90% of total water use and irrigation together with sufficient nutrients can transform marginal land to cultivable land. Irrigation can be gravity driven but increasingly requires energy for pumping.

CLEWs : WATER Scenario
After use, water has a high potential for purification and recycling, which, however, require energy. As available water can be scarce, its management to reduce evaporation can be important. Thus low evaporation storage, drip irrigation, recycling, ‘grey’ water use, and other techniques and technologies are important in improving the efficiency of the water system. Water is returned to the atmosphere via evaporation and transpiration, with the greatest quantities released by evaporation from the ocean.
26

CLEWs : WATER Scenario
In California, up to 3.5 kW/h per 1000 litres can be consumed supplying water. More energy can be required for local irrigation and treatment.
Damming the Nile River, caused the silt which was deposited in the yearly floods and made the Nile floodplain fertile to be deposited behind the dam. This lowered the water storage capacity of Lake Nasser. Poor irrigation practices further waterlog soils and bring the silt to the surface.
In New Mexico, refineries currently use 50–180 litres of water per barrel of crude oil and generate 30–120 litres of wastewater.
27

CLEWs : WATER Scenario 28

CLEWs : ENERGY Scenario
A renewable resource such as fuel wood is consumed faster than it is regrown.
A 60 MW solar thermal power requires about 1 square kilometer of land, more land required to provide back-up power to augment the intermittent nature of solar energy.
Biofuel feedstock maize needs 860 liters of water to produce one liter of ethanol. Over 3000 sq.km.land is required to produce 18 million tons of biofuel, palm oil, annually.
Surface mining and retort operations produce 8–38 liters of wastewater per ton of processed oil shale. An estimated 3 barrels of water are required per barrel of oil equivalent of tar sands.
29

CLEWs “ Climate Scenario
CO2 from energy use accounted for 56% of global GHG emissions in 2004. Power generation accounted for 30.5% of total CO2 emissions and transport for 17%.
30

CLEWs : Climate Scenario 31

CLEWs : Climate Scenario 32
CLEWs: Decision Making and Analysis
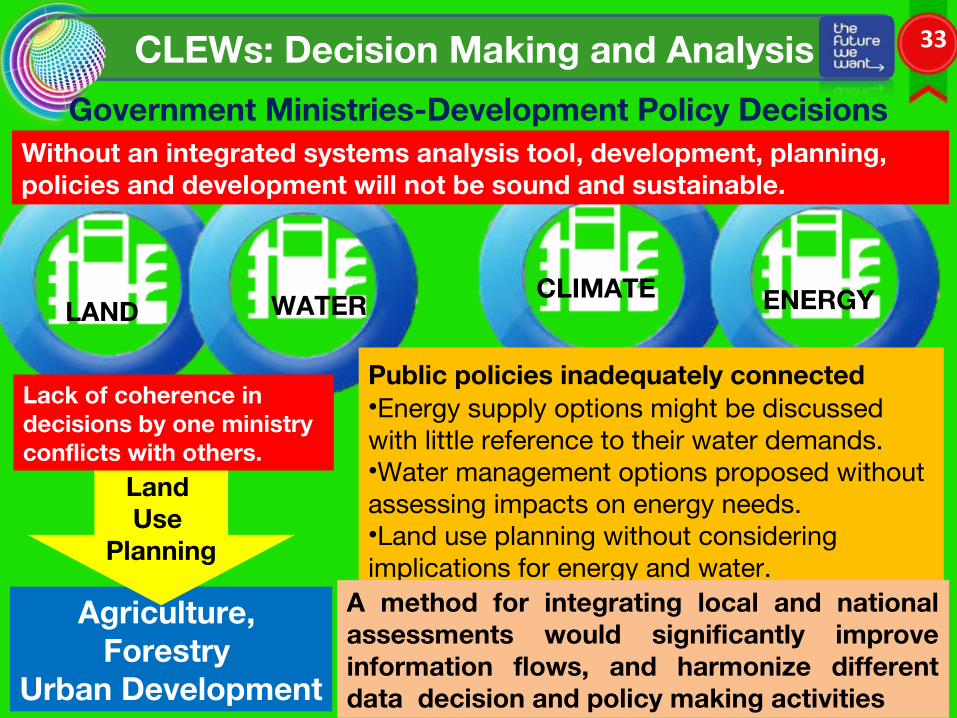
Government Ministries-Development Policy Decisions
LAND WATERCLIMATE ENERGY
Agriculture, Forestry
Urban Development
Land Use
Planning
Lack of coherence in decisions by one ministry conflicts with others.
Public policies inadequately connected •Energy supply options might be discussed with little reference to their water demands.•Water management options proposed without assessing impacts on energy needs.•Land use planning without considering implications for energy and water.
Without an integrated systems analysis tool, development, planning, policies and development will not be sound and sustainable.
A method for integrating local and national assessments would significantly improve information flows, and harmonize different data decision and policy making activities
33

CLEWs : Goals
Policy Harmonization A CLEW tool would help harmonize potentially conflicting policies.
Technology AssessmentsCLEW tool allows more inclusive assessment of technological options. ome technology options can affect multiple resources, e.g. nuclear power could reduce GHG emissions and reduce the exposure to volatile fossil fuel markets. Although it would use water for cooling, nuclear power can generate electricity for seawater desalination.
Policy Assessments If multiple objectives can be achieved by a single policy , CLEW tool provides a
complete, multi-system policy assessment with cost effectiveness for policy makers.
Decision MakingA n integrated CLEW tool d helps decision and policy makers assess options in terms of their likely effects on the broad CLEW system. The tool ransparently evaluates trade-offs in different options. Scenario Development
Helps to elaborate consistent scenarios of possible socio-economic development trajectories identifying future development opportunities as well as understanding the implications of different policies & technology improvements that might significantly change development trajectories.
34

CLEWs Model Applications
The Mauritius case study has inspired many similar climate land energy water development nexus ‐ ‐ ‐ ‐applications. Other case studies include in Australia, Brazil, Burkina Faso, Canada, Cuba, Chile, China, Germany, India, Jamaica, Lithuania, Mauritius, Qatar, South Africa, Syria, Thailand, USA, UK, Tarawa/Kiribati, Comoros, Madagascar, Seychelles, Zanzibar, California, and the river basins of the Danube and the Nile, as well as a number of local applications. These applications use different entry points – energy security, water security or food security (INDIA) – but they share the same approach.
35

CLEW System
A CLEW system would be a valuable addition to the analysis and planning tools, especially for comparative technology and policy assessments, policy harmonization and designing and testing future scenarios of development.
This tool could contribute to stimulating integrated CLEW analysis and planning and to supporting the achievement of broad development goals.
36
CLEWs : Policy Making Model
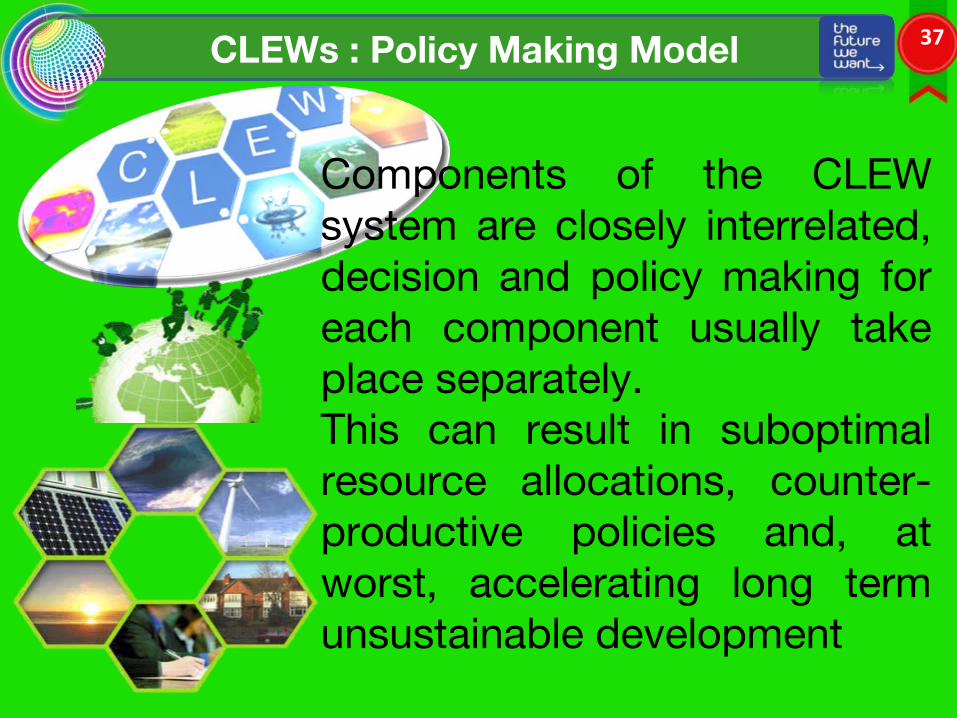
Components of the CLEW system are closely interrelated, decision and policy making for each component usually take place separately. This can result in suboptimal resource allocations, counter-productive policies and, at worst, accelerating long term unsustainable development
37

CLEWs 38