the galactic centre above 10 tev - university of adelaide · suggests nss scenario where cr hadrons...
TRANSCRIPT

The Galactic Centre Above 10 TeV
Roland CrockerUniversity of Adelaide

Slide attribution - just in case somebody is in the audience…
• I have stolen material from talks available on line by:
1. Dermer and Attoyan2. Andrea Goldwurm3. HESS Collaboration

Credit: UCLA Galactic Center Group
GC at Optical Wavelengths
•We can observe the GC at radio, sub-millimeter, infrared, X-ray and g-ray wavelengths

GC - NIR
AU08.0)104
(102.126
122 ≈
××== cm
MM
cGMr
o
BHS
• From NIR monitoring with VLA and Keck of stars in close orbits (periods ~ few decades), it is now conclusively determined that:
1. the distance to the GC, R0, is ~ 8 kpc2. at the dynamical GC there is a 3.7 106 solar
mass black hole ï
16
44 )104
(1054 −
××== sergs
MMGMmL
o
BH
T
HEdd σ
π

R. Genzel, et al. (2004)

Radio Zoom

LaRosa et al. (2000)
Galactic Center Galactic Center Region at 90 cm Region at 90 cm
~ 300 pc~ 300 pc
Nonthermal radio-emitting filaments
Large scale magnetic fields and relativistic electrons
SNRs, HII regionsPoloidal magnetic field within
~100 pc of nucleusSgr A: compact radio
sources at nucleus of Milky Way
Credit: Dermer and Atoyan

Gas Density Through GC
• Molecular line observations trace gas density and show up central molecular zone of giant molecular cloud complexes bound in tight orbits (~100 pc) around Sgr A -these contain ~ 10% of the Galaxy’s molecular gas (3-8 107 solar mass) in densities of nH2 ~ 104 cm-3
Tsuboi (1999)

Credit: HESS Collaboration
EAST

Sgr A Resolved: Radio Features of Inner 10 pc (4 ′×3 ′, or 9.3×7 pc)
6 cm VLA radio of Sgr A East and Sgr A West(Yusef-Zadeh, Melia, & Wandle 2000)
Sgr A East (blue): extremely energetic (≈1052 ergs) region occurring ≈ 50,000 yrs ago from chain of SNRs, a GRB, or star swallowed by BH. Diffuse X-ray emission.
Sgr A West (red): Gas and dust streamers ionized by stars and spiraling around the Galactic center, possibly feeding the nucleus.
Sgr A*: A bright compact radio source at intersection of the arms of the Sgr A West, coincident with Gal dynamical centre
Other components: 1. cluster of evolved and
young stars2. dusty molecular ring
(circumnuclear disk)3. ionized gas streamersCredit: Dermer and Atoyan

Sgr A* in Radio
• GC contains bright radio source, Sgr A*, first identified in the 1970s and coincident with dynamical centre of Galaxy…~ 1 Jyand variable (tens of days)
• @ 3mm size: d 1 AU ~ 20 RSch…emission associated with accretion disk

GC in X-rays

Chandra GC Survey
GC in X-rays:• Point sources: few bright (X-ray Binaries), several transients, many
weak PS• Complex diffuse emission (continuum and lines) peaking towards
Sgr A but with a structured 6.4 keV component associated with MCs (fluorescence due to a bright X-ray flare of Sgr A*?)
• Shell SNR (Sgr A East), Plerion SNR (composite G09+01), star clusters (Arches), Non-Thermal-Filaments, …
Sgr A

Sgr A* in X-rays
• In soft and hard X-rays, Sgr A* is observed to have two states:
1. quiescent: X-ray emission from an extended region, 0.6 arcseconds, or 7×1016 cm ≈ 105 rS with
L ≈ few ×1033 ergs s-1
2. X-ray flares: in both soft and hard X-rays – rise times of 10s of minutes ïemission from inner 10’s of rS

Bélanger et al. (2004)
Flaring Hard XFlaring Hard X--ray Emission from the ray Emission from the Direction of Direction of SgrSgr A*A*
INTEGRAL observations of flaring 20-40 keV emission within 0.9′ of SgrA*
sltrS −= 401Flare lasts < 40 minutes
Credit: Dermer and Atoyan

Soft Gamma-Rays• 511 keV emission detected since 1970s• Emission traces Galactic bulge• Point-like contribution to bulge is neither
excluded or confirmed
GRO/OSSE 511 keVobservations

History of HE Detections of GC
• HE g-ray emission (30 MeV+) detected since 1970s (Cos-B, SAS-2)
• EGRET detected a source (3 EG J1746-2851) marginally consistent with the position of Sgr A*
• Later analysis (Dingus and Hooper, Pohl) showed that this source is not coincident with Sgr A*

Credit: Goldwurm

EGRET GC Source
• The identity of the EGRET source cannot be determined observationally because of the number of HE, candidate sources within PSF
• Lesson: meed excellent angular resolution to pick between candidate source for HE emission in this very crowded region

~TeV Observations of GC
• In 2004, definite detections of the GC at ~TeV energy was reported by:
1. CANGAROO (Tsuchiya et al. 2004)2. Whipple (Kosack et al. 2004) 3. HESS (Aharonian et al. 2004)• Observation of GC with MAGIC has
since been reported (Albert et al. 2006)

HESS Observation of GCAharonian et al. 2004
• Consistent with point source, s < 3 arcmin ~ 7 pc
• Located within 1 arcmin of Sgr A* --also consistent with Sgr A East SNR
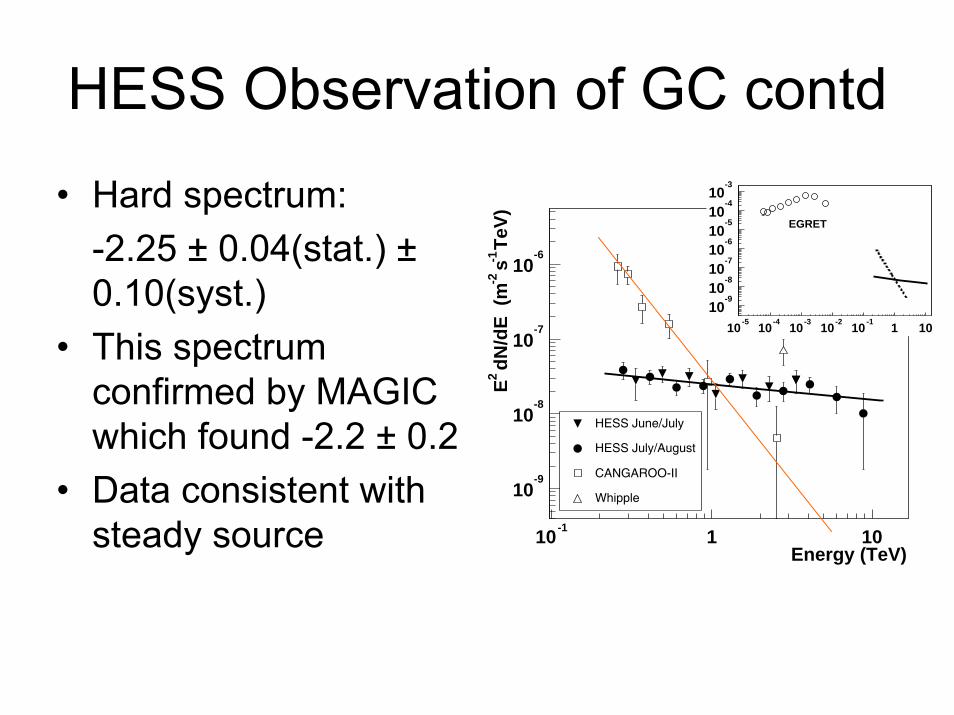
HESS Observation of GC contd
• Hard spectrum: -2.25 ± 0.04(stat.) ±0.10(syst.)
• This spectrum confirmed by MAGIC which found -2.2 ± 0.2
• Data consistent with steady source
Energy (TeV)10
-11 10
TeV
)-1
s-2
dN
/dE
(m
2E
10-9
10-8
10-7
10-6
HESS June/July
HESS July/August
CANGAROO-II
Whipple
10-5
10-4
10-3
10-2
10-1
1 10
10-9
10-8
10-7
10-6
10-5
10-4
10-3
EGRET

Multiwavelength Observations of GC: Synthesis from Aharonian and Neronov (2004)
~10~103636
ergs sergs s--11
Note that Sgr A* is underluminous at all wavelengths by many orders of magnitude: LSgrA* ~ 3×10⁻¹⁰ LEdd

What is the TeV Source at the GC?
Many ideas – overview presented in Aharonian and Neronov (2005)

Source Localization

Dark Matter Annihilation
• Seems to be disfavoured: a flat spectrum (as observed) extending up to t 20 TeV is difficult to reconcile with DM models which tend to turn-over below 10 TeV (given masses of DM candidates) – see
• A sub-dominant contribution cannot be ruled out however:

Hadronic Models• General comment: efficiency of process is determined
by ratio of radiative loss time to diffusive/advectiveescape time – diffusion highly uncertain in GC environment (A&N 2005)
• p’s might be accelerated in/at1. Sgr A*:
i. shocks in the accretion disk ii. stochastically accelerated (2nd order Fermi) in MHD
turbulence (Liu et al. 2004) iii. in jet from tidally-disrupted star (Lu et al. 2006)
2. shocks associated with Sgr A East SNR (Crocker et al. 2005)

g’s from pp Collisions
p’s might interacti. close to the BH horizon (inefficient: A&N 2005) ii. in dense gas at larger radii (A&N 2005, Ballantyne et al. 2006) – out to a few pc

g’s from pg Collisions
• Requires p’s accelerated to 1018 eV+ in shocks/high B fields at ~10 rs (A&N 2005), interact with IR g’s here
• VHE g’s + 2ndary e’s cascade in IR gbackground/B field down to ~TeV
• inefficient

Sample of Leptonic Scenarios• Generically invoke HE e’s IC scattering IR g’s
with e’s accelerated by/at • strong, ordered E/B fields close to BH horizon
(A&N 2005) • winds associated with winds off massive stars
(Quataert & Loeb 2005)• the termination shock of the subrelativistic
wind from the central part of the advection-dominated accretion flow onto the GC black hole – cf. pulsar wind nebulae (Atoyan & Dermer 2005)

Lack of Variability…
• Note that lack of variability within observing runs (HESS, MAGIC) and between different instruments’measurements (HESS – MAGIC) would tend to disfavour models where the emission comes from a very compact region

Utility of Higher Energy GC Observations – See Cut-off?
• Phenomenologically, no evidence for cut-off in HESS spectrum
• Generically, leptonic models are pushed to accelerate electrons to required energy because of synchrotron losses
• Need to exercise care in interpreting any observed cut-off at 10 TeV+ energies…

g-g Attenuation
Moskalenko, Porter and Strong
Getting significant attenuation at t 40 TeV for GC g’s
Need to somehow distinguish between intrinsic and absorption cut-offs

Diffuse Emission

Credit: HESS Collab

Credit: HESS Collab

Credit: HESS Collab

Explaining Emission
• HESS collaboration, noting correlation between g-rays and molecular density, posit hadronic collisions as source of emission – implies 1050 ergs in CR hadrons through the CMZ
• Yusef-Zadeh et al. noting independent correlation between Fe Ka line emission and g-rays suggest origin in IC scattering of IR background by primary electrons

Credit: HESS Collab

Interpreting g-ray/gas Correlation
• HESS Collaboration suggests that break-down of correlation at angular scales ~ 1±suggests NSS scenario where CR hadrons injected at central source
• Assuming diffusion coefficient typical for Galactic disk, viz., 1030 cm2s-1 @ TeV, diffusion time to 1± is ~104 years – close to some estimates of age of Sgr A East SNR

Credit: HESS Collab

Couple of Points Concerning SPIN • Spectrum much harder than would be produced
by local CR population interacting in GC gas• On the one hand, the fact that the SPIN of the
diffuse emission and the GC point source are so similar might argue for a common accelerator (at Sgr A*, Sgr A East?)
• On the other hand, the fact that the spectral index of the diffuse emission does not vary across the region poses some problems for a model invoking diffusion: why doesn’t the SPIN flatten at large distances?

Credit: HESS Collab

Millagro Detects Large-scale, Diffuse Emission at 10 TeV
• The Cygnus Region of the Galaxy as seen in TeV gamma rays…angular resolution is ~0.5∞for individual photons
• astro-ph/0611691, Abdo et al. (Milagrocollab)

Diffuse Emission to 10 TeV: ‘TeV Excess’?
Spectrum of the diffuse emission from the Cygnus Region of the Galactic Plane.
astro-ph/0611691, Abdo et al. (Milagro collab)

Cosmic Ray Anisotropy Towards GC

Evidence for EHE CR Anisotropy
• AGASA: found ~25 % over-abundance towards the GC over a 20 degree diameter circle for
17.9 < log[ E/eV ] < 18.3
Data taken over a 20 year period. 200 000 >1017
eV CR showers. 4.5 σ result. (Hayashida et al. 1999)
• SUGAR data (1968-1979): point source near GC. 4000 events within a priori restricted energy range. 2.6 σ result. (Bellido et al. 2001)

AGASA CR Sky
Galactic Plane
Hayashida et al. 1999 Instrument horizon

Chi-squared Fitting to Combined Data
HESS
EGRET
log[ E / eV ]
8 10 12 14 16 18
-35
-30
-25
-20
-15
−2
−1
log
[
/ c
m
s e
V
]−
1
dEdF
dataEHE CR
fit to HESS alone
fit to EGRET + EHE CR
Whipple
Best-fit spec. ind. = 2.23
chi^2/dof = 0.33/(4-2) = 0.17
Crocker et al. 2005

AUGER: Nothing Obvious at GC
Letessier-Selvon, 29th ICRC 2005