the gambia - food and agriculture organization€¦ · national forest assessment 2008-2010 the...
TRANSCRIPT
National Forest Assessm
ent 2008-2010
The Gambia
The Gam
bia
National Forest Assessment 2008-2010
cover.ai 1 20/07/2011 10:04:34cover.ai 1 20/07/2011 10:04:34
National Forest Assessment 2008-2010 – The Gambia
Funding through
Government of The Gambia - Ministry of Forestry and the Environment (MoFEN) Food and Agriculture Organization of the United Nation (FAO)
Implementing Agencies
Department of Forestry (DoF) - The Gambia Regional Forestry Officers in all five Regions in The Gambia Gambia Bureau of Statistics (GBoS) Natural Resource Consulting (NACO) Department of Wildlife
Advisory and technical supervision
FAO Forest Management Team (FOMR)
Report compilation
Mr Sambou Nget (DoF) Mr Malang Jatta (DoF) Ms Rebecca Tavani (FAO) Mr Marco Piazza (FAO) Ms Lenja Guenther (Consultant)
iii
Table of Contents
List of Acronyms .............................................................................................................................. xi
Acknowledgements ........................................................................................................................ xiii
1 Executive Summary TCP .......................................................................................................... 1
2 Introduction ............................................................................................................................... 3
2.1 Country Background ........................................................................................................ 3 2.1.1 Geographical context ................................................................................................................................. 3 2.1.2 Historical context ...................................................................................................................................... 4 2.1.3 Socio-economic context ............................................................................................................................ 4
2.2 The Gambian Forestry Sector ......................................................................................... 4 2.2.1 Global Commitments ................................................................................................................................. 4 2.2.2 Responsibilities ......................................................................................................................................... 5 2.2.3 Strategic frameworks ................................................................................................................................. 5 2.2.4 Need for cooperation ................................................................................................................................. 5
3 Project Proposal to FAO ........................................................................................................... 6
3.1 Goals and Objectives of the project ................................................................................ 6 3.1.1 Overall Goal .............................................................................................................................................. 6 3.1.2 Specific Objectives .................................................................................................................................... 6
3.2 Expressed need for NFA .................................................................................................. 7 3.2.1 Legal Responsibility .................................................................................................................................. 7 3.2.2 Extended Information Update ................................................................................................................... 7 3.2.3 Policy Fundament ...................................................................................................................................... 7 3.2.4 Global Reporting Standards ...................................................................................................................... 7 3.2.5 Systematic Information Management ........................................................................................................ 7 3.2.6 Capacity Building ...................................................................................................................................... 8 3.2.7 Base for National Forest Action Plan ........................................................................................................ 8
3.3 Expressed need for Forest Policy Popularisation .......................................................... 8 3.3.1 Participatory Approaches .......................................................................................................................... 8 3.3.2 Sector Synergies ........................................................................................................................................ 8 3.3.3 Capacity Building and Empowerment ....................................................................................................... 8
3.4 Expressed need for Forest Legislative Review ............................................................... 9 3.4.1 Integration of new Concepts ...................................................................................................................... 9 3.4.2 Back-up for Investments ............................................................................................................................ 9 3.4.3 Improved Protection Options..................................................................................................................... 9
3.5 FAO cooperation and roadmap ...................................................................................... 9 3.5.1 Financial Cooperation ............................................................................................................................... 9 3.5.2 Technical Cooperation ............................................................................................................................. 10 3.5.3 Inception .................................................................................................................................................. 10 3.5.4 Preparatory phase .................................................................................................................................... 11 3.5.5 Implementation Phase ............................................................................................................................. 11
3.6 Organisational structure for the TCP .......................................................................... 11

iv
3.7 Set-up of PTU .................................................................................................................. 12
4 The NFA 2009/2010 ................................................................................................................ 13
4.1 Executive Summary NFA .............................................................................................. 13
4.2 Specific objectives of the NFA ....................................................................................... 14
4.3 Forest Assessment History ............................................................................................. 15 4.3.1 Forest assessments before 1981 ............................................................................................................... 15 4.3.2 National Forest Inventory – 1981/1982 ................................................................................................... 15 4.3.3 National Forest Inventory – 1997/1998 ................................................................................................... 16 4.3.4 The design of NFA 2009/10 .................................................................................................................... 16
4.4 Phase I: Preparation, Training and Mapping ............................................................. 17 4.4.1 Information Needs Assessment ............................................................................................................... 17 4.4.2 Mapping and Remote Sensing ................................................................................................................. 18 4.4.3 Classifications of forests and land uses ................................................................................................... 20 4.4.4 Procurement of inventory equipment and supplies .................................................................................. 24 4.4.5 Data Collection and Data Entry team ...................................................................................................... 24 4.4.6 Field team organisation ........................................................................................................................... 24 4.4.7 Technical training of the national counterpart ......................................................................................... 26
4.5 Phase II: Field Survey and Remote Sensing Analyses ................................................ 27 4.5.1 Sampling design and Field Data Collection ............................................................................................ 27 4.5.2 Remote Sensing Analyses ....................................................................................................................... 36
4.6 Phase III: Data Processing, Analysis and Reporting ................................................. 36 4.6.1 Field Form Collection and Data Entry..................................................................................................... 36 4.6.2 Data entry ................................................................................................................................................ 36 4.6.3 Data base application ............................................................................................................................... 37 4.6.4 Data base structure .................................................................................................................................. 38 4.6.5 Remote Sensing Results .......................................................................................................................... 39 4.6.6 Reporting ................................................................................................................................................. 40
4.7 Results .............................................................................................................................. 40 4.7.1 Area ......................................................................................................................................................... 40 4.7.2 Volume .................................................................................................................................................... 48 4.7.3 Biomass and Carbon ................................................................................................................................ 53 4.7.4 Biodiversity ............................................................................................................................................. 53 4.7.5 Fire .......................................................................................................................................................... 54 4.7.6 Products and Services .............................................................................................................................. 57 4.7.7 Socio Economic ....................................................................................................................................... 65 4.7.8 Policy, Legal and Management ............................................................................................................... 69
4.8 Comparison of NFA 2009/10, 1997/98 and 1981/82 inventories ................................. 73 4.8.1 Area ......................................................................................................................................................... 75 4.8.2 Volume .................................................................................................................................................... 77 4.8.3 Density .................................................................................................................................................... 79
4.9 Recommendations ........................................................................................................... 80 4.9.1 Catalogue of Measurements on the ground ............................................................................................. 80 4.9.2 Capacity building .................................................................................................................................... 81 4.9.3 Future monitoring .................................................................................................................................... 82
v
4.9.4 Additional information needs .................................................................................................................. 82 4.9.5 Actions for resources development ......................................................................................................... 82 4.9.6 International Reporting ............................................................................................................................ 83
4.10 NFA Conclusion .............................................................................................................. 83
4.11 The way forward - NFA Action Plan ............................................................................ 85 4.11.1 Establishment of NFA section............................................................................................................. 85 4.11.2 Data Storage and Sharing .................................................................................................................... 86 4.11.3 Enhancing and multiplying Skills ....................................................................................................... 86 4.11.4 NFA Results Popularisation ................................................................................................................ 87 4.11.5 Turn findings into action ..................................................................................................................... 87
5 The Forest Policy Popularisation ........................................................................................... 88
5.1 Objective .......................................................................................................................... 88
5.2 Approach ......................................................................................................................... 88 5.2.1 Roadmap .................................................................................................................................................. 88 5.2.2 Stakeholder Workshops ........................................................................................................................... 89 5.2.3 Radio broadcasting .................................................................................................................................. 89 5.2.4 Translation in Local Language ................................................................................................................ 89
5.3 Recommendations ........................................................................................................... 89 5.3.1 Staff of Department of Forestry and collaborating Institutions: .............................................................. 90 5.3.2 Regional Technical Advisory Committees (TACs) and Ward Councillors ............................................. 90 5.3.3 District Chiefs and Village Heads (Alikalolu) ......................................................................................... 91 5.3.4 Resume .................................................................................................................................................... 91
5.4 Outcome and Conclusion ............................................................................................... 92
5.5 Outlook ............................................................................................................................ 92
6 The Review of Forestry Policy and Legislation in The Gambia ........................................... 93
6.1 Objective .......................................................................................................................... 93
6.2 Approach ......................................................................................................................... 93 6.2.1 Roadmap .................................................................................................................................................. 93 6.2.2 Document Review ................................................................................................................................... 94 6.2.3 Stakeholder Consultation ......................................................................................................................... 94 6.2.4 Drafting of the Bill .................................................................................................................................. 94
6.3 Recommendations ........................................................................................................... 94 6.3.1 Functions of the Department ................................................................................................................... 95 6.3.2 Coordination among institutions and stakeholder participation in forest management ........................... 95 6.3.3 Public participation in the process for the adoption of policy and plans ................................................. 95 6.3.4 Community Controlled State Forests ...................................................................................................... 95 6.3.5 Joint Forest Park Management ................................................................................................................ 95 6.3.6 Community Forestry ................................................................................................................................ 95 6.3.7 Private Forests ......................................................................................................................................... 95 6.3.8 Land Use Conflicts .................................................................................................................................. 96 6.3.9 Local Government Act and Decentralisation of the Functions of the DoF to the Local Councils........... 96 6.3.10 Control of industry .............................................................................................................................. 96 6.3.11 Prevention and Control of Fires .......................................................................................................... 96
vi
6.3.12 Offences and Penalties ........................................................................................................................ 97 6.3.13 Transparency ....................................................................................................................................... 97 6.3.14 Definitions ........................................................................................................................................... 97
6.4 Outcome and Conclusion ............................................................................................... 97
6.5 Outlook ............................................................................................................................ 99
7 TCP Conclusion ...................................................................................................................... 99
Bibliography ................................................................................................................................. 101
Annexes ......................................................................................................................................... 104
Annex I - Inventory Field Forms ................................................................................................ 105
Annex II - Tract Report Form ..................................................................................................... 123
Annex III - List of Consultants .................................................................................................... 124
Annex IV - List of other DoF staff (non PTU) closely involved with the NFA Activities ......... 125
Annex V - List of Technicians from the DPWM ......................................................................... 126
Annex VI - List of equipment and materials procured for the NFA .......................................... 127
Annex VII - Tree / shrub species measured in the inventory ..................................................... 129

vii
List of Figures
Figure 1: Administrative regions of The Gambia ............................................................... 3
Figure 2: Organisation chart for the TCP in The Gambia ................................................ 12
Figure 3: Land use/cover classification for the NFA in The Gambia ................................ 23
Figure 4: NFA Field Team in URR ................................................................................... 25
Figure 5: Distribution of tracts for the National Forest Inventory of The Gambia ............. 28
Figure 6: Tract, plot and subplot design .......................................................................... 31
Figure 7: Example of land use/cover sections (LUCS) distribution within a plot .............. 32
Figure 8: Example of land use/cover classes (LUCC) distribution within a tract .............. 32
Figure 9: Area used for selecting household for the household survey ........................... 33
Figure 10: Location of database files ............................................................................... 38
Figure 11: Illustration of the relationship between different data tables ........................... 39
Figure 12: Total area of The Gambia divided into major land use classes ...................... 41
Figure 13: Area of Forest sub-classes ............................................................................. 42
Figure 14: Area of Other Wooded Land sub-classes....................................................... 43
Figure 15: Area of Other Land sub-classes ..................................................................... 43
Figure 16: Area of Inland Water sub-classes .................................................................. 43
Figure 17: Percentage of forest area by forest type and succession stage ..................... 44
Figure 18: Canopy Cover in Forest and Other Wooded Land ......................................... 45
Figure 19: Area by Land Use per Region (5 figures) ....................................................... 46
Figure 20: Proportion of each Region for each Land Use Class (4 figures) .................... 47
Figure 21: Volume Density by LUC and Region (m3/ha) ................................................. 52
Figure 22: Major causes of bushfires in The Gambia ...................................................... 56
Figure 23: Frequency of fire in forest ............................................................................... 57
Figure 24: Major Forest Products (%) ............................................................................. 57
Figure 25: Major Services from Forest ............................................................................ 58
viii
Figure 26: Forest products harvested per Region ........................................................... 59
Figure 27: User group by forest products harvested (%) ................................................. 59
Figure 28: Gender balance for harvesting forest products .............................................. 60
Figure 29: Level of child participation in harvesting forest products ................................ 60
Figure 30: Major conflicts in harvesting forest products .................................................. 61
Figure 31: User groups by forest product harvested ....................................................... 62
Figure 32: Major forest management activities per Region ............................................. 62
Figure 33: Breakdown HH involvement in forest activities per region (5 figures) ............ 64
Figure 34: Main activities of households ......................................................................... 67
Figure 35: Percentages of fuel sources for lighting ......................................................... 68
Figure 36: Main source of media owned by households ................................................. 68
Figure 37: Households’ livelihood trend .......................................................................... 69
Figure 38: Level of households’ awareness of forest initiatives and policies ................... 70
Figure 39: Extent of forest management agreements ..................................................... 71
Figure 40: Extent of ownership area ................................................................................ 71
Figure 41: Designated function of Major LUC ................................................................. 73
Figure 42: Proposed NFA section organisation ............................................................... 85

ix
List of Tables
Table 1: Members of the PTU ......................................................................................... 12
Table 2: Composition of Inventory teams by station and number of tract allocated ........ 24
Table 3: Field Teams composition................................................................................... 25
Table 4: Tract density in The Gambia ............................................................................. 28
Table 5: List of tracts inventoried and the ones initially rejected ..................................... 29
Table 6: Plot location and orientation .............................................................................. 30
Table 7: Survey unit specifications .................................................................................. 33
Table 8: Area of Major LUCs ........................................................................................... 41
Table 9: Specific land use classes and their areas ......................................................... 41
Table 10: Forest area by forest type and succession stage ............................................ 44
Table 11: Canopy Cover in Forest and Other Wooded Land .......................................... 45
Table 12: Area by Land Use per Region ......................................................................... 45
Table 13: Volume and Density by LUCs .......................................................................... 48
Table 14: Function for Calculation of Total Volume ......................................................... 49
Table 15: Function for Calculation of Sawtimber Volume ................................................ 50
Table 16: Western Region - Volume and Density by MLUC ............................................ 51
Table 17: North Bank Region - Volume and Density by MLUC ....................................... 51
Table 18: Lower River Region - Volume and Density by MLUC ...................................... 51
Table 19: Central River - Volume and Density by MLUC ................................................ 52
Table 20: Upper River Region - Volume and Density by MLUC ...................................... 52
Table 21: Total Biomass and Density by Major LUCs ..................................................... 53
Table 22: Most frequent tree species in The Gambia ...................................................... 54
Table 23: Shannon’s Diversity Index and Equitability values by region ........................... 54
Table 24: Areas burnt per Land use and Region ............................................................. 55
Table 25: Major causes of bush fires ............................................................................... 56

x
Table 26: Extent of grazing per land use type ................................................................. 64
Table 27: Extent of grazing per Region ........................................................................... 65
Table 28: Method for determining the representativeness (weight) of each tract for HH survey ....................................................................................................................... 66
Table 29: Household main activity................................................................................... 66
Table 30: Extent of forest management agreements ...................................................... 70
Table 31: Extent of land ownership ................................................................................. 72
Table 32: Extent of designation function of Major LUC ................................................... 73
Table 33: Comparison of Land use Classifications of Gambian Forest Inventories ........ 74
Table 34: Comparison between forest area of 2009/10 and 1997/98 .............................. 77
Table 35: Volume per hectare (m3/ha) comparison between NFA 2009/10 and 1997/98 .................................................................................................................................. 78
Table 36: Volume and Density (GTZ Report, 1983) ........................................................ 79
Table 37: Average density of trees in the selected Land Use type in The Gambia ......... 80

xi
List of Acronyms AC Administrative Circle BAC Brikama Area Council CCSF Community Controlled State Forest CFCs Community Forest Committees CFI Continuous Forest Inventory CFMA Community Forest Management Agreement CILSS The Permanent Inter-State Committee for Drought Control in the Sahel CRD-FP Central River Division Forestry Project. CRR Central River Region DbH Diameter at breast Height DoF Department of Forestry DPWM Department of Parks and Wildlife Management EW East – West FAO Food and Agriculture Organization of United Nation DOFT Fallen Deadwood Transect FOMR Forest Resources Development Service, FAO Rome FRA Forest Resources Assessment GBOS Gambia Bureau Of Statistics GFMC Gambia Forest Management Concept GIS Geographic Information System GOTG Government Of The Gambia GPS Global Position System GTZ Deutsche Gesellschaft für Technische Zusammenarbeit HAS House Hold Survey Area HH Household IA Implementation Area JFPM Joint Forest Park Management LGA Local Government Authority / Area LRR Lower River Region LSP Litter Sub-Plot LTU Lead Technical Unit LUC Land Use Class LUCC Land Use Cover Class LUCS Land Use / Cover Section MA&D Market Analysis and Development MOFEN Ministry Of Forestry and The Environment MOJ Ministry Of Justice NACO National Consultancy on Rural Extension and Training NARI National Agricultural Research Institute NBR North Bank Region

xii
NC National Consultant NEA National Environment Agency NFA National Forest Assessment NFAP National Forest Action Plan NFF National Forestry Fund NFI National Forest Inventory NFMA National Forest Monitoring and Assessment NGO Non Governmental Organization NPC National Planning Commission / National Project Coordinator NS North – South PCFMA Preliminary Community Forest Management Agreement PFM Participatory Forest Management PTU Project Technical Unit RSP Rectangular Sub-Plot SC Steering Committee SJFFC St Joseph Family Farm Centre TANGO The Association of Non Governmental Organisation TCDC Technical Consultant on Development Cooperation TCP Technical Cooperation Program TOR Terms Of Reference UNDP United Nation Development Program URDFP Upper River Division Forestry Project URR Upper River Region USAID United States AID UTM Universal Traverse Mercator WCR West Coast Region WWF World Wildlife Fund

xiii
Acknowledgements The Department of Forestry would like to acknowledge with gratitude the valuable contribution and support of individuals and organizations to the successful implementation of the National Forest Assessment (NFA) but by extension to the whole TCP programme and the compilation of this final report.
The Department is highly indebted to the United Nations Food and Agricultural Organization (FAO) for funding the project and therefore enabling The Gambia to come up with a new baseline on its forest resources, and to the Ministry of Forestry and the Environment for its support before and during project implementation.
Sincere gratitude is extended to all the Regional Governors and Regional Forestry Officers, to the communities, to all the members of the field data collection crews, including the drivers and data entry clerks for their hard work and cooperation during the exercise.
The Department also appreciates the support and cooperation of all the personnel at the FAOR in Banjul, particularly to the Resident Representative, Dr Babagana Ahmadu and his Assistant responsible for projects and programmes, Mrs Mariatou Faal Njie for the commitment demonstrated to make sure that this project was a success.
Finally, the Department wants to acknowledge the commitment and dedication of the staff responsible for the compilation of the Report (Mr Sambou Nget and Mr Malang Jatta) and the reviewing team in Rome (Ms Rebecca Tavani and Mr Marco Piazza) for a job well done. A special gratitude is extended to all the consultants who had worked under this project, both national and international, for their commitment and dedication.

xiv
1
1 Executive Summary TCP The Gambian forest is visibly degraded with the most severe effect on the livelihood of the rural population. Little is known about the real impact and matters in quantitative terms. Strategic and legal document, which are supposed to ensure sustainable forest management, are based on outdated or unreliable figures. Essential document for strategic forest resource planning and implementation, such as the forest policy, was hardly understood as a supportive tool even by key stakeholders.
As the DoF deeply depends on external support to enhance capacities and to cope with the current challenges, a project proposal was sent to FAO for collaboration. The proposal was accepted to undertake a project from 2009-2011 within the frame of the NFP TCP programme.
The overall goals of the project on Support to the National Forest Programme were to contribute to sustainable natural resources management and to increase rural livelihood through improved forestry management and efficient and cost effective forestry-related activities, whilst enhancing the capacity of Forestry Department personnel and other involved stakeholders through knowledge and technology transfer.
The project was scheduled to include three components: The National Forest Assessment (NFA), the Forest Policy Popularisation and the Forest Legislative Review. The main support was given to the NFA, as it was the largest scale component and also implemented the global aspect of international reporting.
Nevertheless, all three components go hand in hand and their improvement will enhance the DoF and other stakeholders with a set of new opportunities:
The NFA provides a living database with options for continuous update and diverse query options, thus providing a true base for data analysis which has the potential to inform decision making and the development of policies, acts, guidelines and other strategic papers.
The Forest Policy Popularisation has created awareness among stakeholders on their role and provided, through detailed 10-year work plans, a hand- on tool for sustainable forest management. The updated NFA data can provide a base for further advice (i.e. as in choice of species for planting or eligible sites for conservation). Vice- versa, results from work plan implementation are supposed to feed back into the NFA so that the next inventory is better informed of information needs.
The legislative forest act review will provide the legal back-up for the implementation of sustainable forest management, according to the current concept, guidelines and

2
policy-based work plans, as soon as the bill has been approved. Vice-versa, future legal reviews can benefit from analysis of the data acquired from the NFA.
All three components also provide a catalogue of recommendations and plans for implementation, which will help to develop the forestry sector itself and to achieve sustainable natural resource management.
The TCP can be considered as an immense success with valuable enhancement of capacities in form of knowledge, skills, technology and equipment. The three components provide strong tools for the DoF and other stakeholders to plan and implement sustainable forest management in national, regional and global context.
3
2 Introduction
2.1 Country Background
2.1.1 Geographical context
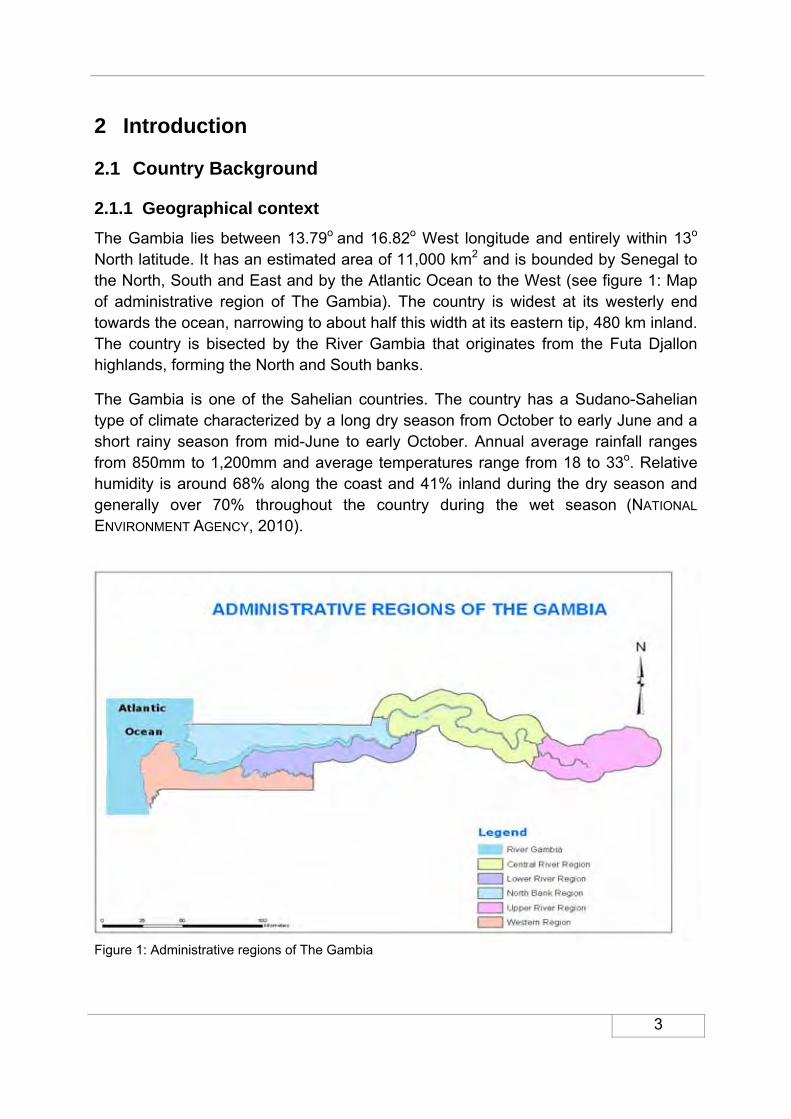
The Gambia lies between 13.79o and 16.82o West longitude and entirely within 13o North latitude. It has an estimated area of 11,000 km2 and is bounded by Senegal to the North, South and East and by the Atlantic Ocean to the West (see figure 1: Map of administrative region of The Gambia). The country is widest at its westerly end towards the ocean, narrowing to about half this width at its eastern tip, 480 km inland. The country is bisected by the River Gambia that originates from the Futa Djallon highlands, forming the North and South banks.
The Gambia is one of the Sahelian countries. The country has a Sudano-Sahelian type of climate characterized by a long dry season from October to early June and a short rainy season from mid-June to early October. Annual average rainfall ranges from 850mm to 1,200mm and average temperatures range from 18 to 33o. Relative humidity is around 68% along the coast and 41% inland during the dry season and generally over 70% throughout the country during the wet season (NATIONAL
ENVIRONMENT AGENCY, 2010).
Figure 1: Administrative regions of The Gambia
4
2.1.2 Historical context
In terms of area, The Gambia is the smallest country on the West African mainland. It became an independent sovereign country in 1965 after gaining independence from the British. Before independence, Gambia was endowed with dense forests. However, with the increasing human population since in the early 50s, the equilibrium that existed started to decline rapidly as a result of the unsustainable forest exploitation, expansion of Agricultural practices, settlement, orchard developments and frequent incidences of fires. Consequently many of the forests have undergone changes, more often to secondary succession, resulting to lesser dense forests, poor regeneration potential, lower growth, undesirable grass occupation and lower plant species diversity.
2.1.3 Socio-economic context
Between the 1983 and 1993 censuses, population growth rate was 4.2 percent per annum. Natural growth was 2.9 percent, and inward migration, resulting from the influx of refugees, at 1.3 percent. The 2003 population census showed that the population is 1.3 million with a growth rate of about 2.8 percent per annum. About 45 percent of the population is less than 15 years old, increasing the burden of providing adequate health and education services as well as gainful employment opportunities. The majority of the population is engaged in agriculture mainly for direct subsistence, whilst the main income is generated from seasonal tourism.
The average gross national income per capita is $ 579,6 per year (http://data.un.org/CountryProfile.aspx?crName=Gambia). The majority of the rural population is depending on free access to forest resources for fuel, construction, food, fodder, medicine and other daily needs. Hence, the informal forestry sector is considered as an important source of non-monetary income, but does not reflect in economic statistics. Little is proved about its real economic meaning and status.
In 2010 The Gambia has been ranked 151 of 169 countries on the Human Development Index scale and is thus ranking among the least developed countries (hdrstats.undp.org/en/countries/profiles/GMB.html).
2.2 The Gambian Forestry Sector
2.2.1 Global Commitments
The Government of The Gambia has ratified several International Conventions which are related to the rational management and utilization of the Forest resources such as:
1. The Convention on Biological Diversity 2. The United Nations Framework Convention on Climate Change 3. The United Nations Convention to Combat Desertification
5
4. The Convention on International Trade in Endangered Species of wild Fauna and Flora (CITES)
5. The Convention on Wetlands of International Importance (Ramsar)
2.2.2 Responsibilities
The Department of Forestry (DoF) is responsible for promoting the rational management of the forest resources of The Gambia. It was created in 1976 and is the governmental institution attached to the Ministry Of Forestry and the Environment (MOFEN) in charge of any actions necessary to ensure the sustainable use and protection of all forest resources in The Gambia, including private natural and plantations. The 2010-2019 Forest Policy charges the DoF with the responsibility of ensuring the sustainable management of forest resources through the active participation of the rural population who are the immediate stakeholders. The Policy directives are given legal effect and backup in the enactment of the 1998 Forest Act, updated through the current Forest Bill 2010.
2.2.3 Strategic frameworks
Before 2009 there existed a catalogue of information on forests in The Gambia. The results of the 1981/82 and 1997/98 National Forest Inventories were available and The Gambia had already formulated forestry legislative frameworks such as the Forest Policy of 2010 and the Forest Act and Forest Regulations of 1998. The Gambian Forest Management Concept (GFMC) of 2000 which is a blue print for Participatory Forest Management (PFM) in The Gambia was available as well as information on Community Based Forest Enterprise Development using the Market Analysis and Development (MA&D) Approach. Other concepts also existed, such as the Joint Forest Park Management Concept (JFPM), Community Controlled State Forest (CCSF) Management and guidelines such as the Community Forestry Implementation Guidelines of 2002. In addition, detailed inventories of various forests (Gazetted Forest Parks) under the control of the DoF were undertaken at various times especially for the preparation of Forest Management Plans.
2.2.4 Need for cooperation
As a sector in one of the least developed and poorest countries in the world, the Gambian forestry sector depends on external support to fulfil its mandate and to contribute to national and global development. Within the forestry sector three major tools needed improvement and updating to overcome current challenges, namely the information management, policy awareness and the legal framework. Thus the Department of Forestry expressed the need for a forest assessment, forest policy popularisation and a review of the forest act.
6
3 Project Proposal to FAO
Under the above context the government of The Gambia initiated a Technical Cooperation Programme (TCP) project proposal in 2007 on National Forest Assessment (NFA), Forest Policy Popularisation and Review of the Forest Legislative frameworks which was submitted to the Food and Agriculture Organization of the United Nations (FAO) and was approved on 28th October, 2008.
3.1 Goals and Objectives of the project
3.1.1 Overall Goal
The overall goals of the project on Support to the National Forest Programme are:
• To contribute to sustainable natural resources management and;
• Increase rural livelihood through improved forestry management and efficient and cost effective forestry-related activities.
The project was also designated to build the capacity of Forestry Department personnel and other involved stakeholders for the sustainable management of the forests and improve the monitoring systems in place as well as transfer technology and provide advisory support to the forestry administration on new methods and techniques of forestry resources monitoring.
3.1.2 Specific Objectives
To overcome the currently most pressing challenges and shortcomings, the project consists of three components with following objectives:
i. National Forest Assessment (NFA) :
The overall objective of the NFA of The Gambia is to generate reliable information on forest resources for policy formulation, institutional capacity building, planning, conservation and utilization of natural resources on a sustainable basis.
ii. Forest Policy Popularization The overall objective of the forestry policy popularization is the dissemination and clarification of the new Forest Policy of 2010 - 2019 to a wider audience (local communities, local government authorities, Non-Governmental Organizations (NGOs) and other relevant stakeholders) as a tool for sustainable development. iii. Forest Legislative Review:
The overall objective of the legal review of the forest act was to update the legislation under the consideration of the latest developments in the forestry sector and related sectors to ensure the rational legal backup of sustainable forest management.

7
3.2 Expressed need for NFA
3.2.1 Legal Responsibility
For the improvement and promotion of the sustainable use of the forest resource of The Gambia, the Forest Act (1998) expressly makes provisions for National Forest Inventories (Assessments). Section 91 (1) of the 1998 Forest Act confers that the Forestry Department shall prepare and conduct a national forest inventory every ten years according to the modalities set by the Secretary of State. Sub-section 2 of the same Act bestows this responsibility to the Director of Forestry who can however subcontract the work to a specialized competent organization. Section 67 of the Forest Bill 2010 mandates the Director of Forestry to prepare and conduct forest assessment and update it as necessary not less than every ten years in accordance with any regulations made under the Act.
3.2.2 Extended Information Update
Though the country undertook two national forest inventories in 1981/82 and 1997/98, the available data was limited to very few parameters (area and wood stocks). With such scope of information, the resources remain largely unknown to the policy makers. The component of trees outside forest and mangroves were not covered in the previous inventories despite their inestimable socio-economic and environmental roles in meeting local populations’ needs. In addition to the products and services, any new national inventory must place emphasis on the rate of forest cover change in the country as well as enhance the knowledge base on all benefits (products and services) of the forests and trees which will serve as a base for the development of forest management plans.
3.2.3 Policy Fundament
Decisions and policies have been based on assumptions on various aspects of the resources, which often make the national programmes and strategies inadequate or even misleading. How policies have been drawn up and how they are influencing the resources remained largely unknown due to lack of information on the changes and trends.
3.2.4 Global Reporting Standards
The information framework in the Gambia was different from what is internationally accepted. Considerable efforts were needed to make the national information system coherent and translatable with the global requirements.
3.2.5 Systematic Information Management
The previous information management system was absent. The existing information was dispersed and fragmentary and difficult to locate. A permanent and functional

8
data base therefore needed to be built to assemble and store the old information and to capture process and manage the new data which indisputably will contribute to the sustainable management of forests and tree resources in the Gambia.
3.2.6 Capacity Building
The Forestry Department requires a great deal capacity building to be able to follow up a national programme of forestry resources monitoring.
3.2.7 Base for National Forest Action Plan
Capacities had to be developed to assess the country’s forest and tree resources and to monitor trends and changes, to describe their nature and localities and to advise on adequate measures which will facilitate the development of a comprehensive National Forestry Action Plan (NFAP) which the Department of Forestry considers as a high priority. In light of the above it was incumbent upon the government to carry out a National Forest Assessment for the fulfillment the above requirements.
3.3 Expressed need for Forest Policy Popularisation
3.3.1 Participatory Approaches
With financial and technical assistance of CILSS and IUCN, the Government prepared a new policy for the forestry sector. In this new policy, one of the major changes is that the forestry sector must not be isolated from the surrounding environment. Though the new policy was prepared following the participatory approach, popularization was needed to present the new national policy framework and provide relevant information to various stakeholders, including the local communities, on the overview and implications of the new forest policy. It is also to inform how the new policy will be applied and will affect the sector and the dependent people and what role each stakeholder will play in its implementation.
3.3.2 Sector Synergies
Further, the Forest Policy Popularization was requested to provide synergies with other natural resource policies (fisheries, water resources, agriculture, biodiversity and wildlife and the Gambia Environmental Action Plan) and to ensure that the new principles are known to all partners and stakeholders. In the past, little or no integration or synergy have existed between the different sectors.
3.3.3 Capacity Building and Empowerment
The local communities have limited capacity to understand and implement the policy. The effort of the Forestry Department is more and more focused on building the capacity of various stakeholders including the local communities on the
9
implementation of the policy and emphasizing gender dimension in policy implementation and its opportunities to improve rural livelihood and women’s empowerment.
3.4 Expressed need for Forest Legislative Review
3.4.1 Integration of new Concepts
The Forest Legislative Review (Forest Act) was considered necessary, as new developments have taken place in the forestry sector and the country in general. New concepts and approach introduced to the forestry sector such as the Gambia Forest Communication Concept, Market Analysis and Development, and community eco-tourism approach must be addressed and taken care of in the new Forest Act.
A Joint Forest Park Management and Community Control State Forest Management concept were developed and for its implementation a legal base is needed. Legal provisions are needed to determine the manner and ratio of benefit sharing in the new forest management ventures, as well as the legal back up for the implementation of sound market analysis and development with regards to free exploitation licenses and permits for communities engaged in the new programmes.
3.4.2 Back-up for Investments
The private sector continues to refrain from any investment despite the existing opportunities. The new forestry legislation must foresee the procedures of private ownership of natural forests and plantations. This will make the forestry sector as competitive for private investment as the other sectors of the economy.
3.4.3 Improved Protection Options
There are multiple shortcomings in the existing legislation. New provisions must be foreseen for better control of the utilization of forest resources and to ensure that fines and imprisonment terms commensurate with the degree of offences.
3.5 FAO cooperation and roadmap
3.5.1 Financial Cooperation
Through a Technical Cooperation Program (TCP) project, FAO has financed technical assistance to the GOTG.
The total cost estimate of the project was 614 000 US$, out of which FAO-contribution was 360 000 US$. The GOTG contribution was about 254 000 US$ which was for the most part in-kind.

10
The FAO Representation of The Gambia (FAOR), as FAO project budget holder, has provided administrative assistance throughout the implementation of the various phases of the project. All Steering Committee Meetings were held at the FAO Representation.
3.5.2 Technical Cooperation
FAO’s LTU has had the overall technical supervision of project implementation and provided technical assistance to the GOTG through national capacity building. The capacity building for DOF personnel and other forestry stakeholders has been carried out through workshops, training sessions and on-the job guidance, partly directly through LTU, partly through national or international consultants or trained DoF staff. Frequent backstopping missions and communication by FOMR, TCDCs or international consultants, supported all three components of the TCP.
3.5.3 Inception
The implementation of the project was initiated with an agreement by the Department of Forestry on the formation of an institutional framework for the coordination and execution of the activities under the project. A project Coordinator was nominated and staff for the Project Technical Unit (PTU) identified (chapter 3.7 Set-up of PTU). This was followed by an inception workshop which was held on the15th January, 2009 at the Baobab Holiday Resort at Kerr Serigne and was attended by more than seventy stakeholders from more than forty different institutions dealing directly or indirectly with natural resources management. This workshop was organized by the Department of Forestry and facilitated by an Inception Mission of two FAO Officers (Mr. Mohammed Saket and Ms Rebecca Tavani), who arrived in The Gambia from Rome on the 11th January, 2009. The following institutions attended and fully participated in the workshop:
1. Ministry of Forestry and the Environment (MoFEN) 2. Department of Forestry (DoF) 3. Regional Forestry Officers in all the five Regions in The Gambia 4. Department of Fisheries 5. Department of Planning 6. Department of Lands and Surveys 7. Department of Parks and Wildlife Management 8. National Environment Agency (NEA) 9. National Agricultural Research Institute (NARI) 10. Department of Agricultural Services 11. Gambia Bureau of Statistics (GBoS) 12. Department of Livestock Services 13. National Planning Commission (NPC) 14. Taiwanese Embassy 15. United Nations Development Programme (UNDP)

11
16. NACO 17. TANGO 18. Food and Agriculture Organization (FAO) 19. Ministry of Justice (MoJ) 20. National Beekeepers Association of The Gambia 21. Ministry of Energy 22. Local Government Authorities 23. Corner CILSS
3.5.4 Preparatory phase
The initial tasks to start the project following the inception workshop were the organization of a number of consultation workshops and discussions, meetings on various matters related to the implementation of all three components between the national team and the LTU. With the NFA as the largest scale component, matters of the discussion included first of all the design of the methodology aimed at harmonizing the reporting systems between countries while satisfying the national information needs, the designing of the project outline, formulation of its implementation procedures, reformulation and development of the field manuals, finalization of the field forms, orientation and training of the DoF personnel, etc. With the project launching, recruitment of consultants and procurement of inventory equipment and materials began (see Annex VI: equipment and material procured). As the project gave a lot of emphasis on enhancement of capacity for the generation of quality information on forest resources several training activities and a field visit were conducted from April 2009 to July 2010.
3.5.5 Implementation Phase
Field data collection was carried out between December 2009 and March 2010 and the processing and analysis of the collected field data was conducted from April 2010 to September 2010. Mapping activities contracted to a National Consultant (NC) started much earlier in project phase (June 2009) and were completed in November 2010. Details of the planned implementation are kept on file at DoF.
3.6 Organisational structure for the TCP
The organisation structure of the TCP of The Gambia was set up at the Forestry Department designated as Focal Institution. The project was led by a full time National Project Coordinator (NPC). The NPC was supported by the National Steering Committee (SC) whose mandate was to oversee the TCP project activities in The Gambia.

12
Figure 2: Organisation chart for the TCP in The Gambia
3.7 Set-up of PTU
As prerequisite to project implementation, the Department of Forestry, the national implementing institution, was to create an institutional framework within the Forestry Administration to be named Project Technical Unit (PTU) which would be responsible for the coordination and implementation of the components of the project. Consequently, an eight member core team for the PTU was set up by the Director of Forestry. The identified members for the PTU were as indicated in Table 2 below:
Table 1: Members of the PTU
No. Name Designation and position
1. Sambou B. Nget Senior Forest Officer, NPC, TCP Project
2. Momodou Lamin Njai Senior Forest Ranger, CF Section
3. Saikou K. Sonko Forest Officer, Survey Section
4. Ebou Sanneh Forest Ranger
6. Lamin Ceesay Senior Forest Officer, M&E
7. Kebba Jammeh Forest Officer, M&E
8. Abdoulie A. Sanneh Principal Forest Officer, RFO, WR
DPWM DoP NPC Water & Soil
Department of Forestry GBoS FAO
National Project Coordinator (NPC)
Field Team
Field Team
Field Team
Field Team
Field Team
National Steering Committee (SC)
13
4 The NFA 2009/2010
4.1 Executive Summary NFA
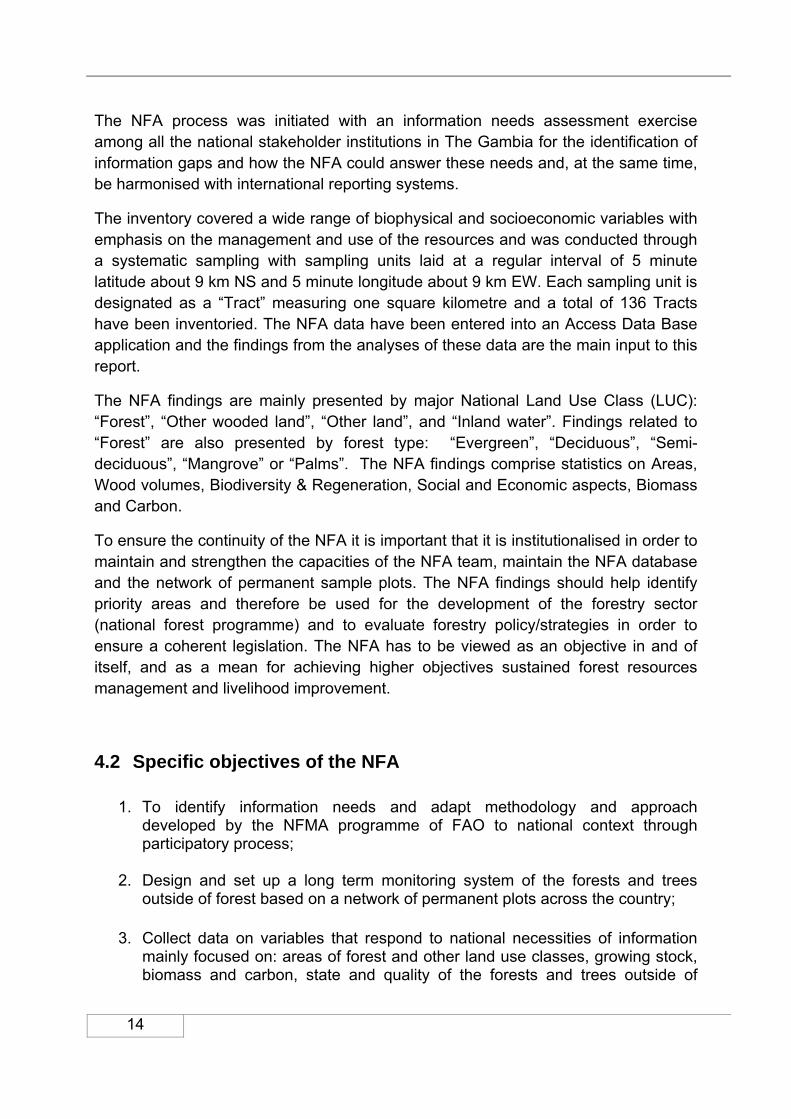
The National Forest Assessment of 2009/2010 is the fulfilment of a mandate to the Department of Forestry in accordance with the Forestry Act which calls for a National Forest Inventory every ten years. The Gambia undertook two national forest inventories in 1982 and 1997; however the data collected in these inventories were mostly limited to very few parameters (area and wood stocks). With such scope of information, the resources remain largely unknown to the policy makers. The component of trees outside forest and mangroves were not covered in the previous inventories despite their inestimable socio-economic and environmental roles in meeting local populations’ needs.
In addition to the products and services, any new national inventory must place emphasis on the rate of forest cover change in the country as well as enhance the knowledge base on all benefits (products and services) of the forests and trees which will serve as a base for the development of forest management plans and for developing a comprehensive National Forestry Action Plan (NFAP) for the country. For The Gambia, being signatory of various international conventions as well as regional ones, a “timely, reliable and accurate information on forests and forest ecosystems” is essential for public understanding and informed decision making as well as for the fulfilment of the requirements of these conventions.
The Department of Forestry, as the institution responsible for the implementation of this National Forest Assessment (NFA), carried out the field data collection from late 2009 to 2010. The national Remote Sensing Consultant, who was responsible for the Remote Sensing work, employed Aster images from 2009 for mapping the land uses and forest types. The overall technical supervision of the NFA implementation has been provided by the FAO Forestry Department in Rome through a Lead Technical Unit (LTU), TCDC experts and national consultants (see Annex III) who also provided a series of trainings to the counterparts from the Department of Forestry (DoF) to enhance their capacities in the areas of planning, NFA methodology, harmonisation of land use classifications, mapping, field survey, data management and reporting.
The overall goals of the NFA are to provide support to the National Forest Programme to contribute to sustainable natural resources management and increase rural livelihood through improved forestry management and efficient and cost effective forestry-related activities. The direct objective is to generate reliable information on forest resources for policy formulation, institutional capacity building, planning, conservation, international reporting and utilization of natural resources on a sustainable basis.
14
The NFA process was initiated with an information needs assessment exercise among all the national stakeholder institutions in The Gambia for the identification of information gaps and how the NFA could answer these needs and, at the same time, be harmonised with international reporting systems.
The inventory covered a wide range of biophysical and socioeconomic variables with emphasis on the management and use of the resources and was conducted through a systematic sampling with sampling units laid at a regular interval of 5 minute latitude about 9 km NS and 5 minute longitude about 9 km EW. Each sampling unit is designated as a “Tract” measuring one square kilometre and a total of 136 Tracts have been inventoried. The NFA data have been entered into an Access Data Base application and the findings from the analyses of these data are the main input to this report.
The NFA findings are mainly presented by major National Land Use Class (LUC): “Forest”, “Other wooded land”, “Other land”, and “Inland water”. Findings related to “Forest” are also presented by forest type: “Evergreen”, “Deciduous”, “Semi-deciduous”, “Mangrove” or “Palms”. The NFA findings comprise statistics on Areas, Wood volumes, Biodiversity & Regeneration, Social and Economic aspects, Biomass and Carbon.
To ensure the continuity of the NFA it is important that it is institutionalised in order to maintain and strengthen the capacities of the NFA team, maintain the NFA database and the network of permanent sample plots. The NFA findings should help identify priority areas and therefore be used for the development of the forestry sector (national forest programme) and to evaluate forestry policy/strategies in order to ensure a coherent legislation. The NFA has to be viewed as an objective in and of itself, and as a mean for achieving higher objectives sustained forest resources management and livelihood improvement.
4.2 Specific objectives of the NFA
1. To identify information needs and adapt methodology and approach
developed by the NFMA programme of FAO to national context through participatory process;
2. Design and set up a long term monitoring system of the forests and trees outside of forest based on a network of permanent plots across the country;
3. Collect data on variables that respond to national necessities of information mainly focused on: areas of forest and other land use classes, growing stock, biomass and carbon, state and quality of the forests and trees outside of

15
forests, social economic information about use and management of forest products and services;
4. Set up a data base to file and manage the field information for analysis and dissemination.
4.3 Forest Assessment History
Well before the launching of this NFA program, assessments and two National Forest Inventories were carried out, but they were based on a different demand and thus on different methodological approach:
4.3.1 Forest assessments before 1981
According to The common trees and shrubs of The Gambia, a publication by PERCIVAL (1968), “there are about 120 different tree and shrub species in The Gambia which are used in some way by the local population”. The description is found in PERCIVAL (1968) on pages 20-268. Little was known though about the actual forest areas of The Gambia and the vegetation composition. It was evident though, that without precise information concerning the forest areas, the distribution and density of usable tree species, no long term planning could have been made and no safe decisions taken. On the other hand it was obvious that the forests of The Gambia were seriously endangered and therefore urgent actions needed to be undertaken for the conservation and systematic management based on proper plans.
4.3.2 National Forest Inventory – 1981/1982
In regards to the situation described above, the Republic of The Gambia requested for technical assistance from the Federal Republic of Germany for the execution of a national forest inventory. The target of that national forest inventory was to get the required information for a medium and long term forestry planning. In particular, it was the target to determine the timber and fire wood volume subdivided for different tree species or groups of tree species, and to estimate the present volume increment.
A national forest inventory of The Gambia was designed as sampling inventory with pre-stratification in order to reduce the cost input and workload but to get the required information. As the forest inventory was to provide mainly the wood volume, the pre-stratification was carried out according to stand density classes, i.e. the forests had been classified according to the stock density. Only Gallery forests and mangroves which form special forest types had been delimited irrespective of density classes. This kind of pre-stratification was conducted with the help of aerial photographs – pan-chromatic black and white ones and false colour infrared ones – which were taken in October/November 1980 in a scale of 1:25 000.

16
The results of the a field sampling inventory, including the country wide land use map, were presented under GGFP Report No. 10 (FORSTER, H. 1983). It provided a data base for forest policy and general forest planning for the whole of The Gambia as well as for more detailed planning in the regions. It also served as a description of the state and condition of the vegetation cover of the country at that time.
4.3.3 National Forest Inventory – 1997/1998
Fifteen years after the first forest inventory (1981/1982), a follow up inventory was necessary to provide a view towards the future. An assessment of the past period of the changes in the vegetation cover in terms of area and structure was an expected activity.
Under the Upper River Division Forestry Project (URDFP), supported by the European Community, financial means to conduct this follow up inventory were available to start the works in 1997. The land use mapping was already carried out under financial support of several donor agencies from different countries, namely USAID to conduct the aerial photography and GTZ to conduct the photo interpretation, mapping and printing of the respective land use maps. The maps were then made available for the National Environment Agency (NEA) by end of February 1998. The inventory works started in November 1997 with the design of the inventory and the training of the field teams.
4.3.4 The design of NFA 2009/10
The new NFA approach is applied on all land uses, with special emphasis to collect information on forests and tree resources, their uses and users. Thus, it also takes trees outside forest and mangroves into consideration.
The present NFA has adopted a set of globally harmonized terms and definitions to provide information also for global assessments. Despite the adoption of globally harmonized terms and definitions, country specific terms and definitions have also been retained. These may be used for the development of forest policies, forestry programs, overall forest management, sustainable development, conservation of the resources, etc. The NFA 2009/10 went beyond the biometric information and gathered as well information on other forest resources (i.e. herbs, fauna, and minerals) and features (i.e. soil condition, erosion, and biomass). The physical field data would be compared with data gained from Remote Sensing. Besides the collection of physically evident data in the field, interviews were held with field guides and households in the vicinity to explore management practices and other socioeconomic data (i.e. gender aspects, dependency, perceptions, awareness etc).
17
For The Gambia, this was a new approach, concerning methodology and content. Thus, new technologies and skills were introduced to the forestry sector though this project.
The project was designed for implementation in three phases:
Phase I: Preparation, Training and Mapping
Phase II: Field Survey and Remote Sensing
Phase III: Data Processing, Analysis and Reporting
4.4 Phase I: Preparation, Training and Mapping
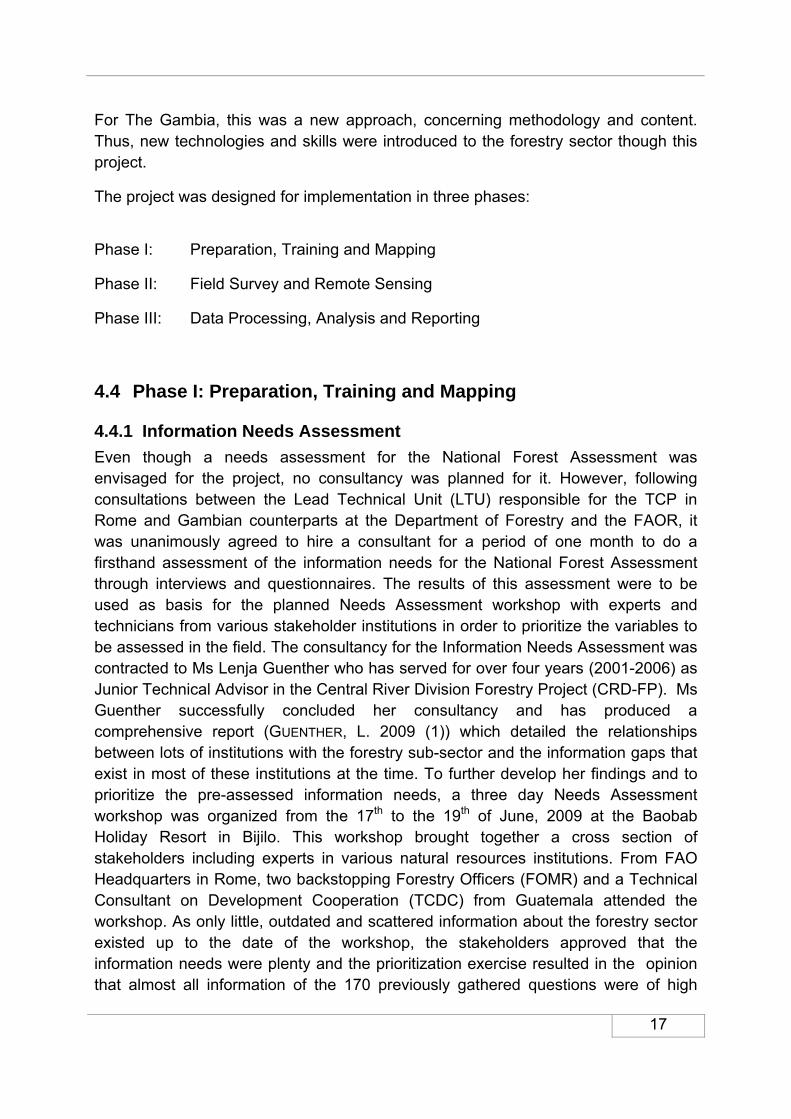
4.4.1 Information Needs Assessment
Even though a needs assessment for the National Forest Assessment was envisaged for the project, no consultancy was planned for it. However, following consultations between the Lead Technical Unit (LTU) responsible for the TCP in Rome and Gambian counterparts at the Department of Forestry and the FAOR, it was unanimously agreed to hire a consultant for a period of one month to do a firsthand assessment of the information needs for the National Forest Assessment through interviews and questionnaires. The results of this assessment were to be used as basis for the planned Needs Assessment workshop with experts and technicians from various stakeholder institutions in order to prioritize the variables to be assessed in the field. The consultancy for the Information Needs Assessment was contracted to Ms Lenja Guenther who has served for over four years (2001-2006) as Junior Technical Advisor in the Central River Division Forestry Project (CRD-FP). Ms Guenther successfully concluded her consultancy and has produced a comprehensive report (GUENTHER, L. 2009 (1)) which detailed the relationships between lots of institutions with the forestry sub-sector and the information gaps that exist in most of these institutions at the time. To further develop her findings and to prioritize the pre-assessed information needs, a three day Needs Assessment workshop was organized from the 17th to the 19th of June, 2009 at the Baobab Holiday Resort in Bijilo. This workshop brought together a cross section of stakeholders including experts in various natural resources institutions. From FAO Headquarters in Rome, two backstopping Forestry Officers (FOMR) and a Technical Consultant on Development Cooperation (TCDC) from Guatemala attended the workshop. As only little, outdated and scattered information about the forestry sector existed up to the date of the workshop, the stakeholders approved that the information needs were plenty and the prioritization exercise resulted in the opinion that almost all information of the 170 previously gathered questions were of high
18
importance to be answered. Based on the outcome of this workshop a second report on the processed information was produced (Guenther, L. 2009 (2)), which describes, how the information needs were integrated in the draft field forms to gather the requested information. In a follow up workshop the field forms were validated to refine and develop the preliminary list of expected results of NFA. The extracted 109 expected query results would facilitate a prioritized data processing.
Resulting from above, a proposal for capturing the socio-economic variables through questionnaires was developed and the final document was submitted to different stakeholders for feedback. This proposal was included in the survey component of the inventory to explore the perception of the population visa-vie sustainable forest management, forest policy, biodiversity, environmental problems and socio-cultural values. All these are important for planning and for sensitization and education purposes.
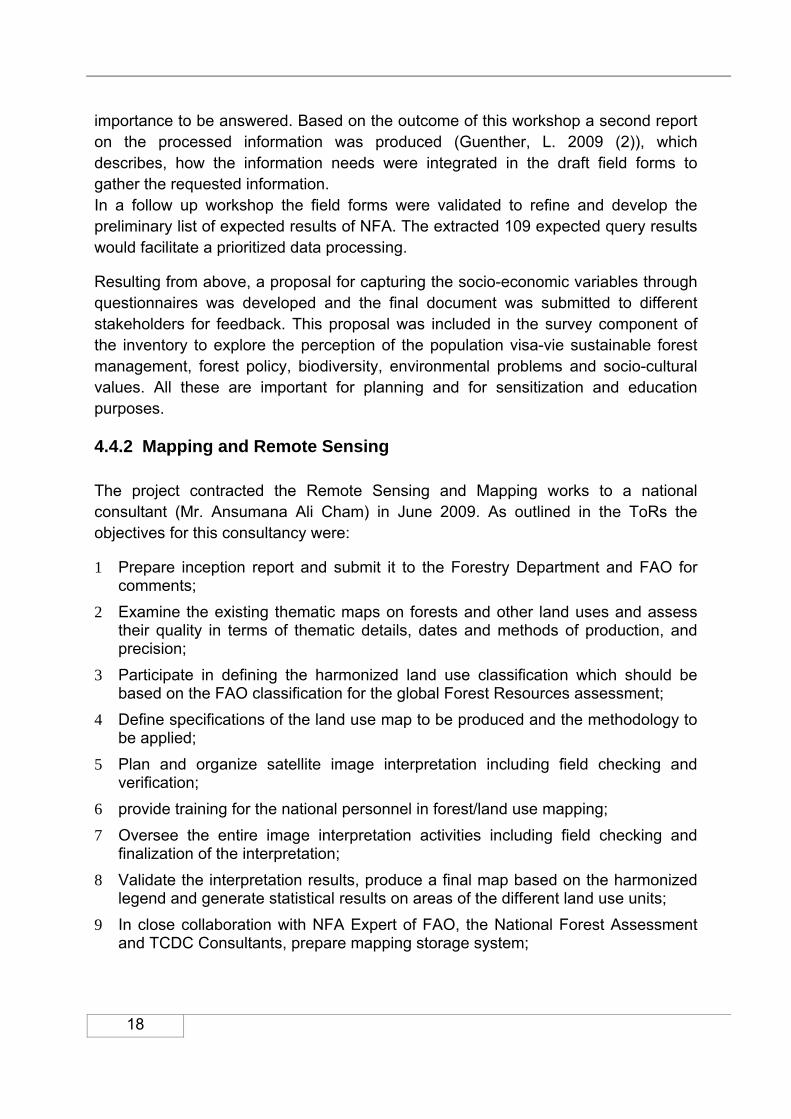
4.4.2 Mapping and Remote Sensing
The project contracted the Remote Sensing and Mapping works to a national consultant (Mr. Ansumana Ali Cham) in June 2009. As outlined in the ToRs the objectives for this consultancy were:
1 Prepare inception report and submit it to the Forestry Department and FAO for comments;
2 Examine the existing thematic maps on forests and other land uses and assess their quality in terms of thematic details, dates and methods of production, and precision;
3 Participate in defining the harmonized land use classification which should be based on the FAO classification for the global Forest Resources assessment;
4 Define specifications of the land use map to be produced and the methodology to be applied;
5 Plan and organize satellite image interpretation including field checking and verification;
6 provide training for the national personnel in forest/land use mapping; 7 Oversee the entire image interpretation activities including field checking and
finalization of the interpretation; 8 Validate the interpretation results, produce a final map based on the harmonized
legend and generate statistical results on areas of the different land use units; 9 In close collaboration with NFA Expert of FAO, the National Forest Assessment
and TCDC Consultants, prepare mapping storage system;
19
10 Work with the TCDC consultant and with other national consultants to reinforce the Forestry Department in strengthening the specialized Project Technical Unit for resources monitoring and information management;
11 Prepare and submit final consultancy report describing the planned activities, the method followed for land use mapping, training programme and beneficiaries and results of the mapping work and the results achieved.
Five day training on GIS and remote sensing was organized by the mapping consultant for the PTU as well as staff from the Dept. of Water Resources, GBoS, Dept. of Lands and Surveys and Department of Parks and Wildlife Management. The participants were exposed to the basics of the GIS software (ArchView) and remote sensing software (Idrisi).
The Remote Sensing Consultant with the support of the Project Coordinator was able to collect following maps in soft and hard copies from Gambian Bureau of Statistics (GBoS) and the Department of Lands and Surveys (DL&S):
Topographic map at scale of 1/50000 prepared in 2002 jointly by JICA Japanese project under government technical cooperation programme and the government of the Republic of the Gambia, on the basis of field survey data by the Department of Lands and Surveys and the JICA study team, December 2001.
Land use Map of The Gambia, DL&S 2003, 1/50000; Settlement map of the Gambia, GBoS 2003, 1/50000; Road network vector map of The Gambia, DL&S 2003, 1/50000; Population Data, GBoS 2003; Google Earth Space Imagery 2009; Landsat imagery (finally not used); Aster Satellite Images, September 2007 and November 2008.
750 UTM coordinates for the 152 tracts and the respective 4 plots (152 tract centers + 4plots x152 tracts=750 UTM coordinates), provided from LTU (Rome) were converted as GPS points on the topographic map (DL&S, 2003, 1/50000) using MS Excel. Having the GPS points plotted on the topographic maps, so called “zoom maps” were produced. The zoom maps were supposed to facilitate orientation for the inventory team in the field. For user friendly handling in the field, the maps were produced as A4 sheets with clear images of the topographic features, the tract number and indication of the center points of the respective tracts and their respective four plots as points. A New mapping software (ArcGIS 9.3) was procured and delivered to the department to facilitate the mapping process. Aster Satellite Images from September 2007 and November 2008 were procured and handed over to the Department of Forestry for the classification of the different land use/cover types (see also chapter 4.4.3) and the production of forest land use map.
20
These panchromatic (black and white) satellite images have been successfully classified using the harmonized land use classification system (chapter 4.4.3 Classifications of forests and land uses). For the classification of the satellite images the image need to be “trained”. For the “training” of the images first of all a so called “unsupervised” classification was undertaken, whereby classifications were automatically produced with IDRISI mapping software. In this automatic process the diverse land use covers would receive specific colors on the image, whereby the classification can only be assumed but need to be proven in the field. Therefore sample sites of each unsupervised classification were chosen and GPS coordinates taken from the image. The sample site would thus be traced with the GPS in the field and the pre-assessed land use cover had to be recognized and matched to the automatically produced color code. Thus, the remote sensing and mapping team would go out to the field and vice–versa locate the diverse land use and cover with the GPS receiver. This field investigation, called “Ground Truthing”, was undertaken countrywide (three trips). Following, back to the office, the GPS coordinates were entered on the image using Erdas Imagine Software (Remote Sensing Software). With this data, the programme would recognize all areas with the same spectral characteristics, thus being able to produce a resultant image, shading the different land use and cover in specific colors, according to a color code. The color code can be amended manually to suit the specific features (i.e. blue for water, green for evergreen). Thus the panchromatic (black and white) satellite images were eventually transformed into a color coded, multi-spectral land use/cover image. This procedure is called a “supervised classification”, meaning that the land use and cover classes have been approved in the field beforehand.
Remote sensing results were eventually supposed to supplement and validation the collected field data. Where discrepancies of results were detected, a field visit was necessary to clarify the situation and correct the results.
Details on methodology and outcome can be found in the final report and the related land use/ forest cover map and supportive/related maps (CHAM, 2011).
4.4.3 Classifications of forests and land uses
The TCDC for the project, Mr. Rodrigo Rodas arrived in the Gambia on the 7th of June, 2009 from Guatemala for a period of two months. While in the Gambia the TCDC worked closely with the National Project Coordinator and other national consultants in the classification of the forest types and other land-uses in the Gambia, taking into consideration the FAO Global Forest Resources Assessment standards. In the same manner he assisted in adapting the field inventory forms to the Gambian situation and realities.

21
Through collaborative efforts of the TCDC expert, the National Team and a backstopping mission composed by two FAO Forestry Officers (Rebecca Tavani and Marco Piazza), the land use/vegetation cover classification and its definitions were adjusted according to the Gambian realities. In addition, these adjustments were incorporated in the field manual. This process was greatly facilitated through consultations of relevant documents (satellite images, field work data, existing records, maps and charts) and by discussion with the senior cadre of the Department of Forestry. To further concretize these initiatives, a field recognizance trip was conducted into the interior of the country precisely in Western, Lower River and Central River Regions, to better understand the different land uses in the country based on the new classification system and to further support the vegetation classification process.
In November 2009, a validation workshop of the land-use/cover classification system developed by the project was conducted by the TCDC (Selmi Khemaies) with experts from key institutions like the Gambia Bureau of Statistics, Dept. of Water Resources, Dept. of Parks and Wildlife Management, Dept. of Livestock, Dept. of Agriculture among others.
The classification system used to define land use/cover classes was based on a dichotomous approach and included four levels:
The first level is composed of the global classes designed for the assessment of resources at global level and is based on the classification system developed by the Forest Resources Assessment Programme of FAO to ensure harmonisation between countries for regional or global assessments. The global classes include Forests, Other wooded land, Other land and Inland water.
The second, third, fourth and fifth levels are country specific, and include additional classes designed to meet specific national and sub-national information needs. The second level applies to all classes and differentiates between land
use/cover types; The third level only applies to evergreen, semi-deciduous and deciduous
forests and describes its naturalness; The fourth level mainly refers to vegetation canopy cover and is
applicable only to evergreen, semi-deciduous, deciduous forests, shrubs and natural grassland.
The fifth level refers to Riverine/Gallery forests and is applicable only for evergreen forests because this type is the one along rivers.
A code with 2 to 5 characters has been assigned to each class in order to facilitate data collection and input.
22
The classes and related codes to be used in the NFI of The Gambia are shown in the NFA Field Manual (RODAS, 2009). Figure 3: Land use/cover classification for the NFA in The Gambia shows the dichotomous approach and the class subdivision.
With inputs from the backstopping FAOR mission and the TCDC and following the recommendations of experts in this field, especially of the LTU experts and the senior staff of the DoF, 36 land use classes were finally identified for use during the collection of the field data (see figure 3 below) .
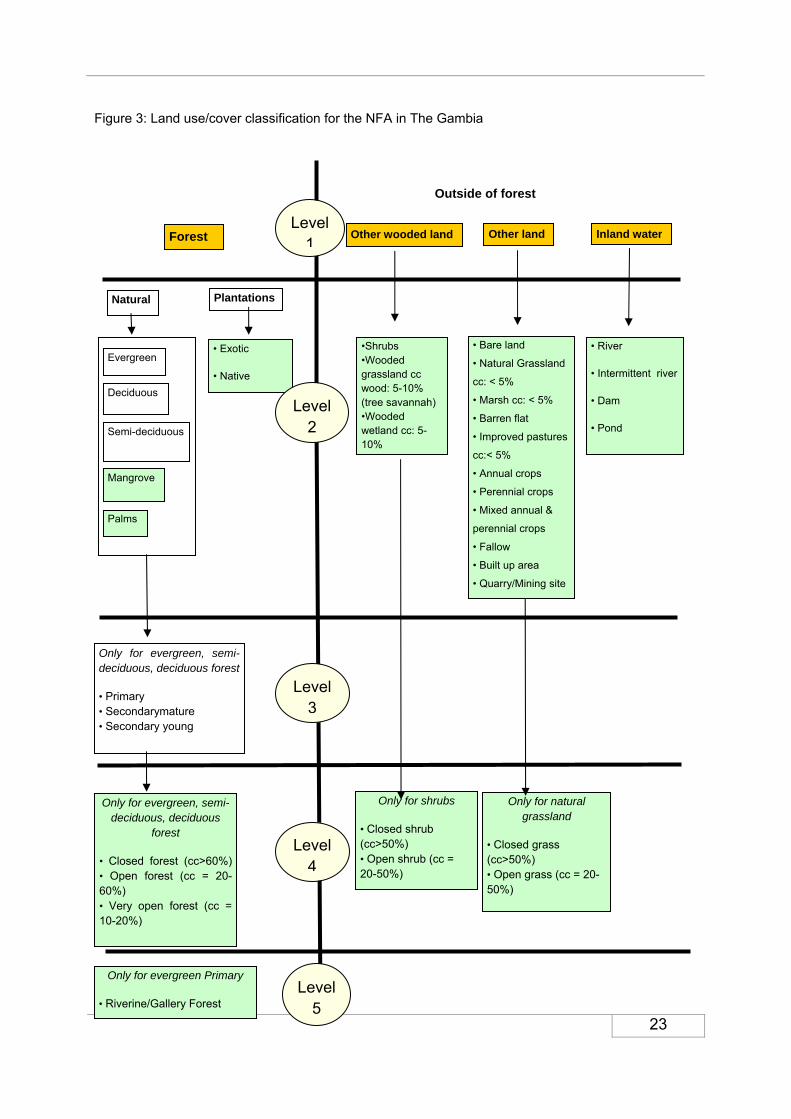
23
Figure 3: Land use/cover classification for the NFA in The Gambia
Forest
Evergreen
Natural Plantations
Only for evergreen, semi-deciduous, deciduous forest
• Primary • Secondarymature • Secondary young
Level 3
Other wooded land Other land Inland water
Outside of forest
•Shrubs •Wooded grassland cc wood: 5-10% (tree savannah)•Wooded wetland cc: 5-10%
• Bare land
• Natural Grassland
cc: < 5%
• Marsh cc: < 5%
• Barren flat
• Improved pastures
cc:< 5%
• Annual crops
• Perennial crops
• Mixed annual &
perennial crops
• Fallow
• Built up area
• Quarry/Mining site
• River
• Intermittent river
• Dam
• Pond
Level 1
Deciduous
Semi-deciduous
Mangrove
Palms
• Exotic
• Native
Level 2
Level 4
Only for evergreen, semi-deciduous, deciduous
forest
• Closed forest (cc>60%) • Open forest (cc = 20-60%) • Very open forest (cc = 10-20%)
Only for shrubs
• Closed shrub (cc>50%) • Open shrub (cc = 20-50%)
Only for natural grassland
• Closed grass (cc>50%) • Open grass (cc = 20-50%)
Level 5
Only for evergreen Primary
• Riverine/Gallery Forest
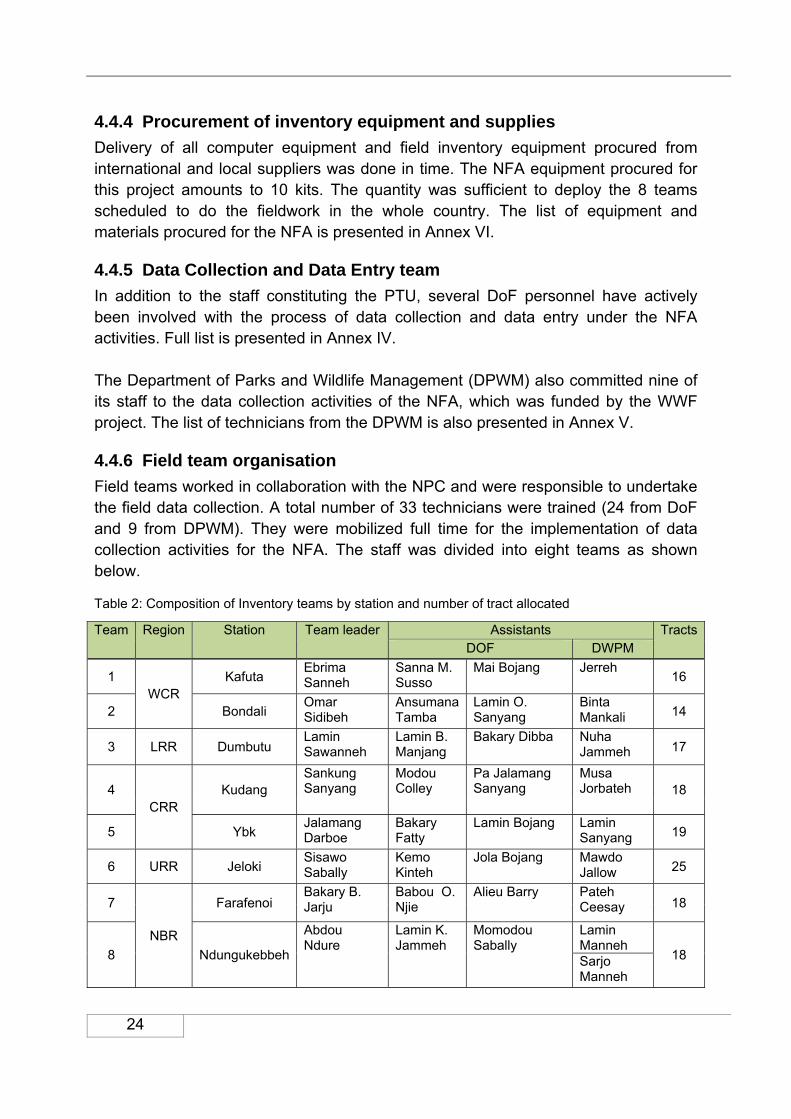
24
4.4.4 Procurement of inventory equipment and supplies
Delivery of all computer equipment and field inventory equipment procured from international and local suppliers was done in time. The NFA equipment procured for this project amounts to 10 kits. The quantity was sufficient to deploy the 8 teams scheduled to do the fieldwork in the whole country. The list of equipment and materials procured for the NFA is presented in Annex VI.
4.4.5 Data Collection and Data Entry team
In addition to the staff constituting the PTU, several DoF personnel have actively been involved with the process of data collection and data entry under the NFA activities. Full list is presented in Annex IV. The Department of Parks and Wildlife Management (DPWM) also committed nine of its staff to the data collection activities of the NFA, which was funded by the WWF project. The list of technicians from the DPWM is also presented in Annex V.
4.4.6 Field team organisation
Field teams worked in collaboration with the NPC and were responsible to undertake the field data collection. A total number of 33 technicians were trained (24 from DoF and 9 from DPWM). They were mobilized full time for the implementation of data collection activities for the NFA. The staff was divided into eight teams as shown below.
Table 2: Composition of Inventory teams by station and number of tract allocated
Team Region Station Team leader Assistants TractsDOF DWPM
1 WCR
Kafuta Ebrima Sanneh
Sanna M. Susso
Mai Bojang Jerreh 16
2 Bondali Omar Sidibeh
Ansumana Tamba
Lamin O. Sanyang
Binta Mankali 14
3 LRR Dumbutu Lamin Sawanneh
Lamin B. Manjang
Bakary Dibba Nuha Jammeh 17
4 CRR
Kudang Sankung Sanyang
Modou Colley
Pa Jalamang Sanyang
Musa Jorbateh 18
5 Ybk Jalamang Darboe
Bakary Fatty
Lamin Bojang Lamin Sanyang 19
6 URR Jeloki Sisawo Sabally
Kemo Kinteh
Jola Bojang Mawdo Jallow 25
7
NBR
Farafenoi Bakary B. Jarju
Babou O. Njie
Alieu Barry Pateh Ceesay 18
8 Ndungukebbeh
Abdou Ndure
Lamin K. Jammeh
Momodou Sabally
Lamin Manneh
18 Sarjo Manneh

25
Each NFA field team was composed by four members, taking into account the amount of information to be collected on the various land uses and the division of tasks among individuals. One member of the field team (temporary assistant) was hired locally and acted as guide in the field.
Each team included a forester as team leader and three other persons with knowledge on: forestry, botanic, soil, sociology and wildlife as shown in Table 3: Field Teams composition.
Table 3: Field Teams composition
Field Team Member
Designation Number
Team Leader AC Head, Forest Rangers, Forest Department 1 Assistant Team Leader
IA Heads, Forest Rangers, Forestry Department Park Assistants & Wardens, DPWM
3
Local guide Locally hired 1
Based on the agreed land use classes at national level for the purpose of NFA and in agreement with FRA standards of FAO, 7 field forms (see Annex I) were developed for recording the field survey data. During the field works, the field teams were regularly supervised to ensure the correct recording of data and to ensure the quality of the data recorded.
Figure 4: NFA Field Team in URR
The team leaders were responsible for submitting the completed field forms to the PTU for review. Before a set of field forms was cleared for data entry, the data needed to be checked and validated by the NPC or the TCDC expert. The field

26
forms that were found incomplete were returned to the responsible team leader with instructions on what was missing or incorrectly registered and how to complete the form.
4.4.7 Technical training of the national counterpart
Under the NFA project a series of trainings was held in the areas of:
Forest and tree inventory methodology including sampling design, classification system, harmonization and variables;
Forest and land use mapping; Field survey; Data processing, information system development and reporting; Information management;
Training and backstopping on the land use classification was undertaken as described in chapter 4.4.3 Classifications of forests and land uses.
Training and backstopping for mapping and remote sensing is described in chapter 4.4.2 Mapping and Remote Sensing.
For the implementation of the field survey following larger, scale training and backstopping was undertaken.
Thirty eight engineers and technicians from the DoF and the Department of Parks and Wildlife Management (DPWM) were trained on field data collection methods. The training was facilitated by the TCDC (Selmi Khemaies), two FAO NFMA experts from Rome and a national consultant (Kanimang Camara) from NACO. The Training Workshop was held in Jenoi in LRR from the 6th to 18th of November. The opening was graced by the presence of the then newly appointed Minister of Forestry and the Environment (Hon. Jato S. Sillah), the FAO Representative in The Gambia (Dr Ahmadou Babagana), the Governor of LRR and other officials from DoF, FAO, LGA and the press.
The technicians were introduced to the NFMA approach and field methodology through class work and extensive field exercises during which the participants learned all the phases of the field procedure, work organization, utilization of measurement tools, and became familiar with the seven field forms used to record the information collected.
During the training, a significant amount of feedback was received on the NFA Field Manual (RODAS, 2009) and its included field forms which had been modified after conducting the June Information Needs Assessment (see also chapter 4.4.1 Information Needs Assessment). This version was further improved based on feedback received from field crews to better serve the purpose.

27
The field crews were also given specific training on household interview techniques by Mr Kanimang Camara, a specialist on rural extension and training.
Following the conclusion of the training phase and the official initiation of the field data collection phase of the project, logistics arrangements were immediately worked out and the teams started the data collection on the 9th of December 2009 as planned.
Training and backstopping undertaken for the data processing is described in chapter 4.6.3 Data base application).
4.5 Phase II: Field Survey and Remote Sensing Analyses
4.5.1 Sampling design and Field Data Collection
The NFA applies two complementary methods of data collection. The first is from a network of field samples distributed along a systematic grid. The second is from complementary mapping using remote sensing techniques (see also chapter 4.4.2 Mapping and Remote Sensing). The field sampling is based on sample plots grouped in tracts. Each tract contains four plots of 5,000 m2. The plots are designed to monitor the dynamic of changes of the land use systems and of the forest and tree cover in the country.
Following the conclusion of the technical training phase of the field crews, logistics arrangements were immediately worked out and the teams started the data collection. The field work ended in April 2010. Due to inaccessibility, 6 tracts situated either in mangroves or Islands could not be accessed on time. However, data from these tracts was later collected in the month August 2010 and entered in the database.
4.5.1.1 Tract selection and distribution The sampling design adopted for the NFA in The Gambia is systematic. The number of sampling units or tracts to be surveyed was determined by the required statistical reliability of the data, the available financial and human resources for the assessment, and with a view to enabling periodic monitoring. The inclusion of the mangroves ecosystems was taken into consideration to be well represented. Sample units or tracts were established every 5 minutes in latitude and 5 minutes in longitude. It resulted in 152 selected tracts nation-wide. The sample density and distribution is shown in
Table 4: Tract density in The Gambia and Figure 5: Distribution of tracts for the National Forest Inventory of The Gambia.
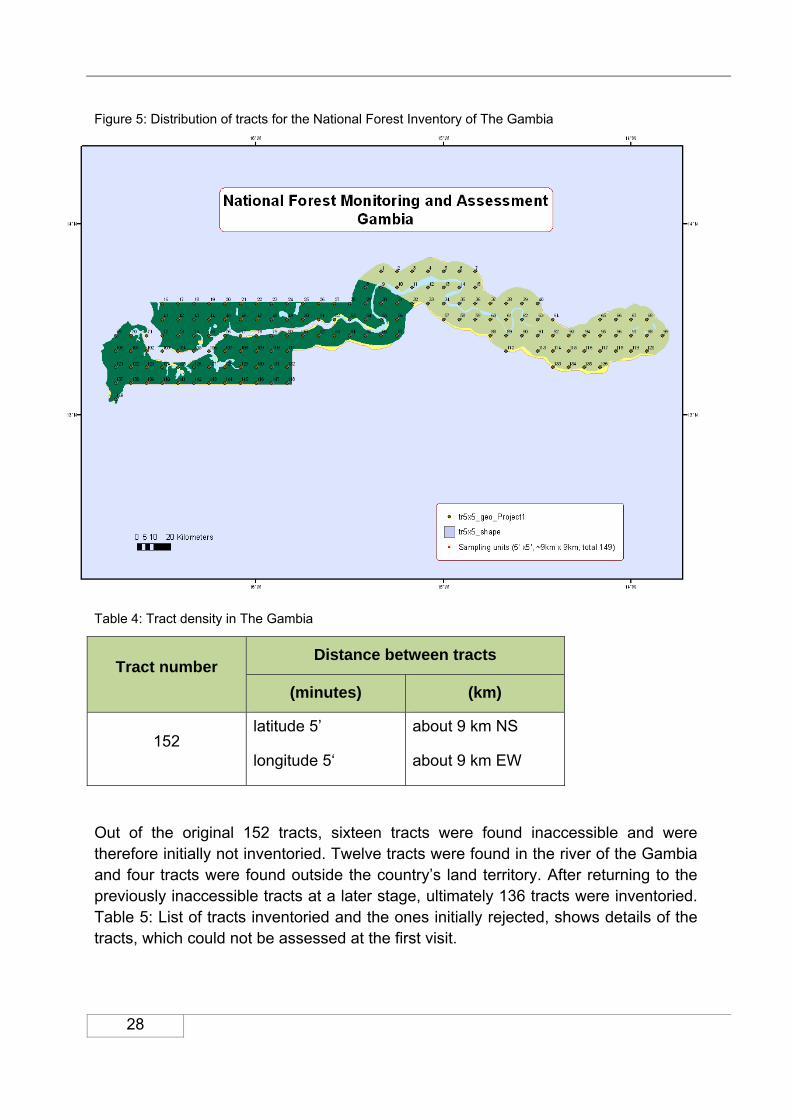
28
Figure 5: Distribution of tracts for the National Forest Inventory of The Gambia
Table 4: Tract density in The Gambia
Tract number Distance between tracts
(minutes) (km)
152 latitude 5’
longitude 5‘
about 9 km NS
about 9 km EW
Out of the original 152 tracts, sixteen tracts were found inaccessible and were therefore initially not inventoried. Twelve tracts were found in the river of the Gambia and four tracts were found outside the country’s land territory. After returning to the previously inaccessible tracts at a later stage, ultimately 136 tracts were inventoried. Table 5: List of tracts inventoried and the ones initially rejected, shows details of the tracts, which could not be assessed at the first visit.
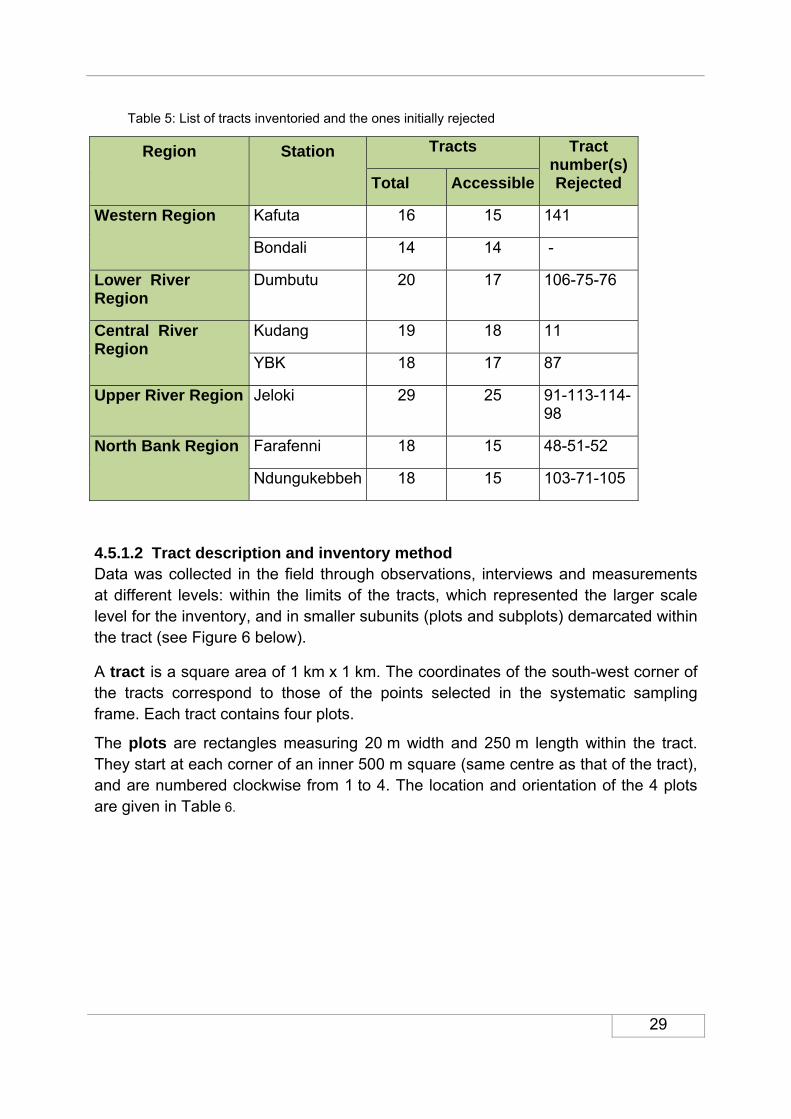
29
Table 5: List of tracts inventoried and the ones initially rejected
Region
Station
Tracts Tract number(s) Rejected Total Accessible
Western Region Kafuta 16 15 141
Bondali 14 14 -
Lower River Region
Dumbutu 20 17 106-75-76
Central River Region
Kudang 19 18 11
YBK 18 17 87
Upper River Region Jeloki 29 25 91-113-114-98
North Bank Region Farafenni 18 15 48-51-52
Ndungukebbeh 18 15 103-71-105
4.5.1.2 Tract description and inventory method Data was collected in the field through observations, interviews and measurements at different levels: within the limits of the tracts, which represented the larger scale level for the inventory, and in smaller subunits (plots and subplots) demarcated within the tract (see Figure 6 below).
A tract is a square area of 1 km x 1 km. The coordinates of the south-west corner of the tracts correspond to those of the points selected in the systematic sampling frame. Each tract contains four plots.
The plots are rectangles measuring 20 m width and 250 m length within the tract. They start at each corner of an inner 500 m square (same centre as that of the tract), and are numbered clockwise from 1 to 4. The location and orientation of the 4 plots are given in Table 6.
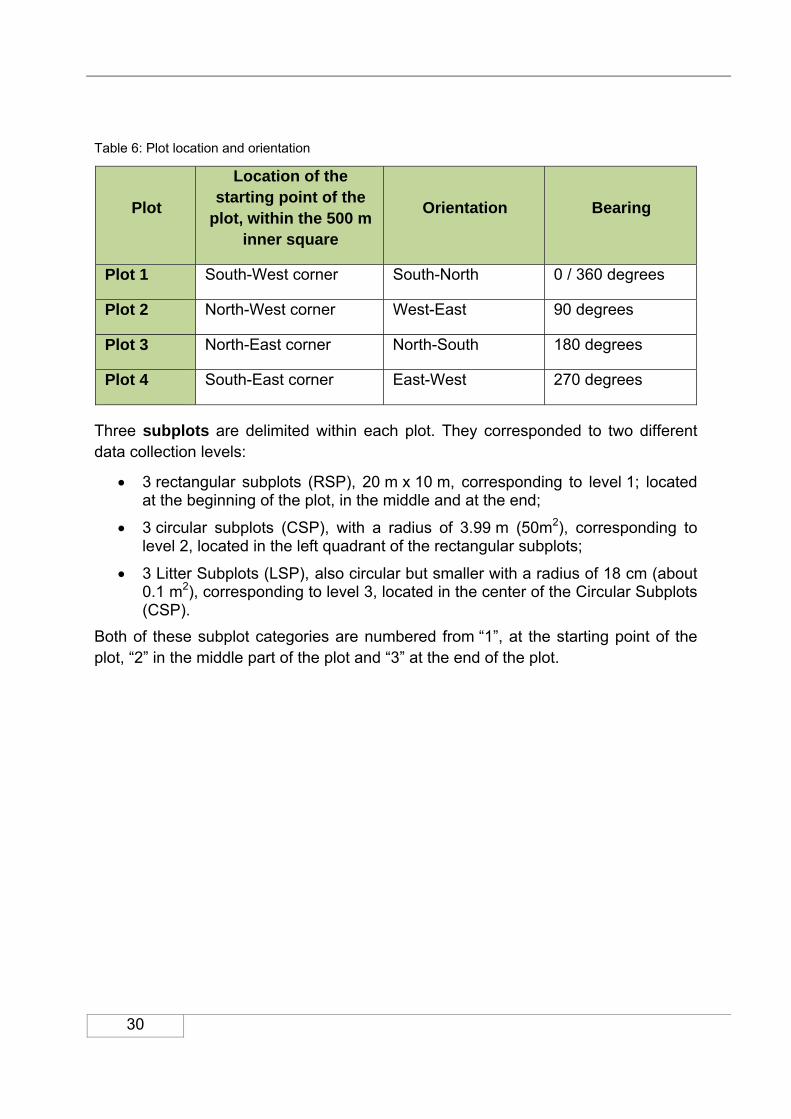
30
Table 6: Plot location and orientation
Plot
Location of the starting point of the
plot, within the 500 m inner square
Orientation Bearing
Plot 1 South-West corner South-North 0 / 360 degrees
Plot 2 North-West corner West-East 90 degrees
Plot 3 North-East corner North-South 180 degrees
Plot 4 South-East corner East-West 270 degrees
Three subplots are delimited within each plot. They corresponded to two different data collection levels:
3 rectangular subplots (RSP), 20 m x 10 m, corresponding to level 1; located at the beginning of the plot, in the middle and at the end;
3 circular subplots (CSP), with a radius of 3.99 m (50m2), corresponding to level 2, located in the left quadrant of the rectangular subplots;
3 Litter Subplots (LSP), also circular but smaller with a radius of 18 cm (about 0.1 m2), corresponding to level 3, located in the center of the Circular Subplots (CSP).
Both of these subplot categories are numbered from “1”, at the starting point of the plot, “2” in the middle part of the plot and “3” at the end of the plot.

31
Plot starting point
10 m
Subplot
Towards plot starting point Rectangular
Subplot (RSP)
Circular Subplot (CSP)
Plo
t 1
Plot 3
Plot
250 m
500 m
1 Km
1 Km
Plot 2
Tract X,Y
Plot central line
.
(+ 10 m)
(-10 m)20 m
Towards end of the plot
Plot
Plot orientation
Measurement Point (MP)
5 m
3.99 m
Litter Subplot (LSP)
Sampling Unit (SU) / Tract
Fallen Deadwood
Transect (FDT)
10 m
RSP3 and CSP3
125
m
250
m
20 m
RSP2 and CSP2
RSP1 and CSP1
Plot end point
Figure 6: Tract, plot and subplot design
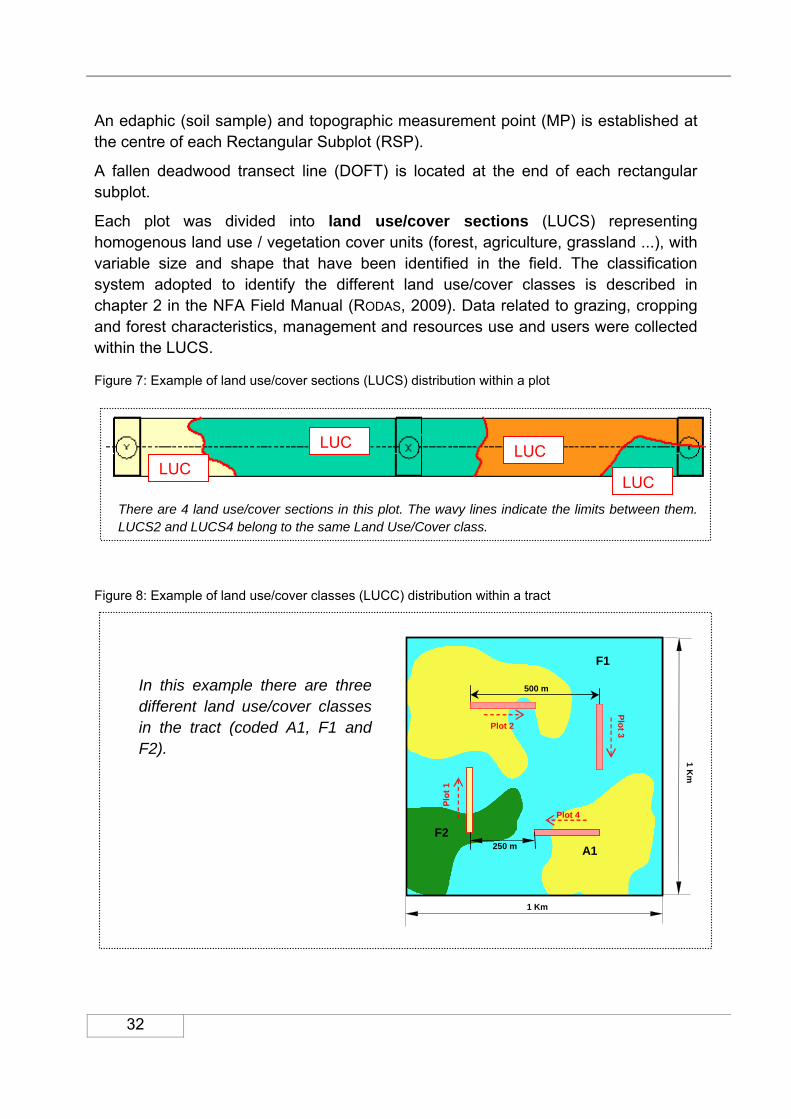
32
An edaphic (soil sample) and topographic measurement point (MP) is established at the centre of each Rectangular Subplot (RSP).
A fallen deadwood transect line (DOFT) is located at the end of each rectangular subplot.
Each plot was divided into land use/cover sections (LUCS) representing homogenous land use / vegetation cover units (forest, agriculture, grassland ...), with variable size and shape that have been identified in the field. The classification system adopted to identify the different land use/cover classes is described in chapter 2 in the NFA Field Manual (RODAS, 2009). Data related to grazing, cropping and forest characteristics, management and resources use and users were collected within the LUCS.
Figure 7: Example of land use/cover sections (LUCS) distribution within a plot
There are 4 land use/cover sections in this plot. The wavy lines indicate the limits between them. LUCS2 and LUCS4 belong to the same Land Use/Cover class.
Figure 8: Example of land use/cover classes (LUCC) distribution within a tract
Plo
t 1
Plo
t 3
Plot 4
250 m
500 m
1 Km
1 Km
Plot 2
A1
F1
F2
In this example there are three different land use/cover classes in the tract (coded A1, F1 and F2).
LUCLUC LUC
LUC

33
For the household survey, the unit used to select the households to be interviewed was a 1 km radius circle from the tract centre. It was called the Household Survey Area (HSA).
Figure 9: Area used for selecting household for the household survey
Table 7: Survey unit specifications
Unit Shape Size (area) Number
Tract Square 1000 m x 1000 m (1 km2) 1
Plot Rectangle 250 m x 20 m (5000 m2) 4/tract
Rectangular Subplot (RSP) Rectangle 20 m x 10 m (200 m2) 3/plot
Circular Subplot (CSP) Circular Radius r = 3,99 m (50 m2) 3/plot
Litter Subplot (LSP) Circular Radius r = 18,0 cm (0.1 m2) 3/plot
Fallen Dead Wood Transect (DOFT) Line 20 mts 3/plot
Land Use/Cover Sections (LUCS) Variable Variable Variable
Land Use/Cover Class (LUCC) Variable Variable Variable
Household Survey Area (HSA) Circular Radius r = 1km (12.6 km2) 10/HSA
Note: All distances indicated are horizontal distances.
1 Km
Tract
Household Survey Area (HSA)
Households selected to be interviewed for the household survey

34
4.5.1.3 Access to plot
For each tract the plots were located with the help of the UTM coordinates and topographic “zoom” maps on which the plots have been indicated. Some reference points that facilitated the orientation in the field (e.g. roads, rivers...) were also identified on the field maps. Local guides were also hired to provide useful information on how to access the plots more easily.
The order in which the plots were inventoried (usually already decided during the planning phase) depended on the accessibility. Nevertheless, plot code (1 to 4) and the orientation were always respected. The data collection process always started at the plot starting point.
Navigation in the field to arrive to the first plot starting point was assured with the help of a GPS receiver where the starting points of each plot have been pre-registered as waypoints, using the “GOTO” function. The GPS normally indicates a straight distance and bearing to the active GOTO waypoint. But in some cases the path to the waypoint required meandering around topographic obstacles or following as far as possible roads or existing paths.
4.5.1.4 Establishment of permanent plot
The position of the starting points of all 4 plots in the tract were precisely located and marked with a permanent marker and properly referenced to ensure that they can be easily located in the future. Galvanized metal tubes were inserted fully into the ground so that they were no longer visible. The markers were placed exactly on the position of the starting point of the plot. In cases where obstacles obstructed or prevented such exact location (tree, rock, river, house, etc.), the permanent markers were placed as close as possible to the starting point of the plot.
4.5.1.5 Data collection in the plot
The data collection always began at the plot starting point and continued in the predefined plot direction. The progress along the central line was made with the help of a compass and 50 m meter tapes, to get a well defined central line. Slope corrections were made using a slope correction table in order to obtain true horizontal distances.
Flagging coloured tape was placed on the corners and limits of the plot (at 10 m from the central line) as the team advanced, in order to easily identify the trees/ shrubs and other target objects within the plot. Range Finders (tool to determine the height of a tree and distance) were used in some cases to determine whether a tree or shrub was inside the plot.
All the data collection process was well documented with photographs. A photograph was taken for each land use/ cover class found in the plot. Pictures of unique features or environmental problems were taken during field work to be included in the report.
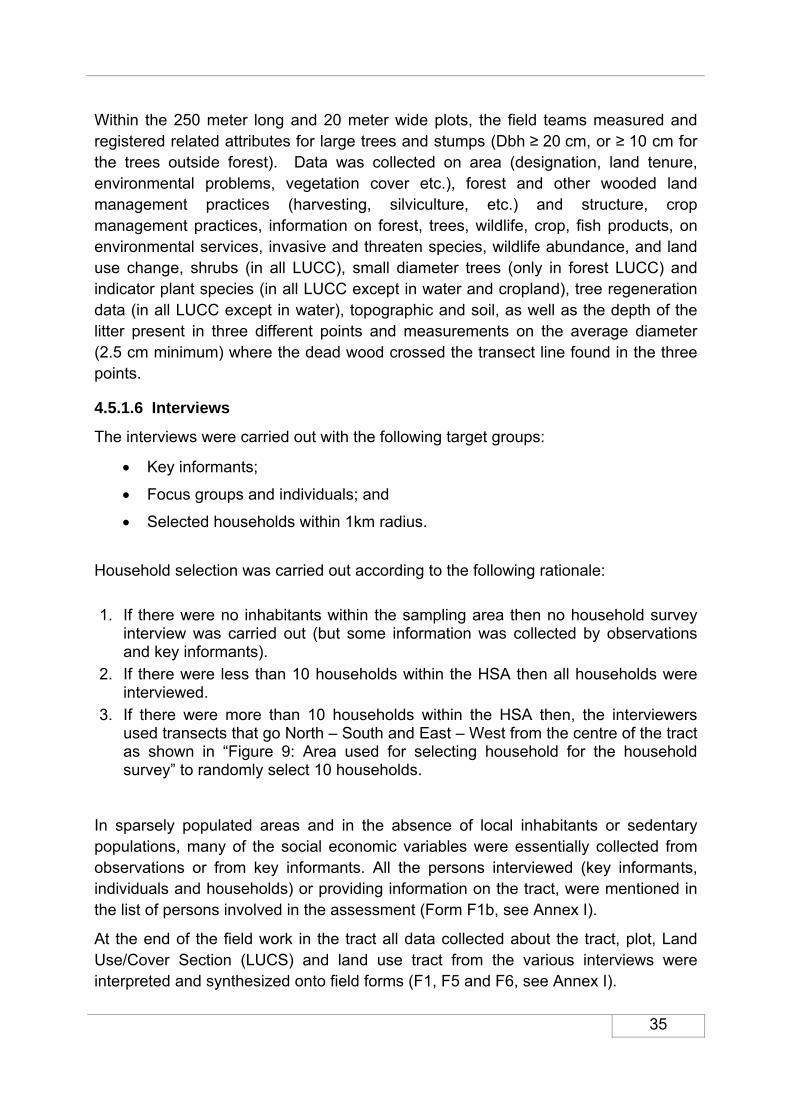
35
Within the 250 meter long and 20 meter wide plots, the field teams measured and registered related attributes for large trees and stumps (Dbh ≥ 20 cm, or ≥ 10 cm for the trees outside forest). Data was collected on area (designation, land tenure, environmental problems, vegetation cover etc.), forest and other wooded land management practices (harvesting, silviculture, etc.) and structure, crop management practices, information on forest, trees, wildlife, crop, fish products, on environmental services, invasive and threaten species, wildlife abundance, and land use change, shrubs (in all LUCC), small diameter trees (only in forest LUCC) and indicator plant species (in all LUCC except in water and cropland), tree regeneration data (in all LUCC except in water), topographic and soil, as well as the depth of the litter present in three different points and measurements on the average diameter (2.5 cm minimum) where the dead wood crossed the transect line found in the three points.
4.5.1.6 Interviews
The interviews were carried out with the following target groups:
Key informants;
Focus groups and individuals; and
Selected households within 1km radius.
Household selection was carried out according to the following rationale: 1. If there were no inhabitants within the sampling area then no household survey
interview was carried out (but some information was collected by observations and key informants).
2. If there were less than 10 households within the HSA then all households were interviewed.
3. If there were more than 10 households within the HSA then, the interviewers used transects that go North – South and East – West from the centre of the tract as shown in “Figure 9: Area used for selecting household for the household survey” to randomly select 10 households.
In sparsely populated areas and in the absence of local inhabitants or sedentary populations, many of the social economic variables were essentially collected from observations or from key informants. All the persons interviewed (key informants, individuals and households) or providing information on the tract, were mentioned in the list of persons involved in the assessment (Form F1b, see Annex I).
At the end of the field work in the tract all data collected about the tract, plot, Land Use/Cover Section (LUCS) and land use tract from the various interviews were interpreted and synthesized onto field forms (F1, F5 and F6, see Annex I).
36
4.5.2 Remote Sensing Analyses
Simultaneous to the Field Data Collection, the Remote Sensing Analyses continued. After the supervised classification was concluded, the ASTER satellite images were processed accordingly with the ERDAS remote sensing software (see 4.4.2 Mapping and Remote Sensing). As the ASTER satellite images did not cover the entire country (roughly the middle of the country, CRR, was left out), the gaps were filled with Google Earth images from 2009. Basically the same procedure was undertaken as with the ASTER images, but manually, instead of automated. Polygons had to be produced and shaded according to the land use /cover colour code manually. Eventually a country wide map was compiled, indicating the diverse land use classes. From this electronic map, land use/cover areas can easily be calculated by the used software. The provided information had to be crosschecked with the field data and vice-versa. Eventually validated data on the land areas and the visual map, would serve especially for comparison with past and future data to trace land use changes.
4.6 Phase III: Data Processing, Analysis and Reporting
A detailed guideline has been developed for data processing and analyses (JATTA, 2010). Following the most relevant steps and features are described:
4.6.1 Field Form Collection and Data Entry
The team leaders were responsible for submitting the completed field forms to the PTU for review. However, before a set of field forms was cleared for data entry, the data needed to be checked and cleared by the NPC or the TCDC expert. The field forms that were found incomplete were returned to the responsible team leader with instructions on what was missing or incorrectly registered and how to complete the form.
All processed forms are stored for references at the DOF HQ in Banjul in a filing cabinet.
4.6.2 Data entry
The data base for the NFA of The Gambia was based on the MS Access software (2000/2002) and stores all the information captured and entered in the field forms for each of the 152 tracts selected for the assessment in the country.
Data entry started in the second quarter of 2010, soon after the installation of the database on a network drive housed at the Department of Forestry headquarters in Banjul and the training of the counter part DoF staff. Three data entry clerks were engaged and supported by the data processing national consultant who was also contracted during this period.
37
The design of the electronic forms for adding/editing field data in the database application follows the same as the field forms employed for the data collection in the field inventory. The idea with this coherence is to facilitate the entering of field data into the database application since the instructions on how to register field data are given in the NFA Field Manual (RODAS, 2009).
The data encoders at DoF headquarters in Banjul were responsible for the data entry into the NFA database application. After the entry of the field data into the NFA database and after it was reviewed and cleaned, the data was ready for processing and analysis.
4.6.3 Data base application
Rebecca Tavani (FOMR) and Reniery Rodriguez (FAO consultant) from Rome came on a mission to the project in July 2010. One of the objectives of this backstopping mission was to train counterpart DoF staff on data processing and analysis in order to ensure high quality data processing and statistical analysis of the NFA data. A TCDC was also available to support the DoF staff in the data processing and analysis. For detailed information on the procedures for data processing please refer to the Guideline for data processing of NFA by JATTA, M. (2010).
Mr. Malang Jatta, forest officer from the DOF was designated as the Biometrician and Data Processing Consultant. He participated both in the training of November 2009 and also in the supervision visits conducted by the monitoring team in December 2009.
Following data entry and data cleaning, the data base became ready for data analysis. The required data was retrieved from the access database by using queries. The query output was exported to MS Excel sheets and the statistical analysis was carried out following the Guideline for data processing of NFA the data processing and analysis (JATTA, 2010) with the support of the trainers from FAO Rome.
To store and manage the collected NFA data, a database application was developed by FAO/FRA in collaboration with the country national team. The database application, based on MS Access software (2000/2002), is composed by two database files; one “data” database (NFI-data_<COUNTRY>.mdb) and one “application” database (NFI-<COUNTRY> v.x.x.mdb). All collected field data (dynamic data) are stored in inter-related tables in the “data” database, while the “application” database contains code tables (static data), forms, queries and macros. The users of the NFA database manage the data through the application database. For opening the database application and for processing of data please refer to the details described in Guideline for data processing of NFA (JATTA, 2010).
After the data were processed they were analysed jointly by the national consultant together with the TCDC expert. The variables to analyze depend on the demand of

38
information at certain time according to the country’s and world’s context. It is important to make an analysis of the previously analyzed variables in order to compare and assess its changes.
A set of queries and data analysis templates were developed for future analysis since the preliminary results needed to be updated to incorporate the results of the mangrove assessment which were obtained much later than the other assessment results.
4.6.4 Data base structure
As described in Guideline for data processing of NFA (JATTA, 2010), the database is structured as follows:
4.6.4.1 Tables All data in the NFA is stored in tables. All tables with collected inventory data (primary data) is kept in the “data” database (NFI-data_<COUNTRY>.mdb), while all static data like codes, expansion factors, etc. are kept in the “application” database (NFI- <COUNTRY> v.x.x.mdb) (refer to Figure 10: Location of database files).
Figure 10: Location of database files
4.6.4.2 Code tables For each variable with attribute options there is a corresponding code table with defined options. The names of code tables all begin with “C-“and they contain internationally harmonized terminology and nationally adapted options to the variables, where every option has a unique code. Thus the data can be merged internationally with other databases of the same structuring and coding.
4.6.4.3 Relation database The NFA database application is developed in MS Access, which is a relation database. A relation database allows that data can be collected at different inventory levels (Tract, Plot, LUS, Tree, etc.) and still relate to each other. In practice this is accomplished by creating separate data tables for each inventory level. To relate (link) the data in one table to another the tables must have at least one common field. In this way the tract attributes can be related to the attributes in all plots in the tract through the “ID-TRACT” field, and the Plot attributes can be related to the attributes in all LUS in the plot through the “ID-PLOT” field, and the LUS attributes can be related to all product/service attributes in the LUS through the ID-LUS field and
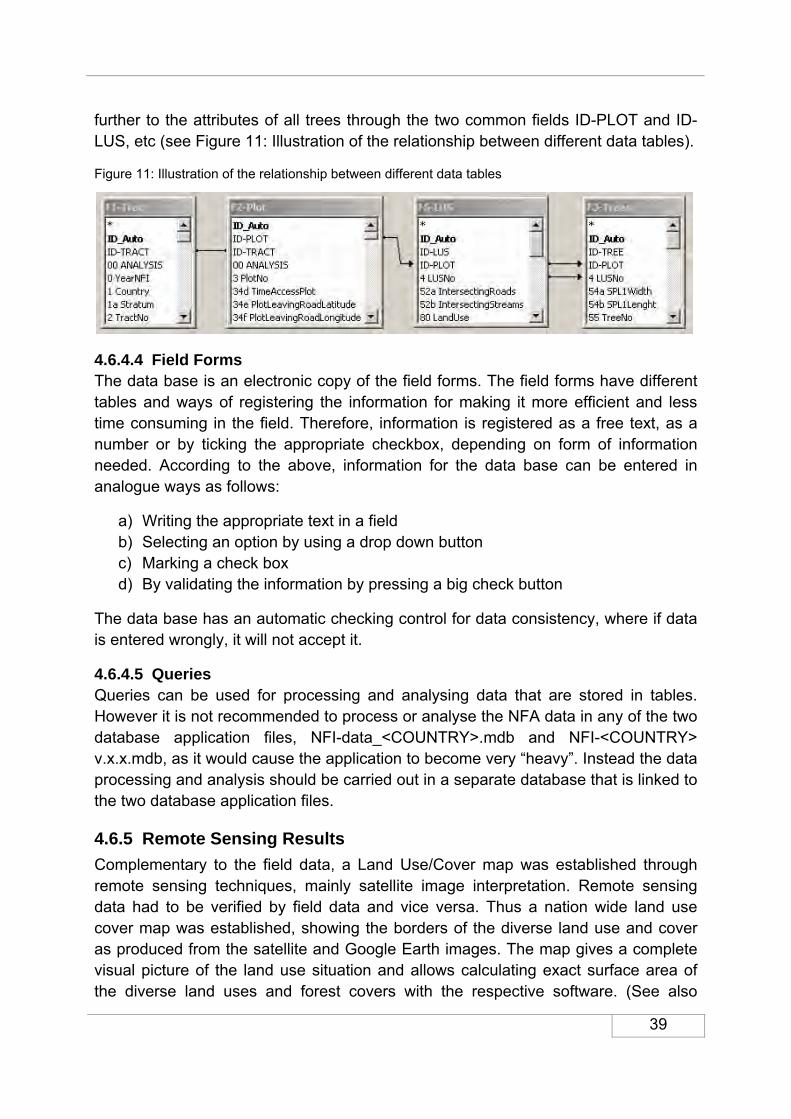
39
further to the attributes of all trees through the two common fields ID-PLOT and ID-LUS, etc (see Figure 11: Illustration of the relationship between different data tables).
Figure 11: Illustration of the relationship between different data tables
4.6.4.4 Field Forms The data base is an electronic copy of the field forms. The field forms have different tables and ways of registering the information for making it more efficient and less time consuming in the field. Therefore, information is registered as a free text, as a number or by ticking the appropriate checkbox, depending on form of information needed. According to the above, information for the data base can be entered in analogue ways as follows:
a) Writing the appropriate text in a field b) Selecting an option by using a drop down button c) Marking a check box d) By validating the information by pressing a big check button
The data base has an automatic checking control for data consistency, where if data is entered wrongly, it will not accept it.
4.6.4.5 Queries Queries can be used for processing and analysing data that are stored in tables. However it is not recommended to process or analyse the NFA data in any of the two database application files, NFI-data_<COUNTRY>.mdb and NFI-<COUNTRY> v.x.x.mdb, as it would cause the application to become very “heavy”. Instead the data processing and analysis should be carried out in a separate database that is linked to the two database application files.
4.6.5 Remote Sensing Results
Complementary to the field data, a Land Use/Cover map was established through remote sensing techniques, mainly satellite image interpretation. Remote sensing data had to be verified by field data and vice versa. Thus a nation wide land use cover map was established, showing the borders of the diverse land use and cover as produced from the satellite and Google Earth images. The map gives a complete visual picture of the land use situation and allows calculating exact surface area of the diverse land uses and forest covers with the respective software. (See also
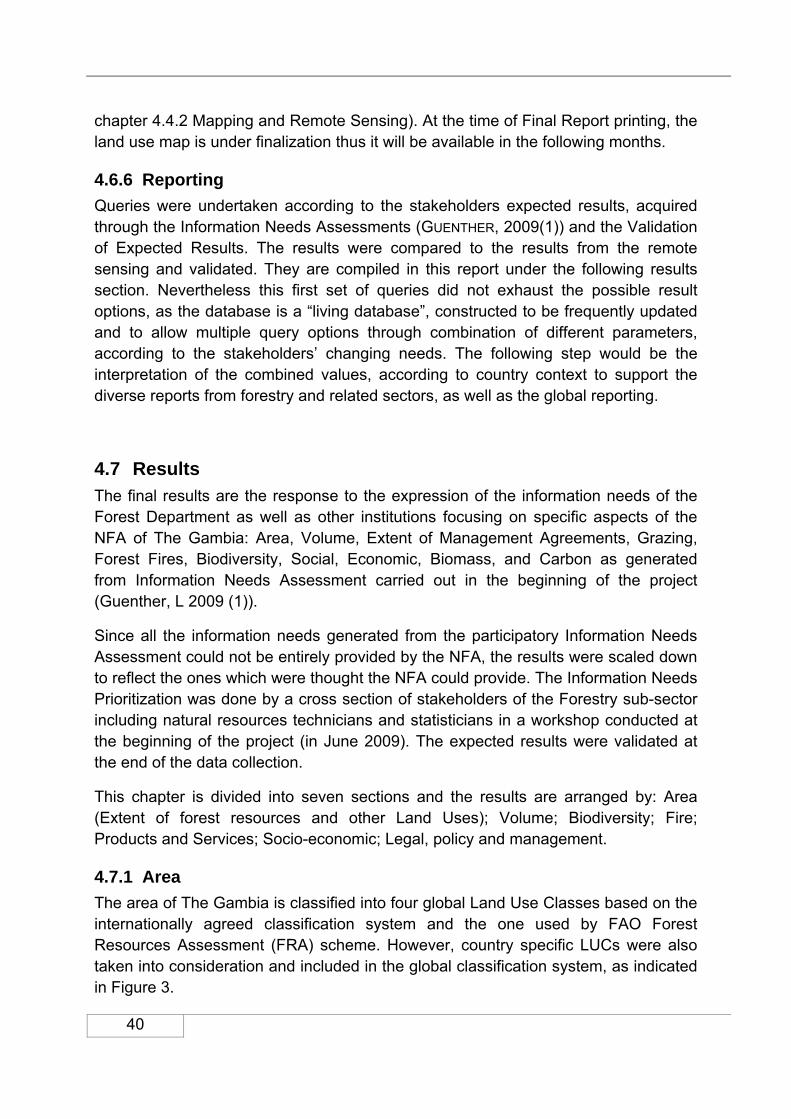
40
chapter 4.4.2 Mapping and Remote Sensing). At the time of Final Report printing, the land use map is under finalization thus it will be available in the following months.
4.6.6 Reporting
Queries were undertaken according to the stakeholders expected results, acquired through the Information Needs Assessments (GUENTHER, 2009(1)) and the Validation of Expected Results. The results were compared to the results from the remote sensing and validated. They are compiled in this report under the following results section. Nevertheless this first set of queries did not exhaust the possible result options, as the database is a “living database”, constructed to be frequently updated and to allow multiple query options through combination of different parameters, according to the stakeholders’ changing needs. The following step would be the interpretation of the combined values, according to country context to support the diverse reports from forestry and related sectors, as well as the global reporting.
4.7 Results
The final results are the response to the expression of the information needs of the Forest Department as well as other institutions focusing on specific aspects of the NFA of The Gambia: Area, Volume, Extent of Management Agreements, Grazing, Forest Fires, Biodiversity, Social, Economic, Biomass, and Carbon as generated from Information Needs Assessment carried out in the beginning of the project (Guenther, L 2009 (1)).
Since all the information needs generated from the participatory Information Needs Assessment could not be entirely provided by the NFA, the results were scaled down to reflect the ones which were thought the NFA could provide. The Information Needs Prioritization was done by a cross section of stakeholders of the Forestry sub-sector including natural resources technicians and statisticians in a workshop conducted at the beginning of the project (in June 2009). The expected results were validated at the end of the data collection.
This chapter is divided into seven sections and the results are arranged by: Area (Extent of forest resources and other Land Uses); Volume; Biodiversity; Fire; Products and Services; Socio-economic; Legal, policy and management.
4.7.1 Area
The area of The Gambia is classified into four global Land Use Classes based on the internationally agreed classification system and the one used by FAO Forest Resources Assessment (FRA) scheme. However, country specific LUCs were also taken into consideration and included in the global classification system, as indicated in Figure 3.

41
4.7.1.1 Area of the Gambia by Major Land Use Classes The land use areas have been obtained from a combination of two sources: the estimation of the classified ASTER images and the field survey. The Gambia has a total area of 1,130,000 hectares (NATIONAL ENVIRONMENT AGENCY, 2010). According to NFA results, the area of The Gambia is composed by 26.6% of Forest, 10.9% Other Wooded Land, 52.1% Other Land and 10.5% Inland Water as shown below.
Table 8: Area of Major LUCs
Major Land Use
Area (‘000 ha)
% of total area
Error % (se)
Forest 300 26.6 11.4 Other Wooded Land 123 10.9 18.2 Other Land 589 52.1 6.5 Inland Water 118 10.5 22.7
Figure 12: Total area of The Gambia divided into major land use classes
4.7.1.2 Area by Major land use classes and national sub-classes For each major land use class, statistics were also compiled for country specific land use sub-classes based on sample plots. Results show that more than 53.2% of the forest is Deciduous while almost 30% is Semi-deciduous and only 4.5% is Evergreen. Mangroves make up almost 12% of total forest area while less than 1% is Palm. Other wooded land is primarily constituted by shrubs (45.9%) and wooded grassland (43%). Annual crops constitute the vast majority of Other Land (63.6%) while all other categories contribute to smaller fractions of area. As it is immediately evident from any map of the Gambia, Inland Water is constituted almost entirely by river (96.3%). Results are displayed in Table 13 and Figures 13 through 16.
Table 9: Specific land use classes and their areas
Forest26.6%
Other Wooded Land
10.9%
Other Land52.1%
Inland Water10.5%
Area of The Gambia by Major LUC

42
Major LUC and sub-classes
Area (‘000 ha)
% of Major LUC
Error % (se)
FOREST Forest Evergreen area 15 4.9 63.0 Forest Deciduous area 160 53.2 17.1 Forest Semi Deciduous area 88 29.2 24.6 Area Mangroves 36 11.9 36.7 Palms 3 0.8 63.8 OTHER WOODED LAND Shrubs 56 45.9 31.6 Wooded Grassland 53 43.0 24.6 Wooded Wetland 14 11.1 61.9 OTHER LAND Bare Land 31 5.3 30.8 Natural Grassland 21 3.6 33.7 Marsh Land 30 5.1 37.6 Barren Flat 17 2.9 39.3 Improved Pastures 5 0.9 82.3 Annual Crops 375 63.6 9.2 Perennial Crops 8 1.3 57.1 Mixed Annual and Perennial Crops 16 2.8 40.0 Fallow 42 7.2 23.3 Built Up Area 41 6.9 37.2 Quarry/Mining site 2 0.3 51.4 INLAND WATER Area River 114 96.3 23.5 Area Intermittent River 4 3.7 69.0
Figure 13: Area of Forest sub-classes
5%
53%
29%
12%
1%
Area of Forest sub‐classes
Forest Evergreen area
Forest Deciduous area
Forest Semi Deciduous area
Area Mangroves
Palms
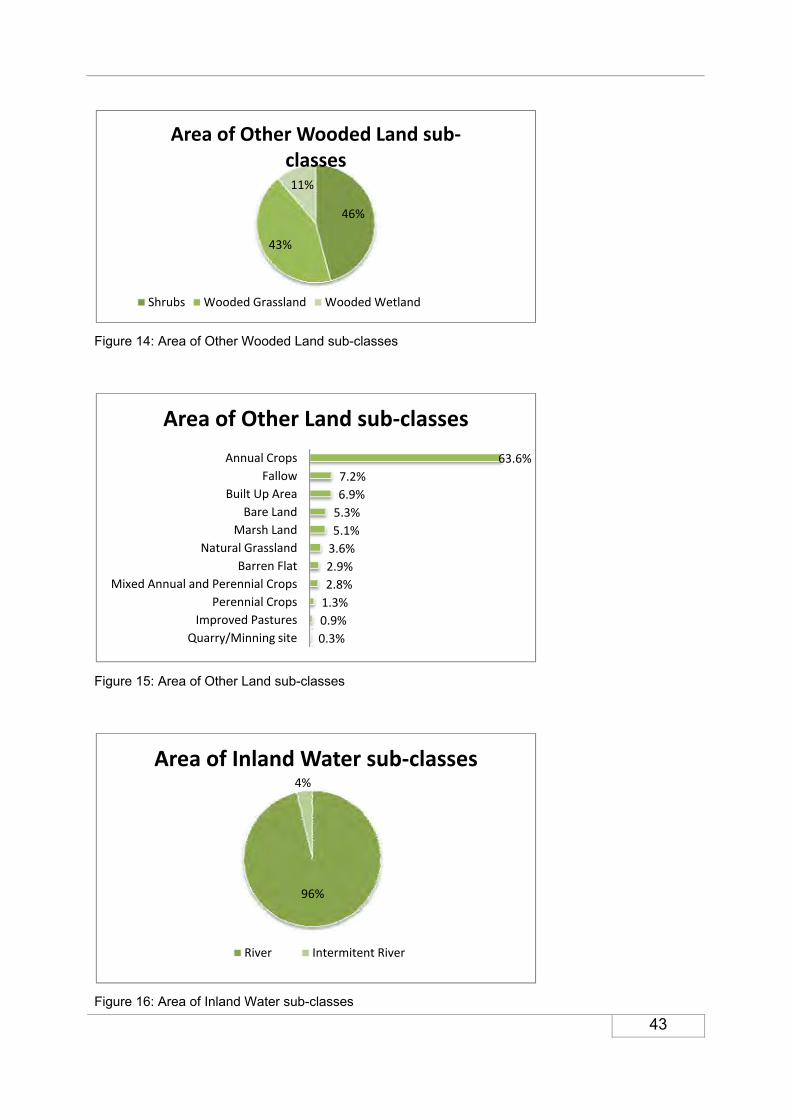
43
Figure 14: Area of Other Wooded Land sub-classes
Figure 15: Area of Other Land sub-classes
Figure 16: Area of Inland Water sub-classes
46%
43%
11%
Area of Other Wooded Land sub‐classes
Shrubs Wooded Grassland Wooded Wetland
0.3%
0.9%
1.3%
2.8%
2.9%
3.6%
5.1%
5.3%
6.9%
7.2%
63.6%
Quarry/Minning site
Improved Pastures
Perennial Crops
Mixed Annual and Perennial Crops
Barren Flat
Natural Grassland
Marsh Land
Bare Land
Built Up Area
Fallow
Annual Crops
Area of Other Land sub‐classes
96%
4%
Area of Inland Water sub‐classes
River Intermitent River

44
4.7.1.3 Areas of forest by type and succession stage Table 14 below shows the areas of forest land by forest type and succession stage. Results indicate that, regardless of the type, the great majority of the forest is Secondary Young (more than 50%), while smaller fractions of areas (around 30%, but more than 40% for Semi deciduous) is Secondary Mature. Primary forest is constituted about 11% of the area of Evergreen forest but only in smaller percentages in other forest types. This is the result of heavy exploitation in the past for charcoal and timber production.
Table 10: Forest area by forest type and succession stage
Forest type Area ('000 ha) % Total area Error (%) se
EVERGREEN FOREST Primary 2 11.6 77 Secondary Mature 4 29 100 Secondary Young 9 59.3 93 DECIDUOUS FOREST Primary 9 5.4 51 Secondary Mature 58 36.3 28 Secondary Young 93 58.3 21 SEMI DECIDUOUS FOREST Primary 2 2.8 83 Secondary Mature 37 42.7 33 Secondary Young 48 54.4 31
Figure 17: Percentage of forest area by forest type and succession stage
0
10
20
30
40
50
60
70
EVERGREEN DECIDUOUS SEMI DECIDUOUS
Forest type and successional stage (% area)
Primary Secondary Mature Secondary Young
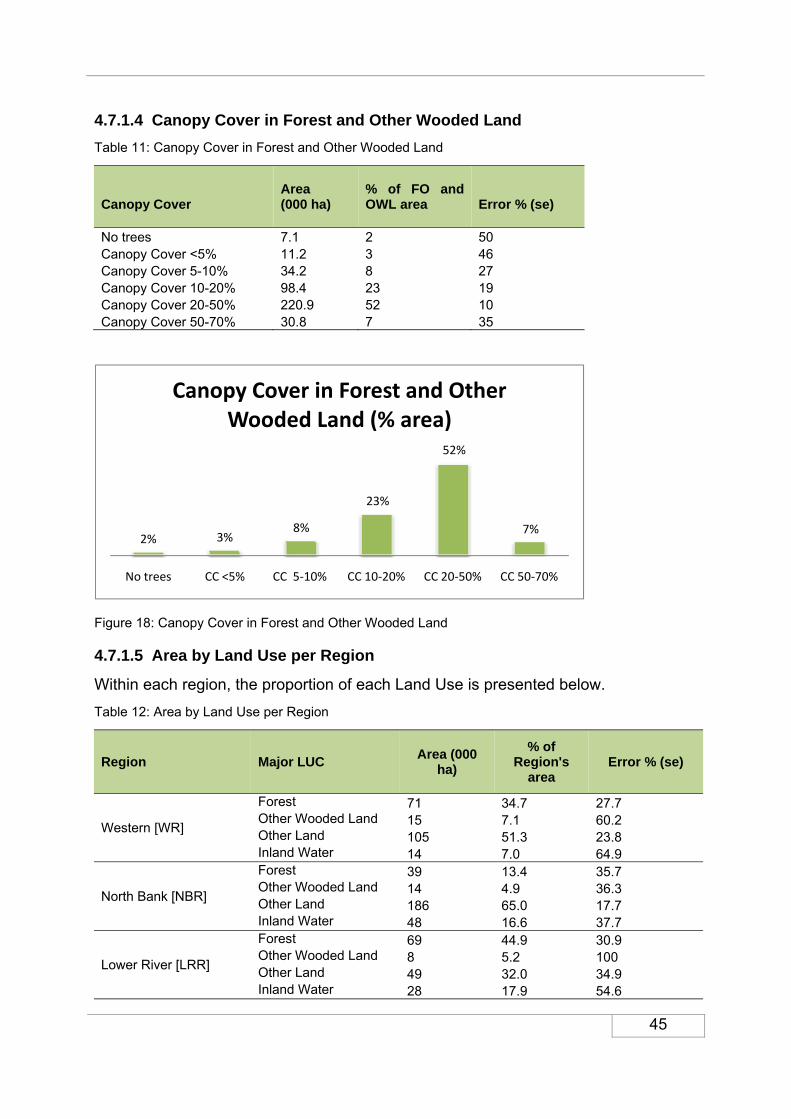
45
4.7.1.4 Canopy Cover in Forest and Other Wooded Land
Table 11: Canopy Cover in Forest and Other Wooded Land
Canopy Cover
Area (000 ha)
% of FO and OWL area
Error % (se)
No trees 7.1 2 50 Canopy Cover <5% 11.2 3 46 Canopy Cover 5-10% 34.2 8 27 Canopy Cover 10-20% 98.4 23 19 Canopy Cover 20-50% 220.9 52 10 Canopy Cover 50-70% 30.8 7 35
Figure 18: Canopy Cover in Forest and Other Wooded Land
4.7.1.5 Area by Land Use per Region
Within each region, the proportion of each Land Use is presented below.
Table 12: Area by Land Use per Region
Region Major LUC Area (000
ha)
% of Region's
area Error % (se)
Western [WR]
Forest 71 34.7 27.7 Other Wooded Land 15 7.1 60.2 Other Land 105 51.3 23.8 Inland Water 14 7.0 64.9
North Bank [NBR]
Forest 39 13.4 35.7 Other Wooded Land 14 4.9 36.3 Other Land 186 65.0 17.7 Inland Water 48 16.6 37.7
Lower River [LRR]
Forest 69 44.9 30.9 Other Wooded Land 8 5.2 100 Other Land 49 32.0 34.9 Inland Water 28 17.9 54.6
2% 3%8%
23%
52%
7%
No trees CC <5% CC 5‐10% CC 10‐20% CC 20‐50% CC 50‐70%
Canopy Cover in Forest and Other Wooded Land (% area)
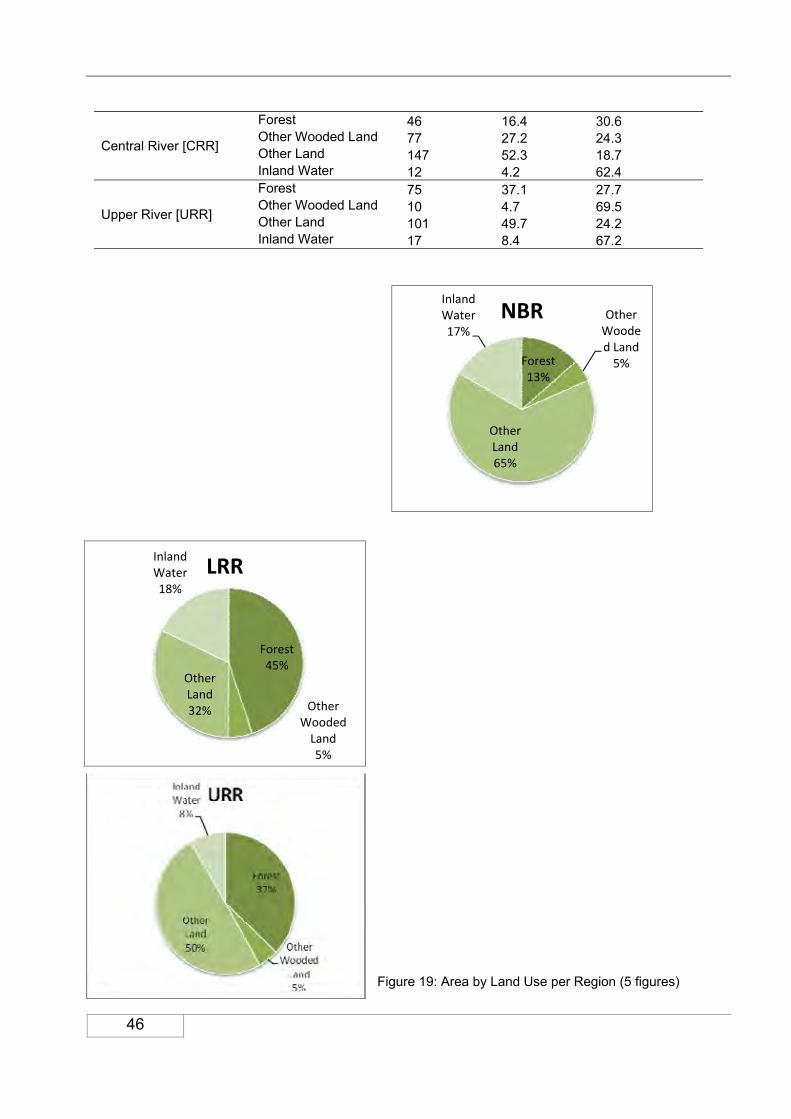
46
Central River [CRR]
Forest 46 16.4 30.6 Other Wooded Land 77 27.2 24.3 Other Land 147 52.3 18.7 Inland Water 12 4.2 62.4
Upper River [URR]
Forest 75 37.1 27.7 Other Wooded Land 10 4.7 69.5 Other Land 101 49.7 24.2 Inland Water 17 8.4 67.2
Figure 19: Area by Land Use per Region (5 figures)
Forest13%
Other Wooded Land5%
Other Land65%
Inland Water17%
NBR
Forest45%
Other Wooded Land5%
Other Land32%
Inland Water18%
LRR
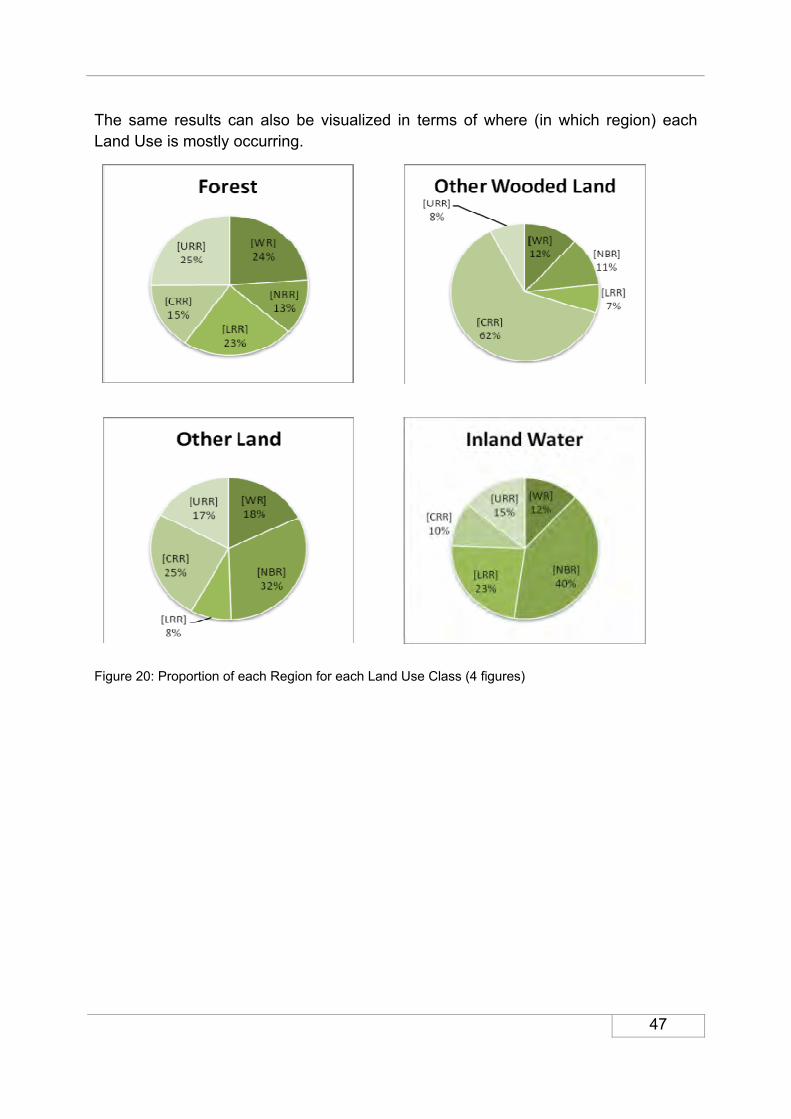
47
The same results can also be visualized in terms of where (in which region) each Land Use is mostly occurring.
Figure 20: Proportion of each Region for each Land Use Class (4 figures)

48
4.7.2 Volume
4.7.2.1 Total Volume, Saw timber Volume and Fuel Wood Volume by Major LUCs
Volume and Density were calculated for Saw timber, Fuel Wood and Total by Major LUCs. Results are presented in the table below. Calculations followed country and species specific functions as developed in Forster H. (1983).
Table 13: Volume and Density by LUCs
unit Forest error (%) se
Other Wooded
Land
error (%) se
Other Land
error (%) se
Inland Water
error (%) se
Total error (%) se
Saw Timber ('000)
m3 1448.7 19.6% 216.7 35.1% 587.4 15.0% 0.0 - 2252.7 19.9%Density m3/ha 4.8 1.8 1.0 0.0 2.0
Fuelwood ('000)
m3 8804.4 15.6% 1441.0 16.2% 6771.6 15.2% 501.3 121.5% 17518.2 18.5%Density m3/ha 29.3 11.7 11.5 4.2 15.5
Total ('000)
m3 10253.1 15.5% 1657.6 17.2% 7359.6 14.6% 501.3 121.5% 19771.6 18.0%Density m3/ha 34.2 13.5 12.5 4.2 17.5
Note: saw timber calculated as dbh>=25cm
Note that in the volume function equations, total volume includes the stem and branch volume of a tree up to a minimum diameter of 5 cm, reduced by the stump and bark volume (= total net volume under bark). It is expressed in cubic decimetres (dm3) for all species except for Gmelina arborea, where it is expressed in m3. The saw timber volume includes the volume of the log of timber species for the length of the stem up to stem height. The saw timber volume is calculated only for trees of at least 25 cm DBH. It is then reduced to the percentage that is estimated as useful volume to be utilized for sawn timber. The DBH is entered in the formulas in centimetres while tree height (ht) and stem height (hs) is entered in meters.
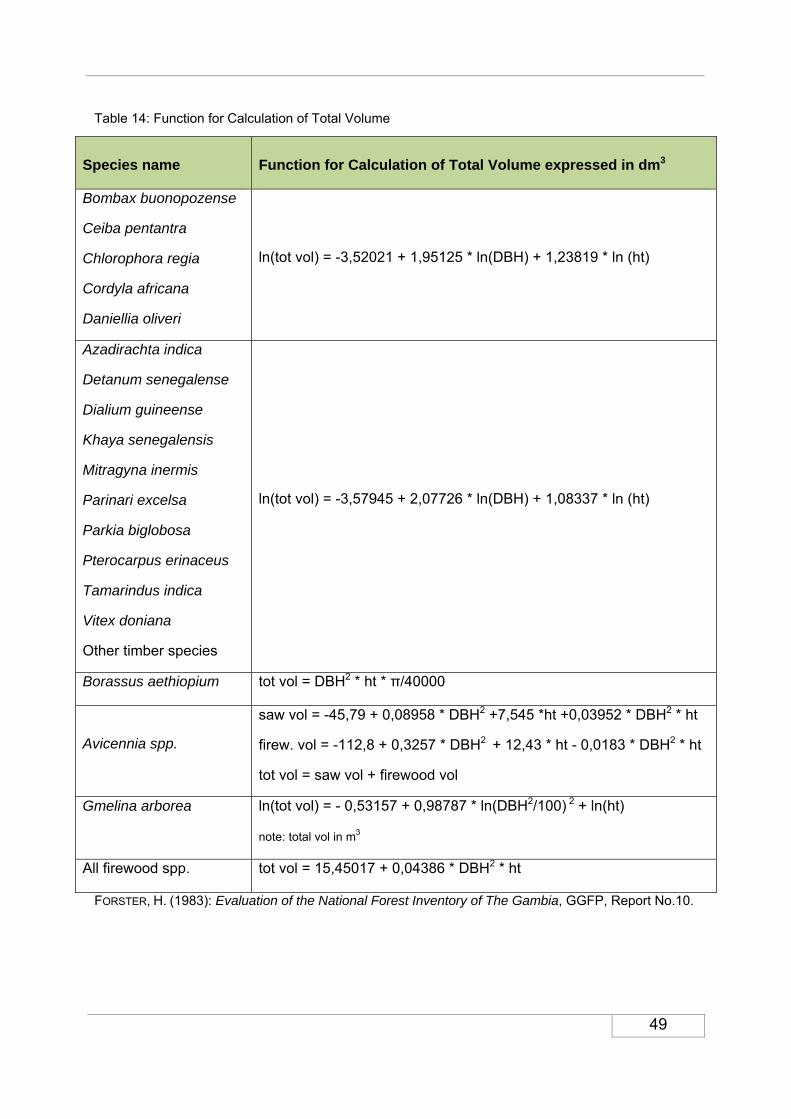
49
Table 14: Function for Calculation of Total Volume
Species name
Function for Calculation of Total Volume expressed in dm3
Bombax buonopozense
Ceiba pentantra
Chlorophora regia
Cordyla africana
Daniellia oliveri
ln(tot vol) = -3,52021 + 1,95125 * ln(DBH) + 1,23819 * ln (ht)
Azadirachta indica
Detanum senegalense
Dialium guineense
Khaya senegalensis
Mitragyna inermis
Parinari excelsa
Parkia biglobosa
Pterocarpus erinaceus
Tamarindus indica
Vitex doniana
Other timber species
ln(tot vol) = -3,57945 + 2,07726 * ln(DBH) + 1,08337 * ln (ht)
Borassus aethiopium tot vol = DBH2 * ht * π/40000
Avicennia spp.
saw vol = -45,79 + 0,08958 * DBH2 +7,545 *ht +0,03952 * DBH2 * ht
firew. vol = -112,8 + 0,3257 * DBH2 + 12,43 * ht - 0,0183 * DBH2 * ht
tot vol = saw vol + firewood vol
Gmelina arborea ln(tot vol) = - 0,53157 + 0,98787 * ln(DBH2/100) 2 + ln(ht)
note: total vol in m3
All firewood spp. tot vol = 15,45017 + 0,04386 * DBH2 * ht
FORSTER, H. (1983): Evaluation of the National Forest Inventory of The Gambia, GGFP, Report No.10.

50
Table 15: Function for Calculation of Sawtimber Volume
Species name
Function for Calculation of Saw timber Volume expressed in dm3
Bombax buonopozense
Ceiba pentantra
Chlorophora regia
Cordyla africana
Daniellia oliveri
saw vol = 84,30111 + 0.04776 * DBH2 * hs
Azadirachta indica
Detanum senegalense
Dialium guineense
Khaya senegalensis
Mitragyna inermis
Parinari excelsa
Parkia biglobosa
Pterocarpus erinaceus
Tamarindus indica
Vitex doniana
Other timber species
saw vol = 20,62001 + 0,05327 * DBH2 * hs
Borassus aethiopium saw vol = DBH2 * hs * π/40
Avicennia spp. saw vol = -45,79 + 0,08958 * DBH2 +7,545 *ht +0,03952 * DBH2 * ht
Gmelina arborea saw vol = 84,30111 + 0.04776 * DBH2 * hs
FORSTER, H. (1983): Evaluation of the National Forest Inventory of The Gambia, GGFP, Report No.10.
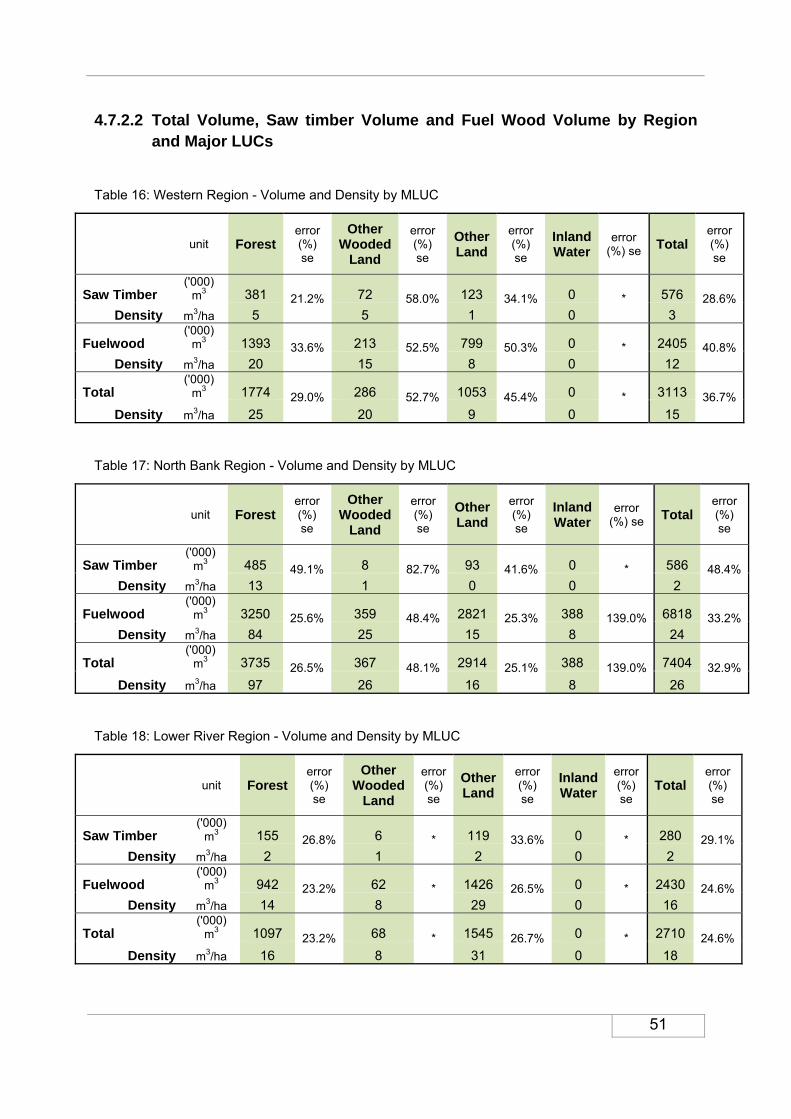
51
4.7.2.2 Total Volume, Saw timber Volume and Fuel Wood Volume by Region and Major LUCs
Table 16: Western Region - Volume and Density by MLUC
unit Forest error (%) se
Other Wooded
Land
error (%) se
Other Land
error (%) se
Inland Water
error (%) se Total
error (%) se
Saw Timber ('000)
m3 381 21.2% 72 58.0% 123 34.1% 0 * 576 28.6% Density m3/ha 5 5 1 0 3
Fuelwood ('000)
m3 1393 33.6% 213 52.5% 799 50.3% 0 * 2405 40.8% Density m3/ha 20 15 8 0 12
Total ('000)
m3 1774 29.0% 286 52.7% 1053 45.4% 0 * 3113 36.7% Density m3/ha 25 20 9 0 15
Table 17: North Bank Region - Volume and Density by MLUC
unit Forest error (%) se
Other Wooded
Land
error (%) se
Other Land
error (%) se
Inland Water
error (%) se Total
error (%) se
Saw Timber ('000)
m3 485 49.1% 8 82.7% 93 41.6% 0 * 586 48.4% Density m3/ha 13 1 0 0 2
Fuelwood ('000)
m3 3250 25.6% 359 48.4% 2821 25.3% 388 139.0% 6818 33.2% Density m3/ha 84 25 15 8 24
Total ('000)
m3 3735 26.5% 367 48.1% 2914 25.1% 388 139.0% 7404 32.9% Density m3/ha 97 26 16 8 26
Table 18: Lower River Region - Volume and Density by MLUC
unit Forest error (%) se
Other Wooded
Land
error (%) se
Other Land
error (%) se
Inland Water
error (%) se
Totalerror (%) se
Saw Timber ('000)
m3 155 26.8% 6 * 119 33.6% 0 * 280 29.1%Density m3/ha 2 1 2 0 2
Fuelwood ('000)
m3 942 23.2% 62 * 1426 26.5% 0 * 2430 24.6%Density m3/ha 14 8 29 0 16
Total ('000)
m3 1097 23.2% 68 * 1545 26.7% 0 * 2710 24.6%Density m3/ha 16 8 31 0 18
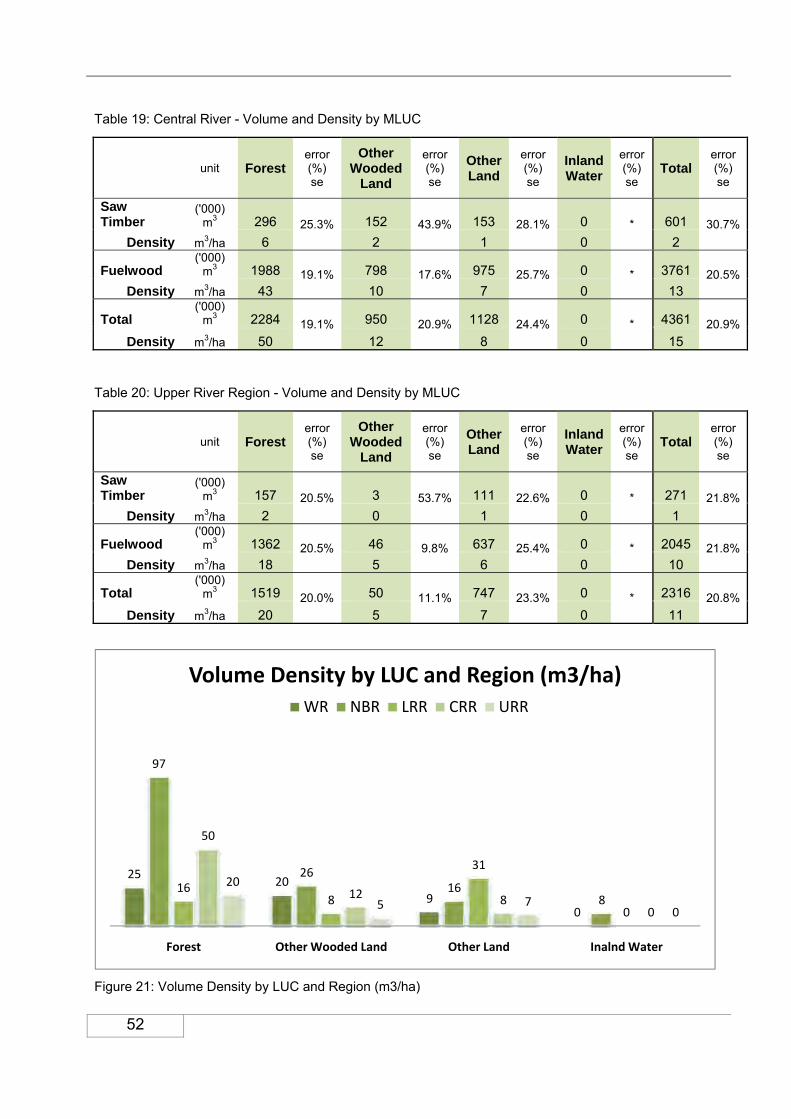
52
Table 19: Central River - Volume and Density by MLUC
unit Forest error (%) se
Other Wooded
Land
error (%) se
Other Land
error (%) se
Inland Water
error (%) se
Totalerror (%) se
Saw Timber
('000) m3 296 25.3% 152 43.9% 153 28.1% 0 * 601 30.7%
Density m3/ha 6 2 1 0 2
Fuelwood ('000)
m3 1988 19.1% 798 17.6% 975 25.7% 0 * 3761 20.5%Density m3/ha 43 10 7 0 13
Total ('000)
m3 2284 19.1% 950 20.9% 1128 24.4% 0 * 4361 20.9%Density m3/ha 50 12 8 0 15
Table 20: Upper River Region - Volume and Density by MLUC
unit Forest error (%) se
Other Wooded
Land
error (%) se
Other Land
error (%) se
Inland Water
error (%) se
Totalerror (%) se
Saw Timber
('000) m3 157 20.5% 3 53.7% 111 22.6% 0 * 271 21.8%
Density m3/ha 2 0 1 0 1
Fuelwood ('000)
m3 1362 20.5% 46 9.8% 637 25.4% 0 * 2045 21.8%Density m3/ha 18 5 6 0 10
Total ('000)
m3 1519 20.0% 50 11.1% 747 23.3% 0 * 2316 20.8%Density m3/ha 20 5 7 0 11
Figure 21: Volume Density by LUC and Region (m3/ha)
2520
90
97
2616
816
8
31
0
50
12 80
20
5 70
Forest Other Wooded Land Other Land Inalnd Water
Volume Density by LUC and Region (m3/ha) WR NBR LRR CRR URR

53
4.7.3 Biomass and Carbon
Biomass was calculated using specific allometric functions applicable to the Gambian context. Two separate functions were selected for the two Geo Ecological Zones (GEZ) present in The Gambia, as follows:
GEZ 12 (Tropical moist deciduous forest): Brown, S. (1997) in Estimating biomass and biomass change of tropical forests, FAO Forestry Paper.
GEZ 13 (Tropical dry forest): Kaire, M. (1999) in La production ligneuse des jachères et son utilisation par l'homme au Sénégal, thesis, Marseille, France, Université de Provence.
4.7.3.1 Total Biomass and Density by Major LUCs In The Gambia, the Forest LUC has more biomass and carbon with 41.8 t/ha and 20.9 t/ha respectively. This is followed by Other Wooded Land with 29.6 t/ha and 14.8 t/ha.
Table 21: Total Biomass and Density by Major LUCs
Biomass Carbon
Land Use Class t/ha s.e % t (000) t/ha s.e % t (000)
Forest 41.8 4.0 12540 20.9 4.0 6270 Other Wooded Land 29.6 9.7 3640 14.8 9.7 1820 Other Land 15.7 7.6 9247 7.9 7.6 4623 Inland Water 9.9 20.0 1168 5.0 20.0 584 Total 23.5 6.7 26596 11.8 6.7 13298
4.7.4 Biodiversity
4.7.4.1 Frequent tree species The total number of tree species that were measured and identified in The Gambia is 124 (this number is slightly under estimated due to the fact that a number of tree species (1.3%) were listed as unknown). Of these, the first ten most occurring represent the 65% of the total. The total list of tree species inventoried can be found in Annex VII while the ten most frequent species are listed below. Among the complete set of tree species registered, Combretum glutinosum (Jambakatango) represents the most frequent (14%), followed by Terminalia macroptera (Wolo) (8.5%) and Mitragyna inemis (Jungo) (8.3%).
These results show that the commercial timber species are now scarce and are being replaced by fuelwood species. The reduction of the timber tree species could be due to frequent and intense bushfires and heavy and uncontrolled timber exploitation in the country. This therefore calls for more protection of the few timber tree species and increased propagation in order to meet one of the policy objectives of supplying the timber needs of the country in future.

54
Table 22: Most frequent tree species in The Gambia
Scientific name
Common name % of tot. trees
Combretum glutinosum jambakatango 13.9% Terminalia macroptera wolo 8.5% Mitragyna inermis jungo 8.3% Pterocarpus erinaceus keno 7.3% Cordyla pinnata duto 5.9% Prosopis africana kembo 5.3% Elais guineense tengo 4.8% Lannea acida bembo-fingo 4.3% Bombax costatum bunkungo 3.5% Rhizophora mangle mankwo 2.5%
4.7.4.2 Biodiversity Indices The degree of biodiversity of the tree species in the Gambia was assessed through Shannon’s Diversity Index which is a mathematical measure of species diversity in a community. The Shannon index accounts for both abundance and evenness of the species present. It ranges from 0.0 to approximately 4.6 where a value near 0.0 means that every tree in the sample is of the same species and a value near 4.6 indicates that the numbers of individuals are evenly distributed among the different species. In addition, a calculation of Equitability was also done. Equitability assumes values between 0 and 1 with 1 being complete evenness. The Table below shows that the highest levels of diversity are found in NBR and WR while LRR has the lowest values.
Table 23: Shannon’s Diversity Index and Equitability values by region
Region No. of Species Shannon's Index of
Diversity (H) Equitability (EH)
WR 53 3.12 0.79 NBR 67 3.23 0.77 LRR 37 2.63 0.73 CRR 48 2.73 0.70 URR 49 2.59 0.67
4.7.5 Fire
4.7.5.1 Area affected by fire per Region Fire affects 68 000 ha of forest in URR, 46 000 ha in LRR, 26 000 ha in CRR while only 9 000 ha in WR and 2 000 ha in NBR. The low forest fire incidences in WR could be attributed to the annual bushfire campaign that is jointly conducted by the DoF, Brikama Area Council (BAC), Governor’s office and Saint Joseph’s Family Farm Centre (SJFFC) in Bwiam. In NBR, it could be due to the low forest cover in the
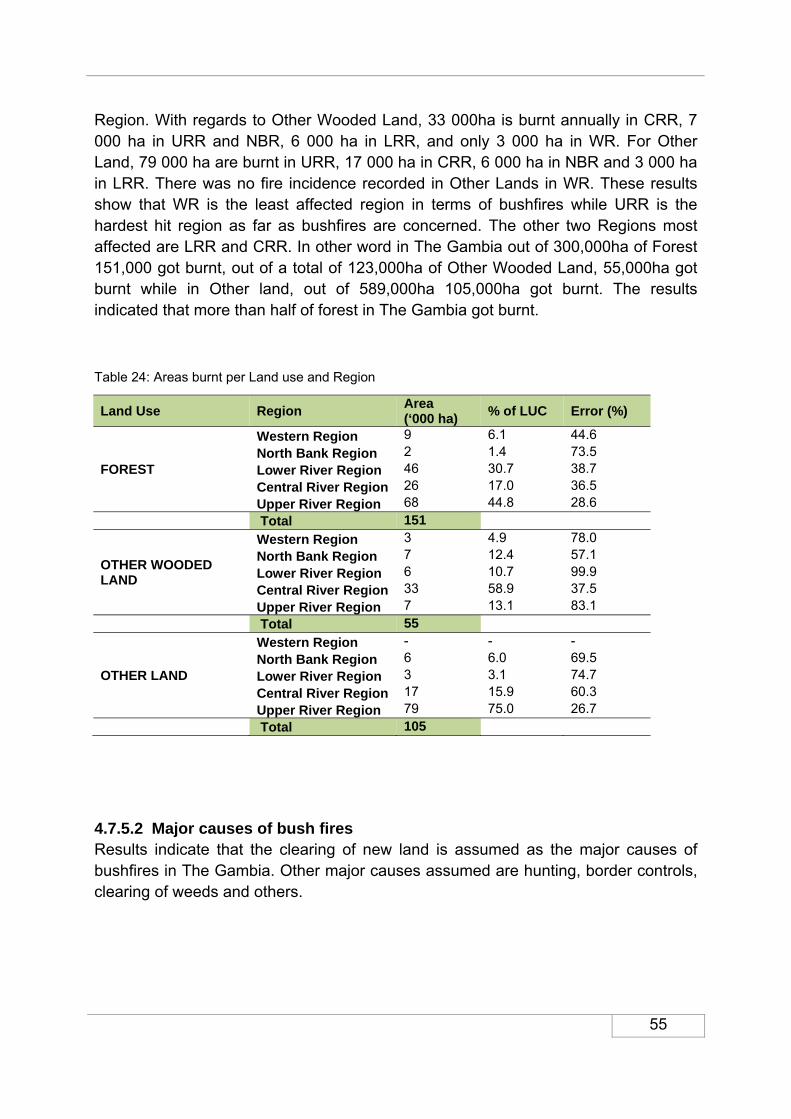
55
Region. With regards to Other Wooded Land, 33 000ha is burnt annually in CRR, 7 000 ha in URR and NBR, 6 000 ha in LRR, and only 3 000 ha in WR. For Other Land, 79 000 ha are burnt in URR, 17 000 ha in CRR, 6 000 ha in NBR and 3 000 ha in LRR. There was no fire incidence recorded in Other Lands in WR. These results show that WR is the least affected region in terms of bushfires while URR is the hardest hit region as far as bushfires are concerned. The other two Regions most affected are LRR and CRR. In other word in The Gambia out of 300,000ha of Forest 151,000 got burnt, out of a total of 123,000ha of Other Wooded Land, 55,000ha got burnt while in Other land, out of 589,000ha 105,000ha got burnt. The results indicated that more than half of forest in The Gambia got burnt.
Table 24: Areas burnt per Land use and Region
Land Use Region Area (‘000 ha)
% of LUC Error (%)
FOREST
Western Region 9 6.1 44.6 North Bank Region 2 1.4 73.5 Lower River Region 46 30.7 38.7 Central River Region 26 17.0 36.5 Upper River Region 68 44.8 28.6
Total 151
OTHER WOODED LAND
Western Region 3 4.9 78.0 North Bank Region 7 12.4 57.1 Lower River Region 6 10.7 99.9 Central River Region 33 58.9 37.5 Upper River Region 7 13.1 83.1
Total 55
OTHER LAND
Western Region - - - North Bank Region 6 6.0 69.5 Lower River Region 3 3.1 74.7 Central River Region 17 15.9 60.3 Upper River Region 79 75.0 26.7
Total 105
4.7.5.2 Major causes of bush fires Results indicate that the clearing of new land is assumed as the major causes of bushfires in The Gambia. Other major causes assumed are hunting, border controls, clearing of weeds and others.

56
Table 25: Major causes of bush fires
Cause of Bush fire % Clearing of new land 31 Hunting 13 Border control 10 Clearing of weeds and residues 10 Others 10 Pasture regrowth 8 Smoking 8 Access to forest products 5 Pest/wildlife control 5
Figure 22: Major causes of bushfires in The Gambia
4.7.5.3 Frequency of fire in forest Among the area of forest affected by fire, results show that 79% experiences fires once or more times each year. Only 12% of the forest gets burnt once every two years while 8% gets burnt once every five years and 1% of the forest area experience fires once every ten years. These figures indicate that fires still continues to be a serious problem for forests in The Gambia and therefore more efforts are needed to reduce them.
Clearing of new land, 31
Hunting, 13
Border control, 10
Clearing of weeds and residues, 10
Others, 10
Pasture regrowth, 8
Smoking, 8
Access to forest products, 5
Pest/wildlife control, 5
Causes of bush fire

57
Figure 23: Frequency of fire in forest
4.7.6 Products and Services
4.7.6.1 Major Products obtained from forest Results confirm that the population of The Gambia obtains a variety of products from the forest. Among the most harvested products from the forest are: Fuel wood (19%), Plants food (17%), Construction material (15%), Tea/herbs (11%) and Medicinal plants (10%). Results are shown below and are expressed in terms of percentage of weight
Figure 24: Major Forest Products (%)
79%
12%
8%
1%
Frequency of Fire in Forest
Once or more than once a year
Once every two years
Once every five years
More than every ten years
0 2 4 6 8 10 12 14 16 18
Fuelwood
Construction material
Plant medicines
Cash crops
Other plant products
Wood carvings
Charcoal
Major Products from forest (%)

58
Similarly to the products mentioned above, the forest also provides a number of services to the Gambian people. The most important include: Windbreak, Grazing and Shade and Soil and Water conservation. These results yet again show the importance of forests to the livelihood of local communities.
Figure 25: Major Services from Forest
4.7.6.2 Forest Products harvested per Region Results indicate that the most common forest product harvested is fuel wood, with high percentages of utilization in all regions. Industrial wood is primarily utilized in Western Region (53%) while in the other Regions utilization accounts on average for slightly over 20%. Wood carving is predominantly practiced in Lower River Region 15% followed by Western Region (10%) and Upper River Region (8%). Although charcoal production is banned in The Gambia, the population continues to use charcoal in their houses. Some of the charcoal is dubbed unauthorized for the fact that it is illegally brought to the country or illegally produced within the country. In terms of charcoal utilization per Region, WR is utilizing more (7%) then CRR (6%) and NBR / LRR (5%). All the other Regions utilize from 2 – 5% of charcoal as shown below.
0.0 2.0 4.0 6.0 8.0 10.0 12.0 14.0
OtherWindbreak
GrazingShade
Soil & Water conservationClimate regulationNot interviewed
EmploymentBiodiversity protection
AestheticReligious/Spiritual/Cultural
Disease controlRecreation/Tourism
Education/Scientific studies
Major Services from Forest (%)

59
Figure 26: Forest products harvested per Region
4.7.6.3 User group by forest products harvested Based on the National Forest assessment results and as shown below, Communities and Individuals in The Gambia use more fuel wood than any other forest products 72% and 55% respectively while Government and other Institutions use more of Industrial wood (86%).
Figure 27: User group by forest products harvested (%)
6 5 52
7
64
58
6764
3025
2123
25
53
5
15
58 10
CRR LRR NBR URR WR
Forest products harvested per Region (%)
Charcoal Fuelwood Industrial wood Wood carvings
4 06
72
14
55
16
86
29
80
9
Communities Government/Institutions Individual
User group by forest products harvested (%)
Unauthorized Charcoal Fuelwood Industrial wood Wood carvings
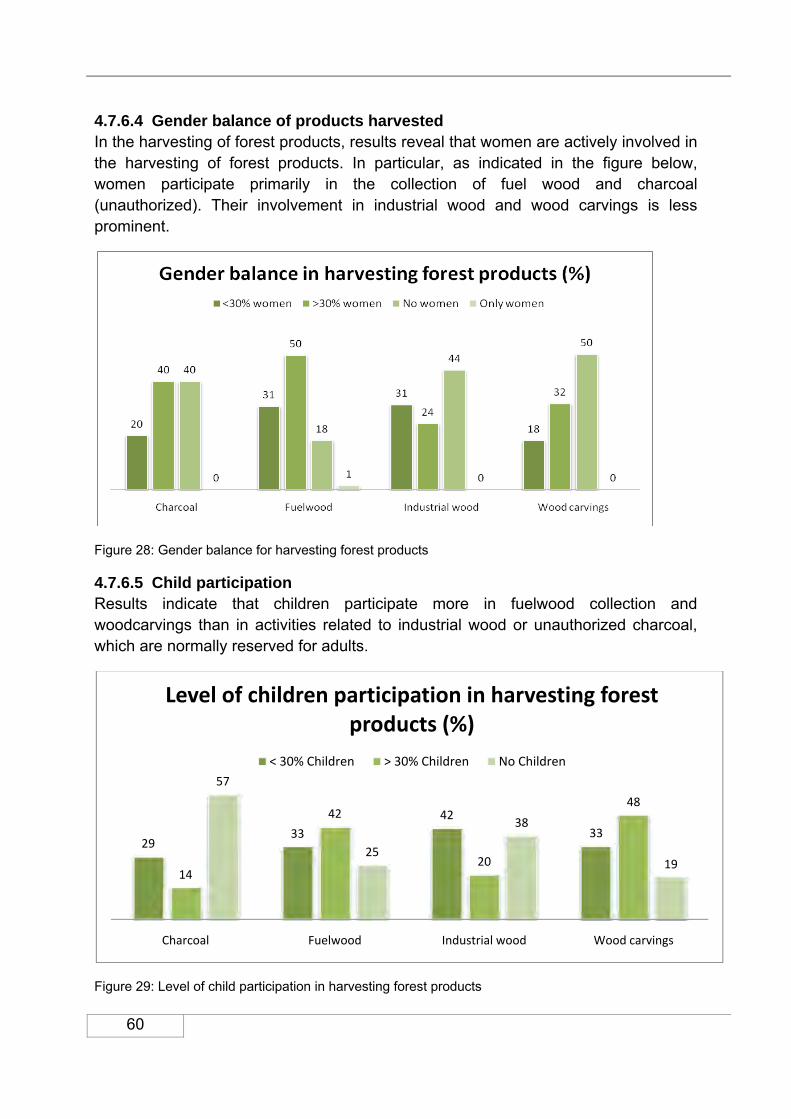
60
4.7.6.4 Gender balance of products harvested In the harvesting of forest products, results reveal that women are actively involved in the harvesting of forest products. In particular, as indicated in the figure below, women participate primarily in the collection of fuel wood and charcoal (unauthorized). Their involvement in industrial wood and wood carvings is less prominent.
Figure 28: Gender balance for harvesting forest products
4.7.6.5 Child participation Results indicate that children participate more in fuelwood collection and woodcarvings than in activities related to industrial wood or unauthorized charcoal, which are normally reserved for adults.
Figure 29: Level of child participation in harvesting forest products
2933
42
33
14
42
20
48
57
25
38
19
Charcoal Fuelwood Industrial wood Wood carvings
Level of children participation in harvesting forest products (%)
< 30% Children > 30% Children No Children
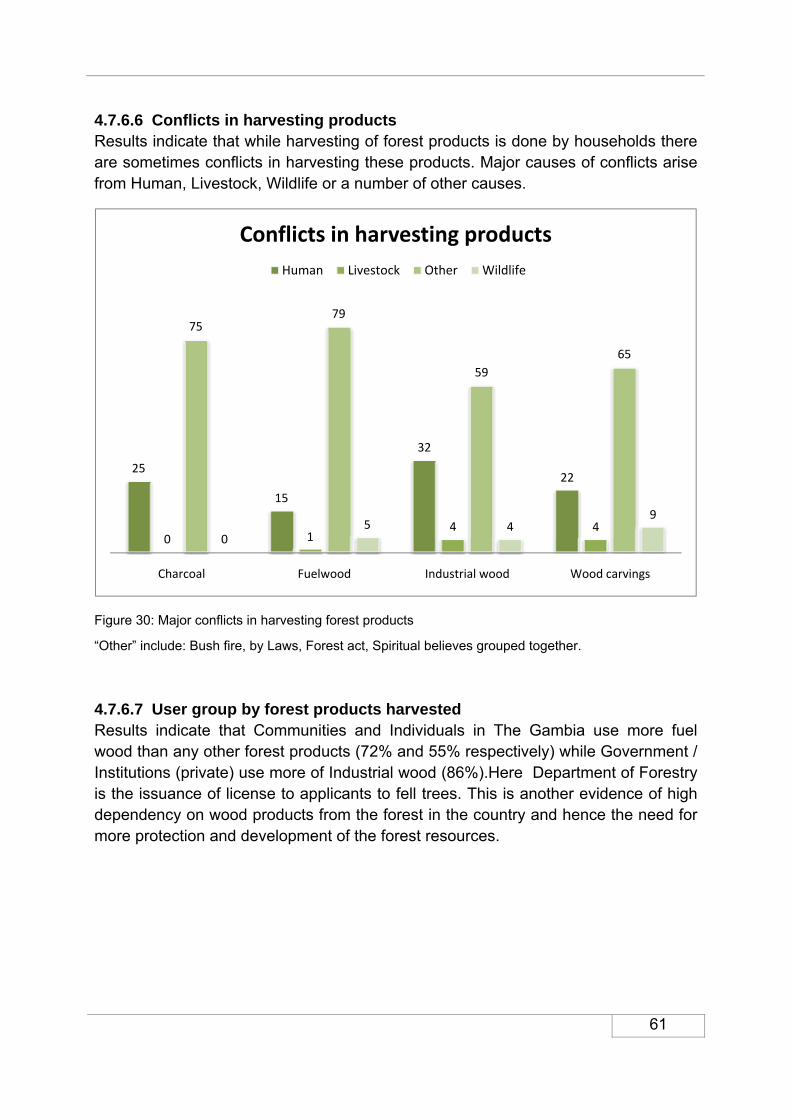
61
4.7.6.6 Conflicts in harvesting products Results indicate that while harvesting of forest products is done by households there are sometimes conflicts in harvesting these products. Major causes of conflicts arise from Human, Livestock, Wildlife or a number of other causes.
Figure 30: Major conflicts in harvesting forest products
“Other” include: Bush fire, by Laws, Forest act, Spiritual believes grouped together.
4.7.6.7 User group by forest products harvested Results indicate that Communities and Individuals in The Gambia use more fuel wood than any other forest products (72% and 55% respectively) while Government / Institutions (private) use more of Industrial wood (86%).Here Department of Forestry is the issuance of license to applicants to fell trees. This is another evidence of high dependency on wood products from the forest in the country and hence the need for more protection and development of the forest resources.
25
15
32
22
0 14 4
7579
59
65
05 4
9
Charcoal Fuelwood Industrial wood Wood carvings
Conflicts in harvesting products
Human Livestock Other Wildlife
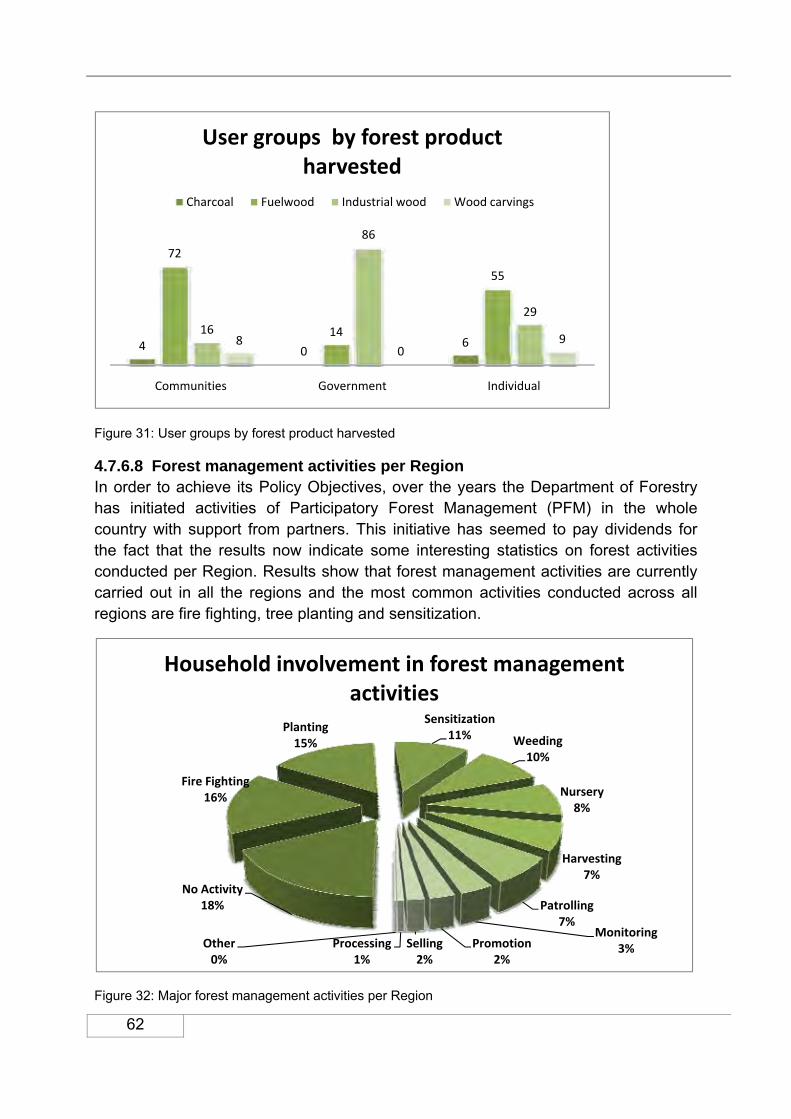
62
Figure 31: User groups by forest product harvested 4.7.6.8 Forest management activities per Region In order to achieve its Policy Objectives, over the years the Department of Forestry has initiated activities of Participatory Forest Management (PFM) in the whole country with support from partners. This initiative has seemed to pay dividends for the fact that the results now indicate some interesting statistics on forest activities conducted per Region. Results show that forest management activities are currently carried out in all the regions and the most common activities conducted across all regions are fire fighting, tree planting and sensitization.
Figure 32: Major forest management activities per Region
4 06
72
14
55
16
86
29
80
9
Communities Government Individual
User groups by forest product harvested
Charcoal Fuelwood Industrial wood Wood carvings
No Activity18%
Fire Fighting16%
Planting15%
Sensitization11% Weeding
10%
Nursery8%
Harvesting7%
Patrolling7%
Monitoring3%Promotion
2%Selling2%
Processing1%
Other0%
Household involvement in forest management activities

63
These results indicate that forestry activities are ongoing across the whole country. This is very much in line with the current forest policy of The Gambia. Some of the activities need to be vigorously supported by both the DoF and other partners. These activities are fire fighting, planting, nursery establishment and management and sensitization. The fact that fire fighting is taking place in all the regions indicate the wide spread of forest fires in the country and the need for the implementation of the Regional Fire Management Concept to all the Regions. The harvesting activities taking place in the Regions must be strictly regulated to avoid over exploitation of our dwindling forest resources.

64
Figure 33: Breakdown HH involvement in forest activities per region (5 figures)
4.7.6.9 Extent of grazing per Land Use Results indicate that grazing and browsing by livestock occurs in almost 65% of the total land area of The Gambia. Levels of grazing and browsing are fairly uniform regardless the land use and intensive browsing occurs only in very small fractions of the territory. Less than 25% of total area is not grazed. Complete results are presented below.
Table 26: Extent of grazing per land use type
Land Use Grazing intensity Area
(‘000 ha) % of LU
area Error (%)
se
FOREST No Grazing 73 24.3 28.9 Grazing & Browsing 224 74.7 14.3 Intensive Browsing 3 0.01 99.9
OTHER WOODED LAND No Grazing 24 19.2 39.7 Grazing & Browsing 96 76.8 21.3 Intensive Browsing 5 4.0 70.4
OTHER LAND No Grazing 123 24.0 20.2 Grazing & Browsing 385 75.1 9.5 Intensive Browsing 4 0.08 79.6
Note: Results do not include 229.000 ha, area where grazing activity was not indicated
4.7.6.10 Extent of grazing per Region The livestock grazed and browsed more in Central River Regions with 191,000ha followed by URR with 168,000ha then NBR with 16,000ha. However, the intensive browsing occurred just in two regions these included LRR claimed to higher with 9000ha and NBR with 2000ha respectively.
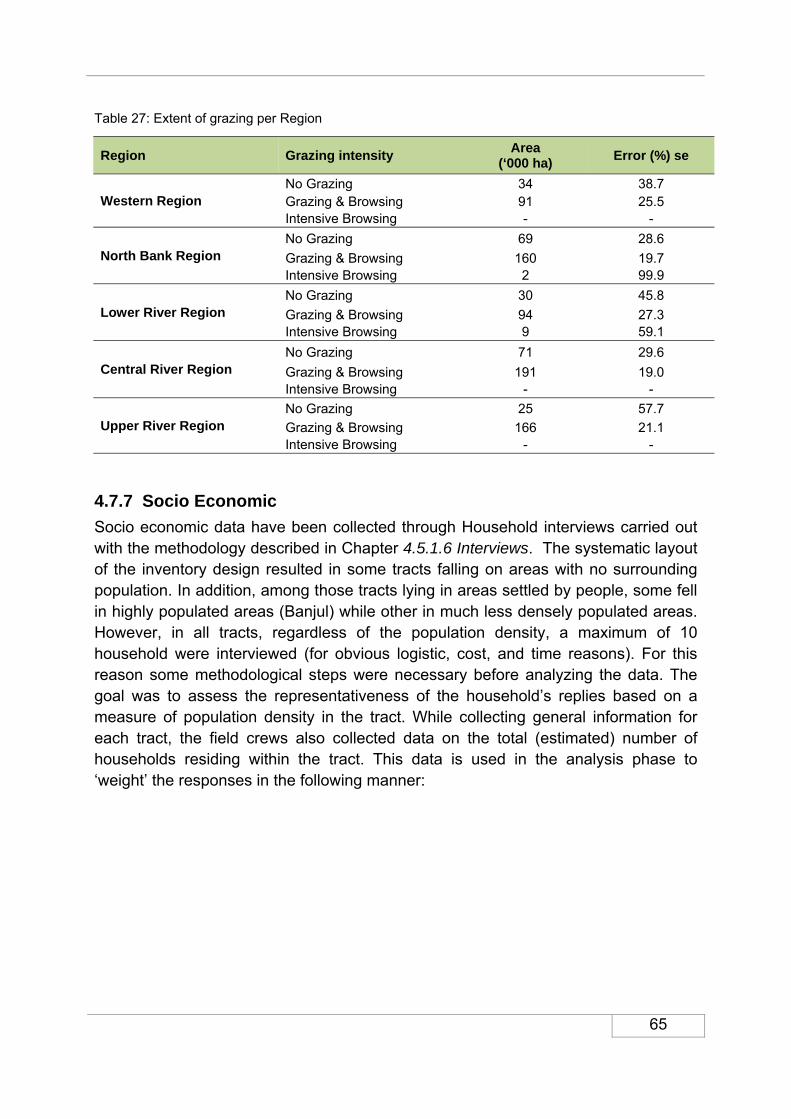
65
Table 27: Extent of grazing per Region
Region Grazing intensity Area
(‘000 ha) Error (%) se
Western Region No Grazing 34 38.7 Grazing & Browsing 91 25.5 Intensive Browsing - -
North Bank Region No Grazing 69 28.6 Grazing & Browsing 160 19.7 Intensive Browsing 2 99.9
Lower River Region No Grazing 30 45.8 Grazing & Browsing 94 27.3 Intensive Browsing 9 59.1
Central River Region No Grazing 71 29.6 Grazing & Browsing 191 19.0 Intensive Browsing - -
Upper River Region No Grazing 25 57.7 Grazing & Browsing 166 21.1 Intensive Browsing - -
4.7.7 Socio Economic
Socio economic data have been collected through Household interviews carried out with the methodology described in Chapter 4.5.1.6 Interviews. The systematic layout of the inventory design resulted in some tracts falling on areas with no surrounding population. In addition, among those tracts lying in areas settled by people, some fell in highly populated areas (Banjul) while other in much less densely populated areas. However, in all tracts, regardless of the population density, a maximum of 10 household were interviewed (for obvious logistic, cost, and time reasons). For this reason some methodological steps were necessary before analyzing the data. The goal was to assess the representativeness of the household’s replies based on a measure of population density in the tract. While collecting general information for each tract, the field crews also collected data on the total (estimated) number of households residing within the tract. This data is used in the analysis phase to ‘weight’ the responses in the following manner:

66
Table 28: Method for determining the representativeness (weight) of each tract for HH survey
Variable definition example
a Number of households interviewed 10
b Number of households present on the tract 25
weight b/a 25 / 10 = 2.5
In this manner, the replies from highly populated areas are assigned a greater weight as they represent a greater number of household within the sampled area. With this in mind, following are presented a selection of Household survey results.
4.7.7.1 Household main activity
Results indicate that the main household activity in The Gambia is crop production, engaging 26% of the Households (HH). This is followed by trade/petty trade engaging 15% of the HH, services (public & private) engaging 13% of the HH, and livestock rearing (12%). Forestry activities of HH constitute only 5%. The low forest activities for the HHs need to be increased by encouraging people to participate in Community Forest Management and to expand the establishment of Community-Based Forest Enterprise Development using the Market Analysis and Development (MA&D) methodology.
Table 29: Household main activity
Household activity %
Crop production 26 Livestock/Herding 15 Horticulture 13 Services (Public and Private) 11 Trade/Petty trade 10 Domestic services 6 Forestry 4 Others 4 Gathering 3 Remittance* 3 Handicraft 3 Fishing 2
*Remittance is not an “activity” but it constitutes a source of income

67
Figure 34: Main activities of households
Others: Tourism, Hunting, Salt production, Aquaculture, Mining/Extraction, Industry, Remittances
4.7.7.2 Fuel for Cooking
Results indicate that almost the entire population uses fuel wood as their main source of energy for cooking (97.3%). Only slightly more then 1% of the households use charcoal. Gas and Residues are used for cooking by less the 1%.
4.7.7.3 Fuel for lighting With regard to households’ main source for lighting, results indicate that 63% of the houeholds interviewed use Candles as their main source and 23% use Electricity. Residues/Briquettes” is used by 4%, the same percentage uses kerosene. Around 6% of the houeholds use other sources for lighting such as solar energy, wind energy, fuel wood, kerosene etc.
0 5 10 15 20 25 30
Crop production
Livestock/Herding
Horticulture
Services (Public and Private)
Trade/Petty trade
Domestic services
Forestry
Others
Gathering
Handicraft
Fishing
Percentage

68
Figure 35: Percentages of fuel sources for lighting
[Others: Solar energy, Fuel wood, Charcoal, Bio fuel, Wind energy]
4.7.7.4 Household main source of media
The main source of media of the households in The Gambia is radio which constitutes 39.6%. Other sources include telephone (30.9%), Television (19.3%), Newspapers (6.2%). Other sources of media were indicated by 3.9% of the households while only 0.1% does not have access to any form of media. These results indicate that the sensitization efforts of the DoF and its partners could be channel through radios or telephones to reach out to many households in the country.
Figure 36: Main source of media owned by households
Candles63%
Electricity23%
Other6%
Kerosene4%
Residues/Briquettes4%
Major source of fuel for lighting
Radio39.6%
Telephone30.9%
Television19.3%
Newspaper6.2%
Other3.9% No media
0.1%
Household main source of media

69
4.7.7.5 Livelihood trend Results indicate that 53% of the households in The Gambia believe that their livelihood is increasing, 27% believes it is decreasing while 17% believe that livelihood is stable at the household level.
Figure 37: Households’ livelihood trend
4.7.8 Policy, Legal and Management
4.7.8.1 Households’ awareness of forest initiatives and policies Results reveal that 65% of the Households is aware of the forest initiatives and policies carried out by the Department of Forestry. This indicates that the implementation of various forestry projects and the active engagement of the local communities have raised awareness and strenghtened the contact between the DoF and the households. Still, the DoF must continue to conduct sensitization to ensure that the entire population becomes aware of the forest initiatives and policies of the department to facilitate their involvement in forest management activities.
Increasing53%
Decreasing27%
No change17%
not applicable3%
Livelihood trend
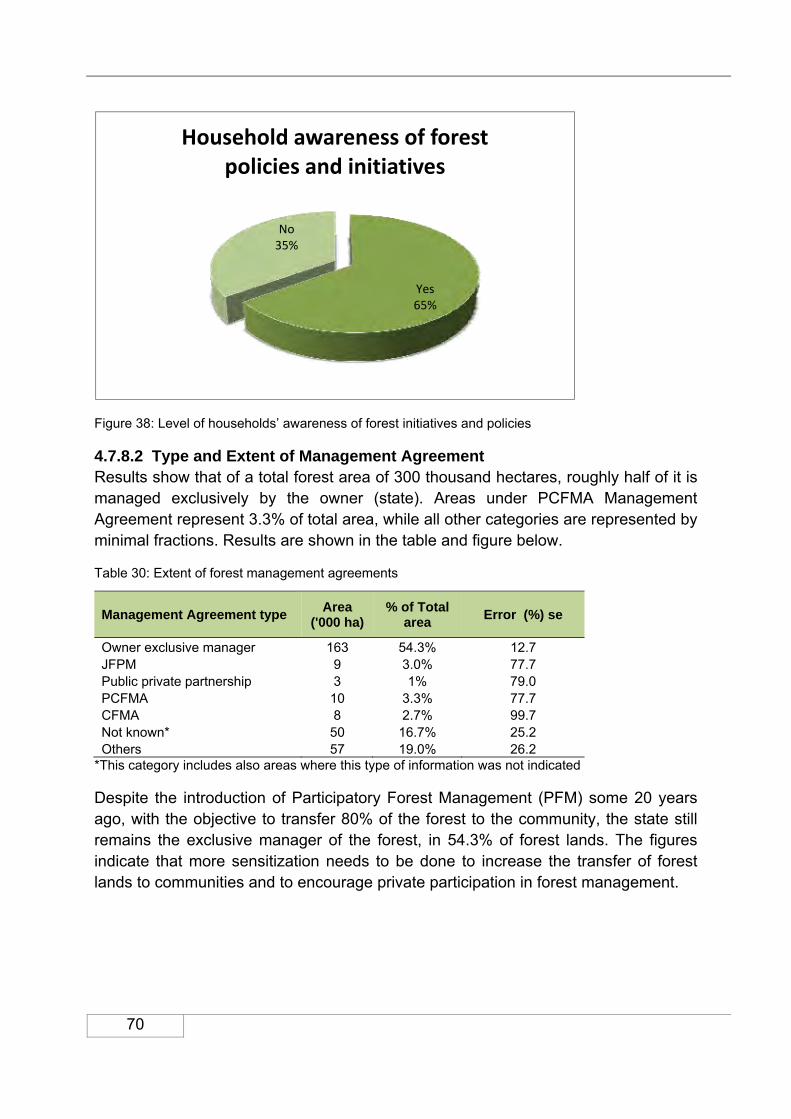
70
Figure 38: Level of households’ awareness of forest initiatives and policies
4.7.8.2 Type and Extent of Management Agreement Results show that of a total forest area of 300 thousand hectares, roughly half of it is managed exclusively by the owner (state). Areas under PCFMA Management Agreement represent 3.3% of total area, while all other categories are represented by minimal fractions. Results are shown in the table and figure below.
Table 30: Extent of forest management agreements
Management Agreement type
Area ('000 ha)
% of Total area
Error (%) se
Owner exclusive manager 163 54.3% 12.7 JFPM 9 3.0% 77.7 Public private partnership 3 1% 79.0 PCFMA 10 3.3% 77.7 CFMA 8 2.7% 99.7 Not known* 50 16.7% 25.2 Others 57 19.0% 26.2
*This category includes also areas where this type of information was not indicated
Despite the introduction of Participatory Forest Management (PFM) some 20 years ago, with the objective to transfer 80% of the forest to the community, the state still remains the exclusive manager of the forest, in 54.3% of forest lands. The figures indicate that more sensitization needs to be done to increase the transfer of forest lands to communities and to encourage private participation in forest management.
Yes65%
No35%
Household awareness of forest policies and initiatives

71
Figure 39: Extent of forest management agreements
4.7.8.3 Extent of ownership area More than 75% of the area of The Gambia is owned by the State (38.8%) and Individuals (37.8%). As the new forest policy (2010 – 2019) is advocating for the transfer of 200 000 ha of forest lands to local communities, reactivation of the Community Forestry Programme is paramount if this target is to be met.
Figure 40: Extent of ownership area
Owner exclusive manager54%
JFPM3%
Public private partnership
1%
PCFMA3%
CFMA3%
Not known17%
Others19%
Type of management Agreement in Forest Area
38.8
37.8
18.9
3.8
0.3
0.2
0.2
0.0
State
Individual
Not Known
Communal
Others Private
Local Government
Other
Industries
Ownership area (%)
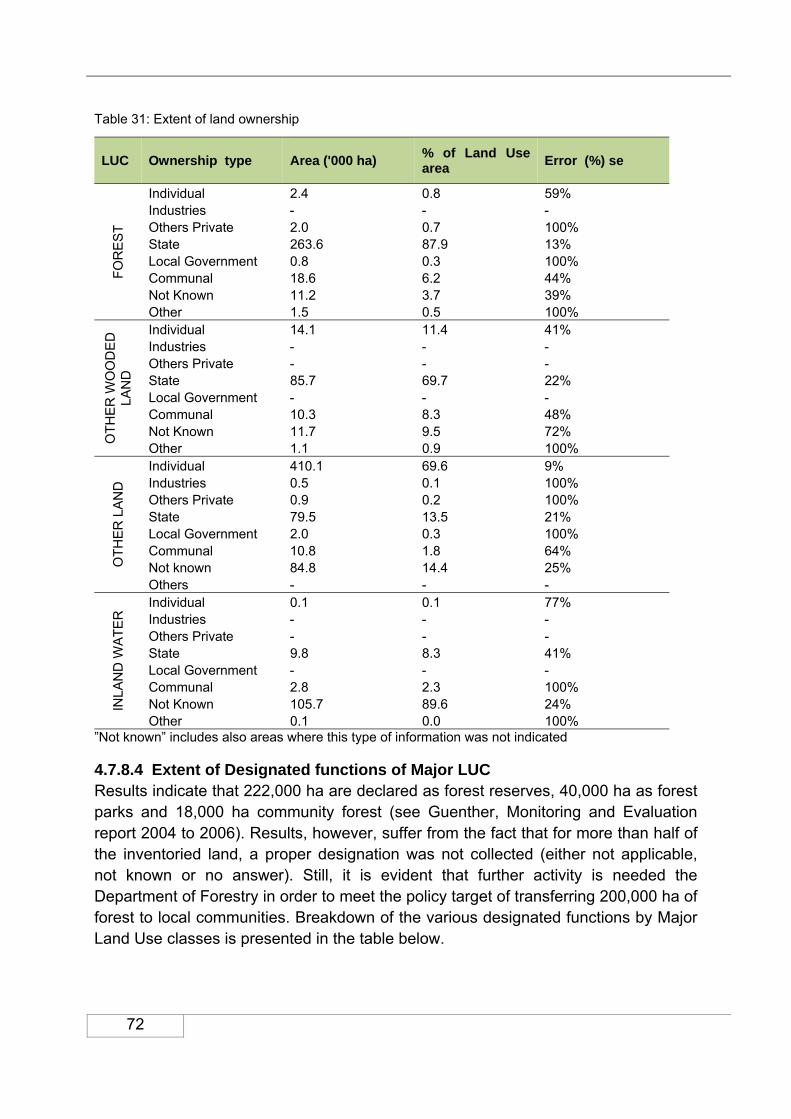
72
Table 31: Extent of land ownership
LUC Ownership type Area ('000 ha)
% of Land Use area
Error (%) se
FOR
ES
T
Individual 2.4 0.8 59% Industries - - - Others Private 2.0 0.7 100% State 263.6 87.9 13% Local Government 0.8 0.3 100% Communal 18.6 6.2 44% Not Known 11.2 3.7 39% Other 1.5 0.5 100%
OTH
ER W
OO
DE
D
LAN
D
Individual 14.1 11.4 41% Industries - - - Others Private - - - State 85.7 69.7 22% Local Government - - - Communal 10.3 8.3 48% Not Known 11.7 9.5 72% Other 1.1 0.9 100%
OTH
ER L
AN
D
Individual 410.1 69.6 9% Industries 0.5 0.1 100% Others Private 0.9 0.2 100% State 79.5 13.5 21% Local Government 2.0 0.3 100% Communal 10.8 1.8 64% Not known 84.8 14.4 25% Others - - -
INLA
ND
WAT
ER Individual 0.1 0.1 77%
Industries - - - Others Private - - - State 9.8 8.3 41% Local Government - - - Communal 2.8 2.3 100% Not Known 105.7 89.6 24% Other 0.1 0.0 100%
”Not known” includes also areas where this type of information was not indicated
4.7.8.4 Extent of Designated functions of Major LUC Results indicate that 222,000 ha are declared as forest reserves, 40,000 ha as forest parks and 18,000 ha community forest (see Guenther, Monitoring and Evaluation report 2004 to 2006). Results, however, suffer from the fact that for more than half of the inventoried land, a proper designation was not collected (either not applicable, not known or no answer). Still, it is evident that further activity is needed the Department of Forestry in order to meet the policy target of transferring 200,000 ha of forest to local communities. Breakdown of the various designated functions by Major Land Use classes is presented in the table below.
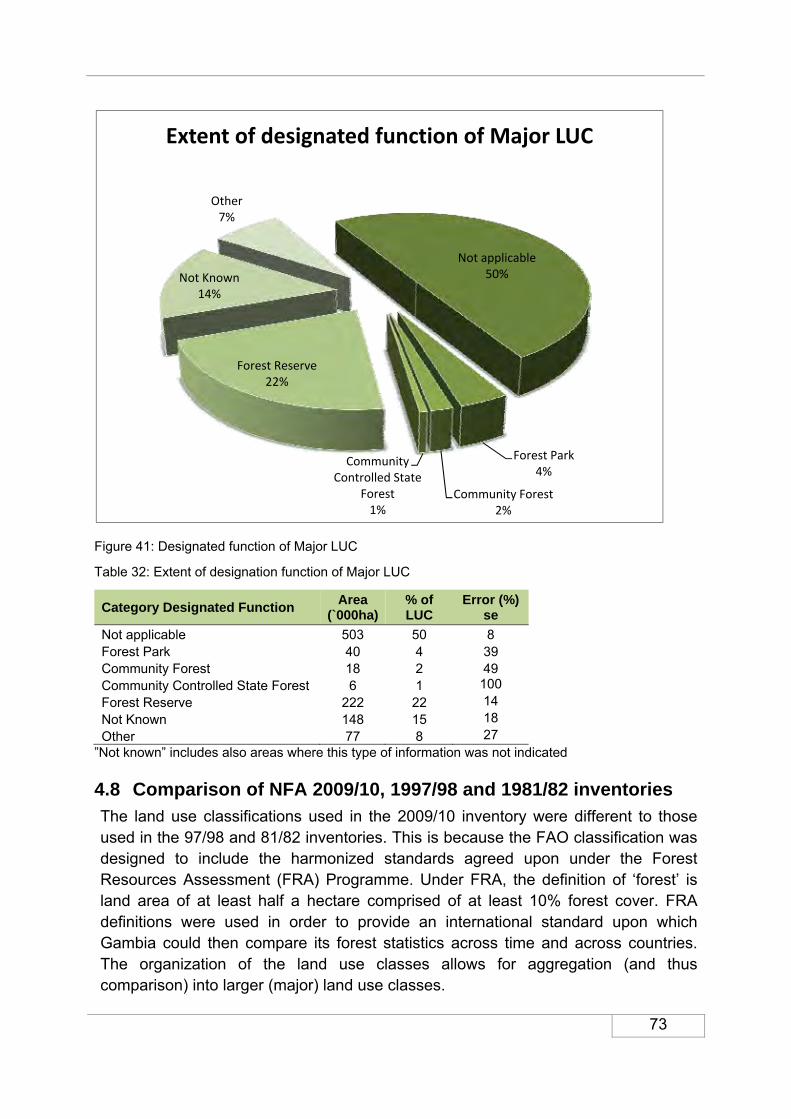
73
Figure 41: Designated function of Major LUC
Table 32: Extent of designation function of Major LUC
Category Designated Function Area
(`000ha)% of LUC
Error (%) se
Not applicable 503 50 8 Forest Park 40 4 39 Community Forest 18 2 49 Community Controlled State Forest 6 1 100 Forest Reserve 222 22 14 Not Known 148 15 18 Other 77 8 27
”Not known” includes also areas where this type of information was not indicated
4.8 Comparison of NFA 2009/10, 1997/98 and 1981/82 inventories
The land use classifications used in the 2009/10 inventory were different to those used in the 97/98 and 81/82 inventories. This is because the FAO classification was designed to include the harmonized standards agreed upon under the Forest Resources Assessment (FRA) Programme. Under FRA, the definition of ‘forest’ is land area of at least half a hectare comprised of at least 10% forest cover. FRA definitions were used in order to provide an international standard upon which Gambia could then compare its forest statistics across time and across countries. The organization of the land use classes allows for aggregation (and thus comparison) into larger (major) land use classes.
Not applicable50%
Forest Park 4%
Community Forest2%
Community Controlled State
Forest 1%
Forest Reserve 22%
Not Known 14%
Other7%
Extent of designated function of Major LUC
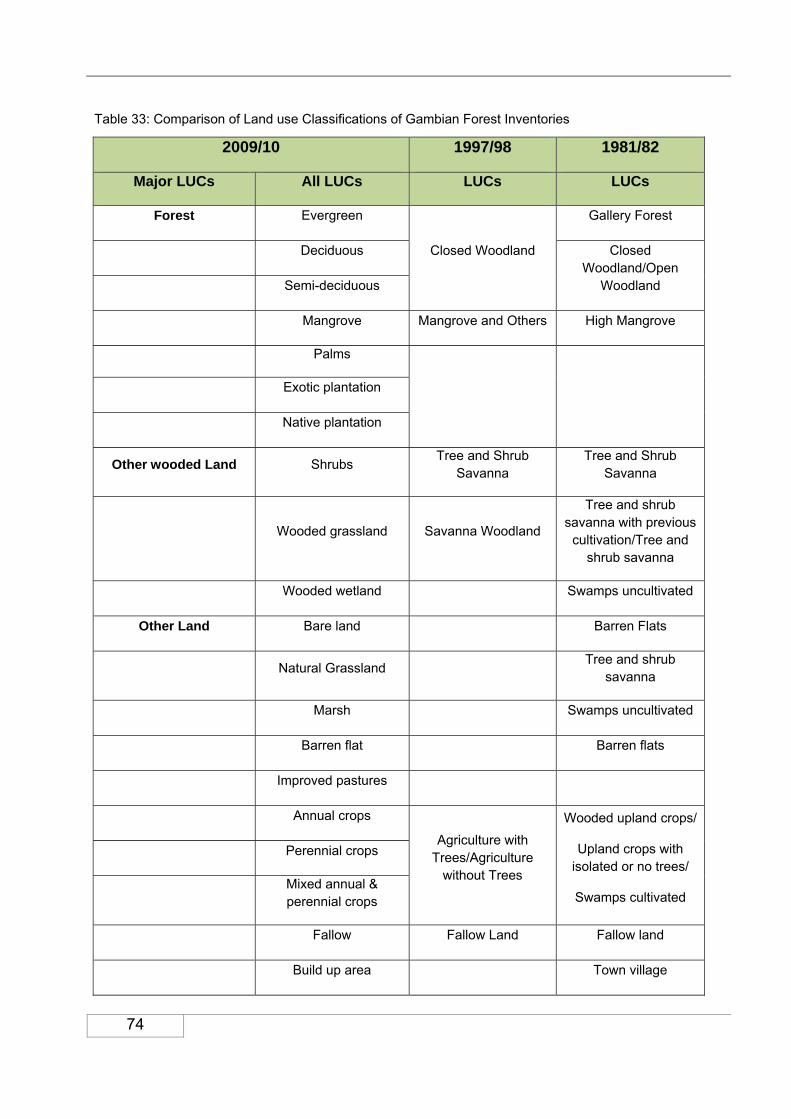
74
Table 33: Comparison of Land use Classifications of Gambian Forest Inventories
2009/10 1997/98 1981/82
Major LUCs All LUCs LUCs LUCs
Forest Evergreen
Closed Woodland
Gallery Forest
Deciduous Closed Woodland/Open
Woodland Semi-deciduous
Mangrove Mangrove and Others High Mangrove
Palms
Exotic plantation
Native plantation
Other wooded Land Shrubs Tree and Shrub Savanna
Tree and Shrub Savanna
Wooded grassland Savanna Woodland
Tree and shrub savanna with previous
cultivation/Tree and shrub savanna
Wooded wetland Swamps uncultivated
Other Land Bare land Barren Flats
Natural Grassland Tree and shrub savanna
Marsh Swamps uncultivated
Barren flat Barren flats
Improved pastures
Annual crops
Agriculture with Trees/Agriculture
without Trees
Wooded upland crops/
Upland crops with isolated or no trees/
Swamps cultivated
Perennial crops
Mixed annual & perennial crops
Fallow Fallow Land Fallow land
Build up area Town village
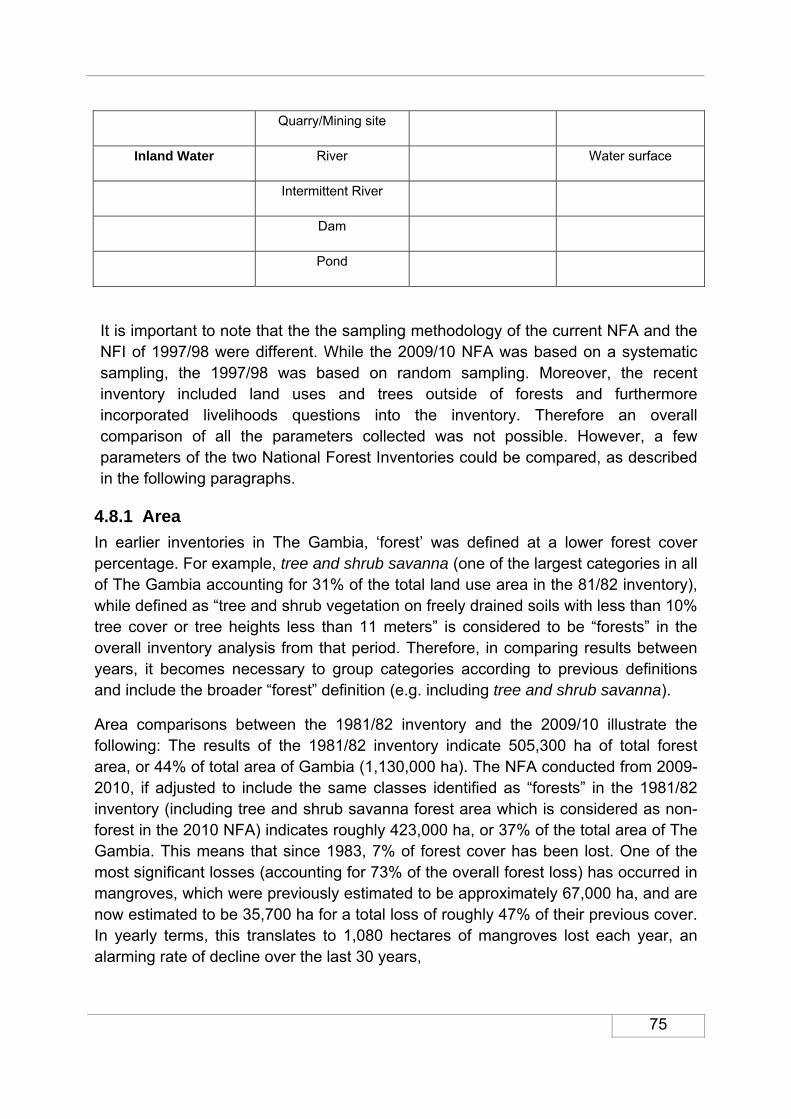
75
Quarry/Mining site
Inland Water River Water surface
Intermittent River
Dam
Pond
It is important to note that the the sampling methodology of the current NFA and the NFI of 1997/98 were different. While the 2009/10 NFA was based on a systematic sampling, the 1997/98 was based on random sampling. Moreover, the recent inventory included land uses and trees outside of forests and furthermore incorporated livelihoods questions into the inventory. Therefore an overall comparison of all the parameters collected was not possible. However, a few parameters of the two National Forest Inventories could be compared, as described in the following paragraphs.
4.8.1 Area
In earlier inventories in The Gambia, ‘forest’ was defined at a lower forest cover percentage. For example, tree and shrub savanna (one of the largest categories in all of The Gambia accounting for 31% of the total land use area in the 81/82 inventory), while defined as “tree and shrub vegetation on freely drained soils with less than 10% tree cover or tree heights less than 11 meters” is considered to be “forests” in the overall inventory analysis from that period. Therefore, in comparing results between years, it becomes necessary to group categories according to previous definitions and include the broader “forest” definition (e.g. including tree and shrub savanna).
Area comparisons between the 1981/82 inventory and the 2009/10 illustrate the following: The results of the 1981/82 inventory indicate 505,300 ha of total forest area, or 44% of total area of Gambia (1,130,000 ha). The NFA conducted from 2009-2010, if adjusted to include the same classes identified as “forests” in the 1981/82 inventory (including tree and shrub savanna forest area which is considered as non-forest in the 2010 NFA) indicates roughly 423,000 ha, or 37% of the total area of The Gambia. This means that since 1983, 7% of forest cover has been lost. One of the most significant losses (accounting for 73% of the overall forest loss) has occurred in mangroves, which were previously estimated to be approximately 67,000 ha, and are now estimated to be 35,700 ha for a total loss of roughly 47% of their previous cover. In yearly terms, this translates to 1,080 hectares of mangroves lost each year, an alarming rate of decline over the last 30 years,
76
Although the methodologies applied in the two National Forest Inventories are different, the Land Use Classes can be compared by grouping them. Table 34 (below) illustrates that in the NFA of 2009/10, the total area of Forest and Other wooded land summed up to 423,000 ha while the 1997/98 NFI revealed that the total area for Closed woodland, Savannah woodland and Tree and Shrub Savannah summed up to 520,000 ha. These results therefore indicate that there is a net decrease of 97,000 ha of forest and other wooded land from 1997/98 to 2009/10. It is assumed that the main factors responsible for the decrease could be attributed to the following:
Agricultural expansion; Bushfires Drought Settlement/encroachment Road construction.
The increase of population in The Gambia in the last decade coupled with the exchange in the traditional farming to mechanised a1gricultural practices have resulted in an increased demand on the land thus the conversion of some forest and other wooded lands to agricultural lands to satisfy the demand. This is manifested by the increase of the agricultural land indicated by the results of the NFA, 2009/10 over that of 1997/8 NFI.
The increase in population has also resulted in high pressure on forest areas for settlement purposes. This is also well manifested by the 2009/10 land Use/Cover map in comparison to the Land Use maps from 1993 (DL&S). The farmers and settlers adjacent to the forest encroached into these areas for settlement and farming activities.
The forest and other wooded land also suffered from road network construction and development. The construction and expansion of highways and numerous feeder roads has taken its toll on part of the forest and other wooded land areas thus resulting in the reduction of these covers.
While the area covered by mangrove was estimated from aerial photographs in the NFI of 1987/98, in the NFA of 2009/10, the area of the mangroves was really based on assessment on the ground. As only few tracts fell in this land cover type, their areas could very well be underestimated. The 1981/82 inventory, however, included field assessments of high mangroves (Rhizophora spp.) and estimated low mangroves (Avicennia spp.) using aerial image interpretation. So in this case, it is more feasible to compare the 2009/10 inventory results with the 1981/82 results. When compared over these two periods, we see a loss of just under half of the mangrove land use cover (47%). Even mangrove area statistics acquired during the 1997/98 inventory via aerial interpretation indicate a loss of mangroves from 1981/82.
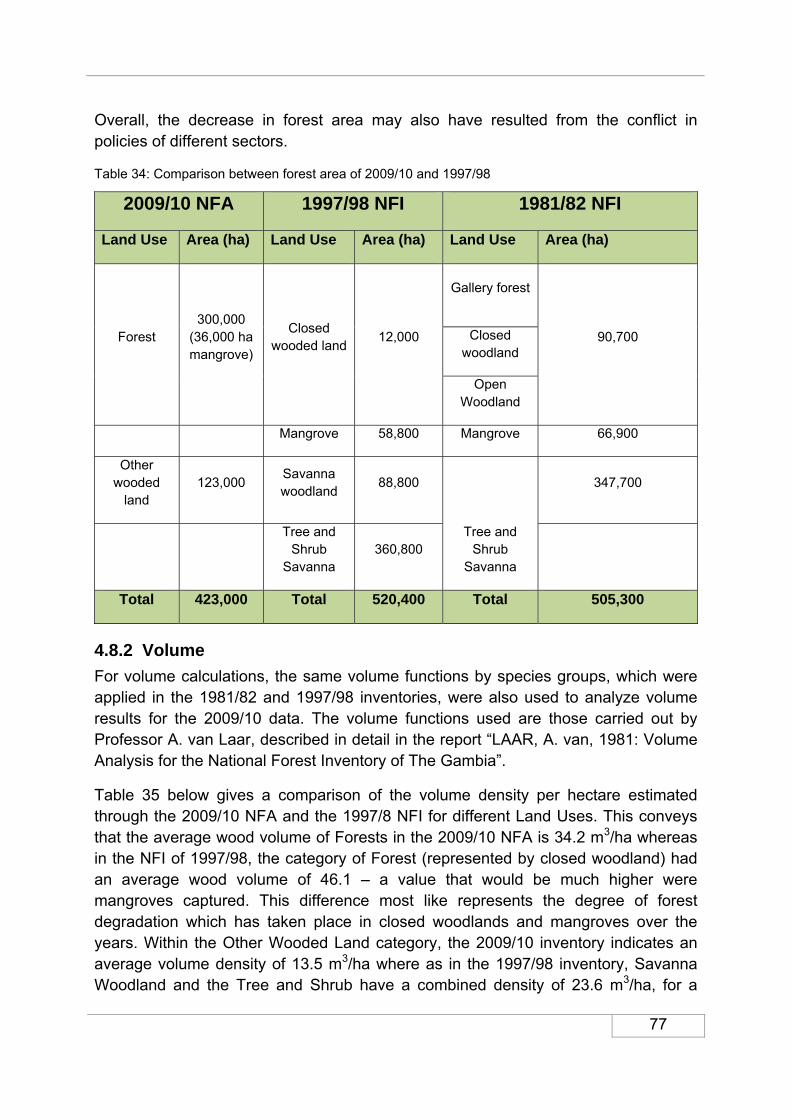
77
Overall, the decrease in forest area may also have resulted from the conflict in policies of different sectors.
Table 34: Comparison between forest area of 2009/10 and 1997/98
2009/10 NFA 1997/98 NFI 1981/82 NFI
Land Use Area (ha) Land Use Area (ha) Land Use Area (ha)
Forest 300,000
(36,000 ha mangrove)
Closed wooded land 12,000
Gallery forest
90,700 Closed woodland
Open Woodland
Mangrove 58,800 Mangrove 66,900
Other wooded
land 123,000 Savanna
woodland 88,800
Tree and Shrub
Savanna
347,700
Tree and
Shrub Savanna
360,800
Total 423,000 Total 520,400 Total 505,300
4.8.2 Volume
For volume calculations, the same volume functions by species groups, which were applied in the 1981/82 and 1997/98 inventories, were also used to analyze volume results for the 2009/10 data. The volume functions used are those carried out by Professor A. van Laar, described in detail in the report “LAAR, A. van, 1981: Volume Analysis for the National Forest Inventory of The Gambia”.
Table 35 below gives a comparison of the volume density per hectare estimated through the 2009/10 NFA and the 1997/8 NFI for different Land Uses. This conveys that the average wood volume of Forests in the 2009/10 NFA is 34.2 m3/ha whereas in the NFI of 1997/98, the category of Forest (represented by closed woodland) had an average wood volume of 46.1 – a value that would be much higher were mangroves captured. This difference most like represents the degree of forest degradation which has taken place in closed woodlands and mangroves over the years. Within the Other Wooded Land category, the 2009/10 inventory indicates an average volume density of 13.5 m3/ha where as in the 1997/98 inventory, Savanna Woodland and the Tree and Shrub have a combined density of 23.6 m3/ha, for a

78
decrease of 10.1m3/ha over that given period. Therefore, over the years there is a net reduction in the average wood volume between the two inventories both in forest and OWL categories. This difference could be explained by the reduction in the forest cover and the high demand of wood from a rising population as well as agricultural expansion. It is important to note that the standard errors in the 1997/98 on volume calculation were also very high.
Table 35: Volume per hectare (m3/ha) comparison between NFA 2009/10 and 1997/98
2009/10 NFA 1997/98 NFI
Land Use m3/ha Error % Land Use m3/ha s %
Forest 34.2 15.5 Closed Woodland 46.1 45.4
Other Wooded
Land 13.5 17.2 Savanna
woodland 32.8 104
Tree and
Shrub Savanna
19.8 81.8
In terms of comparisons between the 1981/82 inventory and the 2009/10 inventory, one can see from table 36 that while the overall volume went up, in large part due to the fact that a greater number of land use classes and trees outside of forests were captured in the most recent inventory, the volume density itself decreased by 2.1 m3/ha. The most striking difference is in saw timber in forests which has decreased by over one third in the 29 years between these two inventories. Saw timber volume density within forests has nearly halved during that same interval. Overall total volume of forests has decreased from 13.4 million cubic meters to 10.3 million cubic meters. While there is an increased in volume density indicated for total volume in forest land, this most likely represents the fact that low mangroves were not captured in the earlier inventory. This can also be seen in the results for firewood in forest land, as low mangroves are not considered to be merchantable.

79
Table 36: Volume and Density (GTZ Report, 1983)
Forest Land*
1981/82
Forest Land
2009/10
Tree-bearing
non forest
1981/82**
Tree-bearing
non forest
2009/10
TOTAL 1981/82
TOTAL 2009/10
Saw timber ('000) m3 4003
1449 628
804 4631
2253Density m3/ha 8.8 4.8 1.6 1.2 5.5 2.0
Firewood ('000) m3 9404
8804 2585
8714 11990
17518Density m3/ha 20.8 29.3 6.6 11.1 14.1 15.5
Total Volume ('000) m3 13407
10253 3213
9519 16620
19772Density m3/ha 30 34.2 8 12.2 19.6 17.5
* excluding low-mangroves ** excluding towns and villages
With respect to where the greatest changes have taken place over the years, the inventory results show that the greatest total volume density (26 m3/ha) is in the North Bank region (table 18). In the 1981/82 inventory, results indicated that Western region had the greatest tree volume at 29.2 m3/ha. Western region now however has a volume density of only 15m3/ha. This indicates a drastic reduction over the years, most likely owing to the loss in mangroves and the fact that Western region is the most densely populated region and therefore experiences the greatest pressure on the forested landscape.
4.8.3 Density
Table 37 indicates the density of trees revealed by the NFA of 2009/10 and the NFI of 1997/98 and 1981/82. On average, there are 42 trees per hectare according to the 2009/10 NFA results while in the NFI of 1997/98 the density was 106 trees per hectare and in the NFI of 1981/82, there were 124 trees per hectare. The high difference of 82 trees per hectare through the years could be attributed to the definitions used for trees in the two inventories as well as a high exploitation rate in these land cover types, indicating a very high rate of forest degradation
It is important to note that the 1997/98 NFA did not distinguish tree and shrub for density analysis instead it has considered all in the calculation. The 2009/10 NFA has made a distinction between the tree and shrub in the Land Use Classification, and it has considered only the trees for density calculation.
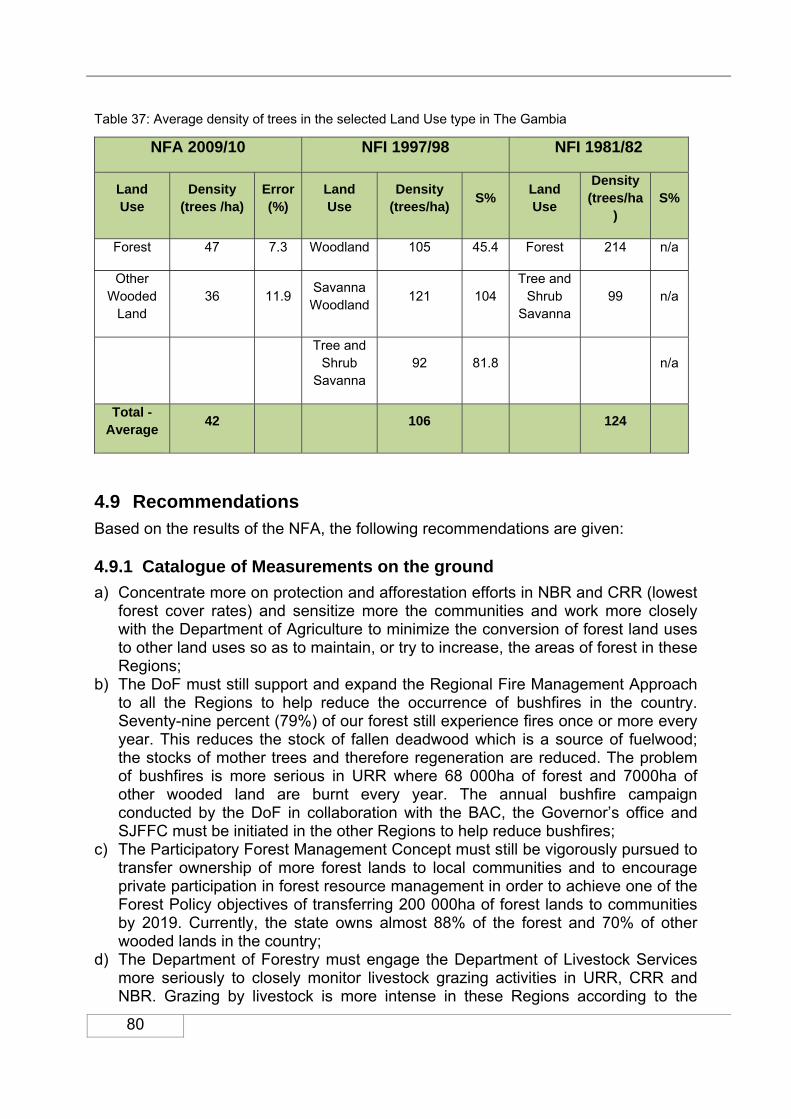
80
Table 37: Average density of trees in the selected Land Use type in The Gambia
NFA 2009/10 NFI 1997/98 NFI 1981/82
Land Use
Density (trees /ha)
Error (%)
Land Use
Density (trees/ha)
S% Land Use
Density (trees/ha
) S%
Forest 47 7.3 Woodland 105 45.4 Forest 214 n/a
Other Wooded
Land 36 11.9 Savanna
Woodland 121 104 Tree and
Shrub Savanna
99 n/a
Tree and
Shrub Savanna
92 81.8 n/a
Total -Average
42 106 124
4.9 Recommendations
Based on the results of the NFA, the following recommendations are given:
4.9.1 Catalogue of Measurements on the ground
a) Concentrate more on protection and afforestation efforts in NBR and CRR (lowest forest cover rates) and sensitize more the communities and work more closely with the Department of Agriculture to minimize the conversion of forest land uses to other land uses so as to maintain, or try to increase, the areas of forest in these Regions;
b) The DoF must still support and expand the Regional Fire Management Approach to all the Regions to help reduce the occurrence of bushfires in the country. Seventy-nine percent (79%) of our forest still experience fires once or more every year. This reduces the stock of fallen deadwood which is a source of fuelwood; the stocks of mother trees and therefore regeneration are reduced. The problem of bushfires is more serious in URR where 68 000ha of forest and 7000ha of other wooded land are burnt every year. The annual bushfire campaign conducted by the DoF in collaboration with the BAC, the Governor’s office and SJFFC must be initiated in the other Regions to help reduce bushfires;
c) The Participatory Forest Management Concept must still be vigorously pursued to transfer ownership of more forest lands to local communities and to encourage private participation in forest resource management in order to achieve one of the Forest Policy objectives of transferring 200 000ha of forest lands to communities by 2019. Currently, the state owns almost 88% of the forest and 70% of other wooded lands in the country;
d) The Department of Forestry must engage the Department of Livestock Services more seriously to closely monitor livestock grazing activities in URR, CRR and NBR. Grazing by livestock is more intense in these Regions according to the

81
results of the NFA and CRR and NBR happen to be the least forested Regions in relation to their own surface areas; The most frequent species are mainly fuel wood species therefore, the Department of Forestry must further strengthen its conservation efforts for species like the Rhunpalm, Mahogany and the African iron wood to maintain timber species also for the future.; e) Commercial fuel wood exploitation must be discouraged in URR or very
closely monitored as this Region has the lowest fuel wood stock density in the country;
f) Licenses for fuel wood exploitation could still be issued in NBR and LRR since these Regions are highly stocked in fuel wood. However, permits for timber tree harvesting must be discouraged in NBR and CRR;
g) Forest species diversity in the country is very low. The most frequent species are mainly fuel wood species. Therefore, the Department of Forestry must further strengthen its conservation efforts for species like the Rhunpalm, Mahogany and the African iron wood.
h) DoF should strengthen the collaboration with relevant stakeholders, partner institutions on the alternative energy sources for fuelwood and charcoal.
i) DoF should strengthen and support the adoption of use of new invention on energy saving stoves within the Urban and Rural areas.
j) DoF need to sensitize and build the capacity of forest product users on most economical use of the forest.
k) DoF should strengthen the use of mass media to create awareness of the general population on the importance of forest and the National Forest Assessment results. The essential components of the National Forest Assessment need to be simplified for the rural communities to understand the results better.
4.9.2 Capacity building
To ensure the effective and continuous monitoring of forestry resources, it is incumbent for the Forestry Department of The Gambia in collaboration with FAO to build and maintain national capacities on field form design, sampling design, field data collection, data processing and analysis, remote sensing and reporting.
The Department of Forestry needs to develop an “Action Plan” (see also chapter 4.11 The way forward - NFA Action Plan) to ensure that the experience gained from the NFA is followed-up and implemented in a way that the capacity to carry out NFAs in long term is guaranteed. The Technical Unit needs to be strengthened in order to take on the NFA tasks. The Department of Forestry should provide budget for NFA and maintain the staff and their competences through continuous capacity building related to NFA activities.
The Department of Forestry of The Gambia must work to improve capacity within the PTU of the NFA particularly on field and map data processing and analyses. Without such capacity the sustainability of the NFA will become impossible and as a result it would be difficult to justify maintaining and financing the unit.

82
4.9.3 Future monitoring
It is of paramount that the results of the NFA 2009/2010 are valued and the monitoring mechanism put in place becomes a permanent and lasting activity of the Forestry Department. To guarantee these operations, it is recommended that Forestry Department of The Gambia:
Institutionalizes the NFA, improves the managerial capacity of the NFA team, continues strengthening the NFA unit by additional training of the national personnel, maintains the personnel assigned to the project in their position and allocates means and resources for implementation of the forestry resources monitoring related activities.
Maintains the NFA database, introduces new technologies of information management and continues updating the baseline information to increase its relevance to the national policy processes and the international reporting.
Makes sure that NFA is carried out on a continuous basis to enable maintenance and development of competence and limit the annual needs of resources.
Ensures that the cycle for re-measurement in the NFA permanent plots is set at around 5 years and not less than 5 years.
Maintains the network of the permanent sample plots by safeguarding the records and undertaking periodic visits to the plot location.
4.9.4 Additional information needs
As demand for information by decision-makers would continue to change in time and by circumstances, it is recommended that:
The NFA and the monitoring system be continually adapted to the changing needs of information of the decision makers by timely identification and inclusion of the new variables;
The information framework be widened to cover issues of management and uses of the resources, biodiversity, climate change (biomass and carbon accounting), livelihoods and in relation with the national poverty reduction strategy;
The DoF of The Gambia to work towards counting on its own technical capacity to plan and implement future surveys based on the new identified information needs and generate such required information;
The DoF of The Gambia works to assign dedicated personnel who would ensure that the interest of the forestry sector and interest of The Gambia in general prevails by optimising the available resources and ensuring high quality delivery.
4.9.5 Actions for resources development
With the current Participatory Forest Management Approach of the DoF of The Gambia as included in the GFMC, a network of forest stations is well established all over the country creating therefore the potential for undertaking future systematic monitoring of the resources. However, technical personnel in

83
the regions require a close follow-up and training to ensure enhanced quality of data collection and timely implementation of the entire NFA process;
The value of the NFA data will increase with every re-measurement of the permanent sample sites in order to capture information on changes. The data and the permanent sampling grid are potentially useful to many other institutions. Collaboration concerning the fieldwork and the sharing of data between relevant stakeholder institutions should therefore be promoted and encouraged. It could also help spread the workload and costs related to conducting periodic fieldwork;
The NFA findings will help identify priority areas for intervention and will therefore be of use for the development of the forestry sector (national forest programme) and an evaluation of forestry policy/strategies in order to ensure a coherent legislation. The NFA is part of a continual process and not the end product in itself;
The diversity of ownership of the forestry resources in The Gambia and the high density of population lead to the recommendation of developing wise policies and management plans for forests and trees outside forests and to include a participatory approach with the private stakeholders.
4.9.6 International Reporting
The NFA will facilitate International Reporting as it produces information required by a number of international processes according to international standards. However, the driving force behind the NFA is the extent to which data is of use at national level e.g. for policy development or for resources management.
Data related to the composition of forests, their state and the uses of forestry resources will always come from field inventories through on-the-ground measurements, being the only way to capture reliable information on the majority of the many functions of forest and trees. The FAO support to the national forest and tree resources assessment of The Gambia is a two-way process, building national capacity in NFA and providing continuous feedback on methodological issues to FAO. It is therefore recommended:
To continue improve the compatibility between the different classification systems and forest/land use related terms and definitions employed nationally and in relation with the international reporting requirements.
To add new scope of information on global benefits such as biodiversity, climate change, trends (deforestation, improvement or degradation of natural forests;
To include any new parameters that can be of importance to the international processes.
4.10 NFA Conclusion
The National Forest Assessment (NFA) of 2009/10 is one of the most important forest assessment exercises in The Gambian history which has covered all the land
84
uses including the mangroves. The assessment was supported by FAO technical assistance and implemented by The Gambia Forestry Department. These implementation arrangements gave a national ownership and responsibility to the project to ensuring its sustainability in the long term.
Both biophysical and socio-economic data on forests and trees outside forest were collected from 152 tracts on a national grid based on systematic field sampling. The field data and maps were based on harmonized land use classification system and forest related terms and definitions in agreement with the global Forest Resource Assessment program of FAO. This assessment covered a wide range of forest and tree attributes including the productive, social, economic and environmental functions of forests and trees resulting to its richness and diversity in information as oppose to the last two National Forest Inventories carried out in 1981/82 and 1997/98 respectively.
In addition to the rich baseline information developed in The Gambia, the NFA process contributed largely to building the capacity within the Forestry Department and harmonisation of the land use classification frameworks, national forest and tree inventory and monitoring, data collection for systematic field sampling, mapping using remote sensing techniques, database development, data processing and reporting.
The statistics on land use areas need to be generated using two main sources: from the mapping on ASTER images and from the field sampling following a harmonised land use/forest type classification system. In the case of the NFA of The Gambia, the field sampling results were used to generate the estimates of forest types and land use classes. The project findings of area and related parameters were based more on the field sampling.
The NFA process has set up a monitoring system for future assessments of the forest and tree resources. A network of permanent sample plots has been established on the ground and well referenced in the records of the DoF for easy re-location in future. This project should therefore be seen as a foundation for long term natural resource monitoring. However, this depends on the priorities and commitments of The Gambia Forestry Department to maintain the built capacity, the developed database, and the set up network of permanent sample plots. It will depend on the action of The Gambia Forestry Department to institutionalize the NFA and ensure continuous financing from the Government budget and the National Forestry Fund (NFF). Moreover, it will depend on how the results will be disseminated and used by the decision-makers and how these results will be valued by the decision makers.
The NFA has followed a harmonized approach to forestry resources monitoring and Assessment thereby, putting The Gambia at the same level in scope, quality and
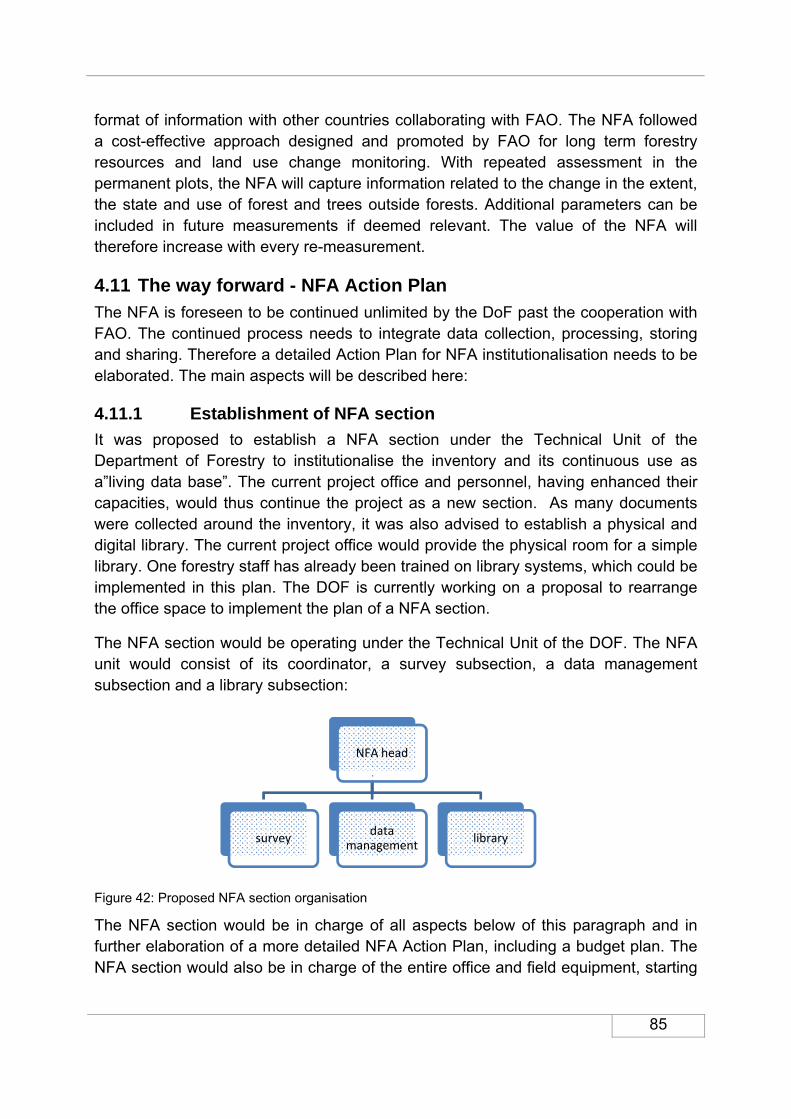
85
format of information with other countries collaborating with FAO. The NFA followed a cost-effective approach designed and promoted by FAO for long term forestry resources and land use change monitoring. With repeated assessment in the permanent plots, the NFA will capture information related to the change in the extent, the state and use of forest and trees outside forests. Additional parameters can be included in future measurements if deemed relevant. The value of the NFA will therefore increase with every re-measurement.
4.11 The way forward - NFA Action Plan
The NFA is foreseen to be continued unlimited by the DoF past the cooperation with FAO. The continued process needs to integrate data collection, processing, storing and sharing. Therefore a detailed Action Plan for NFA institutionalisation needs to be elaborated. The main aspects will be described here:
4.11.1 Establishment of NFA section
It was proposed to establish a NFA section under the Technical Unit of the Department of Forestry to institutionalise the inventory and its continuous use as a”living data base”. The current project office and personnel, having enhanced their capacities, would thus continue the project as a new section. As many documents were collected around the inventory, it was also advised to establish a physical and digital library. The current project office would provide the physical room for a simple library. One forestry staff has already been trained on library systems, which could be implemented in this plan. The DOF is currently working on a proposal to rearrange the office space to implement the plan of a NFA section.
The NFA section would be operating under the Technical Unit of the DOF. The NFA unit would consist of its coordinator, a survey subsection, a data management subsection and a library subsection:
Figure 42: Proposed NFA section organisation
The NFA section would be in charge of all aspects below of this paragraph and in further elaboration of a more detailed NFA Action Plan, including a budget plan. The NFA section would also be in charge of the entire office and field equipment, starting
NFA head
surveydata
managementlibrary

86
with an initial inventory and tracing the distribution and handing over of equipment for future field activities.
4.11.2 Data Storage and Sharing
The inventory data and results are a valuable base for further planning and policy development of the natural resource sector and beyond. The Information Need Assessment (chapter 4.4.1) delivered a broad spectrum of queries and challenges to be solved with improved information. It was even stated in the opening workshop, that”improved information management is key to development”. Related institutions expect the data to be shared in an efficient way to provide a base for synergetic and sustainable planning. Therefore the data needs to be stored safely and access for diverse stakeholders needs to be facilitated.
Thus, the Forestry Department proposes to store copies of the entire digital data set at the following four locations:
a) at the Department of Forestry Headquarter in Banjul as the data query elaboration centre;
b) at the Ministry for Forestry and the Environment for reference purpose;
c) at FAO Gambia for reference purpose;
d) at FAO Rome for global reporting purpose (already received).
The distribution would also serve as backup. In case one of the copies is inaccessible, destroyed or breaks down, it needs to be ensured that it is replaced immediately through copy from one of the remaining sources, preferable the Ministry or the Forestry Department, as the controlling institution. For safety and efficiency reasons, to avoid abuse of information and overlay of work, all queries should be placed to the DOF as the data controlling institution. Nevertheless, data shall be generously available, if reasonably needed for other sectors’ planning and discretion is guaranteed. Procedures need to be worked out, how a query request is handled to decide who is mandated to receive certain data.
4.11.3 Enhancing and multiplying Skills
At the moment only one senior forest officer of the DOF is trained well enough to answer query requests. Training will be necessary to enhance and multiply the skills of the personnel from at least DOF, NEA and DPWM on data maintenance and queries. Training of partner institutions is essential, so they can collaborate efficiently with the DOF and are aware of the query request options. It needs to be ensured that the technical knowledge remains and develops at each institution. Whenever the trained personnel is moved another person needs to be trained beforehand. The trained personnel also needs to be advised on data discretion.

87
4.11.4 NFA Results Popularisation
In general, the availability of the information needs to be promoted to the stakeholders and the general public to make best use of it. The TCP closing workshop will be observed by the local mass media and update the general public about the latest status of the NFA once again. Hereafter, continuously ongoing information shall be disseminated through local TV, radio and newspaper, according to the Gambian Forestry Communication Concept (DEPARTMENT OF FORESTRY, 2002).
General results of the analyses shall be made available for interested institutions and the general public immediately with the publication and validation at the TCP closing workshop. Therefore the report will be given out in hard copy to close partner institutions and in digital version to further identified stakeholders.
A more user friendly version of the data analyses can be given out in a summarised version. A brochure can promote the data and raise awareness for institutions and individuals that the active data base is accessible for further queries on demand.
The DOF already plans to sensitise the local authorities on the outcome and opportunities of the NFA through the UNDP project “Support on Energy and Environment/Forestry”.
The NFA and its results shall be published on the internet, namely the WebPages of FAO and the DOF. Thus global access to extracted data and the entire NFA procedure will be guaranteed.
4.11.5 Turn findings into action
Within the Forestry Department the database will be an important tool to follow up the targets of the latest forest policy and the strategies developed during the forestry policy popularisation. Thus the results need to be made well accessible to all forestry staff and respective stakeholders. They need to be trained to use diverse data for their multiple tasks, as planning, monitoring and reporting. The NFA section would be in charge to provide each forester with a useful set of data and consult senior and field staff on necessary measures resulting from inventory findings. The database will be a useful resource to implement the current policies and legislations and to update any upcoming strategy, guidelines or legislations in the forestry and related sectors.
The due National Forestry Action Plan (NFAP) will strongly benefit from the NFA results to become a useful tool for sustainable forest management (compare chapter 3.2.7 Base for National Forest Action Plan).
88
5 The Forest Policy Popularisation
5.1 Objective
The popularization of the new Forest Policy 2010-2019 is expected to create synergies with other Natural Resource Policies (fisheries, water resources, agriculture, biodiversity and wildlife and the Gambia Environmental Action Plan) and ensure that the new principles are known to all partners and stakeholders for meaningful participation in Policy Implementation.
In very broad terms, the Forest Policy 2010-2019 contributes to focus on Impacts rather than Revenue and maximizing the benefits of the forestry sector to the Gambian society, with a special emphasizes on the contribution of the sector to poverty reduction. It does this by seeking to balance and integrate the sustainable commercialization, community participation and environmental conservation of the Gambian forests, so that the forests can continue to produce vital environmental goods and services alongside supporting the development of the nation. It is also expected that the role of central Government, represented by the Department of Forestry (DoF), will need to change in the future to reflect the demand for greater public participation in Forest Policy implementation.
One of the critical elements for a successful public participation in the implementation of the Forest Policy is to let all relevant stakeholders, and interest groups know about the Forest Policy so that they can contribute to the entire policy implementation process and own it.
Although the formulation of the new policy followed series of participatory consultations, it was deemed necessary to embark upon a wider sensitization programme to consolidate and create greater awareness of the new national policy framework by providing relevant information to various stakeholders, including the local communities, on the content and implications of the new forest policy. In response to this need, the NFP support was designed to inform key stakeholders about how the new policy will be applied, its affects on the sector and the dependent people as well as the roles and responsibilities of each and every stakeholder in the implementation process of the programme.
5.2 Approach
5.2.1 Roadmap
The national consultancy for the popularization of the new forest policy (2010 – 2019) was contracted out to the National Consultancy on Forest Extension and Training (NACO), a local company specialized on extension and field training.
89
As part of its preparations for the popularization, NACO during the reporting period has collected almost all the existing policies on Agriculture and Natural Resources for review. This was important for the harmonization and creation of synergies in the popularization process.
It has also supported the forestry department in the formulation of a cabinet paper (brief) for the final adoption of the new policy which was still in its draft form even though the validation was conducted earlier.
During the reporting period, NACO also prepared an inception report and a detailed work plan including an overview of the methodology to be used for the popularization. Efforts are now being made to finalize the cabinet brief which must be sent to cabinet before the draft policy could be sent to the National Assembly for adoption.
5.2.2 Stakeholder Workshops
The following field activities were undertaken within the frame of the Forest Policy Popularisation:
18 series of workshops were held with 414 key stakeholders (23 Institutions participated) in the workshops from March – August 2010 across the country. Participants at the workshops included:
o staff of DoF and collaborating institutions, o the Regional Technical Advisory Committee members, o Ward Councillors, o District Chiefs and Village Heads.
Workshop participants were introduced to the aims, objectives and strategies within the policy. Special attention was paid to the priorities, timing and stakeholder responsibilities to the implementation of the policy;
5.2.3 Radio broadcasting
A one hour radio talk show was carried out with Gambia Radio and Television Services, Basse Station, to present the new policy to the URR and CRR audiences. Questions and contributions were accommodated during the program to clarify issues relating to Participatory Forest Management.
5.2.4 Translation in Local Language
The policy was translated into Mandinka, Jola and Fulla to facilitate understanding of the policy by the local communities.
5.3 Recommendations
Summary of issues raised during the workshops and discussions These issues and recommendations are based on the results of the workshops with various stakeholders and their views and thoughts regarding what needs to be done to enhance stakeholder participation in the implementation of the Forest Policy in The Gambia. The viewpoints presented here are entirely statements from stakeholders
90
(live comments un-edited) and are not representing the view points of popularization team.
5.3.1 Staff of Department of Forestry and collaborating Institutions:
Building and strengthening of the role of local communities in Forest Policy implementation;
Local communities to be directly involved in policy design and implementation to ensure their full commitment as stakeholders;
Capacity strengthening of DoF staff and staff of collaborating Institutions; Problems of Land tenure and other social conflicts might negatively influence
the attainment of policy objectives; Allocation of adequate resources for field implementation of participatory
forest management programs from the DoF Directorate; DoF staff in the Regional Multi- Disciplinary Facilitation teams needs to
continuously sensitize the local communities on the linkages between forestry and rural development so that communities consider forest management as a priority in the development of their three year strategic development plan to attract funding from the Community Driven Development Project (CDDP) of Government;
Lack of adequate capacity at all level of DoF for effective policy implementation;
Participatory Forest Management Unit of DoF to ensure timely processing of backlog of Forest Management Agreements to facilitate handing over forest ownership and management responsibilities to local communities;
Introduction of other forms of energy sources especially for the urban population as alternative to wood and charcoal which is currently becoming scarce and more difficult to acquire;
Policy implementation to address staff motivation;
5.3.2 Regional Technical Advisory Committees (TACs) and Ward Councillors
DoF to limit its functions to the provision of technical and legal guidance to communities, private sector and other stakeholders in the implementation of the policy;
DoF and other Agriculture and Natural Resource sectors be integrated for a better service delivery and sustainable conservation of the resources;
Decentralization of forest management responsibilities in accordance with the proposed Local Government Decentralization process;
Training of Village Development Committee (VDC) members in forestry matters and sensitize them on the new policy;
Land Use Plan of the country needs to be reviewed taking into account new developments in land uses especially Community Forest Management Concept and other related sector resource management;
DoF being the lead institutions should promote and follow-up village woodlots and other forms of tree planting;

91
Government to support the review of Local Government Policy on land tenure in view of harmonizing it with other sector- related policies;
DoF to continuously share experiences with other institutions in community based resource management;
The new policy should encourage Government to better re-consider including forestry in its development priorities and agenda;
During the policy implementation period, DoF’s actions should be impact oriented and not revenue oriented as enshrined in the policy document;
DoF to reduce the administrative procedures for handing forest ownership to interested stakeholders;
Despite the ban on the use of Chain Saws in Gambian Forests, illegal operators continues to fell timber trees;
Image of DoF should not be tarnished by unscrupulous staff due to their behaviour and actions in rural settings;
5.3.3 District Chiefs and Village Heads (Alikalolu)
Monitoring and supervision of forest resource management to be limited to communities and their local structures;
Translation of policy provisions into the local languages to make it user friendly;
Information on existing conflicts in relation to forest management to be accessed by the District Chiefs such that mediations could be arranged;
DoF to ensure that the District Chiefs and Village Heads are consulted prior to issuance of exploitation license and permits within their areas of jurisdiction;
Adequate coordination amongst Government Institutions to avoid conflicts on land use patterns;
Long term Government policy and strategy to be advanced in addressing sustainable energy supply for the urban populace;
Capacity building programs on policy implementation for the decentralized structures to advance the course of the new policy;
Ward Councillors to ensure that elements of the new policy are incorporated in their ward development plans;
5.3.4 Resume
The outcomes of the Popularization workshops showed that in order to achieve the aims and objectives of the new Forest Policy of The Gambia, the following strategies would have to be pursued as proposed during the workshops and consultations: 1. Strategy for Community Forestry and Private Forest Management; 2. Strategy for Co-Management of CCSF;
3. Strategy for Joint Forest Park Management;
4. Strategy for Forest Conservation and development of ecological, cultural and nature tourism;
92
5. Strategy on Research, Education, Information and Training;
6. Strategy on Forest Legislation and Law Enforcement; and
7. Strategy on Cross-cutting activities.
5.4 Outcome and Conclusion
The strategies above are approximately of equal priority. However, achieving the objectives of some of the strategies will require relatively more efforts than others. According to the perspectives of those involved in the workshops, all future plans, programs and projects in the forestry sector should be directed towards meeting the strategic objectives of the latest forestry policy.
Most of the stakeholders argued that DoF could do better if it consolidates its work on the ground and become strategically focused complimented with providing adequate resources for implementation. Increased cooperation with related sectors and strengthen strategic alliances to increase coverage alongside impact were emphasized by the Non- State Actors. The output of the workshops are developed action plans to implement the policy, which is provided in the Final Consultancy Report (NATURAL RESOURCES CONSULTING, 2010). Therefore, participants agreed that capacity building programmes, to enhance meaningful stakeholder participation in Policy Implementation, were considered key to successes.
5.5 Outlook
The Final Consultancy Report (NATURAL RESOURCES CONSULTING, 2010) highlights the outcomes of the new Forest Policy Popularization Activities and presents a number of strategies (see chapter 5.3.4 Resume) generated through the process that will be pursued to achieve the objectives of the Policy. Meeting these objectives and avoid low participation of primary stakeholders in Policy implementation, as in the past, will require a number of measures as outlined in the report.
The report provides detailed strategies and comprehensive 10 year action/work plans for the sensitised stakeholder groups. The strategies and work plans were elaborated in the diverse stakeholder workshops and provide each an individual hands-on tool for sustainable forest management. As they were elaborated by the stakeholder themselves, who thus carry ownership over the input, the chances for implementation motivation and realisation are better than for imposed plans. The implementation and updating of the planning matrixes should be encouraged, supported and monitored by the DoF and the related sectors.
93
6 The Review of Forestry Policy and Legislation in The Gambia
6.1 Objective
The latest version of the Forest Act is from 1998. Due to continuous developments in the forestry sector and related sectors, the legislation does not address all needs adequately anymore and can be considered as outdated.
The main purpose of this Forest Legislative Review is to carry out a comprehensive review of the national forestry Laws of The Gambia, with a view to determining how far they conform to prevailing best practices and international trends and obligations relating to sustainable and rational management and utilization of forest resources. The main international instruments are the United Nations Convention on Biological Diversity, the United Nations Convention to Combat Desertification, and the United Nations Framework Convention on Climate (three Conventions).
The outcome of this review formed the basis for the drafting of a revised Forest Legislation, and revised supporting Regulations.
6.2 Approach
6.2.1 Roadmap
The consultancy for the review of the Forest Legislation was contracted to a private legal practitioner, Ms Janet Ramatoulie Sallah-Njie. The national consultant after a thorough literature review based on existing policies, laws and international conventions to which Gambia is signatory has produced a zero draft which was circulated to senior cadre of both the Ministry of Forestry and the Environment and the Forestry Department but also to collaborating institutions for their comments and feedback. Feedback and comments based on the first Zero draft were later put together and forwarded to the national consultant. Following the arrival of the backstopping international legal Officer from FAO- Rome, consultations were initiated with some of the stakeholders like local authorities, Forest Associations, private plantation owners, saw-miller’s associations and the Forestry Department senior staff to get their views and have their perceptions on the review process so as to incorporate them in the first draft. The NACO Company was also a key partner in the consultation process for the legislative review and has contributed immensely to the mission of the backstopping legal Officer
Based on the comments and perceptions received from the above consultations as well as feedbacks on the Zero Draft, the legal national consultant produced a first draft taken into consideration all the comments and concerns from the stakeholders particularly those which were not already taken care of by the current Forest Act.
94
6.2.2 Document Review
In accordance with the terms of reference, the review was carried out by way of an initial desk top review of existing legal and policy framework directly and indirectly related to the forest sector with a view to ensuring their compliance or otherwise with international obligations (conventions, treaties and agreements), that The Gambia is bound by, and other relevant documents outlining best practices as far as sustainable and rationale management and utilization of the forest resource is concerned, namely:
Joint Forest Park Management Concept Market Analysis and Development Approach The Gambia Forest Communication Concept Community Control State Forest
6.2.3 Stakeholder Consultation
This initial review was followed by comprehensive consultations with all stakeholders within the forest sector. These consultations included the following:
a) Operators of Industry within the forest sector i.e. plantation owners, saw millers, etc,
b) Other sectoral departments like the National Environment Agency, Department of Parks and Wildlife, Ministry for Local Government and Lands,
c) Regional Forest Officials and other relevant officials within the Department of Forestry,
d) Community based organization involved in forest conservation activities, e) Local Government Authorities, f) Community forest owners and managers, g) Members of the National Assembly, and h) Officials of the Legislative Drafting Division at the Ministry of Justice.
6.2.4 Drafting of the Bill
The Revised Draft Forest Bill and revised Regulations are based on the agreed recommendation generated by this review and the recommendations of the stakeholder validation workshop, which was held by the Department for a comprehensive review of the first draft of the revised Bill.
6.3 Recommendations
Against the background of the legal and policy review, and stakeholder consultation at the validation workshop held by the Department of Forestry (chapter 6.2.1 Roadmap and 6.2.3 Stakeholder Consultation) it was recommended and agreed that the 1998 Act be reviewed particularly as regards the following subject areas:
95
6.3.1 Functions of the Department
The underlying principles in the Communication Concept and Market Analysis and Development should be taken into account in setting out the functions of the Department of Forestry.
6.3.2 Coordination among institutions and stakeholder participation in forest management
The proposed revisions of the Forest Act would take cognizance of the Inter-sectoral Committee on Biodiversity, established under section 88 of the Biodiversity and Wildlife Act.
6.3.3 Public participation in the process for the adoption of policy and plans
The current legislation provides in various provisions, placed sparsely throughout the Act, for the adoption of a policy (sec. 13), a national forestry action program (sec. 92), management plans for forest parks (sec. 96) and other forests, the keeping of an inventory (sec. 91), and a monitoring and evaluation system (sec. 17). These provisions have been grouped in a single chapter of the law, in order to clarify the contents and objectives of each of these instruments and to highlight the links among the various planning levels.
6.3.4 Community Controlled State Forests
Provisions for Community Control State Forests have been revised to be brought in line with the concept published by the Department on this matter, in coordination also with any new provisions which may be introduced regarding joint forest park management.
6.3.5 Joint Forest Park Management
In line with the Joint Forest Park Management Concept, the proposed legislation envisages the creation of a management body for each area, whose composition may be wider than that of a community forest committee.
6.3.6 Community Forestry
The provisions of the current legislation concerning community forestry have proven effective, but are nonetheless strengthened.
6.3.7 Private Forests
The requirements imposed on private forest owners by the current Forest Act have been reviewed. These include the obligation to prepare a management plan for any size of forest (sec. 76), without the assistance of the Department (sec. 83). There seems to be some confusion as to rights granted to owners of planted trees, which seem to be more limited than those granted to owners of natural trees (sections. 6

96
and 7). Although management planning requirements are generally less stringent for owners of private natural forests (sec. 99), these provisions are likely to result in disincentives to planting of trees and tending to them. They are also unlikely to be implemented because they are too difficult to enforce. Therefore, the reviewed provisions ensure that the services of the Department are engaged in the implementation of these obligations.
6.3.8 Land Use Conflicts
In order to address cross cutting and sectoral issues, particularly in relation to land use conflicts, the provision of section 90 of the Biodiversity and Wildlife Act 2003 are referred to in the new legislation. These provisions appropriately give the Biodiversity and Wildlife Committee, which has a multi-sectoral composition of both governmental and non-governmental actors, land use management responsibilities, subject to general guidelines aiming to environmental and social sustainability.
Further attention needs to be devoted to road and infrastructure planning, which under the current Gambia Roads and Technical Services Authority Act is not required to take into account forestry or other environmental interests.
6.3.9 Local Government Act and Decentralisation of the Functions of the DoF to the Local Councils
In order to address the relevant provisions of the Local Government Act relating to the functions of the Local Councils for the management of the forest resource within their areas of jurisdiction, the revised Act makes provisions for the transfer of such functions from the Department to Local Councils at an appropriate time to be determined by the ministers responsible for Forestry and Local Government respectively.
6.3.10 Control of industry
The Act gives the Secretary of State power to issue regulations, among other matters, on fixed and portable sawmills. There is currently general dissatisfaction as to the operation of chainsaws in the forests, as apparently their free accessibility facilitates illegal logging and unfair competition for sustainably managed community and other forests. This issue was further considered and it was agreed that comprehensive provisions be made in the revised Regulations, regulating the use of chainsaws.
6.3.11 Prevention and Control of Fires
Provisions concerning prevention and control of forest fires are strengthened, for example the revised Bill imposes an obligation on every regional forest officer to prepare a fire management plan, the contents of which are comprehensively provided for in the Draft revised Bill.
97
6.3.12 Offences and Penalties
Some of the penalties have become outdated, to the point that they are sometimes lower than fees required to legally taking a certain action. They have therefore been revised to make them more realistic.
6.3.13 Transparency
Some provisions of the Act are inappropriate because they allow an unlimited discretion to the administration, thus potentially hampering an equal and transparent application of the law. These include section 3, which allows the Secretary of State to “withdraw from the operation of all or any of the provisions of this Act any class of persons or any areas specified therein” indefinitely. The revised Bill therefore proposes to limit such powers by ensuring that the exercise of such discretion is guided by the provisions of the Act, Regulations and Guidelines issued by the Department.
6.3.14 Definitions
Another part of the existing legislation that has been reviewed is that setting out definitions. Some of these are for terms which are not used throughout the Act, such as “agroforestry” and “Assistant Director”, or used only once and not strictly necessary where they are used, such as “canted timber”.
6.4 Outcome and Conclusion
Generally the revision has taken the form of rearranging and reorganizing the various sections of the 1998 Forest Act, so as to ensure that all sections fall within the Part that is more relevant in terms of subject matter and content.
In addition to the above, several new provisions have been incorporated in line with the findings of the legal review as follows:
• Clause 6 incorporates the idea of local authority forestry in line with the decentralization provisions in the Local Government Act, 2004
• Under clause 8 provisions are made conferring on the forestry department wide powers and functions for conservation of forest resources.
• Part VI has comprehensive provisions relating to community controlled state forest.
• Part VII provides for joint forest park management
• Clause 75 brings in the role of the biodiversity and wildlife committee under the Biodiversity and Wildlife Act 2003. This is basically to ensure collaboration
98
between the two Departments in terms of matters relating to biodiversity and forest resource conservation.
• Clause 78 makes provision for a National Forest Plan. This is to ensure that the Department is given the responsibility to prepare a national master plan for forest management. All management plans in all forest categories should comply with the National Forest Plan (clause 89).
• Part XI seeks to domesticate the relevant matters under the CITES convention relating to protection of flora.
• Part XII and XV are also new and deal exclusively with removal of forest produce.
• Part XVI Import and Export are innovative. This Part seeks to regulate import and export of forest products. Part XVII seeks to incorporate control measures by providing procedure for the marking of any forest produce to be extracted from any forest.
• Part XVII strengthens the existing provisions, in the 1998 Forest Act, relating to the powers of forest officers and law enforcement officers.
• Part XVIII also reinforces the existing provisions relating to offences and penalties. The penalty classes would still be maintained in the schedule however it is recommended that the appropriate fines and imprisonment terms should be agreed upon at the validation workshop, when stakeholders would be involved in the determination of appropriate punishment for forest offenders.
• Clause 147 makes provisions for the preparation and issuance of forest guidelines to ensure efficient departmental management of forest resources. Under this clause, departmental guidelines could be issued on the concepts developed by the department e.g. fire management strategy, market analysis and development approach, forest communication concept etc.
• It is also proposed that schedule I and II relating to the community forest management applications and agreements be moved to the Regulations.
• Matters relating to the following are also addressed in the draft Regulations:
• Fire management guidelines • Various application forms • Procedures for preparation of management plans • Chain saw regulation.

99
6.5 Outlook
A detailed report was provided by the consultant to trace the procedures and conclusions (SALLAH-NJIE, 2010).
The bill is currently at Ministry of Justice for review, after which it would be forwarded to the National Assembly for approval.
With the updated legislation, the forestry sector provides a strong future tool to back up and address current policies, strategies and concepts for the synergetic development of the forestry sector and related sectors aiming at sustainable natural resource management, the empowerment of stakeholders in such and the improvement of livelihood of local communities through sound use and marketing of the natural resources. Current review and update will be necessary to adapt to future developments and adapt to latest knowledge and technologies.
7 TCP Conclusion
The described TCP with its three components, namely the NFA, the Forest Policy Popularisation and the Forest Legislative Review, increased immensely the capacities of the forestry sector to sustainably manage the forest resources from an environmental, social and economic perspective.
The NFA successfully generated a “living database” and a data management system to produce continuously reliable information on forest resources for policy formulation, institutional capacity building, planning, conservation and utilization of natural resources on a sustainable basis. It does not only improve the local, but also regional and global reporting system. Technology transfer in form of knowledge and equipment, build the capacity of Forestry Department personnel and other involved stakeholders.
Through the nationwide Popularization of the Forest Policy 2010-2019, diverse levels of stakeholders were enhanced with improved knowledge, how to use the forest policy as a tool for sustainable development. The participatory elaborated 10- year-workplans of the key stakeholder groups provide a hands-on tool for successful forest policy implementation for local and global benefit.
The legislative review of the forest act resulted successfully in the draft of a bill for cabinet approval. The improved and updated version ensures the rational legal backup of sustainable forest management under the latest development context.
All three components had a strong participatory approach, which increases the awareness on forestry matters and leads to better acceptance of the action outcome through intellectual ownership.
100
With these new tools and the awareness increase, the project laid a base to overcome the current challenges threatening the forest and tree resources. Thanks to an enhanced information management system, better understanding of the forest policy among key stakeholders and the general public, as well as an updated legislation, forest conservation, sustainable and synergetic management of essential forest resources and marketing can be implemented more efficient in future. Thus, the project clearly improved opportunities to increase livelihood especially for the forest dependent rural population.

101
Bibliography
Literature
CHAM, A.A. (2009): Inception Report on Mapping and Remote Sensing P. 2 – 11.
CHAM, A.A. (2011): Final Report on Mapping and Remote Sensing P. 15.
DEPARTMENT OF FORESTRY (1998): Forest Act 1998. Banjul, The Gambia. P.33.
DEPARTMENT OF FORESTRY (2000 (1)): National Forestry Action Plan (2000-2010). Banjul.
DEPARTMENT OF FORESTRY (2000(2)): National Action Plan to combat Desertification (2000-2010). Banjul.
DEPARTMENT OF FORESTRY (2001): Gambia Forest Management concept, Banjul, The Gambia. P. 16 - 20.
DEPARTMENT OF FORESTRY (2002): Gambian Forestry Communication Concept. Banjul. P.16-20
DEPARTMENT OF FORESTRY (2005): Community Forestry Implementing Guidelines. Banjul. P. 14, 64 & 70.
DEPARTMENT OF FORESTRY (2009): Forest Bill 2009. Banjul. P.37.
DEPARTMENT OF FORESTRY (2010): Forestry Sub-Sector Policy 2010-2019. Banjul
DEPARTMENT OF STATE FOR FINANCE AND ECONOMIC AFFAIRS (2006): Poverty Reduction Strategy 2007-2011. Banjul
FOOD AND AGRICULTURE ORGANISATION (2005): Adopted National Forest Assessment (NFA) of The Gambia Field Manual. Rome. P. 9- 144
GUENTHER, L. (2009(1)): Information Needs Assessment. Banjul.
GUENTHER, L. (2009(2)): Information Needs Processing. Banjul. p. 9 – 83.
GUENTHER, L. (2004-2006): Monitoring & Evaluation Report on CF Status. Banjul, p. 12.
FORSTER, H. (1983): Evaluation of the National Forest Inventory of The Gambia, GGFP, Report No.10. P. 8
JACKSON, J.K, TAYLOR II, G.F AND CONDÉ-WANE, C (1983): Management of the Natural Forest in the Sahel Region. P. 19

102
JATTA, M. (2010): Guideline for data processing of NFA. Banjul P. 24 -27
KHEMAIES, S. (2010): National Forest Assessment Report. P. 6 - 9
LUDWIG, R. AND BOJANG, L. (1998): Results and Analysis of the National Forest Resource Inventory The Gambia 1997/98, URDFP. P.4 & 6.
NATIONAL ENVIRONMENT AGENCY (1991): Gambian Environmental Action Plan. Banjul
NATIONAL ENVIRONMENT AGENCY (2010): State of the Environment Report. Banjul, 2010. P. 3,7 16 & 18.
NATURAL RESOURCES CONSULTING (2010): Popularization of the Forest Policy (2010-2019) amongst Key Stakeholders in The Gambia. Banjul P. 4 - 23
PERCIVAL, D.A. 1968: The common trees and shrubs of The Gambia P 20 - 268.
RODAS, J. R. (2009): National Forest Assessment The Gambia Report. P. 4 - 8
SCHINDELE, W. (2001): Gambian Forest Management Concept (GFMC), 2nd Version, Draft. Banjul.
SALLAH-NJIE, J. R. (2001): Review of Forest Policy and Legislation in The Gambia. Banjul P. 3 - 44
SONKO, K. AND THOMA, W. (1999): Developing a Concept for Community Controlled State Forest. Banjul.
THOMA, W. (2003): Joint Forest Park Management Concept. Banjul.
ZOHRER, F. (1981): An Inventory Design for the National Forest Inventory of The Gambia (NFIG), GGFP Report No. 1. P. 8
Guideline on Community-based tree and forest product enterprises Market Analysis and Development
Maps:
DEPARTMENT OF LANDS AND SURVEYS (1993): Land use Map of The Gambia, 1/50000
DEPARTMENT OF LANDS AND SURVEYS (2003): Land use Map of The Gambia, 1/50000
DEPARTMENT OF LANDS AND SURVEYS (2003): Road network vector map of The Gambia, 1/50000
JICA/DEPARTMENT OF LANDS AND SURVEYS (2002): Topographic map, 1/50000
GAMBIAN BUREAU OF STATISTICS (2003): Settlement map of the Gambia, 1/50000

103
Internet Sources:
http://data.un.org/CountryProfile.aspx?crName=Gambia,12.05.2011, 15:21
hdrstats.undp.org/en/countries/profiles/GMB.html, 14.05.2011, 15:32
Other Sources:
GAMBIAN BUREAU OF STATISTICS (2003): Population Data

104
Annexes

105
Annex I - Inventory Field Forms

1. NFI The Gambia
2. TRACT N° .......
Population distribution
21e. Ethnic group C
22. Years since settlement C
23. Population dynamics C
24a. Population main activity C
24b. Secondary activity C
A. TRACT LOCATION
B. HUMAN POPULATION IN THE TRACT
C. PROXIMITY to Infrastructure D. TRACT ACCESS
Reference points of access path (Route sketch on reverse side)
35. ID 36. Description 37a. UTM E (m) 37b. UTM N (m) 36b. Photo # 36d. Bearing (o)
38a. Notes.............................................................................................................................................................................................
………………………………………………………………………………………………………………………………………
………………………………………………………………………………………………………………………………………
………………………………………………………………………………………………………………………………………
25. Settlement history 25a. Year
/Period
0 Not Applicable (no inhabitants…)
1 War/Civil conflict
2 Insecurity, ethnic conflicts
3 Change of ownership/land tenure
4 Expansion of agriculture
5 Urban development
6 Infrastructure, electric power
7 Economic crisis
8 Natural disaster
9 Human disease
10 Rural-to-urban migration
11 Urban-to-rural migration
12 Rural-to-rural migration
13 Urban-to-urban migration
14 Immigration
15 Emigration
Others
Headed by
Total Female Male
21c. Number of households
Total Female Male
21f. Average household size
21d. Adult literacy rate (%)
21k. Number of refugees
21. Population on the tract
Coordinates Tract Center Point [GIVEN]
14f. UTM E _ _ _ _ _ _ _ m
14g. UTM N _ _ _ _ _ _ _ m
7. Region .........................................
8. Local Gvt. Area............................
9. District.........................................
9a. Ward ……………………………
9b. Enumeration area ………………
10. Community..................................
10b. Name of place…..........................
Distance from centre of tract to nearest:
26. All-weather road _ _ , _ km
27. Seasonal road _ _ , _ km
28. Settlement _ _ , _ km
29. Health centre _ _ , _ km
31c. Skill centers _ _ , _ km
30. School _ _ , _ km
31a. Food Market place _ _ , _ km
31b. Lumo Market _ _ , _ km
Nomadic/transhumant population
21g. Number of households 21i. Ethnic group C
21h. Average household size 21j. Period in the tract _ _ - _ _ (month – month)
11a. GEZ C
11b. AEZ C
12. Altitude Tract centre m
13. Maps & aerial photos....................
............................................................
Access time:
33a. Start time: _ _ : _ _ h 33c. Start date***: _ _/_ _/_ _
34a. End time: _ _ : _ _ h 34c. End date***: _ _/_ _/_ _
34b. Arriving at plot No 34d. Total Access Time: _ _ : _ _ h
*** dd/mm/yy
Leaving Road coordinates
(position at which the team leaves
vehicle and starts walking to tract/plot)
32a. UTM E _ _ _ _ _ _ _ m
32b. UTM N _ _ _ _ _ _ _ m
F1 a TRACT
14c. Cooordinate system
UTM (Prj.) (datum: WGS84): 28N
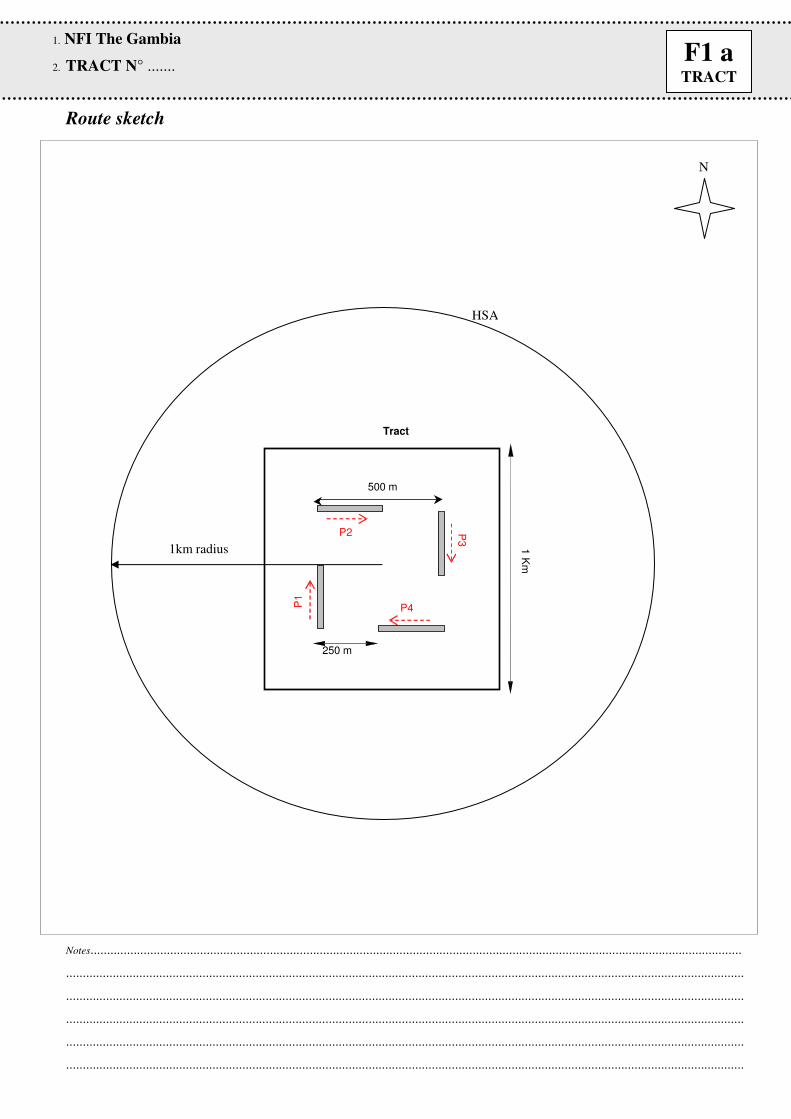
1. NFI The Gambia
2. TRACT N° .......
Route sketch
Notes....................................................................................................................................................................................................
............................................................................................................................................................................................................
............................................................................................................................................................................................................
............................................................................................................................................................................................................
............................................................................................................................................................................................................
............................................................................................................................................................................................................
N
1km radius 1 K
m
Tract
P1
P3
P4
250 m
500 m
P2
HSA
F1 a TRACT

1. NFI The Gambia
2. TRACT N° .......
PERSONS INVOLVED IN THE ASSESSMENT
*Code indicates the informant’s relation to the area, i.e. O = Estate Owner, E = Employee, M = Manager of site, S = Settler, I = Internal key informant;
X = External key informant
38b. Notes: .........................................................................................................................................................................................................................................
………………………………………………………………………………………………………………………………………………………………………
………………………………………………………………………………………………………………………………………………………………………
………………………………………………………………………………………………………………………………………………………………………..
E. Team/Owner/Informant list
20. Informant*
15. Name 16. Address 16b. Title / Function 17. Phone number 18
a. T
eam
lea
der
18b
. T
eam
mem
ber
19
. O
wn
er
O E M S I X
F1 b TRACT
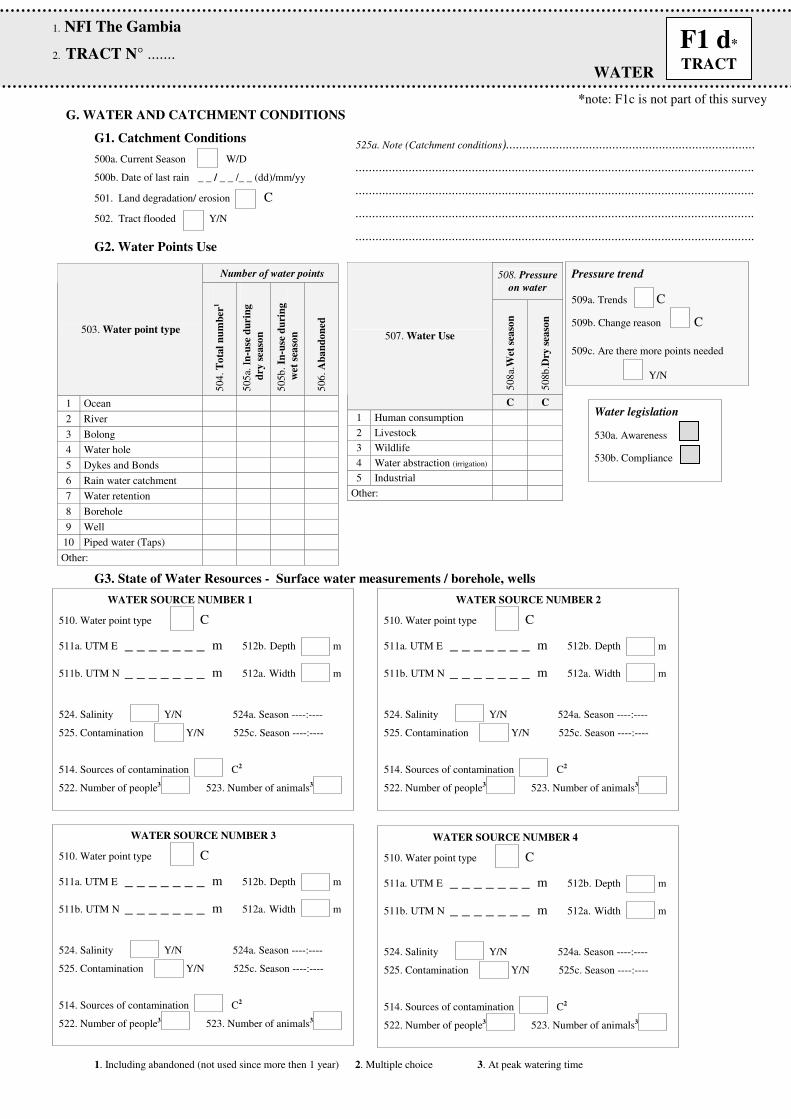
1. NFI The Gambia
2. TRACT N° .......
WATER
WATER SOURCE NUMBER 1
510. Water point type C
511a. UTM E _ _ _ _ _ _ _ m 512b. Depth m
511b. UTM N _ _ _ _ _ _ _ m 512a. Width m
524. Salinity Y/N 524a. Season ----:----
525. Contamination Y/N 525c. Season ----:----
514. Sources of contamination C2
522. Number of people3 523. Number of animals3
WATER SOURCE NUMBER 2
510. Water point type C
511a. UTM E _ _ _ _ _ _ _ m 512b. Depth m
511b. UTM N _ _ _ _ _ _ _ m 512a. Width m
524. Salinity Y/N 524a. Season ----:----
525. Contamination Y/N 525c. Season ----:----
514. Sources of contamination C2
522. Number of people3 523. Number of animals3
WATER SOURCE NUMBER 3
510. Water point type C
511a. UTM E _ _ _ _ _ _ _ m 512b. Depth m
511b. UTM N _ _ _ _ _ _ _ m 512a. Width m
524. Salinity Y/N 524a. Season ----:----
525. Contamination Y/N 525c. Season ----:----
514. Sources of contamination C2
522. Number of people3 523. Number of animals3
WATER SOURCE NUMBER 4
510. Water point type C
511a. UTM E _ _ _ _ _ _ _ m 512b. Depth m
511b. UTM N _ _ _ _ _ _ _ m 512a. Width m
524. Salinity Y/N 524a. Season ----:----
525. Contamination Y/N 525c. Season ----:----
514. Sources of contamination C2
522. Number of people3 523. Number of animals3
G. WATER AND CATCHMENT CONDITIONS
G1. Catchment Conditions
500a. Current Season W/D
500b. Date of last rain _ _ / _ _ /_ _ (dd)/mm/yy
501. Land degradation/ erosion C
502. Tract flooded Y/N
G2. Water Points Use
G3. State of Water Resources - Surface water measurements / borehole, wells
1. Including abandoned (not used since more then 1 year) 2. Multiple choice 3. At peak watering time
Number of water points
503. Water point type
504
. T
ota
l n
um
ber
1
505
a. I
n-u
se d
uri
ng
dry
sea
son
505b
. In
-use
du
rin
g
wet
sea
son
506
. A
ba
nd
on
ed
1 Ocean
2 River
3 Bolong
4 Water hole
5 Dykes and Bonds
6 Rain water catchment
7 Water retention
8 Borehole
9 Well
10 Piped water (Taps)
Other:
508. Pressure
on water
508
a.W
et s
easo
n
508b
.Dry
sea
son
507. Water Use
C C
1 Human consumption
2 Livestock
3 Wildlife
4 Water abstraction (irrigation)
5 Industrial
Other:
525a. Note (Catchment conditions)...........................................................................
........................................................................................................................
........................................................................................................................
........................................................................................................................
........................................................................................................................
Pressure trend
509a. Trends C
509b. Change reason C
509c. Are there more points needed
Y/N
F1 d* TRACT
*note: F1c is not part of this survey
Water legislation
530a. Awareness
530b. Compliance

Day 1:
48. Date 1**: _ _ /_ _ /_ _
49a. Start time: _ _ : _ _ h
51a. End time: _ _ : _ _ h
** dd/mm/yy
1. NFI The Gambia
2. Tract N°.......... 3. Plot N°
A. PLOT ACCESS B. TIME RECORD OF WORK WITHIN PLOT D. PLOT PLAN (52)
C. PLOT STARTING POINT DESCRIPTION
Reference points surrounding Marker position
44. ID 45. Description 46. Bearing*
(°)
47. Distance*
(m) 36c
ID Photo
* From Marker position
53. Notes: ....................................................................................................
……………………………………………..................................................
.....................................................................................................................
.....................................................................................................................
..........................................................................................................................
........................................................................................................................
.........................................................................................................................
..........................……………………………………………..................................
.................................................................................................................................
Day 2*:
50. Date 2**: _ _ /_ _ /_ _
49b. Start time: _ _ : _ _ h
51b. End time: _ _ : _ _ h
*If work in the plot takes more than
one day.
43. Plot starting point plan: M = Marker position
P = Plot starting point, if P ≠ M for any reason
Marker position (GPS reading) if ≠≠≠≠ from Plot Starting Point:
40a. UTM E _ _ _ _ _ _ _ m
40b. UTM N _ _ _ _ _ _ _ m
41. Distance from Marker to Plot starting point m
42. Bearing from Marker to Plot starting point °
Central line bearing:
Plot # 1 = 0° Plot # 2 = 90°
Plot # 3 = 180° Plot # 4 = 270°
Plot end point:
39e. UTM E _ _ _ _ _ _ _ m
39f. UTM N _ _ _ _ _ _ _ m
Plot starting point (given):
39a. UTM E _ _ _ _ _ _ _ m
39b. UTM N _ _ _ _ _ _ _ m
Departing point to reach plot: (same as
F1-32a,b if first visited plot)
34g. UTM E _ _ _ _ _ _ _ m
34h. UTM N _ _ _ _ _ _ _ m
Access Time:
34i. Start time: _ _ : _ _ h
34j. End time: _ _ : _ _ h
M
250m = Plot end
CSP1 & RSP1
0 m
CSP3 & RSP2 245 m = MP 3
CSP2 & RSP2 125 m = MP 2
5 m = MP 1
0 m = Plot start
0 m
Plot end point
100 m
50 m
150 m
200 m
+ 1
0m
− 1
0m
−
10m
+ 1
0m
Plot starting point
Plot middle point:
39c. UTM E _ _ _ _ _ _ _ m
39d. UTM N _ _ _ _ _ _ _ m
Legend:
LUCS limit
Rd1 (Paved road)
_ _ _ Rd2 (Primary road unpaved)
Rd3 (Secondary road)
Rd4 (Track)
_ . _ W1 (Perennial stream)
W2 (Intermittent stream)
Other
52b.
Number
F2 PLOT
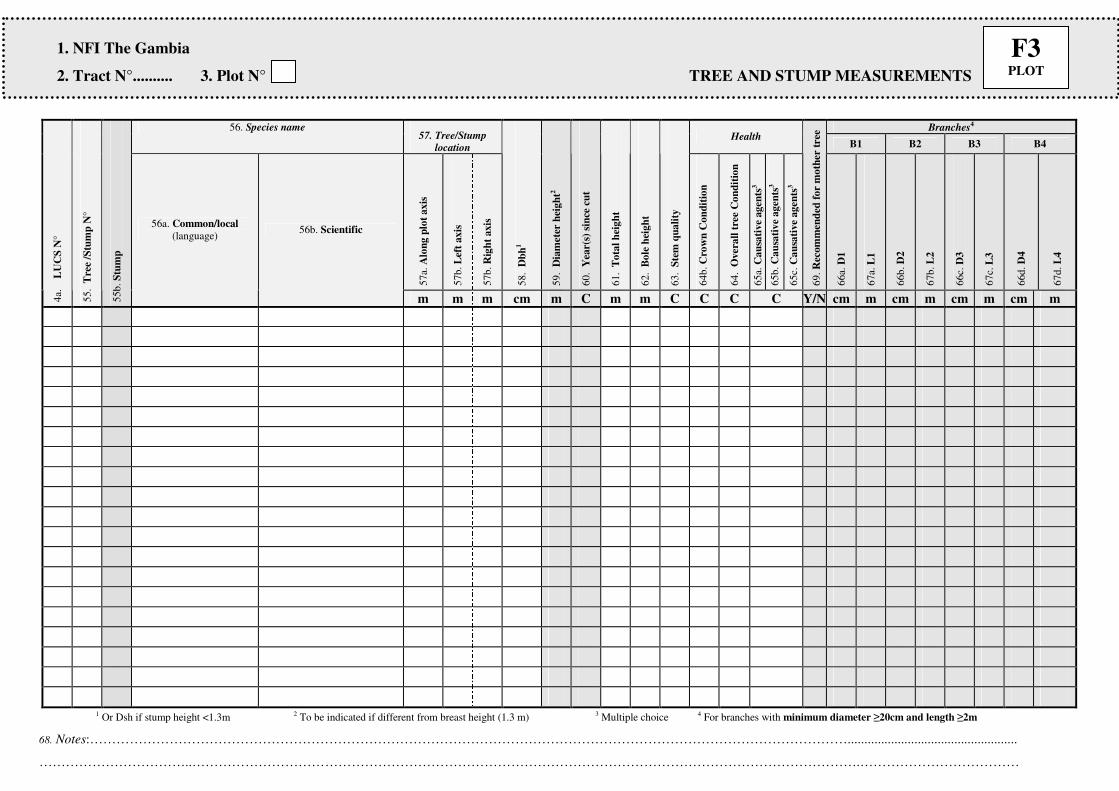
1. NFI The Gambia
2. Tract N°.......... 3. Plot N° TREE AND STUMP MEASUREMENTS
Branches4 56. Species name 57. Tree/Stump
location Health
B1 B2 B3 B4
57a.
Alo
ng
plo
t ax
is
57b
. L
eft
ax
is
57b
. R
igh
t axis
58.
Db
h1
59.
Dia
met
er h
eig
ht2
60.
Yea
r(s)
sin
ce c
ut
61.
To
tal
hei
gh
t
62.
Bo
le h
eig
ht
63.
Ste
m q
ua
lity
64b
. C
row
n C
on
dit
ion
64.
Over
all
tre
e C
on
dit
ion
65a.
Ca
usa
tive
ag
ents
3
65b
. C
au
sati
ve
ag
ents
3
65c.
Ca
usa
tive
ag
ents
3
69.
Rec
om
men
ded
fo
r m
oth
er t
ree
66a.
D1
67a.
L1
66b
. D
2
67b
. L
2
66c.
D3
67c.
L3
66d
. D
4
67d
. L
4
4a.
L
UC
S N
°
55.
Tre
e /S
tum
p N
°
55b
. S
tum
p
56a. Common/local
(language) 56b. Scientific
m m m cm m C m m C C C C Y/N cm m cm m cm m cm m
1 Or Dsh if stump height <1.3m 2 To be indicated if different from breast height (1.3 m) 3 Multiple choice 4 For branches with minimum diameter ≥20cm and length ≥2m
68. Notes:………………………………………………………………………………………………………………………………………………………...................................................
……………………………..…………………………………………………………………………………………………………………………………….………………………………
F3 PLOT

1. NFI The Gambia
2. Tract N°.......... 3. Plot N° MEASUREMENT POINTS / LUC Area in Subplots /LSP
A. MEASUREMENT POINTS - TOPOGRAPHY AND SOIL (IN ALL LUS)
B. LAND USE/COVER AREA IN SUBPLOTS
Subplot N°1 Subplot N°2 Subplot N°3
C. LITTER SUBPLOT (LSP) – LITTER MEASUREMENTS
LSP No1
801
. L
itte
r d
epth
802
. L
itte
r
com
po
siti
on
4
g. L
UC
S N
o
cm C
LSP No3
801
. L
itte
r d
epth
802
. L
itte
r
com
po
siti
on
4
g. L
UC
S N
o
cm C
LSP No2
801
. L
itte
r d
epth
802
. L
itte
r
com
po
siti
on
4
g. L
UC
S N
o
cm C
54c.
SP
Are
a
54d
. S
P A
rea
54e.
SP
Are
a
Subplot
4
c. L
UC
S N
o
% 4d
. L
UC
S N
o
% 4
e. L
UC
S N
o
%
Rectangular
Circular
54c.
SP
Are
a
54d
. S
P A
rea
54e.
SP
Are
a
Subplot
4
c. L
UC
S N
o
% 4d
. L
UC
S N
o
% 4
e. L
UC
S N
o
%
Rectangular
Circular
54c.
SP
Are
a
54d
. S
P A
rea
54e.
SP
Are
a
Subplot
4
c. L
UC
S N
o
% 4d
. L
UC
S N
o
% 4
e. L
UC
S N
o
%
Rectangular
Circular
RECTANGULAR SUB-PLOT 1
MP N°1
4b. LUCS N°
Site: 71. Slope %
70. Slope orientation °
72. Relief C
72b. ID Photo
72c. Photo bearing °
Soil : 73c. Soil type......................................
73d. Soil surface condition C
75. Topsoil depth C
73. Topsoil texture C
73e. Subsoil texture C
73h. Soil colour C
74. Soil drainage C
RECTANGULAR SUB-PLOT 2
MP N°2
4b. LUCS N°
Site: 71. Slope %
70. Slope orientation °
72. Relief C
72b. ID Photo
72c. Photo bearing °
Soil : 73c. Soil type......................................
73d. Soil surface condition C
75. Topsoil depth C
73. Topsoil texture C
73e. Subsoil texture C
73h. Soil colour C
74. Soil drainage C
RECTANGULAR SUB-PLOT 3
MP N°3
4b. LUCS N°
Site: 71. Slope %
70. Slope orientation °
72. Relief C
72b. ID Photo
72c. Photo bearing °
Soil : 73c. Soil type......................................
73d. Soil surface condition C
75. Topsoil depth C
73. Topsoil texture C
73e. Subsoil texture C
73h. Soil colour C
74. Soil drainage C
79b. Notes:
..........................................................................................................................................................................................................................
..........................................................................................................................................................................................................................
..........................................................................................................................................................................................................................
F4 a SUBPLOT
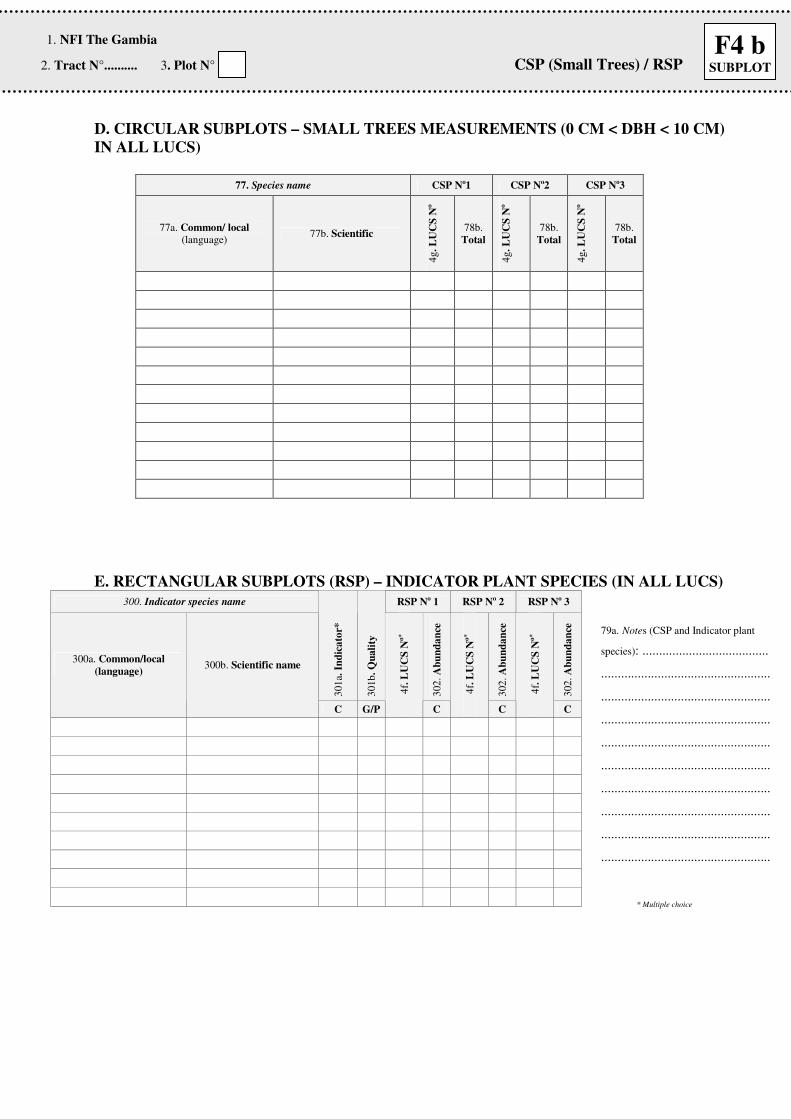
1. NFI The Gambia
2. Tract N°.......... 3. Plot N° CSP (Small Trees) / RSP
D. CIRCULAR SUBPLOTS – SMALL TREES MEASUREMENTS (0 CM < DBH < 10 CM)
IN ALL LUCS)
77. Species name CSP No1 CSP No2 CSP No3
77a. Common/ local
(language) 77b. Scientific
4g. L
UC
S N
o
78b.
Total
4g. L
UC
S N
o
78b.
Total
4g. L
UC
S N
o
78b.
Total
E. RECTANGULAR SUBPLOTS (RSP) – INDICATOR PLANT SPECIES (IN ALL LUCS)
* Multiple choice
300. Indicator species name RSP No 1 RSP No 2 RSP No 3
301
a. I
nd
ica
tor*
301b
. Q
uali
ty
302
. A
bu
nd
an
ce
302
. A
bu
nd
an
ce
302
. A
bu
nd
an
ce
300a. Common/local
(language) 300b. Scientific name
C G/P 4
f. L
UC
S N
o*
C 4
f. L
UC
S N
o*
C 4
f. L
UC
S N
o*
C
79a. Notes (CSP and Indicator plant
species): ......................................
...................................................
...................................................
...................................................
...................................................
...................................................
...................................................
...................................................
...................................................
...................................................
F4 b SUBPLOT

79c. Notes (shrubs/bushes): ............................
.................................................................
.................................................................
.................................................................
.................................................................
.................................................................
.................................................................
.................................................................
.................................................................
.................................................................
.................................................................
.................................................................
.................................................................
.................................................................
.................................................................
.................................................................
.................................................................
.................................................................
.................................................................
.................................................................
.................................................................
.................................................................
.................................................................
.................................................................
.................................................................
.................................................................
.................................................................
.................................................................
.................................................................
.................................................................
.................................................................
.................................................................
.................................................................
.................................................................
.................................................................
.................................................................
.................................................................
.................................................................
.................................................................
1. NFI The Gambia
2. Tract N°.......... 3. Plot N° RECTANGULAR SUBPLOTS (Shrub/Bushes)
F. RECTANGULAR SUBPLOTS (RSP) –SHRUBS/BUSHES
MEASUREMENTS (ALL LUCS)
1 If different from 0.5m
56. Species name
58.
Av
erag
e st
em D
0.5h
59.
Dia
met
er m
easu
rem
ent
hei
gh
t1
61.
Av
erag
e h
eig
ht
6
R
SP
N°
4h
. L
UC
S N
°
56a. Common / local
(language) 56b. Scientific
5
8b
. N
o. o
f st
ems/
un
it
cm m m
F4 c SUBPLOT
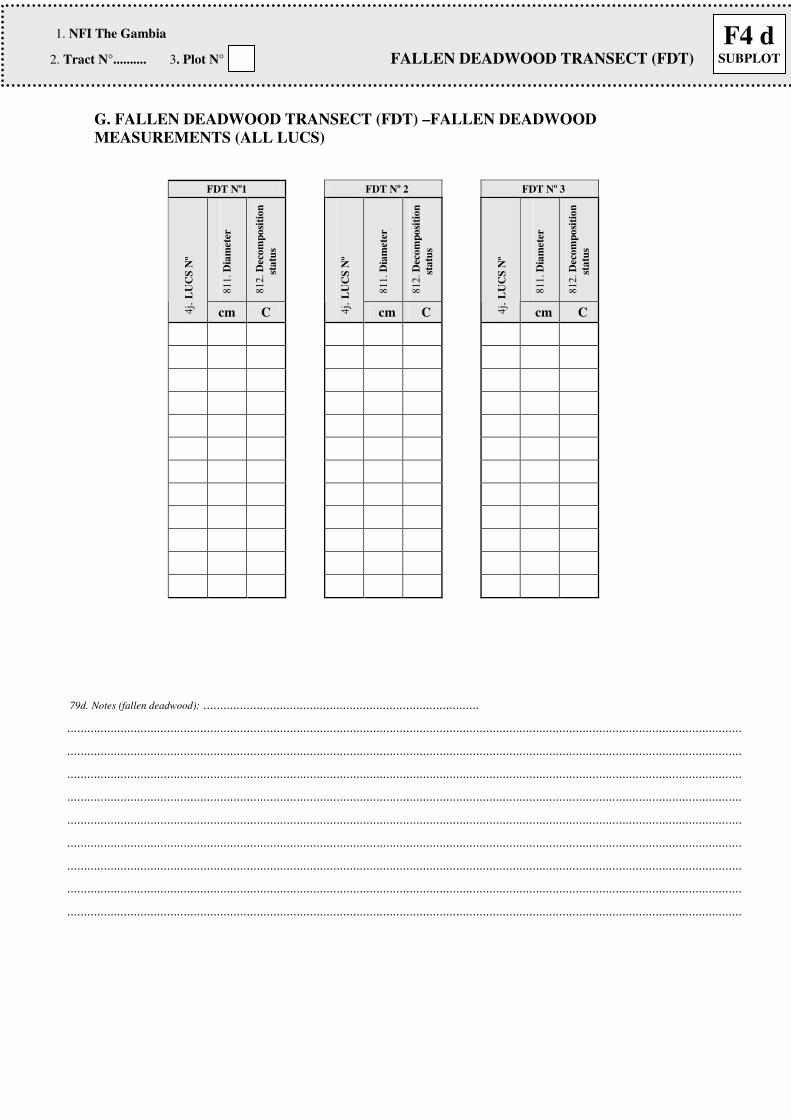
79d. Notes (fallen deadwood): ...................................................................................
...........................................................................................................................................................................................................
...........................................................................................................................................................................................................
...........................................................................................................................................................................................................
...........................................................................................................................................................................................................
...........................................................................................................................................................................................................
...........................................................................................................................................................................................................
...........................................................................................................................................................................................................
...........................................................................................................................................................................................................
...........................................................................................................................................................................................................
1. NFI The Gambia
2. Tract N°.......... 3. Plot N° FALLEN DEADWOOD TRANSECT (FDT)
G. FALLEN DEADWOOD TRANSECT (FDT) –FALLEN DEADWOOD
MEASUREMENTS (ALL LUCS)
FDT No1 FDT No 2 FDT No 3
811
. D
iam
eter
812
. D
eco
mp
osi
tio
n
sta
tus
811
. D
iam
eter
812
. D
eco
mp
osi
tio
n
sta
tus
811
. D
iam
eter
812
. D
eco
mp
osi
tio
n
sta
tus
4j. L
UC
S N
º
cm C 4j. L
UC
S N
º
cm C 4j. L
UC
S N
º
cm C
F4 d SUBPLOT
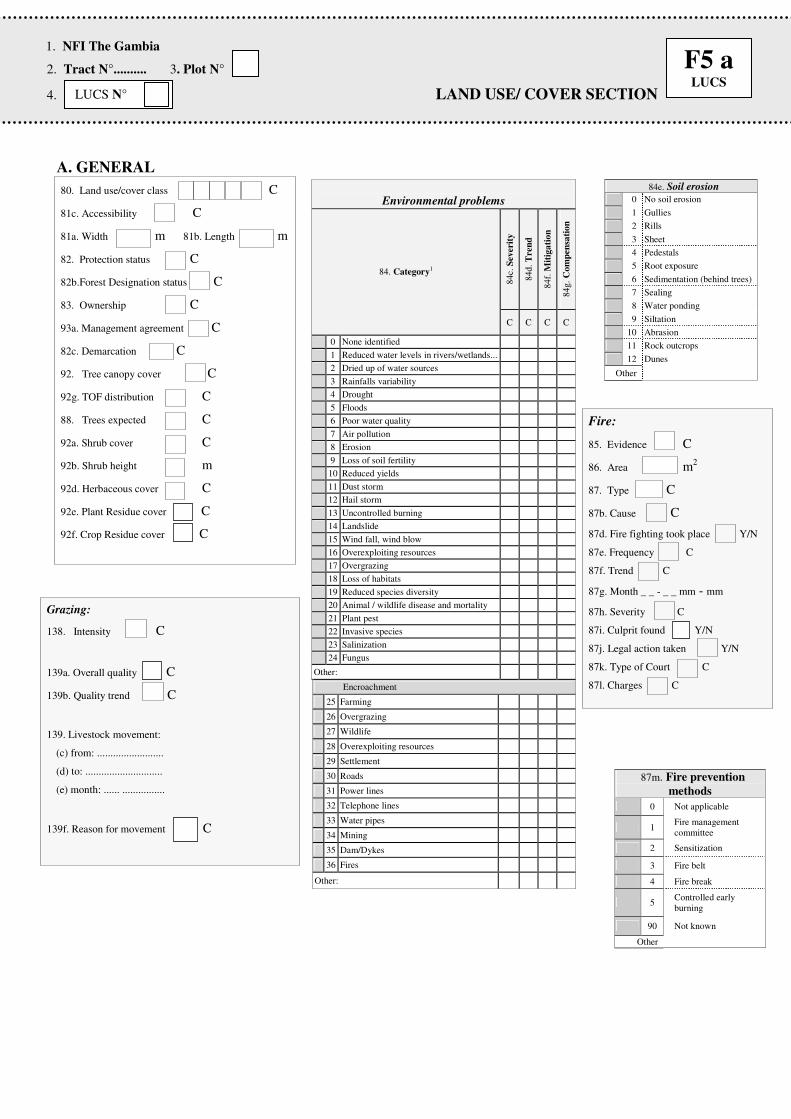
-
80. Land use/cover class C
81c. Accessibility C
81a. Width m 81b. Length m
82. Protection status C
82b.Forest Designation status C
83. Ownership C
93a. Management agreement C
82c. Demarcation C
92. Tree canopy cover C
92g. TOF distribution C
88. Trees expected C
92a. Shrub cover C
92b. Shrub height m
92d. Herbaceous cover C
92e. Plant Residue cover C
92f. Crop Residue cover C
1. NFI The Gambia
2. Tract N°.......... 3. Plot N°
4. LAND USE/ COVER SECTION
A. GENERAL
87m. Fire prevention
methods
0 Not applicable
1 Fire management
committee
2 Sensitization
3 Fire belt
4 Fire break
5 Controlled early
burning
90 Not known
Other
Grazing:
138. Intensity C
139a. Overall quality C
139b. Quality trend C
139. Livestock movement:
(c) from: .........................
(d) to: .............................
(e) month: ...... ................
139f. Reason for movement C
Fire:
85. Evidence C
86. Area m2
87. Type C
87b. Cause C
87d. Fire fighting took place Y/N
87e. Frequency C
87f. Trend C
87g. Month _ _ - _ _ mm - mm
87h. Severity C
87i. Culprit found Y/N
87j. Legal action taken Y/N
87k. Type of Court C
87l. Charges C
LUCS N°
F5 a LUCS
Environmental problems
84c.
Sev
erit
y
84d.
Tre
nd
84f.
Mit
iga
tion
84g.
Com
pen
sati
on
84. Category1
C C C C
0 None identified
1 Reduced water levels in rivers/wetlands...
2 Dried up of water sources
3 Rainfalls variability
4 Drought
5 Floods
6 Poor water quality
7 Air pollution
8 Erosion
9 Loss of soil fertility
10 Reduced yields
11 Dust storm
12 Hail storm
13 Uncontrolled burning
14 Landslide
15 Wind fall, wind blow
16 Overexploiting resources
17 Overgrazing
18 Loss of habitats
19 Reduced species diversity
20 Animal / wildlife disease and mortality
21 Plant pest
22 Invasive species
23 Salinization
24 Fungus
Other:
Encroachment
25 Farming
26 Overgrazing
27 Wildlife
28 Overexploiting resources
29 Settlement
30 Roads
31 Power lines
32 Telephone lines
33 Water pipes
34 Mining
35 Dam/Dykes
36 Fires
Other:
84e. Soil erosion
0 No soil erosion
1 Gullies
2 Rills
3 Sheet
4 Pedestals
5 Root exposure
6 Sedimentation (behind trees)
7 Sealing
8 Water ponding
9 Siltation
10 Abrasion
11 Rock outcrops
12 Dunes
Other
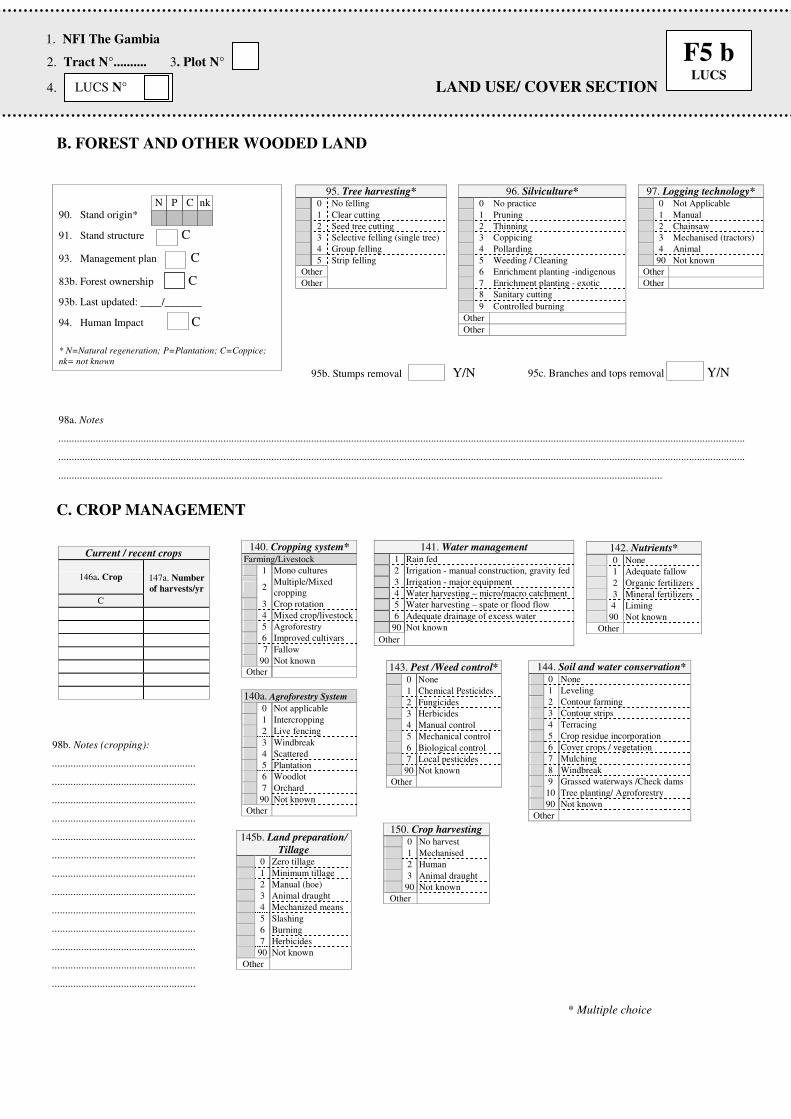
-
B. FOREST AND OTHER WOODED LAND
C. CROP MANAGEMENT
95. Tree harvesting* 96. Silviculture* 97. Logging technology* 0 No felling 0 No practice 0 Not Applicable
1 Clear cutting 1 Pruning 1 Manual
2 Seed tree cutting 2 Thinning 2 Chainsaw
3 Selective felling (single tree) 3 Coppicing 3 Mechanised (tractors)
4 Group felling 4 Pollarding 4 Animal
5 Strip felling 5 Weeding / Cleaning 90 Not known
Other
6 Enrichment planting -indigenous
Other
Other 7 Enrichment planting - exotic Other
8 Sanitary cutting
9 Controlled burning
Other
Other
140. Cropping system* Farming/Livestock
1 Mono cultures
2 Multiple/Mixed
cropping
3 Crop rotation
4 Mixed crop/livestock
5 Agroforestry
6 Improved cultivars
7 Fallow
90 Not known
Other
140a. Agroforestry System
0 Not applicable
1 Intercropping
2 Live fencing
3 Windbreak
4 Scattered
5 Plantation
6 Woodlot
7 Orchard
90 Not known
Other
141. Water management 1 Rain fed
2 Irrigation - manual construction, gravity fed
3 Irrigation - major equipment
4 Water harvesting – micro/macro catchment
5 Water harvesting – spate or flood flow
6 Adequate drainage of excess water
90 Not known
Other
143. Pest /Weed control* 0 None
1 Chemical Pesticides
2 Fungicides
3 Herbicides
4 Manual control
5 Mechanical control
6 Biological control
7 Local pesticides
90 Not known
Other
145b. Land preparation/
Tillage 0 Zero tillage
1 Minimum tillage
2 Manual (hoe)
3 Animal draught
4 Mechanized means
5 Slashing
6 Burning
7 Herbicides
90 Not known
Other
90. Stand origin*
91. Stand structure C
93. Management plan C
83b. Forest ownership C
93b. Last updated: ____/_______
94. Human Impact C
* N=Natural regeneration; P=Plantation; C=Coppice;
nk= not known
Current / recent crops
146a. Crop
C
147a. Number
of harvests/yr
144. Soil and water conservation* 0 None
1 Leveling
2 Contour farming
3 Contour strips
4 Terracing
5 Crop residue incorporation
6 Cover crops / vegetation
7 Mulching
8 Windbreak
9 Grassed waterways /Check dams
10 Tree planting/ Agroforestry
90 Not known
Other
142. Nutrients* 0 None
1 Adequate fallow
2 Organic fertilizers
3 Mineral fertilizers
4 Liming
90 Not known
Other
98a. Notes
..................................................................................................................................................................................................................................................................
..................................................................................................................................................................................................................................................................
...................................................................................................................................................................................................................................
98b. Notes (cropping):
......................................................
......................................................
......................................................
......................................................
......................................................
......................................................
......................................................
......................................................
......................................................
......................................................
......................................................
......................................................
......................................................
N P C
nk
150. Crop harvesting 0 No harvest
1 Mechanised
2 Human
3 Animal draught
90 Not known
Other
95c. Branches and tops removal Y/N
95b. Stumps removal Y/N
1. NFI The Gambia
2. Tract N°.......... 3. Plot N°
4. LAND USE/ COVER SECTION
LUCS N°
F5 b LUCS
* Multiple choice
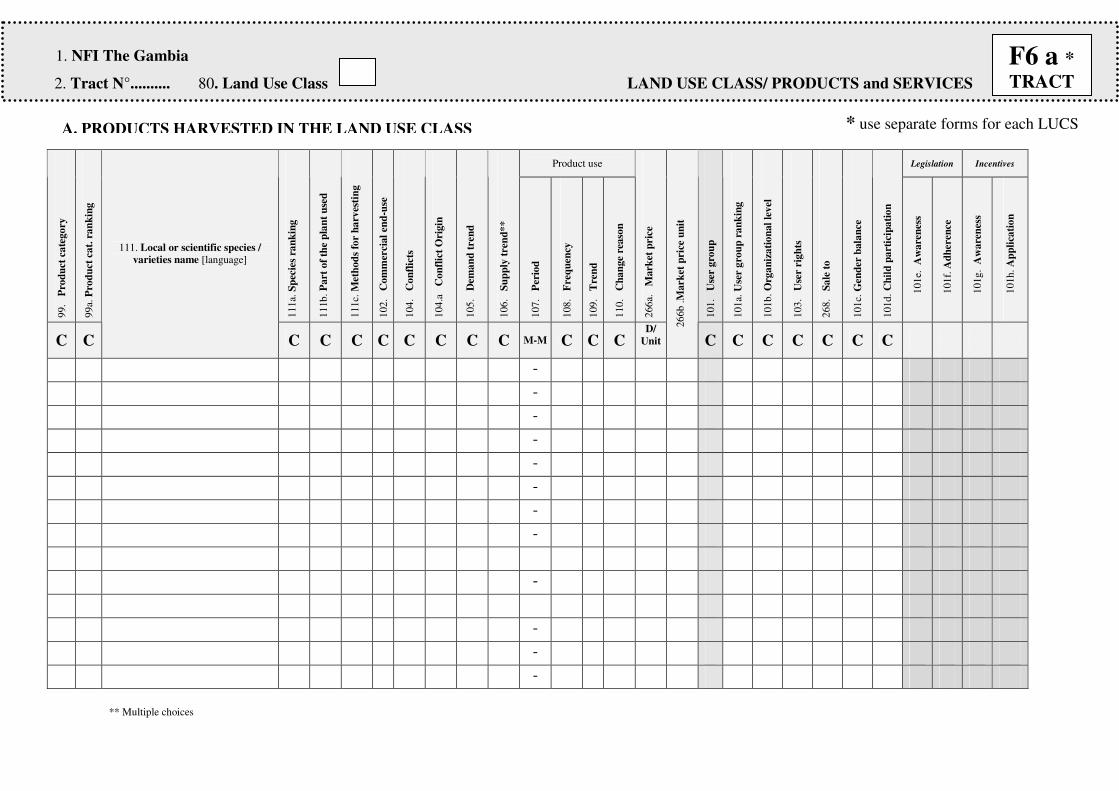
1. NFI The Gambia
2. Tract N°.......... 80. Land Use Class LAND USE CLASS/ PRODUCTS and SERVICES
Product use Legislation Incentives
99.
P
rod
uct
ca
tego
ry
99a.
Pro
du
ct c
at.
ra
nk
ing
111
a. S
pec
ies
ran
kin
g
111b
. P
art
of
the
pla
nt
use
d
111
c. M
eth
od
s fo
r h
arv
esti
ng
102
.
Co
mm
erci
al
end
-use
104
.
Co
nfl
icts
104
.a C
on
flic
t O
rigin
105
.
Dem
an
d t
ren
d
106
.
Su
pp
ly t
ren
d*
*
107
. P
erio
d
108
. F
req
uen
cy
109
. T
ren
d
110
.
Ch
an
ge
rea
son
266
a. M
ark
et p
rice
101
.
Use
r g
rou
p
101
a. U
ser
gro
up
ra
nk
ing
101b
. O
rga
niz
ati
on
al
lev
el
103
.
Use
r ri
gh
ts
268
.
Sa
le t
o
101
c. G
end
er b
ala
nce
101d
. C
hil
d p
art
icip
ati
on
1
01
e.
Aw
are
nes
s
1
01
f. A
dh
eren
ce
1
01g
. A
wa
ren
ess
1
01h
. A
pp
lica
tio
n
C C
111. Local or scientific species /
varieties name [language]
C C C C C C C C M-M C C C D/
Unit
26
6b
.M
ark
et p
rice
un
it
C C C C C C C
-
-
-
-
-
-
-
-
-
-
-
-
F6 a * TRACT
* use separate forms for each LUCS A. PRODUCTS HARVESTED IN THE LAND USE CLASS
** Multiple choices

1. NFI The Gambia
2. Tract N°.......... 80. Land Use Class LAND USE CLASS/ PRODUCTS and SERVICES
Legislation Incentives
148b
. S
erv
ice
ra
nk
ing
148. Service category1
C2
10
1e.
A
wa
ren
ess
1
01
f. A
dh
eren
ce
1
01
g.
Aw
are
nes
s
1
01
h.
Ap
pli
cati
on
0 None identified
1 Soil Protection
2 Soil Fertility
3 Water Conservation
4 Water Purification
5 Climate regulation
6 Disease control
7 Windbreak
8 Shade
9 Religious / Spiritual
10 Cultural Heritage
11 Recreation / Tourism
12 Aesthetic
13 Education / Scientific studies
14 Employment
Other:
160. Insect pests, diseases and invasive
species
160
a. C
ate
gory
160
c.E
ffec
ts
160d
. S
ever
ity
C
160b. Local or scientific name (varieties)
C3 C
161. Threatened and extinct species
161a.
Cate
gory
161c.
Sta
tus
C
161b. Local or scientific name (varieties)
E/T
162. Wildlife Abundance
112a.
Evid
ence
113b.
Ab
un
dan
ce
112b.
Tre
nd
112. Local or scientific name
C C C
E. LAND USE/COVER CHANGE
80b. Conversion C
80c. To land use C
F6 b * TRACT
* use separate forms for each LUCS
F. AREA DEVELOPMENT AND PLANNING
113a. Is there a Forest Management Committee ? (Y/N) ____
113c. Has a Market analysis ever been carried out in your area? (Y/N) ____
113d. Has a development project ever been carried out in your area? (Y/N) ____
C. BIODIVERSITY INDICATORS B. SERVICES PROVIDED BY FORESTS AND TREES
3: only for insect pest and diseases
255. Feed Y/N
256. Beehive Y/N
257. Extraction technique:
1. Traditional
2. Modern
258. Processing Y/N
D. BEEKEEPING
1. Multiple choice 2. C= L, M, H
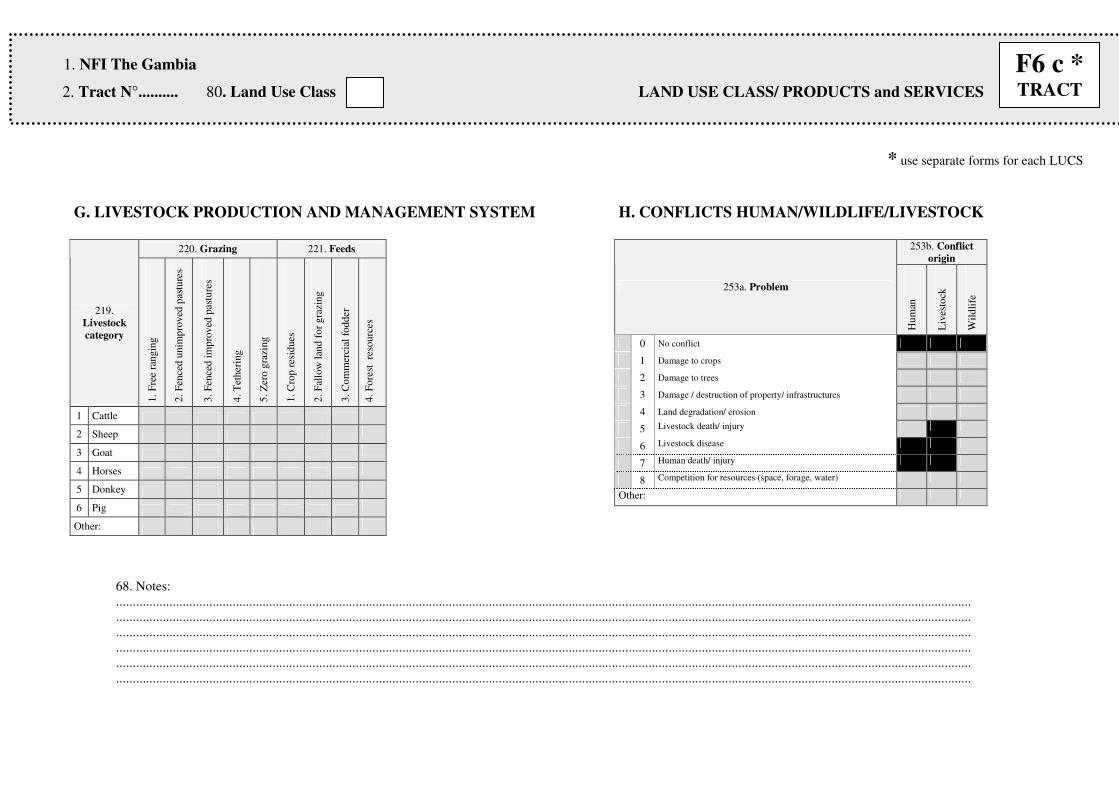
68. Notes:
.................................................................................................................................................................................................................................................................
.................................................................................................................................................................................................................................................................
.................................................................................................................................................................................................................................................................
.................................................................................................................................................................................................................................................................
.................................................................................................................................................................................................................................................................
.................................................................................................................................................................................................................................................................
H. CONFLICTS HUMAN/WILDLIFE/LIVESTOCK
253b. Conflict
origin
253a. Problem
Hu
man
Liv
esto
ck
Wil
dli
fe
0 No conflict
1 Damage to crops
2 Damage to trees
3 Damage / destruction of property/ infrastructures
4 Land degradation/ erosion
5 Livestock death/ injury
6 Livestock disease
7 Human death/ injury
8 Competition for resources (space, forage, water)
Other:
G. LIVESTOCK PRODUCTION AND MANAGEMENT SYSTEM
220. Grazing 221. Feeds
219.
Livestock
category
1.
Fre
e ra
ng
ing
2.
Fen
ced
unim
pro
ved
pas
ture
s
3.
Fen
ced
im
pro
ved
pas
ture
s
4. T
ether
ing
5. Z
ero g
razi
ng
1. C
rop
res
idues
2.
Fal
low
lan
d f
or
gra
zing
3. C
om
mer
cial
fo
dd
er
4.
Fo
rest
re
sou
rces
1 Cattle
2 Sheep
3 Goat
4 Horses
5 Donkey
6 Pig
Other:
1. NFI The Gambia
2. Tract N°.......... 80. Land Use Class LAND USE CLASS/ PRODUCTS and SERVICES
F6 c * TRACT
* use separate forms for each LUCS

1. NFI The Gambia
2. Tract N°.......... 201. Household N°
200. Enumerator(s)…………………….............. 206a. Date : _ _ /_ _ /_ _ 206b. Start time: _ _ : _ _ h 206c. End time: _ _ : _ _ h
A. GENERAL INFORMATION ON THE HOUSEHOLD
202. Village……………………........................... 203a. UTM E _ _ _ _ _ _ _ m 203b. UTM N _ _ _ _ _ _ _ m 203. Distance to tract __, __Km
212. Type: Sedentary Transhumant/ Nomadic Refugee Other ____________________________________
A2. HOUSEHOLD MAIN ACTIVITIES
A1. HOUSEHOLD COMPOSITION Household composition
205
. R
ela
tio
nsh
ip t
o H
ead
15c. S
ex
15g
. A
ge
15h
. E
du
cati
on
15
m. F
ore
st m
an
agem
en
t
Co
mm
itte
e m
emb
er
15. Respondent
(optional)
C M/F C C
15 i. Total number of people in household ______
15 j. Number of Females ______
15 k. Number of Males ______
Main activity
210
. C
hec
k i
f
ap
pli
ca
ble
*
Activities
210b
. F
or
inco
me
gen
erati
on
210
c F
or
foo
d
secu
rity
0 Not applicable
1 Crop production
2 Livestock/ Herding
3 Forestry
4 Aquaculture
5 Fishing
6 Industry
7 Hunting
8 Gathering
9 Domestic services
10 Trade/ Petty trade
11 Remittances
12 Handicraft
13 Services (public and private)
14 Tourism
15 Mining / Extraction
16 Salt production
17 Horticulture
Others
A3. LIVELIHOOD
211b. Livelihood trend C
211c. Change reason C
A6. FOOD SECURITY 215a. Food shortage frequency C
215b. Food shortage period_ _ - _ _ mm-mm
215c. Alternative food sources C
216a. Food security trend C 216b. Change reason C
A5. ACCESS TO MEDIA AND COMMUNICATION 810a
Local 810b
International 810. Media access *
Y/N Y/N
0 No media access
1 Newspaper
2 Radio
3 Television
4 Telephone
5 Other
F7 a
Household
A4. FUEL / ENERGY Main fuel source for:
214a. Cooking
214b. Lighting
Energy saving:
217c. Stove Y/N
217e. Known Y/N
217f. Demand Y/N
217g. Affordability Y/N
217d. Other enegy saving devices:
* Multiple Choice possible

820. Activity
Invo
lvem
ent
0 No activity 1 Nursery 2 Planting 3 Weeding 4 Fire fighting 5 Patrolling 6 Monitoring 7 Sensitization 8 Harvesting 9 Processing
10 Promotion 11 Selling Other:
Area 273a. Land tenure
270.T
ota
l are
a
271. T
ren
d
272.C
han
ge r
easo
n
Ind
ivid
ual
ow
ner
ship
Oth
ers
pri
vate
ow
ner
ship
Cu
stom
ary
Ren
t
Sq
uatt
er
Oth
er :
......
........
.......
Category
Ha C C 1 2 3 4 5 99
Total Property Area
Crop land
Fallow land
Forest
Pond (m2)
Other
Main services
210a
. P
rod
uct
s/S
erv
ices
111. Species Name
210
b. F
or
inco
me
gen
erati
on
210
c F
or
foo
d s
ecu
rity
C
A11. PRODUCTS/SERVICES USED FROM THE FOREST
A7. ACTIVITIES FOR FOREST
MANAGEMENT
1. NFI The Gambia
2. Tract N°.......... 201. Household N°
F7 b Household
A10. LAND AREA AND LAND TENURE A9. ACCESS TO SERVICES
228
. U
se f
req
uen
cy
229
. S
erv
ice
nee
d
230
. A
cces
sib
ilit
y
231
. D
ista
nce
to
ser
vic
e
218. Service category
C Y/N C Km
1 Credit services 2 Saving services 3 Extension services 4 Local market 5 Lumo market 6 Seed provision 7 Education (primary) 8 Education (secondary)
Other:
A8. ACCESS TO WATER RESOURCES
DRY season WET season Uses Uses
233
a. D
ista
nce
284
a. T
ime
233b
. D
ista
nce
284b
. T
ime 217. Water source
type
2
32
a. A
cces
s
Km min 2
81a.
Liv
esto
ck
2
82a.
Cro
ps
2
83a.
Hu
ma
n
2
80
a. C
on
flic
t
2
32
b A
cces
s
Km min 2
81b
. L
ives
tock
2
82b
. C
rop
s
2
83b
. H
um
an
2
80
b. C
on
flic
t
1 Well 2 Borehole 3 Pond 4 River/ Stream 5 Lake 6 Springs 7 Rock catchment 8 Dam 9 Piped water
Other:
273b. Land tenure security trend C
273c. Change reason C
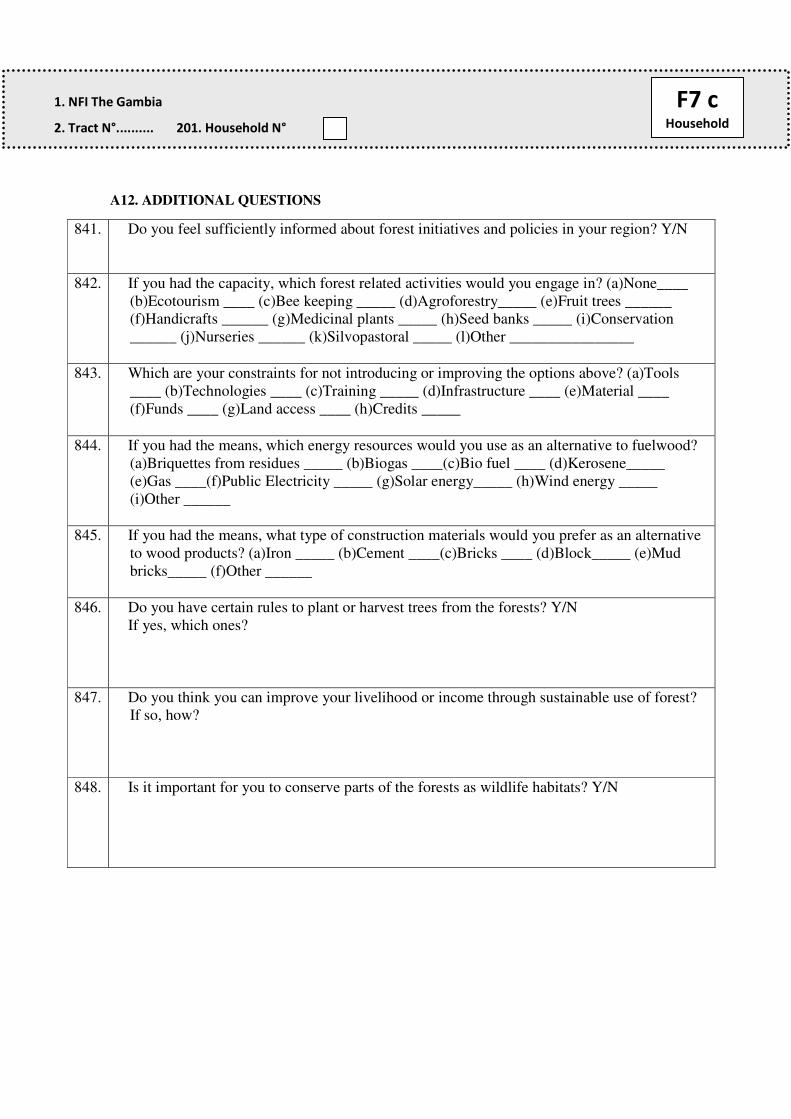
1. NFI The Gambia
2. Tract N°.......... 201. Household N°
A12. ADDITIONAL QUESTIONS
841. Do you feel sufficiently informed about forest initiatives and policies in your region? Y/N
842. If you had the capacity, which forest related activities would you engage in? (a)None____
(b)Ecotourism ____ (c)Bee keeping _____ (d)Agroforestry_____ (e)Fruit trees ______
(f)Handicrafts ______ (g)Medicinal plants _____ (h)Seed banks _____ (i)Conservation
______ (j)Nurseries ______ (k)Silvopastoral _____ (l)Other ________________
843. Which are your constraints for not introducing or improving the options above? (a)Tools
____ (b)Technologies ____ (c)Training _____ (d)Infrastructure ____ (e)Material ____
(f)Funds ____ (g)Land access ____ (h)Credits _____
844. If you had the means, which energy resources would you use as an alternative to fuelwood?
(a)Briquettes from residues _____ (b)Biogas ____(c)Bio fuel ____ (d)Kerosene_____
(e)Gas ____(f)Public Electricity _____ (g)Solar energy_____ (h)Wind energy _____
(i)Other ______
845. If you had the means, what type of construction materials would you prefer as an alternative
to wood products? (a)Iron _____ (b)Cement ____(c)Bricks ____ (d)Block_____ (e)Mud
bricks_____ (f)Other ______
846. Do you have certain rules to plant or harvest trees from the forests? Y/N
If yes, which ones?
847. Do you think you can improve your livelihood or income through sustainable use of forest?
If so, how?
848. Is it important for you to conserve parts of the forests as wildlife habitats? Y/N
F7 c Household
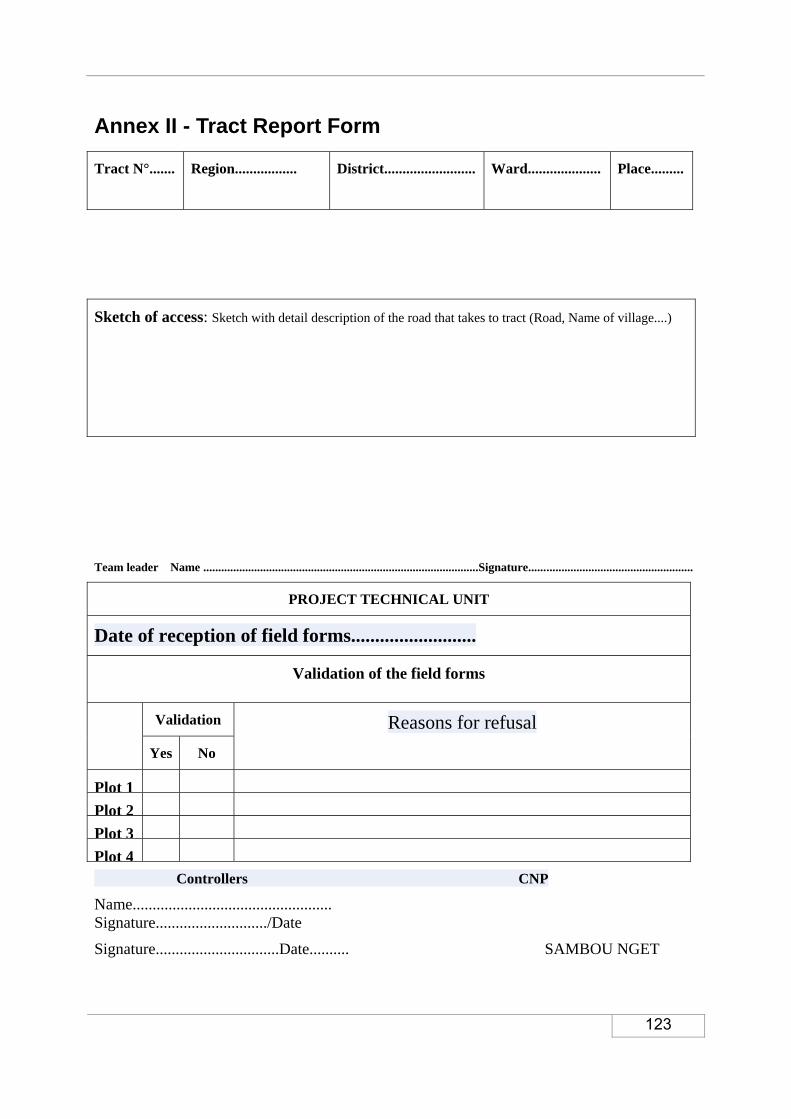
123
Annex II - Tract Report Form
Team leader Name ............................................................................................Signature.......................................................
PROJECT TECHNICAL UNIT
Date of reception of field forms..........................
Validation of the field forms
Validation Reasons for refusal
Yes No
Plot 1
Plot 2
Plot 3
Plot 4 Controllers CNP
Name.................................................. Signature............................/Date
Signature...............................Date.......... SAMBOU NGET
Tract N°.......
Region................. District......................... Ward.................... Place.........
Sketch of access: Sketch with detail description of the road that takes to tract (Road, Name of village....)
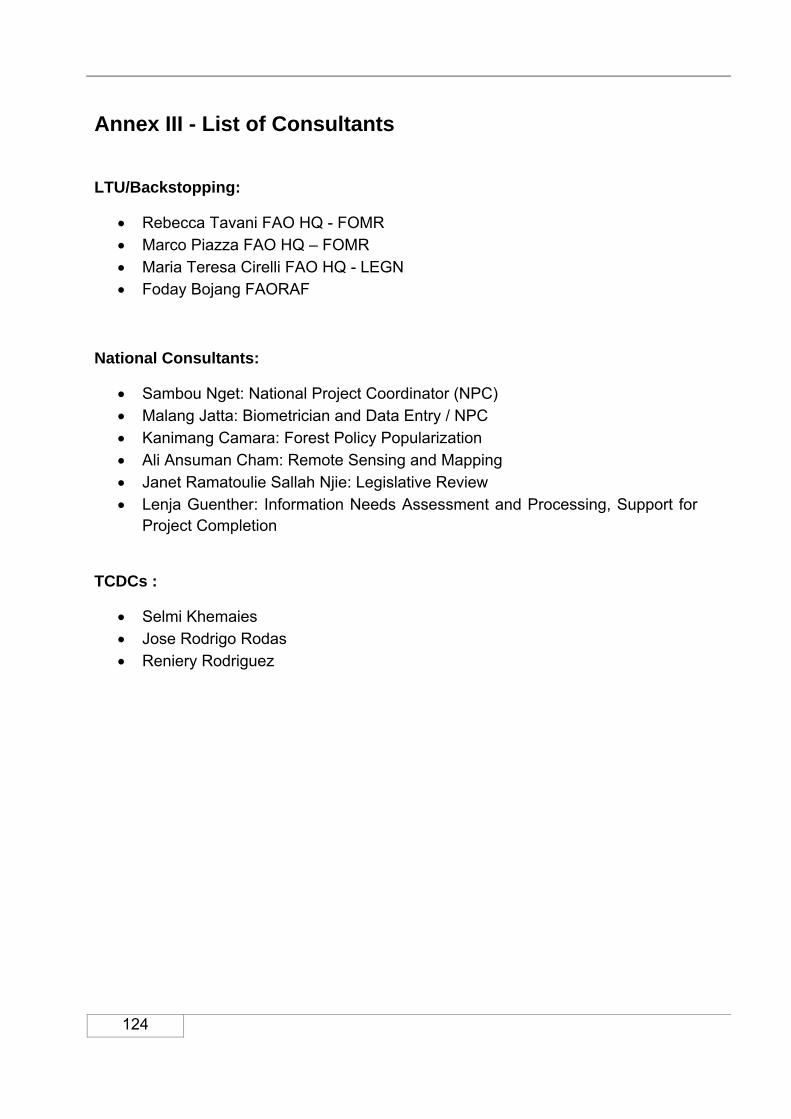
124
Annex III - List of Consultants
LTU/Backstopping:
Rebecca Tavani FAO HQ - FOMR Marco Piazza FAO HQ – FOMR Maria Teresa Cirelli FAO HQ - LEGN Foday Bojang FAORAF
National Consultants:
Sambou Nget: National Project Coordinator (NPC) Malang Jatta: Biometrician and Data Entry / NPC Kanimang Camara: Forest Policy Popularization Ali Ansuman Cham: Remote Sensing and Mapping Janet Ramatoulie Sallah Njie: Legislative Review
Lenja Guenther: Information Needs Assessment and Processing, Support for Project Completion
TCDCs :
Selmi Khemaies Jose Rodrigo Rodas Reniery Rodriguez
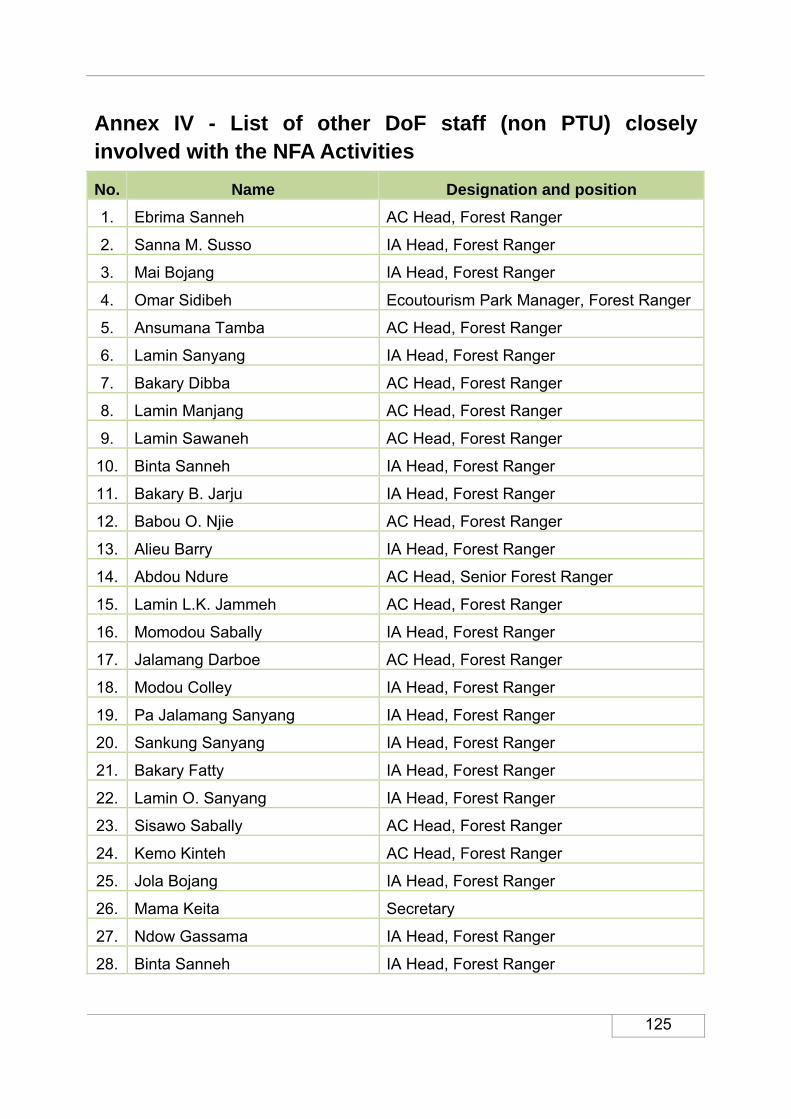
125
Annex IV - List of other DoF staff (non PTU) closely involved with the NFA Activities
No. Name Designation and position
1. Ebrima Sanneh AC Head, Forest Ranger
2. Sanna M. Susso IA Head, Forest Ranger
3. Mai Bojang IA Head, Forest Ranger
4. Omar Sidibeh Ecoutourism Park Manager, Forest Ranger
5. Ansumana Tamba AC Head, Forest Ranger
6. Lamin Sanyang IA Head, Forest Ranger
7. Bakary Dibba AC Head, Forest Ranger
8. Lamin Manjang AC Head, Forest Ranger
9. Lamin Sawaneh AC Head, Forest Ranger
10. Binta Sanneh IA Head, Forest Ranger
11. Bakary B. Jarju IA Head, Forest Ranger
12. Babou O. Njie AC Head, Forest Ranger
13. Alieu Barry IA Head, Forest Ranger
14. Abdou Ndure AC Head, Senior Forest Ranger
15. Lamin L.K. Jammeh AC Head, Forest Ranger
16. Momodou Sabally IA Head, Forest Ranger
17. Jalamang Darboe AC Head, Forest Ranger
18. Modou Colley IA Head, Forest Ranger
19. Pa Jalamang Sanyang IA Head, Forest Ranger
20. Sankung Sanyang IA Head, Forest Ranger
21. Bakary Fatty IA Head, Forest Ranger
22. Lamin O. Sanyang IA Head, Forest Ranger
23. Sisawo Sabally AC Head, Forest Ranger
24. Kemo Kinteh AC Head, Forest Ranger
25. Jola Bojang IA Head, Forest Ranger
26. Mama Keita Secretary
27. Ndow Gassama IA Head, Forest Ranger
28. Binta Sanneh IA Head, Forest Ranger
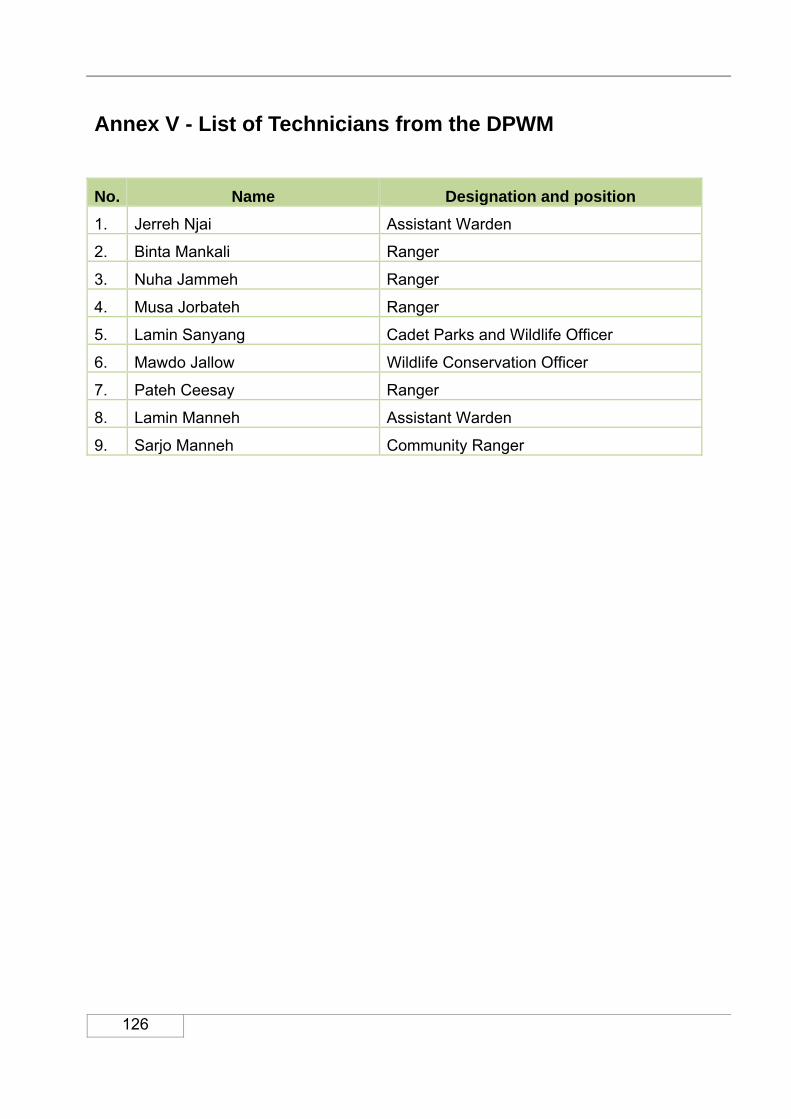
126
Annex V - List of Technicians from the DPWM
No. Name Designation and position
1. Jerreh Njai Assistant Warden
2. Binta Mankali Ranger
3. Nuha Jammeh Ranger
4. Musa Jorbateh Ranger
5. Lamin Sanyang Cadet Parks and Wildlife Officer
6. Mawdo Jallow Wildlife Conservation Officer
7. Pateh Ceesay Ranger
8. Lamin Manneh Assistant Warden
9. Sarjo Manneh Community Ranger
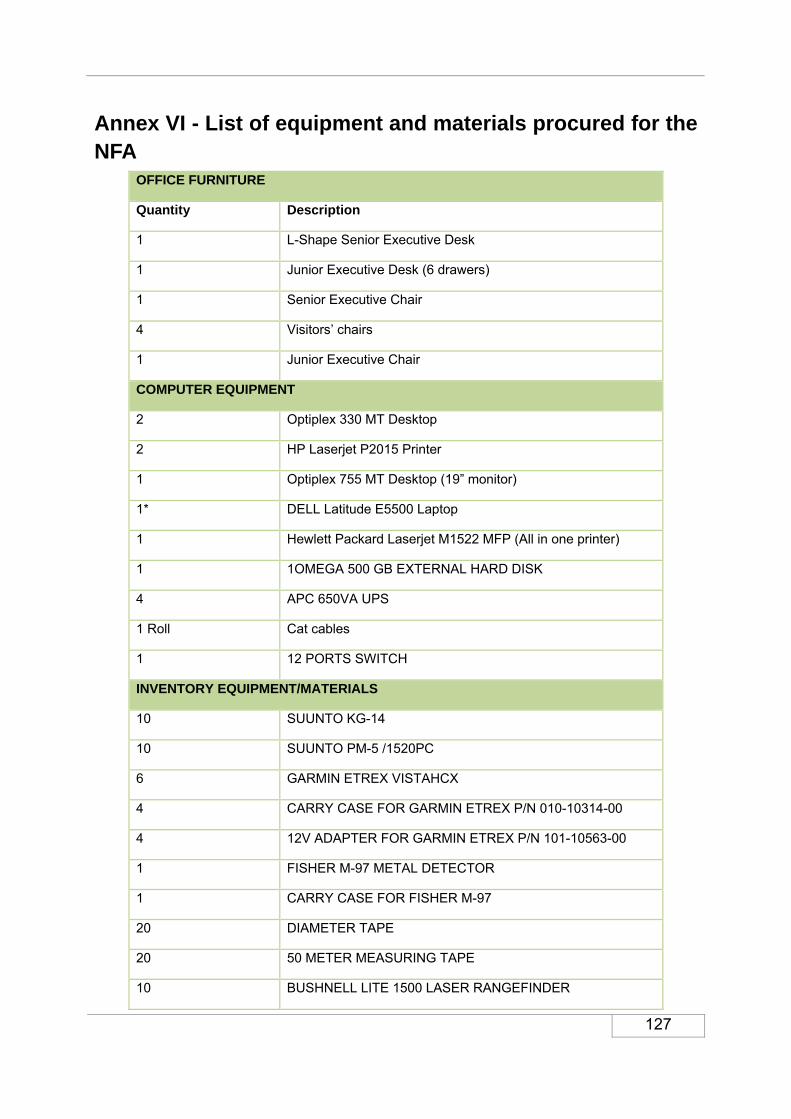
127
Annex VI - List of equipment and materials procured for the NFA
OFFICE FURNITURE
Quantity Description
1 L-Shape Senior Executive Desk
1 Junior Executive Desk (6 drawers)
1 Senior Executive Chair
4 Visitors’ chairs
1 Junior Executive Chair
COMPUTER EQUIPMENT
2 Optiplex 330 MT Desktop
2 HP Laserjet P2015 Printer
1 Optiplex 755 MT Desktop (19” monitor)
1* DELL Latitude E5500 Laptop
1 Hewlett Packard Laserjet M1522 MFP (All in one printer)
1 1OMEGA 500 GB EXTERNAL HARD DISK
4 APC 650VA UPS
1 Roll Cat cables
1 12 PORTS SWITCH
INVENTORY EQUIPMENT/MATERIALS
10 SUUNTO KG-14
10 SUUNTO PM-5 /1520PC
6 GARMIN ETREX VISTAHCX
4 CARRY CASE FOR GARMIN ETREX P/N 010-10314-00
4 12V ADAPTER FOR GARMIN ETREX P/N 101-10563-00
1 FISHER M-97 METAL DETECTOR
1 CARRY CASE FOR FISHER M-97
20 DIAMETER TAPE
20 50 METER MEASURING TAPE
10 BUSHNELL LITE 1500 LASER RANGEFINDER

128
10 PENTAX OPTIO W60
66 BIODEGRADABLE FLAGGING TAPE
10 BACKPCK
10 FIRST AID KIT
10 ENERGIZER BATTERY CHARGER CHCARCP-4
40 RAIN COATS
45 FIELDBOOTS
600 GALVANIZED STEEL BARS (20CM LENGTH)
25 CLIP BOARDS
20 MACHETES
40 H/DUTY GLOVES CLOTH TYPE
25 KNIVES
8 HAMMERS
40 FOAM MATTRESSES (6”)
10 MOBILE PHONES
8 BRTHBL WDRS STOCKINGFOOT Stock #145149 XL
18 Vest FIELDPRO W/REFL TAPE LRG Stock # 105155L
8 Vest PDOF GEN PRPS OVERSIZED OR Stock # 253049
1 PROP IDEN LBL TMPR RES PROPERT S100 Stock # 42353B-1
OFFICE MATERIALS
10 LEVER ARCHFILES
2 GIANT STAPLERS
2 STAPLING MACHINES (SMALL SIZE)
2 PERFORATORS
4 PIN REMOVER
COMMUNICATION EQUIPMENT
1 E-vdo TERMINAL

129
Annex VII - Tree / shrub species measured in the inventory
Tree / shrub scientific name
Tree / shrub local / common name
m3/ha % of total
gross volume
stems/ha
Avicennia nitida jumbukungo 4.57 9.74% 0.50
Adansonia digitata sito 3.61 7.70% 0.18
Cordyla pinnata duto 3.29 7.02% 1.65
Combretum glutinosum jambakatango 3.28 7.00% 3.90
Terminalia macroptera wolo 3.15 6.72% 2.38
Khaya senegalensis jalo 2.68 5.71% 0.21
Pterocarpus erinaceus keno 2.54 5.41% 2.05
Elais guineense tengo 2.27 4.84% 1.35
Daniellia oliveri santango 1.81 3.85% 0.25
Mitragyna inermis jungo 1.78 3.79% 2.34
Prosopis africana kembo 1.40 2.99% 1.48
Ficus capensis soto 1.33 2.83% 0.26
Rhizophora mangle mankwo 1.32 2.81% 0.69
Bombax costatum bunkungo 1.26 2.69% 0.98
Lannea acida bembo-fingo 1.18 2.51% 1.20
Parkia biglobosa netto 1.06 2.26% 0.29
Gmelina arborea gmelina 0.84 1.79% 0.07
Sclerocarya birrea kuntang-jawo 0.72 1.53% 0.56
Unknown Mbembo 0.68 1.45% 0.63
Terminalia albida wolo-koyo 0.63 1.35% 0.61
Sterculia setigera kunkusito 0.62 1.32% 0.21
Anogeisus Leicarpus Kereto/ Kereketo 0.52 1.11% 0.37
Combretum nigricans kulung-kalango 0.45 0.97% 0.35
Mangifera indica Sukono Duto/Mango 0.45 0.96% 0.43
UNKNOWN TOTAL Unknown 0.39 0.84% 0.39
Spondias mombin ninkon 0.36 0.77% 0.14
Azadirachta indica yirinding-kunango/neem 0.35 0.74% 0.34
Erythrophleum guineense talimbaro 0.28 0.60% 0.11
Anacardium occidentalis Cashuwo/ Cashew 0.27 0.58% 0.52
Piliostigma thonningii Fara 0.24 0.51% 0.43
Acacia Faidherbia baransango 0.23 0.49% 0.11
Chlorphora regia tumbuyiro 0.21 0.45% 0.04
Unknown Kewungo 0.20 0.44% 0.12
Cola cordifolia taboo 0.18 0.38% 0.03
Acacia macrostachys singoko 0.18 0.38% 0.26
Borassus aethiopum sibo 0.17 0.35% 0.11
Acacia seyal nganing-koyo 0.16 0.34% 0.17
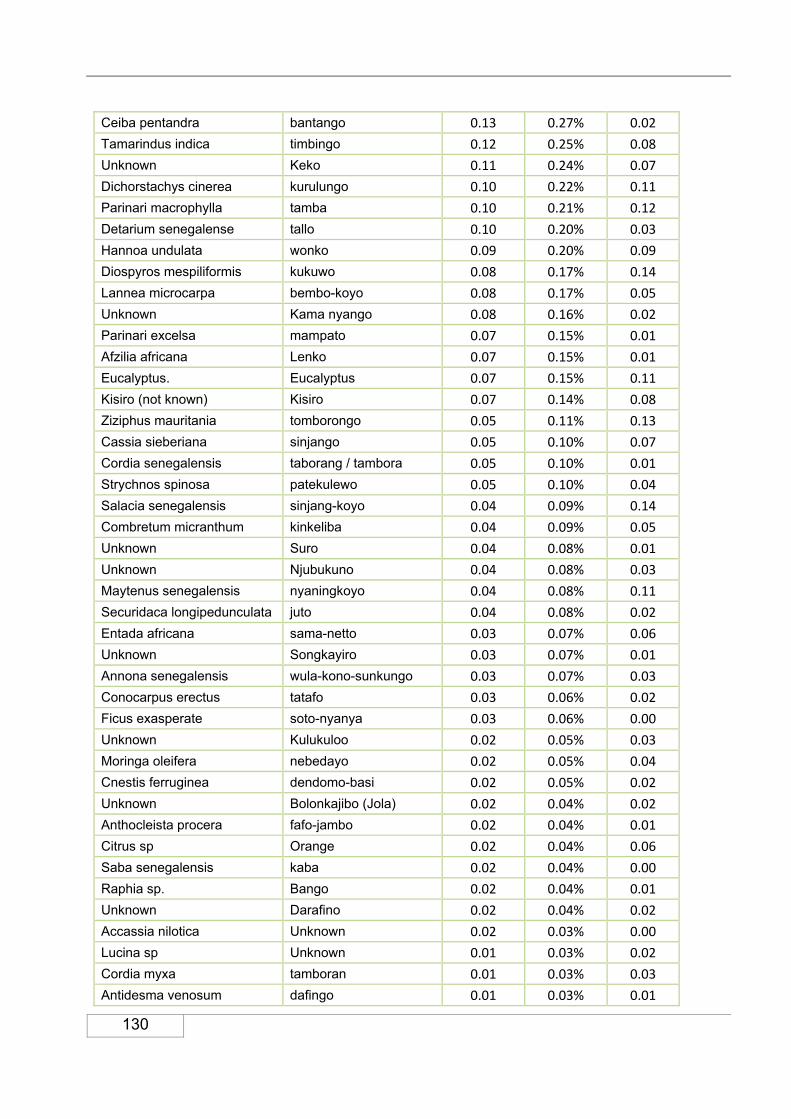
130
Ceiba pentandra bantango 0.13 0.27% 0.02
Tamarindus indica timbingo 0.12 0.25% 0.08
Unknown Keko 0.11 0.24% 0.07
Dichorstachys cinerea kurulungo 0.10 0.22% 0.11
Parinari macrophylla tamba 0.10 0.21% 0.12
Detarium senegalense tallo 0.10 0.20% 0.03
Hannoa undulata wonko 0.09 0.20% 0.09
Diospyros mespiliformis kukuwo 0.08 0.17% 0.14
Lannea microcarpa bembo-koyo 0.08 0.17% 0.05
Unknown Kama nyango 0.08 0.16% 0.02
Parinari excelsa mampato 0.07 0.15% 0.01
Afzilia africana Lenko 0.07 0.15% 0.01
Eucalyptus. Eucalyptus 0.07 0.15% 0.11
Kisiro (not known) Kisiro 0.07 0.14% 0.08
Ziziphus mauritania tomborongo 0.05 0.11% 0.13
Cassia sieberiana sinjango 0.05 0.10% 0.07
Cordia senegalensis taborang / tambora 0.05 0.10% 0.01
Strychnos spinosa patekulewo 0.05 0.10% 0.04
Salacia senegalensis sinjang-koyo 0.04 0.09% 0.14
Combretum micranthum kinkeliba 0.04 0.09% 0.05
Unknown Suro 0.04 0.08% 0.01
Unknown Njubukuno 0.04 0.08% 0.03
Maytenus senegalensis nyaningkoyo 0.04 0.08% 0.11
Securidaca longipedunculata juto 0.04 0.08% 0.02
Entada africana sama-netto 0.03 0.07% 0.06
Unknown Songkayiro 0.03 0.07% 0.01
Annona senegalensis wula-kono-sunkungo 0.03 0.07% 0.03
Conocarpus erectus tatafo 0.03 0.06% 0.02
Ficus exasperate soto-nyanya 0.03 0.06% 0.00
Unknown Kulukuloo 0.02 0.05% 0.03
Moringa oleifera nebedayo 0.02 0.05% 0.04
Cnestis ferruginea dendomo-basi 0.02 0.05% 0.02
Unknown Bolonkajibo (Jola) 0.02 0.04% 0.02
Anthocleista procera fafo-jambo 0.02 0.04% 0.01
Citrus sp Orange 0.02 0.04% 0.06
Saba senegalensis kaba 0.02 0.04% 0.00
Raphia sp. Bango 0.02 0.04% 0.01
Unknown Darafino 0.02 0.04% 0.02
Accassia nilotica Unknown 0.02 0.03% 0.00
Lucina sp Unknown 0.01 0.03% 0.02
Cordia myxa tamboran 0.01 0.03% 0.03
Antidesma venosum dafingo 0.01 0.03% 0.01

131
Unknown Burung barango 0.01 0.02% 0.00
Unknown Kikuwo 0.01 0.02% 0.00
Pseudospondias microcarpa mendiko 0.01 0.02% 0.01
Shrebera arborea sulla-selleh-balo 0.01 0.02% 0.00
Allophylus africanus kunkun-mahulie 0.01 0.02% 0.00
Nauclea latifolia batio 0.01 0.02% 0.01
Acacia polyacantha bambakogo 0.01 0.02% 0.01
Albizia chevalieri sama-teyo 0.01 0.02% 0.01
Hexalobus monopetalous some 0.01 0.01% 0.00
Unknown Sulabanano 0.01 0.01% 0.00
Unknown Sula sele ballo 0.01 0.01% 0.00
Unknown Bocansayo (Jola) 0.01 0.01% 0.00
Unknown Toubabtabo 0.01 0.01% 0.07
Unknown Keminyang 0.01 0.01% 0.00
Stereospermum kunthianum dafingo 0.00 0.01% 0.00
Rauvolfia vomitoria bantang-faro 0.00 0.01% 0.00
Anthostema senegalense manayiro/fama 0.00 0.01% 0.00
Unknown Saminea 0.00 0.01% 0.02
Dialium guineense kosito 0.00 0.01% 0.01
Unknown Walayero 0.00 0.01% 0.00
Antiaris africana jaffo 0.00 0.01% 0.00
Carica papaya Pawpaw 0.00 0.01% 0.01
Unknown Farabantango 0.00 0.01% 0.01
Unknown Mbano 0.00 0.01% 0.00
Newbouldia laevis kunjunburo 0.00 0.01% 0.00
Unknown Barakasonyeh 0.00 0.00% 0.01
Gardenia erubescens tankango 0.00 0.00% 0.01
Unknown Kulungo 0.00 0.00% 0.01
Lophira lanceolata machecharo 0.00 0.00% 0.01
Unknown Janjango 0.00 0.00% 0.01
Vitex doniana kutufingo 0.00 0.00% 0.00
Unknown Nyankoyo 0.00 0.00% 0.02
Saminea Saminea 0.00 0.00% 0.01
Unknown Jolankalo 0.00 0.00% 0.01
Erythrina senegalensis ndolingo 0.00 0.00% 0.00
Morinda geminata batio-jongo 0.00 0.00% 0.01
Unknown Kulutingo 0.00 0.00% 0.00
Phoenix reclinata kurusowo 0.00 0.00% 0.00
Unknown Kerenwuto 0.00 0.00% 0.01
Unknown Kunje 0.00 0.00% 0.01