the gc selective dna-binding antibiotic, mithramycin a ... · the gc selective dna-binding...
TRANSCRIPT
The GC selective DNA-binding antibiotic, Mithramycin A, reveals multiple
points of control in the regulation of Hdm2 protein synthesis
A. Phillips, M. Darley and J. P. Blaydes*
Cancer Sciences Division
School of Medicine, University of Southampton
MP 824, Southampton General Hospital,
Southampton SO16 6YD, U.K.
Running Title: Regulation of Hdm2 by Mithramycin A
Keywords: Hdm2, Mdm2, transcription, mRNA export, promoter
*To whom correspondence should be addressed at Somers Cancer Research Building,
MP 824, Southampton General Hospital, Southampton SO16 6YD, U.K. Phone: +44
(0)23 8079 4582, Fax: +44 (0)23 8079 5152, email: [email protected]
ABSTRACT
The primary role of the Hdm2 / Mdm2 oncoprotein is to regulate the levels and
activity of the transcription factor p53. Hdm2 synthesis is itself tightly controlled and,
as demonstrated by a recently described SNP (SNP309) in the hdm2-P2 promoter,
minor variations in Hdm2 expression have phenotypic consequences on radiation
sensitivity and cancer predisposition. To further define mechanisms regulating Hdm2
expression, we have investigated the effects of the GC selective DNA binding drug,
Mithramycin A (MA) on hdm2 mRNA transcription, trafficking, and translation.
Firstly we show that the constitutive hdm2-P1 promoter is inhibited by MA. We
define, for the first time, the minimal sequence elements that are required for P1-
promoter activity and identify those which confer MA sensitivity. Secondly, MA
induces p53-dependent transcription from the hdm2-P2 promoter. Thirdly, and
critically, MA also inhibits Hdm2 synthesis at the posttranscriptional level, with
negative effects on hdm2 mRNA nuclear export and translation. This study highlights
the complex interplay between the pathways that regulate Hdm2 protein synthesis in
cancer cells, and furthermore emphasises the export of hdm2 mRNA from the nucleus
to the cytoplasm as a key point of control in this process.
INTRODUCTION
The oncoprotein Hdm2 (Mdm2 in mouse) is the primary negative regulator of the
activity of the transcription factor p53 in proliferating cells (Momand et al., 2000;
Vogelstein et al., 2000). Hdm2 regulates p53 function through multiple mechanisms,
including concealing its activation domain from the transcriptional machinery (Oliner
et al., 1993), and targeting it for ubiquitination, nuclear export and proteosomal
degradation (Michael & Oren, 2003). In the absence of functional Hdm2 / Mdm2,
cells in the early embryo undergo spontaneous p53-dependent apoptosis (Jones et al.,
1995; Montes de Oca Luna et al., 1995), normal human fibroblasts in culture undergo
cell cycle arrest (Blaydes & Wynford-Thomas, 1998), and the in vivo proliferation of
tumour cells which retain a wild-type p53 gene is inhibited (Vassilev et al., 2004).
However, the sensitivity of the p53-Hdm2 regulatory module is such that even small
changes in the levels of Hdm2 / Mdm2 can have profound effects on cellular biology.
Most notably, the transgenic manipulation of mice to incorporate a hypomorphic
allele of mdm2 that results in as little as a 20% reduction in Mdm2 protein levels,
renders the animals markedly more sensitive to ionising radiation (Mendrysa et al.,
2003). In humans, a single nucleotide polymorphism (SNP309) in the hdm2 gene
which results in increased Hdm2 expression has been shown to correlate with
accelerated rates of tumorigenesis in a subset of individuals (Bond et al., 2004; Bond
et al., 2005).
Regulation of the levels and activity of Hdm2 therefore has the potential to play a
major role in the control of proliferation and survival of both normal and cancer cells.
It is already clear that regulation of Hdm2 activity at the post-translational level is
critically important for the control of its function, with Hdm2 phosphorylation and
protein:protein interactions being a critical point of convergence for both stress- and
survival-induced signalling pathways (Meek & Knippschild, 2003; Michael & Oren,
2003). Of particular note is the stress-induced increase in Hdm2 protein turnover that
contributes to the activation of p53 following DNA-damage (Stommel & Wahl,
2004), the phosphorylation of Hdm2 by Akt kinase, which promotes the accumulation
of Hdm2 in the nucleus and is an important component of the effects of pro-survival
factors such as Insulin-like Growth Factor–1 (Ashcroft et al., 2002; Feng et al., 2004;
Mayo & Donner, 2001; Shaulian et al., 1997), and the induction of the Hdm2
antagonist, p14ARF by oncogenic stress (Sherr & Weber, 2000; Stott et al., 1998).
Perhaps less thoroughly investigated are the mechanisms whereby the rates of Hdm2
protein synthesis are regulated. However it is clear, not least from the numerous
studies in which elevated levels of hdm2 mRNA and protein expression have been
shown to occur in human tumours (Onel & Cordon-Cardo, 2004), that this is an
equally important point of control. Transcription of hdm2 mRNA encoding the full
length, p53-binding form of Hdm2 (p90) occurs from two promoters, P1 and P2. The
mRNA transcript generated from the P1-promoter is translated approximately 10 fold
less efficiently than the P2 transcript, due to the presence of two upstream open
reading frames (uORFs) in the first exon (Brown et al., 1999; Jin et al., 2003). The
P1-promoter is thought to be responsible for the low level, basal expression of Hdm2 /
Mdm2 in unstressed cells (Mendrysa et al., 2003), though its activity has recently
been found to be regulatable in response to Akt kinase signalling in some cells (Chang
et al., 2004). Transcription from the P2-promoter is highly induced by p53, due to the
presence of two p53-binding sites <100 b.p. 5’ to the transcriptional start site
(Zauberman et al., 1995). This response to p53 is key in regulating the duration of the
p53-response to genotoxic stress (Lev Bar-Or et al., 2000). A number of other
signalling pathways and transcription factors also impinge upon the activity of the
p53-Hdm2 module via the regulation of the activity of the P2-promoter, including
thyroid hormone receptors (Qi et al., 1999), HEY1 and HES1 transcriptional
repressors (Huang et al., 2004), MYCN (Slack et al., 2005) and Ras-Raf-MEK-ERK
signalling (Phelps et al., 2003; Phelps et al., 2005; Ries et al., 2000). Hdm2 protein
synthesis is also subject to post-transcriptional control; the export of hdm2 message
from the nucleus to the cytoplasm is controlled by cellular MEK activity (Phelps et
al., 2005), and hdm2 mRNA translation rates are elevated in some cancer cells
(Landers et al., 1997; Trotta et al., 2003).
There remain, however, many examples in the literature where distinct growth- or
stress-induced signalling pathways have been shown to regulate the levels of
expression of Hdm2, and as a consequence cellular p53 activity, through non-defined
and potentially novel mechanisms. In the recent paper describing the SNP309 in the
hdm2-P2 promoter (Bond et al., 2004), the authors made use of the GC selective
DNA binding anti-tumour antibiotic, Mithramycin A (MA), to show increased activity
of the P2-promoter in cells homozygous for the SNP309 (G/G) was dependent on
Sp1 transcription factors that bind GC-rich sequences. Given that MA is a genotoxic
compound that is able to strongly activate the DNA-binding activity of p53
(Koutsodontis & Kardassis, 2004), we were intrigued by the Bond et al’s data that
MA did not noticeably induce p53-dependent Hdm2 expression in cell lines with an
intact p53-responsive pathway, irrespective of their SNP309 status. In this manuscript
we have further investigated the mechanistic basis for the effects of MA on Hdm2
synthesis. We demonstrate that MA does strongly induce transcription from the p53-
dependent hdm2-P2 promoter, however it also inhibits transcription from the
constitutive hdm2-P1 promoter, which we show is critically dependent on a GC rich
element for its activity. MA also reduces the export of both hdm2 mRNA transcripts
from the nucleus to the cytoplasm, further inhibiting Hdm2 protein synthesis
RESULTS
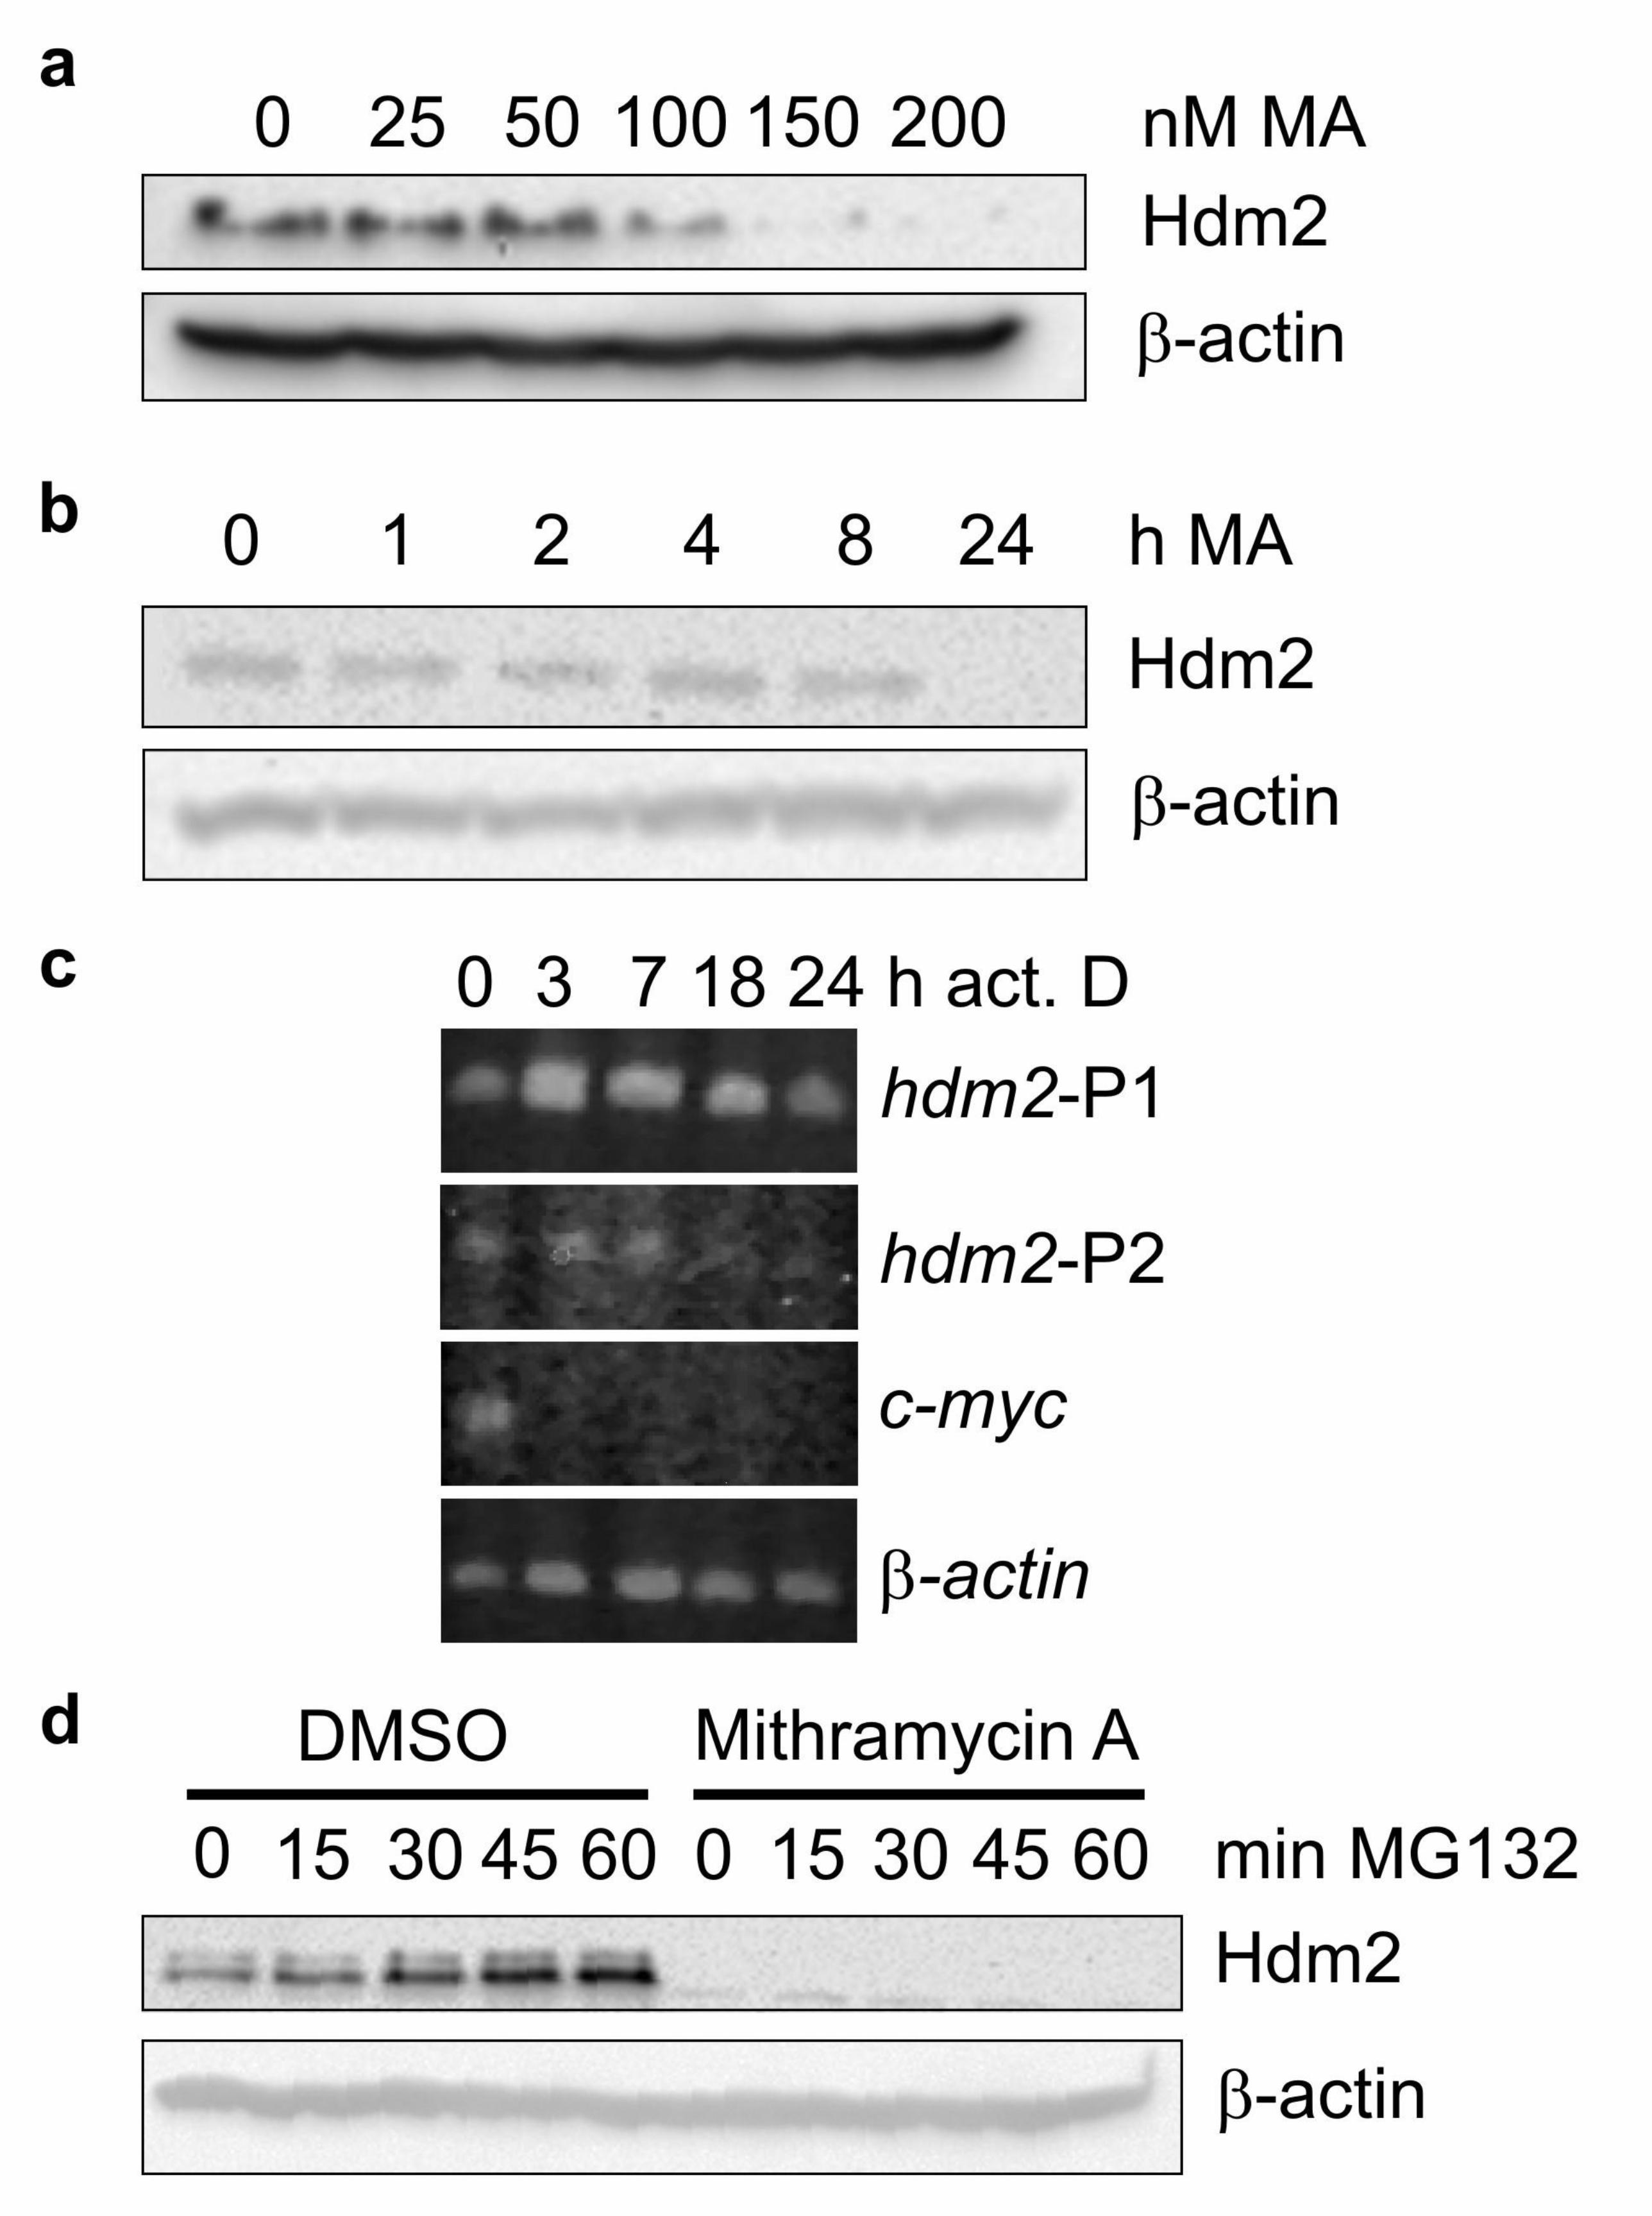
Mithramycin A inhibits Hdm2 protein synthesis in T47D breast cancer cells
The study by Bond et al., 2004 demonstrated that MA decreased levels of SMP14
antibody-reactive Hdm2 protein in a number of cell lines which were G/G
homozygous for SNP309. We therefore initially used one of these lines, breast cancer-
derived T47D cells, to confirm the dose response (Fig. 1a) and time course (Fig. 1b)
of the effects of MA on Hdm2 protein synthesis. For these studies we used antibody
2A9, which unlike several antibodies which recognise Hdm2 including SMP14
(Zhang & Prives, 2001), is not known to be affected by post-translational
modification of Hdm2. Consistent with the previous study, MA at concentrations
above 100 nM reduced Hdm2 levels after 24 h exposure, with the maximum effect
being observed at 150-200 nM. Therefore all future experiments were carried out at
200 nM MA over 24 h.
Hdm2 is a highly labile protein, with a half-life of ~15 min in T47D cells (Phelps et
al., 2005). The half life-of mdm2 mRNA has also been reported to be relatively short
in some cells (Hsing et al., 2000). This appeared to be incompatible with the proposed
mechanism of inhibition of Hdm2 synthesis by MA in these cells, i.e. direct binding
of the hdm2-P2 promoter to inhibit transcription (Bond et al., 2004), as this would be
expected to result in a rapid decrease in Hdm2 protein levels. We therefore examined
the turnover of hdm2 mRNA following blockade of mRNA synthesis by Actinomycin
D (Fig. 1c). Compared with the labile c-myc mRNA, hdm2 mRNA was relatively
stable in T47D cells, not decreasing until 7-18 h exposure to Actinomycin D. This
would, therefore, account for a delayed decrease in Hdm2 protein levels following the
inhibition of hdm2 mRNA synthesis by MA. Finally, we confirmed that MA does, in
fact, inhibit Hdm2 protein synthesis, rather than promoting its proteosomal-mediated
degradation, by demonstrating that treatment with the proteosome inhibitor, MG132,
does not increase Hdm2 protein levels in T47D cell previously exposed to MA (Fig.
1d).
Mithramycin A down-regulates expression of mRNA from the ‘constitutive’ Hdm2-P1
promoter, but not the ‘inducible’ P2-promoter
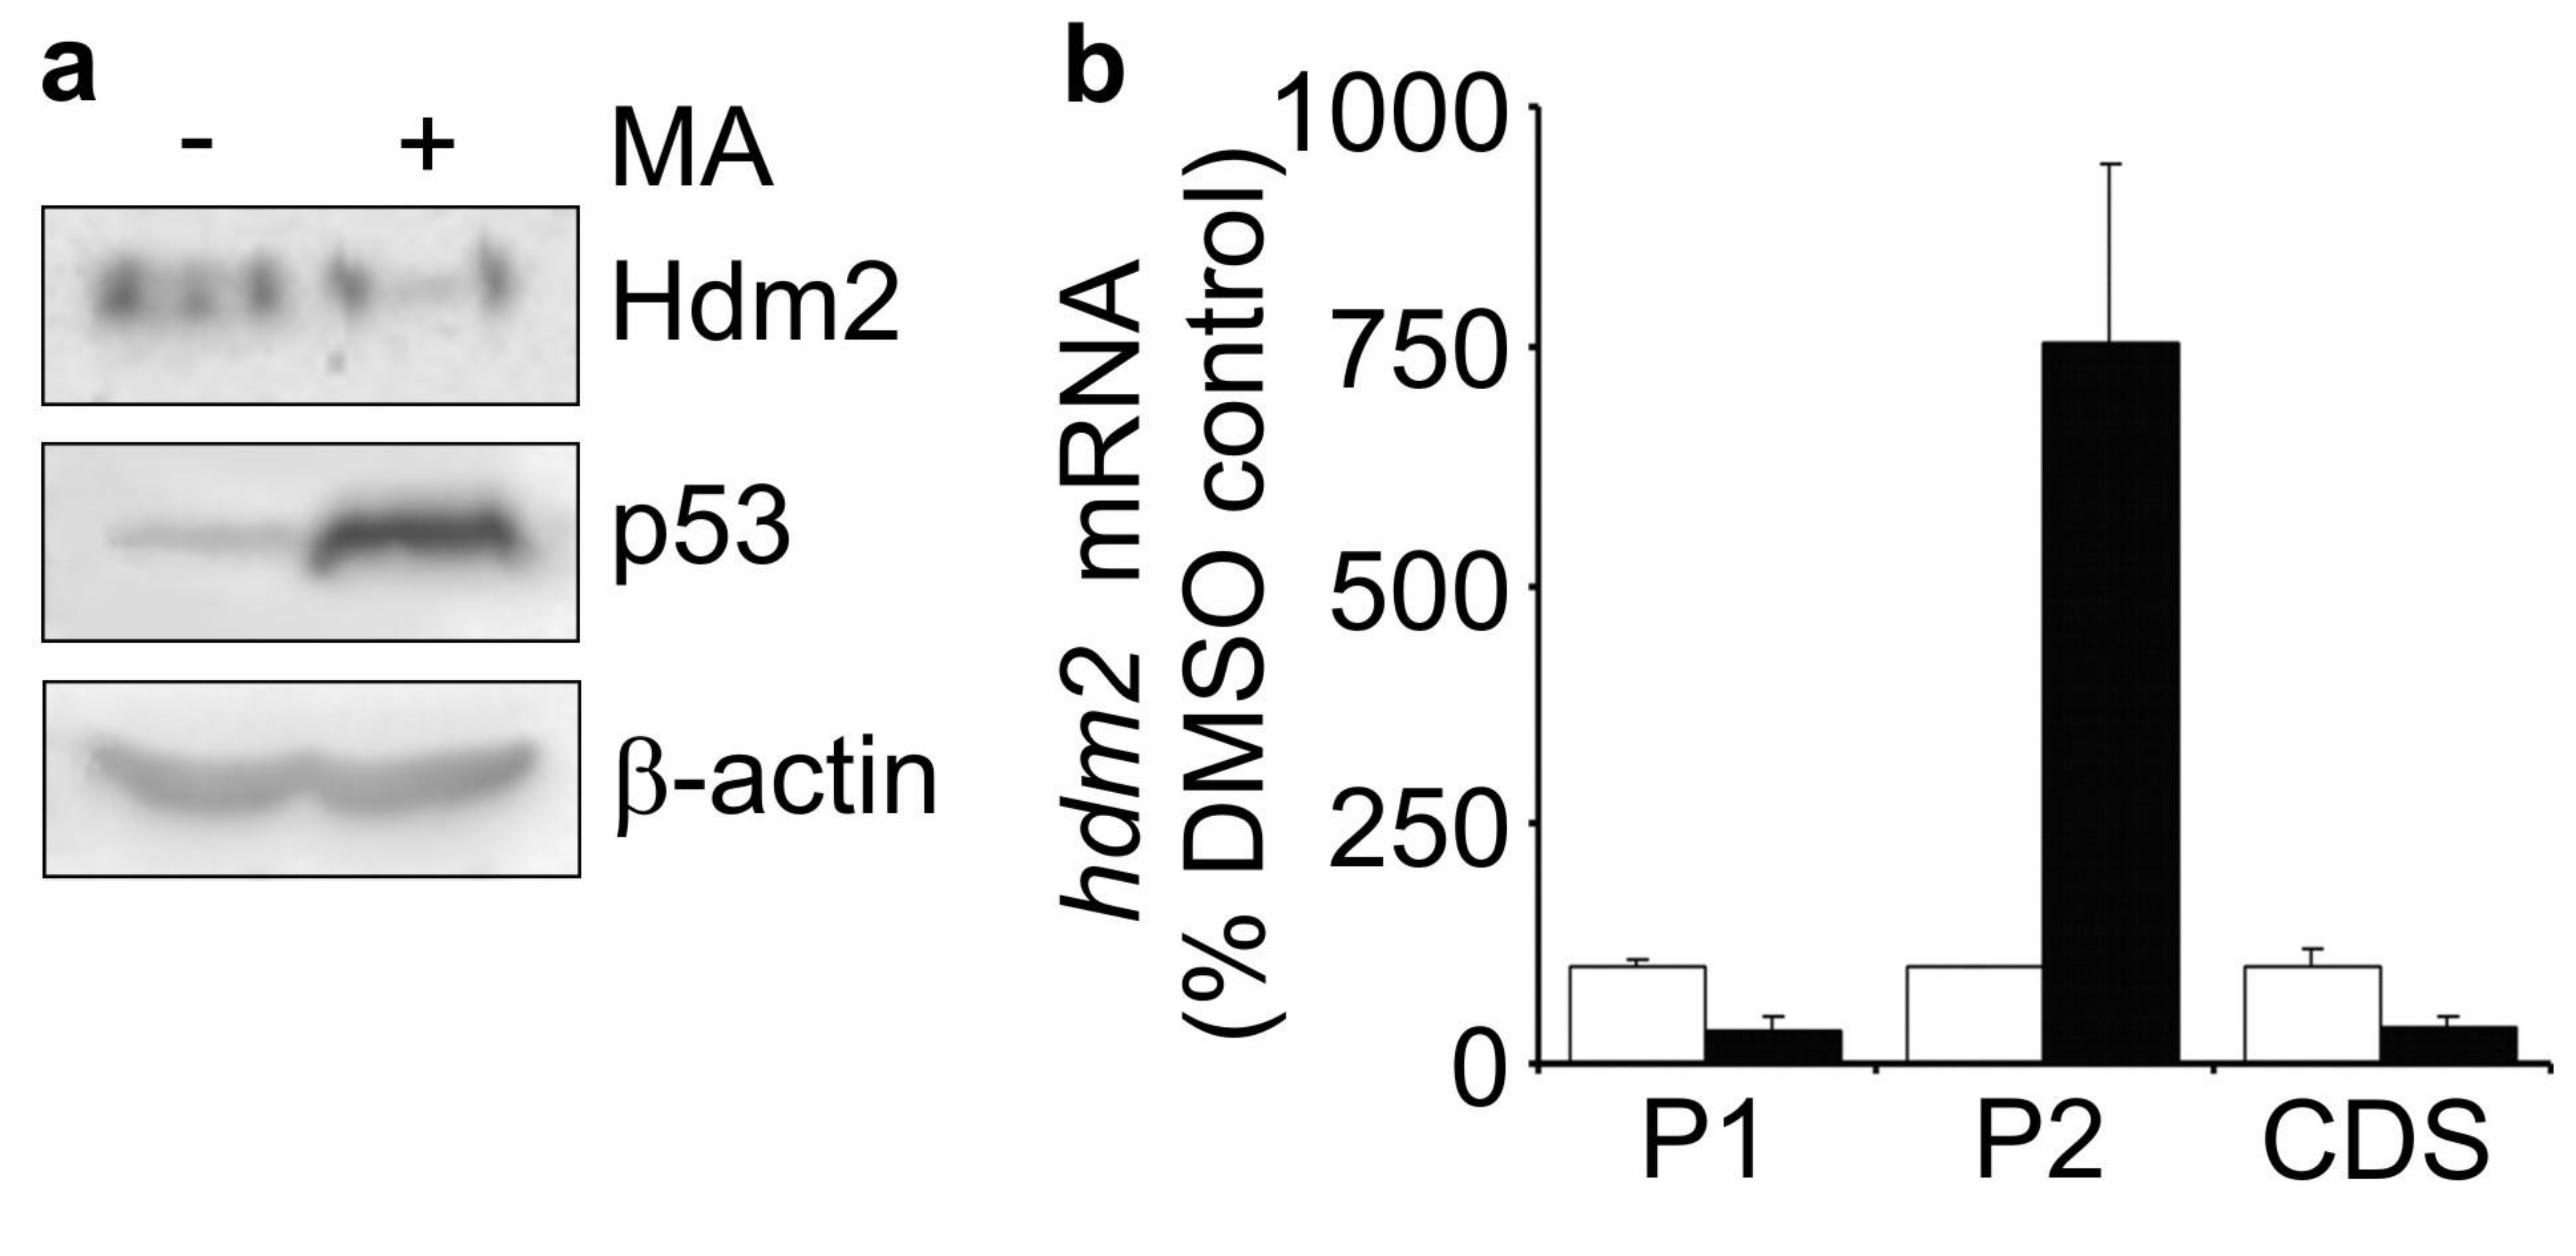
Having confirmed that MA had the expected effects on Hdm2 protein synthesis in
T47D cells, we then examined its effects in a cell line that retains a functional stress-
induced, p53-dependent transcriptional response. MCF-7 breast cancer cells exposed
to MA for 24 h showed a strong induction of p53 protein by MA (Fig. 2a). This was
accompanied by a large increase in the levels of mRNA from the p53-inducible hdm2-
P2 promoter (750 % (P<0.05), Fig. 2b). Despite this induction, Hdm2 protein levels
were reduced in MA-treated MCF-7 cells (Fig. 2a), albeit not to as great an extent as
in T47D cells.
Whilst it is the regulation of the P2-promoter that is normally responsible for the
induction of Hdm2 expression in response to stress-induced p53 activation, the
mRNA from the P1-transcript is actually more abundant than the P2 transcript in
many cell types, including unstressed MCF-7 cells (Phelps et al., 2003). MA caused a
reduction in hdm2-P1 transcript levels to approximately 35 % of control levels in
MCF-7 cells (P<0.05, Fig. 2b), and hence the net effect of MA on levels of hdm2
coding sequence containing transcripts was a decrease (Fig. 2b). As it is likely that
this down-regulation of P1-transcript levels contributes to the overall effects of MA
on Hdm2 protein levels, we next sought to establish the mechanistic basis underlying
this observation.
Sequence elements required for hdm2-P1 promoter activity
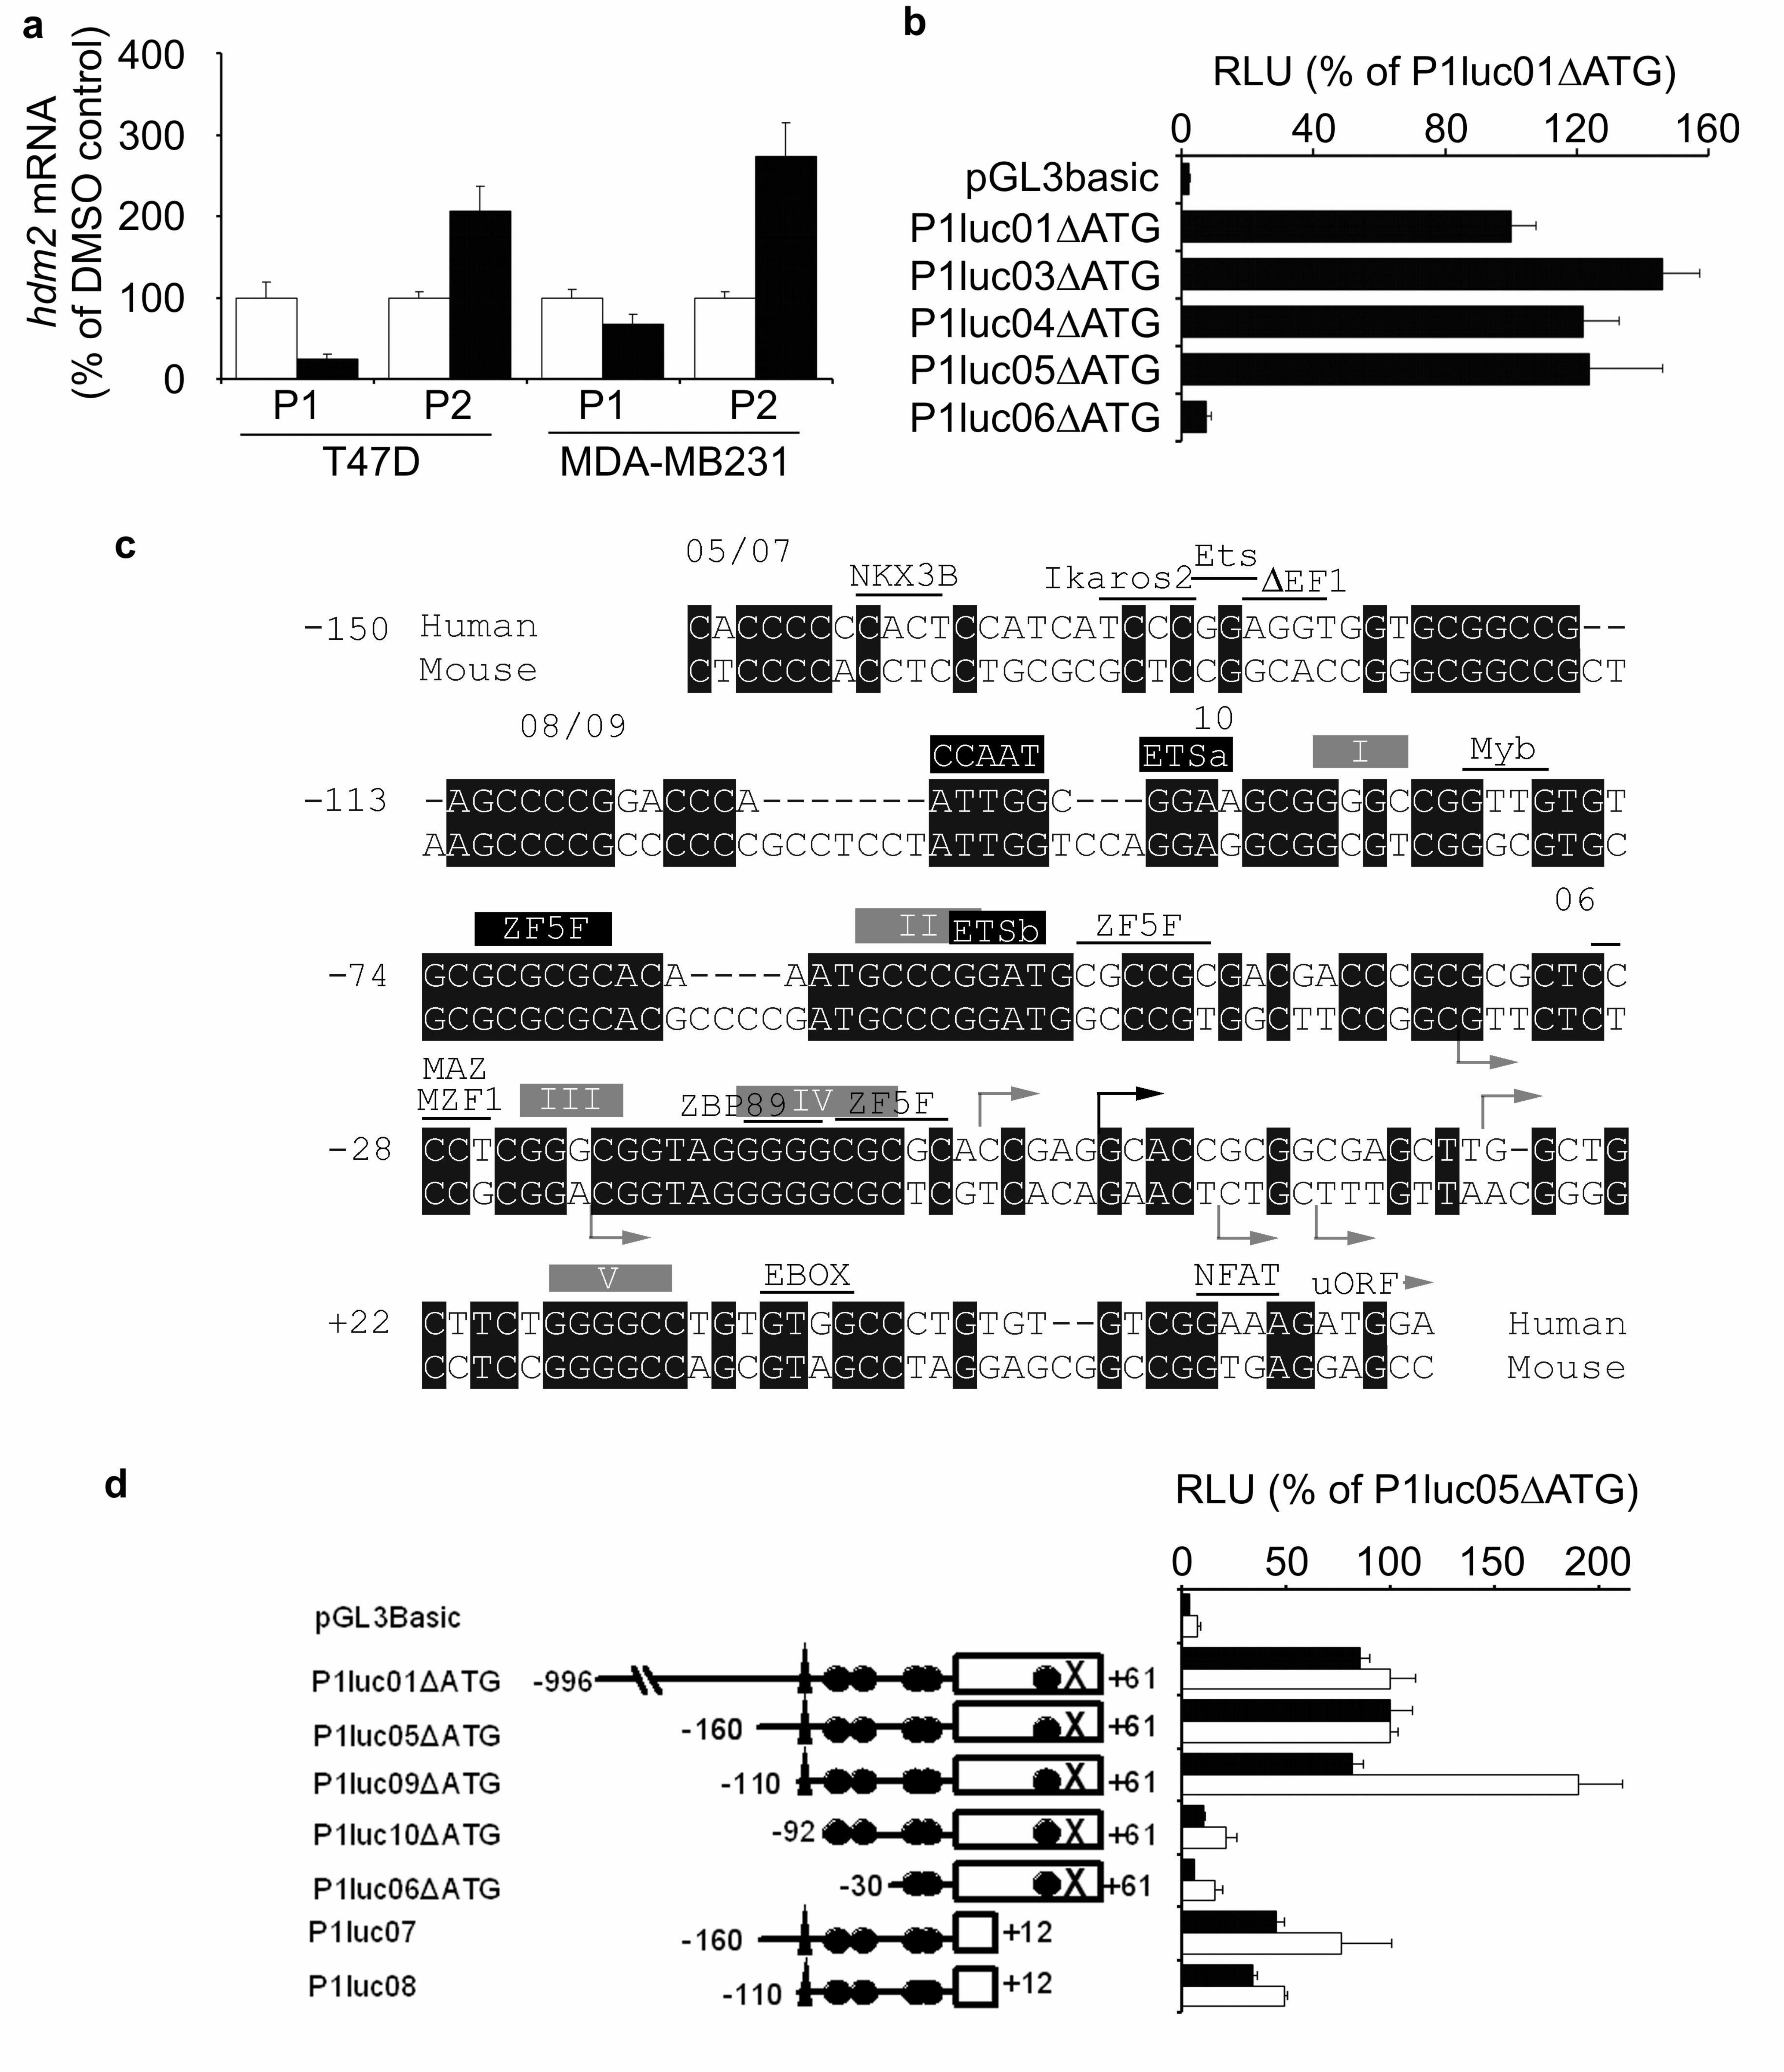
We first confirmed that the effect of MA on hdm2-P1 transcript levels was seen in cell
lines other than MCF-7 (Fig. 3a). MA reduced P1-transcript levels by 74.8 %
(P<0.05) and 33.1 % (P<0.05) in T47D and MDA-MB231 breast cancer cell lines
respectively. We also observed that, whilst both these cell lines express functionally
inactive mutant p53 and hence MA did not cause the same striking increase in P2-
transcripts as in MCF-7, the drug did still induce a modest increase in the P2-
transcript levels in both cell lines (206 % (P<0.05) and 272 % (P<0.05) respectively).
The hdm2-P1 promoter has not been previously subjected to functional analysis,
Therefore, to investigate the regulation of hdm2-P1 observed in all cell lines
examined, we amplified a 1057 b.p. region of the hdm2-P1 promoter from normal
human genomic DNA, and cloned it into the pGL3Basic luciferase reporter vector, to
produce the vector hdm2P1luc01. This region included 61 b.p. of sequence 3’ to the
expected transcriptional start site (Oliner et al., 1992) including an ATG from one of
the two uORFs in exon 1 which inhibit translation of the hdm2-P1 message (Brown et
al., 1999). In order to confirm that transcription was initiating, as would be expected,
from 5’ to this ATG, as well as to improve translation of the luciferase reporter gene,
this ATG codon was mutated (∆ATG vectors). This resulted in an approximately 3-
fold enhancement in reporter activity in all cell lines tested (data not shown), so all
subsequent experiments were performed using reporter vectors with this mutation. We
then made progressive 5’ deletions of the inserted genomic sequence to identify the
minimal region of the promoter that was required for constitutive activity (Fig. 3b). In
MDA-MB231 cells, the plasmid hdm2P1luc05∆ATG, which contains only 221 b.p. of
genomic DNA sequence, had comparable activity to the original 1057 b.p. containing
vector. Deletion of a further 120 b.p. of 5’ sequence (hdm2P1luc06∆ATG) resulted in
loss of >90 % of the promoter activity.
To facilitate further dissection of this promoter region we performed an alignment
analysis of this 221 b.p. region of the human P1-promoter with the comparable region
of the murine promoter (Fig. 3c). It has previously been observed that the 5’UTR
region encoded by exon 1 is relatively poorly conserved between species (Zauberman
et al., 1995) and therefore we reasoned that any conserved elements between the
species in the promoter regions may well be functionally important. The human
sequence was also analysed for potential transcription factor binding sites. The first
observation was that there is no TATA box element to provide a specific
transcriptional start site, and BLAST analysis of both human and mouse EST
databases identified sequences with different 5’ ends in both species, which is
suggestive of multiple start sites. Based on this analysis, a further set of deletion
mutants was then generated, and transfected into MDA-MB231 and MCF-7 cells (Fig.
3d). The activity of hdm2P1luc05∆ATG in each cell line was set as 100 %, and the
other vectors compared to this. In MCF-7 cells, as in MDA-MB231 cells,
hdm2P1luc01∆ATG and hdm2P1luc05∆ATG vectors have approximately equal
activity, and therefore the minimal active region is similar in both cell lines. A
deletion of 50 b.p. from the 5’ end of hdm2P1luc05∆ATG to produce
hdm2P1luc09∆ATG did not result in loss of activity in MDA-MB231 cells, and
actually resulted in significantly (P<0.01) increased activity in MCF-7 cells. A further
deletion of the 18 b.p. sequence between -110 and -92 resulted in a reduction to 21.4
% and 12.5 % of hdm2luc05∆ATG activity in MCF-7 and MDA-MB231 cells
respectively. This region contains a CCAAT box consensus sequence. Deletion of 39
b.p. from the 3’ end of hdm2P1luc05∆ATG resulted in a significant (P<0.01)
reduction in activity to 45.3 % in MDA-MB231. In MCF-7 cells, whether or not this
deletion had a significant effect was dependent on the absence or presence of the 50
b.p. between -160 and -110 at the 5’ end of the inserted sequence.
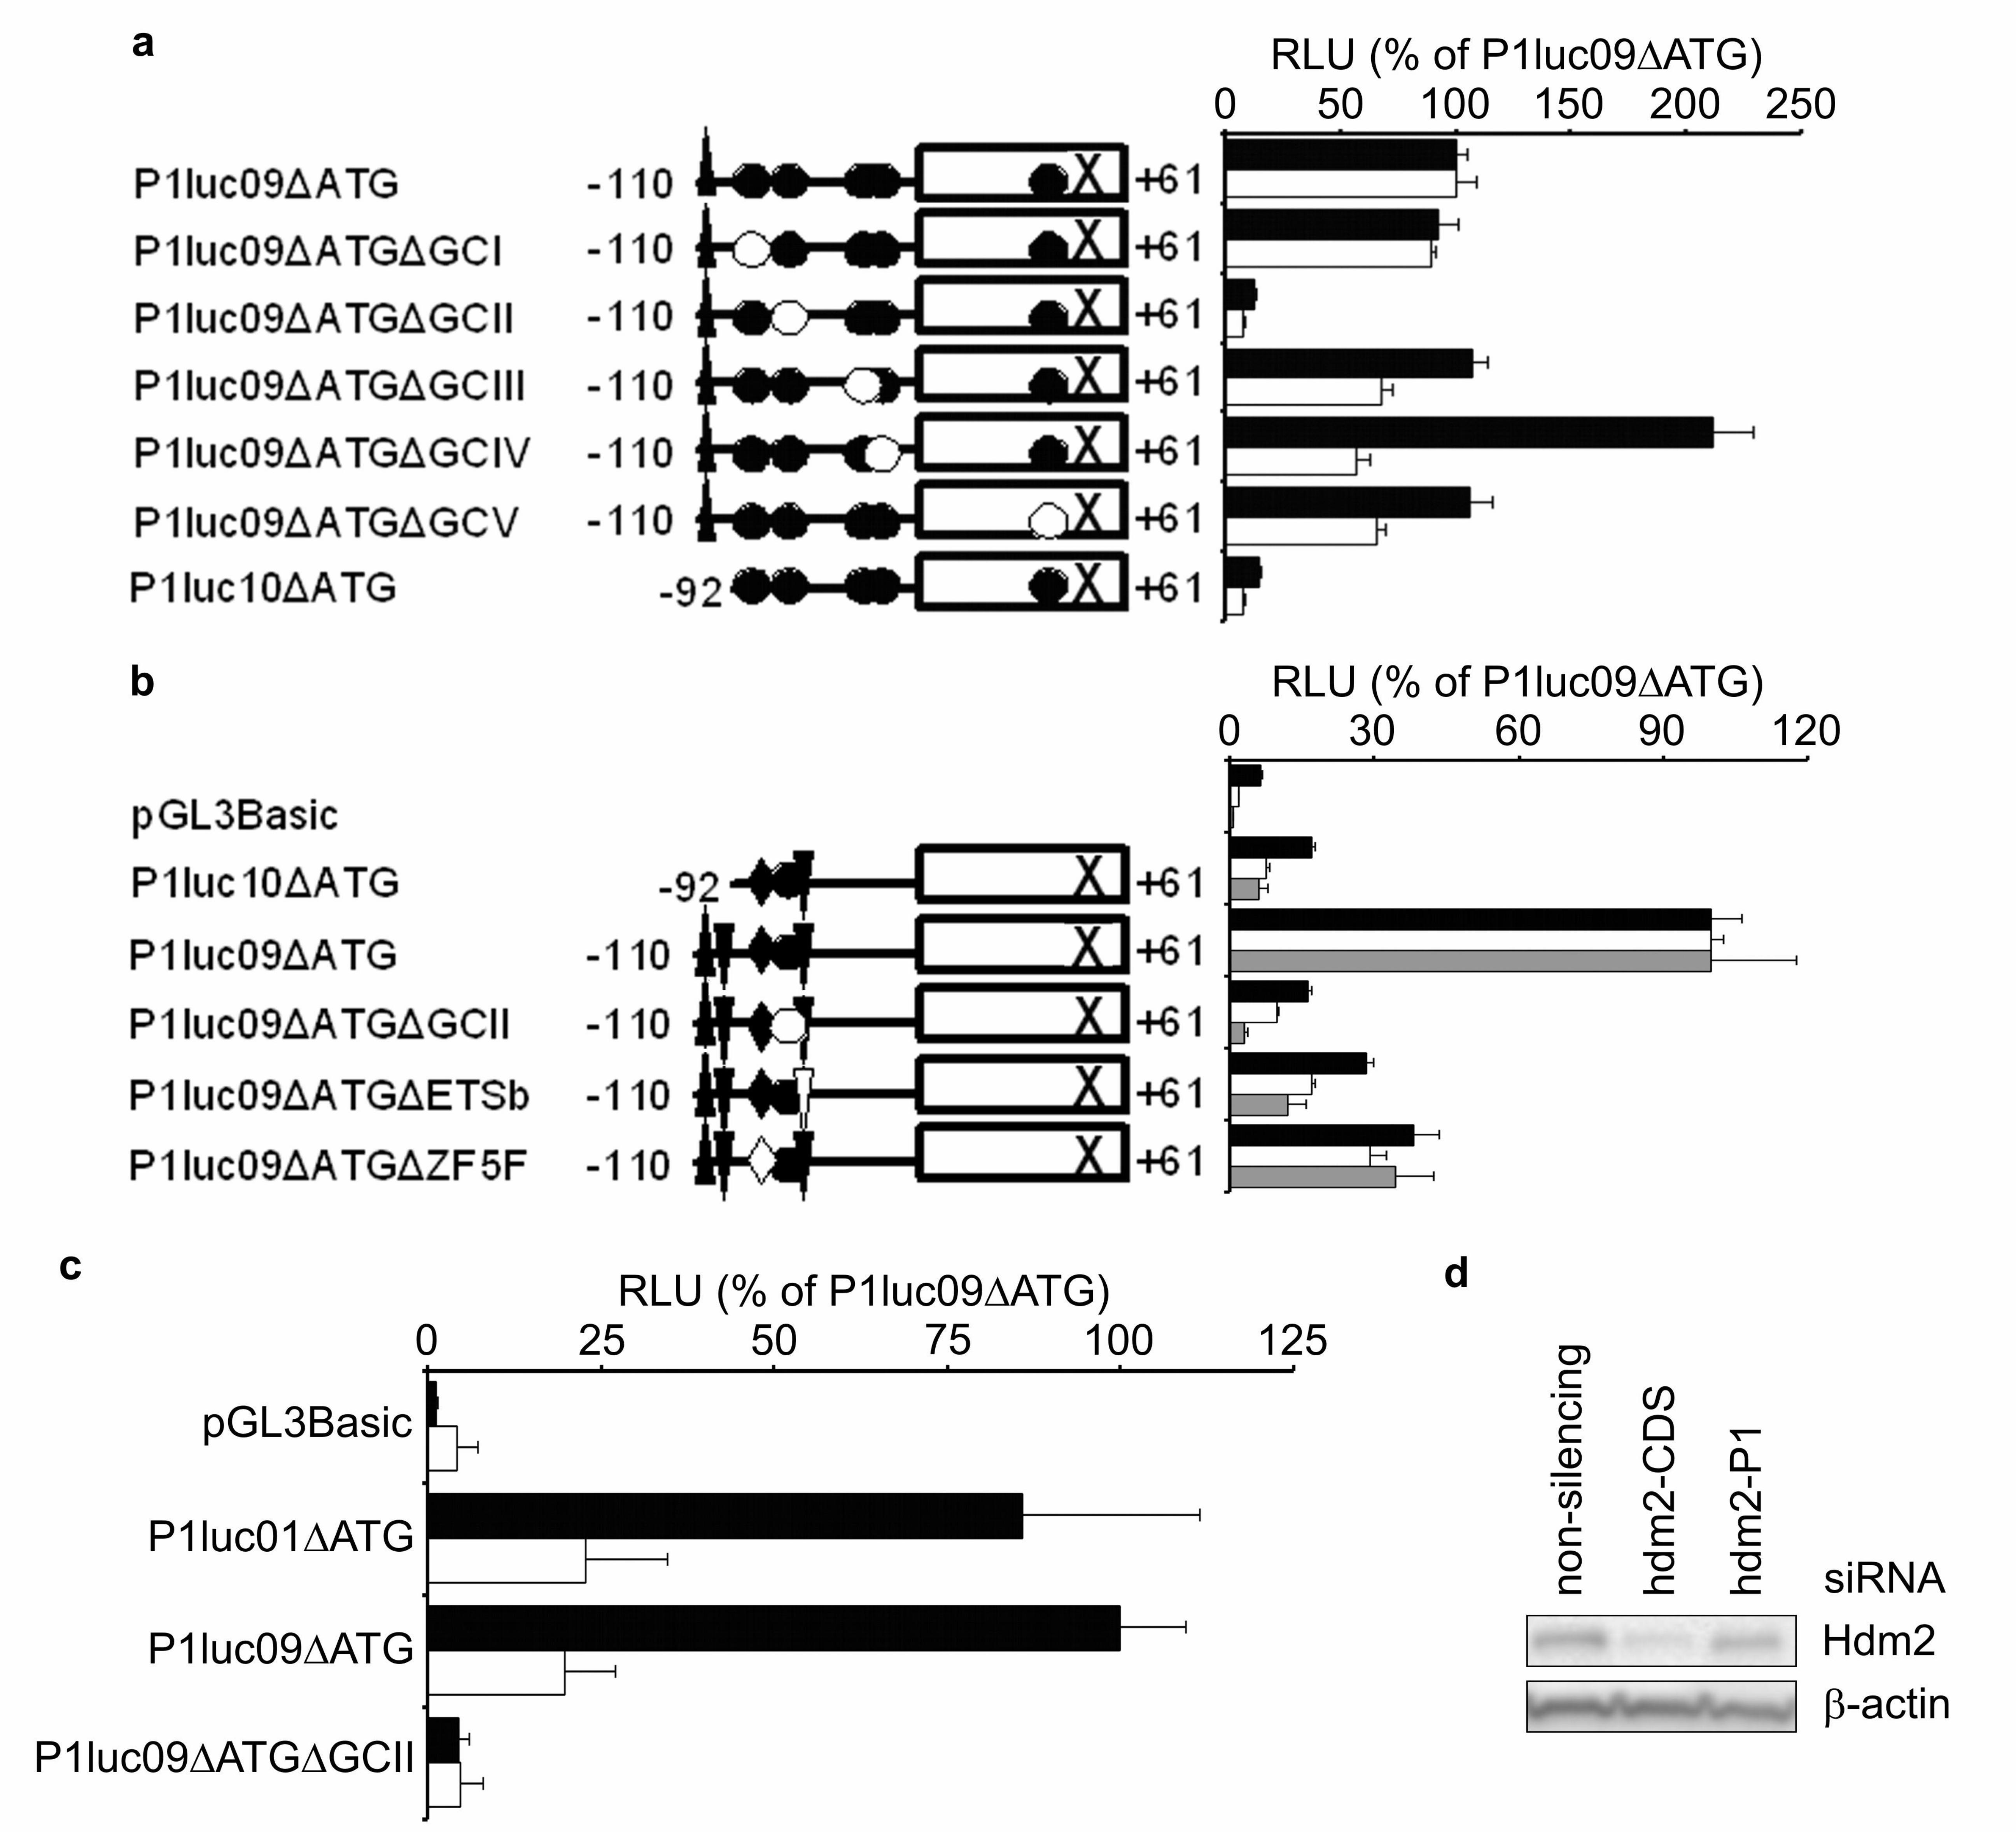
Having established the minimal region required for P1-promoter activity, we then set
out to establish the mechanism whereby MA inhibits expression of the P1-transcript.
MA is thought to inhibit transcription by binding GC-rich regions in promoter, and
preventing them from recruiting activating transcription factors, such as Sp1. We
therefore made and analysed a series of hdm2P1luc09∆ATG-based vectors containing
small mutations in GC rich motifs in the promoter. One of these mutations (GCII)
resulted in a >85 % loss of promoter activity in both cell lines (Fig. 4a). Three other
mutations (GCIII, IV, V) resulted in smaller, though significant (P<0.05), reductions
in activity in MCF-7 cells. In MDA-MB231 cells only one of these other mutants,
GCIV, had a significant effect (P=0.001), though, interestingly the GCIV mutation
resulted in a >2-fold increase in reporter activity in these cells, compared to a 42.8 %
decrease in MCF-7.
The GCII region that is necessary, though not sufficient, for >85% of promoter
activity in both cell lines is also well conserved between the human and mouse
promoters. We therefore generated further mutants to characterise this region, and
individually disrupted a potential ETS family binding site (defined here as site ETSb),
and a consensus binding site for the ubiquitously expressed ZF5F factors, which
overlaps with the 5’ part of the GCII region. The effects of all these mutants of the
GCII regions were examined in MDA-MB231, MCF-7 and T47D cells (Fig. 4b). A 2
b.p. substitution that destroyed the ETSb site resulted in significant (all P<0.01)
71.7 %, 83.0 % and 88.0 % reductions in promoter activity in MDA-MB231, MCF-7
and T47D cells respectively. The 6 b.p. substitution to destroy the ZF5F site also
reduced promoter activity by 61.6 % (P<0.001) in MDA-MB231, 70.8 % (P<0.001) in
MCF-7 and 65.5 % (P<0.01) in T47D cells. In all cell lines, the effect of the GCII
mutation was slightly greater than either the ETSb or ZF5F mutations, suggesting
there may be more than one functional transcription factor binding sites in this region,
which the GCII mutant is more effective at inactivating. To investigate whether the
GCII region could be the functionally relevant target for MA in the hdm2-P1
promoter, we exposed cells transfected with various reporter vectors to MA (Fig. 4c).
MA significantly inhibits activity of hdm2P1luc09∆ATG to 19.8 % (P<0.01) of
control levels; this inhibition is not seen with the GCII mutated vector. As MA is
generally regarded as an inhibitor of Sp1 transcription factor activity, we attempted to
determine the role of Sp1 in transcription from the P1-promoter. However these
experiments proved inconclusive as, whilst ~90 % knockdown of Sp1 protein was
achieved, we did not observe any decrease in endogenous hdm2-P1 message levels,
nor was a known Sp1-responsive reporter vector affected by the Sp1 siRNA.
Potentially, other members of the Sp transcription factor family may be compensating
for the loss of Sp1 in these experiments.
Finally, because the hdm2-P1 transcript is poorly translated, it is not clear to what
extent it may contribute to the overall levels of Hdm2 protein in unstressed cells.
MCF-7 cells were transfected with siRNAs targeting the unique 5’UTR in the hdm2-
P1 transcript, and the effects compared to an siRNA targeting the Hdm2 coding
sequence. (Fig. 4d). Compared to a control siRNA, Hdm2-CDS siRNA reduced
Hdm2 protein expression by approximately 85 %, and hdm2-P1 siRNA caused a 30%
reduction. This confirms that transcription from the P1-promoter does contribute
significantly to the levels if Hdm2 protein in these cells, and therefore MA is likely to
exert its effects on Hdm2 protein levels by, at least in part, inhibiting transcription
from this promoter.
Regulation of the nuclear export of hdm2 mRNA by MA
The above results do not, however, satisfactorily explain why the large induction in
hdm2-P2 transcripts in MCF-7 cells treated with MA does not result in elevated
Hdm2 protein levels in these cells. Previous studies in our laboratory have indicated
the importance of mRNA trafficking and translation as a regulatable point of control
of Hdm2 protein synthesis (Phelps et al., 2005). We therefore set out to investigate
whether MA affects Hdm2 synthesis at the post-transcriptional level. Cells were
incubated with MA or DMSO carrier control and then subjected to hypotonic lysis
and homogenisation to obtain nuclear and cytoplasmic extracts. The fractionation was
verified by comparison of semi-quantitative PCR detection of the small nuclear RNA
snRNA U6, which is enriched in the nuclear compartment, compared to gapdh mRNA
which is present in both nucleus and cytoplasm. Part of the cytoplasmic extract was
then subjected to separation through 30 % sucrose buffer to isolate polyribosome-
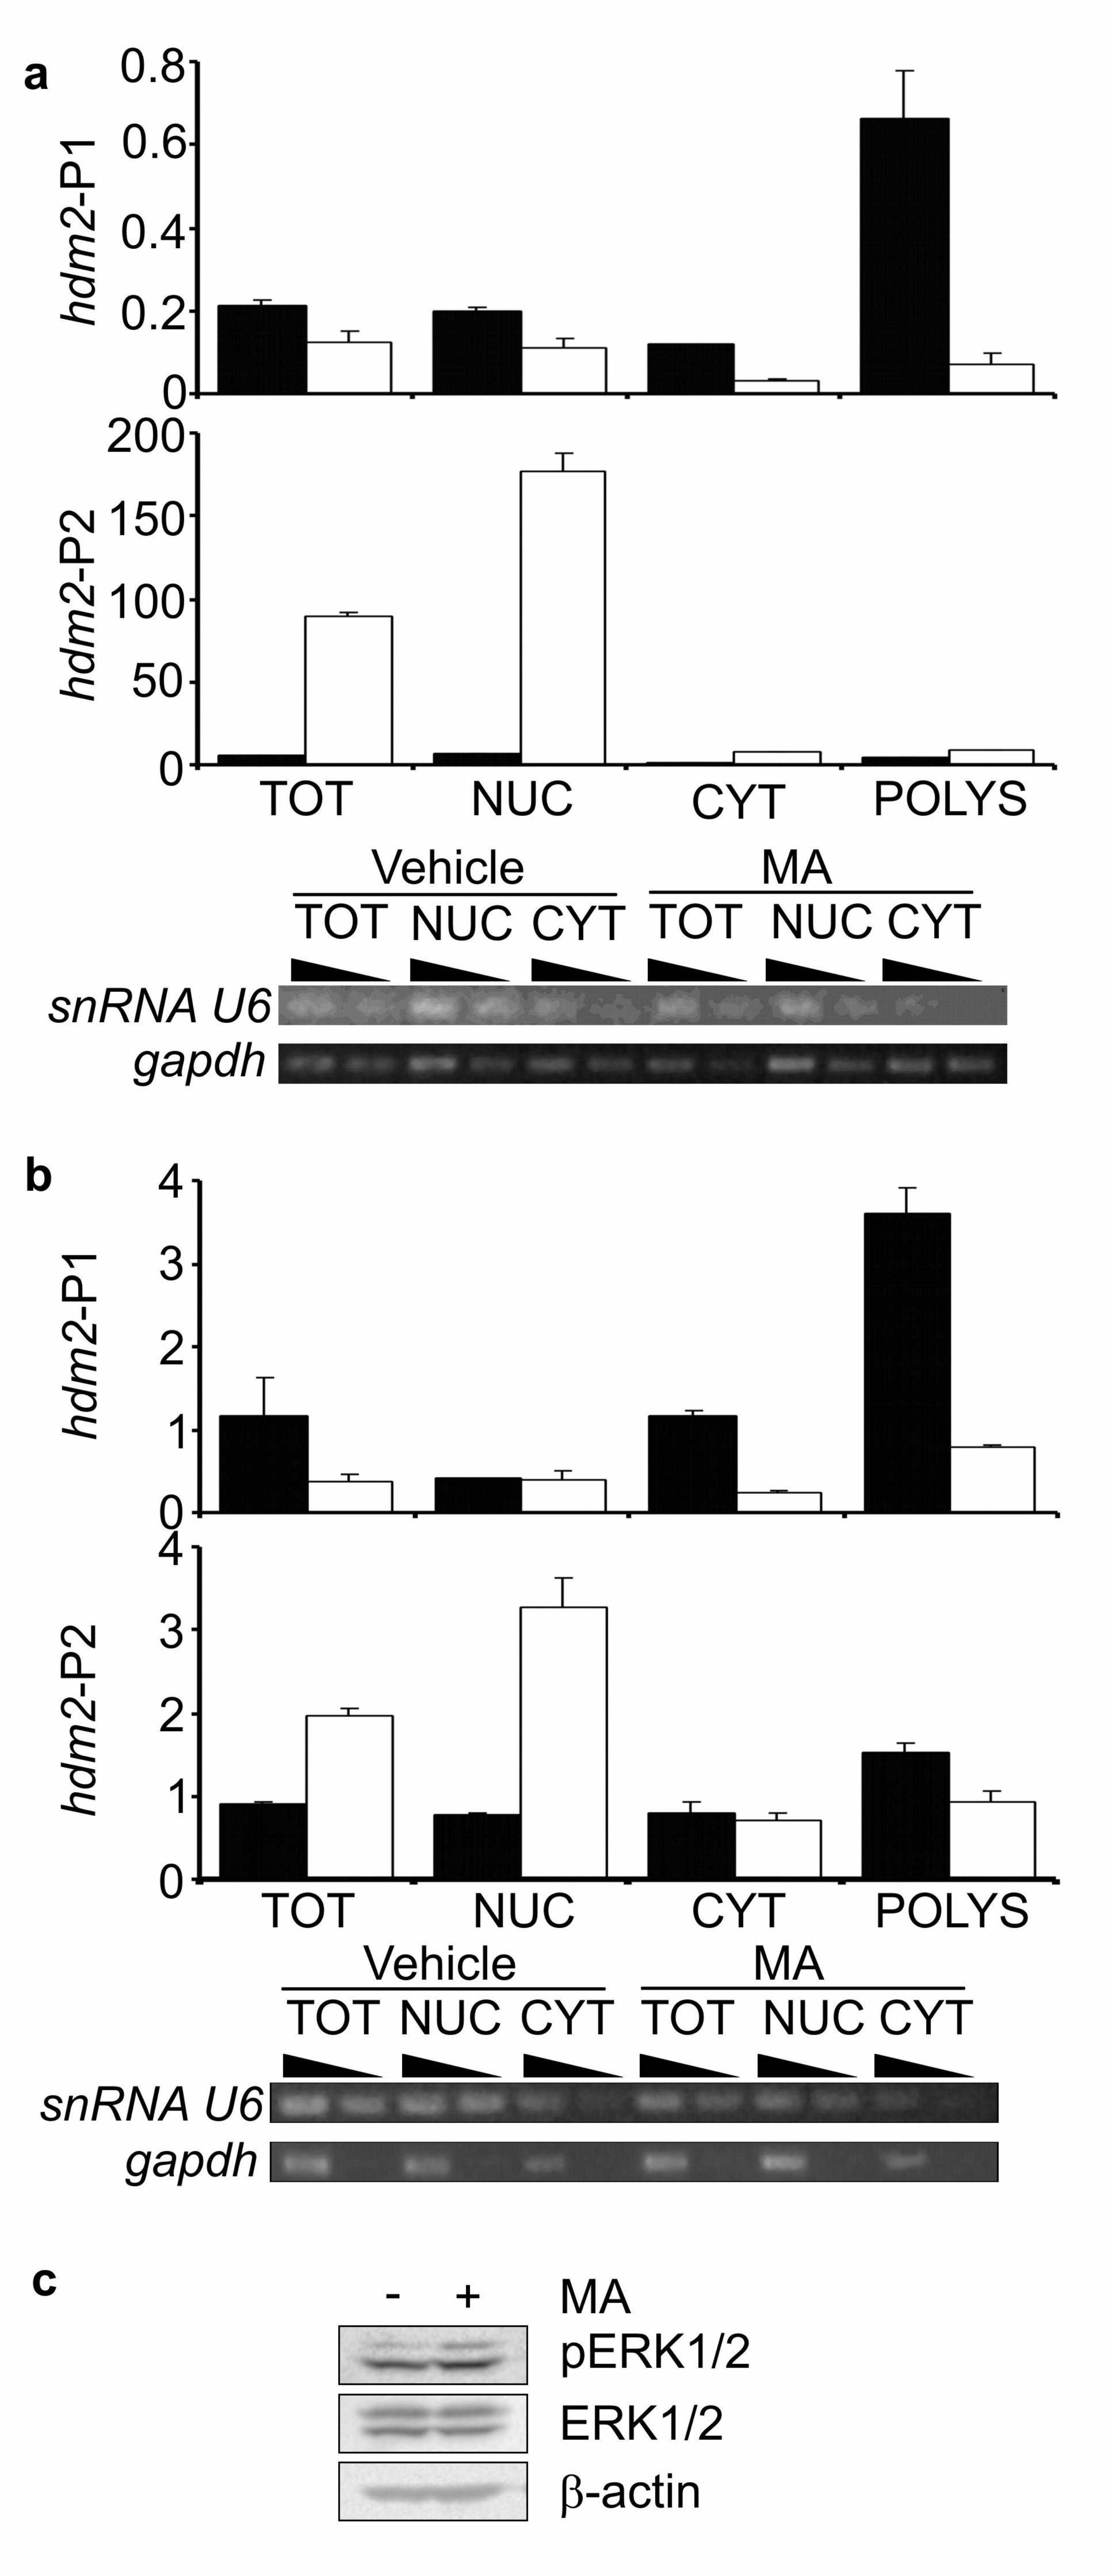
bound mRNA. In MCF-7 cells (Fig. 5a) MA again caused a large induction of P2-
transcript when total cellular RNA was analysed (1530%). However when
cytoplasmic mRNA was analysed, the hdm2-P2 transcript was under represented
relative to gapdh mRNA, compared to the total RNA analysis. Following MA, levels
of cytoplasmic P2-transcript did increase, but the relative increase was only 620%. In
contrast, there was a 2560% increase in the levels of P2-transcript in the nucleus. This
provides strong evidence that MA treatment leads to the preferential retention of
hdm2-P2 transcripts in the nucleus. Furthermore, when the association of P2-
transcripts with polyribosomes was analysed, the increase following MA treatment
was only 213%. In support of these observations, MA caused a reduction in levels of
total hdm2-P1 transcripts in the cells, as before (43%), whereas the reduction in
cytoplasmic P1-mRNA was again greater (83%), indicating that the nuclear export of
this transcript is similarly inhibited. The reduction in polyribosome-associated P1-
transcript was nearly 90%. Overall, the combination of a large reduction in translated
P1 message, with only a small increase in translated P2 message, could account for
the modest decrease in Hdm2 protein levels following exposure of MCF-7 cells to
MA.
Fig. 5b shows that this effect of MA is not restricted to MCF-7 cells, as in MA-treated
T47D cells both P1- and P2- transcripts show an accumulation in the nuclear
compartment, and an up to 50% under-representation in the cytoplasmic RNA,
compared to RNA extracted from whole cells. In T47D cells, there was a reduction in
both P1- and P2- transcripts in the polyribosome fraction following MA treatment,
consistent with the greater effect of the drug on Hdm2 protein synthesis in these cells.
Finally, the effects of MA on the nuclear export of hdm2 mRNA in T47D cells are
similar to the consequences of inhibiting MEK kinase activity that we reported
previously (Phelps et al., 2005). We therefore examined whether inhibition of MEK
kinase activity occurred following 24 h exposure of T47D cells to MA (Fig. 5c). MA
did not affect phosphorylation of ERK1/2 by MEK, demonstrating that MA acts
independently of MEK to inhibit hdm2 mRNA nuclear export.
DISCUSSION
Both the basal and inducible levels of expression of Hdm2 protein are critical in
determining the phenotypic response to cellular stress (Lev Bar-Or et al., 2000; Ma et
al., 2005; Mendrysa et al., 2003; Vogelstein et al., 2000). An inherited polymorphism
in hdm2, can result in variations in radiation responsiveness, and tumour susceptibility
between individuals within a population (Bond et al., 2004; Harris et al., 2005),
tissue-specific pathways which elevate Hdm2 expression may affect the selection
pressure for the acquisition of p53 mutations in different types of cancer (Phelps et
al., 2003; Wynford-Thomas & Blaydes, 1998), tumour associated genetic aberrations
that increase Hdm2 protein levels can promote cancer progression (Momand et al.,
1998; Oliner et al., 1992; Onel & Cordon-Cardo, 2004), and the differential effects of
genotoxic chemotherapeutics on the expression of Hdm2 may contribute to their
ability to induce p53-dependent cell death pathways (Arriola et al., 1999; Inoue et al.,
2001). Therefore it is critically important to understand the mechanistic basis for the
regulation of Hdm2 expression. Mithramycin A is an anti-tumour antibiotic which
inhibits transcription from promoters containing GC rich DNA sequences (Blume et
al., 1991; Miller et al., 1987). MA is licensed for clinical use, and therefore the
elucidation of its mechanisms of action is of interest in that respect (Ferrante et al.,
2004; Remsing et al., 2003). In this report, however, we have focussed on its
application as a useful tool to probe the mechanisms whereby the expression of Hdm2
is regulated in cancer cells.
MA is a potent inducer of sequence-specific DNA-binding competent p53
(Koutsodontis & Kardassis, 2004). The p53 target genes WAF-1 and PUMA are not,
however, induced by MA. This is because p53-dependent transcription of these genes
requires co-operation between p53 and Sp1 transcription factors. MA, by interacting
with GC rich DNA, prevents Sp1 from binding to the WAF-1 and PUMA promoters
(Blume et al., 1991; Koutsodontis & Kardassis, 2004). The hdm2-P2 promoter
contains two adjacent p53-responsive elements in close proximity to the transcription
start site, and is highly sensitive to activation by p53 (Zauberman et al., 1995). Here
we have shown that MA strongly induces expression of the hdm2-P2 transcript in
wild-type p53 expressing cells, and therefore hdm2-P2 promoter activation by p53 is
not Sp1 dependent. This differential dependence on Sp1 for p53-dependent
transcription between hdm2 and certain other p53-responsive genes may potentially
play a role in defining the amplitude and longevity of p53 activation following
distinct stimuli in different cell types.
The hdm2-P2 promoter is also regulated by factors other than p53, the extent of this
p53-independent transcription again being an important regulator of cellular p53
activity (Ries et al., 2000). T47D breast cancer cells, despite expressing functionally
inactive mutant p53, express similar levels of the hdm2-P2 transcript to wild-type p53
expressing MCF-7 cells (Phelps et al., 2003). We have previously shown that the
activity of a hdm2-P2 promoter reporter construct in these cells is partially dependent
on a highly GC rich repetitive sequence, which is a likely binding site for MA.
Subsequently, Bond et al, 2004, showed that T47D cells were homozygous (G/G) for
the SNP309 in the P2-promoter region. They provided compelling evidence that
SNP309 acts to extend an Sp1 site, resulting in increased, Sp1-dependent, activation
of this promoter. To support this interpretation, they showed that MA strongly down-
regulates Hdm2 protein expression in T47D cells, and proposed that this was due to
an inhibition of Sp1-dependent P2-promoter activity by MA in these cells. Here we
show that MA actually causes a modest increase in the levels of P2 transcript in T47D
cells. It is important to note, however, that this does not exclude a role for these GC
rich sequences in the basal activity of the promoter in these cells, as MA may also
prevent transcriptional repressors from binding to the promoter, potentially over-
riding any effects on activation by Sp1, to result in a net up-regulation of activity.
Clearly, however, the down-regulation of Hdm2 protein expression by MA in these
T47D cells in not due to inhibition of transcription from the P2-promoter.
We did however, discover, at least two distinct mechanisms whereby MA does inhibit
the synthesis of Hdm2 protein; inhibition of transcription from the constitutive P1-
promoter, and inhibition of the nuclear export of both P1- and P2- hdm2 mRNA
transcripts. Both of these effects occurred in MCF-7 and T47D cells lines, the less
striking reduction in Hdm2 levels in MCF-7 being accounted for by the MA-induced
up-regulation of p53-dependent P2-promoter activity in these cells. Mechanisms
regulating transcription from the hdm2-P1 promoter have, to date received little
attention. This is primarily because the promoter has not, until recently (Chang et al.,
2004), been show to be regulatable, and also because the transcript is poorly
translated (Brown et al., 1999; Jin et al., 2003). However, murine models have shown
that Mdm2 protein synthesis is dependent almost exclusively on the P1-transcript in
many unstressed normal tissues in vivo (Mendrysa et al., 2003), as well as in tumour
cells in which the mdm2 gene is amplified (Barak et al., 1994). Using siRNA directed
towards the unique 5’ UTR in the P1-transcript, we show here that that transcript does
contribute significantly to the levels of Hdm2 protein in the MCF-7 breast cancer cell
line, though we cannot define the extent of this contribution precisely due to differing
efficacies between siRNAs.
We have defined a 171 b.p. minimal region of the P1-promoter that is required for its
constitutive activity. Further deletions and mutations identified two regions, loss of
either of which results in >80% reduction in promoter activity. These are the 18 b.p.
sequence between -110 and -92, which contains an evolutionarily conserved CCAAT
box, and a GC-rich region, which we have defined as GCII, which is also highly
conserved between human and murine promoters. The residual activity of a reporter
vector in which this GCII element is mutated is insensitive to MA, indicating that this
is the key binding site for MA that is responsible for inhibition of P1-promoter
activity by the drug. Further analysis of the promoter revealed that whilst the above
two regions were essential for promoter activity in all three cells lines examined,
mutation of other sequences had differential effects between cell lines. These included
the 50 b.p. region between -160 and -110, removal of which had no effect in MDA-
MB231 cells, but approximately doubled activity in MCF-7 cells, and the highly
conserved GCIV region immediately 5’ to the transcriptional start sites, deletion of
which either enhanced or reduced activity depending on the cell line examined. These
results demonstrate that, whilst this promoter may be ubiquitously expressed, it is
likely to be regulated by different sets of transcription factors depending on the cell
type. Potentially this may account for our findings (data not shown) that, whilst P1
promoter activity in murine fibroblasts is dependent on an active Akt signalling
pathway (Chang et al., 2004), the >90% reduction of Hdm2 protein levels that results
from 48 h inhibition of Akt activity in MCF-7 cells is not associated with any
decrease in hdm2-P1 transcripts. Further work will be required to determine the extent
to which regulation of transcription from the P1 promoter contributes to the elevated
levels of Hdm2 protein expression in human cancers (Onel & Cordon-Cardo, 2004).
We have demonstrated recently that the export of hdm2 mRNA is a rate-limiting for
the synthesis if Hdm2 protein, and dependent upon the activity of MEK-dependent
signalling pathways (Phelps et al., 2005). We show now that MA treatment also
reduces the cytoplasmic to nuclear ratio of hdm2 mRNA and that this effect
contributes to the reduced rates of Hdm2 protein synthesis in MA treated cells. Of
particular note was our finding that, although MA-induced p53 activation and a strong
up-regulation of hdm2-P2 transcript levels in MCF-7 cells, these transcripts
accumulated to a greater extent in the nucleus, rather than being exported to the
cytoplasm. As a consequence of this, and potentially additional effects of MA on
hdm2 mRNA translation, levels of hdm2-P2 transcripts being actively translated in
polyribosome complexes increased only ~2 fold following MA treatment.
The majority of cellular mRNAs, in the form of ribonucleoprotein complexes, utilise
common pathways for their export from the nucleus to cytoplasm (Erkmann & Kutay,
2004). More recently, however, it has become clear that a subset of cellular mRNAs
utilise more selective processes for their export, through the interaction of RNA
sequences, often in their 3’UTR, with RNA sequence- or structure-selective binding
proteins that direct the export of these mRNAs (Keene, 2003). The translation
initiation factor eIF4E for example has, in addition to its well described role in the
cytoplasm, a nuclear role in the regulation of export of a subset of mRNAs including
cyclin D1 (Culjkovic et al., 2005). This function may be involved in the oncogenic
function of eIF4E, and both this (Kentsis et al., 2004), and possibly other (O'Shea et
al., 2004), selective mRNA export pathways are potential targets for cancer therapy.
The proteins involved in the selective export of hdm2 mRNA remain to be identified,
however our finding that hdm2 mRNA export is not only dependent upon MEK
kinase activity, but is also sensitive to the anti-tumour antibiotic Mithramycin A in a
MEK-independent manner, not only highlight the importance of regulated mRNA
export in controlling Hdm2 synthesis, but should also provide useful in the
elucidation of its mechanism.
MATERIALS AND METHODS
Cell Culture
T47D, MDA-MB231 and MCF-7 breast cancer cell lines were cultured in Dulbecco’s
modified Eagle’s medium (Invitrogen) supplemented with 10 % fetal calf serum
(Autogen Bioclear) as described previously (Phelps et al., 2003). The following
reagents were dissolved in dimethyl sulphoxide (DMSO) at the indicated
concentration before adding to the medium where stated; 200 µM Mithramycin A
(Sigma), 10 mM MG132 (Sigma). Actinomycin D (Sigma) was dissolved in ethanol
at a concentration of 5 mg/ml.
Protein Analysis
Cells were washed with phosphate-buffered saline, pelleted by centrifugation at
1000 X g, snap frozen and stored at -70 °C. Western blotting was performed as
described previously (Phelps et al., 2005), and membranes were probed for Hdm2
(monoclonal antibody 2A9 (Chen et al., 1993)), p53 (DO-1, Serotec), phospho-Thr-
202/Tyr-204 ERK 1 and ERK2 (E10), total ERK1 and ERK2 (both from Cell
Signaling Technology). Equal protein loading was confirmed on all immunoblots
using rabbit anti β-actin antibody (Sigma). Bands were visualised by
chemiluminescence (Supersignal, Pierce) using a Fluor-S MAX system (Bio-Rad).
RNA analysis
RNA extraction from cell pellets was performed using either RNABee (Biogenesis
Inc.) or RNeasy (Qiagen). Semi-quantitative RT-PCR analysis was performed as
described previously (Phelps et al., 2003), using oligo dT (Promega) for the reverse
transcriptase reaction. Primers for amplification of c-myc were c-mycU
5’-CCATCGATTTCTTCCTCATCTTC-3’ and c-mycD
5’-TGAGGAGACACCGCCCAC-3’. Taqman quantitative polymerase chain reaction
(qPCR) analysis of hdm2 transcripts was performed as described previously (Phelps et
al., 2005).
Plasmids
A 1057 b.p. region of the hdm2-P1 promoter (-997 to +61 relative to the major
transcriptional start site) was amplified from normal human genomic DNA and
ligated into pGL3basic using the MluI/XhoI sites (Promega). Mutation of the ATG
codon present in this sequence (+57 to +59) to TTG was introduced using a single
base change in the reverse primer to generate hdm2P1luc01∆ATG. Additional
constructs containing deletions of the hdm2-P1 promoter (luc03 – luc10) were
generated by proof-reading PCR of hdm2P1luc01∆ATG using primers containing
MluI and XhoI sites, followed by ligation into pGL3basic. Analysis of potential
transcription factor binding sites was performed using MatInspector
(www.genomatix.de/cgi-bin/matinspector/matinspector.pl). Further mutations were
introduced using site-directed mutagenesis and all constructs were verified by
sequencing (MWG Biotech). Forward site-directed mutagenesis primers used are as
follows (complementary reverse primers not shown): ∆GCI 5’-
TTGGCGGAAGCGTCTAGACGGTTGTGTGCG-3’; ∆GCII 5’-
GCGCGCSCSSSTTCTAGAGATGCGCCGCGA-3’; ∆GCIII 5’-
CGCGCTCCCCTCTTCTAGAGGTSGGGGGCGC-3’; ∆GCIV 5’-
CTCGGGCGGTAGTCTAGAGCGCACCGAGGC-3’; ∆GCV 5’-
TGGCTGCTTCTGTCTAGACAGAAGCAGCCA-3’; ∆ETSb 5’-
CACAAATGCCCGCTTGCGCCGCGACG-3’; ∆ZF5F 5’-
CCGGTTGTGTGCTCTAGAACAAATGCCCGG-3’.
Transfections
Cells were transfected with reporter vectors using Lipofectamine 2000 reagent
(Invitrogen), and reporter assays were preformed using a Dual-GloTM luciferase assay
(Promega) on cells transfected in 96-well plates, with normalisation to Renilla
luciferase expressed from pRLSV40 (Promega). The normalised data is presented as
relative luciferase units (RLU). For transfection of siRNA, cells in 6-well plates were
transfected with 100 pmol of either control (non-silencing) siRNA or siRNA targeting
different hdm2 transcripts: the coding sequence of hdm2 was targeted using validated
siRNA from Qiagen (Hs_mdm2; will target both P1 and P2 transcripts); hdm2-P1
siRNA was targeted to the following sequence in exon 1, 5’-
AAGATGGAGCAAGAAGCCGAG-3’ (will target hdm2-P1 transcript only). Cells
were harvested and analysed 72 h after transfection.
Cellular Fractionation
Cellular fractionation before RNA extraction or polyribosome analysis was performed
using hypotonic lysis. Cells were washed twice with serum-free medium containing
10 µg/ml cycloheximide, then scraped and pelleted by centrifugation at 365 X g.
Pellets were resuspended in hypotonic lysis buffer (10 mM Tris-HCl pH 7.6, 1 mM
potassium acetate, 1.5 mM magnesium acetate, 2 mM dithiothreitol, 1 unit/µl RNAse
inhibitor) and lysed on ice using a Dounce homogeniser. Lysates were centrifuged at
12 000 X g to separate the cytoplasmic extract from the nuclear pellet. For
polyribosome analysis, aliquots of the cytoplasmic lysates were layered over a
cushion of 30 % sucrose in hypotonic lysis buffer and centrifuged at 130 000 X g for
2.5 h at 4 °C. The supernatant was removed and the remaining polyribosome-bound
RNA pellet was used for RNA extraction.
ACKNOWLEDGEMENTS
We are grateful to Professor Levine for making available antibody 2A9. This work is
supported by a grant from the Association for International Cancer Research (#04-
422).
REFERENCES
Arriola EL, Lopez AR and Chresta CM. (1999). Oncogene, 18, 1081-91.
Ashcroft M, Ludwig RL, Woods DB, Copeland TD, Weber HO, MacRae EJ and
Vousden KH. (2002). Oncogene, 21, 1955-62.
Barak Y, Gottlieb E, Juven-Gershon T and Oren M. (1994). Genes & Dev, 8, 1739-
49.
Blaydes JP and Wynford-Thomas D. (1998). Oncogene, 16, 3317-22.
Blume SW, Snyder RC, Ray R, Thomas S, Koller CA and Miller DM. (1991). J Clin
Invest, 88, 1613-21.
Bond GL, Hu W, Bond EE, Robins H, Lutzker SG, Arva NC, Bargonetti J, Bartel F,
Taubert H, Wuerl P, Onel K, Yip L, Hwang SJ, Strong LC, Lozano G and
Levine AJ. (2004). Cell, 119, 591-602.
Bond GL, Hu W and Levine A. (2005). Cancer Res, 65, 5481-4.
Brown CY, Mize GJ, Pineda M, George DL and Morris DR. (1999). Oncogene, 18,
5631-7.
Chang CJ, Freeman DJ and Wu H. (2004). J Biol Chem, 279, 29841-8.
Chen J, Marechal V and Levine AJ. (1993). Mol Cell Biol, 13, 4107-14.
Culjkovic B, Topisirovic I, Skrabanek L, Ruiz-Gutierrez M and Borden KL. (2005). J
Cell Biol, 169, 245-56.
Erkmann JA and Kutay U. (2004). Exp Cell Res, 296, 12-20.
Feng J, Tamaskovic R, Yang Z, Brazil DP, Merlo A, Hess D and Hemmings BA.
(2004). J Biol Chem, 279, 35510-7.
Ferrante RJ, Ryu H, Kubilus JK, D'Mello S, Sugars KL, Lee J, Lu P, Smith K,
Browne S, Beal MF, Kristal BS, Stavrovskaya IG, Hewett S, Rubinsztein DC,
Langley B and Ratan RR. (2004). J Neurosci, 24, 10335-42.
Harris SL, Gil G, Robins H, Hu W, Hirshfield K, Bond E, Bond G and Levine AJ.
(2005). Proc Natl Acad Sci U S A, 102, 16297-302.
Hsing A, Faller DV and Vaziri C. (2000). J Biol Chem, 275, 26024-31.
Huang Q, Raya A, DeJesus P, Chao SH, Quon KC, Caldwell JS, Chanda SK, Izpisua-
Belmonte JC and Schultz PG. (2004). Proc Natl Acad Sci U S A, 101, 3456-
61.
Inoue T, Geyer RK, Yu ZK and Maki CG. (2001). FEBS Lett, 490, 196-201.
Jin X, Turcott E, Englehardt S, Mize GJ and Morris DR. (2003). J Biol Chem, 278,
25716-21.
Jones SN, Roe AE, Donehower LA and Bradley A. (1995). Nature, 378, 206-8.
Keene JD. (2003). Nat Genet, 33, 111-2.
Kentsis A, Topisirovic I, Culjkovic B, Shao L and Borden KL. (2004). Proc Natl
Acad Sci U S A, 101, 18105-10.
Koutsodontis G and Kardassis D. (2004). Oncogene, 23, 9190-200.
Landers JE, Cassel SL and George DL. (1997). Cancer Res., 57, 3562-8.
Lev Bar-Or R, Maya R, Segel LA, Alon U, Levine AJ and Oren M. (2000). Proc Natl
Acad Sci U S A, 97, 11250-5.
Ma L, Wagner J, Rice JJ, Hu W, Levine AJ and Stolovitzky GA. (2005). Proc Natl
Acad Sci U S A, 102, 14266-71.
Mayo LD and Donner DB. (2001). Proc Natl Acad Sci U S A, 98, 11598-11603.
Meek DW and Knippschild U. (2003). Mol Cancer Res, 1, 1017-26.
Mendrysa SM, McElwee MK, Michalowski J, O'Leary KA, Young KM and Perry
ME. (2003). Mol Cell Biol, 23, 462-72.
Michael D and Oren M. (2003). Semin Cancer Biol, 13, 49-58.
Miller DM, Polansky DA, Thomas SD, Ray R, Campbell VW, Sanchez J and Koller
CA. (1987). Am J Med Sci, 294, 388-94.
Momand J, Jung D, Wilczynski S and Niland J. (1998). Nucleic Acids Res., 26, 3453-
3459.
Momand J, Wu HH and Dasgupta G. (2000). Gene, 242, 15-29.
Montes de Oca Luna R, Wagner DS and Lozano G. (1995). Nature, 378, 203-6.
O'Shea CC, Johnson L, Bagus B, Choi S, Nicholas C, Shen A, Boyle L, Pandey K,
Soria C, Kunich J, Shen Y, Habets G, Ginzinger D and McCormick F. (2004).
Cancer Cell, 6, 611-23.
Oliner JD, Kinzler KW, Meltzer PS, George DL and Vogelstein B. (1992). Nature
(London), 358, 80-3.
Oliner JD, Pietenpol JA, Thiagalingam S, Gyuris J, Kinzler KW and Vogelstein B.
(1993). Nature (London), 362, 857-60.
Onel K and Cordon-Cardo C. (2004). Mol Cancer Res, 2, 1-8.
Phelps M, Darley M, Primrose JN and Blaydes JP. (2003). Cancer Res, 63, 2616-
2623.
Phelps M, Phillips A, Darley M and Blaydes JP. (2005). J Biol Chem, 280, 16651-8.
Qi JS, Yuan Y, Desai-Yajnik V and Samuels HH. (1999). Mol. Cell. Biol., 19, 864-72.
Remsing LL, Gonzalez AM, Nur-e-Alam M, Fernandez-Lozano MJ, Brana AF, Rix
U, Oliveira MA, Mendez C, Salas JA and Rohr J. (2003). J Am Chem Soc,
125, 5745-53.
Ries S, Biederer C, Woods D, Shifman O, Shirasawa S, Sasazuki T, McMahon M,
Oren M and McCormick F. (2000). Cell, 103, 321-330.
Shaulian E, Resnitzky D, Shifman O, Blandino G, Amsterdam A, Yayon A and Oren
M. (1997). Oncogene, 15, 2717-25.
Sherr CJ and Weber JD. (2000). Curr Opin Genet Dev, 10, 94-9.
Slack A, Chen Z, Tonelli R, Pule M, Hunt L, Pession A and Shohet JM. (2005). Proc
Natl Acad Sci U S A, 102, 731-6.
Stommel JM and Wahl GM. (2004). Embo J, 23, 1547-56.
Stott FJ, Bates S, James MC, McConnell BB, Starborg M, Brookes S, Palmero I,
Ryan K, Hara E, Vousden KH and Peters G. (1998). EMBO J., 17, 5001-14.
Thompson JD, Higgins DG and Gibson TJ. (1994). Nucleic Acids Res, 22, 4673-80.
Trotta R, Vignudelli T, Candini O, Intine RV, Pecorari L, Guerzoni C, Santilli G,
Byrom MW, Goldoni S, Ford LP, Caligiuri MA, Maraia RJ, Perrotti D and
Calabretta B. (2003). Cancer Cell, 3, 145-60.
Vassilev LT, Vu BT, Graves B, Carvajal D, Podlaski F, Filipovic Z, Kong N,
Kammlott U, Lukacs C, Klein C, Fotouhi N and Liu EA. (2004). Science, 303,
844-8.
Vogelstein B, Lane D and Levine AJ. (2000). Nature, 408, 307-10.
Wynford-Thomas D and Blaydes J. (1998). Carcinogenesis, 19, 29-36.
Zauberman A, Flusberg D, Barak Y and Oren M. (1995). Nucleic Acids Res., 23,
2584-92.
Zhang T and Prives C. (2001). J Biol Chem, 276, 29702-10.
TITLES AND LEGENDS TO FIGURES
Figure 1. Mithramycin A blocks Hdm2 protein synthesis. (a) T47D cells were
cultured in the presence of the indicated concentration of MA for 24 h before Hdm2
protein levels were determined by Western blotting using 2A9 antibody. As internal
control, the same membrane was re-probed with an antibody to β-actin. (b) T47D
cells were cultured in the presence of 200 nM MA for the indicated time before Hdm2
protein levels were determined by Western blotting using 2A9 antibody. A second
Hdm2 antibody, 2A10, gave similar results (data not shown). (c) T47D cells were
cultured in 5 µg/ml Actinomycin D for the indicated time before RNA was extracted
and semi-quantitative PCR used to determine relative levels of hdm2-P1, hdm2-P2, c-
myc and β–actin transcripts. (d) T47D cells were cultured with DMSO carrier or 200
nM MA for 24 h before 50 µM MG132 was added to the medium to block
proteasome-mediated degradation of Hdm2. Cells were cultured for a further 0-60
min before Hdm2 protein levels were determined by Western blotting.
Figure 2 Mithramycin A inhibits Hdm2 expression in MCF-7 breast cancer cells. (a)
MCF-7 cells were cultured in the presence of DMSO carrier or 200 nM MA for 24 h
before Hdm2 protein levels were determined by Western blotting using 2A9 antibody.
(b) MCF-7 cells were cultured in the presence of DMSO carrier or 200 nM MA for 24
h before total cellular RNA was extracted and analysed by qPCR. hdm2 mRNA levels
were normalised to gapdh housekeeping gene expression, and normalised hdm2
mRNA levels are expressed as percentage of levels in DMSO-treated cells. Open bars,
DMSO-treated; Solid bars, MA-treated. Data are mean ± S.E.M (n=3).
Figure 3 Definition of minimum sequences required for hdm2-P1 promoter activity.
(a) T47D and MDA-MB231 cells were treated and analysed as in Fig 2b. Open bars,
DMSO-treated; Solid bars, MA-treated. Data are mean ± S.E.M (n≥3). (b) MDA-
MB231 cells were transfected with reporter vectors that have progressive truncations
from the 5’ end of Hdm2P1luc01∆ATG, a vector that contains a 1057 b.p. region of
the hdm2-P1 promoter. The 5’ limit compared to the major transcriptional start site is
01 -997, 03 -510, 04 -330, 05 -160, 06 -30. The 3’ end is at +61 in all vectors. Results
are mean RLU ± S.E.M (n=4) expressed as a percentage of Hdm2P1luc01∆ATG. (c)
The human genomic DNA sequence present in the minimally active vector,
Hdm2luc05∆ATG, was aligned with the murine mdm2 P1-promoter region, using
ClustalW (Thompson et al., 1994). Highlighting of conserved regions was performed
using BOXSHADE. The suspected major transcriptional start site in hdm2 is shown
with a black arrow, other potential start sites identified as ESTs are shown as grey
arrows. uORF indicates the position of the ATG that we have mutated. The 5’ end of
the different reporter vectors used is indicated. Matinspector
(http://www.genomatix.de/) was used to identify potential transcription factor binding
sites (Core fit >0.95, Matrix fit >0.925) in the human sequence. Boxed annotations are
positions of potential transcription factor binding sites, or GC rich regions I-V, that
we have modified by site-directed mutagenesis in certain vectors. (d) MDA-MB231
(solid bars) and MCF-7 (open bars) cells were transfected with the indicated reporter
vectors. Results are mean RLU ± S.E.M (n≥4) expressed as a percentage of
Hdm2P1luc05∆ATG. Annotations are: box – exon 1, triangle – CCAAT box, circles
– GC rich regions I-V, X – mutated ATG.
Figure 4 Identification of potential transcription factor binding sites required for P1
promoter activity. (a) MDA-MB231 (solid bars) and MCF-7 (open bars) were
transfected with the reporter vectors shown. Results are mean RLU ± S.E.M (n=4)
expressed as a percentage of P1luc09∆ATG. Annotations are as for Fig. 3d, except
that an open symbol indicates that the site has been mutated. (b) Experiments were
performed exactly as in Fig. 4a, except that T47D cells were also analysed (grey bars)
and different reporter vectors were used. Additional symbols represent ETSa and
ETSb (inverted triangles) and ZF5F (diamond). (c) T47D cells were transfected with
the reporter vector indicated, then cultured for 24 h before assay in the presence of
either DMSO carrier (solid bars) or 200 nM MA (open bars). Results are mean RLU ±
S.E.M (n=2) expressed as a percentage of Hdm2P1luc09∆ATG. (d) MCF-7 cells were
transfected with the indicated siRNA for 72 h before Hdm2 was determined by
Western blotting.
Figure 5 Mithramycin A reduces the export of hdm2 transcripts from the nucleus. (a)
MCF-7 cells were cultured for 24 h in the presence of either DMSO carrier or 200 nM
MA before RNA was extracted from whole cell pellets, nuclear, cytoplasmic or
polyribosomal-associated fractions and levels of hdm2 transcripts analysed by qPCR.
Data are normalised to gapdh. Solid bars, DMSO-treated; Open bars, MA-treated.
Error bars are S.D. of duplicate qPCR assays. Cellular fractionation was validated
using semi-quantitative PCR for snRNA U6 and gapdh. Two PCRs for each fraction
are shown, with a 3-fold difference in the amount of input cDNA to confirm PCRs

have not plateaued. (b) T47D cells were treated and analysed as in Fig 5a. (c) T47D
cells were cultured in the presence of either DMSO carrier or 200 nM MA for 24 h
before the expression of the indicated proteins was determined. p =phosphorylated at
Thr-202/Tyr-204.