the generation of synthetic antibody reagents for ... · the generation of synthetic antibody...
TRANSCRIPT

The Generation of Synthetic Antibody Reagents for Clostridium difficile Toxins
by
Sylvia Cien Man Wong
A thesis submitted in conformity with the requirements for the degree of Master of Science
Graduate Department of Molecular Genetics University of Toronto
© Copyright by Sylvia Wong 2013

ii
The Generation of Synthetic Antibody Reagents for Clostridium
difficile Toxins
Sylvia Cien Man Wong
Master of Science
Graduate Department of Molecular Genetics
University of Toronto
2013
Abstract
The symptoms of C. difficile infection are primarily caused by two toxins, toxin A and toxin B.
Some strains produce a third known toxin, C. difficile transferase (CDT) toxin; however, its role
in virulence remains unclear. I aimed to develop synthetic antibodies using phage display
technology to block toxin entry by binding to the receptor-binding domain (RBD) of the toxins.
I first described the generation of anti-toxin A and anti-toxin B Fabs. I presented Fab A3, which
bound to the full-length toxin, but did not functionally inhibit toxin entry. In chapter 2, I
described the generation of novel anti-CDTb antibodies. I further demonstrated that five of the
anti-CDTb antibodies could functionally inhibit CDTb binding in an ELISA-based assay and on
cultured cells. These antibodies can be used as tools to understand the toxins’ role in human
disease and potentially be used as therapeutics.
iii
Acknowledgments
I am very thankful for having the chance to work with many great scientists in Dr. Jason
Moffat’s and Dr. Sachdev Sidhu’s labs. These people made the lab a very motivating,
supportive, and intellectually stimulating environment, where I was able to learn and expand my
critical thinking skills. Several people that I would like to thank personally are Dewald Van Dyk
who was the first person that taught me everything I need to know about phage display, and
Bryce Nelson, who was always there when I needed to talk, whether it was about experiments or
life decisions. These people have made my graduate experience a wonderful one.
I would like to thank Jason and Dev for their guidance and continual support. Words cannot say
how grateful I am for letting me join their lab. They are indeed the type of employers I would
want to work for in the future. I would also like to thank the lab managers, Linda, Patti, and
Christine for keeping the lab in order. For managing this many people, they are the superheroes
in the lab.
I would like to thank the entire TRAC team for generating the IgGs and Nick Jarvik who
assisted me with obtaining the SPR data on the Fabs and IgG. I would like to thank Sheng Xue
for producing the recombinant extracellular domain of LSR. Most importantly, I would like to
thank my collaborators, Dr. Panagiotis Papatheodorou and Dr. Klaus Aktories, for kindly
providing me with the RBD-CDTb, full-length CDTb, CDTa, CDTb-Dylight 488, and the HeLa
cell lines for the experiments. This project would not exist without their assistance.
Lastly, but most importantly, I would like to thank my loving family and fiancé for being there
for me during my highs and lows since I moved from my hometown. They have given me the
support and strength to continue what I love to do and that is to do good research.

iv
Table of Contents
Acknowledgments ......................................................................................................................... iii
Table of Contents ............................................................................................................................ iv
List of Tables ............................................................................................................................... viii
List of Figures ................................................................................................................................. ix
List of Appendices .........................................................................................................................xii
Table of Abbreviation of Key Terms........................................................................................... xiii
Chapter 1 Introduction ................................................................................................................. 1
1 Introduction ................................................................................................................................. 2
1.1 C. difficile infection (CDI) ................................................................................................... 2
1.2 Clostridium difficile toxins .................................................................................................. 3
1.3 Mode of action of toxin A (TcdA) and toxin B (TcdB) ...................................................... 4
1.4 Mode of action of C. difficile transferase toxin ................................................................... 8
1.5 Lipolysis-stimulated lipoprotein receptor (LSR) ................................................................. 8
1.6 Difficulties in treatment and diagnosis ................................................................................ 9
1.7 Antibodies .......................................................................................................................... 10
1.8 Benefits of antibody treatment against bacterial toxins ..................................................... 12
1.9 Exploiting the filamentous phage lifecycle for phage display .......................................... 12
1.10 Principles of phage display ................................................................................................ 14
1.11 Thesis rationale and objectives .......................................................................................... 17
Chapter 2 Developing high-affinity synthetic human antibodies for toxin A and toxin B ... 18
2 Developing high-affinity synthetic human antibodies for toxin A and toxin B ....................... 19
2.1 Results ............................................................................................................................... 19
2.1.1 Unique clones and binding specificity to recombinant His6-RBD2304–2710-toxin
A and His6 / GST-RBD2286–2366-toxin B ................................................................. 19

v
2.1.2 Affinity measurements of anti-toxin A and anti-toxin B Fabs on RBD of the
toxins by ELISA .................................................................................................... 24
2.1.3 Binding affinity validation of anti-toxin A and anti-toxin B Fabs using SPR ...... 27
2.1.4 Epitope grouping of the Toxin A Fabs, Fab A1 and Fab A3. ................................ 29
2.1.5 Affinity measurements of anti-toxin A Fab A3 on full-length toxin A by
ELISA .................................................................................................................... 30
2.1.6 Cytotoxicity assay .................................................................................................. 31
2.2 Discussion .......................................................................................................................... 32
2.3 Materials and Methods ...................................................................................................... 34
2.3.1 Phagemid plasmid of Library F ............................................................................. 34
2.3.2 Generation of expression plasmids for production of His6-RBD2304–2710 -toxin
A and His6 / GST-RBD2286–2366-toxin B ................................................................ 35
2.3.3 Expression and purification of His6-tagged RBD2304–2710-Toxin A and
RBD2286–2366-Toxin B ............................................................................................ 35
2.3.4 Expression and purification of GST-tagged RBD2286–2366-Toxin B ...................... 36
2.3.5 Western blot for confirmation of RBD2304–2710-toxin A and RBD2286–2366-toxin
B protein preps ....................................................................................................... 36
2.3.6 Phage display ......................................................................................................... 37
2.3.7 Phage-Fab ELISA .................................................................................................. 38
2.3.8 Sanger sequencing for the CDRs of the Fabs ........................................................ 38
2.3.9 Purified Fab generation.......................................................................................... 39
2.3.10 Purified Fab ELISA for direct binding .................................................................. 40
2.3.11 Determination of EC50 for each Fab by generating a binding curve ..................... 40
2.3.12 Competitive ELISA for affinity measurements of Fabs ........................................ 41
2.3.13 Surface Plasmon Resonance .................................................................................. 41
2.3.14 Epitope grouping ................................................................................................... 42
2.3.15 Cytotoxicity assay .................................................................................................. 43
Chapter 3 Developing high-affinity synthetic human antibodies for CDT ............................ 44
vi
3 Developing high-affinity synthetic human antibodies for CDT ............................................... 45
3.1 Results ............................................................................................................................... 45
3.1.1 Identification and binding of CDTb Fabs .............................................................. 45
3.1.2 CDTb-LSR inhibitory properties of CDTb Fabs ................................................... 46
3.1.3 Affinity measurements of CDTb Fabs and IgGs using SPR ................................. 49
3.1.4 Epitope grouping of CDTb affinity reagents ......................................................... 51
3.1.5 Competitive cell binding experiments by flow cytometry .................................... 53
3.1.6 Cytotoxicity assay .................................................................................................. 56
3.1.7 Immunofluorescence on F-actin of CDT and Fab-treated cells............................. 63
3.2 Discussion .......................................................................................................................... 65
3.3 Materials and Methods ...................................................................................................... 69
3.3.1 Recombinant CDTa and CDTb production and purification ................................. 69
3.3.2 Recombinant LSR production and purification ..................................................... 70
3.3.3 Phage display using Library F ............................................................................... 70
3.3.4 ELISA for direct binding using Phage-Fab ........................................................... 70
3.3.5 Sanger sequencing for the CDRs of the Fabs ........................................................ 71
3.3.6 Purified Fab production ......................................................................................... 71
3.3.7 Anti-CDTb IgG1 production ................................................................................. 71
3.3.8 ELISA for direct binding using purified Fabs ....................................................... 72
3.3.9 ELISA-based binding assay of LSR-CDTb interaction......................................... 72
3.3.10 Surface Plasmon Resonance .................................................................................. 73
3.3.11 Epitope grouping ................................................................................................... 73
3.3.12 Cell cultivation....................................................................................................... 73
3.3.13 Whole cell lysate preparation and Western blot .................................................... 73
3.3.14 CDTb-Dylight 488 inhibition on cells by flow cytometry .................................... 74
3.3.15 Cytotoxicity assay .................................................................................................. 75

vii
3.3.16 Dose-response curve of antibodies in cytotoxicity assay ...................................... 75
3.3.17 Time-course for the cytotoxicity assay using IgGs ............................................... 76
3.3.18 Immunofluorescence.............................................................................................. 76
Chapter 4 Conclusions ................................................................................................................ 77
4 Conclusions ............................................................................................................................... 78
4.1 Summary ............................................................................................................................ 78
4.2 Future experiments for CDTb antibodies .......................................................................... 79
4.3 Factors to consider for therapeutic use .............................................................................. 80
4.4 Final remarks ..................................................................................................................... 81
References ..................................................................................................................................... 83
Appendices ................................................................................................................................... 98
viii
List of Tables
Table 2.1 EC50 values from the binding curves of toxin A and B Fabs.. ...................................... 25
Table 2.2 Estimated affinities from the competitive ELISAs of toxin A and B Fabs.. ................. 27
Table 2.3 Surface plasmon resonance data for toxin A and B Fabs.. ............................................ 28
Table 3.1 Surface plasmon resonance data for CDTb Fabs. ........................................................ 49
Table 3.2 Surface plasmon resonance data for CDTb IgGs. ......................................................... 50

ix
List of Figures
Figure 1.1 Domain organization of the large clostridial toxins (LCT), TcdA and TcdB, and the
binary toxin, CDT. ........................................................................................................................... 5
Figure 1.2 Mechanism of LCT entry.. ............................................................................................. 6
Figure 1.3 Mechanism of CDT entry.. ............................................................................................. 7
Figure 1.4 Domain organization of LSR.. ....................................................................................... 9
Figure 1.5 Schematic of IgG structure.. ......................................................................................... 11
Figure 1.6 The lifecycle of filamentous phage.. ............................................................................ 13
Figure 1.7 Phagemid vector for phage display. ............................................................................ 15
Figure 1.8 Antibody selection from M13 bacteriophage libraries. ................................................ 16
Figure 2.1 Western blots on the RBD2304–2710-toxin A and RBD2286–2366-toxin B recombinant
proteins.. ........................................................................................................................................ 20
Figure 2.2 Graph of the ELISA data of the binding specificity of phage-Fabs against RBD
fragments of toxin A and toxin B recombinant proteins. .............................................................. 21
Figure 2.3 Graph of the ELISA data of the binding specificity of the purified Fabs against His6-
tagged RBD fragments of toxin A and toxin B recombinant proteins.. ........................................ 22
Figure 2.4 Graph of the ELISA data of the binding specificity of the purified toxin B Fabs
against GST-tagged RBD fragments of toxin B recombinant protein.. ......................................... 23
Figure 2.5 ELISA data on cross-reactive Fabs.. ............................................................................ 24
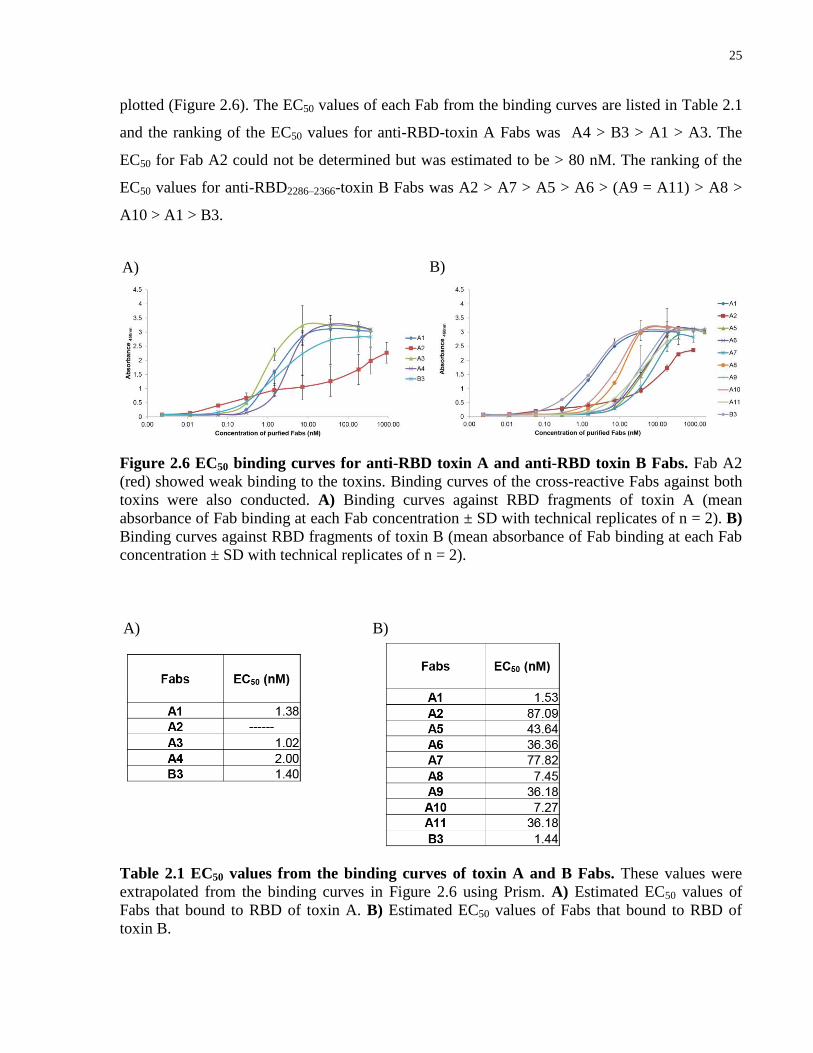
Figure 2.6 EC50 binding curves for anti-RBD toxin A and anti-RBD toxin B Fabs.. ................... 25
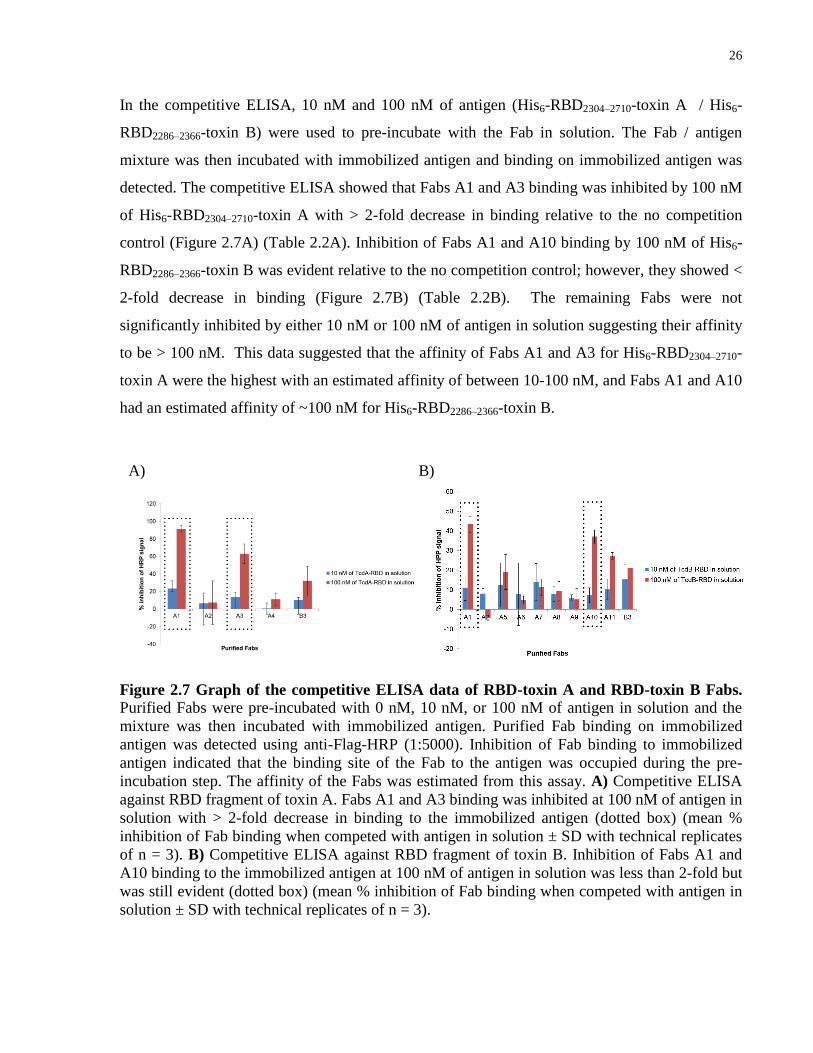
Figure 2.7 Graph of the competitive ELISA data of RBD-toxin A and RBD-toxin B Fabs.. ....... 26
x
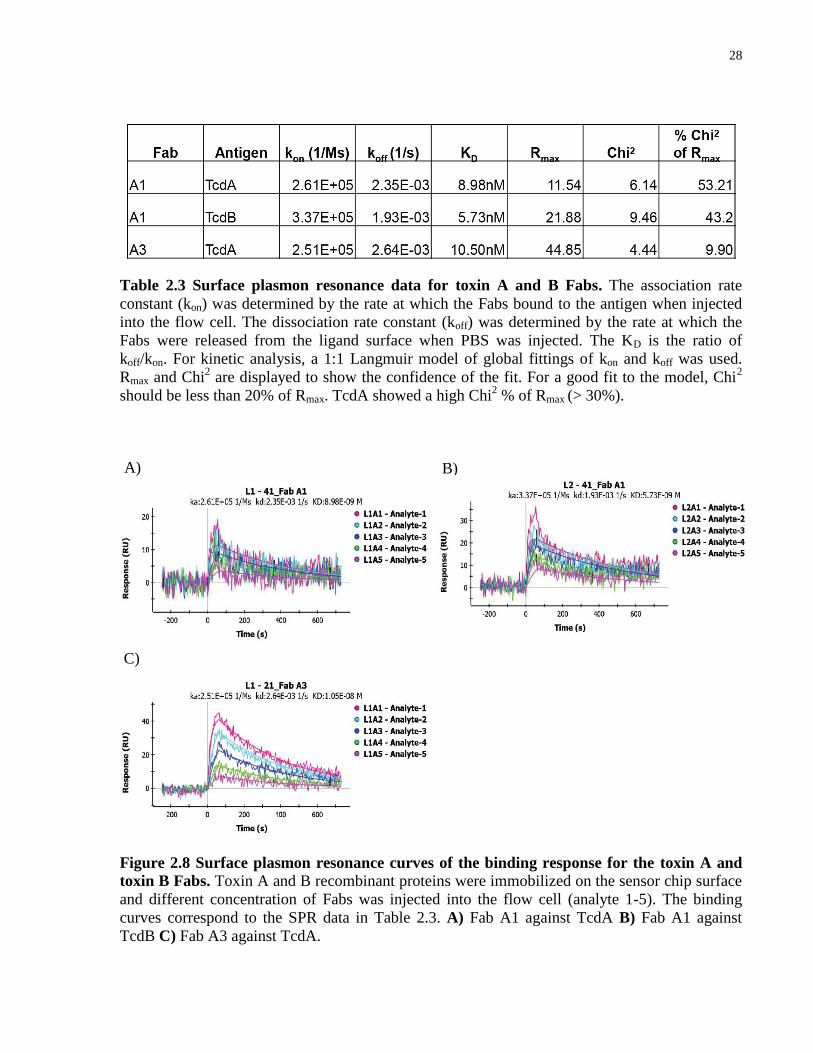
Figure 2.8 Surface plasmon resonance curves of the binding response for the toxin A and toxin
B Fabs.. .......................................................................................................................................... 28
Figure 2.9 Epitope grouping of Fab A1 and A3.. .......................................................................... 29
Figure 2.10 ELISA data for the binding specificity of Fab A1 and A3 against full-length toxin A
and toxin B. .................................................................................................................................... 30
Figure 2.11 EC50 and competitive ELISA binding curves of Fab A3 against full-length toxin A..31
Figure 3.1 Binding specificities of phage-Fabs and purified Fabs against CDTb.. ....................... 46
Figure 3.2 Determination of CDTb concentration to use in the ELISA-based in vitro binding
assay.. ............................................................................................................................................. 47
Figure 3.3 Data of the ELISA-based in vitro binding assay.. ........................................................ 48
Figure 3.4 Surface plasmon resonance curves of the binding response for CDTb Fabs.. ............. 50
Figure 3.5 Surface plasmon resonance curves of the binding response for the CDTb IgGs.. ....... 51
Figure 3.6 Epitope grouping of CDTb antibodies. ........................................................................ 52
Figure 3.7 Schematic of the flow cytometry assay for determining CDT inhibition on cells and
western blot of LSR expression.. ................................................................................................... 53
Figure 3.8 Flow cytometry of CDTb-Dylight 488 binding on HeLa (+LSR) cells when treated
with Fabs.. ...................................................................................................................................... 54
Figure 3.9 Flow cytometry of CDTb-Dylight 488 binding on HCT116 cells when treated with
Fabs.. .............................................................................................................................................. 55
Figure 3.10 Flow cytometry of CDTb-Dylight 488 binding on HeLa (+LSR) cells when treated
with IgGs.. ..................................................................................................................................... 55
Figure 3.11 Flow cytometry of CDTb-Dylight 488 binding on HCT116 cells when treated with
IgGs................................................................................................................................................ 56
xi
Figure 3.12 Cell viability dose-response curve of HeLa (+LSR) and HCT116 cells when
treated with decreasing amount of CDT.. ...................................................................................... 57
Figure 3.13 Images of cells from the cytotoxicity assay that were treated with Fabs. .................. 58
Figure 3.14 Images of cells from the cytotoxicity assay that were treated with IgGs.. ................. 59
Figure 3.15 Cell viability measurements from the cytotoxicity assays. ........................................ 60
Figure 3.16 Cell viability dose-response curve of HeLa (+LSR) and HCT116 cells when treated
with 1 nM of CDT and decreasing concentration of Fabs. ............................................................ 61
Figure 3.17 Cell viability dose-response curve of HeLa (+LSR) cells when treated with 1 nM of
CDT and decreasing concentration of IgGs................................................................................... 62
Figure 3.18 Time course for CDT intoxication on HeLa (+LSR) cells with anti-CDTb IgG
treatments.. ..................................................................................................................................... 63
Figure 3.19 Immunofluorescence images of F-actin stained HeLa (+LSR) cells after anti-CDTb
Fab and CDT (CDTb and CDTa) treatments. ................................................................................ 64
Figure 3.20 Immunofluorescence images of F-actin stained HCT116 cells after anti-CDTb Fab
and CDT (CDTb-Dylight 488 and CDTa) treatments ................................................................... 65
Figure 3.21 Hypothetical scenarios for binding in the epitope grouping ELISA data. ................. 67

xii
List of Appendices
Appendix A: CDR sequences of the antibodies………………………………………………..98
Appendix B: Primer list ……………………………………………………………………….103
Appendix C: Absorbance fold change between target protein and controls in ELISAs……….106
Appendix D: Vector maps……………………………………………………………………..108

xiii
Table of Abbreviation of Key Terms
Abbreviation Full name / definition
BSA Bovine serum albumin
CDI C. difficile infection
CDR Complementarity determining region
CDT C. difficile transferase (binary toxin)
CDTa Enzymatic component of CDT
CDTb Receptor-binding component of CDT
ECD Extracellular domain
EC50 of antibody Half-maximal effective concentration of an antibody, which can bind to the
antigen
EDTA Ethylenediaminetetraacetic acid
ELISA Enzyme-linked immunosorbent assay
Fab Antigen-binding fragment / fragment antigen binding
Fc Fragment crystallizable region
GST Glutathione S-transferase
HCT116 Human colorectal carcinoma cells
IF Immunofluorescence
Ig Immunoglobulin
LCT Large clostridial toxin
xiv
LSR Lipolysis-stimulated lipoprotein receptor
NA Neutravidin
PBS Phosphate buffered saline
RBD Receptor-binding domain
SA Streptavidin
scFv Single-chain variable fragment
SPR Surface plasmon resonance
TcdA Gene for toxin A
TcdB Gene for toxin B
VH Variable heavy chain
VH1, VH2, VH3 Complementarity determining regions of the variable heavy chain
VL Variable light chain
VL1, VL2, VL3 Complementarity determining regions of the variable light chain

1
Chapter 1 Introduction
2
1 Introduction
1.1 C. difficile infection (CDI)
Clostridium difficile is a gram-positive, spore-forming bacterium that infects the epithelial cells
of the lower intestine and is usually transmitted via the fecal-oral route from patients[1],
healthcare workers, and / or contaminated surfaces[2-4]. C. difficile infection (CDI) commonly
occurs in the elderly, immunocompromised patients, and patients undergoing antibiotic therapy
unrelated to CDI[5-7].
C. difficile is becoming one of the most problematic pathogens in hospital settings because
antibiotics such as clindamycin, penicillins, cephalosporins and fluoroquinolones can deplete the
intestinal microflora that normally prevents the invasion of certain pathogenic bacteria[5,8,9].
This imbalance allows C. difficile to overgrow and release toxins that cause the symptoms of the
disease[7,10,11]. Overuse of antibiotics is also a problem, especially for patients who are
prescribed broad-spectrum antibiotics as the first choice of antibiotics for treating unknown
infections[10-12].
Approximately 5-10% of hospital patients infected with toxigenic strains of C. difficile are
asymptomatic but the typical symptoms of CDI include watery diarrhea, fever, abdominal pains,
and in severe cases life-threatening pseudomembranous colitis[13-18]. Since its discovery in
1935, hospital outbreaks of CDI have increased worldwide, and it was reported in 2007 that
more than $3.2 billion per year was spent in healthcare for the diagnosis and treatment of CDI in
the US alone[19,20]. Severity and recurrence of the disease is increasing in frequency, caused
either by reinfection with a new strain of C. difficile or incomplete eradication of the bacterial
spores from a previous infection[6].The BI/NAP1/027 strain of C. difficile has been associated
with majority of the outbreaks worldwide[9,21,22]. In a recent survey, BI/NAP1/027 comprised
53% of 155 C. difficile isolates in the data collected from 16 outbreaks in Ontario. This strain is
also associated with the continual relapse of the disease[23].
3
1.2 Clostridium difficile toxins
The symptoms of the disease are caused by the release of toxins from the bacteria during the late
log growth phase[10,24]. There are three known toxins produced by C. difficile: two large
clostridial toxins, toxin A (TcdA), toxin B (TcdB), and some strains produce a binary toxin
called the C. difficile transferase (CDT) toxin[13], with most disease-causing strains of C.
difficile producing both TcdA and TcdB[10,13,25]. Infections from the BI/NAP1/027 strain are
particularly severe due to a mutation in the loci that regulates the expression of toxins A and B,
which effectively causes overexpression of the toxins[22]. TcdB is 1000 times more toxic than
TcdA in toxicity assays on cultured cells[26,27]; however, it is unclear which toxin is more
essential for causing symptoms associated with infection. It was once thought that the presence
of both TcdA and TcdB cause synergistic damage to the colon but TcdB requires TcdA to initiate
tissue damage [28,29]; however, upon closer examination of A-B
+ strains, it was found that A
-B
+
strains caused disease with the same or increased severity compared to A+B
+ strains[26,30-32].
Furthermore, the A-B
+ strain has been associated with at least 4 outbreaks[24,31,33-35], but it is
not clear whether or not CDT also contributed to these outbreaks.
Less than 15%[36-39] of clinical C. difficile isolates produce CDT with only 2-8%[40,41]
producing CDT alone. The role of this toxin in virulence and pathogenicity remains unclear.
However, there is some speculation that CDT may play a role in virulence, since 65% of the C.
difficile clinical isolates identified during an outbreak in Pittsburgh produce CDT[42]. In an
examination of strains that are A-B
-CDT
+, these strains caused enterotoxic effects and
nonhemorrhagic fluid responses in the rabbit ileal loop test [43]. In contrast, A-B
-CDT
+ strains
did not cause disease or death when the hamsters were challenged with the strain, even though
there was normal colonization of the bacteria [43]. A recent study suggests that CDT aids and
increases C. difficile adherence on intestinal cells by changing the morphology of the colon cells
to form microtubule protrusions[44]. Additionally, the BI/NAP1/027 strain also produces the
binary toxin. Since this strain produces all three toxins, it suggests that CDT may have some role
in infection, and thus, preventing the toxin entry of CDT might decrease C. difficile adherence
and colonization.

4
1.3 Mode of action of toxin A (TcdA) and toxin B (TcdB)
The two large clostridial toxins, TcdA and TcdB, share 47% sequence identity and 63%
sequence similarity[13,28,45]. The two toxins have similar structure and four of the same
domains: 1) a glucosyltransferase domain, which is the enzymatic component of the toxin and is
located at the N-terminus, 2) a cysteine protease domain, 3) a hydrophobic insertion domain, and
4) a receptor-binding domain (RBD), which is located at the C-terminus (Figure 1.1A)[45-47].
Once toxins A and B are secreted from C. difficile, they enter epithelial cells by binding to a
currently unknown receptor through their receptor-binding domain[48] and are consequently
endocytosed to form an endosome[13]. It has been suggested that the low pH environment within
the endosome induces the formation of a pore through the hydrophobic insertion domain while
the catalytic component of the toxin, the glucosyltransferase domain, is cleaved by the cysteine
protease and released through the pore into the cytosol of the cell (Figure 1.2)[49-53].
Once the glucosyltransferase domain enters the cytosol, it inhibits Rho GTPases (Rho, Rac, and
Cdc42) via glucosylation of the Thr37 residue within the pocket of Rho-GDP and prevents it
from becoming activated by guanine-nucleotide-exchange factors (GEF) (Figure 1.2)[54-56].
Rho GTPases regulate many cellular processes including cell polarity, cell adhesion, and the
assembly of the cellular cytoskeleton [57]. Inhibition of Rho GTPases causes disruption of the
cytoskeleton and in turn causes cell rounding and cell death[13]. The intestinal epithelium
contains tight junctions that regulate the permeability of ions, water, and macromolecules and
serves as a barrier for the diffusion of these molecules. The disruption of the cytoskeleton caused
by the toxins compromises the integrity of the tight junctions, and the resulting imbalance of
electrolytes causes symptoms typical of CDI including diarrhea[58,59].
Although the host receptor of toxins A and B remains unknown, several studies have found that
the toxins bind to carbohydrate-containing receptors such as Gal-α-(1,3)-Gal-ß-(1,4)-GlcNAc
and N-acetylglucosamine glycoproteins[60-63]. These receptors, however, are present in various
animal models but absent in human, and identification of the human receptor remains to be
discovered.
5
A)
B)
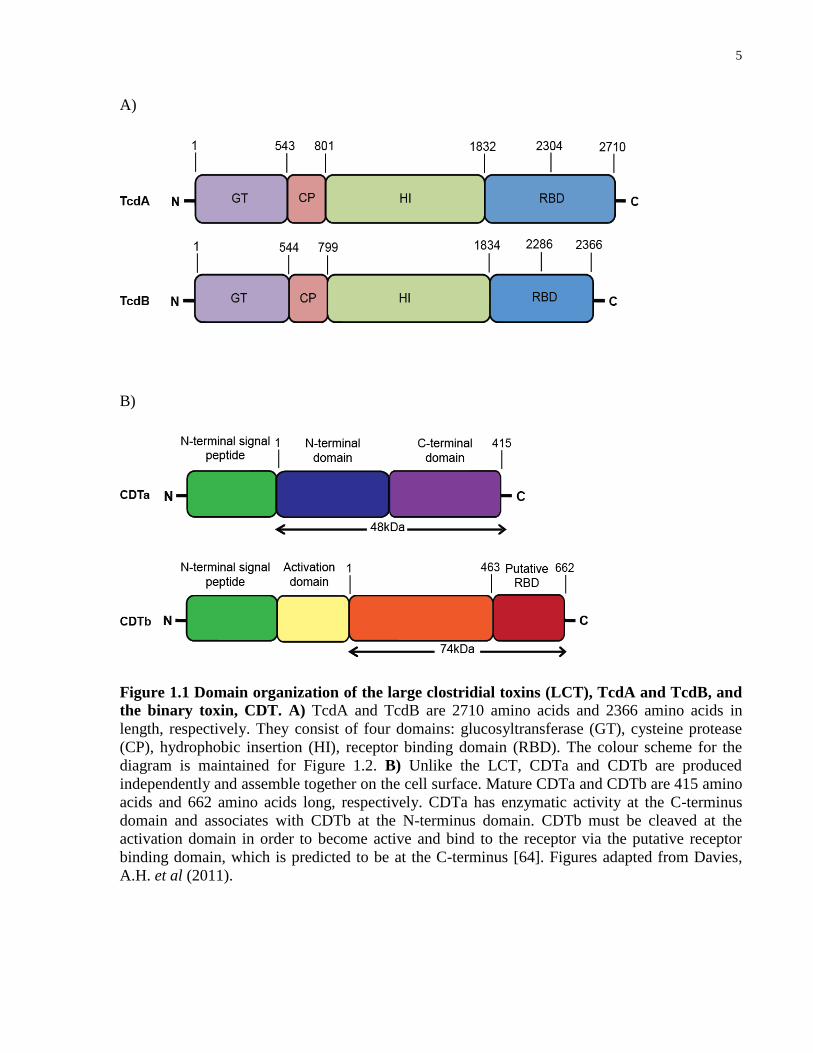
Figure 1.1 Domain organization of the large clostridial toxins (LCT), TcdA and TcdB, and
the binary toxin, CDT. A) TcdA and TcdB are 2710 amino acids and 2366 amino acids in
length, respectively. They consist of four domains: glucosyltransferase (GT), cysteine protease
(CP), hydrophobic insertion (HI), receptor binding domain (RBD). The colour scheme for the
diagram is maintained for Figure 1.2. B) Unlike the LCT, CDTa and CDTb are produced
independently and assemble together on the cell surface. Mature CDTa and CDTb are 415 amino
acids and 662 amino acids long, respectively. CDTa has enzymatic activity at the C-terminus
domain and associates with CDTb at the N-terminus domain. CDTb must be cleaved at the
activation domain in order to become active and bind to the receptor via the putative receptor
binding domain, which is predicted to be at the C-terminus [64]. Figures adapted from Davies,
A.H. et al (2011).
6
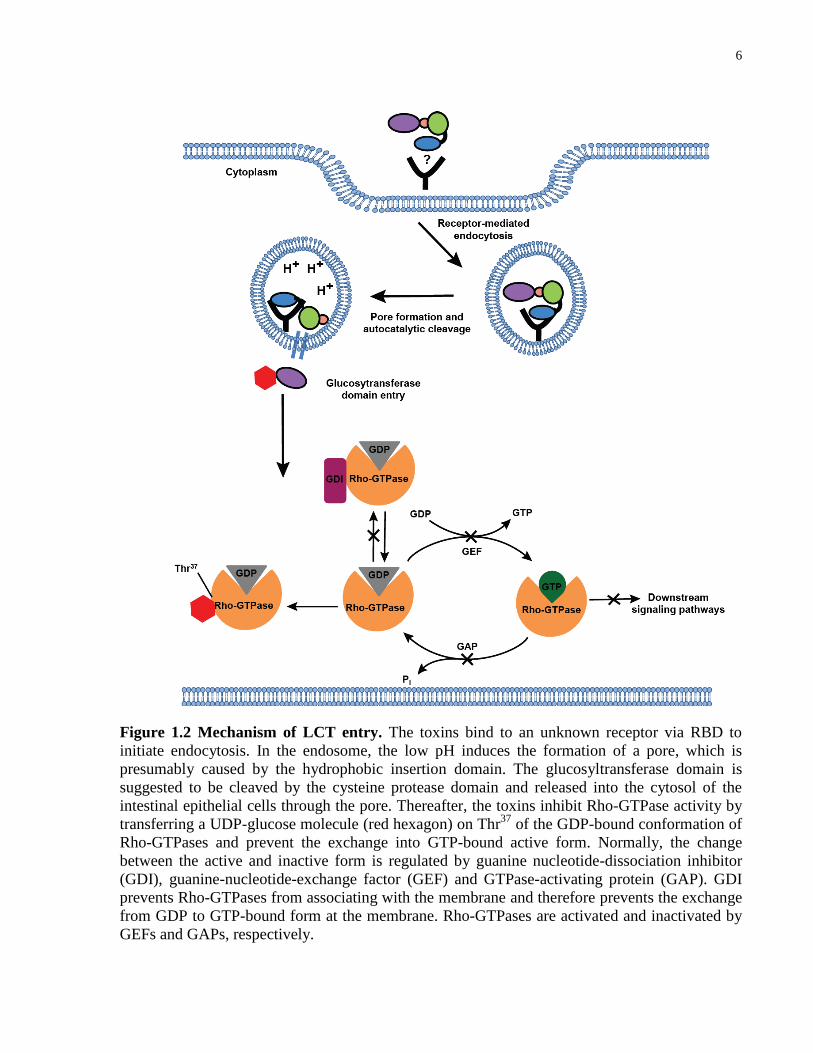
Figure 1.2 Mechanism of LCT entry. The toxins bind to an unknown receptor via RBD to
initiate endocytosis. In the endosome, the low pH induces the formation of a pore, which is
presumably caused by the hydrophobic insertion domain. The glucosyltransferase domain is
suggested to be cleaved by the cysteine protease domain and released into the cytosol of the
intestinal epithelial cells through the pore. Thereafter, the toxins inhibit Rho-GTPase activity by
transferring a UDP-glucose molecule (red hexagon) on Thr37
of the GDP-bound conformation of
Rho-GTPases and prevent the exchange into GTP-bound active form. Normally, the change
between the active and inactive form is regulated by guanine nucleotide-dissociation inhibitor
(GDI), guanine-nucleotide-exchange factor (GEF) and GTPase-activating protein (GAP). GDI
prevents Rho-GTPases from associating with the membrane and therefore prevents the exchange
from GDP to GTP-bound form at the membrane. Rho-GTPases are activated and inactivated by
GEFs and GAPs, respectively.
7
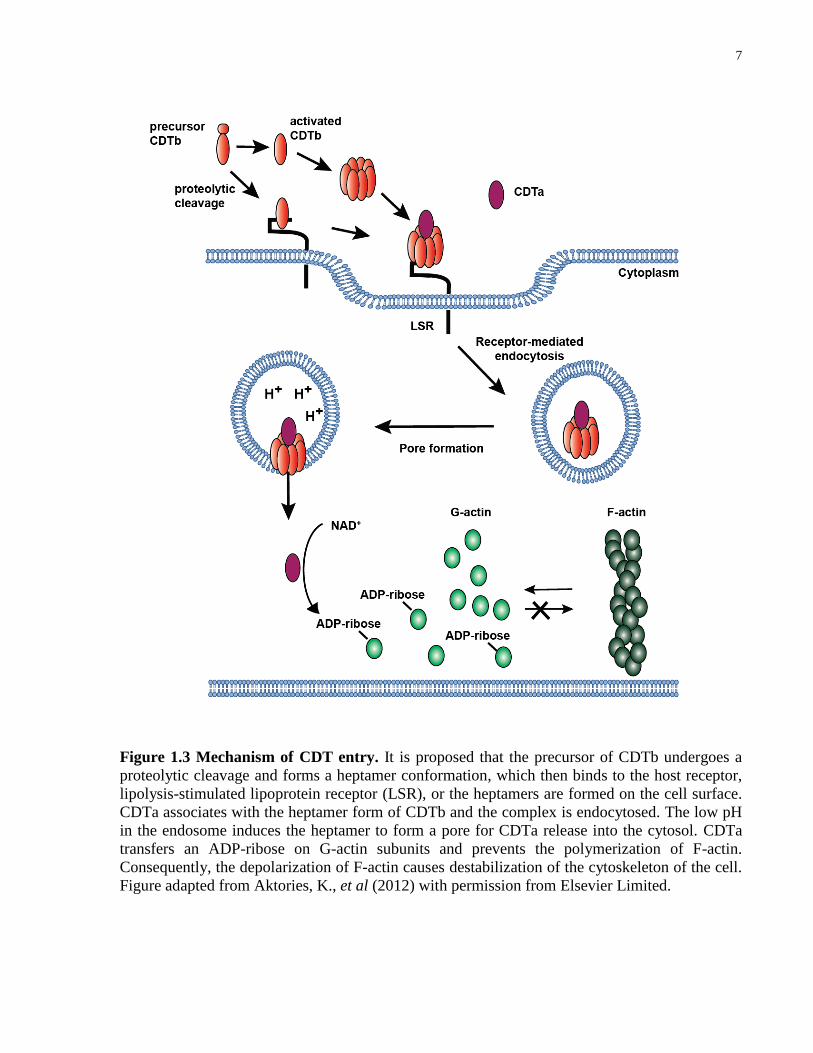
Figure 1.3 Mechanism of CDT entry. It is proposed that the precursor of CDTb undergoes a
proteolytic cleavage and forms a heptamer conformation, which then binds to the host receptor,
lipolysis-stimulated lipoprotein receptor (LSR), or the heptamers are formed on the cell surface.
CDTa associates with the heptamer form of CDTb and the complex is endocytosed. The low pH
in the endosome induces the heptamer to form a pore for CDTa release into the cytosol. CDTa
transfers an ADP-ribose on G-actin subunits and prevents the polymerization of F-actin.
Consequently, the depolarization of F-actin causes destabilization of the cytoskeleton of the cell.
Figure adapted from Aktories, K., et al (2012) with permission from Elsevier Limited.
8
1.4 Mode of action of C. difficile transferase toxin
C. difficile transferase toxin is a binary toxin produced as two independent components, CDTa
and CDTb with a molecular weight of ~48 kDa and ~99 kDa, respectively[65,66]. CDTa is the
catalytic component of the toxin and associates with the receptor-binding component, CDTb,
through its N-terminal region[67]. The C-terminal region of CDTa contains the enzymatic
activity of the toxin (Figure 1.1B)[67].
The mechanism of CDT entry is similar to toxins A and B, where CDTb binds to a receptor to
initiate toxin entry[13,65,68]. However, prior to CDTb binding, it must be activated by
proteolytic cleavage at the N-terminus which subsequently produces a ~74 kDa protein. The
activation of CDTb results in formation of a heptamer either in solution, which then interacts
with the receptor, or forms a heptamer on the cell surface (Figure 1.3). After CDTb binds to the
receptor, CDTa associates with CDTb and both components enter the cell via endosomes. The
low pH in the endosome induces pore formation and only CDTa enters the cytosol of the host
cell[65,68]. Thereafter, CDTa inhibits the polymerization of G-actin to F-actin by irreversibly
transferring an ADP-ribose from NADP / NAD+ to the monomeric G-actin, presumably on
Arg177
[13,69,70]. The imbalance of the ratio between G-actin and F-actin consequently causes
disruption of the cytoskeleton leading to cell rounding and eventual cell death[69-71].
1.5 Lipolysis-stimulated lipoprotein receptor (LSR)
Using a haploid genetic screen developed by Dr. Thijn Brummelkamp[72], Papatheodorou et al.
discovered that lipolysis-stimulated lipoprotein receptor (LSR) is the host receptor of CDT[73].
LSR is a single-pass membrane receptor that contains an Ig-like V-type domain located at the N-
terminal region of the extracellular domain (Figure 1.4). It is a complex multimeric protein that
consists of α or α1 subunits that associate with two or three β subunits through disulfide
bonds[74]. The receptor is present predominantly in the liver[74-76] but also moderately
expressed throughout the gastrointestinal tract and in the pancreas.
In the presence of free fatty acids (FFA), particularly oleate, the receptor undergoes a reversible
conformational change to enable binding to its natural ligands, lipoproteins ApoE and
ApoB[77,78]. Lipoprotein binding induces receptor-mediated endocytosis, which delivers the

9
lipoprotein to the lysosome for degradation[77]. The specific site to which CDT binds to LSR
and whether the binding site is similar to that of the lipoproteins are not clearly defined but it is
likely that it associates with the Ig-like V type domain of the receptor that occupies the majority
of the extracellular domain (Figure 1.4)[73]. Interestingly, it is suggested that LSR plays an
important role in the formation of tricellular tight junctions[79,80]. Whether CDT binding causes
the impairment of the receptor and further decreases the integrity of the tight junctions that leads
to diarrhea in CDI is unknown and must be further investigated. It has also recently been shown
that binary toxins produced by other clostridial species such as Clostridium spiroforme and
Clostridium perfringens can bind to LSR[73,81].
Figure 1.4 Domain organization of LSR. LSR is a 71 kDa single-pass membrane receptor that
contains an Ig-like V-type domain located in the extracellular domain, a transmembrane domain
(TM) for membrane insertion, and an intracellular domain.
1.6 Difficulties in treatment and diagnosis
As of today, diagnosis and treatment of C. difficile infection remains difficult. The first line of
treatment for non-severe CDI includes discontinuing use of C. difficile-associated antibiotics
such as clindamycin and penicillins in preference for the administration of oral metronidazole
and vancomycin[9,82]. However, patients are becoming less responsive to these antibiotics,
especially those that are infected with the hypervirulent strain, BI/NAP1/027, with patients
becoming more prone to relapse of the disease after initial improvement from the antibiotic
treatments[6,9,20-22]. In severe cases, the colon must be removed, particularly in patients that
have repeated relapses of the disease and develop pseudomembranous colitis[83,84].
Fecal transplantation is reported to be an effective treatment that has only recently been widely
recognized and is slowly gaining acceptance in hospitals[85-90]. In this procedure, feces from a
10
healthy relative are transplanted to the colon of the infected patient via enema, gastroscope tube,
or nasojejunal tube in order to replenish the microflora in the lower intestine. Various clinical
studies have shown that the treatment has a high efficacy with 91% (n = 159) of reported cases of
recurrent CDI cured when treated with this procedure[9,89,91], and patients that undergo the
fecal transplantation procedure do not develop significant adverse side effects[92]. Although this
is an effective treatment, there are limitations in these studies that need to be improved or
addressed; a standard optimized protocol for fecal transplantation is currently unavailable, and
factors such as the volume of fecal matter being transplanted, the route of donor-feces infusion,
and the combined effects of other treatments in combination with fecal infusion in the procedures
were not standardized between each study[91]. Further studies need to be performed to assess the
risks of contracting additional infections.
The standard diagnostic tests used in hospitals for CDI diagnosis primarily rely on detection of
toxins in patients’ stools; however several of these tests either have slow turnaround time such as
the cell cytotoxic test, are expensive, insensitive, non-specific, and/or labor intensive[9,93].
Enzyme immunoassay (EIA), as an example, provides a fast test for detecting the toxins using
antibodies but is insensitive and may provide a false-negative result[9,93]. Developing higher
affinity antibodies directed towards both toxin A and B for EIA can provide a better detection
system for the diagnosis of CDI.
1.7 Antibodies
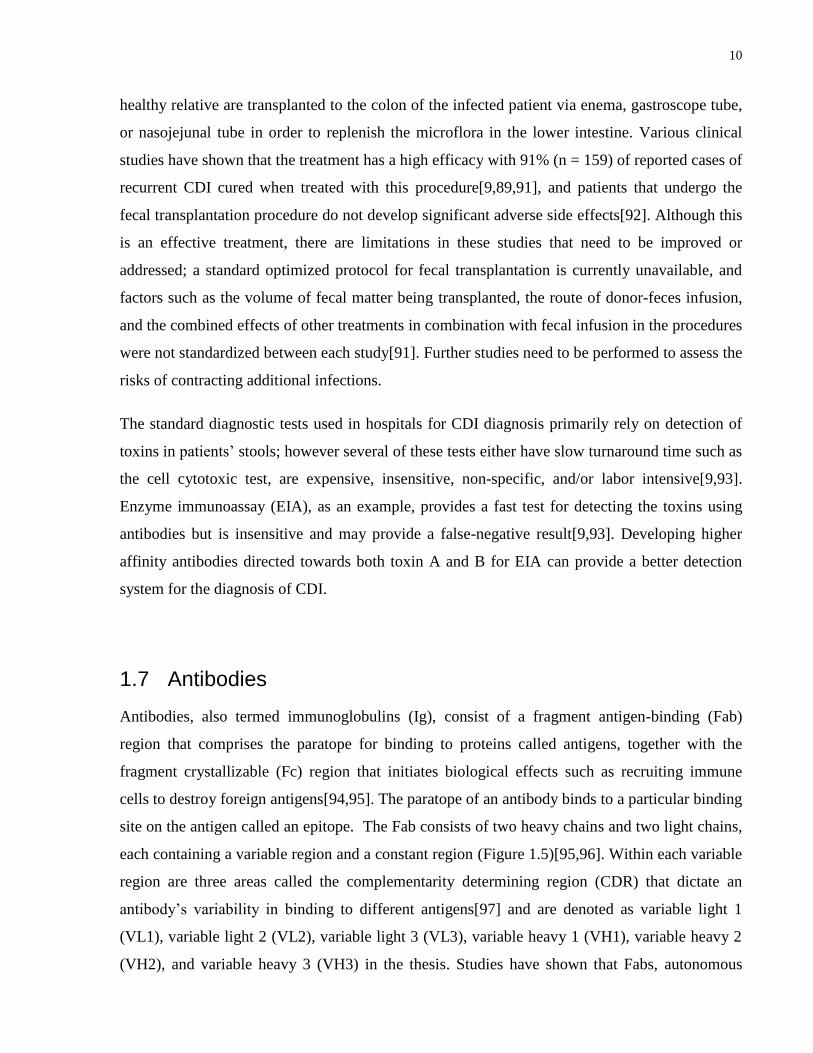
Antibodies, also termed immunoglobulins (Ig), consist of a fragment antigen-binding (Fab)
region that comprises the paratope for binding to proteins called antigens, together with the
fragment crystallizable (Fc) region that initiates biological effects such as recruiting immune
cells to destroy foreign antigens[94,95]. The paratope of an antibody binds to a particular binding
site on the antigen called an epitope. The Fab consists of two heavy chains and two light chains,
each containing a variable region and a constant region (Figure 1.5)[95,96]. Within each variable
region are three areas called the complementarity determining region (CDR) that dictate an
antibody’s variability in binding to different antigens[97] and are denoted as variable light 1
(VL1), variable light 2 (VL2), variable light 3 (VL3), variable heavy 1 (VH1), variable heavy 2
(VH2), and variable heavy 3 (VH3) in the thesis. Studies have shown that Fabs, autonomous
11
single VH domains, and single-chain fragment variables (scFvs) of an antibody (Figure 1.5) are
sufficient for antigen binding[98-101].
In the human immune system, there are five main immunoglobulin isotypes, IgA, IgD, IgE, IgG,
and IgM, each differing in their response to a particular antigen, site of action, and biological
properties[102]. Immunoglobulin G is the primary antibody isotype found in human serum, and
the heavy and light chains are arranged such that each bivalent molecule contains two antigen
binding fragments. Within IgGs, there are four subclasses that also differ in their ability to elicit
effector responses such as complement activation for the removal of invading pathogens[94].
IgG1 is used commonly to generate therapeutic antibodies, as this subclass is found at higher
levels in the serum and can activate effector molecules more potently than IgG2, IgG3, and
IgG4[94,95].
Figure 1.5 Schematic of IgG structure. IgGs are complex multimeric proteins composed of
four polypeptides with two heavy (blue) and two light chains (green) that are folded in a Y
shape. The heavy and light chains are joined by disulfide bonds (-S-S-) and the variable regions
of each chain are located at the ends of the antibody (VL in light green and VH in light blue).
Each variable region has three complementarity regions (CDR) shown as black circles. An IgG
has two fragment antigen-binding (Fab) regions and a fragment crystallizable (Fc) region. A Fab
is composed of a single variable heavy and light chain, and a single constant heavy and light
chain. A single-chain variable fragment (scFv) can be synthesized as a single variable heavy and
light chain, joined by a short peptide linker (orange line). The Fab and the Fc region are
separated by a hinge (red) that adds flexibility to the antibody.

12
1.8 Benefits of antibody treatment against bacterial toxins
Bacteria has a natural tendency to mutate in order to become better suited to a hostile
environment (such as becoming resistant to antibiotics), and therefore targeting secreted
virulence factors such as toxins might be a better therapeutic alternative. This is particular true
when considering that the pathogenicity of a bacterial infection is usually caused either by the
bacterial surface protein, the toxins released by them, or other virulence factors[103]; by
neutralizing the bacterial toxins, the pathogenicity of some bacteria can be reduced and allow the
immune system to clear the bacterial infection[103]. One example already approved and used
effectively as a treatment against C. botulinum poisoning uses human immune serum to
neutralize the botulinum toxin[104]. Monoclonal antibodies against C. difficile toxins, toxin A
and toxin B, called CDA1 and MDX1388, respectively, are currently in phase II clinical trials
and have been shown to decrease the recurrence of CDI when treated as a cocktail[105].
Engineered antibodies can bind very specifically and with very high affinity to their targets and
can be used to block toxin entry by binding to the receptor-binding domain of the toxins and
prevent it from interacting with the receptor[48]. With this approach, the antibodies can act upon
all variants of the bacteria, including those that may be missed by some antibiotics due to
changes in the bacteria mode of infection or colonization. Additionally, the likelihood of
mutations in the RBD of the toxins to prevent antibody binding is low because it may also
prevent binding of the toxin to the host receptor. Furthermore, in contrast to chemical inhibitors,
the Fc portion of antibodies also allows the recruitment of immune cells[94,103] and can prime
the immune system to produce natural antibodies against the toxins[106].
1.9 Exploiting the filamentous phage lifecycle for phage display
High-affinity antibodies can be developed in a selection process called phage display[97,107-
109]. To understand the principle of phage display, we must first understand the lifecycle of a
filamentous phage. The lifecycle begins with binding of the N2 domain of the pIII phage coat
protein to the pili of E. coli (Figure 1.6)[110,111]. This initial step allows binding of the N1
domain of the coat protein to a co-receptor, TolA, found on the surface of the bacteria[112,113].
Thereafter, the phage penetrates the outer membrane of the bacteria and translocates its ssDNA
13
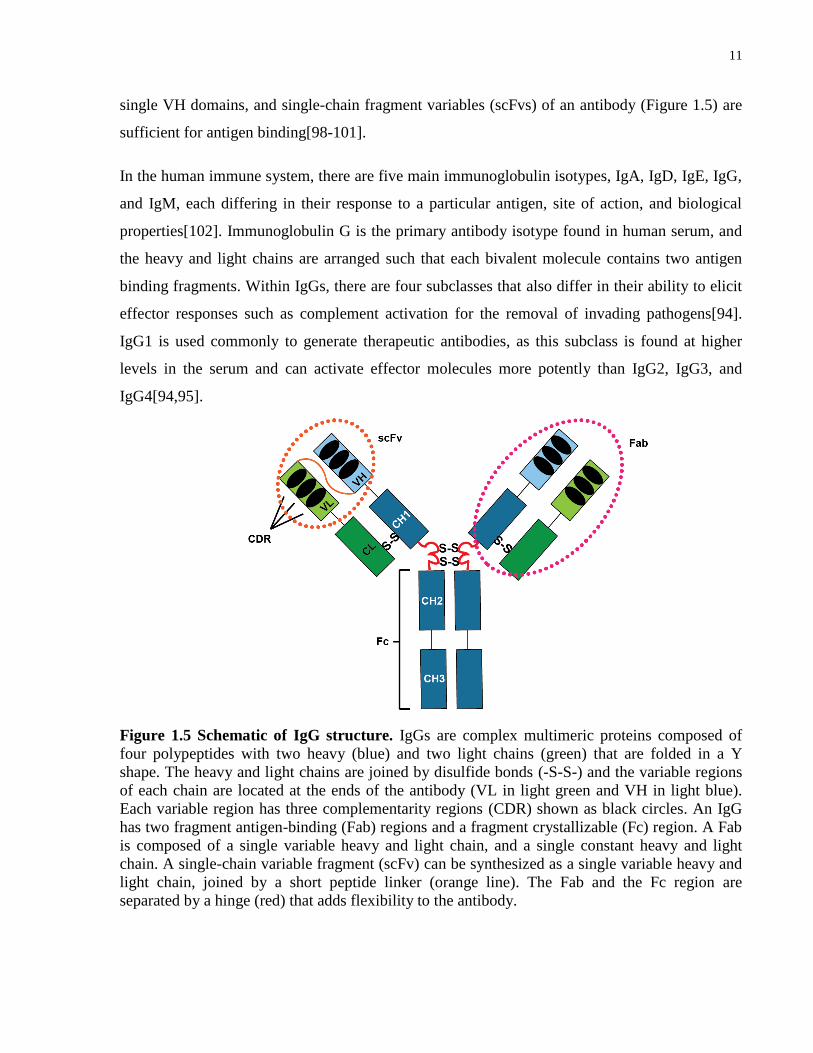
into the bacterial cytoplasm. The host’s DNA polymerase and RNA polymerase converts the
viral ssDNA into dsDNA, and express the viral proteins for ssDNA replication through the
rolling circle method[114]. The viral ssDNA is packaged into the phage particles followed by
their assembly into phage and subsequent secretion from E. coli without cell lyses[111]. Using
the M13 filamentous phage, we can construct a specialized vector called a phagemid and fuse the
protein of interest to the phage coat protein[97,111,115,116]. The protein can then be expressed
on the surface of phage particle and the phage particle can be amplified in E. coli for phage
display (Figure 1.7)[115].
Figure 1.6 The lifecycle of filamentous phage. Phage particles initiate contact with bacteria
bearing the F-pilus. Additional interactions between pIII domains and bacterial receptors occur
with pilus retraction, followed by injection of the phage genome into the cell interior. ssDNA is
converted to the dsDNA replicative form, which enables the synthesis of viral proteins and the
generation of new ssDNA required for replication. Nascent viral coat proteins take up residence
in the bacterial inner membrane in preparation for viral assembly, and pV pre-packages the
ssDNA viral genome for assembly and extrusion. Viral assembly and export occurs through a
membrane pore without cell lysis. Figure and caption was taken from Miersch, S. and Sidhu, S.S.
(2012) with permission from Elsevier Limited.
14
1.10 Principles of phage display
Phage display was first documented by George P. Smith in 1985[115]. He proposed that various
proteins could be fused to the coat protein such as pIII of a filamentous bacteriophage and be
expressed on the surface of the bacteriophage along with the coat protein without affecting the
infectivity of the phage particle. This concept allows the exploration and determination of novel
protein-protein interactions by incubating a protein-displayed phage library with a particular
immobilized target protein and carrying out multiple rounds of selection to enrich for protein-
phage particles that bind specifically to the target protein (Figure 1.8). Since the genetic code of
the protein of interest is linked directly to the DNA that is coding the coat protein being
expressed on the surface of the phage particle, the DNA sequence of the protein can be
determined easily by Sanger sequencing thereby allowing elucidation of the protein that binds to
the target protein.
For our purposes, the sequence of the Fab component of an antibody is fused to pIII in a
phagemid. Since a phagemid does not encode all the necessary genes for phage packaging and
assembly, it requires co-infection with a helper phage such as M13K07 that has all the genes for
phage packaging in addition to the mutation, Met40Ile, in gII. This mutation reduces the activity
of single-stranded DNA replication of the helper phage and preferentially packages the phagemid
DNA into the phage particles[111]. The sequences of the CDRs of a Fab in the library are
randomized via oligonucleotide-directed mutagenesis to provide at least 1010
unique phage-Fabs
in the library[97]. Since the Fab fragments are fully humanized and modular, reformatting to
fully bivalent IgGs, that include Fc functions, can be performed easily.
In order to isolate Fabs that bind to the target protein, the library is pre-incubated with a protein
that is either the fusion tag of the target protein or an unrelated protein such as neutravidin before
the library is incubated with the immobilized target protein. The unbound phage from the library
is removed during the washing step and the bound phage is eluted. The eluted phage is amplified
in E. coli with the help of M13K07 for the next round. This process is repeated for 3 to 4 rounds
with the phage-infected E. coli plated on selective media agar plates for the growth of single
colonies after rounds 3 and 4. Each colony is infected by a single phagemid, and thus each

15
colony can be screened for binding specificity towards the target protein using ELISAs and
subsequently be sequenced to determine unique phage-Fab sequences[97].
Figure 1.7 Phagemid vector for phage display. A phagemid vector contains a site for
replication of single-stranded DNA and phage packaging with the aid of M13K07 helper phage
(f1 ori). The vector also contains a double-stranded DNA origin of replication (322 ori) and an
ampicillin resistant gene (Ampr) for propagation of the plasmid in E. coli. In this case, a protein
of interest is fused to the coat protein P8, and it can be expressed along with P8 under the control
of a promoter. The four minor coat proteins, P3, P6, P7, and P9 have also been used previously
for phage display. The coat protein of the newly packaged phage contains mainly wild-type coat
proteins from the helper phage but also coat proteins displaying the protein of interest. The
phagemid is preferentially packaged into the phage due to a mutation in the genome of the helper
phage which results in an inefficient packaging of wild-type genome. Figure was adapted from
Sidhu, S.S. (2001) with permission from Elservier Limited.

16
Figure 1.8 Antibody selection from M13 bacteriophage libraries. Libraries of antibodies (in
this example, Fabs) are displayed on the surfaces of phage particles as fusions to a coat protein.
Each phage particle displays a unique antibody and also encapsulates a vector that contains the
encoding DNA. Highly diverse libraries (>1010
) can be constructed and represented as phage
pools, which can be used in selections for binding to immobilized antigen. Antigen-binding
phage are retained by the immobilized antigen, and the nonbinding phage are removed by
washing. The retained phage pool can be amplified by infection of an Escherichia coli host, and
the amplified pool can be used for additional rounds of selection to eventually obtain a
population that is dominated by antigen-binding clones. At this point, individual phage clones
can be isolated and subjected to DNA sequencing to decode the sequences of the displayed
antibodies. Figure was modified and caption was taken from F.A. Fellouse and S.S. Sidhu
(2006)[109] with permission from Dr. S.S. Sidhu and Nature Publishing Group.
The advantage of phage display over the hybridoma technique, which is the traditional method
for antibody generation, is that much more control and manipulation can be applied to the
selection environment in order to develop high affinity and specific antibodies in a short period
of time. Furthermore, since these libraries are fully humanized, these antibodies can also be
developed as therapeutics without the cumbersome process of humanizing the antibodies
[108,109,116]. In the hybridoma approach, an antigen of interest is injected into an animal in
order to induce an immune response and produce B-cells. These cells, which produce antibodies
against the antigen, are immortalized by fusion with cancer cells such as myeloma cells. The
disadvantage of this approach is that there is no control over the serum environment during the
selection process, takes much longer, and is much more expensive[117].

17
1.11 Thesis rationale and objectives
In spite of many functional studies, the mechanism of the pathogenicity of C. difficile toxins has
not been clear and the importance of the role of each toxin for infectivity has been debated.
Currently, there are no known CDT-specific antibodies that can inhibit the toxin’s entry, and
current antibodies in clinical trials against toxins A and B that are treated as a mixture of
monocolonal antibodies do not provide complete and long-lasting protection against the effects
of the toxins in patients[105].
In order to understand the role of these toxins, effective tools must be developed to inhibit toxin
entry in order to determine if there is additive protection through inhibition of all three toxins.
These tools can also have applications for understanding the mechanism of C. difficile toxin
entry such as determining important toxin-receptor epitopes. The goal of my project was to
develop high-affinity reagents that can block cellular entry of all three known C. difficile toxins
by targeting the receptor-binding domains of the toxins. In chapter 2, I describe the development
of high-affinity synthetic antibodies against toxins A and B using the phage display method
instead of the traditional hybridoma method with the aim of generating more effective or cross-
reactive anti-toxin A and anti-toxin B antibodies to be used as research tools for studying these
toxins, and possibly as diagnostic purposes. In chapter 3, I describe development of high-affinity
synthetic antibodies against CDT using the same method. These antibodies were characterized
for their binding properties using various affinity assays, such as ELISA and surface plasmon
resonance. The antibodies were also tested for their ability to inhibit toxin entry and prevent
toxicity to cultured cells.
20-30% of infected patients experience relapse after C. difficile-directed antibiotic
treatment[6,9,20,22,118]; so by developing antibodies against all three toxins that have
neutralization properties, the antibodies can potentially be used as an additional and more
effective therapy to relieve the symptoms of CDI. Additionally, obtaining CDT antibodies can be
used to potentially inhibit the effects of binary toxins produced from other bacteria, such as C.
spiroforme and C. perfringens, as there is high sequence homology between CDT and these
toxins.

18
Chapter 2 Developing high-affinity synthetic human antibodies for toxin
A and toxin B
19
2 Developing high-affinity synthetic human antibodies for toxin A and toxin B
Despite many efforts of generating inhibitors against toxins A and B[106,119,120], including
antibodies, there are few examples of reagents/ drugs that can provide durable protection against
the toxins and no reagents/drugs that can detect or effectively prevent intoxication of both toxins
in an animal as a single agent. High-affinity antibodies that are cross-reactive for both toxins
could be beneficial for efficient and accurate toxin detection as diagnostics for clinical
surveillance studies. A single neutralizing antibody treatment could also limit unknown effects
that may result from administration of multiple therapeutic agents in an animal model system.
In addition to developing novel synthetic antibodies against toxins A and B, my experiments
were carried out to address two main questions: 1) can these antibodies from the phage-display
screen bind to the toxins at a high-affinity and are these cross-reactive? 2) can these antibodies
that bind to the toxin inhibit toxin entry? Results from the experiments would determine the
potential of these antibodies for use as reagents for future research studies in the field.
My collaborator, John Tam from Dr. Roman Melnyk’s lab, assisted me in conducting the
functional assay for determining the protective properties of my Fabs against toxins A and B on
cultured cells. Dr. Roman Melnyk’s main research focus is on toxin B and routinely assesses the
toxicity of toxin B on mammalian cells.
2.1 Results
2.1.1 Unique clones and binding specificity to recombinant His6-RBD2304–2710-toxin A and His6 / GST-RBD2286–2366-toxin B
Phage display was performed on 6x histidine (His6)-tagged RBD fragments of toxin A and toxin
B (Figure 2.1A). The fragments were denoted as RBD2304–2710-toxin A and RBD2286–2366-toxin B
(Figure 1.1A). These fragments were known to contain neutralizing epitopes upon llama
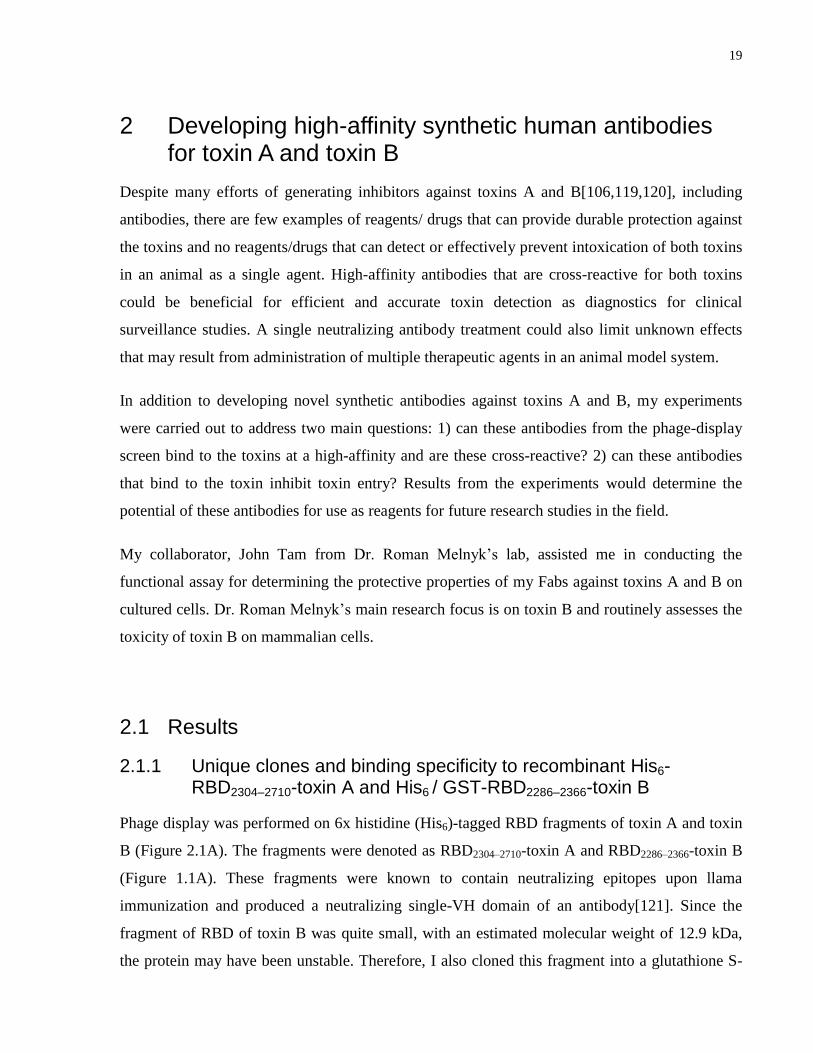
immunization and produced a neutralizing single-VH domain of an antibody[121]. Since the
fragment of RBD of toxin B was quite small, with an estimated molecular weight of 12.9 kDa,
the protein may have been unstable. Therefore, I also cloned this fragment into a glutathione S-
20
transferase (GST)-tagged vector in order to improve the protein stability due to the additional
size of the GST tag (Figure 2.1B). Phage display was also performed on the GST-tagged
RBD2286–2366-toxin B.
Figure 2.1 Western blots on the RBD2304–2710-toxin A and RBD2286–2366-toxin B recombinant
proteins. A) Western blots of His6-RBD2304–2710-toxin A (2) and His6-RBD2286-2366-toxin B (1)
recombinant proteins. The proteins were detected using anti-His6-HRP (1:10000). His6-RBD2286-
2366-toxin B and His6-RBD2304–2710-toxin A displayed a ~14 kDa band and ~35 kDa band,
respectively with minimal background. B) Western blot of GST-RBD2286-2366-toxin B
recombinant protein. The protein was detected using anti-GST-HRP (1:10000). Two bands were
detected in the western blot that corresponded to the GST-RBD2286–2366-toxin B (~38 kDa) and
GST (~27 kDa).
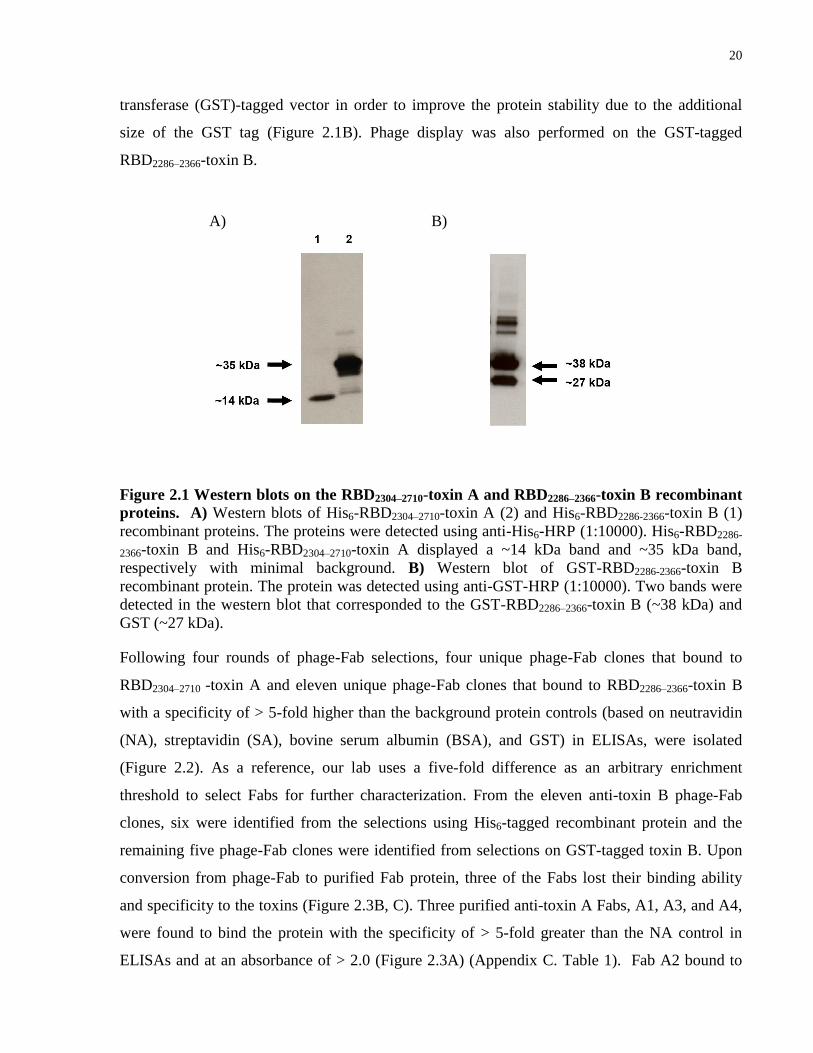
Following four rounds of phage-Fab selections, four unique phage-Fab clones that bound to
RBD2304–2710 -toxin A and eleven unique phage-Fab clones that bound to RBD2286–2366-toxin B
with a specificity of > 5-fold higher than the background protein controls (based on neutravidin
(NA), streptavidin (SA), bovine serum albumin (BSA), and GST) in ELISAs, were isolated
(Figure 2.2). As a reference, our lab uses a five-fold difference as an arbitrary enrichment
threshold to select Fabs for further characterization. From the eleven anti-toxin B phage-Fab
clones, six were identified from the selections using His6-tagged recombinant protein and the
remaining five phage-Fab clones were identified from selections on GST-tagged toxin B. Upon
conversion from phage-Fab to purified Fab protein, three of the Fabs lost their binding ability
and specificity to the toxins (Figure 2.3B, C). Three purified anti-toxin A Fabs, A1, A3, and A4,
were found to bind the protein with the specificity of > 5-fold greater than the NA control in
ELISAs and at an absorbance of > 2.0 (Figure 2.3A) (Appendix C. Table 1). Fab A2 bound to
A) B)
21
toxin A at a lower absorbance of 0.478 but still remained specific as its absorbance was 7.5-fold
greater than the controls when 1 ug/ml of Fab was used in the assay. The ranking of the binding
specificity of the Fabs against His6-RBD-Toxin A was A3 > A1 > A4 > A2 (Appendix C. Table
1).
C)
Figure 2.2 Graph of the ELISA data of the binding specificity of phage-Fabs against RBD
fragments of toxin A and toxin B recombinant proteins. In the assay, the recombinant
proteins were immobilized on protein binding plates and incubated with the phage-Fabs. After
several washes, phage-Fab binding was detected using anti-M13-HRP (1:5000). All phage-Fabs
bound to the RBD toxins with ≥ 5 fold compared to the controls. A) ELISA data of four phage-
Fabs from His6-RBD2304–2710 -toxin A selection B) ELISA data of five phage-Fabs from His6-
RBD2286–2366-toxinB selection. C) ELISA data of six phage-Fabs from GST-RBD2286–2366 -toxin
B selection.
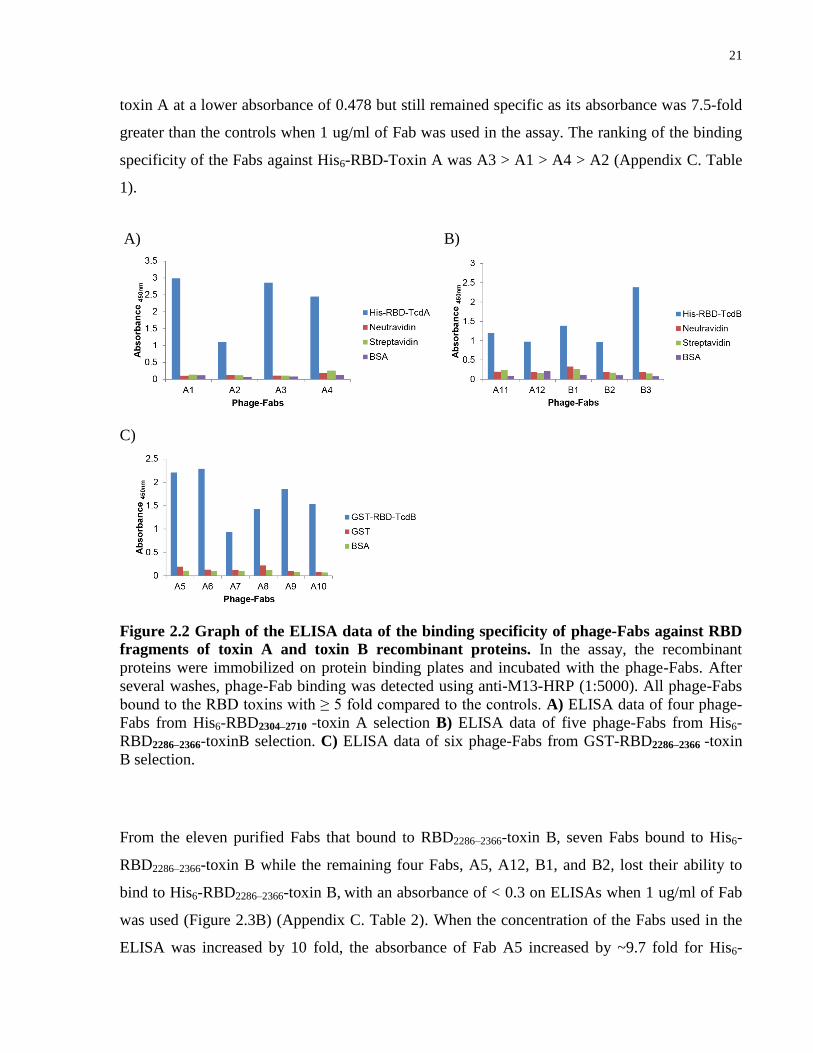
From the eleven purified Fabs that bound to RBD2286–2366-toxin B, seven Fabs bound to His6-
RBD2286–2366-toxin B while the remaining four Fabs, A5, A12, B1, and B2, lost their ability to
bind to His6-RBD2286–2366-toxin B, with an absorbance of < 0.3 on ELISAs when 1 ug/ml of Fab
was used (Figure 2.3B) (Appendix C. Table 2). When the concentration of the Fabs used in the
ELISA was increased by 10 fold, the absorbance of Fab A5 increased by ~9.7 fold for His6-
A) B)
22
RBD2286–2366-toxin B but not in the control wells (Figure 2.3C). When increasing the
concentration of Fabs A12, B1, and B2, there was no significant increase in the absorbance but
there was a decrease in specificity of Fabs A12 and A9 (Figure 2.3C). The ranking of the binding
specificity of the Fabs against His6-RBD2286–2366-toxin B was A10 > B3 > A6 > A8 > A11 > A9
> A7 > A5 > B1. These Fabs gave an absorbance fold difference of > 2 compared to the controls
with 1 ug/ml of Fab was used (Appendix C. Table 2).
Figure 2.3 Graph of the ELISA data of the binding specificity of the purified Fabs against
His6-tagged RBD fragments of toxin A and toxin B recombinant proteins. Binding of
purified Fabs was detected using anti-Flag-HRP (1:5000). A) ELISA data of purified Fabs from
the toxin A selection against toxin A. B) ELISA data of 1 ug/ml of purified Fabs used in the
ELISA against toxin B. C) ELISA data of 10 ug/ml of purified Fabs used in the ELISA against
toxin B.
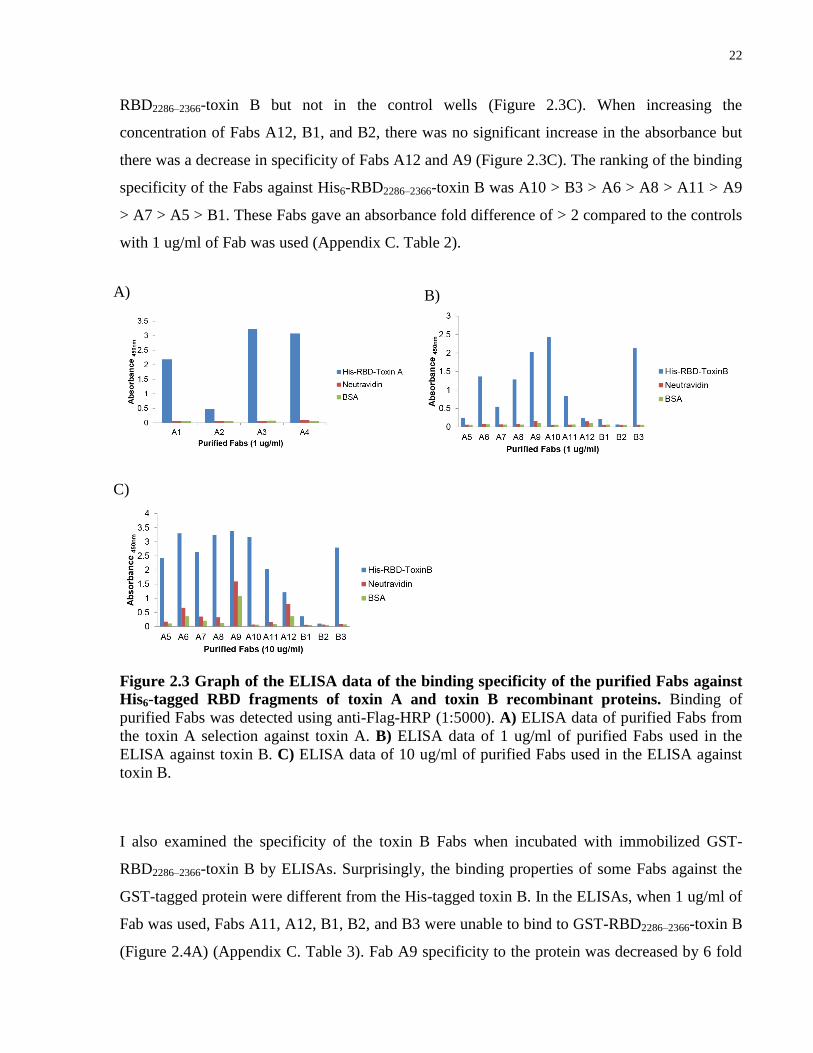
I also examined the specificity of the toxin B Fabs when incubated with immobilized GST-
RBD2286–2366-toxin B by ELISAs. Surprisingly, the binding properties of some Fabs against the
GST-tagged protein were different from the His-tagged toxin B. In the ELISAs, when 1 ug/ml of
Fab was used, Fabs A11, A12, B1, B2, and B3 were unable to bind to GST-RBD2286–2366-toxin B
(Figure 2.4A) (Appendix C. Table 3). Fab A9 specificity to the protein was decreased by 6 fold
A) B)
C)
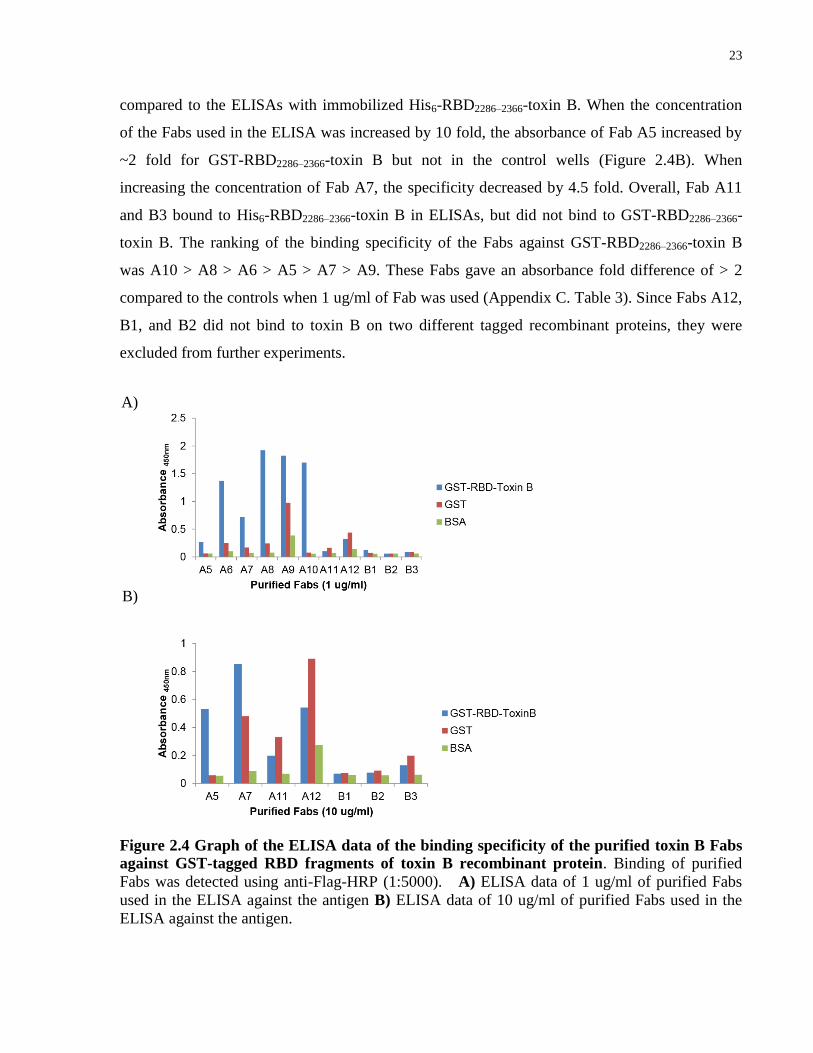
23
compared to the ELISAs with immobilized His6-RBD2286–2366-toxin B. When the concentration
of the Fabs used in the ELISA was increased by 10 fold, the absorbance of Fab A5 increased by
~2 fold for GST-RBD2286–2366-toxin B but not in the control wells (Figure 2.4B). When
increasing the concentration of Fab A7, the specificity decreased by 4.5 fold. Overall, Fab A11
and B3 bound to His6-RBD2286–2366-toxin B in ELISAs, but did not bind to GST-RBD2286–2366-
toxin B. The ranking of the binding specificity of the Fabs against GST-RBD2286–2366-toxin B
was A10 > A8 > A6 > A5 > A7 > A9. These Fabs gave an absorbance fold difference of > 2
compared to the controls when 1 ug/ml of Fab was used (Appendix C. Table 3). Since Fabs A12,
B1, and B2 did not bind to toxin B on two different tagged recombinant proteins, they were
excluded from further experiments.
Figure 2.4 Graph of the ELISA data of the binding specificity of the purified toxin B Fabs
against GST-tagged RBD fragments of toxin B recombinant protein. Binding of purified
Fabs was detected using anti-Flag-HRP (1:5000). A) ELISA data of 1 ug/ml of purified Fabs
used in the ELISA against the antigen B) ELISA data of 10 ug/ml of purified Fabs used in the
ELISA against the antigen.
A)
B)

24
Interestingly, when determining the binding specificity of the Fabs, I discovered that Fabs A1,
A2, and B3 were cross-reactive and bound to both His6-RBD2304–2710-toxin A and His6-RBD2286–
2366-toxin B with high binding specificity at 1 ug/ml of Fab in ELISAs (Figure 2.5) (Appendix C
Table 4, 5). The ranking of the binding specificity of the cross-reactive Fabs for His6-RBD2304–
2710-toxin A was A1 > B3 > A2 and the ranking of the binding specificity of the cross-reactive
Fabs for His6-RBD2286–2366-toxin B was B3 > A1 > A2.
Figure 2.5 ELISA data on cross-reactive Fabs. A) ELISA against RBD-toxin A. Fab B3 came
from the toxin B selection. B) ELISA against RBD-toxin B. Fabs A1 and A2 came from the
toxin A selection.
2.1.2 Affinity measurements of anti-toxin A and anti-toxin B Fabs on RBD of the toxins by ELISA
The relative affinities of the binders were estimated by performing competitive ELISAs. In this
assay, different concentrations of antigen were used to bind to Fabs in solution and then
incubated with immobilized antigen. The concept of the assay is that the binding site of a high
affinity binder with a slow koff will be occupied during the incubation with the antigen in solution
and prevent binding to immobilized antigen. Thus, detection of Fab binding on immobilized
antigen would be low due to the competition with the antigen in solution. A low concentration
of antigen that can inhibit Fab binding to immobilized antigen indicates a high affinity Fab. For
the competitive ELISAs, the concentration of Fabs used in the assay was first established by
measuring the half-maximal effective concentration of the antibody which can bind to the
antigen (EC50). The EC50 values of the Fabs were determined by generating a binding curve for
each Fab. The Fabs were serial diluted and incubated with immobilized recombinant RBD2304–
2710-toxin A and RBD2286–2366-toxin B in the ELISAs. The absorbance from the ELISA was
A) B)
25
plotted (Figure 2.6). The EC50 values of each Fab from the binding curves are listed in Table 2.1
and the ranking of the EC50 values for anti-RBD-toxin A Fabs was A4 > B3 > A1 > A3. The
EC50 for Fab A2 could not be determined but was estimated to be > 80 nM. The ranking of the
EC50 values for anti-RBD2286–2366-toxin B Fabs was A2 > A7 > A5 > A6 > (A9 = A11) > A8 >
A10 > A1 > B3.
Figure 2.6 EC50 binding curves for anti-RBD toxin A and anti-RBD toxin B Fabs. Fab A2
(red) showed weak binding to the toxins. Binding curves of the cross-reactive Fabs against both
toxins were also conducted. A) Binding curves against RBD fragments of toxin A (mean
absorbance of Fab binding at each Fab concentration ± SD with technical replicates of n = 2). B)
Binding curves against RBD fragments of toxin B (mean absorbance of Fab binding at each Fab
concentration ± SD with technical replicates of n = 2).
Table 2.1 EC50 values from the binding curves of toxin A and B Fabs. These values were
extrapolated from the binding curves in Figure 2.6 using Prism. A) Estimated EC50 values of
Fabs that bound to RBD of toxin A. B) Estimated EC50 values of Fabs that bound to RBD of
toxin B.
A) B)
A) B)
26
In the competitive ELISA, 10 nM and 100 nM of antigen (His6-RBD2304–2710-toxin A / His6-
RBD2286–2366-toxin B) were used to pre-incubate with the Fab in solution. The Fab / antigen
mixture was then incubated with immobilized antigen and binding on immobilized antigen was
detected. The competitive ELISA showed that Fabs A1 and A3 binding was inhibited by 100 nM
of His6-RBD2304–2710-toxin A with > 2-fold decrease in binding relative to the no competition
control (Figure 2.7A) (Table 2.2A). Inhibition of Fabs A1 and A10 binding by 100 nM of His6-
RBD2286–2366-toxin B was evident relative to the no competition control; however, they showed <
2-fold decrease in binding (Figure 2.7B) (Table 2.2B). The remaining Fabs were not
significantly inhibited by either 10 nM or 100 nM of antigen in solution suggesting their affinity
to be > 100 nM. This data suggested that the affinity of Fabs A1 and A3 for His6-RBD2304–2710-
toxin A were the highest with an estimated affinity of between 10-100 nM, and Fabs A1 and A10
had an estimated affinity of ~100 nM for His6-RBD2286–2366-toxin B.
Figure 2.7 Graph of the competitive ELISA data of RBD-toxin A and RBD-toxin B Fabs.
Purified Fabs were pre-incubated with 0 nM, 10 nM, or 100 nM of antigen in solution and the
mixture was then incubated with immobilized antigen. Purified Fab binding on immobilized
antigen was detected using anti-Flag-HRP (1:5000). Inhibition of Fab binding to immobilized
antigen indicated that the binding site of the Fab to the antigen was occupied during the pre-
incubation step. The affinity of the Fabs was estimated from this assay. A) Competitive ELISA
against RBD fragment of toxin A. Fabs A1 and A3 binding was inhibited at 100 nM of antigen in
solution with > 2-fold decrease in binding to the immobilized antigen (dotted box) (mean %
inhibition of Fab binding when competed with antigen in solution ± SD with technical replicates
of n = 3). B) Competitive ELISA against RBD fragment of toxin B. Inhibition of Fabs A1 and
A10 binding to the immobilized antigen at 100 nM of antigen in solution was less than 2-fold but
was still evident (dotted box) (mean % inhibition of Fab binding when competed with antigen in
solution ± SD with technical replicates of n = 3).
A) B)

27
Table 2.2 Estimated affinities from competitive ELISAs of toxin A and B Fabs. Fabs that
had an estimated affinities of ≤ 100 nM are in yellow. The values were extrapolated from the
graph in Figure 2.7. A) Estimated affinities of Fabs that bound to RBD of toxin A. B) Estimated
affinities of Fabs that bound to RBD of toxin B.
2.1.3 Binding affinity validation of anti-toxin A and anti-toxin B Fabs using SPR
The binding kinetics of the Fabs for their corresponding proteins were determined using surface
plasmon resonance (SPR). The equilibrium dissociation constant (KD) is the ratio of koff to kon
and corresponds to the concentration of ligand at which it can saturate 50% of the receptor
(antibody). The lower the KD values of a protein, the higher the affinity. Typical KD values for
high-affinity antibodies are within the single-digit nanomolar range. Only Fabs, A1 and A3,
showed binding to His6-RBD2304–2710-toxin A with KD values of 8.98nM and 10.5nM,
respectively (Table 2.3) (Figure 2.8A, C). Since I found that Fab A1 also bound to His6-RBD2286–
2366-toxin B from our previous ELISA data, SPR was also performed on Fab A1 against His6-
RBD2286–2366-toxin B. In agreement with ELISA data, the SPR data showed that Fab A1 also
bound to His6-RBD2286–2366-toxin B with a KD value of 5.73nM (Table 2.3) (Figure 2.8B). From
the SPR data, I found two Fabs with affinities of < 10 nM towards their proteins. Fab A3 had a
better fit than Fab A1 to the curve with a Chi2 value of less than 10% of Rmax. The remaining
Fabs did not bind to their protein in the SPR assay and considering their low affinities, based on
the competitive ELISAs, they were not explored further.
A) B)
28
Table 2.3 Surface plasmon resonance data for toxin A and B Fabs. The association rate
constant (kon) was determined by the rate at which the Fabs bound to the antigen when injected
into the flow cell. The dissociation rate constant (koff) was determined by the rate at which the
Fabs were released from the ligand surface when PBS was injected. The KD is the ratio of
koff/kon. For kinetic analysis, a 1:1 Langmuir model of global fittings of kon and koff was used.
Rmax and Chi2 are displayed to show the confidence of the fit. For a good fit to the model, Chi
2
should be less than 20% of Rmax. TcdA showed a high Chi2 % of Rmax (> 30%).
Figure 2.8 Surface plasmon resonance curves of the binding response for the toxin A and
toxin B Fabs. Toxin A and B recombinant proteins were immobilized on the sensor chip surface
and different concentration of Fabs was injected into the flow cell (analyte 1-5). The binding
curves correspond to the SPR data in Table 2.3. A) Fab A1 against TcdA B) Fab A1 against
TcdB C) Fab A3 against TcdA.
A) B)
C)

29
2.1.4 Epitope grouping of the Toxin A Fabs, Fab A1 and Fab A3.
To assess whether the Fabs bound to the same or different epitopes on the toxins, I carried out
competitive ELISAs to determine if purified Fabs could compete with phage-Fab clones.
Competing Fabs indicated that these Fabs bound to the same epitope and were grouped. When
the phage-Fabs competed with their own corresponding purified Fabs, the epitope was occupied
by the purified Fab and prevented the phage-Fab from binding with a consequent decrease in
absorbance of bound phage-Fab. Maltose-binding protein (MBP) Fab was used as the non-
competing Fab control and therefore, the phage-Fab should bind freely to the antigen.
From our analysis, the toxin A Fabs, A1 and A3, did not compete with each other and showed
nearly equivalent absorbance as the non-competing phage-Fab control (Figure 2.9). As expected,
they were able to carry out autoinhibition of binding with a > 2-fold decrease in absorbance
compared to the non-competing phage-Fab control. The competitive ELISA suggests that Fab
A1 and Fab A3 bind to different epitopes of RBD-toxin A.
Figure 2.9 Epitope grouping of Fab A1 and A3. Phage-Fab competed with purified Fabs for
the epitope binding site of RBD fragment of toxin A. The Fabs indicated in the x-axis are
purified Fabs that were competing with the phage-Fab. Phage-Fab binding was detected using
anti-M13-HRP. The bar highlighted in white showed auto inhibition. A) Detection of phage-Fab
A1 binding. Purified Fab A3 did not inhibit phage-Fab A1 binding (mean absorbance of phage-
Fab binding ± SD with technical replicates of n = 3). B) Detection of phage-Fab A3 binding.
Purified Fab A1 did not inhibit phage-Fab A3 (mean absorbance of phage-Fab binding with
technical replicates of n = 3).
A) B)
30
2.1.5 Affinity measurements of anti-toxin A Fab A3 on full-length toxin A by ELISA
It is functionally important to test binding of these Fabs on the full-length toxins and therefore, I
performed an ELISA on the full-length TcdA and TcdB. From the ELISA, only Fab A3 was
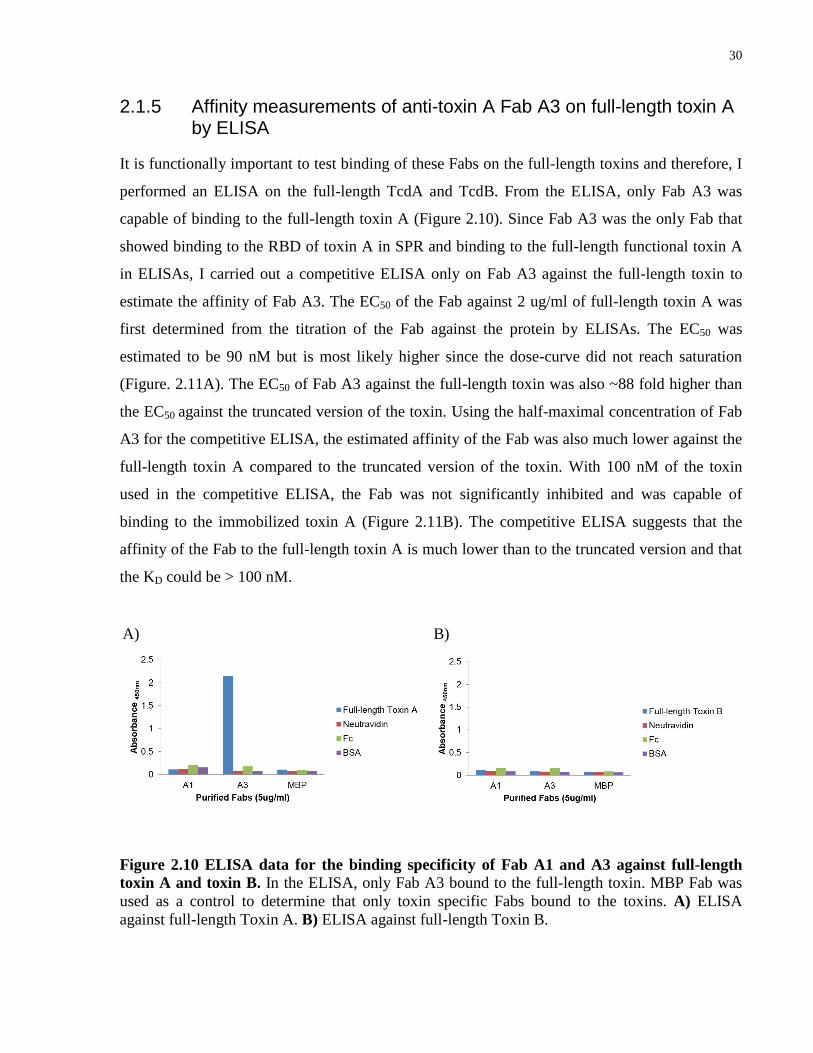
capable of binding to the full-length toxin A (Figure 2.10). Since Fab A3 was the only Fab that
showed binding to the RBD of toxin A in SPR and binding to the full-length functional toxin A
in ELISAs, I carried out a competitive ELISA only on Fab A3 against the full-length toxin to
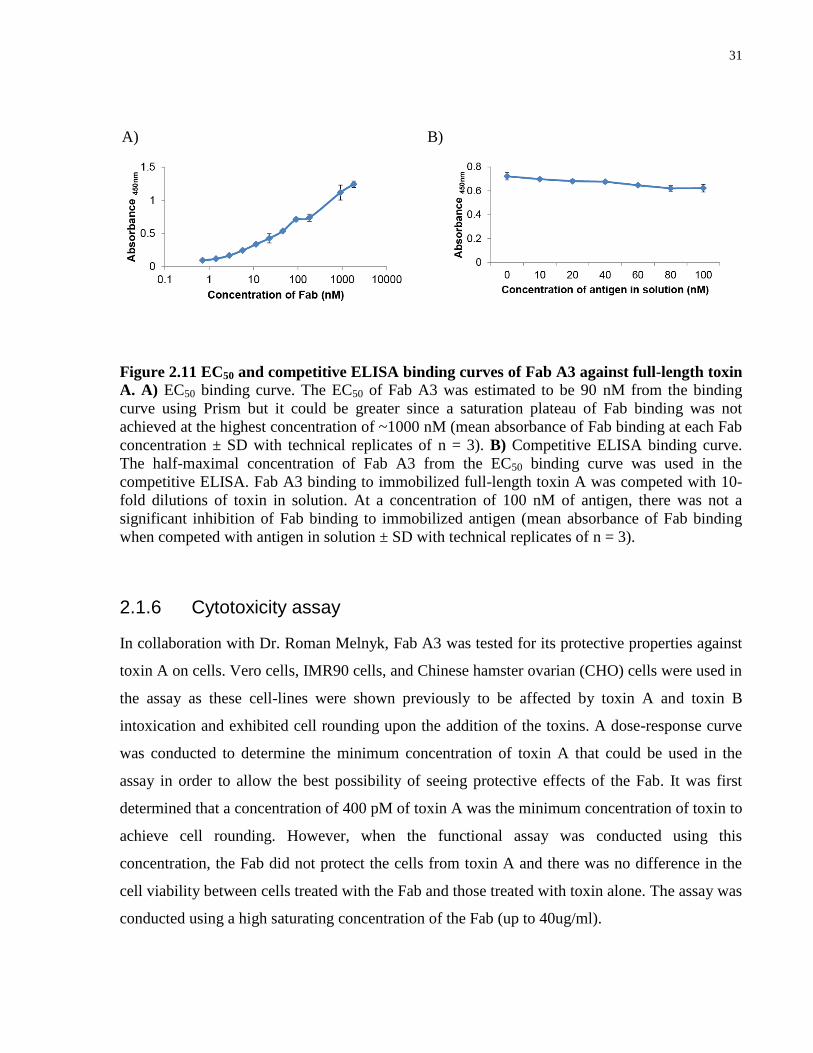
estimate the affinity of Fab A3. The EC50 of the Fab against 2 ug/ml of full-length toxin A was
first determined from the titration of the Fab against the protein by ELISAs. The EC50 was
estimated to be 90 nM but is most likely higher since the dose-curve did not reach saturation
(Figure. 2.11A). The EC50 of Fab A3 against the full-length toxin was also ~88 fold higher than
the EC50 against the truncated version of the toxin. Using the half-maximal concentration of Fab
A3 for the competitive ELISA, the estimated affinity of the Fab was also much lower against the
full-length toxin A compared to the truncated version of the toxin. With 100 nM of the toxin
used in the competitive ELISA, the Fab was not significantly inhibited and was capable of
binding to the immobilized toxin A (Figure 2.11B). The competitive ELISA suggests that the
affinity of the Fab to the full-length toxin A is much lower than to the truncated version and that
the KD could be > 100 nM.
Figure 2.10 ELISA data for the binding specificity of Fab A1 and A3 against full-length
toxin A and toxin B. In the ELISA, only Fab A3 bound to the full-length toxin. MBP Fab was
used as a control to determine that only toxin specific Fabs bound to the toxins. A) ELISA
against full-length Toxin A. B) ELISA against full-length Toxin B.
A) B)
31
Figure 2.11 EC50 and competitive ELISA binding curves of Fab A3 against full-length toxin
A. A) EC50 binding curve. The EC50 of Fab A3 was estimated to be 90 nM from the binding
curve using Prism but it could be greater since a saturation plateau of Fab binding was not
achieved at the highest concentration of ~1000 nM (mean absorbance of Fab binding at each Fab
concentration ± SD with technical replicates of n = 3). B) Competitive ELISA binding curve.
The half-maximal concentration of Fab A3 from the EC50 binding curve was used in the
competitive ELISA. Fab A3 binding to immobilized full-length toxin A was competed with 10-
fold dilutions of toxin in solution. At a concentration of 100 nM of antigen, there was not a
significant inhibition of Fab binding to immobilized antigen (mean absorbance of Fab binding
when competed with antigen in solution ± SD with technical replicates of n = 3).
2.1.6 Cytotoxicity assay
In collaboration with Dr. Roman Melnyk, Fab A3 was tested for its protective properties against
toxin A on cells. Vero cells, IMR90 cells, and Chinese hamster ovarian (CHO) cells were used in
the assay as these cell-lines were shown previously to be affected by toxin A and toxin B
intoxication and exhibited cell rounding upon the addition of the toxins. A dose-response curve
was conducted to determine the minimum concentration of toxin A that could be used in the
assay in order to allow the best possibility of seeing protective effects of the Fab. It was first
determined that a concentration of 400 pM of toxin A was the minimum concentration of toxin to
achieve cell rounding. However, when the functional assay was conducted using this
concentration, the Fab did not protect the cells from toxin A and there was no difference in the
cell viability between cells treated with the Fab and those treated with toxin alone. The assay was
conducted using a high saturating concentration of the Fab (up to 40ug/ml).
A) B)
32
2.2 Discussion
Pathogenic strains of C. difficile can produce two large clostridial toxins, toxin A and toxin B,
which are the main contributors to the symptoms of CDI. In this chapter, I aimed to develop
high-affinity synthetic antibodies against the receptor-binding domains of toxin A and toxin B
using the phage display method instead of the traditional hybridoma method. However, it is
important to note that my goal was not solely to develop neutralizing antibodies but also to
develop antibodies that could be used as a potential diagnostic and research tools for the
detection of these toxins, which current antibodies have failed in this respect due to the
insensitivity of the antibodies.
From the phage display screen, I selected for Fabs that bound to the truncated recombinant toxins
A and B receptor-binding domains. From two separate studies, it was known that those portions
of the RBDs contain sites that are important for binding [121,122] and therefore using those
specific portions for phage display should allow for selection of neutralizing antibodies. Fabs
were isolated from selections on two differently tagged truncated RBD-toxin B proteins, His-
tagged and GST-tagged RBD2286–2366 Toxin B. Upon analysis of the binding specificity for these
proteins using ELISAs, some Fabs bound to His6-RBD2286–2366-toxin B but not to GST- RBD2286–
2366-toxin B. Since GST, with a molecular weight of ~26 kDa, is 2 times larger than RBD2286–
2366-toxin B that has a molecular weight of ~13 kDa, it is possible that the GST tag masked some
epitopes of RBD2286–2366-toxin B that were exposed on the His6-tagged RBD toxin B fragment. I
am confident that at least five Fabs bind to the RBD of toxin B because these Fabs were able to
bind to both His-tagged and GST-tagged recombinant proteins.
Unfortunately, I was unable to identify neutralizing antibodies against toxins A and B. There
could be several factors that contributed to the difficulties encountered, including a factor that
could arise when generating truncated proteins for phage display. One factor was that the affinity
of the Fab was too low to inhibit toxin binding. The KD value for Fab A1obtained from the SPR
against RBD-toxin A and B fragments was in the nanomolar range; however, the binding
response curves for this Fab contained a large amount of background noise and had a high %
Chi2 of Rmax value (Table 2.3) (Figure 2.8 A, B), suggesting that it may be unreliable. SPR is a
good indication of the affinity of the Fabs but there are also pitfalls to consider when using SPR
that may skew the true affinity of the Fabs[123]. One of the pitfalls is that the orientation of the
33
antigen of interest when immobilized on the sensor surface is unknown and the ligand-receptor
interaction could be different in solution. Therefore, the epitopes for Fab binding can be masked
in SPR. The stability and purity of the antigen should also be considered, as this may cause false
positives and background noise, and therefore it may cause misinterpretation of the affinity of
the protein. For these reasons, competitive ELISAs were also conducted, and from this assay it
suggests that the affinities are higher than the affinities obtained in SPR.
Since the affinity of the Fabs was determined using the truncated toxins, I performed ELISAs on
the binders Fab A1 and Fab A3 against the full-length toxins, and I expected that the Fabs would
bind equally well. However, only Fab A3 bound to the full-length toxin A. The EC50 and
estimated affinity from the competitive ELISA of the Fab against the full-length toxin was much
lower than that of the truncated protein, and at ~1000 nM Fab A3 binding did not reach
saturation in the ELISA (Figure 2.11A). It is clear that Fab A3 has a lower affinity against the
full-length toxin than expected. The full-length toxins A and B are much larger than the
truncated toxins with a size of 300 kDa and 270 kDa, respectively. Based on the binding data
from the ELISAs, I suspect that the remaining regions of the toxins were masking some of the
epitopes found on the truncated toxins. Fab A3 could have been binding to an epitope that was
partially masked by the remaining domains of the toxins and therefore weakening the interaction
between the Fab and the toxin, and leading to a lower affinity measurement in the SPR.
Since the human receptor for toxins A and B is unknown, the affinity of the toxins for the
receptor is not clearly defined. This uncertainty makes it difficult to predict an affinity of the
antibody required to compete with the toxins for the receptor. However, from this study and
other studies, it has been suggested that the affinity of bacterial toxins for their receptor is high
and possibly within the nanomolar to picomolar range[106,124,125] and therefore, high affinity
antibodies that are less than single-digit nanomolar affinities might be required to block toxin
entry.
Lastly, in order to develop neutralizing antibodies, it is important that the Fabs bind to
therapeutic epitopes; these are epitopes that when bound by an antibody will neutralize target
antigen function (in the case of antagonistic antibodies)[126]. Although the human receptor for
toxins A and B is unknown, it is suggested that the toxins bind to carbohydrate-containing
receptors. In one study, the crystal structure of the C-terminal region containing the receptor-
34
binding domain of toxin A was determined when bound to a synthetic derivative of a naturally
occurring carbohydrate receptor, α-Gal(1,3)-β-Gal-(1,4)-β-GlcNAcO(CH2)8CO2CH3[122]. From
this crystal structure, multivalent binding of toxin A to the receptor was identified through seven
putative binding sites. Current therapeutic monoclonal antibodies do not decrease the severity of
CDI[106,119], which may be due to the multiple binding sites of toxin to the receptor and that
the antibodies may have blocked only a few key binding sites, leaving the remaining binding
sites available for receptor binding. This study verifies that generating antibodies against toxins
A and B for complete neutralization could be difficult.
Overall, I have developed a Fab called Fab A3 that binds to the full-length toxin A, but I was
unable to develop any anti-toxin B Fabs. Fab A3 binds to the full-length toxin at a low affinity of
> 100 nM based on the competitive ELISA data. The affinity of Fab A3 could be improved,
however, via affinity maturation, and perhaps with a higher affinity, it might be possible for Fab
A3 to neutralize the toxicity of the toxin on cells if it binds to a therapeutic epitope.
2.3 Materials and Methods
2.3.1 Phagemid plasmid of Library F
The phagemid used to generate the library contains an origin of replication (dsDNA ori) for
replication of double-stranded DNA and f1 site, which enables single-stranded DNA replication.
Additionally, the phagemid contains a selectable marker (Ampr) and a phoA promoter for protein
purification (Appendix D. Figure 1). The phage library used in the selection was termed “Library
F” and displayed Fabs of an antibody. The library was created by Dr. Helena Persson (a former
postdoctoral fellow in Dr. Sidhu lab). In this library, CDRs VL3, VH1, VH2, and VH3 of the
Fab were randomized via oligonucleotide-directed mutagenesis. A secretion signal is found at
the N-terminus of both the light chain and heavy chain of the Fab, allowing the light chain and
the heavy chain to be secreted separately and then associate in the periplasm of E. coli to form
the functional Fab. The C-terminal of the heavy chain is fused to the pIII coat protein, which
allows the expression of the Fab on the surface of the phage particles. The library has an
estimated measured diversity of 1010
different antibodies. Detailed description of the library
construction can be found in Fellouse & Sidhu (2007)[97].
35
2.3.2 Generation of expression plasmids for production of His6-RBD2304–
2710 -toxin A and His6 / GST-RBD2286–2366-toxin B
Fragments of the receptor-binding domain of TcdA and TcdB (amino acid 2304-2710 of TcdA
and amino acid 2286-2366 of TcdB, NCBI accession# NC_009089.1) using genomic DNA of C.
difficile strain 90556-M6S as template for PCR were cloned into pGC297 vector and pHH0103
containing a isopropyl β-D-1-thiogalactopyranoside (IPTG) inducible promoter (Appendix D.
Figure 2A, B). The RBD2304–2710-toxin A and RBD2286–2366-toxin B were cloned using a
restriction-enzyme independent method developed by Walker et al. (2008). In this method,
primers were designed to generate two sets of blunt-end PCR products containing the desired
antibody sequence with different overhangs. DNA polymerases that have proofreading activity,
such as Phusion® High-Fidelity DNA polymerase (NEB, cat# M0530), were used to generate
these PCR products so that extra nucleotides were not added at the end of the products. The
cycling protocol for generating the PCR products were as follows: 95 °C for 3 min; 95 °C for 30
s, 62 °C for 30 s, 72 °C for 1 min repeated 34 times; 72 °C for 5 min (primers listed in Appendix
B, Table 1). The His6-tagged vector, pGC297, was cut using KpnI (NEB, cat# R0142) and NcoI
(NEB, cat# R0193). The GST-tagged vector, pHH0103, was cut using KpnI and NotI-HF (NEB,
cat# R3189). The cut plasmids were dephosphorylated using Antarctic Phosphatase (NEB, cat#
M0289) and inserts were phosphorylated using T4 Phosphonucleotide Kinase (NEB, cat#
M0201) to improve the cloning efficiency. The ligation was performed using T4 ligase (NEB,
cat# M0202). Successfully ligated vectors were confirmed using PCR method with the following
cycling protocol: 95 °C for 3 min; 95 °C for 30 s, 55°C for 30 s, 72 °C for 1 min repeated 29
times; 72 °C for 5 min (primers listed in Appendix B, Table1).
2.3.3 Expression and purification of His6-tagged RBD2304–2710-Toxin A and RBD2286–2366-Toxin B
The plasmids were transformed into BL21 bacteria cells. The cells were induced with 1 mM of
IPTG at OD600 of 0.6 and the induction proceeded for 24 hours at 16 °C. The cells were then
pelleted at 10,000 rpm for 20 minutes and resuspended in 40 ml of lysis buffer (50 mM Tris-pH
8.0, 500 mM NaCl, 10 mM imidazole-pH 8.0, 1 mM PMSF, and 1x protease inhibitor cocktail)
36
per 1 L of bacterial culture. The lysate was sonicated on ice with 5 s on / 5 s off pulses for 2 min
at 40% amplification. The lysate was centrifuged twice for 10 min at 10,000 rpm at 4 °C. The
supernatant was added to gravity flow columns that were packed with 1.5 ml of prewashed Ni
beads slurry (Qiagen, cat# 30230) and allowed to flow through the columns. The columns were
washed 3 times with 30 ml of wash buffer (50 mM Tris-pH 8.0, 500 mM NaCl, 20 mM
imidazole). The protein was eluted with 400 ul of elution buffer (50 mM Tris-pH 8.0, 500 mM
NaCl, 250 mM imidazole, 5% glycerol). The proteins were buffer exchanged with PBS using
Thermo Scientific Slide-A-Lyzer Dialysis Cassette G2 20 kDa (cat# 87734) and 2 kDa (cat#
87717) for RBD2304–2710-toxin A and RBD2286–2366-toxin B, respectively.
2.3.4 Expression and purification of GST-tagged RBD2286–2366-Toxin B
The plasmids were transformed into BL21 bacteria cells. The cells were induced with 0.4 mM of
IPTG at OD600 of 0.6 and the induction proceeded for 24 hours at 16 °C. The cells were then
pelleted at 10,000 rpm for 20 minutes and 50 ml lysis buffer (Phosphate Buffered Saline (PBS)
buffer containing 1 mM EDTA, 1 mM DTT, 0.5% Triton, 1x protease inhibitor cocktail) was
added per 250 ml of bacterial culture. The lysate was sonicated on ice with 5 s on / 5 s off pulses
for 2 min at 40% amplification. The lysate was centrifuged twice for 10 min at 10,000 rpm at 4
°C. The supernatant was added to prewashed 300 ul of glutathione resin (GE Healthcare, cat#
17-0756-05) and incubated for 1 hour with gentle nutation. The beads were collected using a
gravity flow columns. The columns were washed 3 times with the first wash using three column
volumes of PBS, the second wash using PBS-150 mM NaCl solution, and the third wash using
PBS. The protein was eluted with three column volumes of the elution buffer (10 mM
glutathione, 50 mM Tris-pH 8.0). The protein was buffer exchanged with PBS using Thermo
Scientific Slide-A-Lyzer Dialysis Cassette G2 20 kDa.
2.3.5 Western blot for confirmation of RBD2304–2710-toxin A and RBD2286–
2366-toxin B protein preps
Western blot was performed to confirm that the proteins were not degraded and were the correct
estimated size. The recombinant proteins were separated by sodium dodecyl sulfate
37
polyacrylamide gel electrophoresis (SDS-PAGE) using 4–15% Mini-PROTEAN® TGX™
Precast Gel (Biorad, cat# 456-1086, 456-1083) and transferred onto a polyvinylidene difluoride
(PVDF) membrane (GE Health, cat# RPN303F). The membrane was blocked with Tris-buffered
saline-0.05% Tween 20, 5% skim milk for 1 hour. His6-RBD2304–2710-toxin A and His6-RBD2286–
2366-toxin B were detected by 1:10000 anti-His6-horseradish peroxidase (HRP) (R&D, cat#
MAB050H) and GST- RBD2286–2366-toxin B was detected using 1:10000 anti-GST-HRP (Sigma,
cat# A7340) in PBS-5% skim milk. The blots were developed using Pierce ECL Western
Blotting substrate (ThermoScientific, cat# 32106).
2.3.6 Phage display
A 96-well protein binding MaxiSorp® plate (Thermo Scientific, cat# 439454) was coated
overnight at 4 °C with 100 ul of RBD2304–2710-toxin A and RBD2286–2366-toxin B (5 ug/ml in
PBS). A second plate was coated with 100 ul of neutravidin, streptavidin, or GST (5 ug/ml) for
the pre-absorption step. The next day the plates were blocked with PBS-0.5% BSA for at least 1
hour. A 0.5 ml glycerol stock of Library F containing 8x10¹²
phage/ml was precipitated with 5
ml 20% polyethylene glycol-8000 (w/v) / 2.5 M NaCl in 30 ml of PBS for 20 min on ice and
centrifuged for 20 min at 12,000 rpm, 4 °C. The precipitated phage pellet was resuspended with
PBS-0.5% BSA, 0.05% Tween 20 (PBT) buffer. The volume of PBT used to resuspend the
phage pellet depended on the number of wells of the plate used. For example, for 8 coated wells,
1 ml of phage library was needed, 100 ul for each well and the remaining 200 ul to titre the input
phage.
The phage library was first incubated on the pre-absorption plate for 1 hour at room temperature,
and then transferred to the antigen plate and incubated for 1 hour at room temperature. For the
selection on His-tagged proteins, the library was pre-absorbed on neutravidin and streptavidin,
alternating with each round. For the selection on the GST-tagged protein, the library was pre-
absorbed on GST for each round. The plates were washed 6 times with PBS-0.05% Tween 20 in
the first round of selection with an increasing number of washes (8, 10, 12) in each round to
increase the stringency of the selection. The phage was eluted using 0.1 N of HCL and
neutralized with Tris-HCL pH 8.0. The eluted phage was then amplified in OmniMAX™ 2 T1
Phage-Resistant (T1R
) E. coli strain for the next round.

38
At the end of each round, the titre of the phage was examined for enrichment. A 10-fold serial
dilution of the phage was carried out in PBS and 90 ul of mid-log OmniMAX E. coli strain was
infected with the diluted phage in a 96-well plate (Corning, cat# 3596). The infection proceeded
for 30 min at 37 °C. 5 ul of the infected E. coli was spotted on carbenicillin, kanamycin, and
tetracyclin 2YT agar plates. The next day, the number of infected colonies on the carbenicillin
plate was examined. The kanamycin was used to select for infection of the helper phage and the
tetracycline was used to select for viability of the E. coli, which is tetracycline resistant.
2.3.7 Phage-Fab ELISA
Binding specificities of the phage-Fab clones were assessed by ELISA. 2 ug/ml of His6-
RBD2304–2710-toxin A (57 nM) and His6/GST-RBD2286–2366-toxin B (57-100 nM) were
immobilized on protein binding Nunc MaxiSorp® flat-bottom 384 well plates (Thermo
Scientific, cat# 464718) overnight at 4 °C. Neutravidin and GST (2 ug/ml) were also
immobilized on separate wells as protein controls. Single bacterial colonies were plated for
round 3 and round 4 and each colony was inoculated in 600 ul 2YT/carbenicillin/M13K07 helper
phage. The next day the ELISA plates were blocked with 60 ul of PBS-0.5% BSA solution for 1
hour. The overnight cultures were centrifuged at 8000 rpm for 10min, and 30 ul of each phage
supernatant was aliquoted to each blocked well quadrant that was coated with the proteins. The
phage supernatant was incubated with the coated wells for 1 hour at room temperature.
Afterwards, the phage was removed and the wells were washed 6 times with PBS-0.05% Tween
20. The bound phage was detected with anti-M13-HRP (GE, cat#27-9421-01) and the signal was
developed with 25 ul of 3,3′,5,5′-tetramethylbenzidine (TMB) substrate after 6 times wash with
PBS-0.05% Tween 20 buffer. The reaction was stopped with 25 ul 1 M H3PO4 and the plate was
read for absorbance at a wavelength of 450 nm.
2.3.8 Sanger sequencing for the CDRs of the Fabs
The VL and VH of the Fab were amplified using previously established primers (Appendix B.
Table 2). The cycling protocol was 94 °C for 5 min; 94 °C for 30 s, 55 °C for 30 s, 72 °C for 1
min repeated 29 times; 72 °C for 5 min to amplify the variable regions of the light and heavy

39
chain of the Fabs. PCR cleanup was performed using an enzymatic approach. For every 4 ul of
PCR product, 0.3 ul of ExoI (NEB, cat# M0293) and 0.3 ul of shrimp alkaline phosphatase
(SAP) (NEB, cat# R0569) was added. Sequencing was performed by the Biobasic sequencing
facility. CDR sequences of Fab A3 are shown in Appendix A.
2.3.9 Purified Fab generation
Protein expression of the antibody fragments from Library F is under the control of a phoA
promoter and the expression of the proteins can be induced by phosphate depleted media. The
Fabs can be purified as an entity without the phage particle by introducing a stop codon via
oligonucleotide-directed mutagenesis at the junction between the gene encoding the pIII coat and
the antibody fragment. However, the expression of the Fab under the phoA promoter is low.
Alternatively, the Fab can be subcloned into a vector that can be expressed under an IPTG
expression vector.
The Fabs were subcloned into P3-His-Stop-IPTG vector (given by Genetech) that was modified
by Nicolas Economopoulos and Rachel Hanna (Appendix D. Figure 1B). The Fabs were
subcloned using a restriction-enzyme independent method developed by Walker et al. (2008).
The cycling protocol was: 98 °C for 30 s; 98 °C for 30 s, 57 °C for 30 s, 72 °C for 1 min repeated
29 times; 72 °C for 10 min (refer to Appendix B. Table 3 for primer list). These products were
purified using Qiagen PCR purification columns (cat# 28106). These products were then mixed
at 1:1 ratio and reannealed using the cycling protocol: 94 °C 5 min, 50 °C 3 min, and 20 °C 3
min, to obtain sticky ends. The vector was cut using NcoI and XbaI (NEB, cat# R0145). The cut
plasmid was dephosphorylated using Antarctic Phosphatase and inserts were phosphorylated
using T4 Phosphonucleotide Kinase to improve the cloning efficiency. The ligation was
performed using T4 ligase. The bacterial colonies were screened for successful ligation using
PCR method with cycling protocol: 95 °C for 3 min; 95 °C for 30 s, 57 °C for 30 s, 72 °C for 2
min repeated 29 times; 72 °C for 10 min (primers listed in Appendix B. Table 3).
The expression was induced by 1 mM of IPTG; from there the protein could be collected either
from the bacterial cells and/or the supernatant of the bacteria culture. If the Fabs were purified
using the bacterial pellet, the bacteria was lysed (1% Triton X-100, 1:100,000 of 250U/ul

40
benzonase, 2 mM MgCl2, 0.2 mM PMSF, and 100 mg/ml lysozyme) and the bacteria fragments
were collected through centrifugation at 12000 rpm for 40 min. The Fabs present in the
supernatant were captured at 4 °C for 2 hours with prewashed protein A-sepharose beads (GE
Healthcare, cat# 17-1279-03), using 500 ul bead volume per 250 ml of supernatant. If the Fabs
were purified using the supernatant from the bacteria culture, the supernatant was simply
incubated with the protein A-sepharose beads (500 ul bead volume per 250 ml of supernatant).
The protein A-sepharose bead column was washed 3 times with PBS and eluted with Fab elution
buffer (50 mM NaH2PO4, 100 mM H3PO4, 140 mM NaCl, pH 2.8). The eluted Fabs were
neutralized with 1 M Tris pH 10. The protein was then concentrated and buffer exchanged with
PBS using Millipore Amicon Ultra-4 and -15 Centrifugal Filter Units – 10,000 NMWL as
specified by the manufacturer.
2.3.10 Purified Fab ELISA for direct binding
The recombinant proteins, His6-RBD2304–2710-toxin A (57 nM) and His6/GST-RBD2286–2366-toxin
B (57-100 nM), were coated overnight at 4 °C on protein binding Nunc MaxiSorp® flat-bottom
384-well plates and blocked the next day with 60 ul of PBS-0.5%BSA for 1 h at room
temperature. For the full-length Toxin A protein, I coated 1 ug/ml (3 nM) of the protein. 30 ul of
1 ug/ml-5 ug/ml of Fab was added to the pre-blocked protein coated plates and incubated for 1
hour at room temperature. The plate was washed 6x with PBS-0.05% Tween 20, and 30ul of
anti-flag-HRP (1:5000 in PBS-0.5% BSA-0.05% Tween 20) was added and incubated for 30 min
at room temperature. The plate was then washed 6 times with PBS-0.05% Tween 20, and the
plate was developed with 25 ul of 3,3′,5,5′-tetramethylbenzidine (TMB) substrate. The reaction
was stopped with 25 ul 1 M H3PO4 and the plate was read for absorbance at a wavelength of 450
nm.
2.3.11 Determination of EC50 for each Fab by generating a binding curve
A dose-response curve of each purified Fabs was generated to determine the sub-maximal
concentration of Fab to use for the competitive ELISA and the EC50 values. The recombinant
proteins, His6-RBD2304–2710-toxin A (57 nM) and His6/GST-RBD2286–2366-toxin B (57-100 nM),
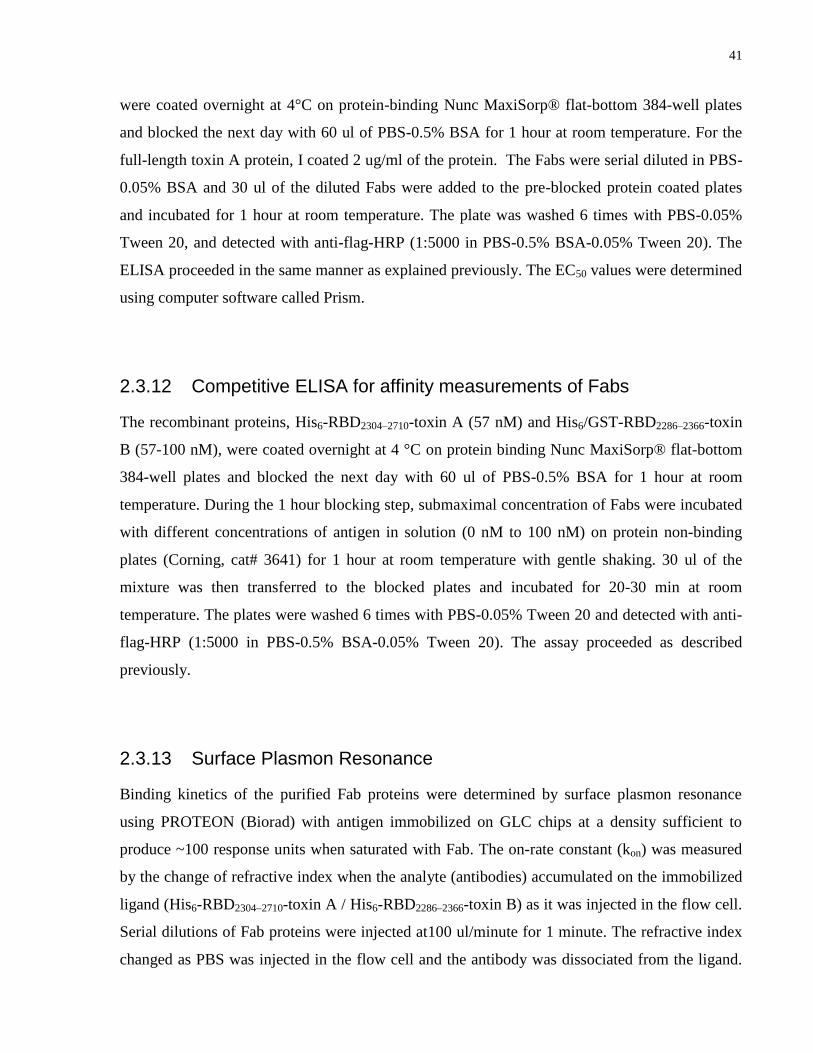
41
were coated overnight at 4°C on protein-binding Nunc MaxiSorp® flat-bottom 384-well plates
and blocked the next day with 60 ul of PBS-0.5% BSA for 1 hour at room temperature. For the
full-length toxin A protein, I coated 2 ug/ml of the protein. The Fabs were serial diluted in PBS-
0.05% BSA and 30 ul of the diluted Fabs were added to the pre-blocked protein coated plates
and incubated for 1 hour at room temperature. The plate was washed 6 times with PBS-0.05%
Tween 20, and detected with anti-flag-HRP (1:5000 in PBS-0.5% BSA-0.05% Tween 20). The
ELISA proceeded in the same manner as explained previously. The EC50 values were determined
using computer software called Prism.
2.3.12 Competitive ELISA for affinity measurements of Fabs
The recombinant proteins, His6-RBD2304–2710-toxin A (57 nM) and His6/GST-RBD2286–2366-toxin
B (57-100 nM), were coated overnight at 4 °C on protein binding Nunc MaxiSorp® flat-bottom
384-well plates and blocked the next day with 60 ul of PBS-0.5% BSA for 1 hour at room
temperature. During the 1 hour blocking step, submaximal concentration of Fabs were incubated
with different concentrations of antigen in solution (0 nM to 100 nM) on protein non-binding
plates (Corning, cat# 3641) for 1 hour at room temperature with gentle shaking. 30 ul of the
mixture was then transferred to the blocked plates and incubated for 20-30 min at room
temperature. The plates were washed 6 times with PBS-0.05% Tween 20 and detected with anti-
flag-HRP (1:5000 in PBS-0.5% BSA-0.05% Tween 20). The assay proceeded as described
previously.
2.3.13 Surface Plasmon Resonance
Binding kinetics of the purified Fab proteins were determined by surface plasmon resonance
using PROTEON (Biorad) with antigen immobilized on GLC chips at a density sufficient to
produce ~100 response units when saturated with Fab. The on-rate constant (kon) was measured
by the change of refractive index when the analyte (antibodies) accumulated on the immobilized
ligand (His6-RBD2304–2710-toxin A / His6-RBD2286–2366-toxin B) as it was injected in the flow cell.
Serial dilutions of Fab proteins were injected at100 ul/minute for 1 minute. The refractive index
changed as PBS was injected in the flow cell and the antibody was dissociated from the ligand.
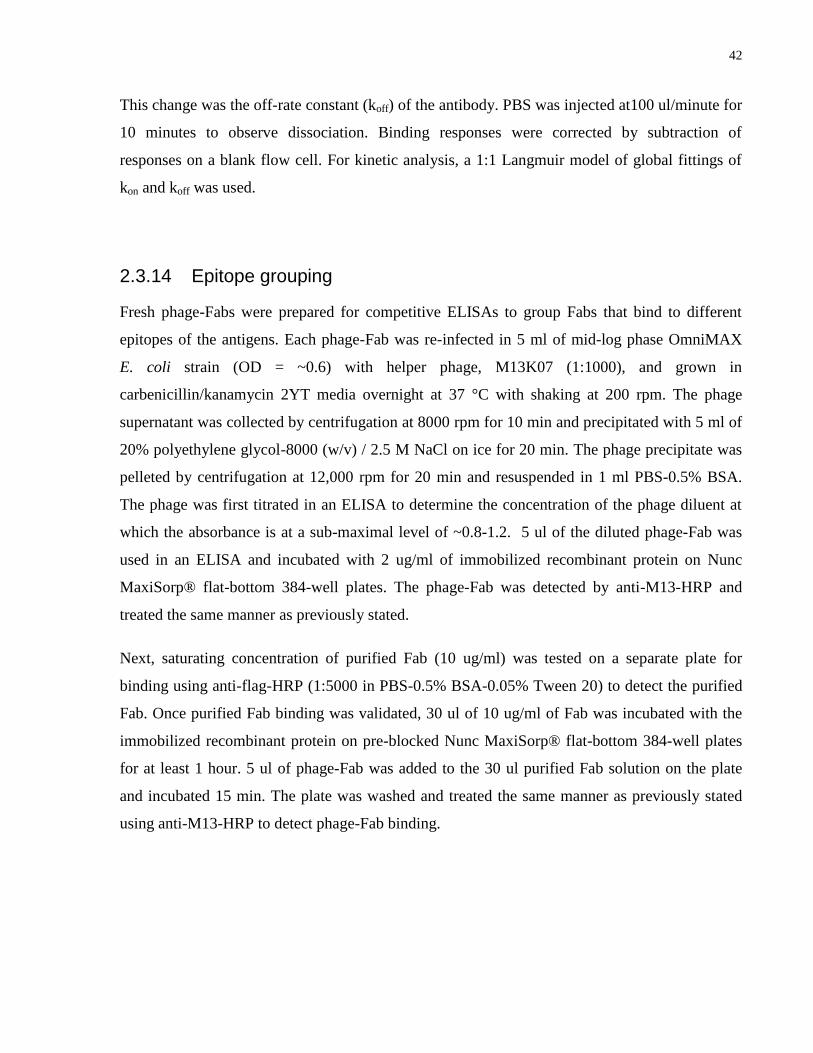
42
This change was the off-rate constant (koff) of the antibody. PBS was injected at100 ul/minute for
10 minutes to observe dissociation. Binding responses were corrected by subtraction of
responses on a blank flow cell. For kinetic analysis, a 1:1 Langmuir model of global fittings of
kon and koff was used.
2.3.14 Epitope grouping
Fresh phage-Fabs were prepared for competitive ELISAs to group Fabs that bind to different
epitopes of the antigens. Each phage-Fab was re-infected in 5 ml of mid-log phase OmniMAX
E. coli strain (OD = ~0.6) with helper phage, M13K07 (1:1000), and grown in
carbenicillin/kanamycin 2YT media overnight at 37 °C with shaking at 200 rpm. The phage
supernatant was collected by centrifugation at 8000 rpm for 10 min and precipitated with 5 ml of
20% polyethylene glycol-8000 (w/v) / 2.5 M NaCl on ice for 20 min. The phage precipitate was
pelleted by centrifugation at 12,000 rpm for 20 min and resuspended in 1 ml PBS-0.5% BSA.
The phage was first titrated in an ELISA to determine the concentration of the phage diluent at
which the absorbance is at a sub-maximal level of ~0.8-1.2. 5 ul of the diluted phage-Fab was
used in an ELISA and incubated with 2 ug/ml of immobilized recombinant protein on Nunc
MaxiSorp® flat-bottom 384-well plates. The phage-Fab was detected by anti-M13-HRP and
treated the same manner as previously stated.
Next, saturating concentration of purified Fab (10 ug/ml) was tested on a separate plate for
binding using anti-flag-HRP (1:5000 in PBS-0.5% BSA-0.05% Tween 20) to detect the purified
Fab. Once purified Fab binding was validated, 30 ul of 10 ug/ml of Fab was incubated with the
immobilized recombinant protein on pre-blocked Nunc MaxiSorp® flat-bottom 384-well plates
for at least 1 hour. 5 ul of phage-Fab was added to the 30 ul purified Fab solution on the plate
and incubated 15 min. The plate was washed and treated the same manner as previously stated
using anti-M13-HRP to detect phage-Fab binding.

43
2.3.15 Cytotoxicity assay
The cytotoxicity assay was conducted by John Tam from Dr. Roman Melnyk’s Lab at the
Hospital for Sick Children in Toronto, ON. In the assay, 10000 cells of IMR90 cells (in EMEM
media) was plated per well. The next day, the media was exchanged with serum-free EMEM
with the addition of 1 uM cytotracker orange for 3 hours. On a separate plate, two-fold dilutions
of Fab in serum-free media plus 400pM of native TcdA (List Biological Laboratories, Inc., cat#
152B) was pre-incubated for 1 hour and then the mixture was added to the cells by media
exchange. After 24 hours (when cell rounding in controls became evident), the media was
changed to complete media (EMEM with serum). Cell rounding was quantitated using the
Cellomics array scan (Thermo Scientific).

44
Chapter 3 Developing high-affinity synthetic human antibodies for CDT
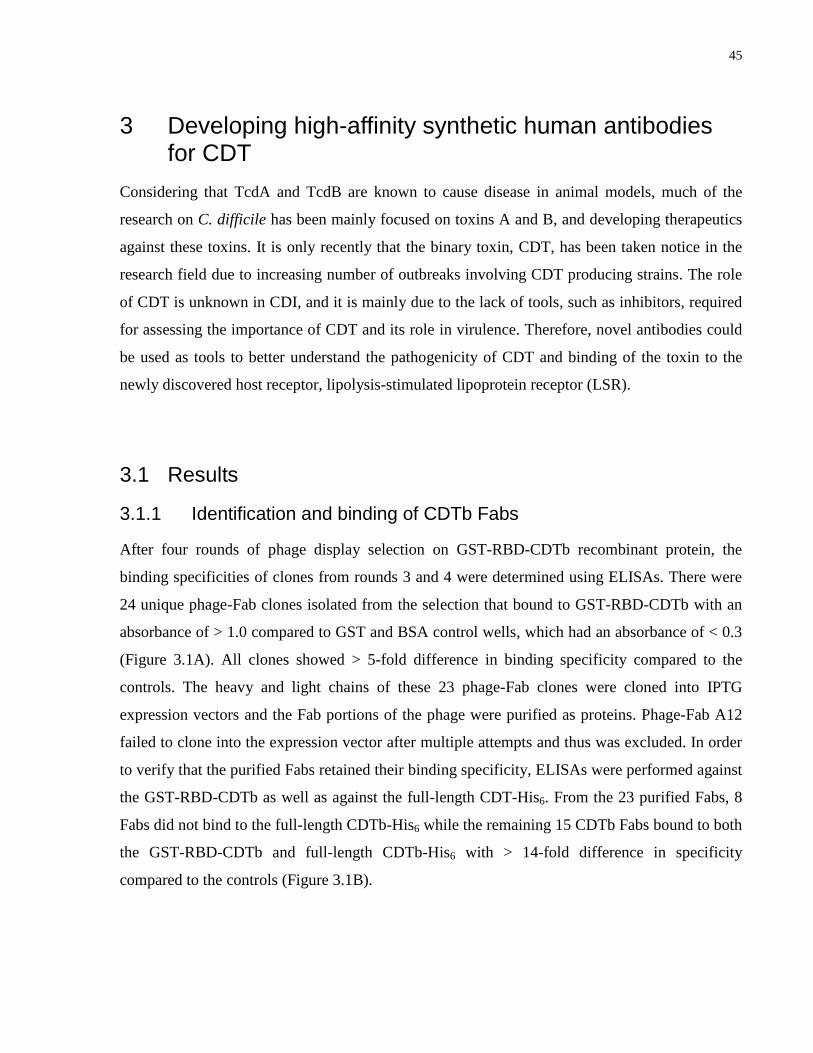
45
3 Developing high-affinity synthetic human antibodies for CDT
Considering that TcdA and TcdB are known to cause disease in animal models, much of the
research on C. difficile has been mainly focused on toxins A and B, and developing therapeutics
against these toxins. It is only recently that the binary toxin, CDT, has been taken notice in the
research field due to increasing number of outbreaks involving CDT producing strains. The role
of CDT is unknown in CDI, and it is mainly due to the lack of tools, such as inhibitors, required
for assessing the importance of CDT and its role in virulence. Therefore, novel antibodies could
be used as tools to better understand the pathogenicity of CDT and binding of the toxin to the
newly discovered host receptor, lipolysis-stimulated lipoprotein receptor (LSR).
3.1 Results
3.1.1 Identification and binding of CDTb Fabs
After four rounds of phage display selection on GST-RBD-CDTb recombinant protein, the
binding specificities of clones from rounds 3 and 4 were determined using ELISAs. There were
24 unique phage-Fab clones isolated from the selection that bound to GST-RBD-CDTb with an
absorbance of > 1.0 compared to GST and BSA control wells, which had an absorbance of < 0.3
(Figure 3.1A). All clones showed > 5-fold difference in binding specificity compared to the
controls. The heavy and light chains of these 23 phage-Fab clones were cloned into IPTG
expression vectors and the Fab portions of the phage were purified as proteins. Phage-Fab A12
failed to clone into the expression vector after multiple attempts and thus was excluded. In order
to verify that the purified Fabs retained their binding specificity, ELISAs were performed against
the GST-RBD-CDTb as well as against the full-length CDT-His6. From the 23 purified Fabs, 8
Fabs did not bind to the full-length CDTb-His6 while the remaining 15 CDTb Fabs bound to both
the GST-RBD-CDTb and full-length CDTb-His6 with > 14-fold difference in specificity
compared to the controls (Figure 3.1B).
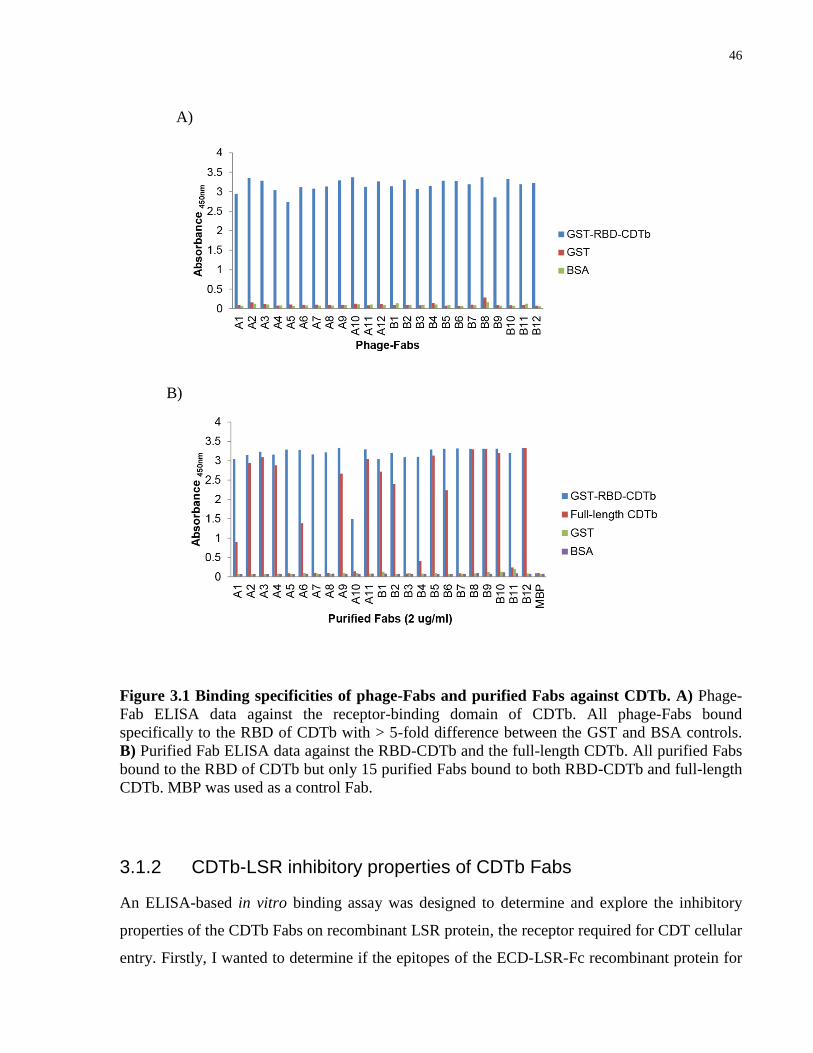
46
Figure 3.1 Binding specificities of phage-Fabs and purified Fabs against CDTb. A) Phage-
Fab ELISA data against the receptor-binding domain of CDTb. All phage-Fabs bound
specifically to the RBD of CDTb with > 5-fold difference between the GST and BSA controls.
B) Purified Fab ELISA data against the RBD-CDTb and the full-length CDTb. All purified Fabs
bound to the RBD of CDTb but only 15 purified Fabs bound to both RBD-CDTb and full-length
CDTb. MBP was used as a control Fab.
3.1.2 CDTb-LSR inhibitory properties of CDTb Fabs
An ELISA-based in vitro binding assay was designed to determine and explore the inhibitory
properties of the CDTb Fabs on recombinant LSR protein, the receptor required for CDT cellular
entry. Firstly, I wanted to determine if the epitopes of the ECD-LSR-Fc recombinant protein for
A)
B)

47
CDTb binding were present and detectable by ELISA. The ECD-LSR-Fc was immobilized on
the plate and incubated with CDTb-His6, and the presence of CDTb-His6 remaining bound on the
plate after several washing steps was detected using anti-His6-HRP (Figure 3.2A). From the
assay, CDTb-His6 was found at detectable levels on the ECD-LSR-Fc immobilized well
(absorbance = ~2.5) compared to the well containing the background control, Fc protein, and a
no CDTb-His6 well (absorbance < 0.1) (Figure 3.2B). Additionally, a dose-curve was performed
to determine the concentration of CDTb that gave an absorbance at sub-maximal level (EC50)
and was calculated to be 19 nM of CDTb (Figure 3.2C). The binding assay could then be
manipulated to determine the inhibitory properties of the CDTb Fabs when these Fabs were pre-
incubated with the submaximal concentration of CDTb before pre-incubation with immobilized
ECD-LSR-Fc (Figure 3.2A).
Figure 3.2 Determination of CDTb concentration to use in the ELISA-based in vitro
binding assay. A) Schematic of the binding assay. The binding assay was modified to determine
if the Fabs can inhibit CDTb binding to LSR by pre-incubating the Fabs with CDTb for 1 hour
and incubating the mixture on the immobilized LSR. B) Graph of the ELISA data on LSR-CDTb
detection. CDTb was detected on the immobilized proteins with anti-His6-HRP C) EC50 binding
curve for LSR-CDTb interaction.
A)
C)
B)

48
From the binding assay, the CDTb Fabs were grouped into three categories. The first category
contained CDTb Fabs that did not bind to the full-length CDTb and showed the same absorbance
as MBP Fab and No Fab controls (absorbance = 0.8) (Figure 3.3A, B). The MBP Fab is a control
Fab that should not bind to CDTb and thus served as a negative control in the assay. The second
category contained CDTb Fabs that bound to CDTb but did not inhibit the CDTb-LSR
interaction. Because the Fab was also His6-tagged and could be detected by the anti-His6-HRP
along with CDTb-His6, these wells showed an amplified absorbance (absorbance > 0.8) above
MBP Fab control well and No Fab control well (Figure 3.3A, B)). The last category contained
five CDTb Fabs that inhibited the CDTb-LSR interaction and showed an absorbance below MBP
Fab control and No Fab control (absorbance < 0.8). The binding assay indicated that there were
five CDTb Fabs that could inhibit the CDTb-LSR interaction in vitro.
Figure 3.3 Data of the ELISA-based in vitro binding assay. A) ELISA data on the binding
assay. The red dotted line was the absorbance at which CDTb binding was detected in no Fab
and MBP Fab controls. The absorbance above the line indicates the presence of both CDTb and
Fab on the plate after the washing step. The absorbance below the line indicates that the Fabs
were able to inhibit CDTb binding (mean absorbance of CDTb binding to LSR after Fab
incubation ± SD with technical replicates of n = 3). B) The schematic displays the binding
scenario of three groups of Fabs determined from the binding assay.
A)
B)

49
3.1.3 Affinity measurements of CDTb Fabs and IgGs using SPR
In order to measure the binding affinity of the antibodies to CDTb, surface plasmon resonance
(SPR) was performed. The Fabs were also converted to the full-length IgG1 and the binding
properties of the IgGs were also determined. The Fabs/IgGs were injected in the flow cell and
the kon was measured as the change of the refractive index over time when the antibodies flowed
over and accumulated on the immobilized CDTb. The koff was measured as PBS was injected
into the flow cell and the antibodies dissociated from CDTb. These antibodies had a fast on-rate
and a slow off-rate, indicating that the protein-protein interaction between the antibody and
CDTb was very strong. This analysis showed that anti-CDTb Fabs (Table 3.1) and IgGs A3, B8,
B9, B10 and B12 (Table 3.2) have an estimated affinity of a KD value of < 10 nM, with some
Fabs and IgGs having a higher estimated affinity with a KD value of < 1 nM. The order of
affinity from highest to lowest binding Fabs was found to be B8 > A3 > B12 > B10 > B9 while
the order of affinity from highest to lowest as IgGs was found to be slightly different with B12 >
A3 > B8 > B10 > B9. The binding curves of the SPR data (Figure 3.4 and Figure 3.5) showed a
good and reliable fit to the curves.
Table 3.1 Surface plasmon resonance data for CDTb Fabs. The association rate constant
(kon) was determined by the rate at which the Fab bound to CDTb when injected into the flow
cell. The dissociation rate constant (koff) was determined by the rate at which the Fab was
released from the ligand surface when PBS was injected. The KD is the ratio of koff/kon. For
kinetic analysis, a 1:1 Langmuir model of global fittings of kon and koff was used. Rmax and Chi2
are displayed to show the confidence of the fit. For a good fit to the model, Chi2 should be less
than ~20% of Rmax.
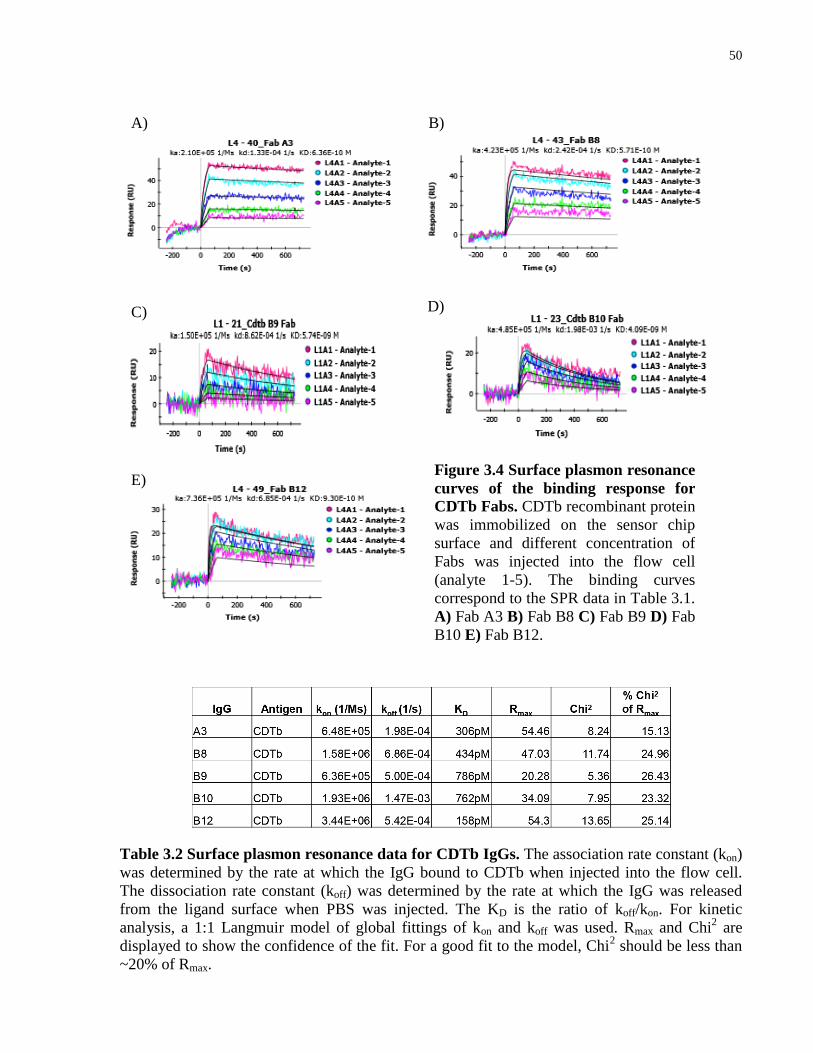
50
Table 3.2 Surface plasmon resonance data for CDTb IgGs. The association rate constant (kon)
was determined by the rate at which the IgG bound to CDTb when injected into the flow cell.
The dissociation rate constant (koff) was determined by the rate at which the IgG was released
from the ligand surface when PBS was injected. The KD is the ratio of koff/kon. For kinetic
analysis, a 1:1 Langmuir model of global fittings of kon and koff was used. Rmax and Chi2 are
displayed to show the confidence of the fit. For a good fit to the model, Chi2 should be less than
~20% of Rmax.
Figure 3.4 Surface plasmon resonance
curves of the binding response for
CDTb Fabs. CDTb recombinant protein
was immobilized on the sensor chip
surface and different concentration of
Fabs was injected into the flow cell
(analyte 1-5). The binding curves
correspond to the SPR data in Table 3.1.
A) Fab A3 B) Fab B8 C) Fab B9 D) Fab
B10 E) Fab B12.
A) B)
C)
E)
D)

51
3.1.4 Epitope grouping of CDTb affinity reagents
To assess whether the anti-CDTb Fabs bound to the same or different epitopes on CDTb, I
carried out competitive ELISAs to determine if purified Fabs could compete with phage-Fab
clones. Competing Fabs indicated that these Fabs bound to the same epitope and were grouped.
The ELISAs showed that the purified Fabs competed effectively with their own corresponding
phage-Fab clones and that Fabs A3, B9, B10, and B12 all competed with each other (Figure 3.6).
Phage-Fab B8 binding, however, was not inhibited by purified Fabs A3, B9, B10, and B12, but
the corresponding phage Fabs of A3, B9, B10, and B12 was inhibited by binding of purified Fab
B8. The competitive ELISA data suggested that Fabs A3, B9, B10, and B12 share the same
CDTb epitope and Fab B8 may not share the same binding site as Fabs A3, B9, B10, and B12.
Figure 3.5 Surface plasmon
resonance curves of the binding
response for the CDTb IgGs. CDTb
recombinant protein was immobilized
on the sensor chip surface and different
concentration of IgGs was injected into
the flow cell (analyte 1-5). The binding
curves correspond to the SPR data in
Table 3.2. A) IgG A3 B) IgG B8 C)
IgG B9 D) IgG B10 E) IgG B12.
A) B)
C) D)
E)
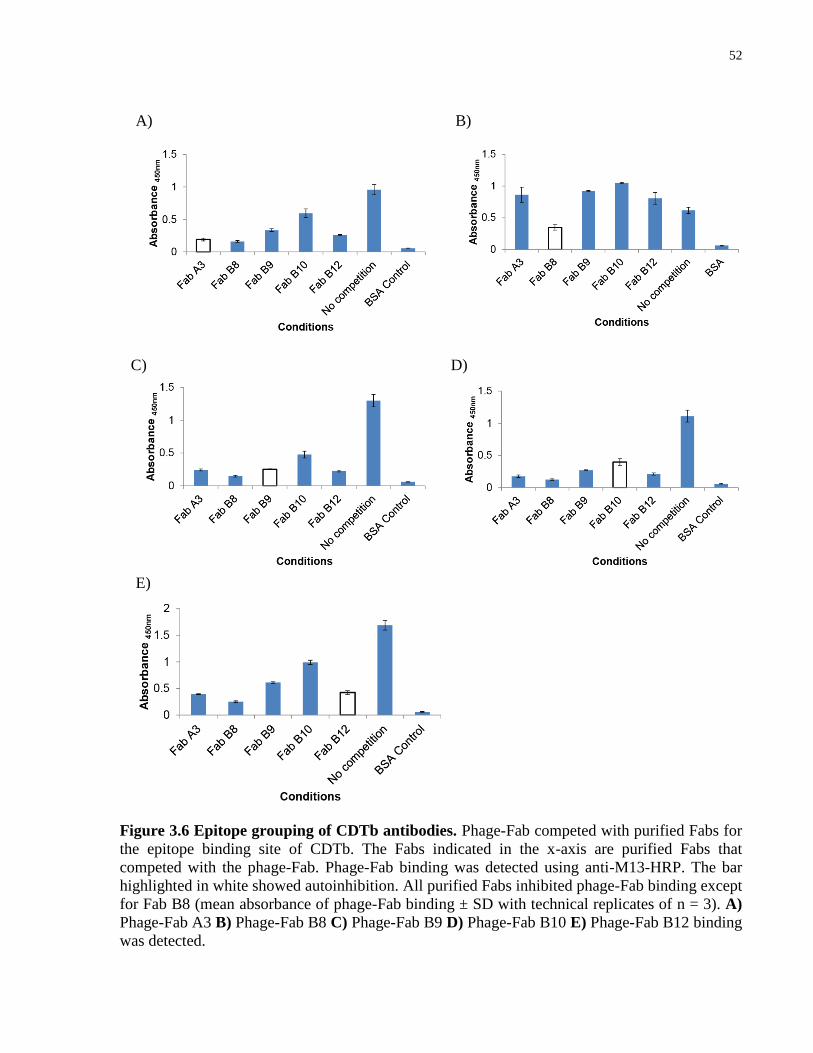
52
Figure 3.6 Epitope grouping of CDTb antibodies. Phage-Fab competed with purified Fabs for
the epitope binding site of CDTb. The Fabs indicated in the x-axis are purified Fabs that
competed with the phage-Fab. Phage-Fab binding was detected using anti-M13-HRP. The bar
highlighted in white showed autoinhibition. All purified Fabs inhibited phage-Fab binding except
for Fab B8 (mean absorbance of phage-Fab binding ± SD with technical replicates of n = 3). A)
Phage-Fab A3 B) Phage-Fab B8 C) Phage-Fab B9 D) Phage-Fab B10 E) Phage-Fab B12 binding
was detected.
E)
A) B)
C) D)
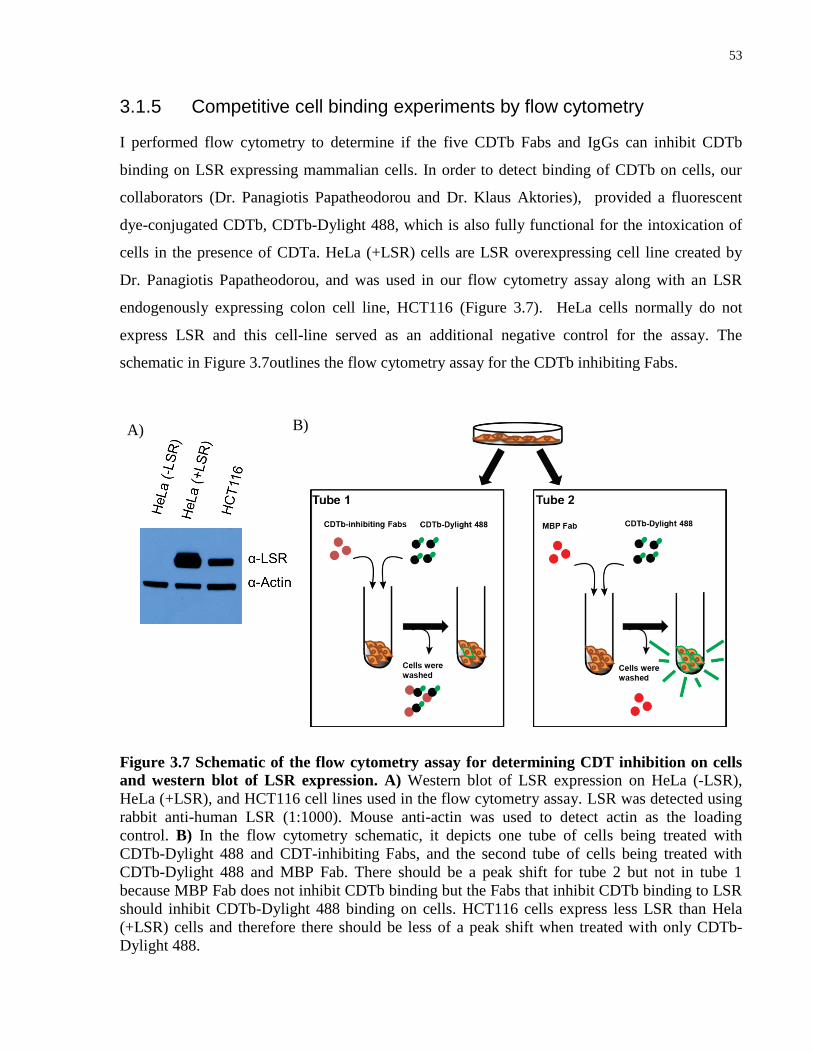
53
3.1.5 Competitive cell binding experiments by flow cytometry
I performed flow cytometry to determine if the five CDTb Fabs and IgGs can inhibit CDTb
binding on LSR expressing mammalian cells. In order to detect binding of CDTb on cells, our
collaborators (Dr. Panagiotis Papatheodorou and Dr. Klaus Aktories), provided a fluorescent
dye-conjugated CDTb, CDTb-Dylight 488, which is also fully functional for the intoxication of
cells in the presence of CDTa. HeLa (+LSR) cells are LSR overexpressing cell line created by
Dr. Panagiotis Papatheodorou, and was used in our flow cytometry assay along with an LSR
endogenously expressing colon cell line, HCT116 (Figure 3.7). HeLa cells normally do not
express LSR and this cell-line served as an additional negative control for the assay. The
schematic in Figure 3.7outlines the flow cytometry assay for the CDTb inhibiting Fabs.
Figure 3.7 Schematic of the flow cytometry assay for determining CDT inhibition on cells
and western blot of LSR expression. A) Western blot of LSR expression on HeLa (-LSR),
HeLa (+LSR), and HCT116 cell lines used in the flow cytometry assay. LSR was detected using
rabbit anti-human LSR (1:1000). Mouse anti-actin was used to detect actin as the loading
control. B) In the flow cytometry schematic, it depicts one tube of cells being treated with
CDTb-Dylight 488 and CDT-inhibiting Fabs, and the second tube of cells being treated with
CDTb-Dylight 488 and MBP Fab. There should be a peak shift for tube 2 but not in tube 1
because MBP Fab does not inhibit CDTb binding but the Fabs that inhibit CDTb binding to LSR
should inhibit CDTb-Dylight 488 binding on cells. HCT116 cells express less LSR than Hela
(+LSR) cells and therefore there should be less of a peak shift when treated with only CDTb-
Dylight 488.
A) B)

54
In the absence of CDTb Fab or IgG, a fluorescent peak shift for CDTb-Dylight 488-treated HeLa
(+LSR) and HCT116 cells could be seen; with median fluorescence intensity values greater than
CDTb antibody-treated cells. The anti-CDTb Fab/IgG-treated HeLa (+LSR) cells had the same
fluorescence peak shift as the untreated cells and CDTb-Dylight 488-treated HeLa (-LSR) cells
(Figure 3.8 and Figure 3.10). Notably, HCT116 cells express LSR at a lower level than the HeLa
(+LSR) cells and therefore a smaller fluorescence shift compared to the LSR over-expressing
cell line was expected and seen. Strikingly, the antibodies prevented the CDTb-Dylight 488
binding to HCT116 cells and thus showed a peak shift similar to the untreated cells (Figure 3.9
and Figure 3.11). The flow cytometry results were the same when I pre-incubated CDTb-Dylight
with the antibody for 1 hour at 4 °C or when I added the CDTb-Dylight 488 and antibody
simultaneously. From the flow cytometry analysis, I showed that all five CDTb Fabs and IgGs
inhibited CDTb binding on HeLa (+LSR) and HCT116 cells compared to MBP Fab/IgG control.
Figure 3.8 Flow cytometry of CDTb-Dylight 488 binding on HeLa (+LSR) cells when
treated with Fabs. Fabs with CDTb-Dylight 488 were incubated on cells for 30 minutes and
unbound CDTb was washed away. The fluorescence of the cells was then read. CDTb-Dylight
488 binding displayed a peak shift when cells were treated with only the CDTb. The Fab treated
cells inhibited CDTb binding, as there was either a slight or no peak shift and it overlapped the
peak representing the untreated cells. With the MBP Fab control treatment, there was a peak shift
that overlapped the CDTb-Dylight 488 alone. HeLa cells do not express the receptor and
therefore there was no peak shift. G = gated cell population. The table on the left shows the
frequency of the gated cell population and the median fluorescent intensity (MFI) in area G of
each treated samples. (MBP Fab-CDTb-Dylight 488 treated HeLa (+LSR) cells = 25.03 MFI,
CDTb Fabs-CDTb-Dylight 488 treated HeLa (+LSR) cells < 12 MFI).
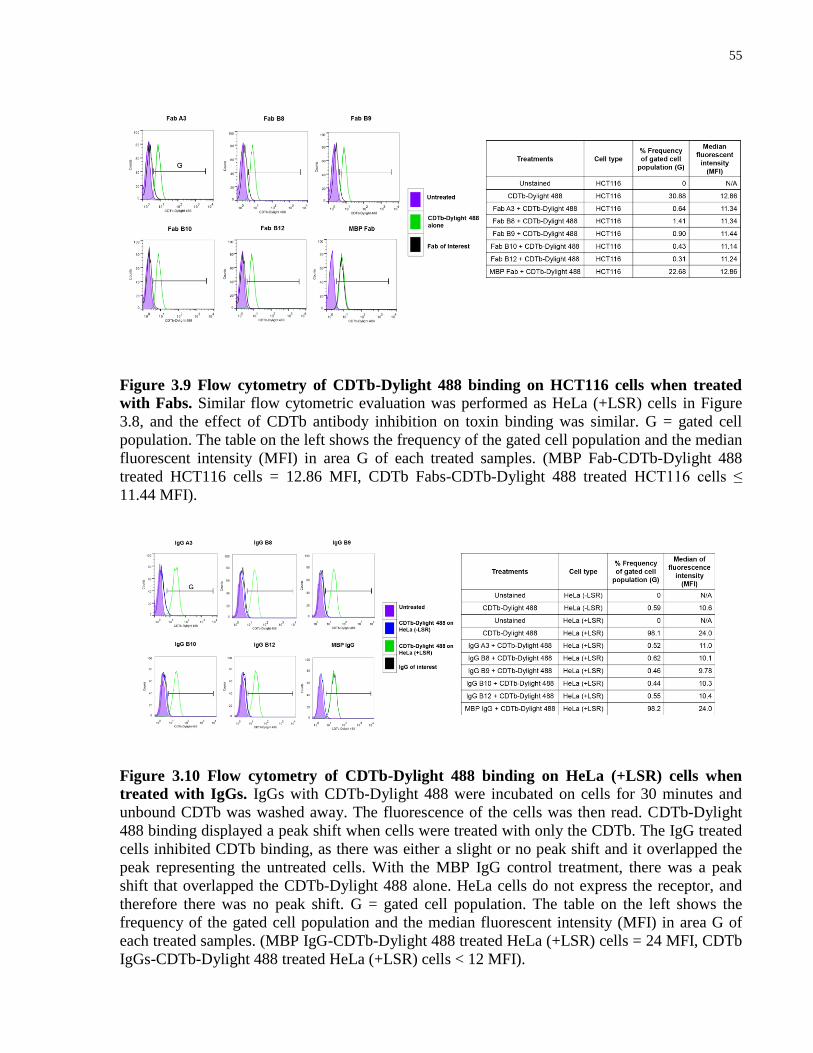
55
Figure 3.9 Flow cytometry of CDTb-Dylight 488 binding on HCT116 cells when treated
with Fabs. Similar flow cytometric evaluation was performed as HeLa (+LSR) cells in Figure
3.8, and the effect of CDTb antibody inhibition on toxin binding was similar. G = gated cell
population. The table on the left shows the frequency of the gated cell population and the median
fluorescent intensity (MFI) in area G of each treated samples. (MBP Fab-CDTb-Dylight 488
treated HCT116 cells = 12.86 MFI, CDTb Fabs-CDTb-Dylight 488 treated HCT116 cells ≤
11.44 MFI).
Figure 3.10 Flow cytometry of CDTb-Dylight 488 binding on HeLa (+LSR) cells when
treated with IgGs. IgGs with CDTb-Dylight 488 were incubated on cells for 30 minutes and
unbound CDTb was washed away. The fluorescence of the cells was then read. CDTb-Dylight
488 binding displayed a peak shift when cells were treated with only the CDTb. The IgG treated
cells inhibited CDTb binding, as there was either a slight or no peak shift and it overlapped the
peak representing the untreated cells. With the MBP IgG control treatment, there was a peak
shift that overlapped the CDTb-Dylight 488 alone. HeLa cells do not express the receptor, and
therefore there was no peak shift. G = gated cell population. The table on the left shows the
frequency of the gated cell population and the median fluorescent intensity (MFI) in area G of
each treated samples. (MBP IgG-CDTb-Dylight 488 treated HeLa (+LSR) cells = 24 MFI, CDTb
IgGs-CDTb-Dylight 488 treated HeLa (+LSR) cells < 12 MFI).
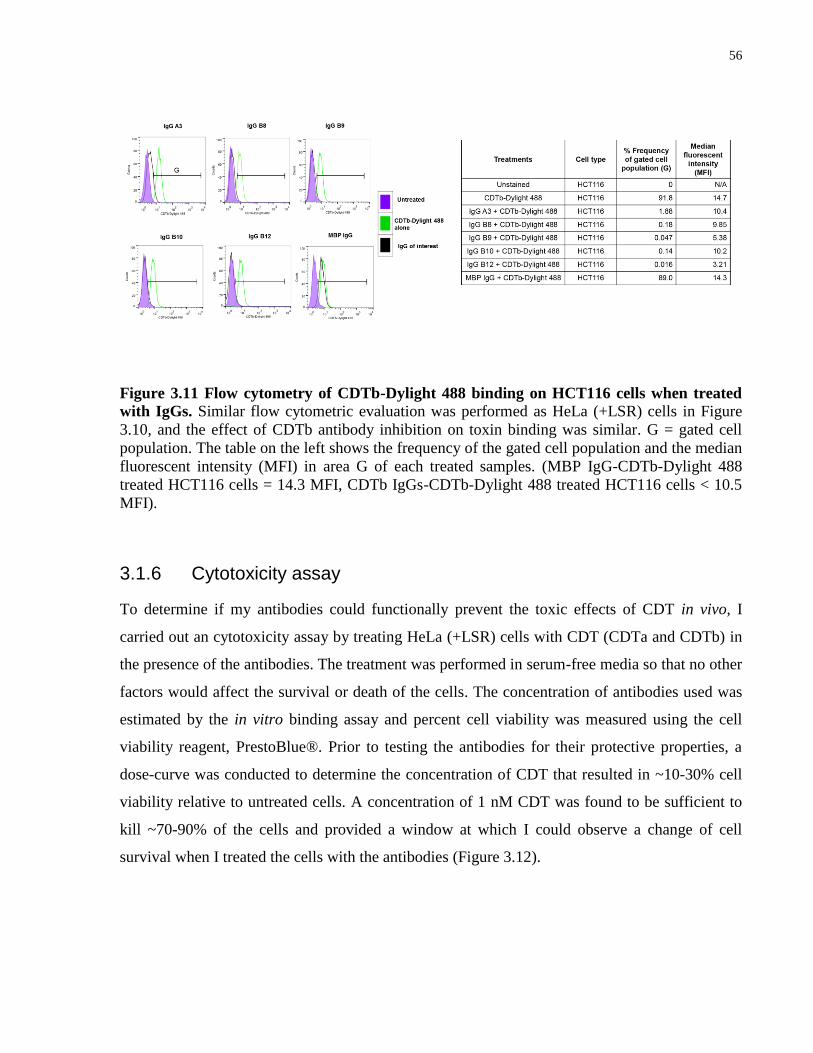
56
Figure 3.11 Flow cytometry of CDTb-Dylight 488 binding on HCT116 cells when treated
with IgGs. Similar flow cytometric evaluation was performed as HeLa (+LSR) cells in Figure
3.10, and the effect of CDTb antibody inhibition on toxin binding was similar. G = gated cell
population. The table on the left shows the frequency of the gated cell population and the median
fluorescent intensity (MFI) in area G of each treated samples. (MBP IgG-CDTb-Dylight 488
treated HCT116 cells = 14.3 MFI, CDTb IgGs-CDTb-Dylight 488 treated HCT116 cells < 10.5
MFI).
3.1.6 Cytotoxicity assay
To determine if my antibodies could functionally prevent the toxic effects of CDT in vivo, I
carried out an cytotoxicity assay by treating HeLa (+LSR) cells with CDT (CDTa and CDTb) in
the presence of the antibodies. The treatment was performed in serum-free media so that no other
factors would affect the survival or death of the cells. The concentration of antibodies used was
estimated by the in vitro binding assay and percent cell viability was measured using the cell
viability reagent, PrestoBlue®. Prior to testing the antibodies for their protective properties, a
dose-curve was conducted to determine the concentration of CDT that resulted in ~10-30% cell
viability relative to untreated cells. A concentration of 1 nM CDT was found to be sufficient to
kill ~70-90% of the cells and provided a window at which I could observe a change of cell
survival when I treated the cells with the antibodies (Figure 3.12).
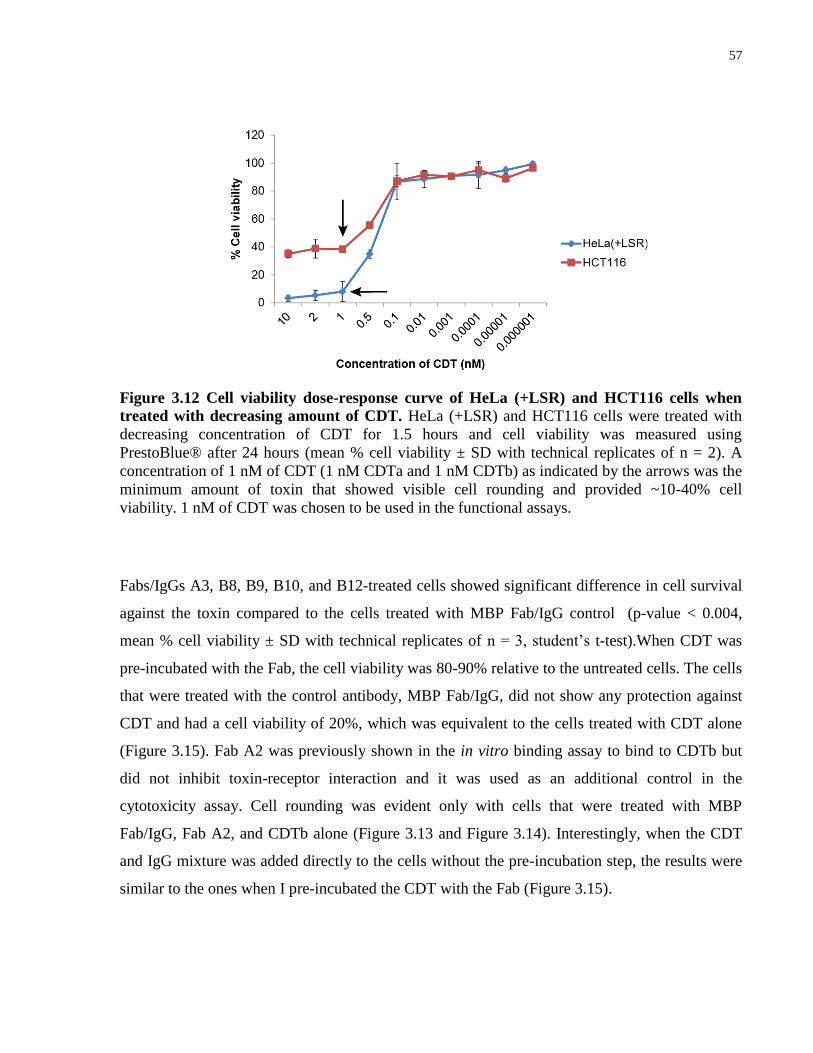
57
Figure 3.12 Cell viability dose-response curve of HeLa (+LSR) and HCT116 cells when
treated with decreasing amount of CDT. HeLa (+LSR) and HCT116 cells were treated with
decreasing concentration of CDT for 1.5 hours and cell viability was measured using
PrestoBlue® after 24 hours (mean % cell viability ± SD with technical replicates of n = 2). A
concentration of 1 nM of CDT (1 nM CDTa and 1 nM CDTb) as indicated by the arrows was the
minimum amount of toxin that showed visible cell rounding and provided ~10-40% cell
viability. 1 nM of CDT was chosen to be used in the functional assays.
Fabs/IgGs A3, B8, B9, B10, and B12-treated cells showed significant difference in cell survival
against the toxin compared to the cells treated with MBP Fab/IgG control (p-value < 0.004,
mean % cell viability ± SD with technical replicates of n = 3, student’s t-test).When CDT was
pre-incubated with the Fab, the cell viability was 80-90% relative to the untreated cells. The cells
that were treated with the control antibody, MBP Fab/IgG, did not show any protection against
CDT and had a cell viability of 20%, which was equivalent to the cells treated with CDT alone
(Figure 3.15). Fab A2 was previously shown in the in vitro binding assay to bind to CDTb but
did not inhibit toxin-receptor interaction and it was used as an additional control in the
cytotoxicity assay. Cell rounding was evident only with cells that were treated with MBP
Fab/IgG, Fab A2, and CDTb alone (Figure 3.13 and Figure 3.14). Interestingly, when the CDT
and IgG mixture was added directly to the cells without the pre-incubation step, the results were
similar to the ones when I pre-incubated the CDT with the Fab (Figure 3.15).
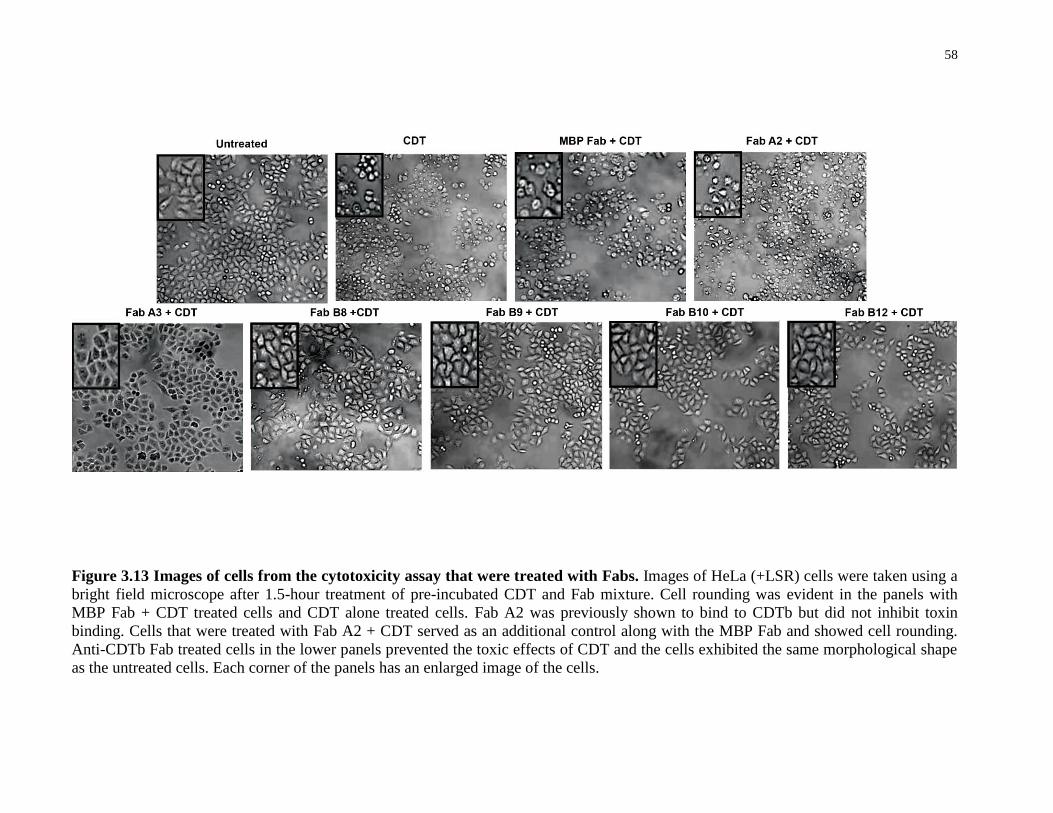
58
Figure 3.13 Images of cells from the cytotoxicity assay that were treated with Fabs. Images of HeLa (+LSR) cells were taken using a
bright field microscope after 1.5-hour treatment of pre-incubated CDT and Fab mixture. Cell rounding was evident in the panels with
MBP Fab + CDT treated cells and CDT alone treated cells. Fab A2 was previously shown to bind to CDTb but did not inhibit toxin
binding. Cells that were treated with Fab A2 + CDT served as an additional control along with the MBP Fab and showed cell rounding.
Anti-CDTb Fab treated cells in the lower panels prevented the toxic effects of CDT and the cells exhibited the same morphological shape
as the untreated cells. Each corner of the panels has an enlarged image of the cells.
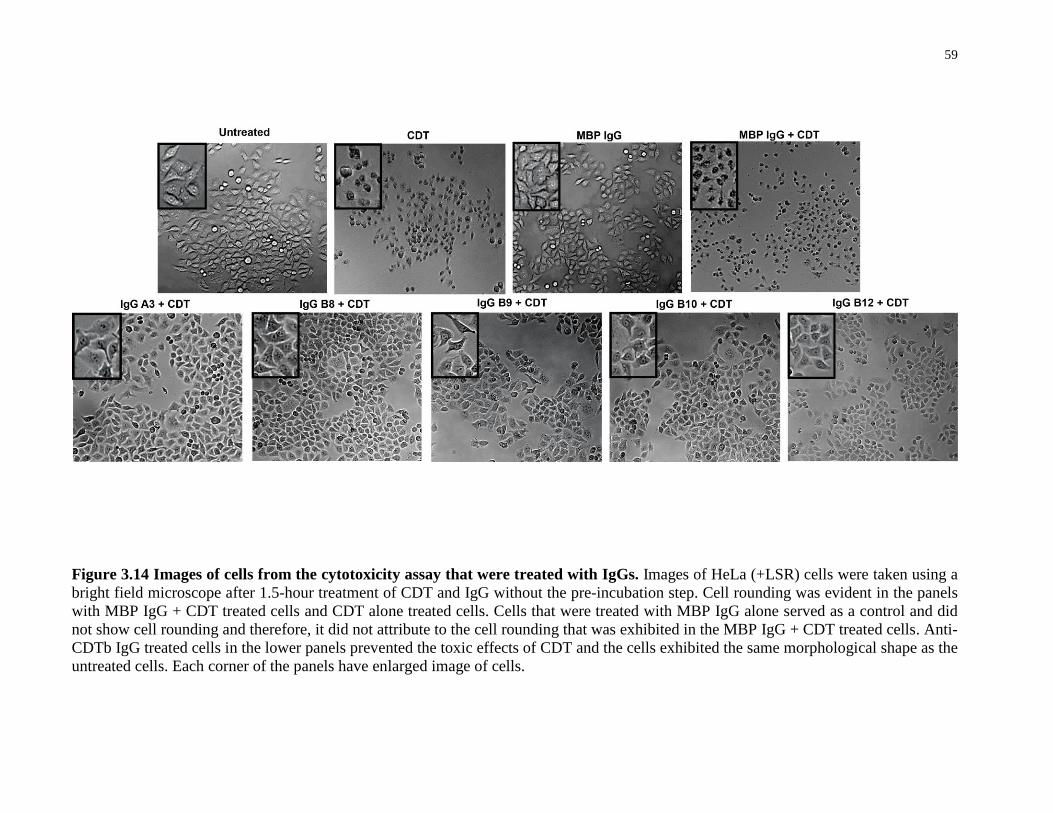
59
Figure 3.14 Images of cells from the cytotoxicity assay that were treated with IgGs. Images of HeLa (+LSR) cells were taken using a
bright field microscope after 1.5-hour treatment of CDT and IgG without the pre-incubation step. Cell rounding was evident in the panels
with MBP IgG + CDT treated cells and CDT alone treated cells. Cells that were treated with MBP IgG alone served as a control and did
not show cell rounding and therefore, it did not attribute to the cell rounding that was exhibited in the MBP IgG + CDT treated cells. Anti-
CDTb IgG treated cells in the lower panels prevented the toxic effects of CDT and the cells exhibited the same morphological shape as the
untreated cells. Each corner of the panels have enlarged image of cells.

60
Figure 3.15 Cell viability measurements from the cytotoxicity assays. The percent cell
viability was calculated relative to the cell viability of untreated cells and student’s t-test was
used to measure the significance of the difference in cell viability between anti-CDTb antibody
treatments and MBP antibody control. A) 1 nM CDT was pre-incubated with 91 nM Fabs for 1
hour prior to treating the cells, and PrestoBlue® was used to measure the cell viability after
treatment. Fab A2 was previously shown to bind to CDTb but did not inhibit toxin binding and
was used as an additional control. All cells treated with the CDTb inhibiting Fabs showed cell
viability similar to untreated and had greater cell viability than MBP Fab (*p-value < 0.001,
mean % cell viability ± SD with technical replicates of n = 3) and Fab A2 treated cells. B) 1
nM CDT and 100 nM IgG was used to treat HeLa (+LSR) cells without a pre-incubation step,
and PrestoBlue® was used to measure the cell viability after treatment. All cells treated with the
CDTb inhibiting IgGs showed cell viability similar to untreated and had greater cell viability
than MBP IgG (**p-value < 0.004, mean % cell viability ± SD with technical replicates of n =
3).
From the cytotoxicity assay, I determined that ~100 nM of anti-CDTb Fab/IgG prevented
intoxication of 1 nM CDT and increased cell survival but the minimum concentration of
antibody that could provide the same level of protection against 1 nM of CDT was unknown.
A)
B)

61
Therefore, I carried out a cytotoxicity assay and decreased the concentration of antibodies by
serially diluting the antibodies by two-fold. Strikingly, there was a correlation between the
amount of added antibody and level of cell viability, and that there was a gradual decrease in
cell viability, as the concentration of antibodies decreased. As a Fab, the ranking of the
antibodies for their protective properties against CDT on HeLa (+LSR) cells was B12 > B8 >
A3 > B9 > B10 (Figure 3.16A). Although Fab A3 initially had the highest cell viability from the
dose-curve, the cell viability dropped more rapidly as the concentration of A3 decreased after 91
nM of Fab. Unlike Fab A3, I observed a steady drop of viable cells for Fabs B8 and B12
treatments with a decrease in effectiveness at 11 nM and 6 nM of treatment, respectively. The
dose-curve was also performed on the HCT116 cell line and although the protective effects from
Fab treatments were not as dramatic as on HeLa (+LSR) cells, I also observed decreased cell
survival corresponding to Fab concentration (Figure 3.16B). As an IgG, the antibodies showed
a similar trend in their effectiveness against CDT. The ranking of the IgGs for their protective
properties on HeLa (+LSR) cells was A3 > B8 > B12 > B9 > B10 and generally showed
increased cell survival compared to the Fab treatments as expected upon reformatting from
monovalent Fabs to bivalent IgGs (Figure 3.17).
Figure 3.16 Cell viability dose-response curve of HeLa (+LSR) and HCT116 cells when
treated with 1 nM of CDT and decreasing concentration of Fabs. A) HeLa (+LSR) cells that
were treated with MBP Fab maintained a cell viability of 30-35% as the concentration of the
Fab decreased. The CDTb Fabs displayed decreased cell viability from 60-98% to ~35% of
viable cells as the Fab concentration decreased. CDT alone treated cells had a cell viability of
~12%. Fabs B9 and B10 provided the lowest protection, Fab A3 provided an intermediate
protection, and Fabs B8 and B12 provided the highest protection against CDT intoxication. B)
HCT116 cells that were treated with MBP Fab maintained a cell viability of 25% as the
concentration of the Fab decreased. The CDTb Fabs displayed decreased cell viability from 90%
to 25% of viable cells as the Fab concentration decreased. Fabs B9 and B10 provided the lowest
protection, Fabs A3 and B12 provided an intermediate protection, and Fab B8 provided the
highest protection against CDT intoxication.
A) B)
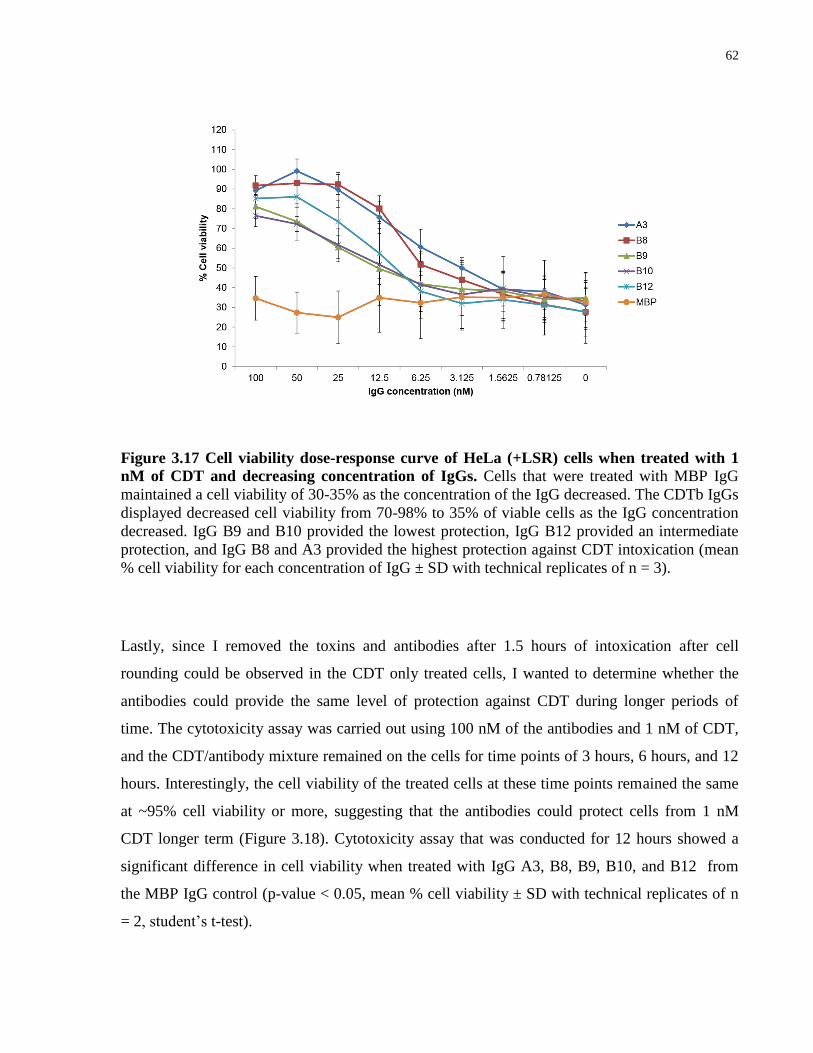
62
Figure 3.17 Cell viability dose-response curve of HeLa (+LSR) cells when treated with 1
nM of CDT and decreasing concentration of IgGs. Cells that were treated with MBP IgG
maintained a cell viability of 30-35% as the concentration of the IgG decreased. The CDTb IgGs
displayed decreased cell viability from 70-98% to 35% of viable cells as the IgG concentration
decreased. IgG B9 and B10 provided the lowest protection, IgG B12 provided an intermediate
protection, and IgG B8 and A3 provided the highest protection against CDT intoxication (mean
% cell viability for each concentration of IgG ± SD with technical replicates of n = 3).
Lastly, since I removed the toxins and antibodies after 1.5 hours of intoxication after cell
rounding could be observed in the CDT only treated cells, I wanted to determine whether the
antibodies could provide the same level of protection against CDT during longer periods of
time. The cytotoxicity assay was carried out using 100 nM of the antibodies and 1 nM of CDT,
and the CDT/antibody mixture remained on the cells for time points of 3 hours, 6 hours, and 12
hours. Interestingly, the cell viability of the treated cells at these time points remained the same
at ~95% cell viability or more, suggesting that the antibodies could protect cells from 1 nM
CDT longer term (Figure 3.18). Cytotoxicity assay that was conducted for 12 hours showed a
significant difference in cell viability when treated with IgG A3, B8, B9, B10, and B12 from
the MBP IgG control (p-value < 0.05, mean % cell viability ± SD with technical replicates of n
= 2, student’s t-test).
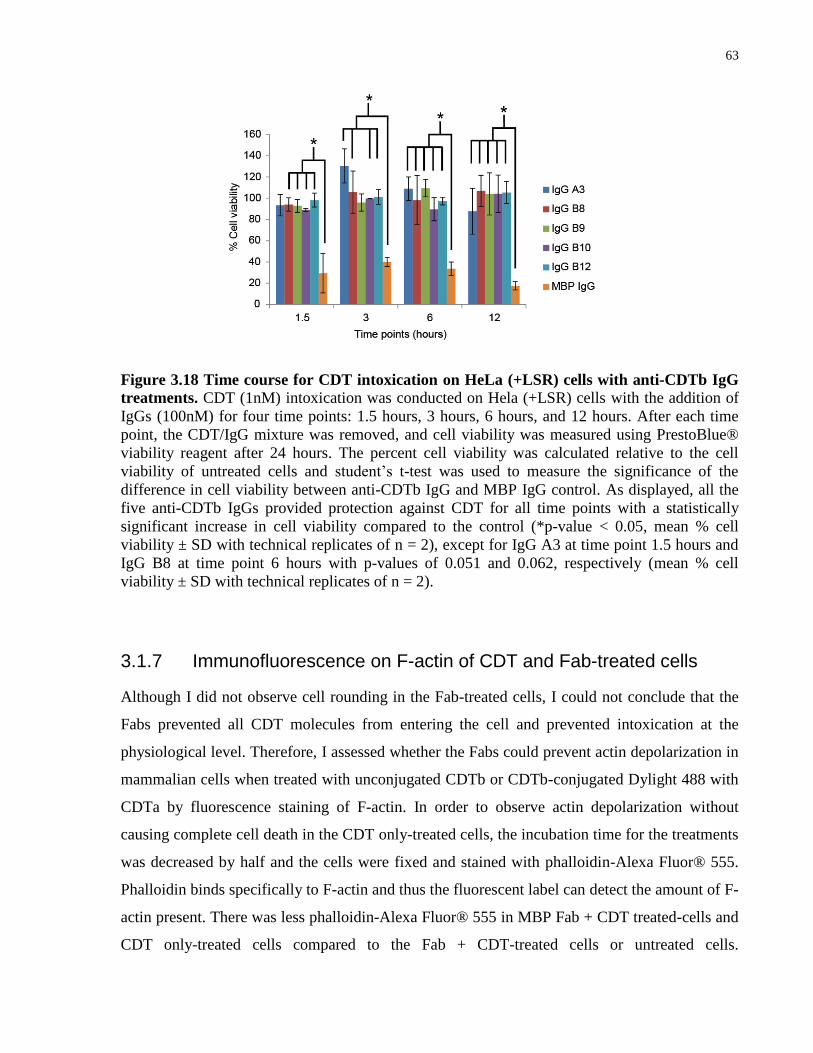
63
Figure 3.18 Time course for CDT intoxication on HeLa (+LSR) cells with anti-CDTb IgG
treatments. CDT (1nM) intoxication was conducted on Hela (+LSR) cells with the addition of
IgGs (100nM) for four time points: 1.5 hours, 3 hours, 6 hours, and 12 hours. After each time
point, the CDT/IgG mixture was removed, and cell viability was measured using PrestoBlue®
viability reagent after 24 hours. The percent cell viability was calculated relative to the cell
viability of untreated cells and student’s t-test was used to measure the significance of the
difference in cell viability between anti-CDTb IgG and MBP IgG control. As displayed, all the
five anti-CDTb IgGs provided protection against CDT for all time points with a statistically
significant increase in cell viability compared to the control (*p-value < 0.05, mean % cell
viability ± SD with technical replicates of n = 2), except for IgG A3 at time point 1.5 hours and
IgG B8 at time point 6 hours with p-values of 0.051 and 0.062, respectively (mean % cell
viability ± SD with technical replicates of n = 2).
3.1.7 Immunofluorescence on F-actin of CDT and Fab-treated cells
Although I did not observe cell rounding in the Fab-treated cells, I could not conclude that the
Fabs prevented all CDT molecules from entering the cell and prevented intoxication at the
physiological level. Therefore, I assessed whether the Fabs could prevent actin depolarization in
mammalian cells when treated with unconjugated CDTb or CDTb-conjugated Dylight 488 with
CDTa by fluorescence staining of F-actin. In order to observe actin depolarization without
causing complete cell death in the CDT only-treated cells, the incubation time for the treatments
was decreased by half and the cells were fixed and stained with phalloidin-Alexa Fluor® 555.
Phalloidin binds specifically to F-actin and thus the fluorescent label can detect the amount of F-
actin present. There was less phalloidin-Alexa Fluor® 555 in MBP Fab + CDT treated-cells and
CDT only-treated cells compared to the Fab + CDT-treated cells or untreated cells.

64
Additionally, the F-actin appeared fragmented in the cells that were not treated with anti-CDTb
Fabs (Figure 3.19). The immunohistochemistry on both HeLa and HCT116 cells demonstrated
that the cells retained the ability to polymerize G-actin to F-actin when treated with the Fabs as
compared to untreated cells. Notably, the CDTb-Dylight 488 was seen present as clustered
puncta in the cytoplasm of only MBP Fab + CDT-treated HCT116 cells and the CDT only-
treated cells (Figure 3.20). By visualization of F-actin, I demonstrated that CDTb Fabs could
prevent CDT entry into cells at a level that could also prevent the actin depolymerization caused
by the toxin.
Figure 3.19 Immunofluorescence images of F-actin stained HeLa (+LSR) cells after anti-
CDTb Fab and CDT (CDTb and CDTa) treatments. Treatments as indicated above the
images were performed prior to staining of F-actin with phalloidin-Alexa Fluor® 555 (red). The
nucleus was stained with Hoechst 33342 (blue). ~91 nM of Fab and ~1 nM of CDT (1 nM
CDTb and 1nM CDTa) was used to treat the cells for 45 min. The panel with untreated cells was
not treated with Fabs or CDT. Treatments with CDT in the presence of anti-CDTb Fabs, A3, B8,
B9, B10, and B12 showed that the anti-CDTb Fabs prevented F-actin depolymerization as
compared to the untreated cells. The panels with CDT only and MBP Fab-treated cells showed
fragmented F-actin indicating F-actin depolymerization. MBP Fab is a Fab that binds to maltose
binding protein and it was served as a control.
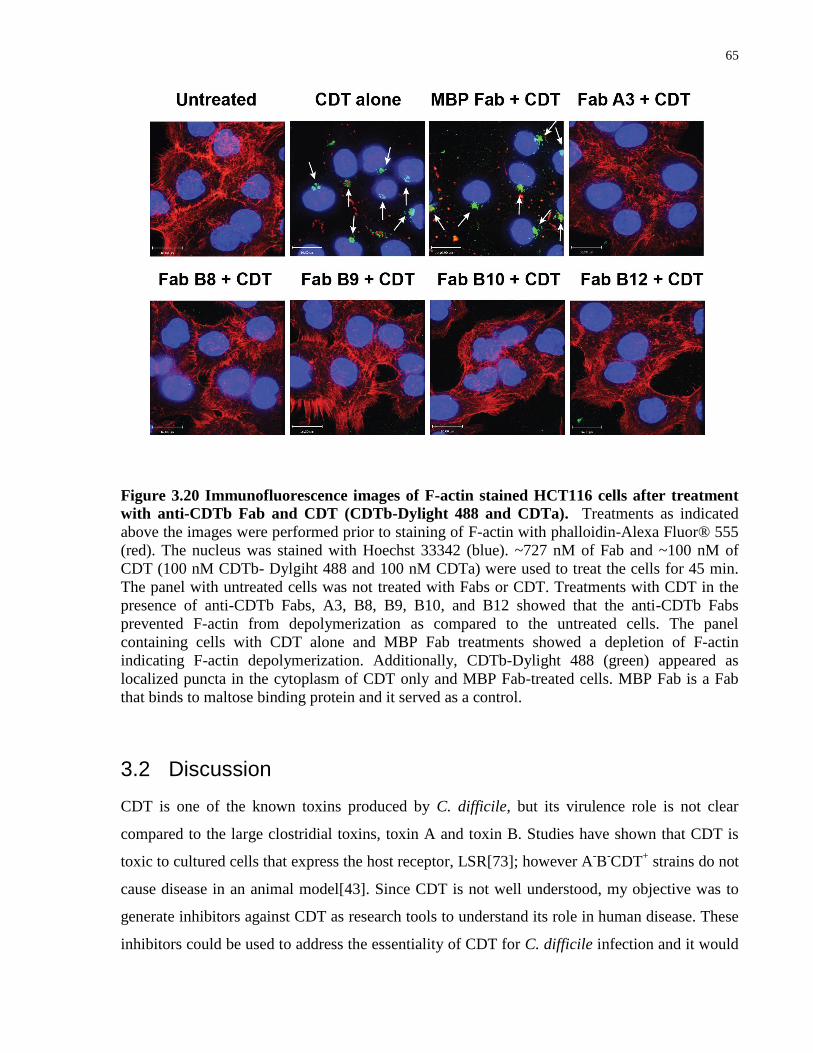
65
Figure 3.20 Immunofluorescence images of F-actin stained HCT116 cells after treatment
with anti-CDTb Fab and CDT (CDTb-Dylight 488 and CDTa). Treatments as indicated
above the images were performed prior to staining of F-actin with phalloidin-Alexa Fluor® 555
(red). The nucleus was stained with Hoechst 33342 (blue). ~727 nM of Fab and ~100 nM of
CDT (100 nM CDTb- Dylgiht 488 and 100 nM CDTa) were used to treat the cells for 45 min.
The panel with untreated cells was not treated with Fabs or CDT. Treatments with CDT in the
presence of anti-CDTb Fabs, A3, B8, B9, B10, and B12 showed that the anti-CDTb Fabs
prevented F-actin from depolymerization as compared to the untreated cells. The panel
containing cells with CDT alone and MBP Fab treatments showed a depletion of F-actin
indicating F-actin depolymerization. Additionally, CDTb-Dylight 488 (green) appeared as
localized puncta in the cytoplasm of CDT only and MBP Fab-treated cells. MBP Fab is a Fab
that binds to maltose binding protein and it served as a control.
3.2 Discussion
CDT is one of the known toxins produced by C. difficile, but its virulence role is not clear
compared to the large clostridial toxins, toxin A and toxin B. Studies have shown that CDT is
toxic to cultured cells that express the host receptor, LSR[73]; however A-B
-CDT
+ strains do not
cause disease in an animal model[43]. Since CDT is not well understood, my objective was to
generate inhibitors against CDT as research tools to understand its role in human disease. These
inhibitors could be used to address the essentiality of CDT for C. difficile infection and it would
66
provide valuable insight into developing strategies to treat CDI. In this study, I used phage
display to develop synthetic human IgGs that bound to the receptor-binding domain of CDTb.
By developing antibodies that target the receptor-binding domain of CDTb, I hypothesized that
these antibodies could prevent CDT from entering the cells, and thus relieve the toxic effects of
CDT on cultured cells.
From the antibody phage display selection on purified CDTb, I isolated five Fabs that bound and
inhibited CDTb binding to the purified receptor, LSR, in an in vitro ELISA-based binding assay.
Like toxins A and B, there were Fabs that bound to the receptor-binding domain of CDTb but
not to the full-length CDTb. These Fabs may have bound to an epitope that was exposed in the
truncated form of CDTb that may be masked by the folding of the missing portions in the full-
length CDTb.
The CDTb-inhibiting Fabs have unique CDR sequences with very different amino acids in the
VH3 and VL3 regions (Appendix A) but were shown to bind to the same epitope when phage-
Fabs were competed with each purified Fabs for the binding site on CDTb in ELISAs. Binding
of CDTb phage-Fabs, A3, B9, B10, and B12 to the immobilized CDTb were inhibited by
binding of each corresponding purified Fabs which suggest that these Fabs bind to the same
binding site or epitope. Fab B8 seemed to bind to the same epitope when purified form of B8
competed with phage-Fabs A3, B9, B10, and B12, however, this competition was unidirectional,
as the phage-Fab of B8 could not be inhibited by purified Fabs A3, B9, B10, and B12. There
could be two possible scenarios for this observation. It is possible that binding of purified Fab
B8 occurred on a different epitope and this binding resulted in changes to the conformation of
CDT in such a way as to alter phage-Fabs A3, B9, B10, and B12 epitope binding (Figure
3.21A). Thus, the phage-Fabs of A3, B9, B10, and B12 would not be able to bind. When
purified Fabs A3, B9, B10, and B12 bound their epitopes, a similar alteration of the B8 epitope
might not have occurred and allowed Fab B8 to bind to the epitope (Figure 3.21B). A second
scenario could be that Fab B8 bound to the same epitope as Fabs A3, B9, B10, and B12 but
bound to a slightly different position on the epitope from the other Fabs thereby allowing
binding inhibition of phage-Fabs A3, B9, B10, and B12 due to steric hindrance by Fab B8
(Figure 3.21C). The binding of purified Fabs A3, B9, B10, and B12, however, did not cause
steric hindrance for Fab B8 and allowed the phage-Fab to bind as suggested from the ELISA
data (Figure 3.21D).

67
Figure 3.21 Hypothetical scenarios for binding in the epitope grouping ELISA data. A) Depicts the scenario where purified Fab B8 binds to its epitope (black circles) and changes the
conformation of CDT and this conformational change masks some epitopes (green circles) that
prevents the phage-Fabs A3, B9, B10, and B12 from binding to the antigen in the ELISA. B)
Depicts the scenario where purified Fabs A3, B9, B10, and B12 bind to the same epitope that
does not change the conformation and allowing phage-Fab B8 to bind. C) Depicts the scenario
where purified Fab B8 binds to a different position of the same epitope than Fabs A3, B9, B10,
and B12 and preventing the binding of these phage-Fab clones due to steric hindrance. D)
Depicts the scenario where purified Fabs A3, B9, B10, and B12 bind to a different position of
the epitope than Fab B8 but allows Fab B8 to bind.
Although there is a crystal structure of the enzymatic component of the toxin[127], x-ray
crystallography of CDTb has not been reported to this date and much of the structural
information is predicted from the iota toxin, Ib, and the protective antigen (PA) domains 1’ and
2’ of the anthrax toxin, both belonging to the binary toxin family[64,65]. Certainly, solving the
structure of CDT in complex with the antibody would elucidate this issue and determine the
exact epitope binding site of the Fabs. This structure would also provide a clue on how this toxin
interacts with the receptor. Nevertheless, the competitive ELISAs suggest that there are possibly
one or two epitopes on CDT that are readily accessible and essential for the toxin-receptor
interaction. However, I cannot exclude the possibility of the presence of more than two epitopes
required for the CDT-LSR interaction. A clear example is shown with neutralizing monoclonal
68
antibodies that have been developed to target the receptor-binding domain of toxins A and B
produced by C. difficile[106,119,121]. These antibodies bind to different epitopes on the toxins
and it has been shown that when the antibodies are combined as a cocktail it provides a
synergistic effect[106].
The Fabs that bound to full-length CDTb but did not inhibit CDTb binding were not explored
further, however, my data strongly suggests that these Fabs bound to different epitopes that were
not involved in binding with the receptor, or inhibited CDTb binding at an insignificant level.
Certainly, these Fabs can be used as potential tools for the detection of toxin in patient stools in
combination with toxin A Fabs, potentially as bispecific IgGs. Additionally, non-inhibiting
CDTb binders have a future prospect as tools to track CDTb inside cells. It has been shown that
it is possible for IgGs to be internalized by the cell through receptor-mediated endocytosis, and
has been explored as a tool to deliver drugs into cancer cells[128-130]. Therefore, my CDTb
Fabs definitely hold promise in CDTb detection and other areas of C. difficile research.
All five Fabs that showed inhibition in the in vitro assay also showed inhibition in CDT
cytotoxicity assays on mammalian cells expressing the receptor. As expected, Fab A2, which
showed binding to the full-length CDT without inhibiting binding to LSR in vitro was not able
to prevent cell rounding and cell death upon CDT intoxication on HeLa (+LSR) cells. The
affinity of the Fabs correlated to the degree of protection against CDT in the does-curve. Fabs
A3, B8, and B12 which have a pM-range affinity also provided the highest protection in the
cytotoxicity assay compared to the nM-range affinity binders, Fabs B9 and B10, which showed
a lesser degree of protection against CDT. These Fabs did not require a pre-incubation step with
CDT in order to inhibit toxin entry in the assays but will likely provide a greater protective
effect, if CDT was pre-incubated with the antibodies. Thus, the affinities obtained from the SPR
can be trusted to be true affinities of the antibodies. HCT116 cells are less adherent than HeLa
cells, and the cells were easily washed off and therefore the results were more variable
compared to the HeLa cell lines. Nevertheless, the Fabs were able to prevent intoxication of
1nM of CDT at 91nM of Fab on the HCT116 cells. Additionally, the Fabs were able to prevent
CDT intoxication at the physiological level for both the Hela and HCT116 cells, as there was no
indication of aberrant actin polymerization in the CDT and Fab treated cells compared to
untreated cells in the immunofluorescence stains. From immunofluorescence stains, it is
apparent that the Fabs can completely block CDT entry by blocking CDTb binding. It also
69
validates that CDTa requires CDTb to bind to the receptor in order for CDTa to enter the cell
and prevent polymerization of F-actin. Previously, my collaborators (Dr. Panagiotis
Papatheodorou and colleagues) have shown that CDTa is the component that is essential for
endocytosis of the CDTb/CDTa complex (unpublished work).
Immunoglobulin G is bivalent, leading to higher affinity compared to monovalent Fab due to
avidity effects. As expected, the data from the SPR indicated that the IgG form had a higher
affinity than the Fab. Additionally, the data from the dose-curve of the IgG + CDT treated HeLa
(+LSR) cells showed that IgG can provide protection against CDT at a lower concentration than
Fab. Not only could IgG block CDTb more effectively than Fab, it was also shown that they
could provide protection for at least 12 hours against CDT on cells at a concentration of 100
nM. This result was not surprising since IgGs are quite stable and it has been shown that most
IgGs are thermally stable as high as ~80 °C [106].
Taken together, it is apparent that my CDTb antibodies isolated from phage display selections
can functionally block CDTb from binding to the receptor and prevent CDT entry. These are
novel antibodies that can be useful as a tool to understand the role of CDT in virulence by
determining if there is a synergistic protection against C. difficile infection when neutralizing
anti-toxin A and anti-toxin B monoclonal antibodies in combination with my CDTb antibodies
are used in an animal model. The CDTb antibodies may not only be used as research tools but
perhaps also be used as a potential therapeutic upon further testing.
3.3 Materials and Methods
3.3.1 Recombinant CDTa and CDTb production and purification
The protein was kindly given to us by Dr. Carsten Schwan and Dr. Klaus Aktories from the
Institute for Experimental and Clinical Pharmacology and Toxicology in Freiburg, Germany.
The full-length CDTa and CDTb were cloned into pHIS1522 Bacillus megaterium expression
vector where the C-terminal of the protein was tagged with 6x histidine tag. The toxin was
expressed in Bacillus megaterium and the purification of the toxin was performed by Ni-affinity
chromatography following an ion-exchange fractionation as described previously by my
collaborators [73,131,132]. The full-length CDTb was treated with trypsin to obtain the
70
activated form of the toxin. The receptor-binding domain of CDTb (amino acid 677-876) was
cloned into a pGEX-4T3 vector backbone containing GST tag located at the C-terminal end of
the protein.
3.3.2 Recombinant LSR production and purification
LSR has several conserved cysteine residues that was predicted to form disulfide bonds that
stabilize the protein. Previously, beta-mercaptoethanol was used in the lysis buffer for cell lysis
in bacterial expression of LSR. This resulted in the destabilization of the protein due to the
reduction of the disulfide bonds and subsequently the yield of the protein was poor, with the
presence of nonspecific proteins. Therefore, expression of LSR was switched from a bacterial
system to a mammalian system. The extracellular domain of LSR (amino acids 49-240,
Accession # Q86X29) was cloned by Sheng Xue into a fusion Fc-vector, pFUSE-hIgG1-Fc2,
(Invivogen, cat# pfuse-hg1fc2) and the protein was expressed in HEK293F cells. Protein A-
sepharose beads were used to capture and purify ECD-LSR-Fc.
3.3.3 Phage display using Library F
The same protocol, as mentioned previously, was used except the library was pre-absorbed on
GST (5 ug/ml) coated plates for 1 hour at room temperature with gentle shaking for each round
and then transferred onto the antigen plate that was immobilized with 5 ug/ml of GST-RBD-
CDTb.
3.3.4 ELISA for direct binding using Phage-Fab
The ELISA for determining the specificity of the phage-Fab clones was conducted the same
manner as explained previously, except that the 384-well plates were coated with 2 ug/ml of
GST-RBD-CDTb (41 nM), and GST control protein (77 nM) overnight at 4 °C.

71
3.3.5 Sanger sequencing for the CDRs of the Fabs
The PCR preparation of the phage samples were conducted the same manner as previously
described for Sanger sequencing. CDR sequences of CDTb Fab A3, B8, B9, B10, and B12 are
shown in Appendix A.
3.3.6 Purified Fab production
Purified Fabs were produced the same manner as explained previously.
3.3.7 Anti-CDTb IgG1 production
The heavy chains of the Fabs were subcloned into a mammalian IgG expression vector,
pFUSEss-CHIg-hG1 (Invivogen, cat# pfuse-hchg1). The light chains of the Fab were subcloned
into a separate mammalian IgG expression vector, pFUSE2ss-CLIg-hk (Invivogen, cat#
pfuse2ss-hclk). Vector maps of these two plasmids are available on the Invivogen website.
These Fabs were subcloned using a restriction enzyme-independent method developed by
Walker et al. (2008). The cycling protocol for generation of the PCR products was: 94 °C for 3
min; 94 °C for 30 s, 60 °C for 10 s, 72 °C for 10 s repeated 35 times; 72 °C for 5 min. These
products were purified using Qiagen PCR purification columns. These products were then
mixed at 1:1 ratio and reannealed using the cycling protocol: 94 °C for 5 min, 50 °C for 3 min,
and 20 °C for 3 min, to obtain sticky ended inserts that could be ligated into the vector of
interest. The vector, pFUSEss-CHIg-hG1 for expressing the heavy chain was cut with EcoRI
(NEB, cat# R0101) and NheI (NEB, cat# R0131), and the vector, pFUSE2ss-CLIg-hk, for
expressing the light chain was cut with EcoRI and NcoI. The cut plasmid was dephosphorylated
using Antarctic Phosphatase and inserts were phosphorylated using T4 Phosphonucleotide
Kinase to improve the cloning efficiency. The ligation was performed using T4 ligase.
Successful ligated vectors were confirmed using PCR method with cycling protocol of: 94 °C
for 3 min, 94 °C for 30 s, 55 °C for 30 s, 72 °C for 1 min repeated 24 times, and 72 °C for 7
min.
The plasmids containing the inserts of the desired heavy chain (500 ug) and light chain (500 ug)
of the antibody were transfected into 293F cells using 293fectin transfection reagent (Invitrogen
cat# 12347-019) and Opti-MEM (Invitrogen cat# 31985-062). The expression of the antibody
72
was controlled by the CMV promoter, which causes high and constitutive expression in
mammalian cells. The protein was harvested from the media and purified 3-5 days after
transfection. Culture supernatant was collected and incubated with protein A-sepharose beads
for at least 1 hour at room temperature. The beads were collected using 20ml gravity flow
columns and washed with 100x bead volume of 1x PBS. The antibody was eluted with 10 ml of
0.2 M Arginine, pH 3.0 and neutralized with 1 ml of 1 M Tris, pH 9.0. The antibodies were
concentrated and buffer exchanged with PBS using the Amicon 30 kDa concentrators. For use
on in vivo assays, the protein samples were sterile filtered using 0.22 uM Spin-X 700 ul spin
filters (Corning, cat# 8160) and endotoxin testing was conducted on the samples.
3.3.8 ELISA for direct binding using purified Fabs
Binding specificities of the purified Fabs were assessed by ELISAs. 2 ug/ml of full-length
CDTb (27 nM), GST-RBD-CDTb (41 nM), and GST control protein (77 nM) were coated
overnight at 4 °C on protein-binding Nunc MaxiSorp® flat-bottom 384-well plates and
incubated with 2 ug/ml of purified Fabs. The remaining steps were conducted in the same
manner as explained previously.
3.3.9 ELISA-based binding assay of LSR-CDTb interaction
In order to determine whether the Fabs could inhibit LSR-CDTb interaction in vitro, 2 ug/ml
(53nM) of human ECD-LSR-Fc was immobilized overnight at 4 °C on protein binding Nunc
MaxiSorp® flat-bottom 384-well plates. The next day the wells were blocked with 60 ul of
PBS-0.5% BSA solution for 1 hour. At the same time, 1 ug/ml (14 nM) of CDTb-His6 was pre-
incubated with 10 ug/ml (182 nM) of Fabs in PBS-0.5% BSA on non-binding protein plate for 1
hour at room temperature. After the pre-incubation step, the CDTb/Fab mixture was transferred
onto the blocked ECD-LSR-Fc immobilized plate and incubated for 30 min at room
temperature. It was then washed 8 times with PBS-0.05% Tween 20 buffer and detected with
anti-His6-HRP (1:5000 in PBS-0.5% BSA-0.05% Tween 20). The signal was developed with 25
ul of TMB substrate after 6 times wash with PBS-0.05% Tween 20 buffer. The reaction was
stopped with 25 ul 1 M H3PO4 and the plate was read for absorbance at wavelength of 450 nm.

73
3.3.10 Surface Plasmon Resonance
Binding kinetics of the purified Fab proteins and IgG were determined by surface plasmon
resonance using PROTEON (Biorad) with antigen immobilized on GLC chips at a density
sufficient to produce ~100 response units when saturated with Fab/IgG. The SPR was conducted
the same manner as previously described.
3.3.11 Epitope grouping
Epitope grouping was conducted the same manner as previously stated except that the
immobilized protein was full-length CDTb.
3.3.12 Cell cultivation
HeLa (+/-LSR) cells were grown in DMEM (Invitrogen Gibco, cat# 11995) supplemented with
10% Fetal bovine serum (FBS), penicillin (4 mM), and streptomycin (4 mM). HCT116 cells
were grown in McCoy’s 5A modified medium (Multicell, cat# 317-010-CL) supplemented with
10% FBS, penicillin (4 mM), and streptomycin (4 mM). All cells were incubated at 37 °C with
5% CO2 under humidified conditions. These conditions were used for further cell-based assays.
3.3.13 Whole cell lysate preparation and Western blot
Adherent cells were washed 2 times with PBS. 1 ml of 1x lysis buffer (20 mM Tris-HCL pH
7.5, 150 mM NaCl, 1 mM Na2EDTA, 1 mM EGTA, 1% Triton, 2.5 mM sodium pyrophosphate,
1 mM beta-glycerophosphate, 1 mM Na3VO4, 1 ug/ml leupeptin) with addition of PMSF (final
concentration of 1 mM) was added per 10-cm dish and incubated on ice for 5 minutes. The cells
were scraped and transferred to ice-cold 1.5 ml microfuge tubes. The cell suspension was passed
through a 25-gauge needle 5-7 times. The extract was centrifuged for 10 min at 14,000 x g at 4
°C and the supernatant was transferred to new 1.5 ml tubes. Bradford protein assay (Thermo
Scientific) was performed to determine the protein concentration. Protein sample buffer (2x
74
Laemmili, 5% beta-mercaptoethanol was added to the lysate in 1:1 ratio) and boiled for 10 min.
The lysate protein was separated by 6-10% SDS-PAGE (Biorad) and transferred onto a
polyvinylidene difluoride (PVDF) membrane. LSR was detected by using a polyclonal rabbit
anti-LSR antibody (Santa Cruz Biotechnology, cat# sc-133765) and actin with monoclonal
mouse anti-β actin antibody (Abcam, cat# ab13772).
3.3.14 CDTb-Dylight 488 inhibition on cells by flow cytometry
A concentration of 5 ug/ml (68 nM) of CDTb-Dylight 488 was pre-incubated with 40 ug/ml
(727 nM) of Fabs for 1.5 hour at 4 °C in the dark. Cells were lifted by EDTA solution (1 mM
disodium EDTA, 137 mM NaCl, 9 mM NaHCO3, 5.6 mM dextrose, and 5.4 mM KCl, and
filtered sterilized) and collected with PBS-0.1% BSA. 0.2-0.5 x 10⁶
cells were aliquoted per
sample and washed with PBS-0.1% BSA once. The cells were incubated with the CDTb-
Dylight/Fab mixture for 30 min at room temperature in the dark. The cells were then washed
twice with 1 ml of PBS-0.1% BSA before re-suspended in PBS-0.1% BSA. The cell samples
were subjected to flow cytometry analysis immediately using BD FACS Calibur and statistical
analysis was conducted using Cell Quest.
Using the same concentration as stated previously, I combined CDTb-Dylight 488 and Fabs on
cells at time 0 and incubated for 30 min at room temperature in the dark. The cells were then
washed twice with 1 ml of PBS-0.1% BSA before re-suspended in PBS-0.1% BSA. The cell
samples were subjected to flow cytometry analysis immediately using BD FACS Calibur and
statistical analysis was conducted using Flow Jo and Cell Quest.
Flow cytometry of inhibition of CDTb-Dylight 488 using IgGs was conducted in the same
manner as the Fabs. The concentration of the IgGs and CDTb-Dylight 488 used in the assay was
40 ug/ml and 5 ug/ml, respectively. The cell samples were subjected to flow cytometry analysis
immediately using BD FACS Calibur and statistical analysis was conducted using Flow Jo.
75
3.3.15 Cytotoxicity assay
A dose-curve of CDT was conducted to determine the concentration of CDT that resulted in
~20-30% cell viability. The cells were serum-starved for 3 hours. CDT was serial diluted from
10 nM to 0.00001 nM in serum-free media and used to treat the cells for 1.5 hours. The toxin
was removed and the media was exchanged with 10% serum-containing media. Cell viability
was measured the next day by adding 1x PrestoBlue® reagent (Invitrogen, cat# A13261) and
the fluorescent was read at 560-620 nm using a plate reader (Biotek). Percent cell viability was
calculated by (treated cells / untreated cells) * 100%. Statistical analysis was conducted using
the t-test.
5 ug/ml (91 nM) of Fab and 1nM of CDT (1nM CDTa and 1nM CDTb) were pre-incubated in
serum-free media for 1 hour at room temperature. The mixture was added to cells that were
starved in serum-free media for 3 hours. After 1.5 hours of intoxication, when cell rounding was
evident in CDT alone well, the toxins and Fabs were removed and exchanged with 10% serum
containing media. Cell viability was measured using PrestoBlue® after 24 hours and images
were taken.
Based on the results in the cytotoxicity assay using the CDTb Fabs, I used 16 ug/ml of the IgGs
which was equivalent to 100nM of IgGs for the assay. The assay was conducted the same
manner as the CDTb Fabs.
3.3.16 Dose-response curve of antibodies in cytotoxicity assay
The Fabs were diluted by two-fold from 5 ug/ml (91 nM) to 0.3125 ug/ml (5.7 nM) in serum-
free media and used to treat the cells with CDT (1nM CDTa and 1nM CDTb) after the cells
were starved in serum-free media for 3 hours. After 1.5 hours of intoxication, when cell
rounding was evident in the CDT only well, the toxins and Fabs were removed and exchanged
with 10% serum containing media. Cell viability was measured using PrestoBlue® after 24
hours.
The dose-curve for IgGs were conducted using the HeLa cells and were diluted by two-fold
from 16 ug/ml (100 nM) to 0.5 ug/ml (3.125 nM) in serum-free DMEM media and treated cells
76
with CDT (1 nM CDTa and 1 nM CDTb) after the cells were starved in serum-free media for 3
hours. The intoxication proceeded as stated previously.
3.3.17 Time-course for the cytotoxicity assay using IgGs
The intoxication of HeLa-LSR cells was conducted as stated previously. The toxins and IgGs
were removed at time points 1.5 hours, 3 hours, 6 hours, and 14 hours, and replaced with serum-
containing DMEM media. Cell viability was measured using PrestoBlue® after 24 hours.
3.3.18 Immunofluorescence
7000 HeLa (+LSR) cells and 15000 HCT116 cells were seeded on 96-well glass plates or
coverslips in DMEM and McCoy’s 5A media, respectively, supplemented with 10% fetal
bovine serum (FBS), penicillin (4 mM), and streptomycin (4 mM). All cells were incubated at
37 °C with 5% CO2 under humidified conditions. Prior to treatment, the cells were starved in
respective serum-free DMEM and McCoy’s 5A media for 3 hours. Fabs (90 nM) and CDT (1
nM CDTa and 1 nM CDTb) in serum-free media were used to treat the cells for 45 min,
followed by fixing the cells in 3.7% paraformaldehyde for 15 min and permeabilizing the cells
with 0.1% Triton X-100 for 3 min. For the treatment of the HCT116 cells with CDTb-Dylight
488, I used 40 ug/ml (727 nM) of Fabs and 100nM of CDT (100 nM CDTa and 100 nM CDTb-
Dylight 488). Post-fixation and permeabilization, the cells were blocked in PBS-1% BSA for 30
min at room temperature and stained with phalloidin-Alexa Fluor® 555 (Invitrogen, cat#
A34055) in PBS-1% BSA (1:1000) for 30 min in the dark at room temperature. Following this,
the cells were washed with PBS twice and then stained with 2 ug/ml of Hoechst 33342
(Molecular Probes, cat# H3570). The cells were then washed and imaged using the Quorum
confocal microscope (Quorum Technologies Inc.) at 63x magnification.

77
Chapter 4 Conclusions
78
4 Conclusions
4.1 Summary
Current neutralizing anti-toxin A and anti-toxin B monoclonal antibodies prevent recurrence of
CDI but they do not decrease the severity of CDI or provide complete protection against C.
difficile toxins in animal models[119] and clinical trials[105]. Additionally, there are no known
inhibitors or antibodies that can block the third known but not well understood toxin, CDT.
CDA1 and MDX1388 were developed using hybridoma technology, which is a traditional
method for generating monoclonal antibodies[119]. Here, my aim was to use a newer technique
called phage display to generate higher affinity and more specific antibodies against toxins A
and B and novel antibodies against CDT.
In chapter 2, I covered my work on the recombinant protein production of truncated fragments
of the RBD of toxins A and B, and using these fragments to select for anti-toxin A and anti-
toxin B antibodies from the existing phage-Fab library called Library F, which was developed
by Dr. Helena Persson. I described the selection process of phage display that I undertook to
generate these antibodies and the in vitro binding assays used to determine the binding
properties of the Fabs. In particular, I focused on Fab A3, which was the only Fab that bound to
the full-length Toxin A but did not neutralize the toxicity of the toxin on polarized cells, Vero
and CHO cells. I concluded that due to its low affinity Fab A3 was not able to compete with the
receptor for the binding site of toxin A. However, Fab A3 could potentially be used as a tool for
toxin A detection. I also outlined two other reasons that I was not able to develop neutralizing
Fabs: 1) Fabs did not bind to a therapeutic epitope and 2) some epitopes present on the truncated
fragments of the RBD of the toxins may have been masked by the remaining regions of the full-
length toxin. Hence, these factors must be considered when attempting to develop antibodies
that cause a functional change on a biological system.
In chapter 3, I outlined the steps of developing antibodies against CDT by using phage display. I
presented two main groups of Fabs: 1) Fabs that bound to CDT but did not inhibit CDT-LSR
interaction 2) Fabs that bound to CDT and inhibited the interaction. This data further
emphasized the importance of binding to a “therapeutic epitope” in order to see a biological
effect. I further described the binding properties and functional properties of the five Fabs that
inhibited CDT-LSR interaction in the in vitro assay. These binders had subnanomolar and
79
picomolar affinities in SPR. With these high affinity measurements, it is not surprising that they
completely blocked CDTb when 1 nM of toxin was used and prevented CDT intoxication on
cells both as a Fab and as an IgG. I also illustrated that the anti-CDTb IgG can provide a long
lasting protection for at least 12 hours from CDT intoxication.
Although I was not successful in generating antibodies that inhibit Toxin A and Toxin B entry, I
developed a Fab that can bind to toxin A and perhaps by affinity maturing Fab A3 and
converting to an IgG it could potentially be used as a high affinity binder for toxin A detection.
By establishing antibodies that can block cellular entry of CDT, the antibodies could be used as
a tool in C. difficile research and provide a stepping stone in understanding this toxin and its role
in virulence.
4.2 Future experiments for CDTb antibodies
Although I have successfully generated CDTb antibodies that can protect cultured cells from
intoxication from CDT, further validation experiments must be performed to determine the
neutralization activity or any protective activity that these antibodies may have in an animal
model and to further investigate the specificity of the antibodies towards CDT in the presence of
other related toxins.
One of the key experiments that can be carried out with the CDTb antibodies is to test for cross
reactivity against binary toxins from related species in the Clostridal family. As discussed,
binary toxins from C. perfringens and C. sporiforme share a high sequence identity of 84% with
CDT and from recent studies by Papatheodorou et al, these toxins also share the same host
receptor[73,81]. Therefore, it would not be surprising if the CDTb antibodies can also inhibit
entry of these toxins. Interestingly, preliminary studies from my collaborators have shown that
my CDTb IgGs did not inhibit binding of the toxin from C. spiroforme in a flow cytometry
experiment but perfectly inhibited binding of CDT. Further exploration of the cross-reactivity of
these antibodies can prove valuable for inhibiting entry of multiple toxins produced by disease
causing pathogens such as C. perfringens using a single antibody. Additionally, antibodies that
are specific for only CDT can have other potential uses for diagnostic purposes.
80
From a recent publication, my collaborator (Dr. Papatheodorou) have shown using time-lapse
and immunofluorescence microscopy that CDT causes changes in the morphology of the host
cell[44]. In the study, upon CDT intoxication on human colon carcinoma cell line, Caco-2, CDT
induced the formation of microtubule-based protrusions. It was proposed that these protrusions
wrap the bacteria onto the surface of the intestinal cell and increases the adherence of the
bacteria[44]. As one of the future experiments, I would like to use these antibodies to determine
if they can decrease the formation of these microtubules and therefore, decrease C. difficile
colonization in an in vitro and in vivo model that was established by Dr. Papatheodorou. The
experiment would further validate the virulence role of CDT and prove advantageous as a
therapeutic target.
Lastly, in order to further determine if CDT has a role in disease I can investigate if there is
synergistic protection when current neutralizing anti-toxin A and anti-toxin B antibodies[119] in
combination with my CDTb IgG antibodies are administered in BI/NAP1/027 infected mice.
Increased protection when there is an addition of CDTb antibodies will indicate that CDT may
have an important role in CDI.
4.3 Factors to consider for therapeutic use
The CDTb antibodies can potentially be used as a therapeutic to inhibit the entry of CDT toxins
produced by C. difficile. Since the notorious BI/NAP1/027 strain produces all three toxins, it
suggests that CDT may contribute to the severity or recurrence of the infection, which is a trait
of the BI/NAP1/027 strain[22]. If CDT has a role in CDI, there are several main factors to
consider in using the antibodies as a therapeutic.
When developing therapeutics, the route of administration of the antibodies is a factor to
consider when treating the site of the infection. C. difficile infects the epithelial cells of the
lower intestine and treatments directed to the intestine via oral delivery prove to be difficult due
to the gastric acid and digestive enzymes. Like most proteins, antibodies will unfold in a highly
basic or acidic environment and thus far, oral delivery of antibodies has not been successfully
developed but studies in this field suggest that a fraction of the immunoglobulin may remain
active and neutralize the target antigen[133,134]. Currently, antibodies are commonly delivered

81
intravenously. Although the site of CDI is in the lower intestine, CDA1 and MDX1388
antibodies can neutralize toxins A and B when administered using this route[119].
Once administered, the half-life and immunogenicity of the antibodies should be considered
when engineering antibody therapeutics. The length of time the antibodies remain stable or in
circulation before it is removed can affect the effectiveness of the treatment and the number of
repeated doses that a patient must receive. However, stability of the immunoglobulin can be
modified through mutations of key residues that provide a more stable framework without
affecting the binding of the antibody[108,109,135,136].
The administration of therapeutic antibodies into patients without causing a serious immune
response against the drug is a challenge that the field is gradually overcoming. Although the
antibodies generated in the lab are fully human, which significantly reduces the risk of
immunogenicity, there are still some immunological risks such as aggregation of the
antibodies[137,138], cytokine release syndrome, and presence of CD4+ T cell epitopes[139]
that should not be ignored and should be taken into consideration.
It is also important to note that the antibodies are primarily used to relieve the symptoms of CDI
caused by the toxins until the bacterium is removed. To increase the efficacy, these antibodies
are most likely would be used in combination with other treatments such as fecal transplantation
to allow the microflora in the intestine to return to adequate levels in order to outcompete C.
difficile while the symptoms dissipate.
4.4 Final remarks
Exploration of developing antibodies that target CDT receptor, LSR, and other domains of the
toxins can be considered as a future direction for the lab that can help C. difficile research.
Phage display is a powerful tool for developing specific antibodies but there are also
improvements that can be made to increase the chances of developing functional antibodies.
Improving antibody phage display selection by initially screening antibodies for functionality
instead of just binding has been implicated in obtaining agonistic antibodies in a recent study in
2012[140]. If we can employ this technique to cell surface proteins such as LSR and obtain

82
antagonistic antibodies, then it will provide a rapid screening system for obtaining functional
antibodies.
83
References
[1] Poutanen, S. M. and A. E. Simor. 2004. Clostridium difficile-associated diarrhea in adults.
CMAJ. 171: 51-58.
[2] Sethi, A. K., W. N. Al-Nassir, M. M. Nerandzic, G. S. Bobulsky and C. J. Donskey. 2010.
Persistence of skin contamination and environmental shedding of Clostridium difficile during
and after treatment of C. difficile infection. Infect. Control Hosp. Epidemiol. 31: 21-27.
[3] Bobulsky, G. S., W. N. Al-Nassir, M. M. Riggs, A. K. Sethi and C. J. Donskey. 2008.
Clostridium difficile skin contamination in patients with C. difficile-associated disease. Clin.
Infect. Dis. 46: 447-450.
[4] Riggs, M. M., A. K. Sethi, T. F. Zabarsky, E. C. Eckstein, R. L. Jump and C. J. Donskey.
2007. Asymptomatic carriers are a potential source for transmission of epidemic and
nonepidemic Clostridium difficile strains among long-term care facility residents. Clin. Infect.
Dis. 45: 992-998.
[5] Bartlett, J. G., T. W. Chang, M. Gurwith, S. L. Gorbach and A. B. Onderdonk. 1978.
Antibiotic-associated pseudomembranous colitis due to toxin-producing clostridia. N. Engl. J.
Med. 298: 531-534.
[6] Kelly, C. P. and J. T. LaMont. 2008. Clostridium difficile--more difficult than ever. N. Engl.
J. Med. 359: 1932-1940.
[7] Lawley, T. D., S. Clare, A. W. Walker, D. Goulding, R. A. Stabler, N. Croucher, P.
Mastroeni, P. Scott, C. Raisen, L. Mottram, N. F. Fairweather, B. W. Wren, J. Parkhill and G.
Dougan. 2009. Antibiotic treatment of clostridium difficile carrier mice triggers a supershedder
state, spore-mediated transmission, and severe disease in immunocompromised hosts. Infect.
Immun. 77: 3661-3669.
[8] Bartlett, J. G., A. B. Onderdonk, R. L. Cisneros and D. L. Kasper. 1977. Clindamycin-
associated colitis due to a toxin-producing species of Clostridium in hamsters. J. Infect.
Dis. 136: 701-705.
84
[9] Cecil, J. A. 2012. Clostridium difficile: Changing Epidemiology, Treatment and Infection
Prevention Measures. Curr. Infect. Dis. Rep. 14: 612-619.
[10] Voth, D. E. and J. D. Ballard. 2005. Clostridium difficile toxins: mechanism of action and
role in disease. Clin. Microbiol. Rev. 18: 247-263.
[11] Bartlett, J. G. 2002. Clinical practice. Antibiotic-associated diarrhea. N. Engl. J. Med. 346:
334-339.
[12] Lyerly, D. M., H. C. Krivan and T. D. Wilkins. 1988. Clostridium difficile: its disease and
toxins. Clin. Microbiol. Rev. 1: 1-18.
[13] Davies, A. H., A. K. Roberts, C. C. Shone and K. R. Acharya. 2011. Super toxins from a
super bug: structure and function of Clostridium difficile toxins. Biochem. J. 436: 517-526.
[14] Dobson, G., C. Hickey and J. Trinder. 2003. Clostridium difficile colitis causing toxic
megacolon, severe sepsis and multiple organ dysfunction syndrome. Intensive Care Med. 29:
1030.
[15] Gerding, D. N., S. Johnson, L. R. Peterson, M. E. Mulligan and J. Silva Jr. 1995.
Clostridium difficile-associated diarrhea and colitis. Infect. Control Hosp. Epidemiol. 16: 459-
477.
[16] Kyne, L., M. Warny, A. Qamar and C. P. Kelly. 2000. Asymptomatic carriage of
Clostridium difficile and serum levels of IgG antibody against toxin A. N. Engl. J. Med. 342:
390-397.
[17] Ozaki, E., H. Kato, H. Kita, T. Karasawa, T. Maegawa, Y. Koino, K. Matsumoto, T.
Takada, K. Nomoto, R. Tanaka and S. Nakamura. 2004. Clostridium difficile colonization in
healthy adults: transient colonization and correlation with enterococcal colonization. J. Med.
Microbiol. 53: 167-172.
[18] Leekha, S., K. C. Aronhalt, L. M. Sloan, R. Patel and R. Orenstein. 2013. Asymptomatic
Clostridium difficile colonization in a tertiary care hospital: admission prevalence and risk
factors. Am. J. Infect. Control. 41: 390-393.

85
[19] Ghantoji, S. S., K. Sail, D. R. Lairson, H. L. DuPont and K. W. Garey. 2010. Economic
healthcare costs of Clostridium difficile infection: a systematic review. J. Hosp. Infect. 74: 309-
318.
[20] O'Brien, J. A., B. J. Lahue, J. J. Caro and D. M. Davidson. 2007. The emerging infectious
challenge of clostridium difficile-associated disease in Massachusetts hospitals: clinical and
economic consequences. Infect. Control Hosp. Epidemiol. 28: 1219-1227.
[21] Bartlett, J. G. 2006. Narrative review: the new epidemic of Clostridium difficile-associated
enteric disease. Ann. Intern. Med. 145: 758-764.
[22] O'Connor, J. R., S. Johnson and D. N. Gerding. 2009. Clostridium difficile infection caused
by the epidemic BI/NAP1/027 strain. Gastroenterology. 136: 1913-1924.
[23] Pillai, D. R., J. Longtin and D. E. Low. 2010. Surveillance data on outbreaks of
Clostridium difficile infection in Ontario, Canada, in 2008-2009. Clin. Infect. Dis. 50: 1685-6;
author reply 1686.
[24] Warny, M., J. Pepin, A. Fang, G. Killgore, A. Thompson, J. Brazier, E. Frost and L. C.
McDonald. 2005. Toxin production by an emerging strain of Clostridium difficile associated
with outbreaks of severe disease in North America and Europe. Lancet. 366: 1079-1084.
[25] Borriello, S. P. 1998. Pathogenesis of Clostridium difficile infection. J. Antimicrob.
Chemother. 41 Suppl C: 13-19.
[26] Carter, G. P., J. I. Rood and D. Lyras. 2012. The role of toxin A and toxin B in the
virulence of Clostridium difficile. Trends Microbiol. 20: 21-29.
[27] Savidge, T. C., W. H. Pan, P. Newman, M. O'brien, P. M. Anton and C. Pothoulakis. 2003.
Clostridium difficile toxin B is an inflammatory enterotoxin in human intestine.
Gastroenterology. 125: 413-420.
[28] Just, I. and R. Gerhard. 2004. Large clostridial cytotoxins. Rev. Physiol. Biochem.
Pharmacol. 152: 23-47.
[29] Lyerly, D. M., K. E. Saum, D. K. MacDonald and T. D. Wilkins. 1985. Effects of
Clostridium difficile toxins given intragastrically to animals. Infect. Immun. 47: 349-352.

86
[30] Alfa, M. J., A. Kabani, D. Lyerly, S. Moncrief, L. M. Neville, A. Al-Barrak, G. K. Harding,
B. Dyck, K. Olekson and J. M. Embil. 2000. Characterization of a toxin A-negative, toxin B-
positive strain of Clostridium difficile responsible for a nosocomial outbreak of Clostridium
difficile-associated diarrhea. J. Clin. Microbiol. 38: 2706-2714.
[31] Drudy, D., S. Fanning and L. Kyne. 2007. Toxin A-negative, toxin B-positive Clostridium
difficile. Int. J. Infect. Dis. 11: 5-10.
[32] Lyras, D., J. R. O'Connor, P. M. Howarth, S. P. Sambol, G. P. Carter, T. Phumoonna, R.
Poon, V. Adams, G. Vedantam, S. Johnson, D. N. Gerding and J. I. Rood. 2009. Toxin B is
essential for virulence of Clostridium difficile. Nature. 458: 1176-1179.
[33] al-Barrak, A., J. Embil, B. Dyck, K. Olekson, D. Nicoll, M. Alfa and A. Kabani. 1999. An
outbreak of toxin A negative, toxin B positive Clostridium difficile-associated diarrhea in a
Canadian tertiary-care hospital. Can. Commun. Dis. Rep. 25: 65-69.
[34] Kuijper, E. J., J. de Weerdt, H. Kato, N. Kato, A. P. van Dam, E. R. van der Vorm, J. Weel,
C. van Rheenen and J. Dankert. 2001. Nosocomial outbreak of Clostridium difficile-associated
diarrhoea due to a clindamycin-resistant enterotoxin A-negative strain. Eur. J. Clin. Microbiol.
Infect. Dis. 20: 528-534.
[35] Limaye, A. P., D. K. Turgeon, B. T. Cookson and T. R. Fritsche. 2000. Pseudomembranous
colitis caused by a toxin A(-) B(+) strain of Clostridium difficile. J. Clin. Microbiol. 38: 1696-
1697.
[36] Popoff, M. R., E. J. Rubin, D. M. Gill and P. Boquet. 1988. Actin-specific ADP-
ribosyltransferase produced by a Clostridium difficile strain. Infect. Immun. 56: 2299-2306.
[37] Geric, B., M. Rupnik, D. N. Gerding, M. Grabnar and S. Johnson. 2004. Distribution of
Clostridium difficile variant toxinotypes and strains with binary toxin genes among clinical
isolates in an American hospital. J. Med. Microbiol. 53: 887-894.
[38] Goncalves, C., D. Decre, F. Barbut, B. Burghoffer and J. C. Petit. 2004. Prevalence and
characterization of a binary toxin (actin-specific ADP-ribosyltransferase) from Clostridium
difficile. J. Clin. Microbiol. 42: 1933-1939.
87
[39] Pituch, H., M. Rupnik, P. Obuch-Woszczatynski, A. Grubesic, F. Meisel-Mikolajczyk and
M. Luczak. 2005. Detection of binary-toxin genes (cdtA and cdtB) among Clostridium difficile
strains isolated from patients with C. difficile-associated diarrhoea (CDAD) in Poland. J. Med.
Microbiol. 54: 143-147.
[40] Stubbs, S., M. Rupnik, M. Gibert, J. Brazier, B. Duerden and M. Popoff. 2000. Production
of actin-specific ADP-ribosyltransferase (binary toxin) by strains of Clostridium difficile. FEMS
Microbiol. Lett. 186: 307-312.
[41] Geric, B., S. Johnson, D. N. Gerding, M. Grabnar and M. Rupnik. 2003. Frequency of
binary toxin genes among Clostridium difficile strains that do not produce large clostridial
toxins. J. Clin. Microbiol. 41: 5227-5232.
[42] McEllistrem, M. C., R. J. Carman, D. N. Gerding, C. W. Genheimer and L. Zheng. 2005. A
hospital outbreak of Clostridium difficile disease associated with isolates carrying binary toxin
genes. Clin. Infect. Dis. 40: 265-272.
[43] Geric, B., R. J. Carman, M. Rupnik, C. W. Genheimer, S. P. Sambol, D. M. Lyerly, D. N.
Gerding and S. Johnson. 2006. Binary toxin-producing, large clostridial toxin-negative
Clostridium difficile strains are enterotoxic but do not cause disease in hamsters. J. Infect.
Dis. 193: 1143-1150.
[44] Schwan, C., B. Stecher, T. Tzivelekidis, M. van Ham, M. Rohde, W. D. Hardt, J. Wehland
and K. Aktories. 2009. Clostridium difficile toxin CDT induces formation of microtubule-based
protrusions and increases adherence of bacteria. PLoS Pathog. 5: e1000626.
[45] Jank, T. and K. Aktories. 2008. Structure and mode of action of clostridial glucosylating
toxins: the ABCD model. Trends Microbiol. 16: 222-229.
[46] Albesa-Jove, D., T. Bertrand, E. P. Carpenter, G. V. Swain, J. Lim, J. Zhang, L. F. Haire,
N. Vasisht, V. Braun, A. Lange, C. von Eichel-Streiber, D. I. Svergun, N. F. Fairweather and K.
A. Brown. 2010. Four distinct structural domains in Clostridium difficile toxin B visualized
using SAXS. J. Mol. Biol. 396: 1260-1270.
88
[47] Pruitt, R. N., M. G. Chambers, K. K. Ng, M. D. Ohi and D. B. Lacy. 2010. Structural
organization of the functional domains of Clostridium difficile toxins A and B. Proc. Natl.
Acad. Sci. U. S. A. 107: 13467-13472.
[48] Frisch, C., R. Gerhard, K. Aktories, F. Hofmann and I. Just. 2003. The complete receptor-
binding domain of Clostridium difficile toxin A is required for endocytosis. Biochem. Biophys.
Res. Commun. 300: 706-711.
[49] Barth, H., G. Pfeifer, F. Hofmann, E. Maier, R. Benz and K. Aktories. 2001. Low pH-
induced formation of ion channels by clostridium difficile toxin B in target cells. J. Biol.
Chem. 276: 10670-10676.
[50] Egerer, M., T. Giesemann, T. Jank, K. J. Satchell and K. Aktories. 2007. Auto-catalytic
cleavage of Clostridium difficile toxins A and B depends on cysteine protease activity. J. Biol.
Chem. 282: 25314-25321.
[51] Giesemann, T., M. Egerer, T. Jank and K. Aktories. 2008. Processing of Clostridium
difficile toxins. J. Med. Microbiol. 57: 690-696.
[52] Kreimeyer, I., F. Euler, A. Marckscheffel, H. Tatge, A. Pich, A. Olling, J. Schwarz, I. Just
and R. Gerhard. 2011. Autoproteolytic cleavage mediates cytotoxicity of Clostridium difficile
toxin A. Naunyn Schmiedebergs Arch. Pharmacol. 383: 253-262.
[53] Qa'Dan, M., L. M. Spyres and J. D. Ballard. 2000. pH-induced conformational changes in
Clostridium difficile toxin B. Infect. Immun. 68: 2470-2474.
[54] Jank, T., T. Giesemann and K. Aktories. 2007. Rho-glucosylating Clostridium difficile
toxins A and B: new insights into structure and function. Glycobiology. 17: 15R-22R.
[55] Just, I., J. Selzer, M. Wilm, C. von Eichel-Streiber, M. Mann and K. Aktories. 1995.
Glucosylation of Rho proteins by Clostridium difficile toxin B. Nature. 375: 500-503.
[56] Just, I., M. Wilm, J. Selzer, G. Rex, C. von Eichel-Streiber, M. Mann and K. Aktories.
1995. The enterotoxin from Clostridium difficile (ToxA) monoglucosylates the Rho proteins. J.
Biol. Chem. 270: 13932-13936.

89
[57] Bustelo, X. R., V. Sauzeau and I. M. Berenjeno. 2007. GTP-binding proteins of the
Rho/Rac family: regulation, effectors and functions in vivo. Bioessays. 29: 356-370.
[58] Schulzke, J. D., S. Ploeger, M. Amasheh, A. Fromm, S. Zeissig, H. Troeger, J. Richter, C.
Bojarski, M. Schumann and M. Fromm. 2009. Epithelial tight junctions in intestinal
inflammation. Ann. N. Y. Acad. Sci. 1165: 294-300.
[59] Hecht, G., C. Pothoulakis, J. T. LaMont and J. L. Madara. 1988. Clostridium difficile toxin
A perturbs cytoskeletal structure and tight junction permeability of cultured human intestinal
epithelial monolayers. J. Clin. Invest. 82: 1516-1524.
[60] Krivan, H. C., G. F. Clark, D. F. Smith and T. D. Wilkins. 1986. Cell surface binding site
for Clostridium difficile enterotoxin: evidence for a glycoconjugate containing the sequence Gal
alpha 1-3Gal beta 1-4GlcNAc. Infect. Immun. 53: 573-581.
[61] Pothoulakis, C., R. J. Gilbert, C. Cladaras, I. Castagliuolo, G. Semenza, Y. Hitti, J. S.
Montcrief, J. Linevsky, C. P. Kelly, S. Nikulasson, H. P. Desai, T. D. Wilkins and J. T. LaMont.
1996. Rabbit sucrase-isomaltase contains a functional intestinal receptor for Clostridium
difficile toxin A. J. Clin. Invest. 98: 641-649.
[62] Rolfe, R. D. and W. Song. 1993. Purification of a functional receptor for Clostridium
difficile toxin A from intestinal brush border membranes of infant hamsters. Clin. Infect.
Dis. 16 Suppl 4: S219-27.
[63] Tucker, K. D. and T. D. Wilkins. 1991. Toxin A of Clostridium difficile binds to the human
carbohydrate antigens I, X, and Y. Infect. Immun. 59: 73-78.
[64] Popoff, M. R. 2000. Molecular Biology of Actin-ADP-Ribosylating Toxins, pp. 275-302.
In: Aktories K. and Just I. (eds.), Bacterial protein toxins, Springer-Verlag Berlin Heidelberg,
Germany.
[65] Barth, H., K. Aktories, M. R. Popoff and B. G. Stiles. 2004. Binary bacterial toxins:
biochemistry, biology, and applications of common Clostridium and Bacillus proteins.
Microbiol. Mol. Biol. Rev. 68: 373-402, table of contents.

90
[66] Perelle, S., M. Gibert, P. Bourlioux, G. Corthier and M. R. Popoff. 1997. Production of a
complete binary toxin (actin-specific ADP-ribosyltransferase) by Clostridium difficile CD196.
Infect. Immun. 65: 1402-1407.
[67] Gulke, I., G. Pfeifer, J. Liese, M. Fritz, F. Hofmann, K. Aktories and H. Barth. 2001.
Characterization of the enzymatic component of the ADP-ribosyltransferase toxin CDTa from
Clostridium difficile. Infect. Immun. 69: 6004-6011.
[68] Barth, H. 2004. Uptake of binary actin ADP-ribosylating toxins. Rev. Physiol. Biochem.
Pharmacol. 152: 165-182.
[69] Mauss, S., C. Chaponnier, I. Just, K. Aktories and G. Gabbiani. 1990. ADP-ribosylation of
actin isoforms by Clostridium botulinum C2 toxin and Clostridium perfringens iota toxin. Eur.
J. Biochem. 194: 237-241.
[70] Vandekerckhove, J., B. Schering, M. Barmann and K. Aktories. 1987. Clostridium
perfringens iota toxin ADP-ribosylates skeletal muscle actin in Arg-177. FEBS Lett. 225: 48-
52.
[71] Sundriyal, A., A. K. Roberts, R. Ling, J. McGlashan, C. C. Shone and K. R. Acharya. 2010.
Expression, purification and cell cytotoxicity of actin-modifying binary toxin from Clostridium
difficile. Protein Expr. Purif. 74: 42-48.
[72] Carette, J. E., C. P. Guimaraes, M. Varadarajan, A. S. Park, I. Wuethrich, A. Godarova, M.
Kotecki, B. H. Cochran, E. Spooner, H. L. Ploegh and T. R. Brummelkamp. 2009. Haploid
genetic screens in human cells identify host factors used by pathogens. Science. 326: 1231-
1235.
[73] Papatheodorou, P., J. E. Carette, G. W. Bell, C. Schwan, G. Guttenberg, T. R.
Brummelkamp and K. Aktories. 2011. Lipolysis-stimulated lipoprotein receptor (LSR) is the
host receptor for the binary toxin Clostridium difficile transferase (CDT). Proc. Natl. Acad. Sci.
U. S. A. 108: 16422-16427.
[74] Yen, F. T., M. Masson, N. Clossais-Besnard, P. Andre, J. M. Grosset, L. Bougueleret, J. B.
Dumas, O. Guerassimenko and B. E. Bihain. 1999. Molecular cloning of a lipolysis-stimulated
remnant receptor expressed in the liver. J. Biol. Chem. 274: 13390-13398.
91
[75] Narvekar, P., M. Berriel Diaz, A. Krones-Herzig, U. Hardeland, D. Strzoda, S. Stohr, M.
Frohme and S. Herzig. 2009. Liver-specific loss of lipolysis-stimulated lipoprotein receptor
triggers systemic hyperlipidemia in mice. Diabetes. 58: 1040-1049.
[76] Yen, F. T., C. J. Mann, L. M. Guermani, N. F. Hannouche, N. Hubert, C. A. Hornick, V. N.
Bordeau, G. Agnani and B. E. Bihain. 1994. Identification of a lipolysis-stimulated receptor that
is distinct from the LDL receptor and the LDL receptor-related protein. Biochemistry. 33: 1172-
1180.
[77] Bihain, B. E. and F. T. Yen. 1992. Free fatty acids activate a high-affinity saturable
pathway for degradation of low-density lipoproteins in fibroblasts from a subject homozygous
for familial hypercholesterolemia. Biochemistry. 31: 4628-4636.
[78] Bihain, B. E. and F. T. Yen. 1998. The lipolysis stimulated receptor: a gene at last. Curr.
Opin. Lipidol. 9: 221-224.
[79] Furuse, M., Y. Oda, T. Higashi, N. Iwamoto and S. Masuda. 2012. Lipolysis-stimulated
lipoprotein receptor: a novel membrane protein of tricellular tight junctions. Ann. N. Y. Acad.
Sci. 1257: 54-58.
[80] Masuda, S., Y. Oda, H. Sasaki, J. Ikenouchi, T. Higashi, M. Akashi, E. Nishi and M.
Furuse. 2011. LSR defines cell corners for tricellular tight junction formation in epithelial cells.
J. Cell. Sci. 124: 548-555.
[81] Papatheodorou, P., C. Wilczek, T. Nolke, G. Guttenberg, D. Hornuss, C. Schwan and K.
Aktories. 2012. Identification of the cellular receptor of Clostridium spiroforme toxin. Infect.
Immun. 80: 1418-1423.
[82] Shah, D., M. D. Dang, R. Hasbun, H. L. Koo, Z. D. Jiang, H. L. DuPont and K. W. Garey.
2010. Clostridium difficile infection: update on emerging antibiotic treatment options and
antibiotic resistance. Expert Rev. Anti Infect. Ther. 8: 555-564.
[83] Lamontagne, F., A. C. Labbe, O. Haeck, O. Lesur, M. Lalancette, C. Patino, M. Leblanc,
M. Laverdiere and J. Pepin. 2007. Impact of emergency colectomy on survival of patients with
fulminant Clostridium difficile colitis during an epidemic caused by a hypervirulent strain. Ann.
Surg. 245: 267-272.
92
[84] Muto, C. A., M. Pokrywka, K. Shutt, A. B. Mendelsohn, K. Nouri, K. Posey, T. Roberts, K.
Croyle, S. Krystofiak, S. Patel-Brown, A. W. Pasculle, D. L. Paterson, M. Saul and L. H.
Harrison. 2005. A large outbreak of Clostridium difficile-associated disease with an unexpected
proportion of deaths and colectomies at a teaching hospital following increased fluoroquinolone
use. Infect. Control Hosp. Epidemiol. 26: 273-280.
[85] Aas, J., C. E. Gessert and J. S. Bakken. 2003. Recurrent Clostridium difficile colitis: case
series involving 18 patients treated with donor stool administered via a nasogastric tube. Clin.
Infect. Dis. 36: 580-585.
[86] Borody, T. J. 2000. "Flora Power"-- fecal bacteria cure chronic C. difficile diarrhea. Am. J.
Gastroenterol. 95: 3028-3029.
[87] Garborg, K., B. Waagsbo, A. Stallemo, J. Matre and A. Sundoy. 2010. Results of faecal
donor instillation therapy for recurrent Clostridium difficile-associated diarrhoea. Scand. J.
Infect. Dis. 42: 857-861.
[88] Rohlke, F., C. M. Surawicz and N. Stollman. 2010. Fecal flora reconstitution for recurrent
Clostridium difficile infection: results and methodology. J. Clin. Gastroenterol. 44: 567-570.
[89] van Nood, E., P. Speelman, E. J. Kuijper and J. J. Keller. 2009. Struggling with recurrent
Clostridium difficile infections: is donor faeces the solution? Euro Surveill. 14: 19316.
[90] van Nood, E., A. Vrieze, M. Nieuwdorp, S. Fuentes, E. G. Zoetendal, W. M. de Vos, C. E.
Visser, E. J. Kuijper, J. F. Bartelsman, J. G. Tijssen, P. Speelman, M. G. Dijkgraaf and J. J.
Keller. 2013. Duodenal infusion of donor feces for recurrent Clostridium difficile. N. Engl. J.
Med. 368: 407-415.
[91] Gough, E., H. Shaikh and A. R. Manges. 2011. Systematic review of intestinal microbiota
transplantation (fecal bacteriotherapy) for recurrent Clostridium difficile infection. Clin. Infect.
Dis. 53: 994-1002.
[92] Brandt, L. J., O. C. Aroniadis, M. Mellow, A. Kanatzar, C. Kelly, T. Park, N. Stollman, F.
Rohlke and C. Surawicz. 2012. Long-term follow-up of colonoscopic fecal microbiota
transplant for recurrent Clostridium difficile infection. Am. J. Gastroenterol. 107: 1079-1087.
93
[93] Crobach, M. J., O. M. Dekkers, M. H. Wilcox and E. J. Kuijper. 2009. European Society of
Clinical Microbiology and Infectious Diseases (ESCMID): data review and recommendations
for diagnosing Clostridium difficile-infection (CDI). Clin. Microbiol. Infect. 15: 1053-1066.
[94] Jefferis, R., J. Pound, J. Lund and M. Goodall. 1994. Effector mechanisms activated by
human IgG subclass antibodies: clinical and molecular aspects. Review article. Ann. Biol. Clin.
(Paris). 52: 57-65.
[95] Sthoeger, Z., I. Asher, S. Rosenberg-Bezalel and K. Mahlab-Guri. 2012. Immunoglobulin
G4 and related diseases. Isr. Med. Assoc. J. 14: 642-645.
[96] Rahman, A. and I. P. Giles. 2006. Structure and function of autoantibodies and their role in
autoimmune rheumatic diseases. Expert Rev. Clin. Immunol. 2: 225-236.
[97] Fellouse, F.A. & Sidhu, S.S. 2007. Making antibodies in bacteria, pp. 157-180.
In: Howard, G.C. & & Kasers, R. (ed.), Making and using antibodies: a practical handbook,
CRC Press, Boca Raton, FL.
[98] Decanniere, K., A. Desmyter, M. Lauwereys, M. A. Ghahroudi, S. Muyldermans and L.
Wyns. 1999. A single-domain antibody fragment in complex with RNase A: non-canonical loop
structures and nanomolar affinity using two CDR loops. Structure. 7: 361-370.
[99] Hamers-Casterman, C., T. Atarhouch, S. Muyldermans, G. Robinson, C. Hamers, E. B.
Songa, N. Bendahman and R. Hamers. 1993. Naturally occurring antibodies devoid of light
chains. Nature. 363: 446-448.
[100] Huston, J. S., D. Levinson, M. Mudgett-Hunter, M. S. Tai, J. Novotny, M. N. Margolies,
R. J. Ridge, R. E. Bruccoleri, E. Haber and R. Crea. 1988. Protein engineering of antibody
binding sites: recovery of specific activity in an anti-digoxin single-chain Fv analogue produced
in Escherichia coli. Proc. Natl. Acad. Sci. U. S. A. 85: 5879-5883.
[101] Skerra, A. and A. Pluckthun. 1988. Assembly of a functional immunoglobulin Fv
fragment in Escherichia coli. Science. 240: 1038-1041.
[102] Woof, J. M. and D. R. Burton. 2004. Human antibody-Fc receptor interactions illuminated
by crystal structures. Nat. Rev. Immunol. 4: 89-99.
94
[103] Bebbington, C. and G. Yarranton. 2008. Antibodies for the treatment of bacterial
infections: current experience and future prospects. Curr. Opin. Biotechnol. 19: 613-619.
[104] Cardenas Aranzana, M. J., B. Isla Tejera, M. V. Gil Navarro and E. Lopez Laso. 2007.
Human botulism immuneglobulin for the treatment of infant botulism. Farm. Hosp. 31: 384-
385.
[105] Lowy, I., D. C. Molrine, B. A. Leav, B. M. Blair, R. Baxter, D. N. Gerding, G. Nichol, W.
D. Thomas Jr, M. Leney, S. Sloan, C. A. Hay and D. M. Ambrosino. 2010. Treatment with
monoclonal antibodies against Clostridium difficile toxins. N. Engl. J. Med. 362: 197-205.
[106] Davies, N. L., J. E. Compson, B. Mackenzie, V. L. O'Dowd, A. K. Oxbrow, J. T. Heads,
A. Turner, K. Sarkar, S. L. Dugdale, M. Jairaj, L. Christodoulou, D. E. Knight, A. S. Cross, K.
J. Herve, K. L. Tyson, H. Hailu, C. B. Doyle, M. Ellis, M. Kriek, M. Cox, M. J. Page, A. R.
Moore, D. J. Lightwood and D. P. Humphreys. 2013. A Mixture of Functionally Oligoclonal
Humanized Monoclonal Antibodies That Neutralize Clostridium difficile TcdA and TcdB with
High Levels of In Vitro Potency Shows In Vivo Protection in a Hamster Infection Model. Clin.
Vaccine Immunol. 20: 377-390.
[107] Koellhoffer, J. F., G. Chen, R. G. Sandesara, S. Bale, E. O. Saphire, K. Chandran, S. S.
Sidhu and J. R. Lai. 2012. Two synthetic antibodies that recognize and neutralize distinct
proteolytic forms of the ebola virus envelope glycoprotein. Chembiochem. 13: 2549-2557.
[108] Miersch, S. and S. S. Sidhu. 2012. Synthetic antibodies: concepts, potential and practical
considerations. Methods. 57: 486-498.
[109] Sidhu, S. S. and F. A. Fellouse. 2006. Synthetic therapeutic antibodies. Nat. Chem.
Biol. 2: 682-688.
[110] Deng, L. W., P. Malik and R. N. Perham. 1999. Interaction of the globular domains of pIII
protein of filamentous bacteriophage fd with the F-pilus of Escherichia coli. Virology. 253:
271-277.
[111] Russel, M., H. B. Lowman and T. Clackson. 2004. Introduction to phage biology and
phage display, pp. 1-24. In: Clackson T. and Lowman H. B. (eds.), Phage Display: a practical
approach, Oxford university press, New York, US.
95
[112] Lubkowski, J., F. Hennecke, A. Pluckthun and A. Wlodawer. 1999. Filamentous phage
infection: crystal structure of g3p in complex with its coreceptor, the C-terminal domain of
TolA. Structure. 7: 711-722.
[113] Riechmann, L. and P. Holliger. 1997. The C-terminal domain of TolA is the coreceptor
for filamentous phage infection of E. coli. Cell. 90: 351-360.
[114] Horiuchi, K. 1997. Initiation mechanisms in replication of filamentous phage DNA. Genes
Cells. 2: 425-432.
[115] Smith, G. P. 1985. Filamentous fusion phage: novel expression vectors that display cloned
antigens on the virion surface. Science. 228: 1315-1317.
[116] Nelson, B. and S. S. Sidhu. 2012. Synthetic antibody libraries. Methods Mol. Biol. 899:
27-41.
[117] Zhang, C. 2012. Hybridoma technology for the generation of monoclonal antibodies.
Methods Mol. Biol. 901: 117-135.
[118] McFarland, L. V. 2011. Emerging therapies for Clostridium difficile infections. Expert
Opin. Emerg. Drugs. 16: 425-439.
[119] Babcock, G. J., T. J. Broering, H. J. Hernandez, R. B. Mandell, K. Donahue, N. Boatright,
A. M. Stack, I. Lowy, R. Graziano, D. Molrine, D. M. Ambrosino and W. D. Thomas Jr. 2006.
Human monoclonal antibodies directed against toxins A and B prevent Clostridium difficile-
induced mortality in hamsters. Infect. Immun. 74: 6339-6347.
[120] Abdeen, S. J., R. J. Swett and A. L. Feig. 2010. Peptide inhibitors targeting Clostridium
difficile toxins A and B. ACS Chem. Biol. 5: 1097-1103.
[121] Hussack, G., M. Arbabi-Ghahroudi, H. van Faassen, J. G. Songer, K. K. Ng, R.
MacKenzie and J. Tanha. 2011. Neutralization of Clostridium difficile toxin A with single-
domain antibodies targeting the cell receptor binding domain. J. Biol. Chem. 286: 8961-8976.
[122] Greco, A., J. G. Ho, S. J. Lin, M. M. Palcic, M. Rupnik and K. K. Ng. 2006. Carbohydrate
recognition by Clostridium difficile toxin A. Nat. Struct. Mol. Biol. 13: 460-461.

96
[123] De mol, N. J. and M. J. E. Fischer. 2008. Kenetic and Thermodynamic Analysis of
Ligand-receptor interactions: SPR applications in drug development, pp. 123-172.
In: Schasfoort R. B. M. and Tudos A. J. (eds.), Handbook of Surface Plasmon Resonance, The
Royal Society of Chemistry, Cambridge, UK.
[124] Eglow, R., C. Pothoulakis, S. Itzkowitz, E. J. Israel, C. J. O'Keane, D. Gong, N. Gao, Y.
L. Xu, W. A. Walker and J. T. LaMont. 1992. Diminished Clostridium difficile toxin A
sensitivity in newborn rabbit ileum is associated with decreased toxin A receptor. J. Clin.
Invest. 90: 822-829.
[125] MacKenzie, C. R., T. Hirama, K. K. Lee, E. Altman and N. M. Young. 1997. Quantitative
analysis of bacterial toxin affinity and specificity for glycolipid receptors by surface plasmon
resonance. J. Biol. Chem. 272: 5533-5538.
[126] Schulten, V., C. Oseroff, R. Alam, D. Broide, P. Vijayanand, B. Peters and A. Sette. 2013.
The identification of potentially pathogenic and therapeutic epitopes from common human
allergens. Ann. Allergy Asthma Immunol. 110: 7-10.
[127] Sundriyal, A., A. K. Roberts, C. C. Shone and K. R. Acharya. 2009. Structural basis for
substrate recognition in the enzymatic component of ADP-ribosyltransferase toxin CDTa from
Clostridium difficile. J. Biol. Chem. 284: 28713-28719.
[128] Maxfield, F. R. and T. E. McGraw. 2004. Endocytic recycling. Nat. Rev. Mol. Cell
Biol. 5: 121-132.
[129] Garnett, M. C. 2001. Targeted drug conjugates: principles and progress. Adv. Drug Deliv.
Rev. 53: 171-216.
[130] Schrama, D., R. A. Reisfeld and J. C. Becker. 2006. Antibody targeted drugs as cancer
therapeutics. Nat. Rev. Drug Discov. 5: 147-159.
[131] Papatheodorou, P., C. Zamboglou, S. Genisyuerek, G. Guttenberg and K. Aktories. 2010.
Clostridial glucosylating toxins enter cells via clathrin-mediated endocytosis. PLoS One. 5:
e10673.
97
[132] Yang, G., B. Zhou, J. Wang, X. He, X. Sun, W. Nie, S. Tzipori and H. Feng. 2008.
Expression of recombinant Clostridium difficile toxin A and B in Bacillus megaterium. BMC
Microbiol. 8: 192-2180-8-192.
[133] Ochi, H., M. Abraham, H. Ishikawa, D. Frenkel, K. Yang, A. S. Basso, H. Wu, M. L.
Chen, R. Gandhi, A. Miller, R. Maron and H. L. Weiner. 2006. Oral CD3-specific antibody
suppresses autoimmune encephalomyelitis by inducing CD4+ CD25- LAP+ T cells. Nat.
Med. 12: 627-635.
[134] Reilly, R. M., R. Domingo and J. Sandhu. 1997. Oral delivery of antibodies. Future
pharmacokinetic trends. Clin. Pharmacokinet. 32: 313-323.
[135] Wu, S. J., J. Luo, K. T. O'Neil, J. Kang, E. R. Lacy, G. Canziani, A. Baker, M. Huang, Q.
M. Tang, T. S. Raju, S. A. Jacobs, A. Teplyakov, G. L. Gilliland and Y. Feng. 2010. Structure-
based engineering of a monoclonal antibody for improved solubility. Protein Eng. Des. Sel. 23:
643-651.
[136] Igawa, T., H. Tsunoda, T. Kuramochi, Z. Sampei, S. Ishii and K. Hattori. 2011.
Engineering the variable region of therapeutic IgG antibodies. MAbs. 3: 243-252.
[137] Rosenberg, A. S. 2006. Effects of protein aggregates: an immunologic perspective. AAPS
J. 8: E501-7.
[138] Shire, S. J. 2009. Formulation and manufacturability of biologics. Curr. Opin.
Biotechnol. 20: 708-714.
[139] Wang, W., E. Q. Wang and J. P. Balthasar. 2008. Monoclonal antibody pharmacokinetics
and pharmacodynamics. Clin. Pharmacol. Ther. 84: 548-558.
[140] Zhang, H., I. A. Wilson and R. A. Lerner. 2012. Selection of antibodies that regulate
phenotype from intracellular combinatorial antibody libraries. Proc. Natl. Acad. Sci. U. S.
A. 109: 15728-15733.
98
Appendices
Appendix A: CDR sequences of the antibodies
CDRs of the VH and VL regions of Toxin A Fab A3
Nucleotide VL (ToxA_A3) CDRL3 variable region
GATATCCAGATGACCCAGTCCCCGAGCTCCCTGTCCGCCTCTGTGGGCGATAGGGT
CACCATCACCTGCCGTGCCAGTCAGTCCGTGTCCAGCGCTGTAGCCTGGTATCAACA
GAAACCAGGAAAAGCTCCGAAGCTTCTGATTTACTCGGCATCCAGCCTCTACTCTG
GAGTCCCTTCTCGCTTCTCTGGTAGCCGTTCCGGGACGGATTTCACTCTGACCATCA
GCAGTCTGCAGCCGGAAGACTTCGCAACTTATTACTGTCAGCAAGCTTTCGGTTACT
CTCCGTTCACGTTCGGACAGGGTACCAAG
Amino acid VL (ToxA_A3) CDRL3 variable region
DIQMTQSPSSLSASVGDRVTITCRASQSVSSAVAWYQQKPGKAPKLLIYSASSLYSGVPS
RFSGSRSGTDFTLTISSLQPEDFATYYCQQAFGYSPFTFGQGTK
Nucleotide VH (ToxA_A3) CDRH1-3 variable region
GAGGTTCAGCTGGTGGAGTCTGGCGGTGGCCTGGTGCAGCCAGGGGGCTCACTCCG
TTTGTCCTGTGCAGCTTCTGGCTTCAACATCTCTTATTATTATATGCACTGGGTGCGT
CAGGCCCCGGGTAAGGGCCTGGAATGGGTTGCATCTATTTATCCTTATTCTAGCTAT
ACTTATTATGCCGATAGCGTCAAGGGCCGTTTCACTATAAGCGCAGACACATCCAA
AAACACAGCCTACCTACAAATGAACAGCTTAAGAGCTGAGGACACTGCCGTCTATT
ATTGTGCTCGCTCTTACTGGGCTTCTTGGCATGCTATGGACTACTGGGGTCAAGGAA
CCCTGGTCACCGTCTCCTCG
Amino acid VH (ToxA_A3) CDRH1-3 variable region
EVQLVESGGGLVQPGGSLRLSCAASGFNISYYYMHWVRQAPGKGLEWVASIYPYSSYT
YYADSVKGRFTISADTSKNTAYLQMNSLRAEDTAVYYCARSYWASWHAMDYWGQG
TLVTVSS

99
Appendix A. Figure 1 Complementarity determining regions of Toxin A Fab A3 and wild-type
VL and VH region.
CDRs of the VH and VL regions of CDTb inhibiting antibodies
Nucleotide VL (CDTb_A03) CDRL3 variable region
GATATCCAGATGACCCAGTCCCCGAGCTCCCTGTCCGCCTCTGTGGGCGATAGGGT
CACCATCACCTGCCGTGCCAGTCAGTCCGTGTCCAGCGCTGTAGCCTGGTATCAACA
GAAACCAGGAAAAGCTCCGAAGCTTCTGATTTACTCGGCATCCAGCCTCTACTCTG
GAGTCCCTTCTCGCTTCTCTGGTAGCCGTTCCGGGACGGATTTCACTCTGACCATCA
GCAGTCTGCAGCCGGAAGACTTCGCAACTTATTACTGTCAGCAATCTTACGCTGGTT
ACCTGATCACGTTCGGACAGGGTACCAAG
Amino acid VL (CDTb_A03) CDRL3 variable region
DIQMTQSPSSLSASVGDRVTITCRASQSVSSAVAWYQQKPGKAPKLLIYSASSLYSGVPS
RFSGSRSGTDFTLTISSLQPEDFATYYCQQSYAGYLITFGQGTK
Nucleotide VH (CDTb_A03) CDRH1-3 variable region
GAGGTTCAGCTGGTGGAGTCTGGCGGTGGCCTGGTGCAGCCAGGGGGCTCACTCCG
TTTGTCCTGTGCAGCTTCTGGCTTCAACCTCTATTATTCTTCTATCCACTGGGTGCGT
CAGGCCCCGGGTAAGGGCCTGGAATGGGTTGCATATATTTCTTCTTATTATGGCTAT
ACTTCTTATGCCGATAGCGTCAAGGGCCGTTTCACTATAAGCGCAGACACATCCAA
AAACACAGCCTACCTACAAATGAACAGCTTAAGAGCTGAGGACACTGCCGTCTATT
ATTGTGCTCGCCCGTCTTCTCCGCCGTTCGGTCATGGTGGTTCTCATTACCCGGTTTG
GGCTTTGGACTACTGGGGTCAAGGAACCCTGGTCACCGTCTCCTCG
Amino acid VH (CDTb_A03) CDRH1-3 variable region
EVQLVESGGGLVQPGGSLRLSCAASGFNLYYSSIHWVRQAPGKGLEWVAYISSYYGYT
SYADSVKGRFTISADTSKNTAYLQMNSLRAEDTAVYYCARPSSPPFGHGGSHYPVWAL
DYWGQGTLVTVSS
100
Nucleotide VL (CDTb_B08) CDRL3 variable region
GATATCCAGATGACCCAGTCCCCGAGCTCCCTGTCCGCCTCTGTGGGCGATAGGGT
CACCATCACCTGCCGTGCCAGTCAGTCCGTGTCCAGCGCTGTAGCCTGGTATCAACA
GAAACCAGGAAAAGCTCCGAAGCTTCTGATTTACTCGGCATCCAGCCTCTACTCTG
GAGTCCCTTCTCGCTTCTCTGGTAGCCGTTCCGGGACGGATTTCACTCTGACCATCA
GCAGTCTGCAGCCGGAAGACTTCGCAACTTATTACTGTCAGCAATACTACTACTTCT
GGTCTTCTCCGATCACGTTCGGACAGGGTACCAAG
Amino acid VL (CDTb_B08) CDRL3 variable region
DIQMTQSPSSLSASVGDRVTITCRASQSVSSAVAWYQQKPGKAPKLLIYSASSLYSGVPS
RFSGSRSGTDFTLTISSLQPEDFATYYCQQYYYFWSSPITFGQGTK
Nucleotide VH (CDTb_B08) CDRH1-3 variable region
GAGGTTCAGCTGGTGGAGTCTGGCGGTGGCCTGGTGCAGCCAGGGGGCTCACTCCG
TTTGTCCTGTGCAGCTTCTGGCTTCAACATCTCTTATTATTATATGCACTGGGTGCGT
CAGGCCCCGGGTAAGGGCCTGGAATGGGTTGCATCTATTTATTCTTATTCTGGCTAT
ACTTATTATGCCGATAGCGTCAAGGGCCGTTTCACTATAAGCGCAGACACATCCAA
AAACACAGCCTACCTACAAATGAACAGCTTAAGAGCTGAGGACACTGCCGTCTATT
ATTGTGCTCGCTACTACCATTGGGGTTCTGGTATTGACTACTGGGGTCAAGGAACCC
TGGTCACCGTCTCCTCG
Amino acid VH (CDTb_B08) CDRH1-3 variable region
EVQLVESGGGLVQPGGSLRLSCAASGFNISYYYMHWVRQAPGKGLEWVASIYSYSGY
TYYADSVKGRFTISADTSKNTAYLQMNSLRAEDTAVYYCARYYHWGSGIDYWGQGTL
VTVSS
Nucleotide VL (CDTb_B09) CDRL3 variable region
GATATCCAGATGACCCAGTCCCCGAGCTCCCTGTCCGCCTCTGTGGGCGATAGGGT
CACCATCACCTGCCGTGCCAGTCAGTCCGTGTCCAGCGCTGTAGCCTGGTATCAACA
GAAACCAGGAAAAGCTCCGAAGCTTCTGATTTACTCGGCATCCAGCCTCTACTCTG
GAGTCCCTTCTCGCTTCTCTGGTAGCCGTTCCGGGACGGATTTCACTCTGACCATCA
GCAGTCTGCAGCCGGAAGACTTCGCAACTTATTACTGTCAGCAAGTTTACGGTTCTT
CTCTGTTCACGTTCGGACAGGGTACCAAG
Amino acid VL (CDTb_B09) CDRL3 variable region
DIQMTQSPSSLSASVGDRVTITCRASQSVSSAVAWYQQKPGKAPKLLIYSASSLYSGVPS
RFSGSRSGTDFTLTISSLQPEDFATYYCQQVYGSSLFTFGQGTK
Nucleotide VH (CDTb_B09) CDRH1-3 variable region
GAGGTTCAGCTGGTGGAGTCTGGCGGTGGCCTGGTGCAGCCAGGGGGCTCACTCCG
TTTGTCCTGTGCAGCTTCTGGCTTCAACATCTATTATTCTTATATGCACTGGGTGCGT
CAGGCCCCGGGTAAGGGCCTGGAATGGGTTGCATCTATTTCTCCTTATTCTGGCTAT
101
ACTTATTATGCCGATAGCGTCAAGGGCCGTTTCACTATAAGCGCAGACACATCCAA
AAACACAGCCTACCTACAAATGAACAGCTTAAGAGCTGAGGACACTGCCGTCTATT
ATTGTGCTCGCGCTGCTTACTACTACGCTGGTTTGGACTACTGGGGTCAAGGAACCC
TGGTCACCGTCTCCTCG
Amino acid VH (CDTb_B09) CDRH1-3 variable region
EVQLVESGGGLVQPGGSLRLSCAASGFNIYYSYMHWVRQAPGKGLEWVASISPYSGYT
YYADSVKGRFTISADTSKNTAYLQMNSLRAEDTAVYYCARAAYYYAGLDYWGQGTL
VTVSS
Nucleotide VL (CDTb_B10) CDRL3 variable region
GATATCCAGATGACCCAGTCCCCGAGCTCCCTGTCCGCCTCTGTGGGCGATAGGGT
CACCATCACCTGCCGTGCCAGTCAGTCCGTGTCCAGCGCTGTAGCCTGGTATCAACA
GAAACCAGGAAAAGCTCCGAAGCTTCTGATTTACTCGGCATCCAGCCTCTACTCTG
GAGTCCCTTCTCGCTTCTCTGGTAGCCGTTCCGGGACGGATTTCACTCTGACCATCA
GCAGTCTGCAGCCGGAAGACTTCGCAACTTATTACTGTCAGCAATCTTACTACCCGT
CTCTGTTCACGTTCGGACAGGGTACCAAG
Amino acid VL (CDTb_B10) CDRL3 variable region
DIQMTQSPSSLSASVGDRVTITCRASQSVSSAVAWYQQKPGKAPKLLIYSASSLYSGVPS
RFSGSRSGTDFTLTISSLQPEDFATYYCQQSYYPSLFTFGQGTK
Nucleotide VH (CDTb_B10) CDRH1-3 variable region
GAGGTTCAGCTGGTGGAGTCTGGCGGTGGCCTGGTGCAGCCAGGGGGCTCACTCCG
TTTGTCCTGTGCAGCTTCTGGCTTCAACCTCTATTATTCTTCTATCCACTGGGTGCGT
CAGGCCCCGGGTAAGGGCCTGGAATGGGTTGCATATATTTCTTCTTATTATGGCTAT
ACTTCTTATGCCGATAGCGTCAAGGGCCGTTTCACTATAAGCGCAGACACATCCAA
AAACACAGCCTACCTACAAATGAACAGCTTAAGAGCTGAGGACACTGCCGTCTATT
ATTGTGCTCGCGCTTTCTACCCGTACGCTATGGACTACTGGGGTCAAGGAACCCTGG
TCACCGTCTCCTCG
Amino acid VH (CDTb_B10) CDRH1-3 variable region
EVQLVESGGGLVQPGGSLRLSCAASGFNLYYSSIHWVRQAPGKGLEWVAYISSYYGYT
SYADSVKGRFTISADTSKNTAYLQMNSLRAEDTAVYYCARAFYPYAMDYWGQGTLVT
VSS
Nucleotide VL (CDTb_B12) CDRL3 variable region
GATATCCAGATGACCCAGTCCCCGAGCTCCCTGTCCGCCTCTGTGGGCGATAGGGT
CACCATCACCTGCCGTGCCAGTCAGTCCGTGTCCAGCGCTGTAGCCTGGTATCAACA
GAAACCAGGAAAAGCTCCGAAGCTTCTGATTTACTCGGCATCCAGCCTCTACTCTG
GAGTCCCTTCTCGCTTCTCTGGTAGCCGTTCCGGGACGGATTTCACTCTGACCATCA
GCAGTCTGCAGCCGGAAGACTTCGCAACTTATTACTGTCAGCAAGCTTACCCGCCG
TCTCTGATCACGTTCGGACAGGGTACCAAG
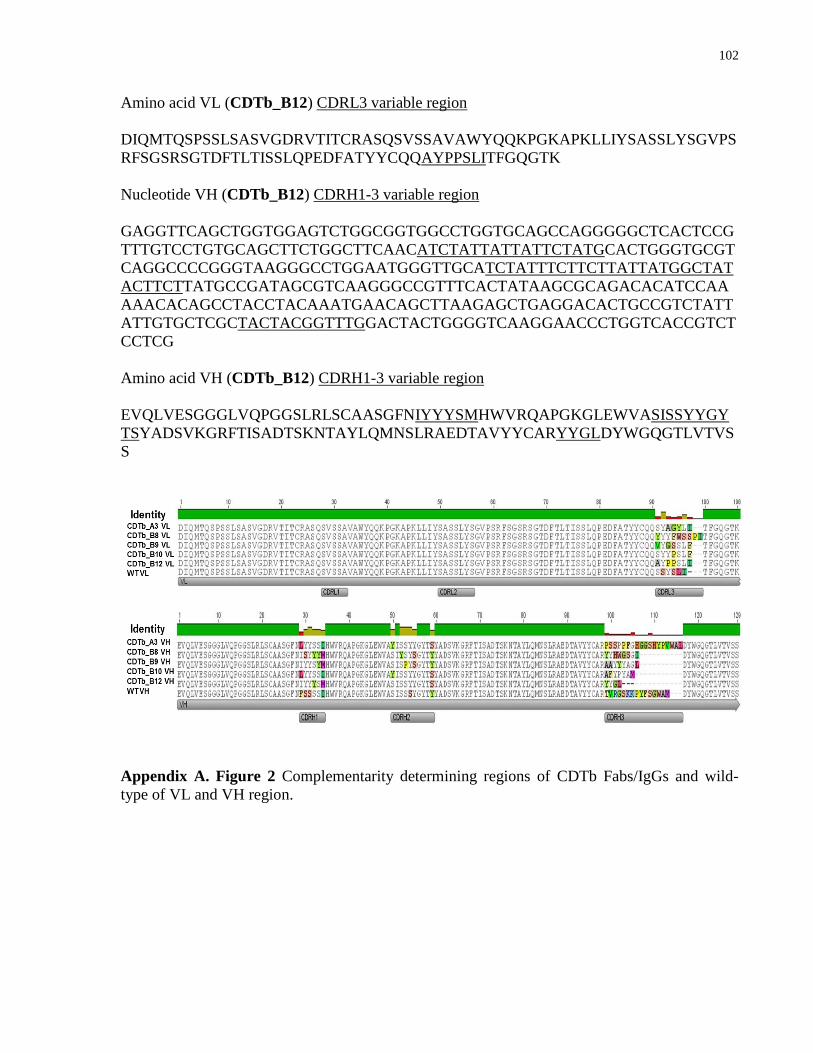
102
Amino acid VL (CDTb_B12) CDRL3 variable region
DIQMTQSPSSLSASVGDRVTITCRASQSVSSAVAWYQQKPGKAPKLLIYSASSLYSGVPS
RFSGSRSGTDFTLTISSLQPEDFATYYCQQAYPPSLITFGQGTK
Nucleotide VH (CDTb_B12) CDRH1-3 variable region
GAGGTTCAGCTGGTGGAGTCTGGCGGTGGCCTGGTGCAGCCAGGGGGCTCACTCCG
TTTGTCCTGTGCAGCTTCTGGCTTCAACATCTATTATTATTCTATGCACTGGGTGCGT
CAGGCCCCGGGTAAGGGCCTGGAATGGGTTGCATCTATTTCTTCTTATTATGGCTAT
ACTTCTTATGCCGATAGCGTCAAGGGCCGTTTCACTATAAGCGCAGACACATCCAA
AAACACAGCCTACCTACAAATGAACAGCTTAAGAGCTGAGGACACTGCCGTCTATT
ATTGTGCTCGCTACTACGGTTTGGACTACTGGGGTCAAGGAACCCTGGTCACCGTCT
CCTCG
Amino acid VH (CDTb_B12) CDRH1-3 variable region
EVQLVESGGGLVQPGGSLRLSCAASGFNIYYYSMHWVRQAPGKGLEWVASISSYYGY
TSYADSVKGRFTISADTSKNTAYLQMNSLRAEDTAVYYCARYYGLDYWGQGTLVTVS
S
Appendix A. Figure 2 Complementarity determining regions of CDTb Fabs/IgGs and wild-
type of VL and VH region.

103
Appendix B: Primer list
Oligo ID Description Oligonucleotide DNA Sequence (5’3’)
SW001_H
isToxAF1
Forward primer for RBD- Toxin
A PCR product A for cloning into
His6-tagged expression vector
CCATCATCACCATCACCACTACCAAAAT
AAATTCTTAACTTTG
SW002_H
isToxAR1
Reverse primer for RBD- Toxin A
PCR product A for cloning into
His6-tagged expression vector
GCTAGCCATATATCCCAGGGGCTT
SW003_H
isToxAF2
Forward primer for RBD- Toxin
A PCR product B for cloning into
His6-tagged expression vector
GTACCCATCATCACCATCACCACTACCA
AAATAAATTCTTAACTTTG
SW004_H
isToxAR2
Reverse primer for RBD- Toxin A
PCR product B for cloning into
His6-tagged expression vector
CATGGCTAGCCATATATCCCAGGGGCTT
SW005_H
isToxBF1
Forward primer for RBD- Toxin
B PCR product A for cloning into
His6-tagged expression vector
CCATCATCACCATCACCACGGTGAAGA
TGGTGTCATGC
SW006_H
isToxBR1
Reverse primer for RBD- Toxin B
PCR product A for cloning into
His6-tagged expression vector
GCTATTCACTAATCACTAATTGAGCTGT
SW007_H
isToxBF2
Forward primer for RBD- Toxin
B PCR product B for cloning into
His6-tagged expression vector
GTACCCATCATCACCATCACCACGGTGA
AGATGGTGTCATGC
SW008_H
isToxBR2
Reverse primer for RBD- Toxin B
PCR product B for cloning into
His6-tagged expression vector
CATGGCTATTCACTAATCACTAATTGAG
CTGT
SW040-
FcM13
Forward
Forward primer for bacterial
colony screen
GTAAAACGACGGCCAGTCGAGCACTTC
ACCAACAA
SW041-
FcM13Re
verse
Reverse primer for bacterial
colony screen
CAGGAAACAGCTATGACAGAGGAAGAC
TGACGGTC
SW042-
GSTToxB
F1
Forward primer for RBD- Toxin
B PCR product A for cloning into
GST-tagged expression vector
CGGTGAAGATGGTGTCATGC
SW043-
GSTToxB
R1
Reverse primer for RBD- Toxin B
PCR product A for cloning into
GST-tagged expression vector
GCCTATTCACTAATCACTAATTGAGCTG
T
SW044-
GSTToxB
F2
Forward primer for RBD- Toxin
B PCR product B for cloning into
GST-tagged expression vector
GTACCGGTGAAGATGGTGTCATGC
SW045-
GSTToxB
R2
Reverse primer for RBD- Toxin B
PCR product B for cloning into
GST-tagged expression vector
GGCCGCCTATTCACTAATCACTAATTGA
GCTGT
SW046-
G8 R1
Reverse primer for bacterial
colony screen
TTCAACAGTTTCAGCGGAG
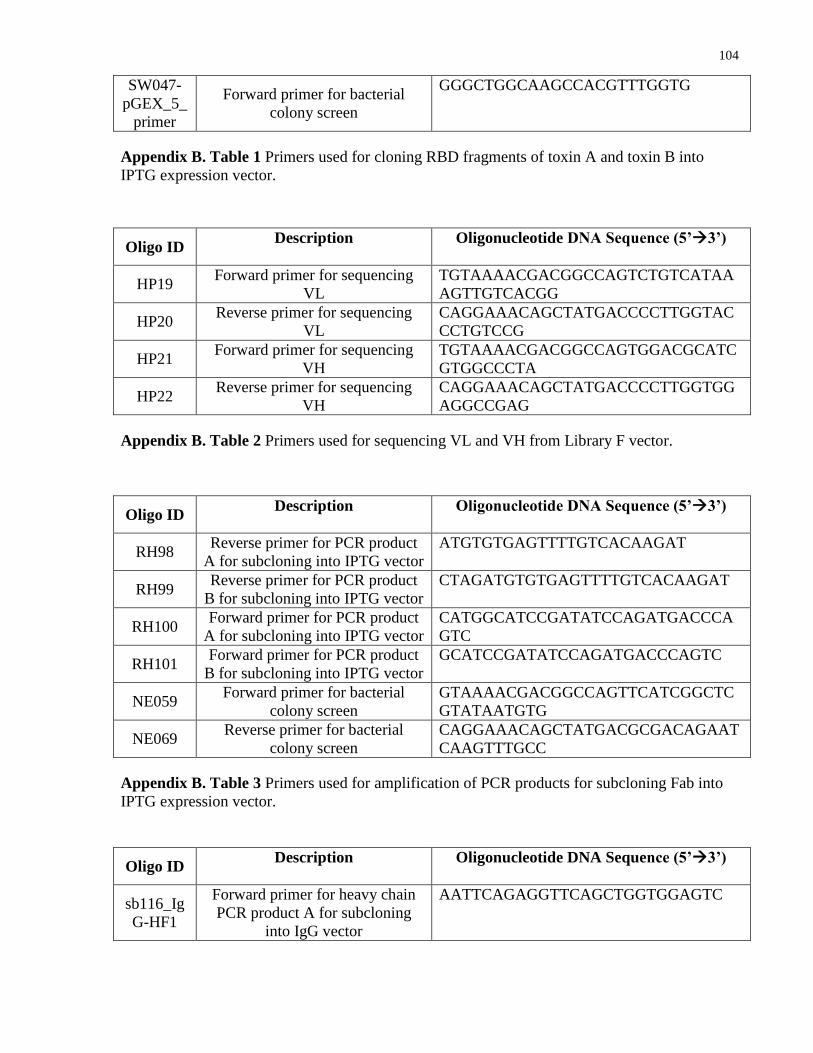
104
SW047-
pGEX_5_
primer
Forward primer for bacterial
colony screen
GGGCTGGCAAGCCACGTTTGGTG
Appendix B. Table 1 Primers used for cloning RBD fragments of toxin A and toxin B into
IPTG expression vector.
Oligo ID Description Oligonucleotide DNA Sequence (5’3’)
HP19 Forward primer for sequencing
VL
TGTAAAACGACGGCCAGTCTGTCATAA
AGTTGTCACGG
HP20 Reverse primer for sequencing
VL
CAGGAAACAGCTATGACCCCTTGGTAC
CCTGTCCG
HP21 Forward primer for sequencing
VH
TGTAAAACGACGGCCAGTGGACGCATC
GTGGCCCTA
HP22 Reverse primer for sequencing
VH
CAGGAAACAGCTATGACCCCTTGGTGG
AGGCCGAG
Appendix B. Table 2 Primers used for sequencing VL and VH from Library F vector.
Oligo ID Description Oligonucleotide DNA Sequence (5’3’)
RH98 Reverse primer for PCR product
A for subcloning into IPTG vector
ATGTGTGAGTTTTGTCACAAGAT
RH99 Reverse primer for PCR product
B for subcloning into IPTG vector
CTAGATGTGTGAGTTTTGTCACAAGAT
RH100 Forward primer for PCR product
A for subcloning into IPTG vector
CATGGCATCCGATATCCAGATGACCCA
GTC
RH101 Forward primer for PCR product
B for subcloning into IPTG vector
GCATCCGATATCCAGATGACCCAGTC
NE059 Forward primer for bacterial
colony screen
GTAAAACGACGGCCAGTTCATCGGCTC
GTATAATGTG
NE069 Reverse primer for bacterial
colony screen
CAGGAAACAGCTATGACGCGACAGAAT
CAAGTTTGCC
Appendix B. Table 3 Primers used for amplification of PCR products for subcloning Fab into
IPTG expression vector.
Oligo ID Description Oligonucleotide DNA Sequence (5’3’)
sb116_Ig
G-HF1
Forward primer for heavy chain
PCR product A for subcloning
into IgG vector
AATTCAGAGGTTCAGCTGGTGGAGTC

105
sb117_Ig
G-HF2
Forward primer for heavy chain
PCR product B for subcloning
into IgG vector
CAGAGGTTCAGCTGGTGGAGTC
sb118_Ig
G-HR1
Reverse primer for heavy chain
PCR product A for subcloning
into IgG vector
CCGAGGAGACGGTGACCAGG
sb119_Ig
G-HR2
Reverse primer for heavy chain
PCR product B for subcloning
into IgG vector
CTAGCCGAGGAGACGGTGACCAGG
sb120_k-
LF1
Forward primer for light chain
PCR product A for subcloning
into IgG vector
AATTCAGATATCCAGATGACCCAGTCC
sb121_k-
LF2
Forward primer for light chain
PCR product B for subcloing into
IgG vector
CAGATATCCAGATGACCCAGTCC
sb122_hk-
LR1
Reverse primer for light chain
PCR product A for subcloning
into IgG vector
GCTTTGATCTCCACCTTGGTACC
sb123_hk-
LR2
Reverse primer for light chain
PCR product B for subcloning
into IgG vector
CATGGCTTTGATCTCCACCTTGGTACC
sb141_pF
USE
M13F
Forward primer for colony screen
for heavy and light chains of the
antibodies
TGTAAAACGACGGCCATGTAAAGCTCA
GGTCGAGACCGG
sb142_hG
4 M13R
Reverse primer for bacterial
colony screen for the heavy chain
of the antibodies
CAGGAAACAGCTATGACCAAGGTGTGC
ACGCCGCTGG
sb144_hK
M13R
Reverse primer for bacterial
colony screen for the light chain
of the antibodies
CAGGAAACAGCTATGACCTAGGTGCTG
TC CTTGCTGTCC
Appendix B. Table 4 Primers used for subcloning Fab into IgG expression vector.

106
Appendix C: Absorbance fold change between target protein and controls in ELISAs
Name of
Fab
A450nm
His-RBD
toxin A
A450nm
Neutravidin A450nm BSA
A450nm His-RBD
toxin A / A450nm
Neutravidin
A450nm His-
RBD toxin A /
A450nm BSA
ToxA_A1 2.184 0.053 0.067 41.2 32.6
ToxA_A2 0.478 0.055 0.064 8.7 7.5
ToxA_A3 3.229 0.062 0.078 52.1 41.4
ToxA_A4 3.077 0.108 0.073 28.5 42.2
Appendix C. Table 1 Fold changes of toxin A Fabs binding to His6-RBD2304–2710-toxin A in
ELISA compared to the background controls. 1 ug/ml of Fab was used.
Name of Fab
A450nm
His-
RBD
toxin B
A450nm
Neutravidin A450nm BSA
A450nm His-RBD
toxin B / A450nm
Neutravidin
A450nm His-
RBD toxin B /
A450nm BSA
ToxB_A5 0.25 0.061 0.055 4.1 4.6
ToxB_A6 1.363 0.073 0.07 18.7 19.5
ToxB_A7 0.545 0.067 0.063 8.1 8.7
ToxB_A8 1.283 0.081 0.063 15.8 20.4
ToxB_A9 2.027 0.166 0.11 12.2 18.4
ToxB_A10 2.428 0.056 0.058 43.4 41.9
ToxB_A11 0.832 0.061 0.065 13.6 12.8
ToxB_A12 0.232 0.15 0.099 1.5 2.3
ToxB_B1 0.215 0.055 0.063 3.9 3.4
ToxB_B2 0.064 0.055 0.056 1.2 1.1
ToxB_B3 2.125 0.057 0.056 37.3 37.9
Appendix C. Table 2 Fold changes of Toxin B purified Fabs binding to His6-RBD2286–2366-
Toxin B in ELISA compared to the background controls.1 ug/ml of Fab was used.
Name of Fab
A450nm
GST-
RBD
toxin B
A450nm
GST A450nm BSA
A450nm GST-RBD
toxin B / A450nm
GST
A450nm GST-
RBD toxin B /
A450nm BSA
ToxB_A5 0.266 0.061 0.059 4.4 4.5
ToxB_A6 1.367 0.249 0.1 5.5 13.7
ToxB_A7 0.716 0.169 0.071 4.2 10.1
ToxB_A8 1.919 0.243 0.078 7.9 24.6
ToxB_A9 1.823 0.974 0.384 1.9 4.7
ToxB_A10 1.699 0.078 0.056 21.8 30.3
ToxB_A11 0.103 0.163 0.069 0.6 1.5
ToxB_A12 0.32 0.437 0.139 0.7 2.3
ToxB_B1 0.124 0.073 0.056 1.7 2.2

107
ToxB_B2 0.058 0.059 0.06 1.0 0.97
ToxB_B3 0.088 0.087 0.06 1.0 1.5
Appendix C. Table 3 Fold changes of Toxin B purified Fabs binding to GST-RBD2286–2366-
Toxin B in ELISA compared to the background controls.1 ug/ml of Fab was used.
Name of
Fab
A450nm
His-
RBD
toxin B
A450nm
Neutravidin A450nm BSA
A450nm His-RBD
Toxin B / A450nm
Neutravidin
A450nm His-
RBD toxin B /
A450nm BSA
ToxA_A1 1.476 0.056 0.06 26.4 24.6
ToxA_A2 0.34 0.054 0.066 6.3 5.2
ToxB_B3 2.125 0.057 0.056 37.3 37.9
Appendix C. Table 4 Fold changes of cross-reactive Fabs binding to His6-RBD2304–2710-Toxin
A in ELISA compared to the background controls. 1 ug/ml of Fab was used.
Name of Fab
A450nm His-
RBD toxin
A
A450nm GST A450nm BSA
A450nm His-RBD
toxin A / A450nm
GST
A450nm His-RBD
toxin A / A450nm
BSA
ToxA_A1 2.184 0.075 0.067 29.1 32.6
ToxA_A2 0.478 0.061 0.064 7.8 7.5
ToxB_B3 2.111 0.098 0.065 21.5 32.5
Appendix C. Table 5 Fold changes of cross-reactive Fabs binding to His6-RBD2286–2366-Toxin
B in ELISA compared to the background controls. 1 ug/ml of Fab was used.
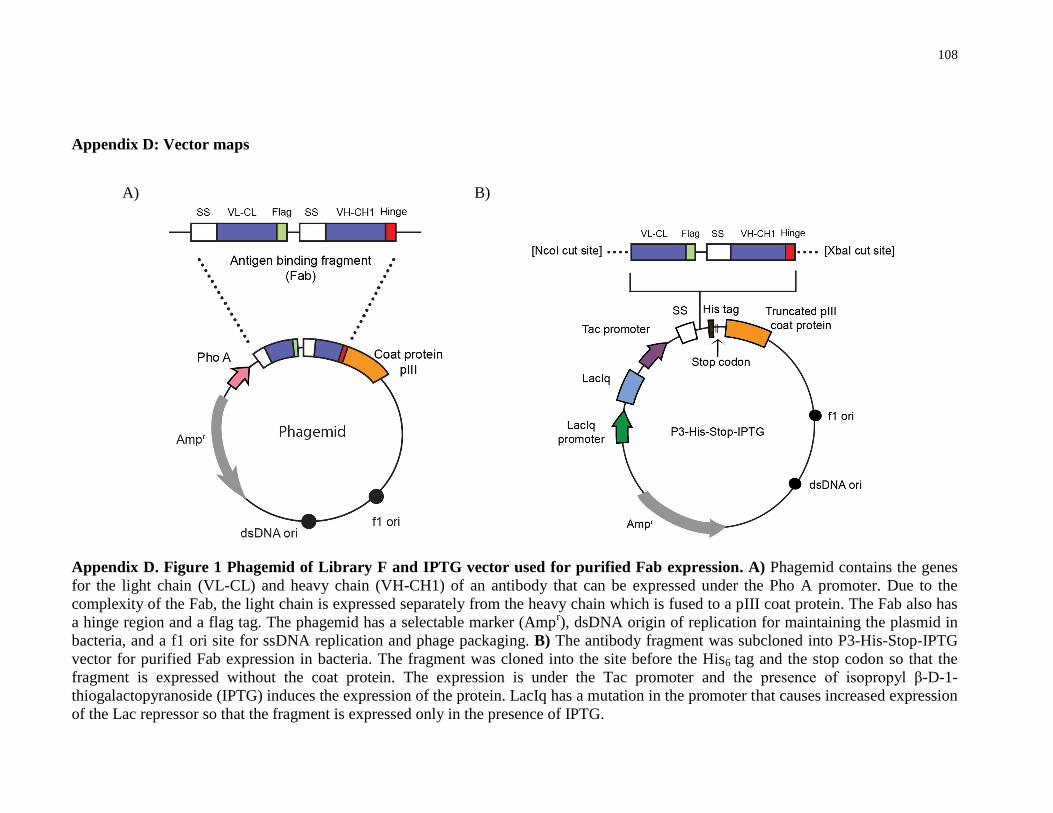
108
Appendix D: Vector maps
Appendix D. Figure 1 Phagemid of Library F and IPTG vector used for purified Fab expression. A) Phagemid contains the genes
for the light chain (VL-CL) and heavy chain (VH-CH1) of an antibody that can be expressed under the Pho A promoter. Due to the
complexity of the Fab, the light chain is expressed separately from the heavy chain which is fused to a pIII coat protein. The Fab also has
a hinge region and a flag tag. The phagemid has a selectable marker (Ampr), dsDNA origin of replication for maintaining the plasmid in
bacteria, and a f1 ori site for ssDNA replication and phage packaging. B) The antibody fragment was subcloned into P3-His-Stop-IPTG
vector for purified Fab expression in bacteria. The fragment was cloned into the site before the His6 tag and the stop codon so that the
fragment is expressed without the coat protein. The expression is under the Tac promoter and the presence of isopropyl β-D-1-
thiogalactopyranoside (IPTG) induces the expression of the protein. LacIq has a mutation in the promoter that causes increased expression
of the Lac repressor so that the fragment is expressed only in the presence of IPTG.
A) B)
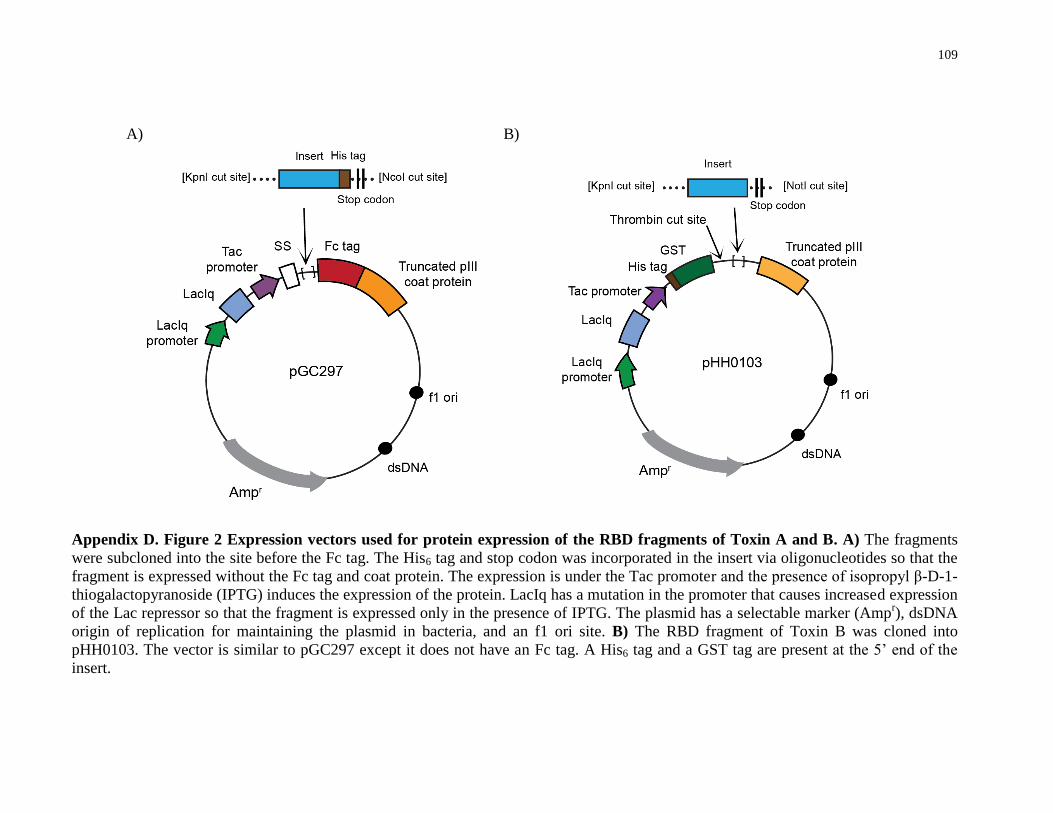
109
Appendix D. Figure 2 Expression vectors used for protein expression of the RBD fragments of Toxin A and B. A) The fragments
were subcloned into the site before the Fc tag. The His6 tag and stop codon was incorporated in the insert via oligonucleotides so that the
fragment is expressed without the Fc tag and coat protein. The expression is under the Tac promoter and the presence of isopropyl β-D-1-
thiogalactopyranoside (IPTG) induces the expression of the protein. LacIq has a mutation in the promoter that causes increased expression
of the Lac repressor so that the fragment is expressed only in the presence of IPTG. The plasmid has a selectable marker (Ampr), dsDNA
origin of replication for maintaining the plasmid in bacteria, and an f1 ori site. B) The RBD fragment of Toxin B was cloned into
pHH0103. The vector is similar to pGC297 except it does not have an Fc tag. A His6 tag and a GST tag are present at the 5’ end of the
insert.
A) B)