the generosity of the welfare state and the skill composition of migrants: which causes which?...
Post on 20-Dec-2015
241 views
TRANSCRIPT

THE GENEROSITY OF THE THE GENEROSITY OF THE WELFARE STATE AND THE SKILL WELFARE STATE AND THE SKILL
COMPOSITION OF MIGRANTS: COMPOSITION OF MIGRANTS: WHICH CAUSES WHICHWHICH CAUSES WHICH??
December 2009by
Alon Cohen and Assaf Razin
MIGRATION AND THE WELFARE STATE: POLITICAL-ECONOMY
POLICY FORMATION
•Assaf Razin, Efraim Sadka,
• and
• Ben Suwankiri
Background
•AGING•The European Union, both "old" (EU-15) and "new"
(after the enlargement to EU-27), faces a severe aging problem. For instance the ratio of the elderly population (aged 60 years and over) to the working age population (aged 15-59 years) in the EU-15 is projected to at least double from about 20% in the
year 2000 to over 40% in the year 2050 .•PUBLIC FINANCE
•This shakes the financial soundness of the welfare state, especially its old-age security and medical health components, because there are fewer workers
asked to support increasing numbers of retirees. .

Background
•As put metaphorically by the Economist (March 15th, 2003, 80):…"the fiscal burden on the diminishing number of worker-bees will rise as more people turn into pensioner
drones “.

Background• Intuition suggests that even though unskilled migration
improves the dependency ratio, it nevertheless burdens the welfare state. This is because low-skill migrants are typically net
beneficiaries of a generous welfare state .
•In 1997 the U.S. National Research Council sponsored a study on the overall fiscal impact of immigration into the U.S.; see Smith and Edmonston (1997). The study looks carefully at all layers of government (federal, state, and local), all programs (benefits), and all types of taxes. For each cohort, defined by age of arrival to the U.S., the benefits (cash or in kind) received by migrants over their own lifetimes and the lifetimes of their first-generation
descendents were projected .
•These benefits include Medicare, Medicaid, Supplementary Security Income (SSI), Aid for Families with Dependent Children (AFDC), food stamps, Old Age, Survivors, and Disability
Insurance (OASDI), etc .

Background
•Within each age cohort, these calculations were disaggregated according to three educational levels: Less than high school education, high school education, and more than high school education. The findings suggest that migrants with less than high school education are typically a net fiscal burden that can reach as high as approximately US-$100,000 in present value, when the migrants' age on arrival is between 20--30 years.

“bad” and “good” migration
• • Hans-Werner Sinn (Financial Times, July 12th
2004) made a somewhat alarming prediction:•There will be more migration in Europe, but it will be
'bad' migration as well as 'good.'
•'Good' migration is driven by wage and •productivity differences .
•'Bad' migration is driven by generosity
of the welfare state

Background
•Only three members of the EU-15 (the UK, Sweden and Ireland) allowed free access for residents of the accession countries to their national labor markets, in the year of the first enlargement, 2004. The other members of the EU-15 took advantage of the clause that allows for restricted labor markets for a transitional
period of up to seven years..(

accession countries
•Focusing on the UK and the A8 countries
•The A8 countries are the first eight accession countries (Czech Republic, Estonia, Hungary, Latvia, Lithuania, Slovenia and Poland.)
•Dustmann at al (2009) bring evidence of no welfare migration.
9

Accession countries’ migration•A recent study by Bardone et al (2009), based on the 2006
European Union Survey of Income and Living conditions, finds that migrants from the accession countries constitute only 1-2 percent of the total population in the pre-enlargement EU countries (excluding Germany and Luxemburg) ;
•by comparison about 6 percent of the population in the latter EU countries were born outside the enlarged EU .
•The small share of migrants from the accession countries is, of course, not surprising in view of the restrictions imposed on migration from the accession countries to the EU-15 before the enlargement and during the transition period after the enlargement .
•The study shows also that there is, as expected, a positive correlation between the net current taxes (that is, taxes paid less benefits received) of migrants from all source countries and their education level.

Opinion Surveys•Hanson et al (2007) employing opinion surveys, find for the United
States that natives of states which provide generous benefits to migrants prefer to reduce the number of migrants. This opposition is stronger among higher income groups.
• •Similarly, Hanson et al (2009), again employing opinion surveys,
find for the United States that native-born residents of states with a high share of unskilled migrants among the migrants population prefer to restrict in migration; whereas native-born residents of states with a high share of skilled migrants among the migrants' population are less likely to favor restricting migration. Indeed, developed economies do attempt to sort out immigrants by skill
•

Selection Mechanisms
•Recently the U.S. employs explicit preference for professional, technical and
kindred immigrants under the so-called third-preference quota. Jasso and Rosenzweig
(2009) find that both the Australian and American selection mechanisms are
effective in sorting out the skilled migrants and produce essentially similar outcomes
despite of their different legal characteristics.
12

13
The Research IssuesThe Research Issues
• To analyze what is the effect of welfare state generosity in host countries, over the skill composition of their migrants, we decompose our analysis into two extreme cases of migration regimes:
– Free migration
– Political-economy based Policy-Restricted Migration

14
Free Migration Free Migration
The skill composition of immigrants is adversely
affected by the welfare generosity of host countries.

15
Policy-Controlled MigrationPolicy-Controlled Migration
The skill composition of immigrants is likely to be upgraded
Because of the positive effect of skilled migrants on public finance, as reflected in the considerations of voters in the host country.

16
Related Literature: Migration within Related Literature: Migration within the USAthe USA
• Welfare migration empirical literature is inconclusive.• Normally, evidence suggests that welfare serves as a
magnet for immigrants:– Southwick (1981); Gramlich and Laren (1984);
Blank (1988); Borjas (1999); Gelbach (2000); McKinnish (2005, 2007)
• On the other hand, some find that welfare benefits has no significant effect over migration:– Walker (1994); Levine and Zimmerman (1999)
• These studies however, do not address international immigration, only migration within the U.S.

17
Related Literature: International Related Literature: International MigrationMigration
• Peridy (2006) and Warin and Svaton (2008) find that aggregate welfare-state benefits have a positive effect on migration.
• They do not, however, separate between high-skilled and low-skilled immigrants.
• De Giorgi and Pellizzari (2006) find that this positive effect is coherent across different levels of education among the immigrants.
• Docquier, Lohest and Marfouk (2006) find that while all education groups are indeed attracted to welfare-benefits, the unskilled are motivated by social expenditure much more than the skilled.
• ALL these studies, however, do not differentiate between free and policy-controlled migration!

18
Parsimoneous Model: Policy-Controlled Policy-Controlled MigrationMigration
• Production:
• Labor:
• Government Budget:
• Individuals:

19
• Indirect Utility function:
• Median Voter:
Theory: Policy-Controlled Migration Theory: Policy-Controlled Migration Stylized ModelStylized Model

20
• The share of skilled immigrants, σ, has two effects on the indirect utility.
• First, an increase in σ increases labor productivity and thereby the level of benefits, b.
• Second, an increase in σ depresses skilled labor wages and raises unskilled labor wages.
• If the median voter is unskilled, both effects are positive. Thus, the unskilled median voter is unambiguously for skilled immigration.
• If the domestic median voter is skilled, however, the two effects are conflicting.
• Therefore: σs <σu=1.
Theory: Policy-Controlled Migration Theory: Policy-Controlled Migration Stylized ModelStylized Model

21
• :
Comparative statics: Policy-Controlled Policy-Controlled MigrationMigration

22
Individuals in the source country are heterogeneous: in each skill level, there is a continuum (with respect to any other quality other than labor skills, for instance, migration costs) of reservation utilities.
Free Migration Stylized ModelFree Migration Stylized Model

23
Parsimoneous Model: Free Migration : Free Migration Stylized ModelStylized Model
• Define skilled and unskilled migration:
• The cut-off reservation utility is:
• Implying:

24
Testable ImplicationsTestable Implications
• The main results of the theory:
• Namely, if migration is free, the generosity of the welfare state has an adverse effect on the skill composition of immigrants.
• If, however, the skill mixture of migration is controlled by policy, then the generosity of the welfare state has a positive effect on it.
25
Decomposition of Data
•Data is decomposed into two groups:
•)1 (Group A contains only source-host pairs of countries within the EU-- free
migration;
•)2 (Group B includes only source – host pairs for which the source country is non-EU country and the host is an EU country .

26
Identification strategy
•)1 (Decomposition into group A and group B is exogenous to the dependent variable
•)2 (The generosity of the welfare state, is averaged, lagged and instrumented

27
Two altrnative instruments
•)The measure of social benefits for each host country instrumented by legal origin;
•)2 (We cluster the sample of host countries by linguistic similarity, legal origin and geographical proximity into several groups. In each group for either host country we construct an IV measure: the average predetermined value of welfare state benefits of the OTHER countries in the
group .

28
Tax rates and welfare benefits are correlated by competition within
each group—leading to exogeneity
•The groups: (England and Ireland); (Austria, Germany, Switzerland); (Belgium, France, Italy, the Netherlands,
Greece); (Denmark, Sweden; Norway, Finland); (Portugal, Spain).
•Plausibly, countries within each group have strong economic relations and similar social systems. Thus tax rates and welfare benefits are correlated by competition .
•IT IS NOT LIKELY THAT THE MIGRATION DECISION TO MOVE TO A COUNTRY WITHIN A GROUP DEPENDS ON THE LAGGED VALUE OF THE
BENEFITS OF OTHER COUNTRY IN THE GROUP!

29
Empirical Evidence: AssumptionsEmpirical Evidence: Assumptions
• These are 16 European countries: Austria, Belgium, Denmark, Finland, France, Germany, Greece, Ireland, Italy, Netherlands, Portugal, Spain, Sweden, U.K., Norway and Switzerland.
• The second group (group B) includes only source-host pairs of countries, within which the source country residents cannot freely move, work and get benefits in either of the host country.
• The host countries are the same 16 countries.• The source countries are 10 developed countries:
U.S., Canada, Japan, Australia, New Zealand, Israel, Taiwan, Hong Kong, Korea and Singapore.

30
Identification AssumptionsIdentification Assumptions
It embodies our threefold identification assumptions:– Immigration within group A is free– Immigration within group B is controlled and
screened by policies of the host countries– The decomposition into groups A and B is
exogenous to the skill composition of immigrants

31
• If immigration is indeed free within Group A, then a competitive equilibrium is achieved.
• In which case, a change in welfare-state benefits within the host countries, other things being equal, generate a change in the supply side of immigrants.
• Plausibly, the demand for labor immigrants is independent of the welfare-state benefits.
• Hence, within group A, welfare-policy changes identifies the considerations of the potential immigrants.
• These consideration implicates that: 0
d
d F
Empirical Evidence: AssumptionsEmpirical Evidence: Assumptions

32
w/p
Slow
Shigh Shigh/low (normalized)
Empirical Evidence: AssumptionsEmpirical Evidence: Assumptions
mhigh , mlow

33
• If immigration is indeed restricted within group B, then the “demand” for immigrants is perfectly inelastic.
• (It is not demand per se, but regulated quota)• Therefore, only shifts of the “demand” side, that is,
the migration policy, can change the equilibrium rates of immigration.
• Hence, within group B, welfare-policy changes identifies the considerations of the policy-makers within the host countries.
• These consideration implicates that: 0
d
d R
Empirical Evidence: AssumptionsEmpirical Evidence: Assumptions

34
mhigh , mlow
w/p
Dhigh
Dlow
Dhigh/low (normalized)
Empirical Evidence: AssumptionsEmpirical Evidence: Assumptions

35
Empirical Evidence: DataEmpirical Evidence: Data
• Immigration Data (Docquier and Marfouk (2006)):• The data contains bilateral stock of immigrants,
based on census and register data, for the years 1990 and 2000.
• Immigrants are at working age (25+), defined as foreign born, subdivided into three classes of education level: low-skilled (0-8 schooling years), medium-skilled (9-12 schooling years) and high-skilled (13+ schooling years).
• Stock variables are more reliable than flow data, as flow data disregards return migration movements, which may distort the estimated effects.
• Moreover, endogenous dynamic of equilibrium rates, are better captured by stocks than flows.

36
Empirical Evidence: DataEmpirical Evidence: Data
• Data for welfare-state benefits per capita is based on OECD's Analytical Database.
• We use lagged average rates between 1974-1990.• Social benefits encompass all kinds of social public
expenditures, in cash or in kind, including, for instance, old age transfers, incapacity related benefits, health care, unemployment compensations and so on.
• The data is PPP-converted to 1990 U.S. dollars.

37
The Econometric Approach

38
Explanatory Variables

39
Differencing

40
Observables and non observables

41
Group A and Group B

42
The Estimated Equation

43
OLS OLS IV IV
benefits per capita (host country) -0.139 -0.111 -0.199 -0.205(0.049)*** (0.054)** (0.079)** (0.086)**
benefits per capita (host country) X R 0.135 0.133 0.195 0.226(0.054)** (0.061)** (0.079)** (0.088)**
migration stock share in 1990 - low skilled -0.755 -0.757 -0.750 -0.750(0.097)*** (0.095)*** (0.098)*** (0.097)***
migration stock share in 1990 - low skilled X R 1.673 1.694 1.669 1.687(0.185)*** (0.180)*** (0.185)*** (0.181)***
migration stock share in 1990 - high skilled 1.076 1.082 1.071 1.071(0.131)*** (0.127)*** (0.132)*** (0.130)***
migration stock share in 1990 - high skilled X R -0.729 -0.734 -0.723 -0.723(0.134)*** (0.130)*** (0.135)*** (0.133)***
high-low labor ratio in 1990 (host country) -0.459 -0.459(0.165)*** (0.165)***
high-low labor ratio in 1990 (host country) X F -0.088 0.221(0.558) (0.542)
Observations 400 400 400 400R-squared 0.857 0.858 0.856 0.856Migration into 16 European countries, from 26 developed countries (inclusive of the 16 host countries, amongwhich free migration is allowed); F (R) is a dummy variable for the 16 (10) source countries whose migration into the 16 host countries is (not) freeIV: legal origin of the host country (English, Scandivavian, German-French)Robust standard errors in parentheses* significant at 10%; ** significant at 5%; *** significant at 1%
Dependent Variable: High-Low Difference in Migration Stock Shares at 2000

44
Robustness Tests

45
Empirical Evidence: RobustnessEmpirical Evidence: Robustness
OLS OLS IV IV
benefits per capita (host country) -0.215 -0.126 -0.173 -0.152(0.082)*** (0.082) (0.065)*** (0.068)**
benefits per capita (host country) X R 0.198 0.113 0.156 0.139(0.082)** (0.083) (0.065)** (0.068)**
migration stock share in 1990 - low skilled -0.668 -0.666 -0.670 -0.665(0.139)*** (0.133)*** (0.139)*** (0.132)***
migration stock share in 1990 - low skilled X R 0.130 0.133 0.132 0.132(0.224) (0.221) (0.224) (0.221)
migration stock share in 1990 - medium skilled 0.890 0.895 0.892 0.894(0.159)*** (0.152)*** (0.159)*** (0.151)***
migration stock share in 1990 - medium skilled X R 0.293 0.286 0.290 0.287(0.402) (0.401) (0.402) (0.401)
medium-low labor ratio in 1990 (host country) -0.065 -0.065(0.056) (0.056)
medium-low labor ratio in 1990 (host country) X F -1.663 -1.614(0.485)*** (0.485)***
Observations 400 400 400 400R-squared 0.727 0.746 0.726 0.746Migration into 16 European countries, from 26 developed countries (inclusive of the 16 host countries, amongwhich free migration is allowed); F (R) is a dummy variable for the 16 (10) source countries whose migration into the 16 host countries is (not) freeIV: legal origin of the host country (English, Scandivavian, German-French)Robust standard errors in parentheses* significant at 10%; ** significant at 5%; *** significant at 1%
Dependent Variable: Medium-Low Difference in Migration Stock Shares at 2000
46
OLS OLS IV IV
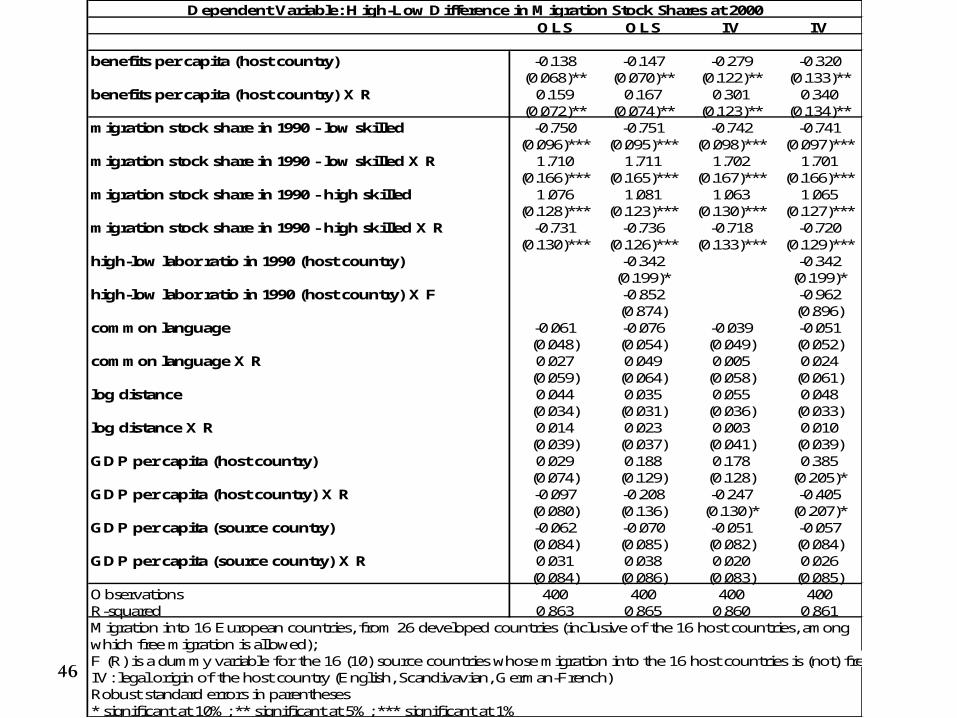
benefits per capita (host country) -0.138 -0.147 -0.279 -0.320(0.068)** (0.070)** (0.122)** (0.133)**
benefits per capita (host country) X R 0.159 0.167 0.301 0.340(0.072)** (0.074)** (0.123)** (0.134)**
migration stock share in 1990 - low skilled -0.750 -0.751 -0.742 -0.741(0.096)*** (0.095)*** (0.098)*** (0.097)***
migration stock share in 1990 - low skilled X R 1.710 1.711 1.702 1.701(0.166)*** (0.165)*** (0.167)*** (0.166)***
migration stock share in 1990 - high skilled 1.076 1.081 1.063 1.065(0.128)*** (0.123)*** (0.130)*** (0.127)***
migration stock share in 1990 - high skilled X R -0.731 -0.736 -0.718 -0.720(0.130)*** (0.126)*** (0.133)*** (0.129)***
high-low labor ratio in 1990 (host country) -0.342 -0.342(0.199)* (0.199)*
high-low labor ratio in 1990 (host country) X F -0.852 -0.962(0.874) (0.896)
common language -0.061 -0.076 -0.039 -0.051(0.048) (0.054) (0.049) (0.052)
common language X R 0.027 0.049 0.005 0.024(0.059) (0.064) (0.058) (0.061)
log distance 0.044 0.035 0.055 0.048(0.034) (0.031) (0.036) (0.033)
log distance X R 0.014 0.023 0.003 0.010(0.039) (0.037) (0.041) (0.039)
GDP per capita (host country) 0.029 0.188 0.178 0.385(0.074) (0.129) (0.128) (0.205)*
GDP per capita (host country) X R -0.097 -0.208 -0.247 -0.405(0.080) (0.136) (0.130)* (0.207)*
GDP per capita (source country) -0.062 -0.070 -0.051 -0.057(0.084) (0.085) (0.082) (0.084)
GDP per capita (source country) X R 0.031 0.038 0.020 0.026(0.084) (0.086) (0.083) (0.085)
Observations 400 400 400 400R-squared 0.863 0.865 0.860 0.861Migration into 16 European countries, from 26 developed countries (inclusive of the 16 host countries, amongwhich free migration is allowed); F (R) is a dummy variable for the 16 (10) source countries whose migration into the 16 host countries is (not) freeIV: legal origin of the host country (English, Scandivavian, German-French)Robust standard errors in parentheses* significant at 10%; ** significant at 5%; *** significant at 1%
Dependent Variable: High-Low Difference in Migration Stock Shares at 2000

47
Replacing the period for the benefits

48
Pension payments as the benefits

49
Index of non-defense- spending measure for the benefits

50
Adding the Gini Coefficient

51
Adding Gravity variables

Reversing the direction: The Effect of Migration on the
Welfare State

53
Reversing the Direction: migration effect on benefits
Data

The dependent variable

The explanatory variable

Endogeneity Problem

Instruments

Instruments (continued)

Auxilliary equation

Fitted values of migration variables