the genetic architecture of maize · pdf filethe genetic architecture of maize height ......
TRANSCRIPT

INVESTIGATION
The Genetic Architecture Of Maize HeightJason A. Peiffer,*,1 Maria C. Romay,† Michael A. Gore,‡ Sherry A. Flint-Garcia,§,** Zhiwu Zhang,†
Mark J. Millard,††,‡‡ Candice A. C. Gardner,††,‡‡ Michael D. McMullen,§,** James B. Holland,§§,***
Peter J. Bradbury,††† and Edward S. Buckler†,‡,†††
*Department of Genetics, Bioinformatics Research Center, North Carolina State University, Raleigh, North Carolina 27695,†Institute for Genomic Diversity and ‡Department of Plant Breeding and Genetics, Cornell University, Ithaca, New York, 14853,§United States Department of Agriculture -Agricultural Research Service, Columbia, Missouri 65211, **Division of Plant Sciences,
University of Missouri, Columbia, Missouri 65211, ††United States Department of Agriculture -Agricultural Research Service,Ames, Iowa, 50011, ‡‡Department of Agronomy, Iowa State University, Ames, Iowa 50011, §§United States Department of
Agriculture -Agricultural Research Service, Raleigh, North Carolina 27695, ***Department of Crop Science, North Carolina StateUniversity, Raleigh, North Carolina 27695, and †††United States Department of Agriculture -Agricultural Research Service, Ithaca,
NY 14853
ABSTRACT Height is one of the most heritable and easily measured traits in maize (Zea mays L.). Given a pedigree or estimates of thegenomic identity-by-state among related plants, height is also accurately predictable. But, mapping alleles explaining natural variationin maize height remains a formidable challenge. To address this challenge, we measured the plant height, ear height, flowering time,and node counts of plants grown in .64,500 plots across 13 environments. These plots contained .7300 inbreds representing mostpublically available maize inbreds in the United States and families of the maize Nested Association Mapping (NAM) panel. Joint-linkage mapping of quantitative trait loci (QTL), fine mapping in near isogenic lines (NILs), genome-wide association studies (GWAS),and genomic best linear unbiased prediction (GBLUP) were performed. The heritability of maize height was estimated to be .90%.Mapping NAM family-nested QTL revealed the largest explained 2.1 6 0.9% of height variation. The effects of two tropical alleles atthis QTL were independently validated by fine mapping in NIL families. Several significant associations found by GWAS colocalized withestablished height loci, including brassinosteroid-deficient dwarf1, dwarf plant1, and semi-dwarf2. GBLUP explained .80% of heightvariation in the panels and outperformed bootstrap aggregation of family-nested QTL models in evaluations of prediction accuracy.These results revealed maize height was under strong genetic control and had a highly polygenic genetic architecture. They alsoshowed that multiple models of genetic architecture differing in polygenicity and effect sizes can plausibly explain a population’svariation in maize height, but they may vary in predictive efficacy.
HEIGHT adaptations are essential to plant fitness andagricultural performance. They are intrinsic to the evo-
lutionary history, standing diversity, and genetic architectureof a population, and impact the velocity of its evolution andresponse to breeders’ selection pressures. The height ofplants evolving in competitive environments is in parta product of selection imposed on fitness by the effects oflight interception, carbon and nutrient capture, weed compe-tition, and seed dispersal (Lin et al. 1995). In domesticated
crops, breeding efforts facilitating agricultural industrializationindirectly select height adaptations, maximizing yield undermonoculture. Height adaptations buffering yield againstdrought and other environmental factors are also desirablyselected. This is illustrated in the yield gains and height reduc-tions of wheat (Triticum spp.) and rice (Oryza sativa) in theGreen Revolution (Khush 2001). During selection for industrialagriculture, height adaptations increase harvest uniformity, fa-vorably partition carbon and nutrients between grain and non-grain biomass, and enhance fertilizer, pesticide, and water useefficiency (Khush 2001). In grasses like maize, wheat, and rice,apical growth is terminated at reproductive maturity (Lin et al.1995). This may establish genetic correlations among heightand flowering and constrain evolvability.
Due to its high heritability and the ease of its measurement,plant height has been studied since Mendel’s foundational
Copyright © 2014 by the Genetics Society of Americadoi: 10.1534/genetics.113.159152Manuscript received November 1, 2013; accepted for publication February 4, 2014;published Early Online February 10, 2014.Available freely online through the author-supported open access option.Supporting information is available online http://www.genetics.org/lookup/suppl/doi:10.1534/genetics.113.159152/-/DC1.1Corresponding author: Department of Genetics, Bioinformatics Research Center,North Carolina State University, Raleigh, NC 27695. E-mail: [email protected]
Genetics, Vol. 196, 1337–1356 April 2014 1337

hybridization experiments (Mendel 1866). Plant height locihave been cloned and resolved by molecular tagging of large-effect alleles often induced by mutagenesis (Salas Fernandezet al. 2009; Andorf et al. 2010). Over 40 maize genes at whichmutations have large effects on plant height have been identi-fied (Multani et al. 2003). These are involved in hormonesynthesis, transport, and signaling (Wang and Li 2008).Well-characterized maize height genes include: brachytic2,influencing polar auxin transport (Multani et al. 2003); dwarf3,mediating gibberellin synthesis (Winkler andHelentjaris 1995);dwarf8 and dwarf9, regulating DELLA proteins of gibber-ellin signal transduction pathways (Lawit et al. 2010); andnana plant1, impacting brassinosteroid synthesis (Hartwiget al. 2011).
The large effects of these loci suggest they may notcommonly segregate in natural populations due to rapid lossor fixation. Loss of large-effect alleles is especially likely asa population approaches optimal fitness or agriculturaldesirability, as predicted by the Fisher–Orr model (Orr2005; Brown et al. 2011). Nevertheless, height mutationsmay influence other traits, causing antagonistic pleiotropyand resulting in the maintenance of such alleles. Polymor-phism at these loci may also be maintained in some genomicregions if selection is limited by linkage disequilibrium asexplained byHill–Robertson interference (Hill and Robertson1966) and the Fisher–Muller model (Fisher 1930; Muller1932). In maize, breeders maintain inbred heterotic groupswith established general combining abilities but select indi-viduals based upon specific hybrid performance. This practicemay allow segregation of large recessive effects. Admixtureof exotic germplasm and locally adapted subpopulations mayalso allow persistent segregation of large-effect alleles due toevolutionary capacitance (Masel 2005), wherein environ-ments and epistatic alleles buffer large effects in adaptedpopulations but cease to do so in a new environment or whennew alleles become common in an admixed population.Therefore, the proportion of variation explained by largeeffects in admixed diversity panels is unknown. Details ofthe joint distribution of genetic effect sizes, frequencies,linkage equilibria, recombination rates, environmental andgenetic conditionalities (such as genotype-by-environmentinteraction and epistasis), and pleiotropy will enhance ourunderstanding of phenotypic landscapes or responsesurfaces implicit to crop evolution (Rice 2004; Messinaet al. 2011) and help to optimize selection practices for cropimprovement.
Maize is a model species with exceptional morphologicaland molecular diversity. Millions of single nucleotide poly-morphisms (SNPs) may segregate in a modestly sized pop-ulation (Tian et al. 2011) and the annual cross-pollinationof maize rapidly decays their linkage disequilibrium (LD)(Remington et al. 2001). Breeders have selected and recom-bined this diversity for .7000 years and commercial hybridbreeding has ensued for a century (Hamblin et al. 2007;Piperno et al. 2009; Wallace et al. 2013). The past decadehas seen exceptional genotyping advances. Molecular markers
now regularly serve as proxies for heritable trait variation andaid dissection of its segregation. Over 27 million variants havebeen genotyped in 27 inbreds (Gore et al. 2009; Chia et al.2012). These were parents of the maize Nested AssociationMapping (NAM) families (Chia et al. 2012) and the inter-mated B73 3 Mo17 family (IBM) (Lee et al. 2002). Parentalvariants were imputed based on 1106 markers scored on4892 recombinant inbred lines (RILs). Also, 2815 inbredsfrom the US Department of Agriculture–Agricultural ResearchService (USDA–ARS) North Central Regional Plant Introduc-tion Station (NCRPIS) were genotyped-by-sequencing toidentify 681,257 SNPs (Romay et al. 2013). These are themost densely genotyped public maize populations (Chiaet al. 2012).
This study’s objectives were to explore the genetic archi-tecture of maize height and related traits, validate severalallele estimates of the inferred architecture, and contrastmultiple models estimating genetic architecture in their abil-ity to explain the natural height variation of observed linesand predict the height of unobserved lines given theirgenotypes. To achieve these objectives, maize plant height(PHT), ear height (EHT), flowering time (days to anthesis,DTA), and node count (NPH) were measured in the NAMand IBM families and joint-linkage mapping of quantitativetrait loci (QTL) was performed. A genome-wide associationstudy (GWAS) was also executed across the NAM and IBMfamilies as well as within the NCRPIS diversity panel.To validate allele estimates of a QTL on chromosome 9,PHT was mapped in two families of near isogenic lines(NILs) with introgressions of NAM parents (CML277 andCML333) in a B73 background. Variants segregating in theNAM and IBM families as well as the NCRPIS panel wereused to construct genomic identity-by-state (IBS) relation-ship matrices for genomic best linear unbiased prediction(GBLUP) (VanRaden 2008). GBLUP was performed andcompared to QTL models explaining PHT, EHT, DTA, andNPH variation across, within, and between RIL families.GBLUP was also performed within the NCRPIS diversitypanel.
Materials and Methods
Plant materials and environments
The NAM families were developed by the Maize DiversityProject as previously described (McMullen et al. 2009; Hunget al. 2012). The IBM family (Lee et al. 2002) was alsoevaluated. RILs were measured in 10 environments, underconventional fertilization, weed, and pest control. In 2006and 2007, RILs were scored in Aurora, New York; Clayton,North Carolina; Columbia, Missouri; and Urbana, Illinois. In2008, RILs were scored in Aurora, NY. In 2009, they werescored in Columbia, MO. In total, 4892 NAM and IBM RILswere scored for height in .7 environments. This datasetwas used in linkage mapping, GWAS, and GBLUP.
In New York, RILs were planted at Muskgrave ResearchStation (Honeoye silt-loam soil). In 2006, 2007, and 2008,
1338 J. A. Peiffer et al.

single row plots of 12 plants were grown for each RIL. In2006, RILs were stratified by randomized family as pre-viously described (Hung et al. 2012). In each family, incom-plete blocks of 20 random RILs, B73, and the family’salternate parent were grown in an a-lattice. Plot order ineach block was randomized. In 2007 and 2008, a similarapproach was taken, but plots were stratified by maturitygroup. In North Carolina during 2006 and 2007, RILs wereplanted at the Central Crops Research Station (Cecil sandy-loam soil) in single row plots of 8 plants after thinning. TheRILs were grown in a similar design to New York the sameyears. In 2006, a second replicate of families correspondingto CML247, CML277, Ki3, M162W, Mo17, and Tzi8 wasgrown. In Missouri, RILs were planted at Bradford ResearchCenter (Mexico silt-loam soil) in 2006 and 2007. A single rowplot of 9 plants was grown for each RIL. Due to poor germi-nation and drought, families corresponding to CML247,CML322, IL14H, M162W, Mo18W, MS71, NC350, NC358,and P39were not scored in 2006, and in 2007, the IBM familywas not grown (Hung et al. 2012). In Missouri during 2009,RILs were planted in single-row plots of 15 plants at RollinsBottoms Research Station (Haymond silt-loam soil). A similarfield design to New York and North Carolina was used.In Illinois during 2006 and 2007, RILs were grown at theCrop Sciences Research and Education Center (Muscatinesilt-loam soil) in single row plots thinned to 15 plants. Plotswere arranged in a design similar to other environmentsplanted the same years.
After joint-linkage mapping, two NILs with a B73 back-ground were used to validate the family-nested QTL explain-ing the most variation in NAM. The NILs had introgressionsfor two alleles on the long arm of chromosome 9 and wereobtained from the Syngenta Corporation. Introgressions ofCML277 and CML333 were estimated to be �90 Mb (Chr 9:25,654,718–114,922,534 bp, Maize RefGenV1) and 125 Mb(Chr 9: 11,972,467–136,597,740 bp, RefGenV1) based on1106 molecular markers genotyped on the NILs (see geno-typing). These NILs were backcrossed to B73 and their prog-eny were selfed to produce two segregating NIL families of�3500 plants. After genotyping, 88 recombinants derivedfrom the CML277 introgressed NIL and 93 recombinantsderived from the CML333 introgressed NIL were recovered.These were selfed and fixed for recombinants. Bulks of thelines were planted in single-row plots and scored for PHT,EHT, and DTA in Aurora, NY; Columbia, MO; and Clayton,NC in 2011. Plots consisted of 12, 12, and 8 plants per rowafter thinning in New York, Missouri, and North Carolina,respectively. Single-row plots of 12 and 8 plants per rowwere scored again in Columbia, MO and Clayton, NC in2012. In all environments, plots were grown in incompleteblocks of 15 fixed recombinants, B73, and the NIL family’salternate parent, CML277 or CML333.
In addition to RILs and NILs, the NCRPIS diversity panelfrom the USDA–ARS North Central Regional Plant Introduc-tion Station, was evaluated in 2010. This resource contains2815 inbreds from worldwide maize gene pools (Romay
et al. 2013). Inbreds were planted in single-row plots andevaluated for PHT, EHT, and DTA in three environments:Aurora, NY; Clayton, NC; and Columbia, MO. In New Yorkand North Carolina, inbreds were planted in plots of 12plants at Muskgrave Research Station, and Central CropsResearch Station, respectively. In Missouri, inbreds wereplanted at South Farm in plots of 15 plants. In all fields,the NCRPIS panel was stratified by nine maturity groups.Lines were randomly assigned to two incomplete blocks of19 inbreds, checks of B73, IL14H, KI11, P39, SA24, orTX303 were organized in an a-lattice.
Phenotyping maize height and related traits
In all environments and panels, PHT was measured as thedistance in centimeters from the soil line of the plant to thebase of the flag leaf at reproductive maturity; this measureexcluded any variation in tassel length from the flag leaf tothe top of the plant. Similarly, EHT was scored as thedistance from the soil to the primary ear node, at the samedevelopmental stage. NPH was scored as the number ofnodes between the top brace root node and the flag leaf,excluding any variation in brace root nodes and anysubterranean nodes. In all three traits, multiple plants (threeto eight) were measured in each plot and mean plot valueswere recorded. As described (Buckler et al. 2009), DTA wasscored as the days from planting to median anthesis in a plot.
Genotyping RIL and NIL families and the NCRPISdiversity panel
Six molecular marker sets were used for joint-linkage QTLmapping, GWAS, and GBLUP across NAM and IBM families,positional mapping across two NIL families, and linearmixed model GWAS and GBLUP across the NCRPIS inbreddiversity panel. In the first marker set, 1106 markers weregenotyped on an Illumina Golden Gate assay across theNAM and IBM families to facilitate joint-linkage mapping(McMullen et al. 2009). In this marker set, missing genotypecalls were imputed as a weighted average of flankingmarkers. Relative weights were estimated from the geneticdistance between a missing marker and adjacent markers aspreviously described (Tian et al. 2011). These 1106 markerswere also genotyped on an Illumina Golden Gate assayacross the NILs provided by Syngenta to assess introgressionsizes in the B73 background.
A second marker set of �1.6 million of the 3.3 millionSNPs detailed in the maize HapMapV1 (Gore et al. 2009)and scored in the 27 founder lines of the NAM and IBMfamilies were also employed in the analyses. Within thismarker set, missing genotypes were imputed across founderlines using the haplotype clustering algorithm fastPHA-SEv1.3 as previously described (Tian et al. 2011). Next,SNPs were projected onto the 4692 RIL progeny of theNAM and IBM families by first estimating their physical dis-tance to the nearest flanking markers of the first marker setof 1106 markers based on maize RefGenV1. These physicaldistances were then used to calculate a weighted average of
The Genetic Architecture of Maize Height 1339

genotype scores from the flanking markers of the firstmarker set as an estimate of the projected SNP’s genotypesacross all RILs (Tian et al. 2011). SNP genotype scores weresubsequently used in GBLUP of the RIL families.
A third marker set of �26 million of the 55 million SNPsand RDVs reported in the maize HapMapV2 (Chia et al. 2012)was imputed across NAM and IBM family parents usingregions of identity by descent. These were projected on RILfamilies based on their parental lineage and the B73 genomeas previously reported (Tian et al. 2011; Chia et al. 2012). Asin maize HapMap V1, SNPs projected on the RILs wereassigned a value equal to the weighted average of flankingmarkers from the first marker set of 1,106 markers genotypedacross all RILs. Weights were estimated by a SNP or read-depth variant9s (RDV) physical distance from flanking geno-typed markers based on maize RefGenV1 (Tian et al. 2011;Chia et al. 2012). This marker set was then employed in joint-linkage-assisted GWAS of the RIL families.
A fourth marker set consisting of four SNPs was genotypedusing KBioscience’s KASPar SNP genotyping system (http://www.kbioscience.co.uk/). The assayed SNPs were located at73,592,864 bp, 99,948,772 bp, 102,469,299 bp, and109,910,100 bp on the long arm of chromosome 9 in maizeRefGenV1. These SNPs were scored across NILs with CML277and CML333 introgressions in chromosome 9 obtained fromSyngenta. No imputations or projections of SNPs were per-formed. The SNPs were used to screen 3488 and 3897 linesfor recombinant haplotypes derived from the CML277 andCML333 NIL families, respectively.
A fifth set of 1813 SNPs located across a 126-Mb regionon maize chromosome 9 was scored using genotyping bysequencing (GBS) (Elshire et al. 2011). These SNPs weregenotyped across 86 and 93 fixed recombinants of theCML277 and CML333 NIL families, respectively. MissingSNPs were imputed using a nearest neighbors algorithm inTASSEL v.3.0 (Bradbury et al. 2007) and estimated withhaplotypes of adjacent SNPs in a 1024-bp window (Romayet al. 2013). Genotype calls across these SNPs were used inmapping both NIL families.
A final set of 681,257 SNPs scored on the NCRPIS diversitypanel was genotyped using GBS as previously described(Elshire et al. 2011; Romay et al. 2013). Missing SNPs werealso imputed by a nearest neighbors algorithm in TASSELv.3.0 (Bradbury et al. 2007) and estimated with haplotypesconstructed from SNPs in a window of 1024 bp (Romay et al.2013). The SNPs were then used in linear mixed modelGWAS of the NCRPIS diversity panel and genomic predictionby GBLUP (Endelman 2011). All marker sets genotyped inthe NAM and IBM families or the NCRPIS diversity panel, andused within the analyses of this study, are publicly available atwww.panzea.org.
Partitioning trait variance, calculating heritability,and estimating line values
To partition trait variation into components of genetic andenvironmental variance, we performed linear mixed modeling
using ASReml v3.0 (Gilmour et al. 1995). To reduce undueinfluence of outliers, plot measures over three standarddeviations from each environmental mean were replacedby the mean plus or minus three standard deviations,whichever value best approximated the original measure.Linear mixed model selection was then performed for eachtrait with custom Java code calling ASReml v3.0 (Gilmouret al. 1995). First, trait variation within each of the envi-ronments was fit in separate models. Terms retained inthese models were chosen by backward selection basedupon likelihood ratio testing (P , 0.05). These terms werethen nested within environment and a multienvironmentmodel was constructed.
For the RILs of the NAM and IBM families, linear mixedmodels separately fit for each environment included a fixedeffect for the grand population mean and multiple randomeffects. Random effects entering the full model includedfamily and RIL nested within family genotypic effects, aswell as environmental effects denoting the blocks, rows, andcolumns of each field design. A separate variance compo-nent was fit for RIL nested within each of the NAM and IBMfamilies and an additional family term was constructed forreplicated parental checks. All random effects in the model,including the genotypic effects of family and RIL nested infamily, were modeled with independent G covariancestructures. But, a correlated R structure was fit amongresiduals based on a two-dimensional separable first-orderautoregressive spatial structure for rows and columns withineach environment. The importance of all environmentaleffects and the residual correlation structures within eachenvironment’s model were tested by backward selectionand retained if they met a likelihood ratio significance ofP , 0.05.
Next, for each trait, a single linear mixed model acrossenvironments was fit for the RIL families, including andnesting the significant components of each individual environ-ment model by environment. Multiple across environmentterms were also added, including environment, family byenvironment, and RIL nested within family-by-environmentinteraction terms, as well as a heterogeneous spatially corre-lated R structure across environments. The significant autor-egressive spatial structures for rows and columns within eachenvironment were also included in the model. Line values foreach RIL were predicted from the multienvironment model foruse in mapping and prediction (Table S1). Genetic effects forfamily and RIL nested within family were refit as fixed effectswithin the same multienvironment model to infer best linearunbiased estimates of line values and their unbiased distribu-tions. Using these line values, significance of skew about themid-parent values for each RIL family was estimated by a mod-ified two-sided D’Agostino–Pearson test (D’Agostino 1970).This test was modified such that estimates of the population’smean were replaced by the population’s mid-parent value andsignificance was determined by the Bonferroni-corrected sig-nificance threshold of P, 1.9E-3. This enabled the assessmentof skew with respect to the mid-parent and was performed as
1340 J. A. Peiffer et al.

a test for the potential of nonadditive genetic variation with theassumption that the population was random mating and notunder selection since the initial parental cross.
Recombinant NILs fixed for an introgressed region ofCML277 or CML333 on the long arm of chromosome 9 werefit in a linear mixed model across the five field environmentssurveyed for PHT and EHT and across the three fieldenvironments measured for DTA. Fixed effects were fit forthe grand mean as well as NIL family and line value wasnested within the NIL family. Random effect terms denotingenvironment and block nested within environment werealso included in the model. Best linear unbiased estimatedline values for each NIL were then calculated from themultienvironment model (Table S3).
Within the NCRPIS diversity panel, a single linear mixedmodel was fit across all environments including a singlefixed effect for the grand mean and random effects forgenotypic and environmental factors using ASReml v3.0(Gilmour et al. 1995) for each trait. Random effects enteringthe full model included an inbred genotypic effect and theenvironmental effects of field, row, column, and blocks ineach environment. Analogous to the RIL families, all randomeffects including genetic effects were modeled with indepen-dent G structures. A two-dimensional separable first-orderautoregressive spatial structure for rows and columns ineach environment and a heterogeneous correlated covari-ance structure across environments were modeled in theR structure of the residuals. From the multienvironmentmodels, best linear unbiased predicted and estimated linevalues for each inbred of the NCRPIS diversity panel were cal-culated for mapping, prediction, and correlation (Table S2).
After constructing the multienvironment models, weestimated heritability on a line-values basis for every traitin each of the NAM and IBM families and across theNAM and NCRPIS diversity panel, as previously described(Holland et al. 2003; Hung et al. 2012). The variance com-ponent explaining variation between families and the arith-metic mean of variance components explaining variationbetween lines in each family were summed to infer thegenetic variance of each trait. Genetic variances in each familywere estimated as the variance component explaining varia-tion between lines of the family. This was also true across theNCRPIS diversity panel, where genetic variance was estimatedas the variance component explaining variation between lines.To attain heritability estimates, the values were divided by thetotal variance between and within line values after accountingfor variance attributable to established environmental sources.For estimation of contributions to a single line value, family-by-environment and line nested in family-by-environmentvariance components were divided by the harmonic mean ofthe number of environments a family or line was measured aspreviously described (Holland et al. 2003). Contributionsof residuals were estimated by dividing the arithmeticmean for residuals across the heterogeneously modeled resid-uals for each environment by the harmonic mean number ofplots a line was measured (Holland et al. 2003). Heritability
estimators calculated within a NAM family as well as acrossthe NCRPIS diversity panel did not involve family or family-by-environment variance components, but were calculatedsimilarly.
Bootstrapped QTL mapping across and withinRIL families
Joint linkage mapping of family-nested QTL explaining varia-tion in line values for each of the traits across all envi-ronments was performed using the SAS system version 9.2(SAS 2004–2008). PROC GLMSELECT was implemented toselect a family-nested QTL model from the first marker set of1106 SNPs nested in each of the 26 NAM and IBM families.Based on null permutation testing, the threshold for modelinclusion and exit of each family-nested QTL in all traits wasset to a false positive rate of 0.001 during stepwise modelselection. A term denoting RIL family was also forced intoevery model. In addition to joint-linkage mapping of RILfamily-nested QTL using the full dataset (Buckler et al. 2009;Tian et al. 2011), a family-stratified bootstrap samplingscheme was also executed. In this approach, 80% of the RILswithin each of the NAM and IBM families were randomlysampled with replacement (20% of RILs were present acrossall samples) and the stepwise model selection routine wasperformed for 100 sampling iterations to permit calculationof resamplemodel inclusion probabilities (RMIPs) or the prob-ability a family-nested QTL is included within the final model(Valdar et al. 2009). To estimate a genome-wide significancethreshold for RMIPs, null permutation testing was performedfor PHT and EHT. At the previously defined thresholds formodel inclusion and exit, no family-nested QTL were foundto exceed RMIPs of 0.10 upon null permutation of trait valuesunder the employed bootstrap sampling scheme. Linkagemap-ping of nonnested QTL explaining PHT variation in the linevalues of each family was performed in an analogous mannerto joint-linkage mapping to permit calculation of QTL RMIPs.SAS system code for the sampling procedure is available onrequest.
Fine mapping two alleles of a height QTL onchromosome 9 in NIL families
To begin validation of the family-nested QTL results, wemeasured and further resolved two NILs possessing intro-gressions of the tropical lines CML277 and CML333 on thelong arm of chromosome 9 in a B73 (temperate stiff stalk)genetic background. In a preliminary analysis, Welch’st-tests from the base package of R v2.12.0 (R DevelopmentCore Team 2011) were employed to compare the NILsobtained from Syngenta to the inbred B73. These analysesconcurred with the significant PHT increasing (relative toB73) QTL effects identified in the CML277 3 B73 andCML333 3 B73 NAM families within the NIL’s introgressionregions. After backcrossing the NILs to B73, selfing theresulting progeny, screening 3488 and 3897 F2 plants forrecombinants within the introgression regions, and selfingtwo generations with selection for F3 plants homozygous for
The Genetic Architecture of Maize Height 1341

recombinant chromosomes, bulks of the homozygous re-combinant lines were evaluated for PHT, DTA, and EHT.Genotyping by sequencing (Elshire et al. 2011) and imputa-tion were performed across NIL families of 86 and 93recombinants with introgressions for CML277 and CML333as previously described. Using Welch’s t-test in R v2.12.0,the NIL line values for each of the traits were used in 1813sequential single marker regressions across the introgressionregion to further resolve the original NIL effect and supportjoint-linkage mapping results within the CML277 andCML333 NIL families.
GWAS across RIL families and within the NCRPISdiversity panel
To further resolve the genetic architecture of PHT andrelated traits, we conducted a joint-linkage-assisted GWASwith 4892 RILs across 26 million SNPs imputed from maizeHapMapv2 (Chia et al. 2012). After removing all family-nested QTL from a single chromosome, the family nestedQTL model was fit to line values for each trait and residualvariance attributed to the removed family-nested QTL aswell as genetic variance not previously accounted for bythe QTL model was determined (Tian et al. 2011). This pro-cedure was repeated for all 10 chromosomes of the maizegenome. Using these estimates of residual genetic effectsand custom Java code we performed a stepwise regressionprocedure as previously described (Tian et al. 2011) witha genome-wide false positive threshold of 5e-4 as deter-mined by 2000 null permutations of PHT. The procedurewas repeated for the residuals of each chromosome for100 stratified sampling iterations whereby 80% of the RILswithin each NAM and IBM family were randomly sampledwith replacement. The RMIP of a SNP was estimated as theproportion of models containing the SNP (one model foreach stratified sampling iteration) out of the 100 modelsthat were constructed. This measure was used to assess therobustness of the SNP's association with the trait. A genome-wide significance threshold for RMIP values (0.05) wasdetermined by null permutation testing as previouslydescribed (Brown et al. 2011; Kump et al. 2011; Tian et al.2011). Proximity of GWAS associations to QTL identifiedduring joint-linkage QTL mapping and candidate genes wereinferred based on the RefGenV1 physical map and functionalannotations from maize genome sequence release 4a.53.
Using the genome association and prediction integratedtool (GAPIT) (Lipka et al. 2011) in R v2.12.0 (R Develop-ment Core Team 2011) we performed sequential singlemarker mixed-model GWAS for PHT and related traitsacross the NCRPIS diversity panel. This approach includeda relatedness matrix scaled to be analogous to the numera-tor relationship matrix as described by the first method ofVanRaden (Yu et al. 2006; VanRaden 2008) as well as fixedcovariates for six eigenvectors with the largest eigenvaluesof the relatedness matrix (these eigenvectors explained31.6% of the variance in additive genetic relationshipmatrix) to capture additional population structure and allow
independent scaling of the matrix. It permitted identificationof significant associations with PHT and EHT. Associationswith Benjamini–Hochberg false discovery rate (FDR) ,5%(Benjamini and Hochberg 1995) were considered signifi-cant. The proximity of these GWAS associations to candidategenes was inferred based on the RefGenV2 physical map andthe functional annotations from maize genome sequence re-lease 5a.
Cross-validated genomic prediction across RIL familiesand within the NCRPIS panel
Using the package rrBLUP in R v2.12.0 (Elshire et al. 2011;Endelman 2011), we conducted genomic prediction byGBLUP. Identity-by-state (IBS) matrices detailing genomicrelationships were constructed as described by the firstmethod detailed in VanRaden (2008) for the NAM andIBM families from 1.6 million SNPs of the maize HapMapV1(Gore et al. 2009). Estimates of genomic relationship in theNCRPIS diversity panel were also calculated using the681,257 SNPs genotyped in the panel (Bradbury et al.2007). After constructing the genomic relationship matrices,all line values in an experiment (NAM RILs or the NCRPISdiversity panel, each analyzed separately) were fit by re-stricted maximum likelihood in a GBLUP framework to as-sess variance explained by the method. Next, RILs andinbreds in each panel were randomly allocated to five dis-joint subsets for cross-validation (Figure S7). Line valuesfrom combinations of one to four subsets were used inmodel calibration to predict line values of remaining sub-sets. Prediction accuracies were averaged across the folds.This process was repeated 10 times selecting five randomsubsets each time to estimate prediction accuracy with re-spect to the number of lines included in model calibration.
For comparison to GBLUP of RILs, prediction of NAMRIL PHT line values by bootstrap aggregating or bagging(Breiman 1996) family-nested QTL models was performedusing PROC GLMSelect in the SAS system v9.2 (SAS 2004–2008). However, unlike the approach to map family-nestedQTL, only RILs in a calibration subset were bootstrapsampled and used to construct family-nested QTL modelsto predict the RILs not included in the calibration subset.Selection of calibration subsets was performed in an iden-tical sampling scheme to sampling families during GBLUPcross-validation (Figure S7). But, from every subset of RILsselected to calibrate a prediction model, 10 bootstrapsamples were taken with replacement in a family-stratifiedmanner, these samples were not disjoint. From these boot-strap samples of the calibration subset (and equal in size tothe calibration subset), 10 family-nested QTL models wereconstructed. A family term was included in every modeland family-nested markers were included until reachingthe null-permutation threshold (as in the bootstrappingapproach employed in the full dataset). Models from boot-strap samples of the calibration subset were each used topredict RILs excluded from the calibration subset and anaverage of the predicted values (bagged estimator) was
1342 J. A. Peiffer et al.

calculated for each RIL. While prediction accuracy is tradi-tionally measured as the correlation (r) between predictedand observed line values given this statistics connectionwith selection accuracy, we measured the coefficient ofdetermination (r2) obtained by regressing line valuesagainst predicted line values obtained by GBLUP or by bag-ging family-nested QTL models during cross-validation.This measure has utility and reveals the variation explainedamong the predicted values. But, given that this measurewas employed, it must be noted that in all instances corre-lations between predicted and observed line values werepositive.
Cross-validated genomic prediction within and betweenRIL families
Within each RIL family, GBLUP and bagging of QTL modelswas performed in a manner identical to that performedacross families. The variance explained by GBLUP andpredicted from varying calibration sizes was determined.Similarly, the variance explained and predicted by baggingQTL models was also estimated in a manner analogous tothat performed across families. However, no family term wasincluded within the QTL models and markers were notnested within family, as only a single family was employedin each model selection process.
Between RIL families, bagging QTL models assumingallele effects were identical between families revealed nosignificant prediction accuracy. This was expected given theextensive allele series observed during family-nested QTLmapping. Consequently, between-family prediction accuracywas only extensively evaluated for GBLUP. A GBLUP modelcalibrated by every RIL in a single family was used to predictRILs in each of the other families. This procedure wasrepeated for all 26 RIL families. This provided 650 estimatesof between-family prediction accuracy. To assess the correla-tion of between-family prediction accuracies and the related-ness of their families, a modified Mantel test (Mantel 1967)was invoked between the relatedness matrix (VanRaden2008) of the non-B73 parent of each family and the matrixof r2 estimates of between-family prediction accuracy. In themodifiedMantel test, diagonal elements of bothmatrices wereexcluded from analysis as only elements of between-familyprediction accuracy (off-diagonal elements) and not within-family prediction accuracy were of interest. Inclusion of thesevalues would have upwardly biased the test’s correlation andits significance.
Results
Variation in maize height and related traits
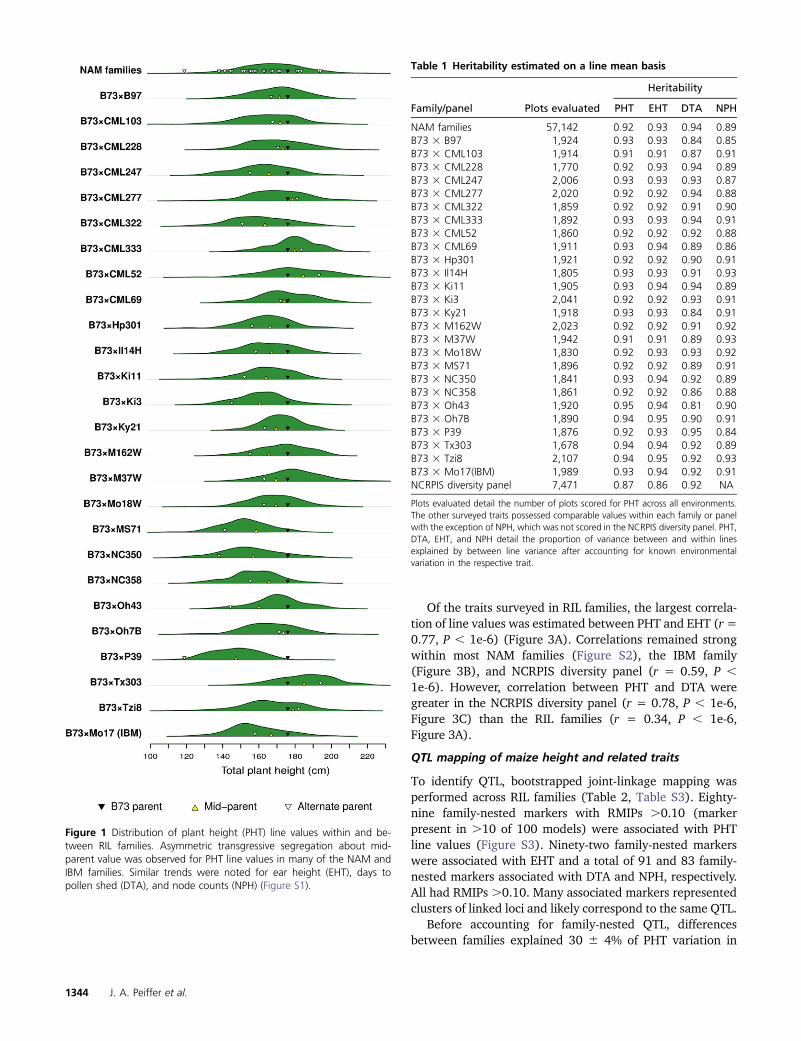
Heritable variation was observed for PHT, EHT, DTA, andNPH in the NAM and IBM families evaluated across 10environments. PHT, EHT, and DTA measures collected inthe NCRPIS diversity panel across three environments werealso highly heritable. Best linear unbiased estimated line
values for PHT across environments possessed an overallstandard error of difference of 5.2 and 6.4 cm in RIL familiesand the NCRPIS diversity panel, respectively. In RIL families,95% of line values for PHT fell between 138 and 199 cm,with 95% of EHT line values spanning 61 to 113 cm. Theshortest parent, P39 (116 cm), was shorter than nearly allRILs, whereas the tallest, TX303 (198 cm), approximatedthe tallest. Despite a similar range of parents and progenyacross families, transgressive segregation was present in allfamilies and significantly asymmetric about mid-parentvalues in 9 families for PHT, suggesting a role for epistasis(Figure 1, supporting information Table S1). Similar levelsof transgressive segregation and asymmetry about mid-parent values were found for EHT and the other traits inmany families (Figure S1).
The only traits with significantly correlated levels oftransgressive segregation (as measured by correlation of theratio of progeny and parent variances) across families werePHT and EHT, r = 0.63, P , 0.01. No trends in the asym-metry of progeny distributions (as measured by skew aboutthe mid-parent value) were found between traits across fam-ilies. In the NCRPIS diversity panel, 95% of PHT line valuesranged from 110 to 194 cm, while EHT line values fell be-tween 34 and 119 cm. Despite similar ranges, the greaterallelic diversity of the NCRPIS diversity panel relative to theRILs was mirrored by its larger variance for PHT and EHT.
Estimates of heritability calculated on a line mean basisdisplay the proportion of trait variation attributable todifferences between maize lines after accounting for varia-tion explained by known environmental factors. Theseestimates were high for all traits (Table 1) and similar topast surveys of the NAM families in fewer environments(Hung et al. 2012). The most heritable trait across theNAM families was DTA (H2
line = 0.94 6 0.01), followedby PHT (H2
line = 0.93 6 0.01), EHT (H2line = 0.92 6
0.01), and NPH (H2line = 0.89 6 0.02). Traits maintained
rank in the NCRPIS diversity panel: DTA (H2line = 0.92 6
02), PHT (H2line = 0.87 6 0.03), and EHT (H2
line = 0.86 60.02). Variation of heritability estimates within individualfamilies was small; yet, a significant correlation betweenestimates was found for PHT and EHT across families (r =0.86, P , 0.01).
Unlike recent efforts to detail the genetic architecture offlowering time photoperiod response in the NAM families(Hung et al. 2012), more uniform photoperiods were sur-veyed in the long day temperate environments of this study.Yet, the fraction of variation attributed to environmentalfactors was still significantly greater for DTA than the othertraits for the RILs (Figure 2A) and the NCRPIS diversitypanel (Figure 2B). Adjusting for temperature differencesby converting DTA to growing degree days to anthesis didnot substantially reduce estimates of between-environmentvariation. Genotype-by-environment interaction was greaterfor PHT and EHT than DTA or NPH in the RIL families andthe NCRPIS diversity panel (P , 0.05).
The Genetic Architecture of Maize Height 1343
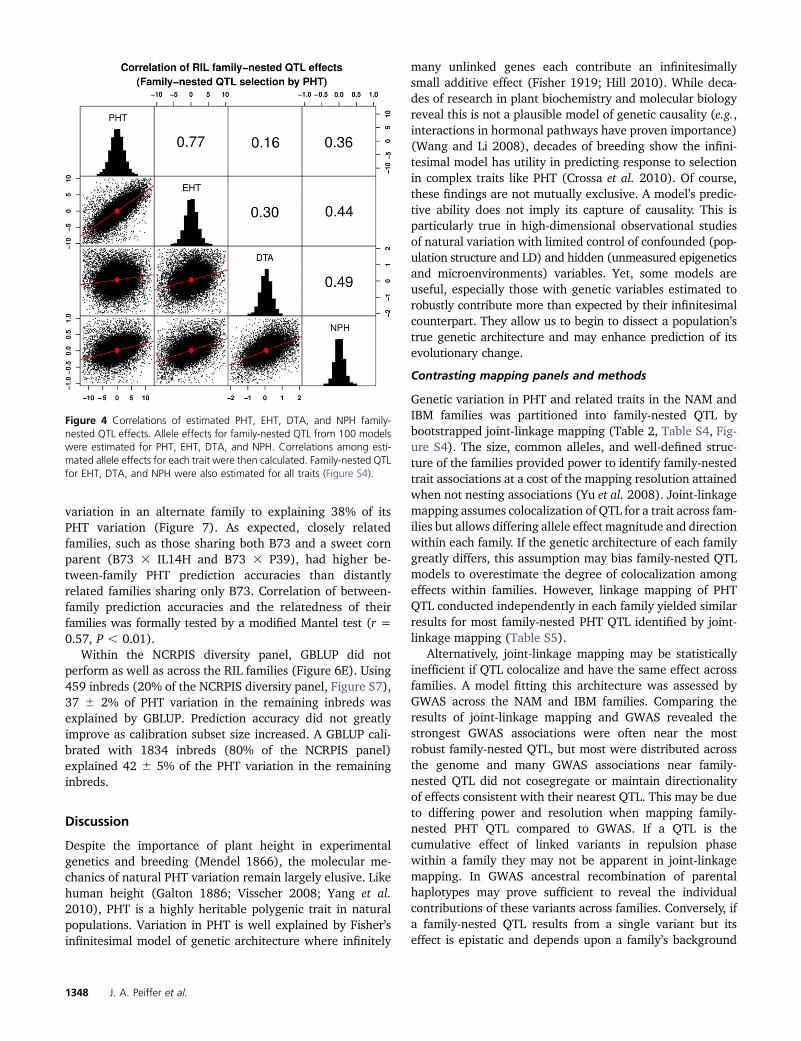
Of the traits surveyed in RIL families, the largest correla-tion of line values was estimated between PHT and EHT (r=0.77, P , 1e-6) (Figure 3A). Correlations remained strongwithin most NAM families (Figure S2), the IBM family(Figure 3B), and NCRPIS diversity panel (r = 0.59, P ,1e-6). However, correlation between PHT and DTA weregreater in the NCRPIS diversity panel (r = 0.78, P , 1e-6,Figure 3C) than the RIL families (r = 0.34, P , 1e-6,Figure 3A).
QTL mapping of maize height and related traits
To identify QTL, bootstrapped joint-linkage mapping wasperformed across RIL families (Table 2, Table S3). Eighty-nine family-nested markers with RMIPs .0.10 (markerpresent in .10 of 100 models) were associated with PHTline values (Figure S3). Ninety-two family-nested markerswere associated with EHT and a total of 91 and 83 family-nested markers associated with DTA and NPH, respectively.All had RMIPs .0.10. Many associated markers representedclusters of linked loci and likely correspond to the same QTL.
Before accounting for family-nested QTL, differencesbetween families explained 30 6 4% of PHT variation in
Figure 1 Distribution of plant height (PHT) line values within and be-tween RIL families. Asymmetric transgressive segregation about mid-parent value was observed for PHT line values in many of the NAM andIBM families. Similar trends were noted for ear height (EHT), days topollen shed (DTA), and node counts (NPH) (Figure S1).
Table 1 Heritability estimated on a line mean basis
Heritability
Family/panel Plots evaluated PHT EHT DTA NPH
NAM families 57,142 0.92 0.93 0.94 0.89B73 3 B97 1,924 0.93 0.93 0.84 0.85B73 3 CML103 1,914 0.91 0.91 0.87 0.91B73 3 CML228 1,770 0.92 0.93 0.94 0.89B73 3 CML247 2,006 0.93 0.93 0.93 0.87B73 3 CML277 2,020 0.92 0.92 0.94 0.88B73 3 CML322 1,859 0.92 0.92 0.91 0.90B73 3 CML333 1,892 0.93 0.93 0.94 0.91B73 3 CML52 1,860 0.92 0.92 0.92 0.88B73 3 CML69 1,911 0.93 0.94 0.89 0.86B73 3 Hp301 1,921 0.92 0.92 0.90 0.91B73 3 Il14H 1,805 0.93 0.93 0.91 0.93B73 3 Ki11 1,905 0.93 0.94 0.94 0.89B73 3 Ki3 2,041 0.92 0.92 0.93 0.91B73 3 Ky21 1,918 0.93 0.93 0.84 0.91B73 3 M162W 2,023 0.92 0.92 0.91 0.92B73 3 M37W 1,942 0.91 0.91 0.89 0.93B73 3 Mo18W 1,830 0.92 0.93 0.93 0.92B73 3 MS71 1,896 0.92 0.92 0.89 0.91B73 3 NC350 1,841 0.93 0.94 0.92 0.89B73 3 NC358 1,861 0.92 0.92 0.86 0.88B73 3 Oh43 1,920 0.95 0.94 0.81 0.90B73 3 Oh7B 1,890 0.94 0.95 0.90 0.91B73 3 P39 1,876 0.92 0.93 0.95 0.84B73 3 Tx303 1,678 0.94 0.94 0.92 0.89B73 3 Tzi8 2,107 0.94 0.95 0.92 0.93B73 3 Mo17(IBM) 1,989 0.93 0.94 0.92 0.91NCRPIS diversity panel 7,471 0.87 0.86 0.92 NA
Plots evaluated detail the number of plots scored for PHT across all environments.The other surveyed traits possessed comparable values within each family or panelwith the exception of NPH, which was not scored in the NCRPIS diversity panel. PHT,DTA, EHT, and NPH detail the proportion of variance between and within linesexplained by between line variance after accounting for known environmentalvariation in the respective trait.
1344 J. A. Peiffer et al.

line values in the NAM and IBM families. Similarly, 46 6 4%of EHT variation in line values was explained by familyeffects. By comparison, family mean differences weremore important for DTA (62 6 3%) and NPH (64 6 4%).Beyond variation explained by families, family-nested QTLexplained 466 5% of PHT variation in line values. The locusexplaining the most variation was found on chromosome 9and explained 2.1 6 0.9% of PHT variation after accountingfor variation attributed to families and other estimated fam-ily-nested QTL. This estimate rose to 2.6 6 0.5% of PHTvariation among the 66 models that possessed no linkedfamily-nested QTL within 10 cM of the locus. In total, thejoint-linkage QTL models explained 76 6 4% of PHT varia-tion and 78 6 3% of EHT variation, whereas they accountedfor 85 6 3% of DTA variation and 82 6 3% of NPHvariation.
Variation in QTL effects among RIL families suggestedallele series for all traits. All family-nested PHT QTL hadsignificant effects in at least four families (t-test, within fam-ily, P , 0.05) and positive and negative effects relative tothe shared parent, B73. Although most family-nested QTLwere not near loci with established effects on PHT, a few didcolocalize with previously identified PHT loci (Table 2,Table S4, Figure S3). The most notable was a QTL withRMIP of 0.77 within the 15.5-kb locus of brassinosteroid-deficient dwarf 1 (brd1) (Pettem 1956; Makarevitch et al.2012) on chromosome 1 at 248,503,298 bp (RefGenV1).In 18 of the 26 RIL families, this QTL was estimated toreduce PHT relative to the shared parent, B73. In addition,crinkly leaves 1 (Beavis et al. 1991) on chromosome 3 andcrinkly leaves 4 (Stinard and Robertson 1987) on chromo-some 10 were also near family-nested QTL with RMIPs of0.12 and 0.19, respectively. Maize plants with the crinklyleaves 1 or 4 mutant allele are short and possess crinklyknot-bearing leaves (Stinard and Robertson 1987; Beaviset al. 1991). As previously reported, vegetative to generativetransition 1 and zfl2 flowering time loci were also nearfamily-nested QTL for DTA (Buckler et al. 2009; Romay
et al. 2013) and NPH. However, these DTA loci did notoverlap with family-nested QTL for PHT or EHT.
The effects of family-nested PHT QTL on EHT, DTA, andNPH were estimated to assess the importance of pleiotropyand/or linkage (Table 2, Table S4, Figure 4). Allelic effectson EHT had the strongest correlation with PHT effects, r =0.77, P , 1e-6, whereas the weakest occurred between PHTand DTA, r = 0.16, P , 1e-6. These estimates paralleledcorrelations of line values across the RILs (Figure 3A). Sim-ilar trends were also observed for the effects of family-nested EHT, DTA, and NPH QTL on PHT and for QTL effectsmapped in individual families (Figure S4).
Fine mapping a maize height QTL in two NIL families
The effects of two tropical alleles (from CML277 andCML333) at the PHT QTL explaining the most variation(2.1%) in joint-linkage mapping were independently vali-dated in two NIL families. The QTL interval was a 15-Mbregion on chromosome 9 centered at 98.5 Mb (RefGenV1).It contained five joint-linkage markers each with a RMIP.0.10 for PHT. One of the five markers was present in everymodel upon bootstrapped joint-linkage mapping of PHT andEHT; but two markers never entered the same model. Thisgave the region a combined RMIP of 1.00 and implied seg-regation of a common factor. In mapping NPH, two markersin the region had a combined RMIP of 0.60 but no markerwith a RMIP .0.10 was found for DTA.
The CML277 and CML333 alleles of the QTL significantlyincreased PHT by �6 or 4 cm, respectively, relative to theB73 reference allele in family-nested joint-linkage modelsand also in single family models where the effects wereestimated (Table S4 and Table S5). Two NILs with a B73genetic background and introgressions from CML277(90-Mb segment) or CML333 (125-Mb segment) at thisQTL region were selected to independently validate andresolve the initial joint-linkage mapping results. Relative toB73, the introgressions increased PHT by �5 cm in bothNILs (P , 5e-4). After backcrossing NILs to B73, selfing
Figure 2 Partitioning variation in PHT, EHT, DTA, andNPH. PHT, EHT, DTA, and NPH variation was attributedto genetic and environmental factors across the NAMfamilies (A) and within the NCRPIS diversity panel (B).
The Genetic Architecture of Maize Height 1345

the resultant progeny, identifying recombinant haplotypes,and testing homozygous recombinant progeny lines, effectswere resolved to a region of �10 Mb on chromosome 9 inboth NIL families (CML277: 102,469,299–109,910,100,CML333: 99,948,772–109,910,100, RefGenV1). Effect esti-mates in this interval were maintained at 7 cm (P , 5e-4)for the CML277 allele and �4 cm (P, 5e-4) for the CML333allele (Figure 5, Table S7). The intervals contained .100genes, including several transcription factors, but no obviousPHT candidate genes with involvement in auxin, brassinoste-roid, or gibberellin synthesis, transport, or signaling path-ways were identified.
GWAS of maize height and related traits
To resolve additional associations, we performed a joint-linkage-assisted genome-wide association study (GWAS)across RILs of the NAM and IBM families (Table 3, TableS6, Figure S3). In total, 277 associations with RMIP .0.05were found for PHT. Effect sizes of the mid 95% of theseassociations spanned 22.4 to 1.9 cm. Many of these associa-tions cosegregated with allele effects of their nearest family-nested QTL, yet several affected height in a direction opposingthe allele effect of nearbyQTL.Many associations not linked toQTL were also found. At the interval on chromosome 9 map-ped in the NIL families, seven associations with RMIPs .0.05were found. Three were polymorphic between B73 andCML277 or CML333 (Chr 9: 97,520,280; 100,367,415; and100,371,640; RefGenV1). All increased PHT relative to theB73 allele, but none were within 100 kb of genes known toinfluence PHT (Figure 5, Table S7).
Nonetheless, a few significant GWAS variants in othergenomic regions were near genes known to influence PHT(Table 3). The most notable colocalized with the family-nested QTL in the brd1 locus. These associations consistedof two C/T transitions (Chr 1: 248,503,977 and Chr 1:248,505,581 bp; RefGenV1). The variants possessed effectson PHT of 21.39 cm and 21.24 cm relative to the B73
allele, RMIPs of 0.42 and 0.12, and segregated in at least 4and 9 of the 26 families, respectively. Other significant var-iants near genes of interest included a C/T transition (Chr 1:74,769,251 bp; RefGenV1) with a RMIP of 0.63. This associa-tion was 17 kb from a homolog (GRMZM2G068701) of the-Arabidopsis thaliana gene encoding AUXIN UPREGULATED3(AT4G37390) (Staswick et al. 2005). Another association(Chr 2: 1,907,158 bp; RefGenV1) with a RMIP of 0.98 was35 kb from a homolog (GRMZM2G068202) of a rice gene(Os05g35690) encoding a Gibberellin-regulated GASTprotein. Finally, an association on Chr 3 (10,179,485 bp;RefGenV1) had a RMIP of 0.22. Although no QTL werenearby, the A/G transversion was 50 kb from dwarfplant1 (d1) (Emerson 1922) (Chr 3: 10,229,006–10,228,832;RefGenV1).
We also conducted GWAS in the NCRPIS panel, identi-fying 213 PHT associations with a FDR of ,5% (Table 4,Table S8), of which 174 had minor allele frequencies(MAFs) .5%. The mid 95% of effect sizes fell between24.6 and 4.7 cm. No association explained over 1% of PHTvariation. PHT associations identified separately in the RILsand the NCRPIS panel had limited overlap. But, a few PHT-associated variants of the NCRPIS panel did colocalize withcandidate genes (Table 4, Table S8). A GWAS variant (Chr 3:158,897,644 bp; RefGenV2) with a q-value of 0.01 was foundin the semi-dwarf2 (sdw2) locus (Neuffer 1990, 1992) (Chr 3:158,841,148–161,311,068; RefGenV2 and IBM2 2008 Neigh-bors map). This C/T transition had a MAF of 0.36 andexplained 0.65% of PHT variation in the panel. Its effect onPHT was +2.9 cm and it was found in a calmodulin-bindingtranscription activator (GRMZM2G171600). Also, two PHT-associated variants (Chr 5: 175,615,577 bp and Chr 5:175,615,580 bp; RefGenV2) with q-values of 0.01 were incomplete LD 30 kb from a putative gibberellin receptor GID1L2(GRMZM2G049675). These C/T transitions had a MAF of0.13, an effect of +4.9 cm, and explained 0.65% of PHTvariation.
Figure 3 Correlations of estimated PHT, EHT, DTA, and NPH line values. Pairwise trait correlations across all NAM families (A) and within the IBM family(B). Trait correlations within each of the NAM families were similar (Figure S2). The NCRPIS diversity panel differed, displaying higher correlationsbetween PHT and DTA than PHT and EHT (C).
1346 J. A. Peiffer et al.

Prediction of maize height and related traits
Prediction of RIL values by GBLUP and bootstrap aggregat-ing (bagging) family-nested QTL models was significant inmost traits and populations (Figure 6, Figure S6). Across RILfamilies, GBLUP based upon randomly chosen calibrationsubsets of 940 RILs (20% of line values, Figure S7)explained 63 6 3% of PHT variation in the remaining RILs.This was greater than the 23 6 10% of variation explainedby bagging family-nested QTL models with equally sizedcalibration subsets (Figure 6A). As calibration subsetsincreased to 3760 RILs (80% of line values), differences inprediction accuracy remained and bagging family-nestedQTL models still did not perform as well as GBLUP(Figure 6A).
Within RIL families, prediction accuracies by GBLUP andbagging QTL models were more similar to each other thanacross families. Using 38 RILs (20% of IBM family, FigureS7), 11 6 10% of PHT variation in the remaining RILs was
explained by GBLUP (Figure 6C). As calibration subsets in-creased to 152 RILs (80% of IBM family), GBLUP explained236 10% of PHT variation. Similar accuracies were attainedbagging QTL models (Figure 6C). In addition to the IBMfamily, within-family PHT prediction accuracy was evaluatedfor each NAM family (Figure S8). In most families, resultsmirrored the IBM family and prediction accuracies of GBLUPand bagging QTL models rarely significantly differed. Ininstances where differences between the methods wereobserved, GBLUP always outperformed bagging of the QTLmodels.
Between RIL families, PHT prediction accuracies bybagging QTL models were low (,5% PHT variation pre-dicted) for pairwise comparison of RIL families (one familywas used to estimate allele effects that were then fit to gen-otypes of an alternate family to predict its height). However,significant PHT prediction accuracies were attained betweenRIL families by GBLUP. These ranged from explaining no
Table 2 Top height-associated family-nested QTL across RIL families
Combined RMIP
Chr Mb cM PHT EHT DTA NPH Nearby annotations of interest
1 10 20 54 64 0 01 29 47 36 0 0 01 66 75 47 25 17 01 83 82 45 64 95 511 184 99 54 0 0 591 204 117 43 44 40 01 249 148 71 66 0 0 brassinosteroid-deficient dwarf1 (Pettem 1956)2 1 0 46 32 0 02 3 7 40 15 0 02 90 76 44 11 76 313 5 21 12 0 0 0 crinkly leaves1 (Beavis W et al. 1991)3 10 34 34 23 0 03 24 52 64 54 33 673 160 73 67 26 78 784 148 62 44 53 0 04 235 115 52 43 12 05 89 70 27 51 40 05 201 109 69 91 0 116 92 19 21 20 0 06 96 22 77 51 12 06 141 55 27 28 0 126 147 58 21 0 0 07 33 48 56 16 0 677 135 73 52 61 37 177 143 81 22 0 0 07 152 89 27 0 0 07 155 95 58 23 0 08 22 49 24 19 0 08 121 64 69 91 98 979 99 50 83 96 0 159 111 55 34 19 47 409 133 69 64 17 0 0
10 5 15 19 11 15 7 crinkly leaves4 (Stinard and Robertson 1987)10 140 69 26 0 0 5010 147 91 36 13 0 0
The combined resample model inclusion probability (RMIP) details the number of models one or more markers located within 3 cM of the stated association was selected outof the 100 models constructed for each trait (PHT, EHT, DTA, NPH). Each of the 100 models was calibrated from a family-stratified sampling of RILs during bootstrapped joint-linkage mapping. Mb denotes megabase positions in maize RefGenV1. cM denotes centimorgan positions of the composite NAM family genetic map.
The Genetic Architecture of Maize Height 1347
variation in an alternate family to explaining 38% of itsPHT variation (Figure 7). As expected, closely relatedfamilies, such as those sharing both B73 and a sweet cornparent (B73 3 IL14H and B73 3 P39), had higher be-tween-family PHT prediction accuracies than distantlyrelated families sharing only B73. Correlation of between-family prediction accuracies and the relatedness of theirfamilies was formally tested by a modified Mantel test (r =0.57, P , 0.01).
Within the NCRPIS diversity panel, GBLUP did notperform as well as across the RIL families (Figure 6E). Using459 inbreds (20% of the NCRPIS diversity panel, Figure S7),37 6 2% of PHT variation in the remaining inbreds wasexplained by GBLUP. Prediction accuracy did not greatlyimprove as calibration subset size increased. A GBLUP cali-brated with 1834 inbreds (80% of the NCRPIS panel)explained 42 6 5% of the PHT variation in the remaininginbreds.
Discussion
Despite the importance of plant height in experimentalgenetics and breeding (Mendel 1866), the molecular me-chanics of natural PHT variation remain largely elusive. Likehuman height (Galton 1886; Visscher 2008; Yang et al.2010), PHT is a highly heritable polygenic trait in naturalpopulations. Variation in PHT is well explained by Fisher’sinfinitesimal model of genetic architecture where infinitely
many unlinked genes each contribute an infinitesimallysmall additive effect (Fisher 1919; Hill 2010). While deca-des of research in plant biochemistry and molecular biologyreveal this is not a plausible model of genetic causality (e.g.,interactions in hormonal pathways have proven importance)(Wang and Li 2008), decades of breeding show the infini-tesimal model has utility in predicting response to selectionin complex traits like PHT (Crossa et al. 2010). Of course,these findings are not mutually exclusive. A model’s predic-tive ability does not imply its capture of causality. This isparticularly true in high-dimensional observational studiesof natural variation with limited control of confounded (pop-ulation structure and LD) and hidden (unmeasured epigeneticsand microenvironments) variables. Yet, some models areuseful, especially those with genetic variables estimated torobustly contribute more than expected by their infinitesimalcounterpart. They allow us to begin to dissect a population’strue genetic architecture and may enhance prediction of itsevolutionary change.
Contrasting mapping panels and methods
Genetic variation in PHT and related traits in the NAM andIBM families was partitioned into family-nested QTL bybootstrapped joint-linkage mapping (Table 2, Table S4, Fig-ure S4). The size, common alleles, and well-defined struc-ture of the families provided power to identify family-nestedtrait associations at a cost of the mapping resolution attainedwhen not nesting associations (Yu et al. 2008). Joint-linkagemapping assumes colocalization of QTL for a trait across fam-ilies but allows differing allele effect magnitude and directionwithin each family. If the genetic architecture of each familygreatly differs, this assumption may bias family-nested QTLmodels to overestimate the degree of colocalization amongeffects within families. However, linkage mapping of PHTQTL conducted independently in each family yielded similarresults for most family-nested PHT QTL identified by joint-linkage mapping (Table S5).
Alternatively, joint-linkage mapping may be statisticallyinefficient if QTL colocalize and have the same effect acrossfamilies. A model fitting this architecture was assessed byGWAS across the NAM and IBM families. Comparing theresults of joint-linkage mapping and GWAS revealed thestrongest GWAS associations were often near the mostrobust family-nested QTL, but most were distributed acrossthe genome and many GWAS associations near family-nested QTL did not cosegregate or maintain directionalityof effects consistent with their nearest QTL. This may be dueto differing power and resolution when mapping family-nested PHT QTL compared to GWAS. If a QTL is thecumulative effect of linked variants in repulsion phasewithin a family they may not be apparent in joint-linkagemapping. In GWAS ancestral recombination of parentalhaplotypes may prove sufficient to reveal the individualcontributions of these variants across families. Conversely, ifa family-nested QTL results from a single variant but itseffect is epistatic and depends upon a family’s background
Figure 4 Correlations of estimated PHT, EHT, DTA, and NPH family-nested QTL effects. Allele effects for family-nested QTL from 100 modelswere estimated for PHT, EHT, DTA, and NPH. Correlations among esti-mated allele effects for each trait were then calculated. Family-nested QTLfor EHT, DTA, and NPH were also estimated for all traits (Figure S4).
1348 J. A. Peiffer et al.

allele frequencies, it may be identified in joint-linkage map-ping, but may not associate in GWAS. These allele modelscenarios and an intermediate scenario created by clusteringmultiple parental alleles by windows of locally inferred an-cestral similarity have been compared in a recent study(Bardol et al. 2013). The study found models leveraginglinkage and linkage disequilibrium information, like thejoint-linkage-assisted GWAS performed herein, found moreQTL than linkage mapping alone, but no single allelemodel performed best for all datasets and traits. This lendsto the conclusion that it remains important to test manydifferent allele model scenarios to benefit from their com-plementarities while mapping (Kump et al. 2011; Bardolet al. 2013).
Factors contributing to differences in associations foundby the different allele model scenarios of joint-linkagemapping and GWAS across the RIL families are also likelyresponsible for differences in associations found by GWASacross the RIL families and the NCRPIS diversity panel.Furthermore, alternate methods used to account for pop-ulation structure during GWAS in the NCRPIS panel andacross the RIL families (see Materials and Methods) may alsocontribute to lack of widespread commonality among asso-ciations. Despite this limited congruency, effects of twoalleles at the PHT QTL explaining the most PHT variationwhen mapped across RIL families were maintained afterbeing isolated from other segregating loci and validated inNILs. This suggests the most robust allele associations maybe less dependent upon background alleles and may retain
their utility in molecular marker-assisted selection duringplant breeding.
Polygenicity of maize height and frequencies ofassociated alleles
The normality and high heritability of PHT variation in allpopulations surveyed suggested a high degree of polygenic-ity. Joint-linkage mapping confirmed this hypothesis andshowed models of family main effects and QTL effects nestedin families explained less variation in PHT and EHT than inDTA and NPH, suggesting that PHT and EHT are morepolygenic than DTA and NPH. The large number and smalleffects of associations found during GWAS of RIL families andthe NCRPIS panel also supported a high degree of poly-genicity for PHT (Table S8), but the additivity and mannerthat this variation is distributed among large and small effectsremains a point of contention.
The Fisher–Orr model postulates that independent poly-genic traits with equally scaled influence on fitness will havean exponential distribution of genetic effect sizes (Fisher1930; Orr 2005; Brown et al. 2011), meaning a few alleleswill have large effect but most will be small. It also positsthat genetic effects fixed by selection will, at first, be largeand then be reduced in a geometric sequence as a populationnears optimal fitness. In this dynamic, newer rare alleles willbear larger effects that have yet to be purged; while oldercommon alleles will bear smaller effects. This trend wasfound in the NCRPIS panel where rare alleles had largereffects on PHT than common alleles (Figure S9). The trend
Figure 5 NIL families support of CML277 and CML333 alleles at a RIL family-nested QTL. Two families of recombinant lines with introgressions ofCML277 (A) and CML333 (B) on chromosome 9 in a B73 background were queried for association with PHT to validate a NAM family-nested QTL(RefGenV1 Chr 9: 98,502,843) with significant allele effects when mapped independently in B73 3 CML277 and B73 3 CML333 RIL families. WithinNIL families, t-tests for PHT associations using genotyping by sequencing (GBS) marker variants and Kaspar assays across a region of 10 Mb supportedallele effect estimates. The smaller effect of the CML333 allele relative to CML277 also concurred within the families. Three associations (RefGenV1 Chr9: 97,520,280; 100,367,415; and 100,371,640) identified to increase PHT relative to B73 by GWAS and segregating between B73 and CML277 orCML333 were also in the region.
The Genetic Architecture of Maize Height 1349

has also been found in previous maize flowering time stud-ies (Bouchet et al. 2013).
However, it is important to note that assumptions of theFisher–Orr model are violated in the NCRPIS panel. Themost pervasive is a lack of independence of traits as wellas loci. This covariance leaves potential for antagonisticpleiotropic effects among traits and repulsion phase linkagesamong loci. These may preserve higher frequencies of largeeffects. Population structure also complicates the modelwhen subpopulations are jointly analyzed. Each subpopula-tion may evolve by a different evolutionary path lendingselection to act upon unique genetic effects in each sub-population due to epistasis, environment, and genetic-by-environment interactions creating shifting local fitnessoptima. Biological relevance of effect size and rare allelesare also confounded to an unknown extent by statisticalartifact. Only rare alleles with large effects will pass signif-icance thresholds. Similarly, false positive associations aremore likely among rare alleles due to increased leverageof trait outliers and biased estimates of the PHT distributionof plants bearing the rare allele. Therefore, while the fre-quency spectrum of the Fisher–Orr model is approximatedby PHT-associated variants it remains controversial if this isbiologically relevant or a statistical artifact.
Pleiotropy of maize height and related traits
Variation in PHT was more strongly positively correlatedwith DTA than even EHT (Figure 3C) in the NCRPIS panel,but not the RIL families (Figures 3, A and B, Figure S2). Inthe NCRPIS panel, correlation between PHT and DTA mayresult from inclusion of late-flowering tall tropical lines. In
contrast, recent recombination within the RIL families mayhave broken linkages of PHT and DTA loci in RIL families asevidenced by reduced correlation between PHT and DTAacross RILs relative to their parents. This suggests thatPHT and DTA may be controlled by distinct loci in LD inthe NCRPIS panel and RIL parents and that recombinationduring RIL development exposed the independence andmodularity of their genetic architectures within RIL families.To more directly assess the importance of pleiotropy amongloci for PHT and other traits in the RIL families, correlationsamong common QTL effect estimates were calculated. Whilelinkage still influences these estimates, correlations of QTLeffects on traits displayed similar trends to those on linevalues (Figure 3A, Figure 4, Figure S2, Figure S4). Correla-tions between QTL effects for PHT and EHT were strongest,whereas those for PHT and DTA were weakest. These find-ings support the modularity of PHT and DTA genetic archi-tectures and their independent evolvability.
Transgressive segregation and allelic series
Contrasts of trait values of RIL families and their parentsrevealed transgressive segregation for PHT in many families(Figure 1). Direct evidence for the basis of this transgressivesegregation was found in the positive and negative effectalleles at QTL for PHT and other traits in every family. Theseeffects suggest repulsion phase alleles were present in everyinbred parent of the NAM and IBM families for every trait atavailable mapping resolution. The NAM panel was welldesigned to reveal allelic variation (or “allelic series”) atQTL (Buckler et al. 2009) due to segregation of differentadditive alleles within families. Apparent allelic series may
Table 3 Top height-associated QTN by joint-linkage-assisted GWAS across RIL families
Chr Position RMIP P-value Nearby annotations of interest
1 74,769,251 63 3.10E-22 Homolog of AUXIN UPREGULATED 3 in A. thaliana1 243,646,785 74 1.79E-111 248,504,011 42 1.81E-16 brassinosteroid-deficient dwarf1 (Pettem 1956)1 285,096,711 54 5.29E-082 1,907,158 98 7.39E-31 Homolog of Gibberellin-regulated GAST in O. sativa3 10,179,485 22 1.36E-11 dwarf plant1 (Emerson and Emerson 1922)3 21,644,498 80 7.55E-213 158,425,337 60 4.21E-133 163,876,586 80 2.05E-234 152,011,687 53 3.38E-164 223,212,889 64 6.25E-505 200,084,856 72 2.15E-256 96,782,537 88 1.87E-116 152,327,461 82 3.86E-077 34,507,421 55 3.23E-187 115,984,409 78 7.26E-107 141,767,918 84 6.17E-158 109,065,095 97 7.96E-248 118,514,691 98 1.29E-418 119,634,216 71 2.45E-12
10 5,930,926 57 1.52E-1210 25,565,254 62 1.34E-23
“Nearby” references those annotations within 100 kb of an association. RMIP denotes the resample model inclusion probability detailing the number of models the variantwas selected out of 100 forward regression models. Physical positions of the variants across the NAM and IBM families are stated with respect to maize RefGenV1.
1350 J. A. Peiffer et al.

also arise from family-specific epistatic interactions that mapin an additive manner. Similarly, epistatic interactions maybe responsible for asymmetry in transgressive segregationnoted within several RIL families.
Associations with genes in canonical hormonalpathways of plant height
Examination of .120 loci and genes affecting PHT throughcanonical pathways (gibberellin, brassinosteroid, and auxinsignaling, transport, and synthesis) and identified by molec-ular tagging, past cloning efforts (Multani et al. 2003), ororthology to PHT associated genes in other species identifiedfew commonalities with associations found in the NAM andIBM families (Table 2, Table 3). Review of loci like dwarf8and dwarf9 regulating DELLA proteins in gibberellin signal-ing (Peng et al. 1999) and loci containing the GA20-oxidase2critical to gibberellin synthesis and responsible for heightreductions of the Green Revolution (Monna et al. 2002)did not reveal colocalizing associations. However, a GWAS
associationwas found near dwarf1 and itsGA3-b-hydroxylase2involved in gibberellin synthesis. This supports the effect ofdwarf1 on natural PHT variation in a recent mapping efforttaken in a separate maize panel (Teng et al. 2013), and itssignificance as a maize improvement gene in a recent genomescan for selection among the improved maize lines and thelandraces of maize HapMapV2 (Hufford et al. 2012). No PHTassociations were near the cytochrome P450 (Hong et al.2002) in dwarf 3, involved in gibberellin synthesis or nanaplant1 impacting brassinosteroid synthesis (Hartwig et al.2011), but a family-nested QTL and two GWAS associationswere found near a cytochrome P450 affecting brassinosteroidsynthesis in brassinosteroid-deficient dwarf1 (Makarevitchet al. 2012; Stinard 2012). As for auxin, no associations werein brachytic2 impacting polar auxin transport (Multani et al.2003); but, an associationwas near an ortholog ofArabidopsis’AUXIN UPREGULATED3 (Staswick et al. 2005). Like the RILfamilies, few PHT associations colocalized with candidategenes in the NCRPIS panel with the exception of semi-dwarf2
Table 4 Top height-associated QTN by linear mixed model GWAS in the NCRPIS panel
Chr Position P-value % var. MAF Nearby annotations of interest
1 210,523,816 2.34E-08 0.81 0.131 276,301,378 5.97E-09 0.88 0.231 279,563,896 2.12E-07 0.70 0.193 158,897,644 5.11E-07 0.65 0.36 semi-dwarf2 (Neuffer 1990, 1992)3 159,555,813 4.59E-07 0.66 0.283 161,559,292 5.42E-07 0.65 0.283 172,927,922 9.65E-07 0.62 0.343 199,486,592 5.60E-07 0.65 0.323 201,259,090 1.16E-07 0.73 0.223 201,670,688 3.08E-07 0.68 0.394 220,918,216 6.89E-07 0.64 0.265 175,615,577 8.36E-06 0.51 0.13 Putative Gibberellin receptor GID1L26 25,290,244 6.65E-07 0.64 0.097 107,232,529 4.29E-07 0.66 0.278 131,176,630 1.24E-07 0.72 0.268 131,176,643 8.24E-10 0.98 0.308 131,176,679 5.29E-07 0.65 0.408 131,527,597 1.82E-08 0.82 0.378 131,904,755 4.51E-09 0.89 0.508 131,904,775 2.65E-09 0.92 0.508 131,904,780 3.71E-09 0.90 0.508 131,904,787 3.71E-09 0.90 0.508 132,047,205 8.03E-07 0.63 0.258 132,199,932 9.25E-07 0.62 0.288 134,736,543 5.66E-07 0.65 0.15
10 14,908,520 9.55E-07 0.62 0.1410 31,014,424 7.03E-07 0.64 0.3310 31,028,430 7.67E-07 0.63 0.3310 31,028,444 7.80E-07 0.63 0.3310 31,028,490 2.54E-07 0.69 0.3610 31,028,651 1.45E-07 0.72 0.3510 31,191,977 9.03E-07 0.62 0.3710 148,879,043 5.69E-07 0.65 0.1510 148,879,067 5.71E-07 0.65 0.1610 148,879,068 5.69E-07 0.65 0.15
“Nearby” references those annotations within 100 kb of an association. Physical positions of the variants across the NCRPIS diversity panel are stated with respect to themaize RefGenV2. Percent var. refers to the difference in the coefficient of determination after including the stated variant in a linear mixed model already accounting forheight variation explained by an additive relationship matrix and fixed effect covariates constructed from its six largest eigenvectors. MAF refers to the minor allele frequencyof the association.
The Genetic Architecture of Maize Height 1351

1352 J. A. Peiffer et al.
(Neuffer 1990, 1992), a locus with established influence onPHT (Table 4, Table S8, Figure S5). Limited colocalizationmay be due to lethality of the extreme effects of establishedloci. Previously identified loci possess a much larger effect onPHT than estimated effects mapped in the RIL families orNCRPIS panel. For this reason, they may be functionally con-served in natural diversity, as large effect alleles are rapidlypurged by selection.
Prediction of maize height and related traits
Pedigree methods and estimates of identity-by-descent havelong assisted breeding programs to predict genetic meritbefore trait evaluation (Crossa et al. 2010). In doing so, theseapproaches used an infinitesimal model to interpolate apopulation’s phenotypic landscape and help breeders opti-mize allocation of evaluation resources to lines with the mostpredicted promise. Recently, prediction models inferringidentity by state from genotyped variants, like GBLUP, mod-els selecting variant subsets, like QTL models, and model-averaging approaches, like bagging (Breiman 1996), haveaccrued interest in breeding. These serve a similar purposeto pedigree-based prediction (Lorenz 2013), but leveragegenotyping advances to complement pedigrees and refinecomparisons of progeny assumed equally related in a pedi-gree model by further detailing Mendelian sampling ofalleles. To assess prediction accuracies of our genetic modelsof PHT and other traits, we evaluated GBLUP performance inthe NCRPIS panel. We also compared GBLUP and bagging offamily-nested QTL models across, within, and between RILfamilies in cross-validation routines with calibration and pre-dicted subsets of varied size and structure. These GBLUPanalyses were performed and comparisons were made toQTL models to evaluate multiple models of genetic architec-ture differing in their polygenicity and effect sizes and to de-termine if they both plausibly explain a population’s variationinmaize height among populations possessing observed and/or unobserved line values.
Within the NCRPIS panel, GBLUP revealed significantprediction accuracies for PHT, EHT, and DTA (Figure 6E),but these were lower than prediction accuracies in the NAMand IBM families. The increased diversity and reduced geno-typing density in the NCRPIS panel relative to the HapMapv1 SNPs projected onto NAM and IBM families is likely thelargest factor contributing to the reduced accuracy. The in-creased structure of the NCRPIS panel also suggests eachsubpopulation may possess a unique evolutionary historywith selection acting on alternate genetic effects in eachsubpopulation due to epistatic and genetic-by-environment
interactions. The additive GBLUP model may fail to capturesuch dependencies.
Family-nested QTL models explained substantial varia-tion in PHT in calibration subsets, but had poor predictionaccuracies. This suggests the family-nested QTL overfit thecalibration subset (local region of the phenotypic land-scape), reducing their generalizability when predicting theglobal phenotypic landscape or other localities. To reducevariance in predictions of a given line value among family-nested QTL models, bagging of the models was employed.While this reduced overfitting and slightly improved pre-diction, bagged family-nested QTL model estimates werestill largely dependent on calibration subset size and did notperform as well as GBLUP.
Within RIL families, prediction accuracies of PHT weremore similar between the two prediction methods (TableS9, Figure S8), but GBLUP outperformed bagged predictionsderived from nonnested QTL mapping on many occasions.Their increased similarity in accuracies may be due to thereduced population sizes and overall reduction in predictionaccuracies of both methods relative to across family predic-tion. Also, the increased relatedness of RILs within a familymay reduce differences in prediction accuracy between mod-els. Between RIL families, prediction was not successful bybagging QTL models and resulted in no significant predic-tion accuracies. This result was unsurprising given the allelicseries observed at loci during family-nested QTL mapping.In contrast to between-family PHT prediction by QTL, pre-diction of PHT by GBLUP between families was often suc-cessful, albeit with limited prediction accuracies rangingfrom no accuracy to explaining 38% of variation in the pre-dicted family (Figure 7).
In conclusion, the molecular mechanics of naturalPHT variation remain difficult to disentangle and it seemsunlikely that the rapid systematic elucidation of a causalmodel for the genetic architecture of this variation ispossible. Yet, our results show multiple plausible modelsexist to explain natural variation in maize plant height.These vary from the highly polygenic models bearing smallallelic effects, such as GBLUP, to joint-linkage QTL andGWAS models bearing larger effects and lower polygenicity.While the more polygenic GBLUP model provided animproved approach to predicting PHT and did not overfitthe calibration population as much as bagging family-nestedQTL models, we have also shown one of the most robust lociamong the family-nested QTL models could be empiricallyvalidated in NILs and genes implicated in canonical PHThormonal pathways like brassinosteroid-deficient dwarf1,
Figure 6 Prediction of PHT across RIL families and within the NCRPIS diversity panel. A random sample of 20, 40, 60, and 80% of RILs in all NAMfamilies calibrated GBLUP and family-nested QTL models to predict PHT variation of RILs not employed in calibration (A). All RILs were used to calibrateGBLUP and family-nested QTL models to explain their PHT variation (B). In the IBM family, random samples of RILs calibrated GBLUP and QTL models topredict PHT variation of the remaining RILs (C). All RILs in the IBM family were used to calibrate GBLUP and QTL models to explain PHT variation (D).Random samples of inbreds in the NCRPIS diversity panel calibrated GBLUP models to predict PHT variation of inbreds not employed in calibration (E). Allinbreds in the NCRPIS diversity panel were used to calibrate a GBLUP model to explain their PHT variation (F). Similar levels of prediction accuracy wereobserved in GBLUP for EHT, DTA, and NPH (Figure S6).
The Genetic Architecture of Maize Height 1353

dwarf plant1, and semi-dwarf2 colocalized with robust lociin our analyses. Two decades before Francis Galton’s studiesof human height based upon the resemblance between rel-atives (Galton 1886; Visscher et al. 2010), Mendel used PHTto establish our understanding of the laws of inheritance(Mendel 1866). Even in this postgenomic era, PHT remainsexemplary in advancing our understanding of genetic
causality and evaluating approaches to explain the variationof a highly heritable, yet highly complex polygenic trait.
Acknowledgments
For growth and management of the maize fields, we aregrateful to members of the Maize Diversity Project and their
Figure 7 Prediction of PHT within and between RIL families. The PHT explanatory ability of GBLUP within family (main diagonal) and prediction accuracyof models calibrated from one family and used to predict another were assessed (off diagonal). The nonparanthetical number of each off-diagonalelement details the prediction accuracy of that row’s family when used to predict that column’s family. The number in parentheses details the predictionaccuracy of that column’s family when used to predict that row’s family. Families are denoted by their unshared parent and ordered based uponclustering of their between-family prediction profiles across the families.
1354 J. A. Peiffer et al.

field assistants at the University of Missouri, North CarolinaState University, University of Wisconsin, and CornellUniversity. For the development of a library of NILs employedin NIL validation of QTL mapping results we are grateful toSyngenta. For assistancewith the construction of relationshipmatrices we extend thanks to Jean-Luc Jannink. We are alsothankful for the substantial genotyping efforts of CornellUniversity and Cold Spring Harbor in preparation of SNPsacross the NAM and IBM families as well as the NCRPISdiversity panel.
Literature Cited
Andorf, C. M., C. J. Lawrence, L. C. Harper, M. L. Schaeffer, D. A.Campbell et al., 2010 The Locus Lookup tool at MaizeGDB:identification of genomic regions in maize by integrating se-quence information with physical and genetic maps. Bioinfor-matics 26: 434–436.
Bardol, N., M. Ventelon, B. Mangin, S. Jasson, V. Loywick et al.,2013 Combined linkage and linkage disequilibrium QTL map-ping in multiple families of maize (Zea mays L.) line crosseshighlights complementarities between models based on paren-tal haplotype and single locus polymorphism. Theor. Appl.Genet. 126: 2717–2736.
Beavis, W., D. Grant, and M. Albertsen and R. Fincher,1991 Quantitative trait loci for plant height in four maize pop-ulations and their associations with qualitative genetic loci.Theor. Appl. Genet. 83: 141–145.
Benjamini, Y., and Y. Hochberg, 1995 Controlling the false dis-covery rate: a practical and powerful approach to multiple test-ing. J. R. Stat. Soc. B 57: 289–300.
Bouchet, S., B. Servin, P. Bertin, D. Madur, V. Combes et al.,2013 Adaptation of maize to temperate climates: mid-densitygenome-wide association genetics and diversity patterns revealkey genomic regions, with a major contribution of the Vgt2(ZCN8) locus. PLoS ONE 8: e71377.
Bradbury, P. J., Z. Zhang, D. E. Kroon, T. M. Casstevens, Y. Ramdosset al., 2007 TASSEL: software for association mapping of com-plex traits in diverse samples. Bioinformatics 23: 2633–2635.
Breiman, L., 1996 Bagging predictors. Mach. Learn. 24: 123–140.Brown, P. J., N. Upadyayula, G. S. Mahone, F. Tian, P. J. Bradbury
et al., 2011 Distinct genetic architectures for male and femaleinflorescence traits of maize. PLoS Genet. 7: e1002383.
Buckler, E. S., J. B. Holland, P. J. Bradbury, C. B. Acharya, P. J.Brown et al., 2009 The genetic architecture of maize floweringtime. Science 325: 714–718.
Chia, J.-M., C. Song, P. J. Bradbury, D. Costich, N. de Leon et al.,2012 Maize HapMap2 identifies extant variation from a ge-nome in flux. Nat. Genet. 44: 803–807.
Crossa, J., G. l. Campos, P. Pérez, D. Gianola, J. Burgueño et al.,2010 Prediction of genetic values of quantitative traits in plantbreeding using pedigree and molecular markers. Genetics 186:713–724.
D’Agostino, R. B., 1970 Transformation to normality of the nulldistribution of g1. Biometrika 57: 679–681.
Elshire, R. J., J. C. Glaubitz, Q. Sun, J. A. Poland, K. Kawamotoet al., 2011 A robust, simple genotyping-by-sequencing (GBS)approach for high diversity species. PLoS ONE 6: e19379.
Emerson, R., and S. H. Emerson, 1922 Genetic interrelations oftwo andromonoecious types of maize, dwarf and anther ear.Genetics 7: 203–236.
Endelman, J. B., 2011 Ridge regression and other kernels for ge-nomic selection with R Package rrBLUP. Plant Gen. 4: 250–255.
Fisher, R. A., 1919 XV.—The correlation between relatives on thesupposition of Mendelian inheritance. Earth and EnvironmentalScience Transactions of the Royal Society of Edinburgh 52: 399–433.
Fisher, R. A., 1930 The Genetical Theory of Natural Selection, Ox-ford University Press, Oxford.
Galton, F., 1886 Hereditary stature. Nature 33: 295–298.Gilmour, A. R., R. Thompson, and B. R. Cullis, 1995 Average in-
formation REML: an efficient algorithm for variance parameterestimation in linear mixed models. Biometrics 51: 1440–1450.
Gore, M. A., J.-M. Chia, R. J. Elshire, Q. Sun, E. S. Ersoz et al.,2009 A first-generation haplotype map of maize. Science326: 1115–1117.
Hamblin, M. T., M. L. Warburton, and E. S. Buckler, 2007 Empiricalcomparison of simple sequence repeats and single nucleotidepolymorphisms in assessment of maize diversity and relatedness.PLoS ONE 2: e1367.
Hartwig, T., G. S. Chuck, S. Fujioka, A. Klempien, R. Weizbaueret al., 2011 Brassinosteroid control of sex determination inmaize. Proc. Natl. Acad. Sci. USA 108: 19814–19819.
Hill, W. G., 2010 Understanding and using quantitative geneticvariation. Philos. Trans. R. Soc. Lond. B Biol. Sci. 365: 73–85.
Hill, W. G., and A. Robertson, 1966 The effect of linkage on limitsto artificial selection. Genet. Res. 8: 269–294.
Holland, J. B., W. E. Nyquist, and C. T. Cervantes-Martinez,2003 Estimating and interpreting heritability for plant breed-ing: an update. Plant Breed. Rev. 22: 9–111.
Hong, Z., M. Ueguchi-Tanaka, S. Shimizu-Sato, Y. Inukai, S. Fujiokaet al., 2002 Loss-of-function of a rice brassinosteroid biosyn-thetic enzyme, C-6 oxidase, prevents the organized arrangementand polar elongation of cells in the leaves and stem. Plant J. 32:495–508.
Hufford, M. B., X. Xu, J. van Heerwaarden, T. Pyhajarvi, J.-M. Chiaet al., 2012 Comparative population genomics of maize do-mestication and improvement. Nat. Genet. 44: 808–811.
Hung, H. Y., C. Browne, K. Guill, N. Coles, M. Eller et al.,2012 The relationship between parental genetic or phenotypicdivergence and progeny variation in the maize nested associa-tion mapping population. Heredity 108: 490–499.
Khush, G. S., 2001 Green revolution: the way forward. Nat. Rev.Genet. 2: 815.
Kump, K. L., P. J. Bradbury, R. J. Wisser, E. S. Buckler, A. R. Belcheret al., 2011 Genome-wide association study of quantitative re-sistance to southern leaf blight in the maize nested associationmapping population. Nat. Genet. 43: 163–168.
Lawit, S. J., H. M. Wych, D. Xu, S. Kundu, and D. T. Tomes,2010 Maize DELLA proteins dwarf plant8 and dwarf plant9as modulators of plant development. Plant Cell Physiol. 51:1854–1868.
Lee, M., N. Sharopova, W. D. Beavis, D. Grant, M. Katt et al.,2002 Expanding the genetic map of maize with the intermatedB73 3 Mo17 (IBM) population. Plant Mol. Biol. 48: 453–461.
Lin, Y. R., K. F. Schertz, and A. H. Paterson, 1995 Comparativeanalysis of QTLs affecting plant height and maturity across thePoaceae, in reference to an interspecific sorghum population.Genetics 141: 391–411.
Lipka, A. E., F. Tian, Q. Wang, J. Peiffer, M. Li et al., 2012 GAPIT:genome association and prediction integrated tool. Bioinfor-matics 28: 2397–2399.
Lorenz, A. J., 2013 Resource allocation for maximizing predictionaccuracy and genetic gain of genomic selection in plant breed-ing: a simulation experiment. G3 3: 481–491.
Makarevitch, I., A. Thompson, G. J. Muehlbauer, and N. M. Springer,2012 Brd1 gene in maize encodes a brassinosteroid C-6 oxidase.PLoS ONE 7: e30798.
Mantel, N., 1967 The detection of disease clustering and a gener-alized regression approach. Cancer Res. 27: 209–220.
The Genetic Architecture of Maize Height 1355

Masel, J., 2005 Evolutionary capacitance may be favored by nat-ural selection. Genetics 170: 1359–1371.
McMullen, M. D., S. Kresovich, H. S. Villeda, P. Bradbury, H. Liet al., 2009 Genetic properties of the maize nested associationmapping population. Science 325: 737–740.
Mendel, G., 1866 Versuche über Pflanzen-hybridenn. Verh.Natforsch. Ver. Brünn. English translation from web sitehttp://www.esp.org/foundations/genetics/classical/gm-65.pdf.4: 3–47.
Messina, C. D., D. Podlich, Z. Dong, M. Samples, and M. Cooper,2011 Yield–trait performance landscapes: from theory to ap-plication in breeding maize for drought tolerance. J. Exp. Bot.62: 855–868.
Monna, L., N. Kitazawa, R. Yoshino, J. Suzuki, H. Masuda et al.,2002 Positional cloning of rice semidwarfing Gene, sd-1: rice“green revolution gene” encodes a mutant enzyme involved ingibberellin synthesis. DNA Res. 9: 11–17.
Muller, H. J., 1932 Some genetic aspects of sex. Am. Nat. 66:118–138.
Multani, D. S., S. P. Briggs, M. A. Chamberlin, J. J. Blakeslee, A. S.Murphy et al., 2003 Loss of anMDR transporter in compact stalksof maize br2 and sorghum dw3 mutants. Science 302: 81–84.
Neuffer, M. G., 1990 Location and description of dominant dwarfmutants. Maize Genet. Coop. News Lett. 64: 51.
Neuffer, M. G., 1992 Location and designation of 8 dominantmutants from chemical mutagenesis and spontaneous origin.Maize Genet. Coop. News Lett. 66: 39–40.
Orr, H. A., 2005 The genetic theory of adaptation: a brief history.Nat. Rev. Genet. 6: 119–127.
Peng, J., D. E. Richards, N. M. Hartley, G. P. Murphy, K. M. Devoset al., 1999 Green revolution genes encode mutant gibberellinresponse modulators. Nature 400: 256–261.
Pettem, F., 1956 Dwarfs. Maize Genet. Coop. News Lett. 30: 9–10.
Piperno, D. R., A. J. Ranere, I. Holst, J. Iriarte, and R. Dickau,2009 Starch grain and phytolith evidence for early ninth mil-lennium B.P. maize from the Central Balsas River Valley, Mex-ico. Proc. Natl. Acad. Sci. USA 106: 5019–5024.
R Development Core Team, 2011 R: A Language and Environmentfor Statistical Computing, R Foundation for Statistical Comput-ing, Vienna.
Remington, D. L., J. M. Thornsberry, Y. Matsuoka, L. M. Wilson,S. R. Whitt et al., 2001 Structure of linkage disequilibrium andphenotypic associations in the maize genome. Proc. Natl. Acad.Sci. USA 98: 11479–11484.
Rice, S. H., 2004 Evolutionary Theory: Mathematical And Concep-tual Foundations, Sinauer Associates, Sunderland, MA.
Romay, M., M. Millard, J. Glaubitz, J. Peiffer, K. Swarts et al.,2013 Comprehensive genotyping of the USA national maizeinbred seed bank. Genome Biol. 14: R55.
Salas Fernandez, M. G., P. W. Becraft, Y. Yin, and T. Lübberstedt,2009 From dwarves to giants? Plant height manipulation forbiomass yield. Trends Plant Sci. 14: 454–461.
SAS, 2004–2008 SAS 9.2.1, SAS Institute, Cary, NC. www.SAS.comStaswick, P. E., B. Serban, M. Rowe, I. Tiryaki, M. T. Maldonado
et al., 2005 Characterization of an Arabidopsis enzyme familythat conjugates amino acids to Indole-3-acetic acid. The PlantCell Online 17: 616–627.
Stinard, P., 2012 Tiny plant mutant ty*-8446 is allelic to brd1.Maize Genet. Coop. News Lett. 86: 1.
Stinard, P., and D. Robertson, 1987 Dappled: a putative Mu-induced aleurone developmental mutant. Maize Genet. Coop.News Lett. 61: 7–9.
Teng, F., L. Zhai, R. Liu, W. Bai, L. Wang et al., 2013 ZmGA3ox2,a candidate gene for a major QTL, qPH3.1, for plant height inmaize. Plant J. 73: 405–416.
Tian, F., P. J. Bradbury, P. J. Brown, H. Hung, Q. Sun et al.,2011 Genome-wide association study of leaf architecture inthe maize nested association mapping population. Nat. Genet.43: 159–162.
Valdar, W., C. C. Holmes, R. Mott, and J. Flint, 2009 Mapping instructured populations by resample model averaging. Genetics182: 1263–1277.
VanRaden, P. M., 2008 Efficient methods to compute genomicpredictions. J. Dairy Sci. 91: 4414–4423.
Visscher, P. M., 2008 Sizing up human height variation. Nat.Genet. 40: 489–490.
Visscher, P. M., B. McEvoy, and J. Yang, 2010 From Galton toGWAS: quantitative genetics of human height. Genet. Res. 92:371–379.
Wallace, J. G., S. J. Larsson, and E. S. Buckler, 2014 Entering thesecond century of maize quantitative genetics. Heredity 112:30–38.
Wang, Y., and J. Li, 2008 Molecular basis of plant architecture.Annu. Rev. Plant Biol. 59: 253–279.
Winkler, R. G., and T. Helentjaris, 1995 The maize Dwarf3 geneencodes a cytochrome P450-mediated early step in Gibberellinbiosynthesis. Plant Cell 7: 1307–1317.
Yang, J., B. Benyamin, B. P. McEvoy, S. Gordon, A. K. Henders et al.,2010 Common SNPs explain a large proportion of the herita-bility for human height. Nat. Genet. 42: 565–569.
Yu, J., G. Pressoir, W. H. Briggs, I. Vroh Bi, M. Yamasaki et al.,2006 A unified mixed-model method for association mappingthat accounts for multiple levels of relatedness. Nat. Genet. 38:203–208.
Yu, J., J. B. Holland, M. D. McMullen, and E. S. Buckler,2008 Genetic design and statistical power of nested associa-tion mapping in maize. Genetics 178: 539–551.
Communicating editor: A. Charcosset
1356 J. A. Peiffer et al.

GENETICSSupporting Information
http://www.genetics.org/lookup/suppl/doi:10.1534/genetics.113.159152/-/DC1
The Genetic Architecture Of Maize HeightJason A. Peiffer, Maria C. Romay, Michael A. Gore, Sherry A. Flint-Garcia, Zhiwu Zhang,
Mark J. Millard, Candice A. C. Gardner, Michael D. McMullen, James B. Holland,Peter J. Bradbury, and Edward S. Buckler
Copyright © 2014 by the Genetics Society of AmericaDOI: 10.1534/genetics.113.159152

2 SI J. A. Peiffer et al.
All figures and tables are available for download at http://www.genetics.org/lookup/suppl/doi:10.1534/genetics.113.159152/-/DC1
Figure S1 EHT, DTA, and NPH variation in each RIL family and the NCRPIS panel.
Figure S2 Trait correlations among PHT, EHT, DTA, and NPH in each RIL family.
Figure S3 Family-nested QTL and joint-linkage-assisted GWAS across RIL families.
Figure S4 QTL effect correlations among PHT, EHT, DTA, and NPH in each RIL family.
Figure S5 PHT linear mixed model GWAS across the NCRPIS panel.
Figure S6 Prediction of EHT, DTA, and NPH across RIL families and NCRPIS panel.
Figure S7 Sampling for cross-validation of prediction in RIL families and NCRPIS panel.
Figure S8 Prediction of PHT in each RIL family.
Figure S9 PHT and EHT effect sizes by minor allele frequency across the NCRPIS panel.
Table S1 PHT, EHT, DTA, and NPH line values across RIL families and tests of skewness about mid-parent values within RIL families. Table S2 PHT, EHT, DTA, and NPH line values across the NCRPIS panel.
Table S3 PHT line values across the NIL families.
Table S4 PHT, EHT, DTA, and NPH family-nested QTL across RIL families.
Table S5 PHT QTL in each RIL family.
Table S6 PHT joint-linkage-assisted GWAS results across RIL families.
Table S7 PHT mapping results in each NIL family.
Table S8 PHT linear mixed model GWAS results across the NCRPIS panel.
Table S9 Prediction of PHT across and within RIL families and the NCRPIS panel.