the genetic basis of mutation rate variation in yeast
TRANSCRIPT

| INVESTIGATION
The Genetic Basis of Mutation Rate Variation in YeastLiangke Gou,* Joshua S. Bloom,*,† and Leonid Kruglyak*,†,‡,1
*Department of Human Genetics, †Howard Hughes Medical Institute, and ‡Department of Biological Chemistry, University ofCalifornia, Los Angeles, California 90095
ORCID IDs: 0000-0002-5767-9603 (L.G.); 0000-0002-7241-1648 (J.S.B.); 0000-0002-8065-3057 (L.K.)
ABSTRACT Mutations are the root source of genetic variation and underlie the process of evolution. Although the rates at whichmutations occur vary considerably between species, little is known about differences within species, or the genetic and molecular basisof these differences. Here, we leveraged the power of the yeast Saccharomyces cerevisiae as a model system to uncover natural geneticvariants that underlie variation in mutation rate. We developed a high-throughput fluctuation assay and used it to quantify mutationrates in seven natural yeast isolates and in 1040 segregant progeny from a cross between BY, a laboratory strain, and RM, a winestrain. We observed that mutation rate varies among yeast strains and is heritable (H2 = 0.49). We performed linkage mapping in thesegregants and identified four quantitative trait loci underlying mutation rate variation in the cross. We fine-mapped two quantitativetrait loci to the underlying causal genes, RAD5 and MKT1, that contribute to mutation rate variation. These genes also underliesensitivity to the DNA-damaging agents 4NQO and MMS, suggesting a connection between spontaneous mutation rate and mutagensensitivity.
KEYWORDS Spontaneous mutation rate; QTL mapping; genetic basis; natural variants; yeast; complex traits
MUTATIONSare permanent changes to the genome of anorganism that can result from DNA damage that is
improperly repaired, from errors in DNA replication (Lieber2010), or from the movement of mobile genetic elements.Mutations give rise to genetic variants in populations andare the wellspring of evolution (Long et al. 2003). Mutationsalso play a major role in both inherited diseases and acquireddiseases such as cancer (Tomlinson et al. 1996).
The mutation rate can be defined as the number of muta-tional events per cell division, generation, orunit of time (Baeret al. 2007). Mutation rates tend to be �1029 – 10210 muta-tions per base pair, per cell division, for most microbial spe-cies (Drake et al. 1998), making them difficult to measureand compare across individuals. As a consequence, the effectsof genetic background differences on mutation rates haveonly been investigated on a small scale (Demerec 1937).Two types of experimental approaches have been used to
measure mutation rates in yeast. The first is the fluctuationassay (Luria and Delbrück 1943). This method requires agene with a selectable phenotype such that loss-of-functionmutations in the gene enable the mutants to grow in thecorresponding selective conditions. Spontaneous mutationrate is then estimated from the distribution of mutant num-bers in parallel cultures. Lang and Murray applied the fluctu-ation assay to Saccharomyces cerevisiae and estimated theper-base-pair mutation rate in yeast (Lang and Murray2008). A second method tracks mutation accumulation dur-ing experimental evolution and uses whole-genome se-quencing to estimate mutation rates (Zhu et al. 2014).This approach also provides information on the number,locations, and types of spontaneous mutations. However,this assay requires growing the mutation accumulation linesover hundreds of generations, as well as sequencing manygenomes. Although the fluctuation assay is faster andcheaper, the need for many parallel cultures makes it labo-rious to extend it to many different strains.
Here, we developed a modified version of the fluctuationassay to enable higher-throughput measurements of sponta-neous mutation rates. We used the new assay to quantifymutation rates across genetically distinct yeast strains andobserved considerable variation. Tofind the genes underlyingthe observed variation, we applied the modified fluctuation
Copyright © 2019 by the Genetics Society of Americadoi: https://doi.org/10.1534/genetics.118.301609Manuscript received September 12, 2018; accepted for publication November 26,2018; published Early Online November 30, 2018.Available freely online through the author-supported open access optionSupplemental material available at Figshare: https://doi.org/10.6084/m9.figshare.7343036.1Corresponding author: Gonda Research Center, 695 Charles E. Young Dr. S., LosAngeles, CA 90095. E-mail: [email protected]
Genetics, Vol. 211, 731–740 February 2019 731

assay to a large panel of 1040 segregants froma cross betweenthe laboratory strain BY4724 (hereafter referred to as BY) andthevineyardstrainRM11-1a(hereafter referred toasRM).Weidentified four loci associatedwithmutation ratevariationandnarrowed the two loci that contributed the most to mutationrate variation to missense variants in the genes RAD5 andMKT1. We also found interactions between alleles of RAD5and MKT1.
Materials and Methods
Yeast strains and media
Seven natural S. cerevisiae strains (Supplemental Material,Table S1) were used in this study. The 1040 segregants de-rived from BY4724 (MATa) and RM11-1a (MATa, MKT1-BY,hoD::HphMX, flo8D::NatMX) were generated, genotyped,and described previously (Bloom et al. 2013). The RM::MKT1-BY strain was made previously by our lab. The BY::RAD5-RM strain and the RAD5 variants substitution strains(Table 1) were from Demogines et al. (2008). For fluctuationassay, yeast was grown in synthetic complete liquid mediumwithout arginine (SC-Arg) before plating onto selective plates.For DNA-damaging agent sensitivity assays, yeast were grownin rich YPD medium (1% yeast extract, 2% peptone, and 2%glucose) before plating onto YPD agar plates with DNA-damaging agents. SC-Arg and YPD liquid media and agarplates were made according to Amberg et al. (2005).
Selection agar plate construction
Selective canavanine plates were made from arginine mi-nus synthetic complete agar medium with 60 mg/literL-canavanine (C1625; Sigma, St. Louis,MO). The canavanineplates were dried by incubating at 30� overnight. Selectiveplates for the DNA-damaging agent sensitivity assay weremade with YPD agar medium containing the respectiveagents at the concentrations indicated in Table 2. Then,50 ml of the agar medium was poured into each Nunc Omni-Tray plates (264728; Thermo Scientific) and placed on a flatsurface to solidify. Each experiment was performed with thesame batch of selection plates. The concentrations for4-nitroquinoline 1-oxide (4NQO) (N8141; Sigma), methylmethane sulfonate (MMS) (64382; Sigma), and hydrogenperoxide (H2O2) (216763; Sigma) were 0.1 mg/ml, 0.01%and 4 mM. These concentrations capture the sensitivity dif-ference between the segregants, while maintaining enoughcolony growth for quantitative trait locus (QTL) mapping.
Fluctuation assays
To begin the fluctuation assay, yeast were grown in SC-Arg in96-well plates (3370; Costar, Cambridge, MA) for �48 hr tosaturation. Saturated cultures were diluted and pinned into anew 96-well plate with liquid SC-Arg medium. This step en-sured a small number of �1000 yeast cells in the initialinoculum. Plates were sealed with a Breathe-Easy sealingmembrane (Z380059; Sigma) to prevent evaporation, and
incubated at 30� with shaking for �48 hr. Then, 100 ml sat-urated cultures were spot-plated onto canavanine plates in afour by six configuration using a Biomek FXP automatedworkstation. Plates with spot-plated yeast culture were driedin the laminar flow hood (Nuair) for 30 mins or until dry, andincubated at 30� for �48 hr. We imaged the plates using animaging robot (BM3-SC; S&P Robotics), and the number ofcolonies in each spot was manually counted from the images.An example of the imaged plate is shown in Figure S1.
Mutation rate was estimated using the Ma–Sandri–Sarkarmaximum likelihood method, where the numbers of observedcolonies on canavanine plates was fitted into the Luria–Delbrück distribution and a single parametermwas calculated(Sarkar et al. 1992). The parameterm represents the expectednumber ofmutation events per culture. For the natural isolatesand engineered strains, the mutation rate was calculated fromthe equationm ¼ m=N, whereN is the average number of cellsper culture (as a proxy for the number of cell divisions, giventhe starting inoculum is much smaller than N). In the segre-gant panel, we defined a mutation rate score that was calcu-lated as the residual phenotype after regressing out the effectof average number of cells per strain (N) from the estimate ofm per strain across all of the segregants.
For each of the seven natural isolate strains, we performed96 replicates of the fluctuation assay, which means we had96 estimations of mutation rate. In each replicate threecultures were plated onto canavanine plates, and the numberof resistant colonies in these three plates were fitted into theLuria–Delbrück distribution to estimate the mutation eventsper culture (m). One culture was diluted and plated onto YPDto determine the number of cells per culture (N) in eachreplicate. Given the number of replicates used for estimatem and N were limited, the mutation rate estimation for theseven natural isolate strains had large variance. For the BY3RM segregants panel, 12 independent replicate cultures wereplated onto canavanine plates for every segregant. The num-ber of canavanine resistant colonies in these 12 plates wasfitted into the Luria–Delbrück distribution to calculate thenumber of mutations per culture (m), and one culture wasdiluted and plated on the YPD plates to determine the num-ber of cells (N). Given only one culture was used to estimatethe number of cells (N) for each segregant, the mutation rateestimation from the equation m ¼ m=N would be largely af-fected by that one measure of N. The number of cells perculture (N) was measured by counting the number of cellsgrowing on a YPD nonselective plate after a 105 dilution. Thisdilution was chosen based on pilot experiments in whichdifferent dilutions were tested. This 105 dilution was appliedto all segregants before plating on YPD to measure N. How-ever, this degree of dilution was not suitable for all individualsegregants. Any segregants that had too many colonies(.70) or no colonies growing on the YPD plates could notgive us an accurate measurement of N. Thus we removedthese 197 segregants from the downstream QTL analysis;only 843 segregants with confident measurements of N wereused. To minimize noise driven by the measurements of N,
732 L. Gou, J. S. Bloom, and L. Kruglyak

we defined a mutation rate score that regressed out the effectof N. We built a linear model that included the number ofcells per culture (N) and a plate effect as additive covariatesfor the number of mutations per culture (m). The residualsfrom this linear model were called the “mutation rate score”and used in downstream analyses. For each allele replace-ment strain (Table 1), 96 replicates of fluctuation analysiswere performed, providing 96 estimations of mutation rate.In each replicate, 12 cultures were plated onto canavanineplate to estimate the number of mutations per culture (m),and three cultures were pooled, diluted, and plated on YPDplates to determine the number of cells per culture (N).
Yeast growth measurement for DNA-damaging agentsensitivity assay
The segregant panel were originally stored in 96-well plates(3370; Costar). During the DNA-damaging agent sensitivityassay, individual segregants were inoculated in two plate con-figurations in384-wellplates (264574;ThermoScientific)withYPD and grown for�48 hr in a 30� incubator without shaking.Saturated cultures were mixed for 1 min at 2000 rpm using aMixMate (Eppendorf), before pinning. The colony handlingrobot (BM3-SC; S&P Robotics) was used to pin segregantsonto selective agar plates with 384 long pins. The plates wereincubated at 30� for �48 hr and imaged by the colony han-dling robot (BM3-SC; S&P Robotics). Custom R code (Bloomet al. 2013) was used to determine the size of each colony andthe size was used as a proxy for growth in the presence of theDNA-damaging agents.
QTL mapping and detecting QTL–QTL interactions
To control for intrinsic growth rate differences and plateposition effects, we normalized the traits for growth by fitting
a regression for growth of the yeast that were in the samelayout configuration on control plate (YPD agar plates formutagen sensitivity assay). Residuals were used for QTLmapping. We tested for linkage by calculating logarithmlikelihood ratio (LOD scores) for each genotypic markerand trait as 2nðlnð12 r2Þ=ð2lnð10ÞÞ, where r is the Pearsoncorrelation coefficient between the segregant genotypes andthe segregant mutation rate or DNA-damaging agents sensi-tivity. The threshold declaring the significant QTL effectwas calculated from the empirical null distribution of themaximum LOD score determined from 1000 permutations(Churchill and Doerge 1994). The estimated 5% family-wiseerror rate significance thresholds were 3.52, 3.62, 3.61, and3.64 for mutation rate, mutagen sensitivity for 4NQO, MMS,and H2O2 respectively. The 95% confidence intervals weredetermined using a 1.5 LOD score drop. The code and thedata for QTL mapping is available at https://github.com/gouliangke/Mutation-rate/tree/master/qtl_mapping.
We tested for interactions between each QTL pair bycomparing a model that includes an interaction term forthe two QTL, y ¼ ax þ bzþ cxzþ d, with a model that doesnot, y ¼ ax þ bzþ d, using the add1 function in R and calcu-lating an F-statistic. Here, y is the residuals vector for themutation rate score, x is the genotype vector at the firstQTL, z is the genotype vector at the second QTL, and a; b; c;and d are estimated parameters specific to each locus pair.
Calculating heritability
Broad-sense heritability was calculated using the naturalisolate data and a random effect ANOVA. The variance struc-ture of the phenotype is V ¼ s2
G ZZ’ þ s2EIm, where Z is an
incidence matrix mapping phenotypes to strain identity andIm is the identity matrix. The broad-sense heritability was
Figure 1 Linkage analysis identi-fied four loci underlying mutationrate variation. (A) The fluctuationassay was performed as shownin the workflow. The assay startedwith a small number of cells grow-ing in 96-well plates in liquid SC-Arg medium for �48 hr, followedby plating onto selective agarplates with canavanine. A propor-tion of the cultures were dilutedto measure the number of cellsper culture (Materials and Meth-ods). Plates were imaged 2 daysafter spot-plating, and the num-ber of colonies on canavanine platewas counted. (B) LOD score formutation rate variation is plottedagainst the genetic map. The foursignificant QTL explain 20.7% ofthe phenotypic variance. The redline indicates a 5% FWER signifi-cance threshold (LOD = 3.52).
Genetic Basis of Mutation Rate Variation 733

estimated as s2G=ðs2
G þ s2EÞ, where s2
G is the genetic var-iance and s2
E is the error variance. Standard errors of vari-ance component estimates were calculated as the square rootof the diagonal of the Fisher information matrix from theiteration at convergence of the AI-REML algorithm (Bloomet al. 2015).
Amplicon sequencing of the CAN1 region in segregants
A total of 1040 segregants were assigned into four groupsaccording to their alleles at gene RAD5 andMKT1 (Table S2).We collected the canavanine-resistant colonies from the can-avanine plates that we used to measure the mutation rate ofsegregants in the previous fluctuation analysis. A single can-avanine-resistant colony (if any) was picked from each seg-regant and the picked colonies from the same group werepooled together for DNA extraction. DNAwas extracted fromthe pool using the Qiagen DNeasy Blood & Tissue Kit. TheCAN1 region was amplified from the DNA of four groupsusing the Phusion High-Fidelity DNA Polymerase (ThermoFisher Scientific) and eight pairs of designed primers (FileS3). The amplicon sequencing library was prepared usingthe Illumina Nextera DNA Library Prep Kit with the adjustedprotocols to skip the Nextera treatment. The library was thensequenced on the MiSeq platform using the MiSeq ReagentV2 Nano Kit. As shown in Table S3, the original aligned readcounts for each library varied widely. To eliminate biascaused by read count variation, we adjusted the number ofread counts for each sample by randomly downsamplingthe reads in the fastq files to be the same for all samples,using custom Python code. Then, we processed reads withthe following pipeline: read pairing [paired-end reAdmergeR (PEAR)], read trimming (Trimmomatic-0.36), and read
alignment [Burrows-Wheeler Aligner (BWA)] to the refer-ence-targeting region using the downsampled fastq files.The adjusted read counts for each sample are shown in TableS3. Custom R code was used to determine the mutation ratespectrum of each group. The code for the mutation rate spec-trum analysis is available at https://github.com/gouliangke/Mutation-rate/tree/master/mutation_spectrum.
Data availability
Strains and plasmids are available upon request. File S1contains the “mutation rate score” for 843 segregants. FileS2 contains the mutation rate for allele replacement andvariant-engineered strains. File S3 contains the primer se-quences used for the amplicon sequencing. Data and codefor QTL mapping and mutation spectrum analysis are avail-able at https://github.com/gouliangke/Mutation-rate. Sup-plemental material available at Figshare: https://doi.org/10.6084/m9.figshare.7343036.
Results
High-throughput fluctuation assay for measuringmutation rates
The fluctuation assay for measuring mutation rate involvesgrowing many parallel cultures, each starting from a smallnumber of cells, under nonselective conditions, followed byplating to selective medium to identify mutants. The numberof mutations that occurs in each culture should follow thePoisson distribution, as mutations arise spontaneously. How-ever, the number of mutant cells that survive on the selectiveplates can vary greatly because early mutations are inheritedby all offspring of the mutant. This leads to the “jackpot”
Figure 2 Polymorphisms in RAD5underlie mutation rate variation.(A) RAD5 polymorphisms betweenBY and RM are located in the heli-case region. The first letter foreach polymorphism indicates theBY polymorphisms (E783, I791)and the second letter indicatesthe RM polymorphisms (D783,S791). (B) The effect of single RAD5polymorphism and RAD5 whole-gene replacement was tested inthe BY strain background for mu-tation rate. For each strain, themutation rates of 96 replicateswere measured. Bold lines showthe mean. Boxes show the inter-quartile range. Statistical significancewas tested using a permutationt-test. Permutation P value ,0.001is shown as ***.
734 L. Gou, J. S. Bloom, and L. Kruglyak

effect, in which some cultures contain a large number ofmutant individuals. The number of observed mutant cellsper culture follows the Luria–Delbrück distribution (Luriaand Delbrück 1943), and the Ma–Sandri–Sarkar maximumlikelihoodmethod can be used to estimate the expected num-ber of mutations per culture from the observed numbers ofmutants (Sarkar et al. 1992). The underlying mutation rate isthen calculated by dividing the number of mutations perculture by the average number of cells per culture (Luriaand Delbrück 1943). Here, we measured rare spontaneousloss-of-function mutations in the gene CAN1, which encodesan arginine permease. Yeast cells carrying loss-of-functionmutations in CAN1 can grow on canavanine, an otherwisetoxic arginine analog. Typically, fluctuation assays are labor-intensive and have limited throughput because a largenumber of parallel cultures is required for estimating themutation rate in each assay, and several replicate assaysare needed for a robust measurement of the mutation ratein each strain (Lang and Murray 2008). We modified thefluctuation assay into a high-throughput method for mea-suring mutation rates in many strains in parallel. We grewcultures in 96-well plates, automated the spotting of cul-tures, and used a plate-imaging robot to capture images ofthe mutant colonies on plates (Materials and Methods, Fig-ure 1A). The automated spotting process for 96 strains tookonly �20 min, and the imaging process required even lesstime. These improvements enabled us to measure the spon-taneous mutation rates in the hundreds of strains necessaryfor genetic mapping.
Spontaneous mutation rate varies among yeast isolates
To investigate mutation rate variation among S. cerevisiaestrains, wemeasured the spontaneous mutation rate of sevenyeast isolates using the high-throughput fluctuation assay(Table S1). The seven strains span a large range of yeastgenetic diversity (Schacherer et al. 2009). We found thatthe mutation rates of these strains range from 1.1 3 1027
to 5.8 3 1027 mutations per gene per generation, with amedian of 1.73 1027 (Figure S2 and Table S1). The medianmutation rate was very similar to the previously reportedmutation rate at CAN1 (Lang and Murray 2008). In particu-lar, the mutation rate we observed for the BY strain (1.7 31027) is very similar to the previously reported rate, whichwas measured in strain W303 (1.5 3 1027) (Lang and Mur-ray 2008), consistent with the fact that W303 shares a largefraction of its genome with BY (Schacherer et al. 2007;Matheson et al. 2017). An ANOVA showed that strain identityexplained a significant fraction of the observed variance in
mutation rates (F = 69.9, d.f. = 6, P , 2 3 10216) (FigureS2). The fraction of total variance inmutation rates explainedby the repeatability of measurements for each strain, 49%(SE = 0.29), serves as an upper bound for the estimate ofthe total contribution of genetic differences between strainsto trait variation (broad-sense heritability or H2). We ob-served that RM, a vineyard strain, had a mutation rate higherthan all other strains (Figure S2).
Four QTL explain the majority of observed mutationrate variation
To find the genetic factors underlying the difference in mu-tation rate between BY and RM, we performed QTL mappingin 1040 genotyped haploid segregants from a cross betweenthese strains (Bloom et al. 2013). We measured the mutationrate of each segregant using the high-throughput fluctuationassay (Materials and Methods). We estimated the fraction ofphenotypic variance explained by the additive effects of allsegregating markers (narrow-sense heritability) to be 30%(Materials and Methods) (Lynch and Walsh 1998). This setsan upper bound for the expectation of the total amount ofadditive genetic variance that could be explained with a QTL-based model. QTL mapping in the segregant panel identifiedsignificant linkage at four distinct loci (Figure 1B). At two ofthe QTL, on chromosomes XII and I, the RM allele conferred ahigher mutation rate, consistent with the higher mutationrate of this strain. At the other two QTL, on chromosomesXIV and V, the BY allele conferred a higher mutation rate(Figure S3), showing that a strain with lower trait valuecan nevertheless harbor trait-increasing alleles. The four de-tected QTL explained 20.7% of the phenotypic variance, thusaccounting for 69% of the estimated additive heritability. Theloci on chromosomes XII, XIV, I, and V explained 8.8, 6.1, 3.1,and 2.6% of the variance, respectively. We tested the fouridentified QTL for pairwise interactions and found a signifi-cant interaction between theQTL on chromosome XII and theQTL on chromosome XIV that explained 1% of the pheno-typic variance (F = 8.41, d.f. = 1, Bonferroni-corrected P =0.023).
Polymorphisms in genes RAD5 and MKT1 underlie themajor QTL on chromosomes XII and XIV
Ten genes fell within the confidence interval of the QTL onchromosome XII. A strong candidate was RAD5, based onprevious studies showing that natural variants in RAD5 con-tribute to sensitivity to the mutagen 4NQO (Demogines et al.2008). RAD5 encodes a DNA repair protein involved in the error-free DNA damage tolerance (DDT) pathway (Torres-Ramos
Table 1 The allele replacement strains and variant substitution strains
Strain Background Relevant genotype Source
YLK802 RM MATa, MKT1-BY, hoD::HphMX, flo8D::NatMX Smith and Kruglyak (2008)EAY1463 BY MATa, lys2D, RAD5-RM::NatMX Demogines et al. (2008)EAY1471 BY MATa, lys2D, RAD5-I791S::KanMX Demogines et al. (2008)EAY2169 BY MATa, lys2D, RAD5-E783D::KanMX Demogines et al. (2008)
Genetic Basis of Mutation Rate Variation 735
et al. 2002; Blastyák et al. 2007). The DDT pathway pro-motes the bypass of single-stranded DNA lesions encoun-tered by DNA polymerases during DNA replication, thuspreventing the stalling of DNA replication (Bi 2015). RAD5 playsa crucial role in one branch of the DDT pathway called tem-plate switching, in which the stalled nascent strand switchesfrom the damaged template to the undamaged newly synthe-sized sister strand for extension past the lesion (Bi 2015).Two nonsynonymous substitutions exist between BY andRM strains in RAD5 (Figure 2A), at amino acid positions783 (glutamic acid in BY and aspartic acid in RM) and791 (isoleucine in BY and serine in RM). According toPfam alignments (Sonnhammer et al. 1997), RAD5 contains aHIRAN domain, an SNF2-related N-terminal domain, aRING-type zinc finger domain, and a helicase C-terminal do-main (Figure 2A). Both nonsynonymous polymorphismsmapped to the helicase domain of RAD5 (Figure 2A), andno other sequenced strains of S. cerevisiae in the 1002 YeastGenomes Project contain the aspartic acid 783 and serine791 variants that are exclusive to the RM strain (Peter et al.2018).We used protein variation effect analyzer (PROVEAN)(Choi and Chan 2015) to predict whether the two nonsynon-ymous substitutions have an effect on the biological functionof the protein. PROVEAN showed the I791S substitution(score 25.4) might have a strong deleterious effect, whilethe E783D variant (score 21.8) was not predicted to havea strong effect.
Nineteen genes fell within the confidence interval ofthe QTL on chromosome XIV. A strong candidate wasMKT1, which was also reported to affect 4NQO sensitivity(Demogines et al. 2008).MKT1 encodes an RNA-binding pro-tein that affects multiple traits and underlies an expressionQTL hotspot in yeast (Albert and Kruglyak 2015). The RMallele ofMKT1 increases sporulation rate (Deutschbauer andDavis 2005) and improves survival at high temperature(Steinmetz et al. 2002), in low glucose (Parreiras et al.2011), after exposure to DNA-damaging agents (Demogineset al. 2008), and in high ethanol levels (Swinnen et al. 2012).The coding region of the BY and RM alleles ofMKT1 differs by
one synonymous polymorphism and two nonsynonymoussubstitutions. MKT1 has an Xeroderma Pigmentosum Com-plementation Group G (XPG) domain, which is relevant toDNA repair, and an MKT1 domain, which is related to themaintenance of K2 killer toxin (Wickner 1980). One nonsy-nonymous variant is in the XPG domain at amino acid posi-tion 30 (aspartic acid in BY and glycine in RM), while theother nonsynonymous variant is in the MKT1 domain at po-sition 453 (lysine in BY and arginine in RM). PROVEAN pre-dicted a large effect of the D30G variant (score 6.7) on thefunction of MKT1, and this variant was previously found toinfluence sporulation rate (Deutschbauer and Davis 2005),mitochondrial genome stability (Dimitrov et al. 2009), andsurvival at high temperature (Parreiras et al. 2011). Theother variant (K453R) was not predicted to have a strongeffect (score 0.6).
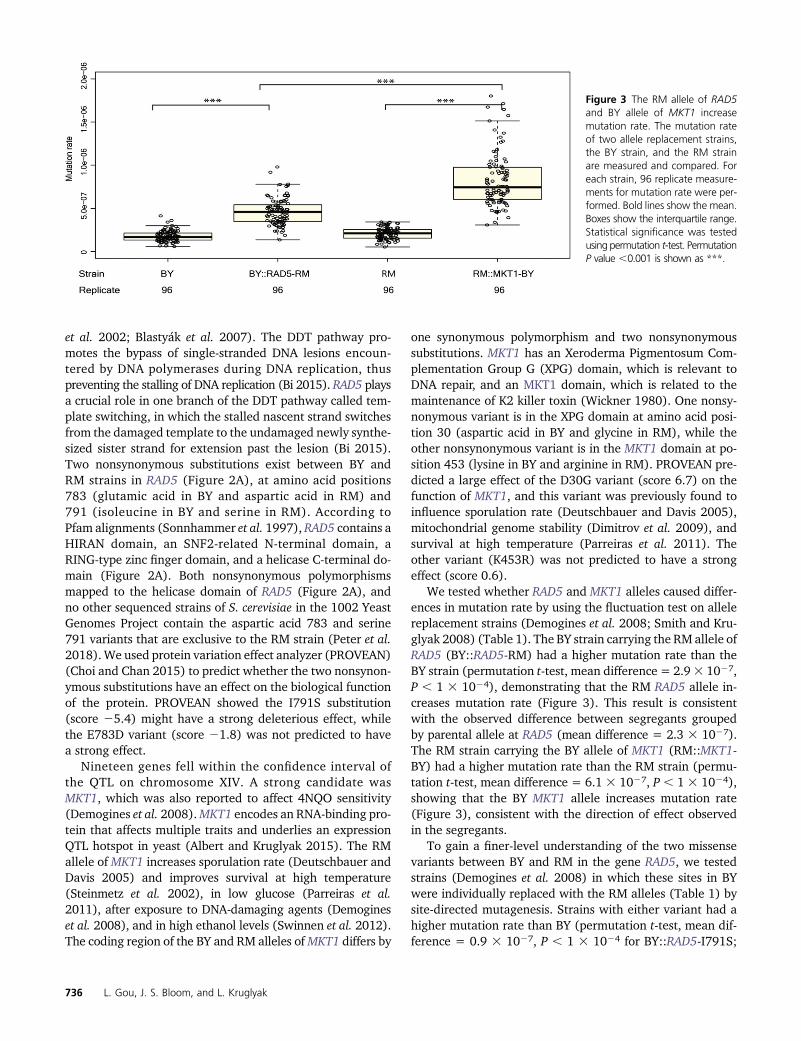
We tested whether RAD5 and MKT1 alleles caused differ-ences in mutation rate by using the fluctuation test on allelereplacement strains (Demogines et al. 2008; Smith and Kru-glyak 2008) (Table 1). The BY strain carrying the RM allele ofRAD5 (BY::RAD5-RM) had a higher mutation rate than theBY strain (permutation t-test, mean difference = 2.93 1027,P , 1 3 1024), demonstrating that the RM RAD5 allele in-creases mutation rate (Figure 3). This result is consistentwith the observed difference between segregants groupedby parental allele at RAD5 (mean difference = 2.3 3 1027).The RM strain carrying the BY allele of MKT1 (RM::MKT1-BY) had a higher mutation rate than the RM strain (permu-tation t-test, mean difference = 6.1 3 1027, P , 1 3 1024),showing that the BY MKT1 allele increases mutation rate(Figure 3), consistent with the direction of effect observedin the segregants.
To gain a finer-level understanding of the two missensevariants between BY and RM in the gene RAD5, we testedstrains (Demogines et al. 2008) in which these sites in BYwere individually replaced with the RM alleles (Table 1) bysite-directed mutagenesis. Strains with either variant had ahigher mutation rate than BY (permutation t-test, mean dif-ference = 0.9 3 1027, P , 1 3 1024 for BY::RAD5-I791S;
Figure 3 The RM allele of RAD5and BY allele of MKT1 increasemutation rate. The mutation rateof two allele replacement strains,the BY strain, and the RM strainare measured and compared. Foreach strain, 96 replicate measure-ments for mutation rate were per-formed. Bold lines show the mean.Boxes show the interquartile range.Statistical significance was testedusing permutation t-test. PermutationP value ,0.001 is shown as ***.
736 L. Gou, J. S. Bloom, and L. Kruglyak

mean difference = 0.3 3 1027, P = 6 3 1024 for BY::RAD5-E783D) (Figure 2B), suggesting that both variants contributeto the higher mutation rate. The BY strain with the I791Ssubstitution had a higher mutation rate than the BY strainwith the E783D substitution (permutation t-test, mean dif-ference = 0.63 1027, P, 13 1024) (Figure 2B), consistentwith the PROVEAN prediction of a stronger effect for theI791S variant. However, neither variant alone nor the addi-tive effect of the two variants fully recapitulated the increasein mutation rate that we observed when replacing the entirecoding region of RAD5 in BY with the RM allele (F = 67.6,d.f. = 1, P=3.33 10215), suggesting an interaction betweenthe two variants.
Mutation rate shares two large effect QTL with growthon DNA-damaging agents 4NQO and MMS
Deficiencies in DNA repair can increase mutation rate (Supekand Lehner 2015; Sabarinathan et al. 2016) and increasesensitivity to DNA-damaging agents such as alkylating com-pounds and ultraviolet light (Frankfurt 1991; Sun and Moses1991). We hypothesized that genetic variants that cause de-ficiencies in DNA repair may underlie QTL for both muta-tion rate variation and sensitivity to DNA-damaging agents.Previously, Demogines et al. identified a large-effect QTLon chromosome XII for MMS and 4NQO sensitivity in apanel of 123 segregants from a cross between BY and RM(Demogines et al. 2008). Additionally, they identified a QTLon chromosome XIV for 4NQO sensitivity by using backcross-ing and bulk segregant analysis. These QTL overlapped withthe major QTL that we identified for mutation rate variation,and the underlying causal genes for 4NQO sensitivity werealso RAD5 and MKT1.
To follow up on these results, we measured sensitivityto three different DNA damaging agents in our panel of1040 segregants (Table 2). The compounds assayed in-cluded MMS, an alkylating agent that induces DNA double-strand breaks and stalls replication forks (Hampsey 1997);4NQO, an ultraviolet light mimetic agent (Hampsey 1997);and H2O2, a compound that induces DNA single- and double-strand breaks (Hampsey 1997). We observed that segre-gants with higher mutation rate, and presumably less-efficientDNA repair systems, were more sensitive to MMS, 4NQO,and H2O2 (Figure S4), consistent with our hypothesisthat deficiencies in DNA repair increase the rate of spon-taneous mutations and increase sensitivity to DNA-damaging agents. We identified two large-effect QTL for4NQO and MMS sensitivity that overlapped with themajor QTL for mutation rate (Figure 4, A and B). TheQTL on chromosome XII and XIV were still observed in
the linkage mapping for H2O2, but they had small ef-fects (Figure S5). The large effect QTL detected for H2
O2 sensitivity on other chromosomes likely reflects trait-specific effects of variants acting on sensitivity to H2O2
(Figure S5).
Similar mutation spectra in segregants with differentRAD5 and MKT1 genotypes
To gain a better understanding of how genetic variation inRAD5 and MKT1 might influence the DNA damage repairprocess, we characterized the spontaneous mutation spec-trum at CAN1 in the segregants. We divided 1040 segregantsinto four groups based on their genotypes at RAD5 andMKT1and sequenced pools of CAN1-resistant mutants from eachgroup (Tables S2 and S3). The mutation spectra of the fourgroups are shown in Figure S6 and Table S4. C:G . T:Atransitions were the most frequently observed mutations,A:T . G:C was the rarest transition, and A:T . T:A was therarest transversion. The spectra for single base-pair substitu-tions observed here (Figure S7) are similar to previous obser-vations based on whole-genome sequencing of mutationaccumulation strains (Zhu et al. 2014). While there weresome differences in the relative frequencies of specific muta-tion types (for instance, more C:G . G:C transversions insegregants with the RM MKT1 allele and more A:T . C:Gtransversions in segregants with the BY RAD5 allele), thesemutation differences were not statistically significant aftercorrection for multiple testing.
Discussion
We developed and implemented a high-throughput fluctua-tionassay todirectlymeasuremutation rates in yeast.Weusedthis assay to map four QTL that influence differences in thespontaneous mutation rate, and narrowed the two QTL withthe largest effects to causal genes and variants.We attemptedto gain insight into how these variants might affect themutation rate by comparing mutational spectra of segregantsgrouped by genotype, but the differences we observed did notreach statistical significance.
We identified RAD5 as the gene underlying the QTL withthe largest effect on mutation rate. RAD5 encodes a DNAhelicase and ubiquitin ligase involved in the error-free DDTpathway (Hishida et al. 2009; Unk et al. 2010). We showedthat two nonsynonymous variants between BY and RM in thehelicase domain affect mutation rate. The Rad5 DNA helicaseinvolves in the replication fork regression process, which washypothesized to promote DDT and repair during replication(Neelsen and Lopes 2015). The RM allele of RAD5 increasesthe sensitivity of yeast to 4NQO and MMS (Demogines et al.2008), probably due to a defect in replication fork regression.Thus the RM allele of RAD5 causes both decreased growth inmutagenic conditions and a higher mutation rate in non-stressful normal conditions.
We furthermore showed that polymorphisms in MKT1contribute to mutation rate variation. MKT1 is a highly
Table 2 DNA-damaging agents used for the sensitivity assay
Agent Agent characteristic
Hydrogen peroxide (H2O2) Altering DNA structureMethyl methane sulfonate (MMS) Altering (alkylating) DNA bases4-Nitroquinoline 1-oxide (4NQO) Ultraviolet mimetic
Genetic Basis of Mutation Rate Variation 737

pleiotropic gene that has been shown to affect a number ofphenotypes (Steinmetz et al. 2002; Deutschbauer andDavis 2005; Demogines et al. 2008; Smith and Kruglyak2008; Parreiras et al. 2011; Swinnen et al. 2012; Wang andKruglyak 2014; Albert and Kruglyak 2015). The BY and RMalleles of MKT1 differ by two nonsynonymous substitu-tions. One variant (K453R) is located in the MKT1 domain,which is required for activity of the Mkt1 protein in main-taining K2 killer toxin (Vermut et al. 1994). Another vari-ant (D30G) localizes to the XPG-N (the N-terminus of XPG)domain. Four other yeast proteins contain this domain:Exo1, Din7, Rad27 and Rad2. All of these proteins havefunctions related to DNA repair and cellular response toDNA damage, including DNA double-strand break repair(Exo1) (Tkach et al. 2012), DNA mismatch repair (Exo1,Din7) (Koprowski et al. 2003; Tran et al. 2007), nucleotideexcision repair (Rad2) (Northam et al. 2010), ribonucleo-tide excision repair (Rad27) (Sparks et al. 2012), and largeloop repair (Rad27) (Sommer et al. 2008). The internalXPG (XPG-I) domain, together with XPG-N, forms the cat-alytic domain of the XPG protein in humans. The XPG pro-tein has well-established catalytic and structural roles innucleotide excision repair, a DNA repair process, and actsas a cofactor for a DNA glycosylase that removes oxidizedpyrimidines from DNA (Clarkson 2003). Mutations in theXPG protein commonly cause xeroderma pigmentosum, whichoften leads to skin cancer (O’Donovan et al. 1994).We hypoth-esize that Mkt1 has a previously unknown function in DNAdamage repair, mediated through its XPG domain.
We found that variants in RAD5 and MKT1 contributeto both mutation rate variation and mutagen sensitiv-ity. These results suggest that spontaneously occurringmutations may have a similar mutation spectrum to those
created by 4NQO and MMS, and are potentially repairedby the same mechanisms. Deficient DNA repair can leadto increased sensitivity to agents such as alkylating com-pounds and ultraviolet light (Frankfurt 1991; Sun andMoses 1991; O’Driscoll et al. 1999), and to higher muta-tion rates at sites that are less accessible to the DNA repairsystem (Sabarinathan et al. 2016). Because mutation ratescan be difficult to measure, sensitivity to mutagens mayserve as a useful proxy.
Recently, Jerison et al. reported heritable differences inadaptability in 230 yeast segregants from the same crosswe studied here (Jerison et al. 2017). They measured adapt-ability as the difference in fitness between a given segregant(“founder”) and a descendant of that founder after 500 gen-erations of experimental evolution. Interestingly, RAD5 fellwithin one of the QTL found to influence adaptability. To-gether with our observation that RAD5 influences mutationrate, this finding suggests that differences in mutation ratecan affect the adaptability of organisms.
Acknowledgments
We are grateful to members of the Kruglyak laboratory forinsightful comments on this manuscript and suggestionsfor experiments and data analyses. We thank Meru Sadhufor helpful discussion. We would like to especially thank theAlani laboratory in Cornell University for the RAD5 allelereplacement and variant substitution strains.
Author contributions: Conceived and designed the experi-ments: L.G., J.S.B., and L.K. Performed the experiments:L.G. Analyzed the data: L.G. and J.S.B. Wrote the paper:L.G., J.S.B., and L.K.
Figure 4 Loci underlying muta-tion rate variation, 4NQO sen-sitivity, and MMS sensitivity areoverlapping. (A and B) The LODscores for 4NQO (0.1 mg/ml) sen-sitivity and MMS (0.01%) sensitiv-ity are plotted against the geneticmap. The red line indicates a5% FWER significance threshold(LOD = 3.62 for 4NQO and LOD =3.61 for MMS).
738 L. Gou, J. S. Bloom, and L. Kruglyak

Literature Cited
Albert, F. W., and L. Kruglyak, 2015 The role of regulatory vari-ation in complex traits and disease. Nat. Rev. Genet. 16: 197–212. https://doi.org/10.1038/nrg3891
Amberg, D. C., D. J. Burke, and J. N. Strathern, 2005 Methods inYeast Genetics: A Cold Spring Harbor Laboratory Course Man-ual. Cold Spring Harbor Laboratory Press, Cold Spring Harbor,NY.
Baer, C. F., M. M. Miyamoto, and D. R. Denver, 2007 Mutationrate variation in multicellular eukaryotes: causes and conse-quences. Nat. Rev. Genet. 8: 619–631. https://doi.org/10.1038/nrg2158
Bi, X., 2015 Mechanism of DNA damage tolerance. World J. Biol.Chem. 6: 48. https://doi.org/10.4331/wjbc.v6.i3.48
Blastyák, A., L. Pintér, I. Unk, L. Prakash, S. Prakash et al.,2007 Yeast rad5 protein required for postreplication repairhas a DNA helicase activity specific for replication fork regres-sion. Mol. Cell 28: 167–175. https://doi.org/10.1016/j.mol-cel.2007.07.030
Bloom, J. S., I. M. Ehrenreich, W. T. Loo, T.-L. V. Lite, and L.Kruglyak, 2013 Finding the sources of missing heritability ina yeast cross. Nature 494: 234–237. https://doi.org/10.1038/nature11867
Bloom, J. S., I. Kotenko, M. J. Sadhu, S. Treusch, F. W. Albert et al.,2015 Genetic interactions contribute less than additive effectsto quantitative trait variation in yeast. Nat. Commun. 6: 8712.https://doi.org/10.1038/ncomms9712
Choi, Y., and A. P. Chan, 2015 PROVEAN web server: a tool topredict the functional effect of amino acid substitutions andindels. Bioinformatics 31: 2745–2747. https://doi.org/10.1093/bioinformatics/btv195
Churchill, G. A., and R. W. Doerge, 1994 Empirical thresholdvalues for quantitative trait mapping. Genetics 138: 963–971.https://doi.org/10.1534/genetics.107.080101
Clarkson, S. G., 2003 The XPG story. Biochimie 85: 1113–1121.https://doi.org/10.1016/j.biochi.2003.10.014
Demerec, M., 1937 Frequency of spontaneous mutations in cer-tain stocks of drosophila melanogaster. Genetics 22: 469–478.
Demogines, A., E. Smith, L. Kruglyak, and E. Alani, 2008 Identi-fication and dissection of a complex DNA repair sensitivity phe-notype in baker’s yeast. PLoS Genet. 4: e1000123. https://doi.org/10.1371/journal.pgen.1000123
Deutschbauer, A. M., and R. W. Davis, 2005 Quantitative trait locimapped to single-nucleotide resolution in yeast. Nat. Genet. 37:1333–1340. https://doi.org/10.1038/ng1674
Dimitrov, L. N., R. B. Brem, L. Kruglyak, and D. E. Gottschling,2009 Polymorphisms in multiple genes contribute to the spon-taneous mitochondrial genome instability of Saccharomyces cer-evisiae S288C strains. Genetics 183: 365–383. https://doi.org/10.1534/genetics.109.104497
Drake, J. W., B. Charlesworth, D. Charlesworth, and J. F. Crow,1998 Rates of spontaneous mutation. Genetics 148: 1667–1686. https://doi.org/citeulike-article-id:610966
Frankfurt, O. S., 1991 Inhibition of DNA repair and the enhance-ment of cytotoxicity of alkylating agents. Int. J. Cancer 48: 916–923. https://doi.org/10.1002/ijc.2910480620
Hampsey, M., 1997 A review of phenotypes in Saccharomycescerevisiae. Yeast 13: 1099–1133. https://doi.org/10.1002/(SICI)1097-0061(19970930)13:12,1099::AID-YEA177.3.0.CO;2-7
Hishida, T., Y. Kubota, A. M. Carr, and H. Iwasaki, 2009 RAD6–RAD18–RAD5-pathway-dependent tolerance to chronic low-dose ultraviolet light. Nature 457: 612–615. https://doi.org/10.1038/nature07580
Jerison, E. R., S. Kryazhimskiy, J. K. Mitchell, J. S. Bloom, L.Kruglyak et al., 2017 Genetic variation in adaptability and
pleiotropy in budding yeast. Elife 6: e27167. https://doi.org/10.1101/121749
Koprowski, P., M. U. Fikus, P. Dzierzbicki, P. Mieczkowski, J.Lazowska et al., 2003 Enhanced expression of the DNAdamage-inducible gene DIN7 results in increased mutagenesisof mitochondrial DNA in Saccharomyces cerevisiae. Mol. Genet.Genomics 269: 632–639. https://doi.org/10.1007/s00438-003-0873-8
Lang, G. I., and A. W. Murray, 2008 Estimating the per-base-pairmutation rate in the yeast Saccharomyces cerevisiae. Genetics178: 67–82. https://doi.org/10.1534/genetics.107.071506
Lieber, M. R., 2010 The mechanism of double-strand DNA breakrepair by the nonhomologous DNA end-joining pathway. Annu.Rev. Biochem. 79: 181–211. https://doi.org/10.1146/annurev.biochem.052308.093131
Long, M., E. Betrán, K. Thornton, and W. Wang, 2003 The originof new genes: glimpses from the young and old. Nat. Rev. Genet.4: 865–875. https://doi.org/10.1038/nrg1204
Luria, S., and M. Delbrück, 1943 Mutations of bacteria from virussensitivity to virus resistance. Genetics 28: 491–511. https://doi.org/10.1038/nature10260
Lynch, M., and B. Walsh, 1998 Genetics and Analysis of Quantita-tive Traits, pp. 980. Sinauer, Sunderland, MA
Matheson, K., L. Parsons, and A. Gammie, 2017 Whole-genomesequence and variant analysis of W303, a widely-used strainof Saccharomyces cerevisiae. G3 (Bethesda) 7: 2219–2226.https://doi.org/10.1534/g3.117.040022
Neelsen, K. J., and M. Lopes, 2015 Replication fork reversal ineukaryotes: from dead end to dynamic response. Nat. Rev.Mol. Cell Biol. 16: 207–220. https://doi.org/10.1038/nrm3935
Northam, M. R., H. A. Robinson, O. V. Kochenova, and P. V.Shcherbakova, 2010 Participation of DNA polymerase?? inreplication of undamaged DNA in Saccharomyces cerevisiae. Ge-netics 184: 27–42. https://doi.org/10.1534/genetics.109.107482
O’Donovan, A., D. Scherly, S. G. Clarkson, and R. D. Wood,1994 Isolation of active recombinant XPG protein, a humanDNA repair endonuclease. J. Biol. Chem. 269: 15965–15968.
O’Driscoll, M., P. Macpherson, Y. Z. Xu, and P. Karran, 1999 Thecytotoxicity of DNA carboxymethylation and methylation by themodel carboxymethylating agent azaserine in human cells. Car-cinogenesis 20: 1855–1862. https://doi.org/10.1093/carcin/20.9.1855
Parreiras, L. S., L. M. Kohn, and J. B. Anderson, 2011 Cellulareffects and epistasis among three determinants of adaptationin experimental populations of Saccharomyces cerevisiae. Eu-karyot. Cell 10: 1348–1356. https://doi.org/10.1128/EC.05083-11
Peter, J., M. De Chiara, A. Friedrich, J.-X. Yue, D. Pflieger et al.,2018 Genome evolution across 1,011 Saccharomyces cerevi-siae isolates. Nature 556: 339–344. https://doi.org/10.1038/s41586-018-0030-5
Sabarinathan, R., L. Mularoni, J. Deu-Pons, A. Gonzalez-Perez, andN. Lopez-Bigas, 2016 Nucleotide excision repair is impaired bybinding of transcription factors to DNA. Nature 532: 264–267.https://doi.org/10.1038/nature17661
Sarkar, S., W. T. Ma, and G. H. Sandri, 1992 On fluctuation anal-ysis: a new, simple and efficient method for computing the ex-pected number of mutants. Genetica 85: 173–179. https://doi.org/10.1007/BF00120324
Schacherer, J., D. M. Ruderfer, D. Gresham, K. Dolinski, D. Botsteinet al., 2007 Genome-wide analysis of nucleotide-level varia-tion in commonly used Saccharomyces cerevisiae strains. PLoSOne 2: e322. https://doi.org/10.1371/journal.pone.0000322
Schacherer, J., J. A. Shapiro, D. M. Ruderfer, and L. Kruglyak,2009 Comprehensive polymorphism survey elucidates popula-tion structure of Saccharomyces cerevisiae. Nature 458: 342–345. https://doi.org/10.1038/nature07670
Genetic Basis of Mutation Rate Variation 739

Smith, E. N., and L. Kruglyak, 2008 Gene-environment interac-tion in yeast gene expression. PLoS Biol. 6: e83. https://doi.org/10.1371/journal.pbio.0060083
Sommer, D., C. M. Stith, P. M. J. Burgers, and R. S. Lahue,2008 Partial reconstitution of DNA large loop repair with pu-rified proteins from Saccharomyces cerevisiae. Nucleic AcidsRes. 36: 4699–4707. https://doi.org/10.1093/nar/gkn446
Sonnhammer, E. L., S. R. Eddy, and R. Durbin, 1997 Pfam: acomprehensive database of protein domain families based onseed alignments. Proteins 28: 405–420. https://doi.org/10.1002/(SICI)1097-0134(199707)28:3,405::AID-PROT10.3.0.CO;2-L
Sparks, J. L., H. Chon, S. M. Cerritelli, T. A. Kunkel, E. Johansson et al.,2012 RNase H2-Initiated ribonucleotide excision repair. Mol. Cell47: 980–986. https://doi.org/10.1016/j.molcel.2012.06.035
Steinmetz, L. M., H. Sinha, D. R. Richards, J. I. Spiegelman, P. J.Oefner et al., 2002 Dissecting the architecture of a quantitativetrait locus in yeast. Nature 416: 326–330. https://doi.org/10.1038/416326a
Sun, Y., and R. E. Moses, 1991 Reactivation of psoralen-reactedplasmid DNA in Fanconi anemia, xeroderma pigmentosum, andnormal human fibroblast cells. Somat. Cell Mol. Genet. 17: 229–238. https://doi.org/10.1007/BF01232819
Supek, F., and B. Lehner, 2015 Differential DNA mismatch repairunderlies mutation rate variation across the human genome.Nature 521: 81–84. https://doi.org/10.1038/nature14173
Swinnen, S., K. Schaerlaekens, T. Pais, J. Claesen, G. Hubmannet al., 2012 Identification of novel causative genes determin-ing the complex trait of high ethanol tolerance in yeast usingpooled-segregant whole-genome sequence analysis. GenomeRes. 22: 975–984. https://doi.org/10.1101/gr.131698.111
Tkach, J. M., A. Yimit, A. Y. Lee, M. Riffle, M. Costanzo et al.,2012 Dissecting DNA damage response pathways by analy-sing protein localization and abundance changes during DNA
replication stress. Nat. Cell Biol. 14: 966–976. https://doi.org/10.1038/ncb2549
Tomlinson, I. P., M. R. Novelli, and W. F. Bodmer, 1996 Themutation rate and cancer. Proc. Natl. Acad. Sci. USA 93: 14800–14803. https://doi.org/10.1073/pnas.93.25.14800
Torres-Ramos, C. A., S. Prakash, and L. Prakash, 2002 Requirementof RAD5 and MMS2 for postreplication repair of UV-damagedDNA in Saccharomyces cerevisiae. Mol. Cell. Biol. 22: 2419–2426. https://doi.org/10.1128/MCB.22.7.2419-2426.2002
Tran, P. T., J. P. Fey, N. Erdeniz, L. Gellon, S. Boiteux et al.,2007 A mutation in EXO1 defines separable roles in DNA mis-match repair and post-replication repair. DNA Repair (Amst.) 6:1572–1583. https://doi.org/10.1016/j.dnarep.2007.05.004
Unk, I., I. Hajdú, A. Blastyák, and L. Haracska, 2010 Role of yeastRad5 and its human orthologs, HLTF and SHPRH in DNA dam-age tolerance. DNA Repair (Amst.) 9: 257–267. https://doi.org/10.1016/j.dnarep.2009.12.013
Vermut, M., W. R. Widner, J. D. Dinman, and R. B. Wickner, 1994 XIV.Yeast sequencing reports. Sequence of MKT1, needed for propaga-tion of M2 satellite dsRNA of the L‐A virus of Saccharomyces cerevi-siae. Yeast 10: 1477–1479. https://doi.org/10.1002/yea.320101111
Wang, X., and L. Kruglyak, 2014 Genetic basis of haloperidol re-sistance in Saccharomyces cerevisiae is complex and dose de-pendent. PLoS Genet. 10: e1004894. https://doi.org/10.1371/journal.pgen.1004894
Wickner, R. B., 1980 Plasmids controlling exclusion of the K2killer double-stranded RNA plasmid of yeast. Cell 21: 217–226. https://doi.org/10.1016/0092-8674(80)90129-4
Zhu, Y. O., M. L. Siegal, D. W. Hall, and D. A. Petrov, 2014 Preciseestimates of mutation rate and spectrum in yeast. Proc. Natl.Acad. Sci. USA 111: E2310–E2318. https://doi.org/10.1073/pnas.1323011111
Communicating editor: C. Queitsch
740 L. Gou, J. S. Bloom, and L. Kruglyak