the genomic complexity of prostate cancer · the genomic complexity of prostate cancer rami...
TRANSCRIPT

The genomic complexity of prostate cancer
Rami Aqeilan, PhD The Lautenberg Center for Immunology and
Cancer Research Hebrew University-Hadassah Medical School
Jerusalem May 7, 2013

Prostate Cancer Definition • Relevance
– Most common noncutaneous malignancy in men • Incidence
– Nearly 200,000 new cases per year in U.S. • Mortality
– 32,000 deaths in the United States each year – Second most common cause of cancer death in men
• Morbidity – Single histologic disease – Ranges
• From indolent, clinically irrelevant • To virulent, rapidly lethal phenotype: castrate-resistant
prostate cancer (CRPC).
Small, E., Cecil Textbook of Medicine, Prostate Cancer, 2004, WB Saunders, an Elsevier imprint Theodorescu, D., Prostate Cancer: Management of Localized Disease, www.emedicine.com, 20042
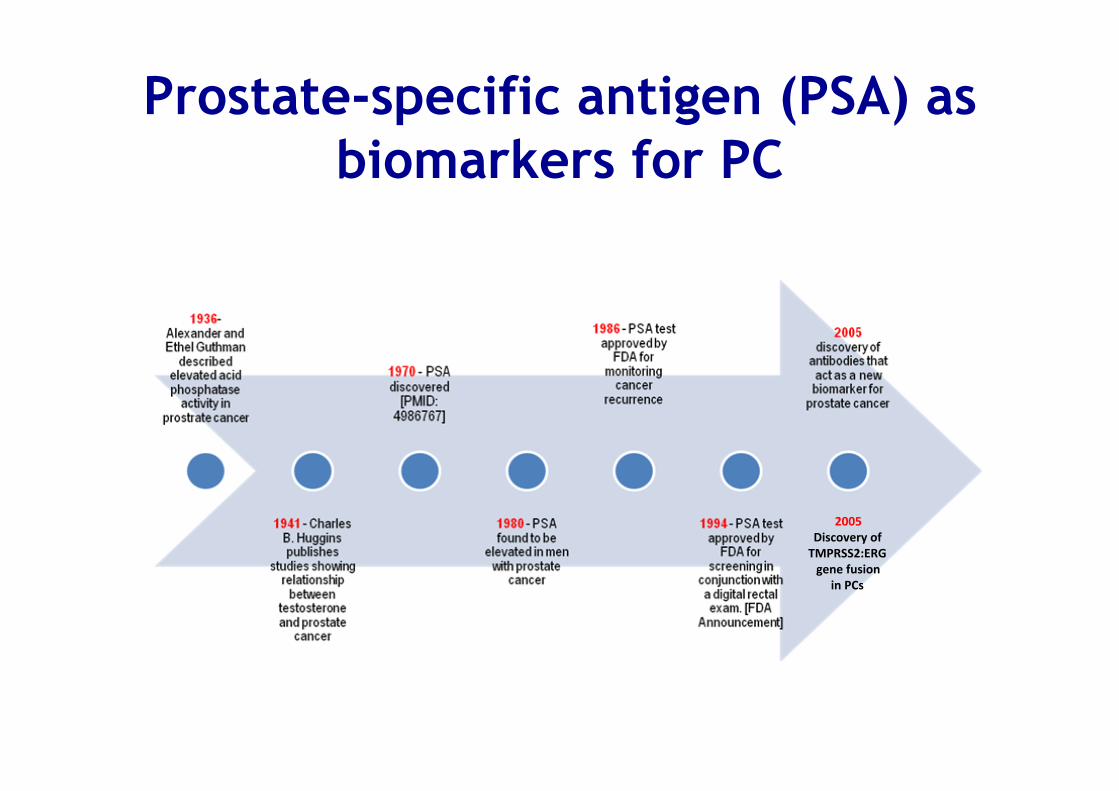
Prostate-specific antigen (PSA) as biomarkers for PC
2005 Discovery of TMPRSS2:ERG gene fusion
in PCs

Prostate Cancer Epidemiology
• Prostate-specific antigen (PSA) assay has affected incidence of prostate cancer
• Incidence – Prior to PSA
• 19,000 new cases / year in US – 1993
• 84,000 – 1996
• 300,000 – Since 1996
• 200,000 per year • A number that more closely estimate the true annual
incidence of clinically detectable disease
Small, E., Cecil Textbook of Medicine, Prostate Cancer, 2004, WB Saunders, an Elsevier imprint

Prostate Cancer Pathophysiology
• Adenocarcinoma – 95% of prostate cancers
• Developing in the acini of prostatic ducts
• Rare histopathologic types of prostate carcinoma – Occur in approximately 5% of patients – Include
• Small cell carcinoma • Mucinous carcinoma • Endometrioid cancer (prostatic ductal carcinoma) • Transitional cell cancer • Squamous cell carcinoma • Basal cell carcinoma • Adenoid cystic carcinoma (basaloid) • Signet-ring cell carcinoma • Neuroendocrine cancer
Theodorescu, D., Prostate Cancer: Management of Localized Disease, www.emedicine.com, 2004
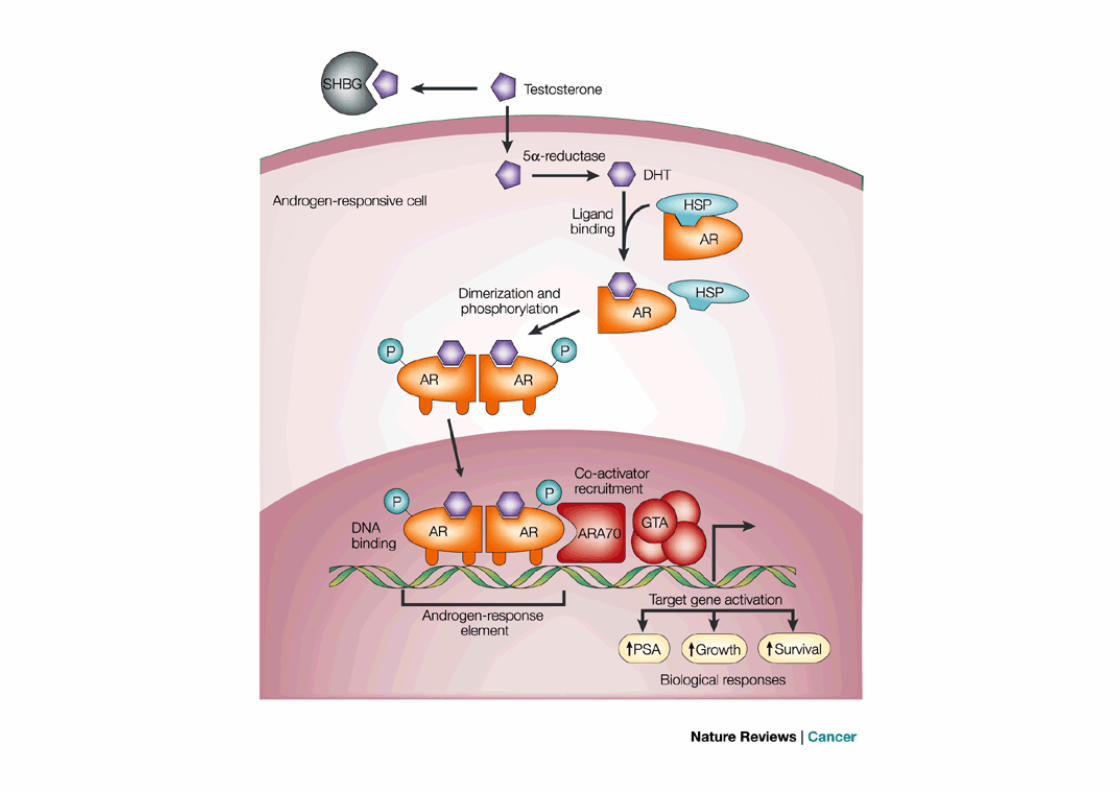


Androgen-dependent and independent PC
In advance disease, androgen-deprivation therapy results in rapid response; however, nearly all patients eventually progress to metastatic castration-resistant prostate cancer (CRPC)

Common chromosomal fusions in prostate cancer
Nature Medicine -‐ 12, 14 -‐ 15 (2006)

ARTICLEdoi:10.1038/nature09744
The genomic complexity of primaryhuman prostate cancerMichael F. Berger1{*, Michael S. Lawrence1*, Francesca Demichelis2,3*, Yotam Drier4*, Kristian Cibulskis1, Andrey Y. Sivachenko1,Andrea Sboner5,6, Raquel Esgueva2, Dorothee Pflueger2, Carrie Sougnez1, Robert Onofrio1, Scott L. Carter1, Kyung Park2,Lukas Habegger6, Lauren Ambrogio1, Timothy Fennell1, Melissa Parkin1, Gordon Saksena1, Douglas Voet1, Alex H. Ramos1,7,Trevor J. Pugh1,7,8, Jane Wilkinson1, Sheila Fisher1, Wendy Winckler1, Scott Mahan1, Kristin Ardlie1, Jennifer Baldwin1,Jonathan W. Simons9, Naoki Kitabayashi2, Theresa Y. MacDonald2, Philip W. Kantoff7,8, Lynda Chin1,7,8,10, Stacey B. Gabriel1,Mark B. Gerstein5,6,11, Todd R. Golub1,12,13,14, Matthew Meyerson1,7,8,14, Ashutosh Tewari15, Eric S. Lander1,7,16, Gad Getz1,Mark A. Rubin2 & Levi A. Garraway1,7,8,14
Prostate cancer is the second most common cause of male cancer deaths in the United States. However, the full range ofprostate cancer genomic alterations is incompletely characterized. Here we present the complete sequence of sevenprimary human prostate cancers and their paired normal counterparts. Several tumours contained complex chains ofbalanced (that is, ‘copy-neutral’) rearrangements that occurred within or adjacent to known cancer genes.Rearrangement breakpoints were enriched near open chromatin, androgen receptor and ERG DNA binding sites inthe setting of the ETS gene fusion TMPRSS2–ERG, but inversely correlated with these regions in tumours lacking ETSfusions. This observation suggests a link between chromatin or transcriptional regulation and the genesis of genomicaberrations. Three tumours contained rearrangements that disrupted CADM2, and four harboured events disruptingeither PTEN (unbalanced events), a prostate tumour suppressor, or MAGI2 (balanced events), a PTEN interacting proteinnot previously implicated in prostate tumorigenesis. Thus, genomic rearrangements may arise from transcriptional orchromatin aberrancies and engage prostate tumorigenic mechanisms.
Among men in the United States, prostate cancer accounts for morethan 200,000 new cancer cases and 32,000 deaths annually1. Althoughandrogen deprivation therapy yields transient efficacy, most patientswith metastatic prostate cancer eventually die of their disease. Theseaspects underscore the critical need to articulate both genetic under-pinnings and novel therapeutic targets in prostate cancer.
Recent years have heralded a marked expansion in our understand-ing of the somatic genetic basis of prostate cancer. Of considerableimportance has been the discovery of recurrent gene fusions thatrender ETS transcription factors under the control of androgen-responsive or other promoters2–5. These findings suggest that genomicrearrangements may comprise a major mechanism driving prostatecarcinogenesis. Other types of somatic alterations also engage import-ant mechanisms6–8; however, the full spectrum of prostate cancergenomic alterations remains incompletely characterized. Moreover,although the androgen signalling axis represents an important thera-peutic focal point9,10, relatively few additional drug targets have yetbeen elaborated by genetic studies of prostate cancer11. To discoveradditional genomic alterations that may underpin lethal prostate cancer,we performed paired-end, massively parallel sequencing on tumour andmatched normal genomic DNA obtained from seven patients with‘high-risk’ primary prostate cancer.
Landscape of genomic alterationsAll patients harboured tumours of stage T2c or greater, and Gleasongrade 7 or higher. Serum prostate-specific antigen levels ranged from2.1 to 10.2 ng ml21 (Supplementary Table 1). Three tumours con-tained chromosomal rearrangements involving the TMPRSS2 (trans-membrane protease, serine 2)–ERG (v-ets erythroblastosis virus E26oncogene homologue (avian)) loci as determined by fluorescence insitu hybridization (FISH) and PCR with reverse transcription (RT–PCR)2 (Table 1 and Supplementary Table 1). We obtained approxi-mately 30-fold mean sequence coverage for each sample, and reliablydetected somatic mutations in more than 80% of the genome(described in Supplementary Information). Circos plots12 indicatinggenomic rearrangements and copy number alterations for each pro-state cancer genome are shown in Fig. 1.
We identified a median of 3,866 putative somatic base mutations(range 3,192–5,865) per tumour (Supplementary Table 2); the estimatedmean mutation frequency was 0.9 per megabase (see SupplementaryMethods). This mutation rate is similar to that observed in acutemyeloid leukaemia and breast cancer13–16 but 7–15-fold lower than ratesreported for small cell lung cancer and melanoma17–19. The mutationrate at CpG (that is, cytosine–phosphate–guanine) dinucleotides wasmore than tenfold higher than at all other genomic positions
1The Broad Institute of Harvard and MIT, Cambridge, Massachusetts 02142, USA. 2Department of Pathology and Laboratory Medicine, Weill Cornell Medical College, New York, New York 10065, USA.3Institute for Computational Biomedicine, Weill Cornell Medical College, New York, New York 10021, USA. 4Department of Physics of Complex Systems, Weizmann Institute of Science, Rehovot 76100,Israel. 5Department of Molecular Biophysics and Biochemistry, Yale University, New Haven, Connecticut 06520, USA. 6Program in Computational Biology and Bioinformatics, Yale University, New Haven,Connecticut 06520, USA. 7Harvard Medical School, Boston, Massachusetts 02115, USA. 8Department of Medical Oncology, Dana-Farber Cancer Institute, Boston, Massachusetts 02115, USA. 9TheProstate Cancer Foundation, Santa Monica, California 90401, USA. 10Belfer Institute for Applied Cancer Science, Dana-Farber Cancer Institute, Boston, Massachusetts 02115, USA. 11Department ofComputerScience, Yale University,New Haven, Connecticut06520,USA. 12DepartmentofPediatricOncology, Dana-FarberCancer Institute, Boston, Massachusetts 02115,USA. 13HowardHughesMedicalInstitute, Chevy Chase, Maryland 20815, USA. 14Center for Cancer Genome Discovery, Dana-Farber Cancer Institute, Boston, Massachusetts 02115, USA. 15Department of Urology, Institute of ProstateCancer and Lefrak Center of Robotic Surgery, Weill Cornell Medical College and New York Presbyterian Hospitals, New York, New York 10065, USA. 16Whitehead Institute for Biomedical Research, 9Cambridge Center, Cambridge, Massachusetts 02142, USA. {Present address: Department of Pathology, Memorial Sloan-Kettering Cancer Center, New York, New York 10065, USA.*These authors contributed equally to this work.
2 1 4 | N A T U R E | V O L 4 7 0 | 1 0 F E B R U A R Y 2 0 1 1
Macmillan Publishers Limited. All rights reserved©2011

Point Mutation rate
M F. Berger et al. Nature 470, 214-220 (2011)
0.9 mutation per megabase

M F. Berger et al. Nature 470, 214-220 (2011)
Graphical representation of the first seven sequenced prostate cancer genomes
TMPRSS2-ERG positive

Complex structural rearrangements in prostate cancer
M F. Berger et al. Nature 470, 214-220 (2011)

Disruption of CADM2 and the PTEN pathway by rearrangements
M F. Berger et al. Nature 470, 214-220 (2011)
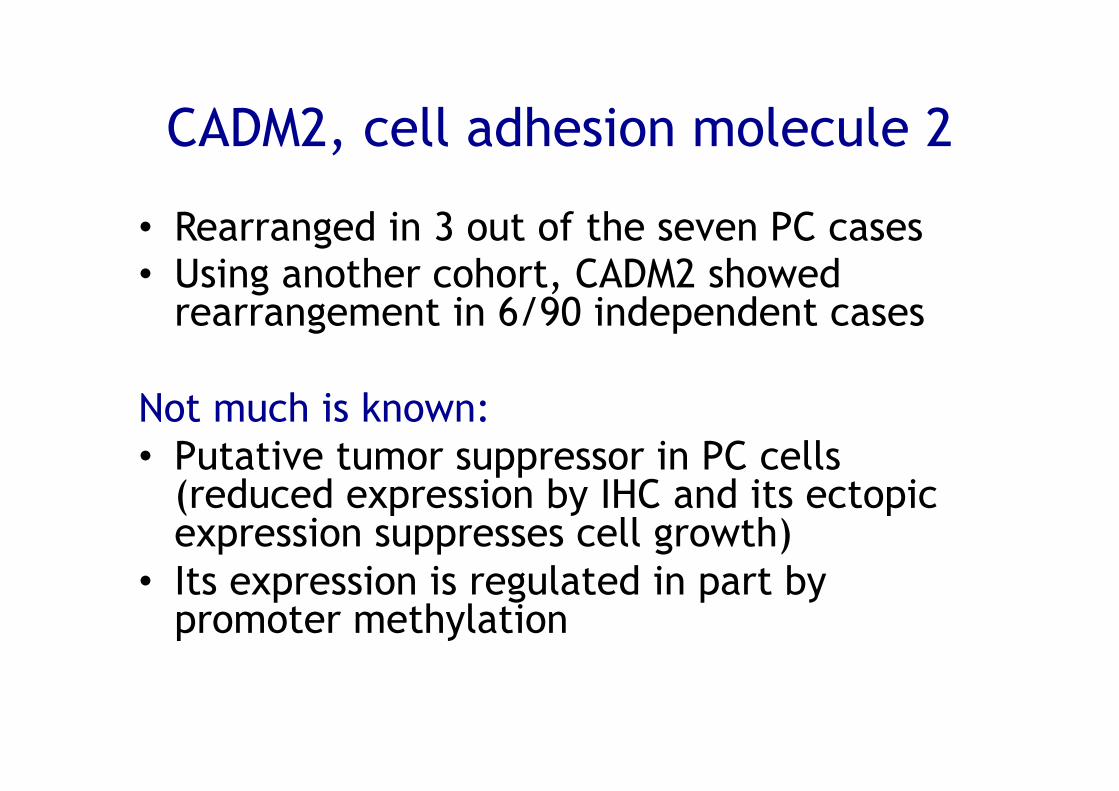
CADM2, cell adhesion molecule 2
• Rearranged in 3 out of the seven PC cases • Using another cohort, CADM2 showed
rearrangement in 6/90 independent cases
Not much is known: • Putative tumor suppressor in PC cells
(reduced expression by IHC and its ectopic expression suppresses cell growth)
• Its expression is regulated in part by promoter methylation
Rearrangements disrupting PTEN and MAGI2
• Rearranged in 4 out of the seven PC cases, including all three tumors with TMPRSS2-ERG rearrangements.
• MAGI2 (membrane associated guanylate kinase, WW and PDZ domain containing 2) is PTEN-interacting protein.
• Using another cohort, MAGI2 showed rearrangement in 3/88 independent cases.
• Direct or indirect loss of PTEN function thus dysregulating PI3 kinase pathway in PC

Association between rearrangement breakpoints and genomewide transcriptional/histone marks in PC
M F. Berger et al. Nature 470, 214-220 (2011)
TMPRSS2-‐ERG

LETTERdoi:10.1038/nature11125
The mutational landscape of lethalcastration-resistant prostate cancerCatherine S. Grasso1,2*, Yi-Mi Wu1,2*, Dan R. Robinson1,2*, Xuhong Cao1,3, Saravana M. Dhanasekaran1,2, Amjad P. Khan1,2,Michael J. Quist1,2, Xiaojun Jing1,2, Robert J. Lonigro1,4, J. Chad Brenner1, Irfan A. Asangani1,2, Bushra Ateeq1,2, Sang Y. Chun1,Javed Siddiqui1,2, Lee Sam1, Matt Anstett5, Rohit Mehra1,2, John R. Prensner1,2, Nallasivam Palanisamy1,2,4, Gregory A. Ryslik6,Fabio Vandin7, Benjamin J. Raphael7, Lakshmi P. Kunju1,2, Daniel R. Rhodes1,2,5, Kenneth J. Pienta1,4,8,9, Arul M. Chinnaiyan1,2,3,4,9
& Scott A. Tomlins1,2
Characterization of the prostate cancer transcriptome and genomehas identified chromosomal rearrangements and copy numbergains and losses, including ETS gene family fusions, PTEN lossand androgen receptor (AR) amplification, which drive prostatecancer development and progression to lethal, metastatic castration-resistant prostate cancer (CRPC)1. However, less is known about therole of mutations2–4. Here we sequenced the exomes of 50 lethal,heavily pre-treated metastatic CRPCs obtained at rapid autopsy(including three different foci from the same patient) and 11treatment-naive, high-grade localized prostate cancers. We iden-tified low overall mutation rates even in heavily treated CRPCs(2.00 per megabase) and confirmed the monoclonal origin of lethalCRPC. Integrating exome copy number analysis identified disrup-tions of CHD1 that define a subtype of ETS gene family fusion-negative prostate cancer. Similarly, we demonstrate that ETS2,which is deleted in approximately one-third of CRPCs (commonlythrough TMPRSS2:ERG fusions), is also deregulated throughmutation. Furthermore, we identified recurrent mutations inmultiple chromatin- and histone-modifying genes, includingMLL2 (mutated in 8.6% of prostate cancers), and demonstrateinteraction of the MLL complex with the AR, which is requiredfor AR-mediated signalling. We also identified novel recurrentmutations in the AR collaborating factor FOXA1, which is mutatedin 5 of 147 (3.4%) prostate cancers (both untreated localized pro-state cancer and CRPC), and showed that mutated FOXA1 repressesandrogen signalling and increases tumour growth. Proteins thatphysically interact with the AR, such as the ERG gene fusionproduct, FOXA1, MLL2, UTX (also known as KDM6A) and ASXL1were found to be mutated in CRPC. In summary, we describe themutational landscape of a heavily treated metastatic cancer, identifynovel mechanisms of AR signalling deregulated in prostate cancer,and prioritize candidates for future study.
Although localized prostate cancer is highly curable, more than32,000 US men die annually of metastatic disease. Androgen-deprivationtherapy results in rapid responses in men with metastatic prostatecancer; however, nearly all patients eventually progress to CRPC.Although CRPC was thought to be androgen-signalling independent,recent evidence demonstrates that androgen signalling is often main-tained through varied mechanisms (reviewed in refs 1, 5). Gene expres-sion and copy number profiling studies have identified recurrentgene fusions, chromosomal gains and losses, and deregulated pathwaysin prostate cancer1. Resequencing studies have characterized themutational spectrum of prostate cancer3,4,6, and the genomes of seven
localized prostate cancers have been reported7. More recently, theexomes of xenografts from 16 CRPC cases were reported2.
We sequenced the exomes of 50 lethal heavily pre-treated CRPCs(patient identifiers WA2–WA60) obtained at rapid autopsy8, includ-ing three distinct sites in the same patient, and 11 treatment-naive,high-grade localized prostate cancers (patient identifiers T1–T97)(Supplementary Table 1). Sequencing results, including coveragestatistics, mutation rates, validation rates, mutational spectrum, con-firmation of the monoclonal origin of CRPC, and overlap with muta-tions observed in previous studies are provided in SupplementaryResults, Supplementary Figs 1–6 and Supplementary Tables 2–6.
We used exome sequencing data to identify somatic copy numberalterations9 (see Methods, Supplementary Fig. 7 and SupplementaryTables 7–9), and as shown in Supplementary Fig. 8 we identifiedrecurrent aberrations previously associated with prostate cancerdevelopment and progression (Supplementary Results). We additionallyperformed array comparative genome hybridization (aCGH) copynumber and gene expression profiling on a matched cohort of benignprostate tissues, localized prostate cancers (3/59 sequenced) and 35CRPCs (31/35 sequenced) (Supplementary Table 10). Profiles wereuploaded into Oncomine (http://www.oncomine.com) for automateddata processing, analysis and visualization, and are available for explora-tion. aCGH profiles were similar to copy number analysis by exomesequencing and to other prostate cancer profiling studies available inOncomine (Supplementary Fig. 9). Global gene expression profiles weresimilar to previous studies (analyses available in Oncomine), with excep-tions described in Supplementary Results and Supplementary Fig. 10.Finally, we performed transcriptome sequencing of 11 prostate cancercell lines to identify likely somatic variants (see Supplementary Results,Supplementary Methods and Supplementary Tables 11–15).
From our exome data, we identified nine genes that were significantlymutated (false discovery rate # 0.10) (Fig. 1 and Supplementary Tables16 and 4), six of which have been reported as recurrently mutated inprostate cancer: TP53, AR, ZFHX3, RB1, PTEN and APC. Three signifi-cantly mutated genes do not have described roles in prostate cancer:MLL2, OR5L1 and CDK12. MLL2 encodes a H3K4-specific histonemethyltransferase that is recurrently mutated in multiple cancers andCDK12 was recently identified as significantly mutated in ovarianserous carcinoma10. Additionally, using several approaches, we iden-tified multiple significantly mutated pathways, including WNT signal-ling and a PTEN interaction network (Supplementary Fig. 11 andSupplementary Tables 17 and 18); observations on significantly mutatedgenes and pathways are provided in the Supplementary Results.
*These authors contributed equally to this work.
1Michigan Center for Translational Pathology, University of Michigan Medical School, Ann Arbor, Michigan 48109, USA. 2Department of Pathology, University of Michigan Medical School, Ann Arbor,Michigan 48109, USA. 3Howard Hughes Medical Institute, University of Michigan Medical School, Ann Arbor, Michigan 48109, USA. 4Comprehensive Cancer Center, University of Michigan Medical School,Ann Arbor, Michigan 48109, USA. 5Compendia Bioscience, Ann Arbor, Michigan 48104, USA. 6Division of Biostatistics, Yale School of Public Health, New Haven, Connecticut 06520, USA. 7Department ofComputer Science & Center for Computational Molecular Biology, Brown University, Providence, Rhode Island 02912, USA. 8Department of Internal Medicine, University of Michigan Medical School, AnnArbor, Michigan 48109, USA. 9Department of Urology, University of Michigan Medical School, Ann Arbor, Michigan 48109, USA.
1 2 J U L Y 2 0 1 2 | V O L 4 8 7 | N A T U R E | 2 3 9
Macmillan Publishers Limited. All rights reserved©2012
Major findings in metastatic CRPCs
• Low overall mutation rate • Disruption of CHD1 that defines a subset
of ETS gene family fusion-negative PCs. • Recurrent mutations in multiple
chromatin and histone-modifying genes. • Identify novel mechanisms of AR signaling
deregulated in PCs; FOXA1 and MLL2.
CS Grasso et al. Nature 487, (2012)
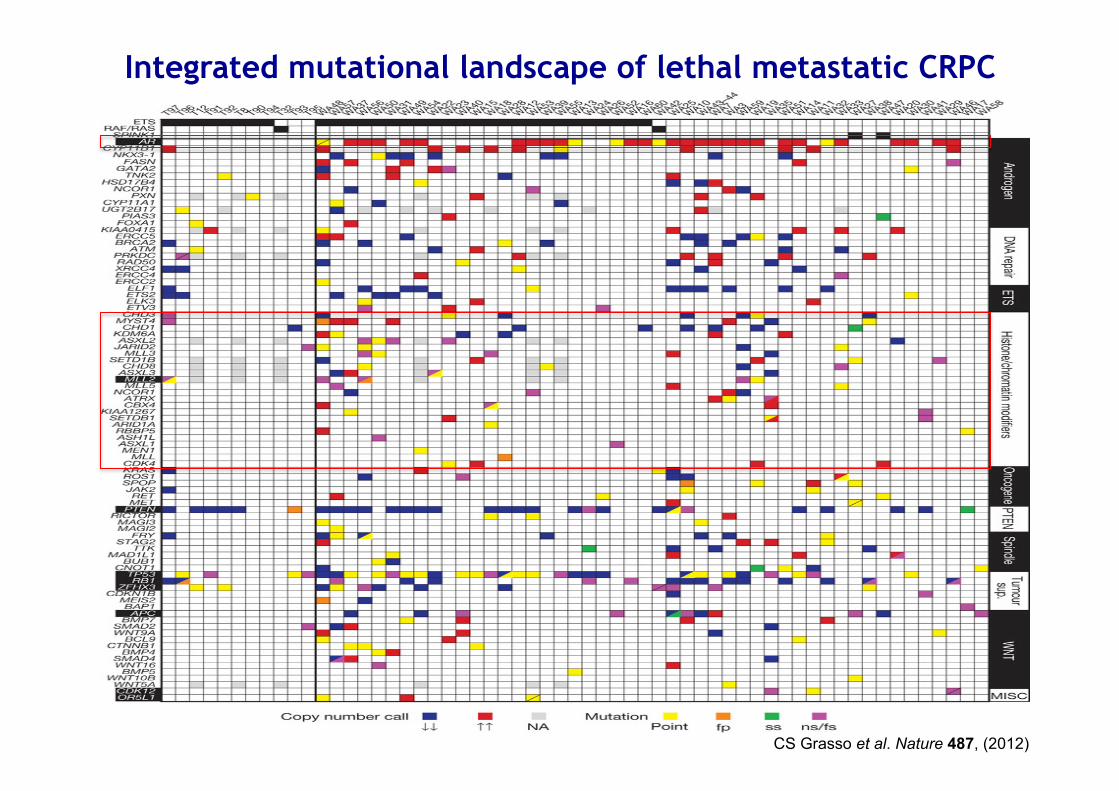
Integrated mutational landscape of lethal metastatic CRPC

CRPC harbours mutational aberrations in chromatin/histone modifiers that physically interact with the AR
CS Grasso et al. Nature 487, (2012)
Sum
med
Cop
y N
umbe
r Cal
ls in
CR
PC
and
PC
�
�
�
���
����
PTEN
AR
CHD1
PIK3CA
RB1TP53
NT5E
HOXA3Cluster
aFigure S8
Sum
med
Cop
y N
umbe
r Cal
ls in
CR
PC
�
�
�
���
����
Sum
med
Cop
y N
umbe
r Cal
ls in
PC
�
�
�
���
1 2 3 4 5 6 7 8 9 10 11 12 13 14 15 16 17 18 19 20 2122 X Y
1 2 3 4 5 6 7 8 9 10 11 12 13 14 15 16 17 18 19 20 2122 X Y
1 2 3 4 5 6 7 8 9 10 11 12 13 14 15 16 17 18 19 20 2122 X Y
PTEN
AR
CHD1
PIK3CA
RB1TP53NT5E
HOXA3Cluster
b
c
PTEN
AR
CHD1
PIK3CA
RB1 TP53NT5E
HOXA3Cluster
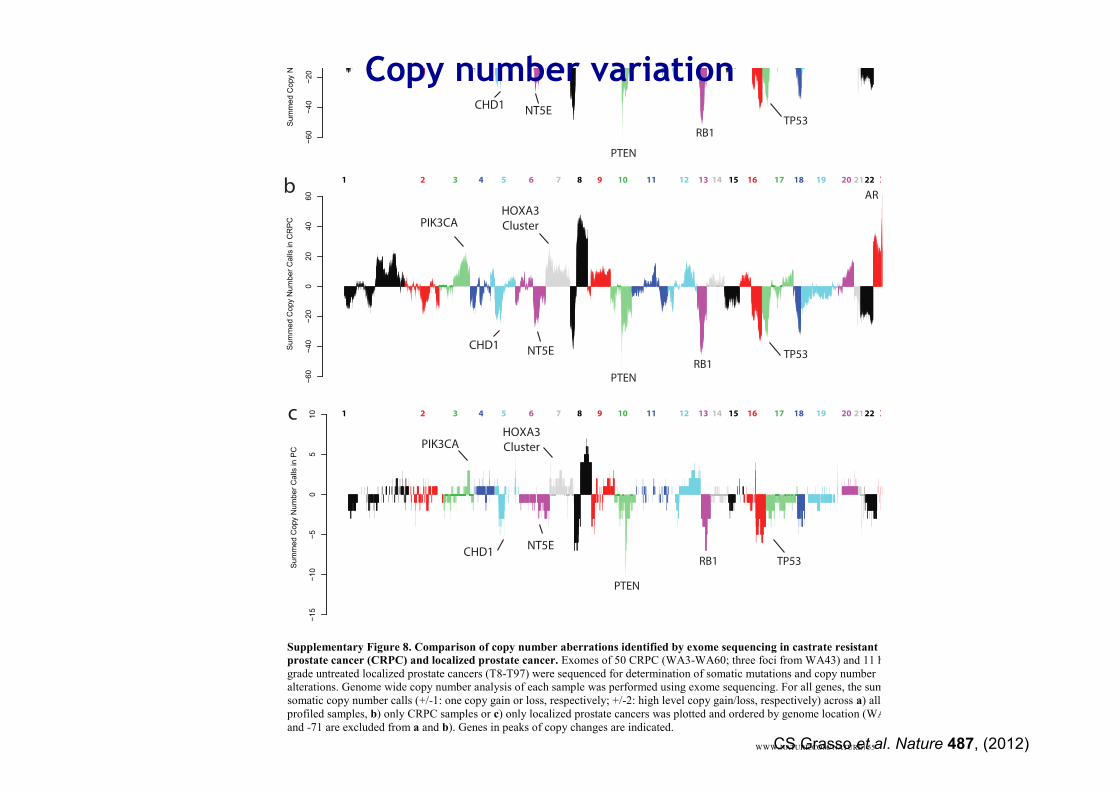
Supplementary Figure 8. Comparison of copy number aberrations identified by exome sequencing in castrate resistant
prostate cancer (CRPC) and localized prostate cancer. Exomes of 50 CRPC (WA3-WA60; three foci from WA43) and 11 high-grade untreated localized prostate cancers (T8-T97) were sequenced for determination of somatic mutations and copy number alterations. Genome wide copy number analysis of each sample was performed using exome sequencing. For all genes, the sum of somatic copy number calls (+/-1: one copy gain or loss, respectively; +/-2: high level copy gain/loss, respectively) across a) all profiled samples, b) only CRPC samples or c) only localized prostate cancers was plotted and ordered by genome location (WA43-24 and -71 are excluded from a and b). Genes in peaks of copy changes are indicated.
Sum
med
Cop
y N
umbe
r Cal
ls in
CR
PC
and
PC
�
�
�
���
����
PTEN
AR
CHD1
PIK3CA
RB1TP53
NT5E
HOXA3Cluster
aFigure S8
Sum
med
Cop
y N
umbe
r Cal
ls in
CR
PC
�
�
�
���
����
Sum
med
Cop
y N
umbe
r Cal
ls in
PC
�
�
�
���
1 2 3 4 5 6 7 8 9 10 11 12 13 14 15 16 17 18 19 20 2122 X Y
1 2 3 4 5 6 7 8 9 10 11 12 13 14 15 16 17 18 19 20 2122 X Y
1 2 3 4 5 6 7 8 9 10 11 12 13 14 15 16 17 18 19 20 2122 X Y
PTEN
AR
CHD1
PIK3CA
RB1TP53NT5E
HOXA3Cluster
b
c
PTEN
AR
CHD1
PIK3CA
RB1 TP53NT5E
HOXA3Cluster
Supplementary Figure 8. Comparison of copy number aberrations identified by exome sequencing in castrate resistant
prostate cancer (CRPC) and localized prostate cancer. Exomes of 50 CRPC (WA3-WA60; three foci from WA43) and 11 high-grade untreated localized prostate cancers (T8-T97) were sequenced for determination of somatic mutations and copy number alterations. Genome wide copy number analysis of each sample was performed using exome sequencing. For all genes, the sum of somatic copy number calls (+/-1: one copy gain or loss, respectively; +/-2: high level copy gain/loss, respectively) across a) all profiled samples, b) only CRPC samples or c) only localized prostate cancers was plotted and ordered by genome location (WA43-24 and -71 are excluded from a and b). Genes in peaks of copy changes are indicated.
WWW.NATURE.COM/ NATURE | 55CS Grasso et al. Nature 487, (2012)
Copy number variation

CS Grasso et al. Nature 487, (2012)
Integrated mutational landscape of lethal metastatic CRPC
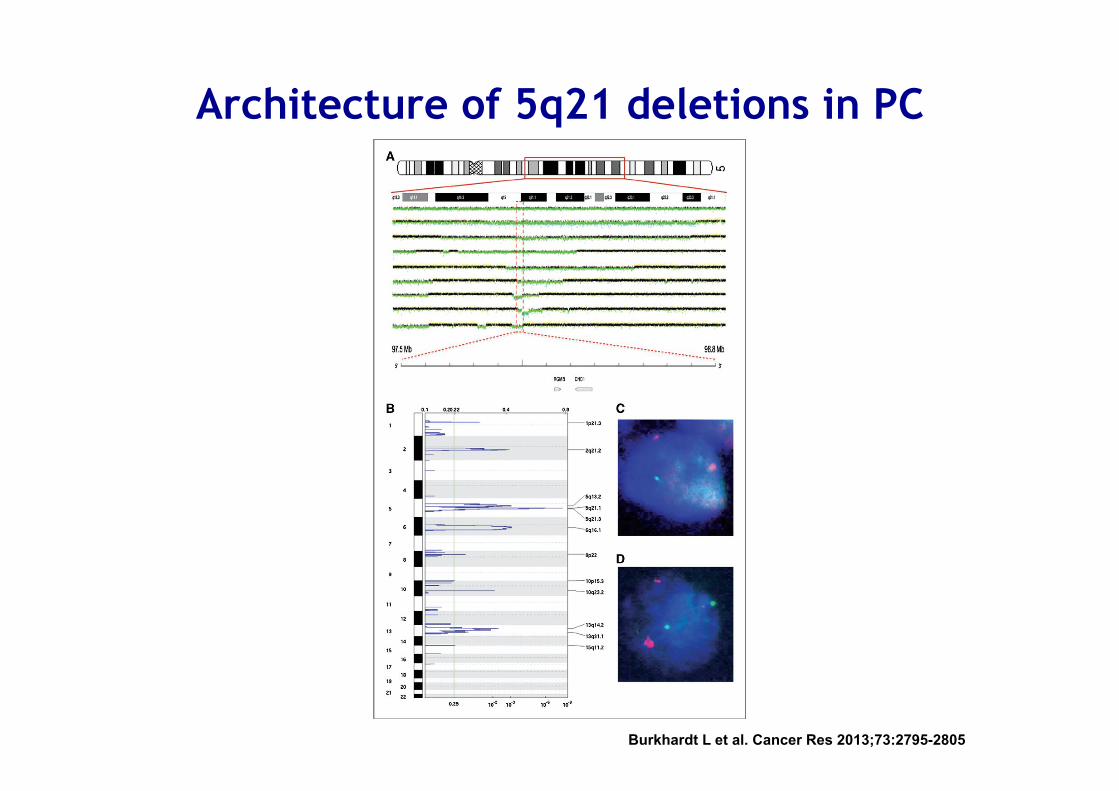
Architecture of 5q21 deletions in PC
Burkhardt L et al. Cancer Res 2013;73:2795-2805

Copy
Num
ber
(Sum
log2
Cop
y N
umbe
r)
a
PJA2
Benign ProstateLocalized PCCastrate Resitant PC
5q21
T65
d
Figure S13
01020304050607080910111213141516171819202122XY
0.51 >2.00
Copy Number
<-1.0 0(Log2)
(Abs Log2)
b
1.0
0.5
0
-0.5
-1.0
-1.5
T65T56T53T45T43T42
WA7WA47WA42
WA3WA19WA14WA10WA24WA54WA53WA40WA37WA18
1510
50
-5-10
-20-15
chr5q21
c
ETS+
No ETS
No ETS/CHD1-
Copy Number (Sum log2 Copy Number)aCGH
No ETS/5q21-
(Log2) -8 8 NA
N9
N21
N
16
N22
N
23
N11
N
7 N
26
N19
N
5 N
2 N
29
N10
N
20
N27
N
6 N
8 N
15
N17
N
1 N
18
N24
N
12
N4
N28
N
13
N25
N
14
WA4
W
A39
WA1
3 T
19
T62
T
8 T
60
WA5
3 T
54
WA2
T
11
T17
W
A28
WA5
5 T
50
T5
T59
T
44
T75
T
68
T51
T
83
T69
W
A6
T70
T
12
T46
W
A54
T82
W
A31
T64
T
41
WA1
8 W
A37
T73
T
48
WA4
0 W
A16
T63
T
85
T39
W
A22
WA2
4 W
A23
T20
W
A26
T57
T
52
T3
T9a
T
10
WA7
T
45
WA1
0 T
42
T43
T
65
WA1
9 T
53
T37
T
58
T55
T
26
T61
T
67
WA3
2 T
40
WA5
W
A20
T21
T
6 W
A33
WA1
4 W
A47
T56
T
27
T49
T
29
T32
T
25
WA3
5 T
66
T31
T
24
T47
W
A3
WA2
5 T
1 T
7 W
A46
WA2
9 W
A11
WA4
2 W
A30
ETS+
CHD1-
CHD1
ERG
ETV1
ETV5
SPINK1
LNPE
P
LIX1
RIO
K2
RGM
B
CHD
1
FAM
174A
ST8S
IA4
SLCO
4C1
SLCO
6A1
PAM
GIN
1
PPIP
5K2
C5O
RF30
NU
DT1
2
EFN
A5
FBXL
17 FER
PJA2
MAN
2A1
TMEM
232
SLC2
5A26
TSLP
Cop
y N
umbe
r (Su
m lo
g2 C
opy
Num
ber)
5q21
T56 01020304050607080910111213141516171819202122XY
1.0
0.5
0
-0.5
-1.0
T65
ETS+/5q21-
Supplementary Figure 13. Deregulation of genes at 5q21, including CHD1, confirmed by matched aCGH and gene expression profiling. Genome wide copy number analysis of high-grade localized prostate cancer and castrate resistant prostate cancer by exome sequencing identified a peak of copy number loss on chr 5q21 centered on CHD1. A subset of samples used for exome sequencing, and additional benign prostate tissue (N1-29) and localized prostate cancers were used for matched aCGH and gene expression profiling. a. Genome wide analysis by aCGH identified a similar peak of copy number loss on 5q21 (upper panel, sum log2 copy number across all samples plotted) centered on CHD1. The expanded view is as in Figure 2a, except the area (absolute Log2 ratio) and color intensity (Log 2 ratio; copy number loss in blue) of each box are proportional to binned copy number for that gene according to the legend. ETS- and ETS+ samples are indicated in black or gray type, respectively. Samples with focal deletions of CHD1 (CHD1-) or other genes within 5q21 (5q21-) by aCGH are indicated with green or red background, respectively, according to the legend. The adjoining plot shows the genome wide copy number plot for T56, which harbors a focal, high level deletion on 5q21 including CHD1. b. Co-expression of CHD1 and ETS family members. Heatmap of CHD1, ETS genes (ERG, ETV1, ETV5) and SPINK1 gene expression. Samples are stratified by benign prostate tissue and prostate cancer (including localized and CRPC). ETS and CHD1 status was determined, with black and green indicating ETS+ and CHD1-, respectively. c. Genome wide copy number plot for T65, which shows focal, high level deletion of 5q21, including PJA2, but not CHD1. d. Expression of PJA2 stratified by benign prostate tissues (orange), localized prostate cancers (cyan) and CRPCs (black). T65 is indicated in red.
Copy
Num
ber
(Sum
log2
Cop
y N
umbe
r)
a
-4.0
-3.0
-2.0
-1.0
0.0
1.0
2.0PJA2
Benign ProstateLocalized PCCastrate Resitant PCG
ene
Expr
essi
on (
log2
med
ian-
cent
ered
rat
io)
5q21
T65
d
Figure S13
01020304050607080910111213141516171819202122XY
0.51 >2.00
Copy Number
<-1.0 0(Log2)
(Abs Log2)
b
1.0
0.5
0
-0.5
-1.0
-1.5
T65T56T53T45T43T42
WA7WA47WA42
WA3WA19WA14WA10WA24WA54WA53WA40WA37WA18
1510
50
-5-10
-20-15
chr5q21
c
ETS+
No ETS
No ETS/CHD1-
Copy Number (Sum log2 Copy Number)aCGH
No ETS/5q21-
(Log2) -8 8 NA
N9
N21
N
16
N22
N
23
N11
N
7 N
26
N19
N
5 N
2 N
29
N10
N
20
N27
N
6 N
8 N
15
N17
N
1 N
18
N24
N
12
N4
N28
N
13
N25
N
14
WA4
W
A39
WA1
3 T
19
T62
T
8 T
60
WA5
3 T
54
WA2
T
11
T17
W
A28
WA5
5 T
50
T5
T59
T
44
T75
T
68
T51
T
83
T69
W
A6
T70
T
12
T46
W
A54
T82
W
A31
T64
T
41
WA1
8 W
A37
T73
T
48
WA4
0 W
A16
T63
T
85
T39
W
A22
WA2
4 W
A23
T20
W
A26
T57
T
52
T3
T9a
T
10
WA7
T
45
WA1
0 T
42
T43
T
65
WA1
9 T
53
T37
T
58
T55
T
26
T61
T
67
WA3
2 T
40
WA5
W
A20
T21
T
6 W
A33
WA1
4 W
A47
T56
T
27
T49
T
29
T32
T
25
WA3
5 T
66
T31
T
24
T47
W
A3
WA2
5 T
1 T
7 W
A46
WA2
9 W
A11
WA4
2 W
A30
ETS+
CHD1-
CHD1
ERG
ETV1
ETV5
SPINK1
LNPE
P
LIX1
RIO
K2
RGM
B
CHD
1
FAM
174A
ST8S
IA4
SLCO
4C1
SLCO
6A1
PAM
GIN
1
PPIP
5K2
C5O
RF30
NU
DT1
2
EFN
A5
FBXL
17 FER
PJA2
MAN
2A1
TMEM
232
SLC2
5A26
TSLP
Cop
y N
umbe
r (Su
m lo
g2 C
opy
Num
ber)
5q21
T56 01020304050607080910111213141516171819202122XY
1.0
0.5
0
-0.5
-1.0
T65
ETS+/5q21-
Supplementary Figure 13. Deregulation of genes at 5q21, including CHD1, confirmed by matched aCGH and gene expression profiling. Genome wide copy number analysis of high-grade localized prostate cancer and castrate resistant prostate cancer by exome sequencing identified a peak of copy number loss on chr 5q21 centered on CHD1. A subset of samples used for exome sequencing, and additional benign prostate tissue (N1-29) and localized prostate cancers were used for matched aCGH and gene expression profiling. a. Genome wide analysis by aCGH identified a similar peak of copy number loss on 5q21 (upper panel, sum log2 copy number across all samples plotted) centered on CHD1. The expanded view is as in Figure 2a, except the area (absolute Log2 ratio) and color intensity (Log 2 ratio; copy number loss in blue) of each box are proportional to binned copy number for that gene according to the legend. ETS- and ETS+ samples are indicated in black or gray type, respectively. Samples with focal deletions of CHD1 (CHD1-) or other genes within 5q21 (5q21-) by aCGH are indicated with green or red background, respectively, according to the legend. The adjoining plot shows the genome wide copy number plot for T56, which harbors a focal, high level deletion on 5q21 including CHD1. b. Co-expression of CHD1 and ETS family members. Heatmap of CHD1, ETS genes (ERG, ETV1, ETV5) and SPINK1 gene expression. Samples are stratified by benign prostate tissue and prostate cancer (including localized and CRPC). ETS and CHD1 status was determined, with black and green indicating ETS+ and CHD1-, respectively. c. Genome wide copy number plot for T65, which shows focal, high level deletion of 5q21, including PJA2, but not CHD1. d. Expression of PJA2 stratified by benign prostate tissues (orange), localized prostate cancers (cyan) and CRPCs (black). T65 is indicated in red.
Copy
Num
ber
(Sum
log2
Cop
y N
umbe
r)
a
PJA2
Benign ProstateLocalized PCCastrate Resitant PC
5q21
T65
d
Figure S13
01020304050607080910111213141516171819202122XY
0.51 >2.00
Copy Number
<-1.0 0(Log2)
(Abs Log2)
b
1.0
0.5
0
-0.5
-1.0
-1.5
T65T56T53T45T43T42
WA7WA47WA42
WA3WA19WA14WA10WA24WA54WA53WA40WA37WA18
1510
50
-5-10
-20-15
chr5q21
c
ETS+
No ETS
No ETS/CHD1-
Copy Number (Sum log2 Copy Number)aCGH
No ETS/5q21-
(Log2) -8 8 NA
N9
N21
N
16
N22
N
23
N11
N
7 N
26
N19
N
5 N
2 N
29
N10
N
20
N27
N
6 N
8 N
15
N17
N
1 N
18
N24
N
12
N4
N28
N
13
N25
N
14
WA4
W
A39
WA1
3 T
19
T62
T
8 T
60
WA5
3 T
54
WA2
T
11
T17
W
A28
WA5
5 T
50
T5
T59
T
44
T75
T
68
T51
T
83
T69
W
A6
T70
T
12
T46
W
A54
T82
W
A31
T64
T
41
WA1
8 W
A37
T73
T
48
WA4
0 W
A16
T63
T
85
T39
W
A22
WA2
4 W
A23
T20
W
A26
T57
T
52
T3
T9a
T
10
WA7
T
45
WA1
0 T
42
T43
T
65
WA1
9 T
53
T37
T
58
T55
T
26
T61
T
67
WA3
2 T
40
WA5
W
A20
T21
T
6 W
A33
WA1
4 W
A47
T56
T
27
T49
T
29
T32
T
25
WA3
5 T
66
T31
T
24
T47
W
A3
WA2
5 T
1 T
7 W
A46
WA2
9 W
A11
WA4
2 W
A30
ETS+
CHD1-
CHD1
ERG
ETV1
ETV5
SPINK1
LNPE
P
LIX1
RIO
K2
RGM
B
CHD
1
FAM
174A
ST8S
IA4
SLCO
4C1
SLCO
6A1
PAM
GIN
1
PPIP
5K2
C5O
RF30
NU
DT1
2
EFN
A5
FBXL
17 FER
PJA2
MAN
2A1
TMEM
232
SLC2
5A26
TSLP
Cop
y N
umbe
r (Su
m lo
g2 C
opy
Num
ber)
5q21
T56 01020304050607080910111213141516171819202122XY
1.0
0.5
0
-0.5
-1.0
T65
ETS+/5q21-
Supplementary Figure 13. Deregulation of genes at 5q21, including CHD1, confirmed by matched aCGH and gene expression profiling. Genome wide copy number analysis of high-grade localized prostate cancer and castrate resistant prostate cancer by exome sequencing identified a peak of copy number loss on chr 5q21 centered on CHD1. A subset of samples used for exome sequencing, and additional benign prostate tissue (N1-29) and localized prostate cancers were used for matched aCGH and gene expression profiling. a. Genome wide analysis by aCGH identified a similar peak of copy number loss on 5q21 (upper panel, sum log2 copy number across all samples plotted) centered on CHD1. The expanded view is as in Figure 2a, except the area (absolute Log2 ratio) and color intensity (Log 2 ratio; copy number loss in blue) of each box are proportional to binned copy number for that gene according to the legend. ETS- and ETS+ samples are indicated in black or gray type, respectively. Samples with focal deletions of CHD1 (CHD1-) or other genes within 5q21 (5q21-) by aCGH are indicated with green or red background, respectively, according to the legend. The adjoining plot shows the genome wide copy number plot for T56, which harbors a focal, high level deletion on 5q21 including CHD1. b. Co-expression of CHD1 and ETS family members. Heatmap of CHD1, ETS genes (ERG, ETV1, ETV5) and SPINK1 gene expression. Samples are stratified by benign prostate tissue and prostate cancer (including localized and CRPC). ETS and CHD1 status was determined, with black and green indicating ETS+ and CHD1-, respectively. c. Genome wide copy number plot for T65, which shows focal, high level deletion of 5q21, including PJA2, but not CHD1. d. Expression of PJA2 stratified by benign prostate tissues (orange), localized prostate cancers (cyan) and CRPCs (black). T65 is indicated in red.
WWW.NATURE.COM/ NATURE | 60
CHD1 deregulation deletion in ETS fusion negative PCs

CHROMODOMAIN HELICASE DNA-BINDING PROTEIN 1 (CHD1)
• Encodes an ATP chromatin-remodeling enzyme • CHD1 is involved in assembly, shifting and
removal of nucleosomes from the DNA double helix to keep it in an open and transcriptionally active state
• CHD1 is essential to maintain open chromatin of pluripotent embryonic stem cells.
• It associates with the promoters of active genes through binding to the H3K4-trimetylated histones.

Effect of CHD1 depletion on the transcription of AR-dependent genes
Burkhardt L et al. Cancer Res 2013;73:2795-2805

Effect of CHD1 on expression of known tumor suppressor genes of prostate cancer cells
Burkhardt L et al. Cancer Res 2013;73:2795-2805
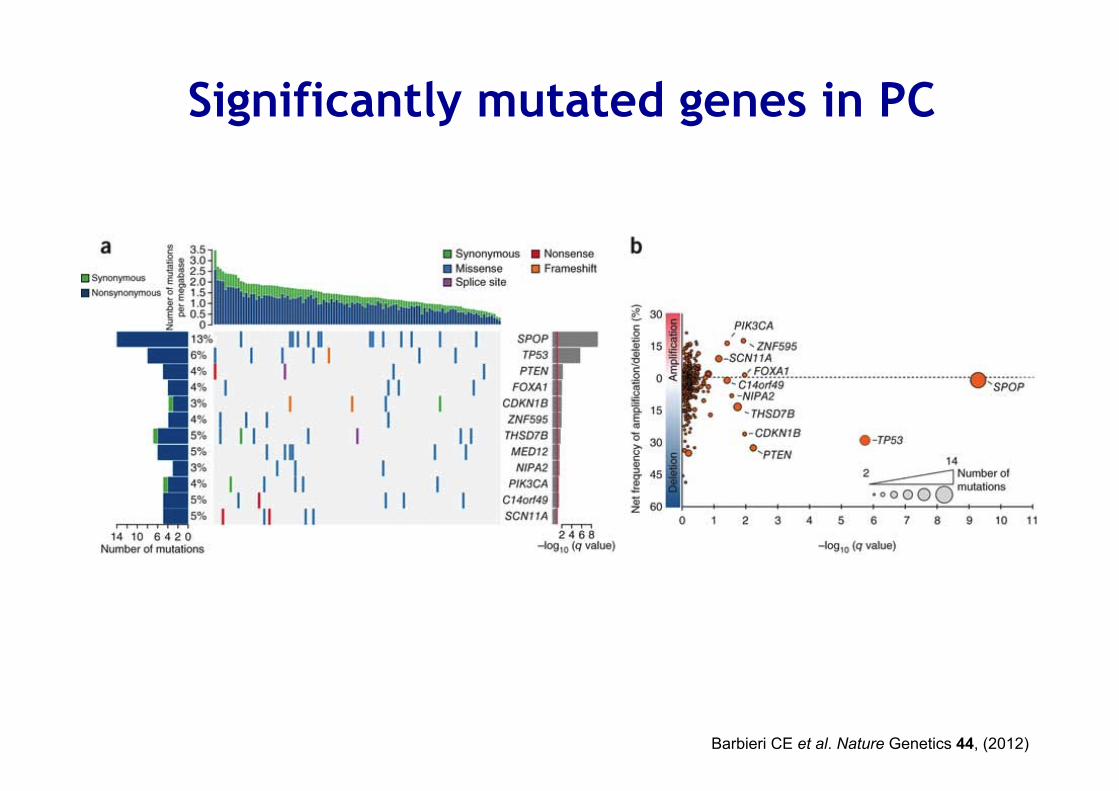
Significantly mutated genes in PC
Barbieri CE et al. Nature Genetics 44, (2012)
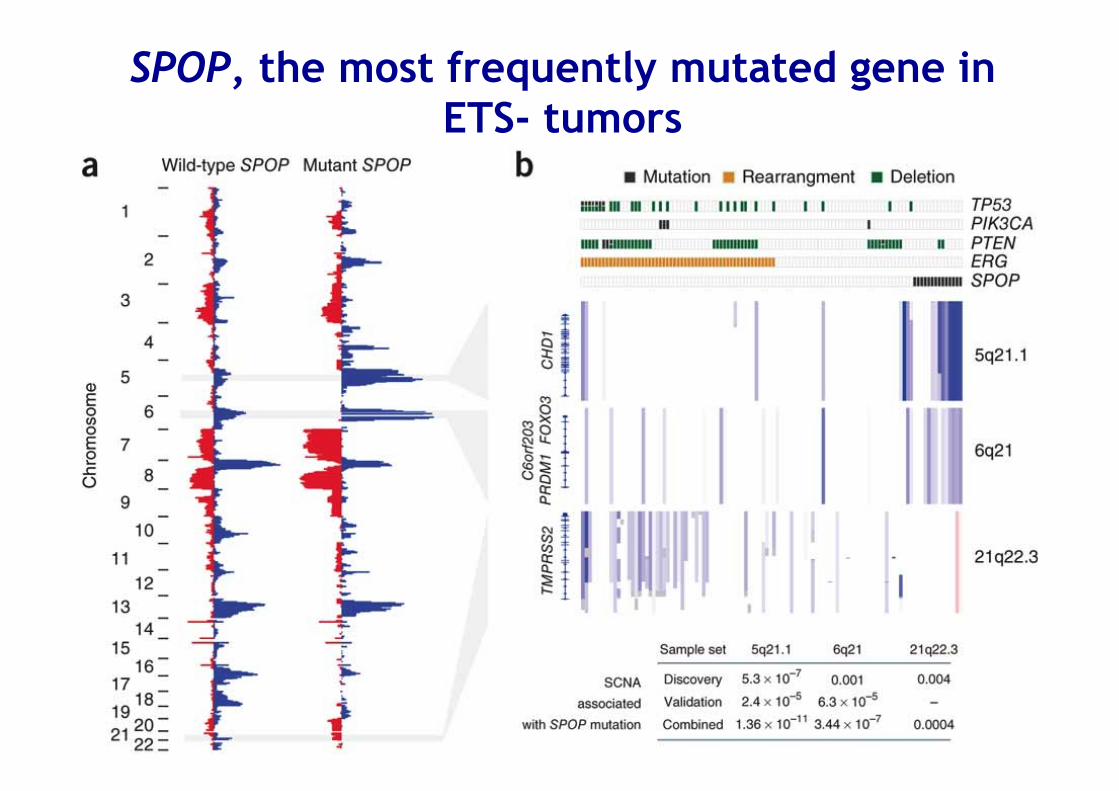
SPOP, the most frequently mutated gene in ETS- tumors

Recurrent mutations in the AR collaborating factor FOXA1 promote tumour growth and affect AR signalling
CS Grasso et al. Nature 487, (2012)
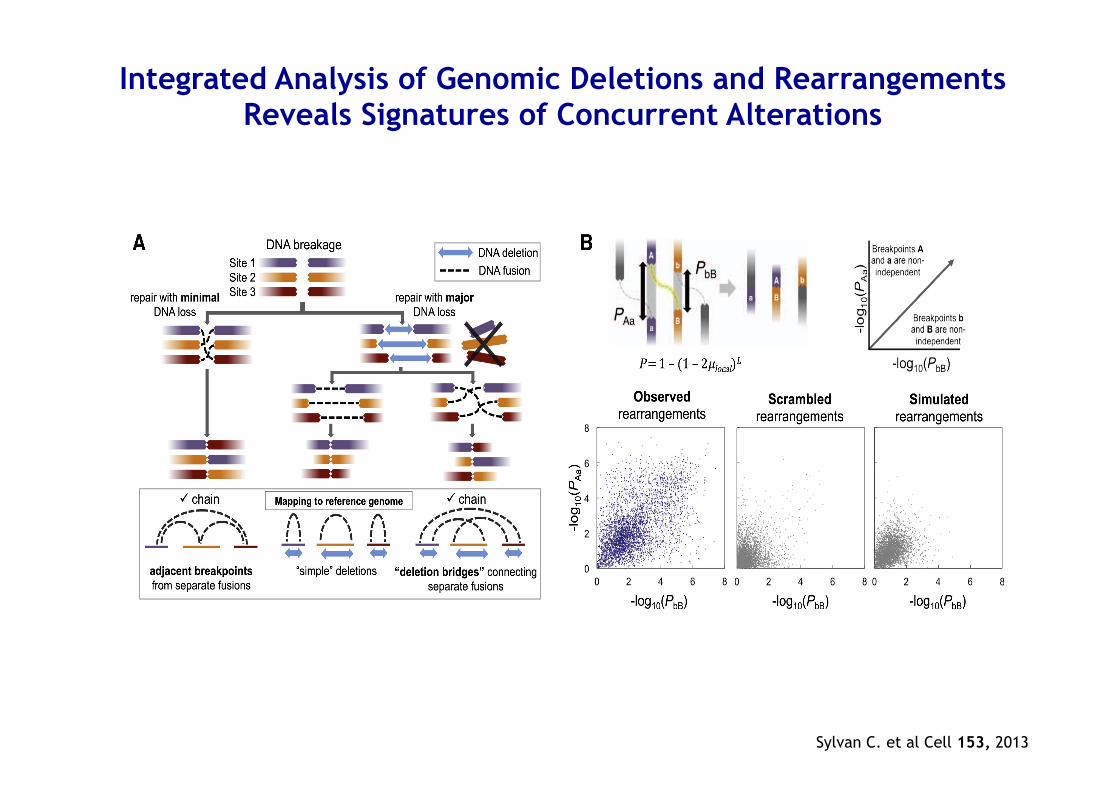
Integrated Analysis of Genomic Deletions and Rearrangements Reveals Signatures of Concurrent Alterations
Sylvan C. et al Cell 153, 2013

Chromoplexy • Interdependent genomic restructuring driving
prostate cancer progression
• A complex chains of DNA rearrangements accompanied by significant DNA deletions that spanned breakpoints from distinct fusions
• Is prevalent in highly expressed genomic regions of ETS fusion–positive prostate tumors
• Induce coordinated dysregulation of multiple cancer genes, including deletion of tumor suppressors and generation of oncogenic ETS fusions
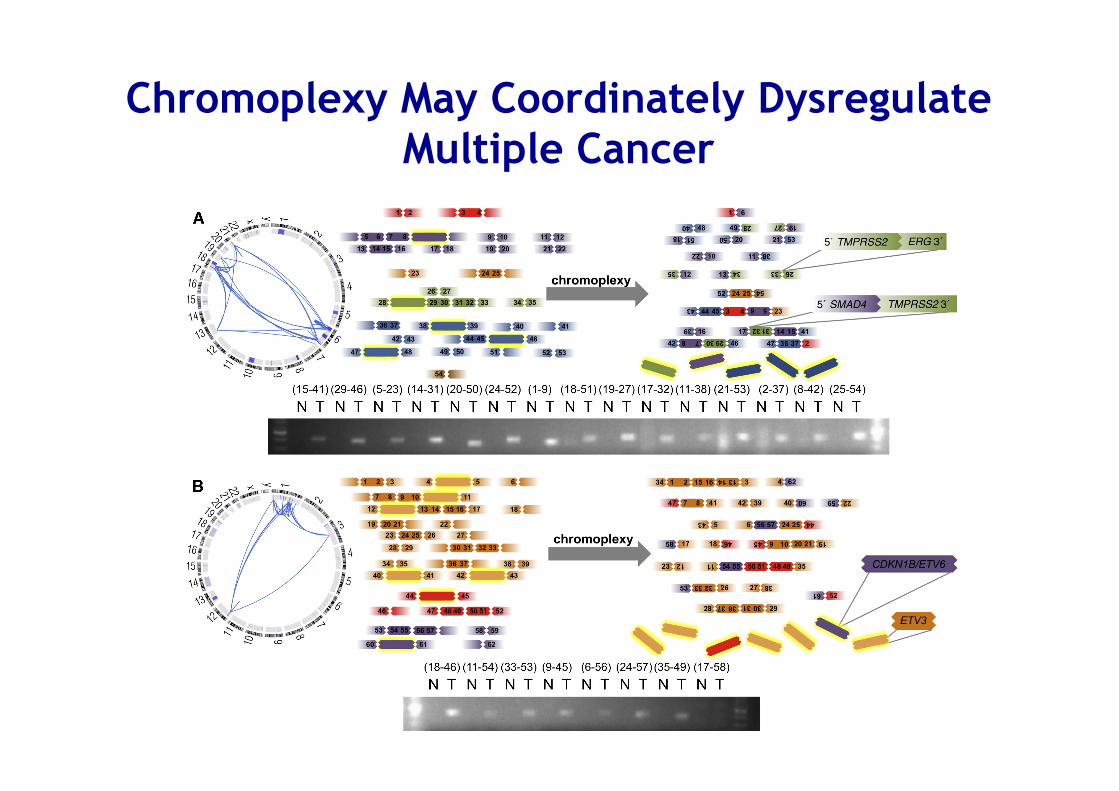
Chromoplexy May Coordinately Dysregulate Multiple Cancer

Source: Cell , 2011 Volume 144, Issue 1, Pages 27-‐40 (DOI:10.1016/j.cell.2010.11.055)
Chromotripsis: A massive genomic rearrangement acquired in a single catastrophic event during
cancer development

Manifestations of Chromoplexy Vary by ETS Fusion Status
Sylvan C. et al Cell 153, 2013

A Continuum Model for the Genomic Evolution of Prostate Cancer
Sylvan C. et al Cell 153, 2013
Conclusions • Low overall point mutation rate
• High prevalence of complex structural rearrangements; closed chain and copy neutral (Chromoplexy)
• Many rearrangements may occur preferentially in genes that are localized with transcriptional or chromatin compartments
• Novel mechanisms of AR signaling deregulation in PC & new subsets of ETS-/CHD1- tumors

Your best bid!