the genomic landscape of pediatric ewing sarcoma · the sequencing of cancer genomes in aggressive...
TRANSCRIPT

The Genomic Landscape of Pediatric Ewing Sarcoma Brian D. Crompton 1 , Chip Stewart 2 , Amaro Taylor-Weiner 2 , Gabriela Alexe 1,2,3 , Kyle C. Kurek 4 , Monica L. Calicchio 4 , Adam Kiezun 2 , Scott L. Carter 2 , Sachet A. Shukla 5 , Swapnil S. Mehta 1 , Aaron R. Thorner 1 , Carmen de Torres 6 , Cinzia Lavarino 6 , Mariona Suñol 6 , Aaron McKenna 2 , Andrey Sivachenko 2 , Kristian Cibulskis 2 , Michael S. Lawrence 2 , Petar Stojanov 2,7 , Mara Rosenberg 2 , Lauren Ambrogio 2 , Daniel Auclair 2 , Sara Seepo 2 , Brendan Blumenstiel 2 , Matthew DeFelice 2 , Ivan Imaz-Rosshandler 8 , Angela Schwarz-Cruz y Celis 8 , Miguel N. Rivera 2,9 , Carlos Rodriguez-Galindo 1 , Mark D. Fleming 4 , Todd R. Golub 1,2 , Gad Getz 2,9,10 , Jaume Mora 6 , and Kimberly Stegmaier 1,2
RESEARCH ARTICLE
on January 6, 2020. © 2014 American Association for Cancer Research. cancerdiscovery.aacrjournals.org Downloaded from
Published OnlineFirst September 3, 2014; DOI: 10.1158/2159-8290.CD-13-1037

NOVEMBER 2014�CANCER DISCOVERY | 1327
ABSTRACT Pediatric Ewing sarcoma is characterized by the expression of chimeric fusions of
EWS and ETS family transcription factors, representing a paradigm for studying
cancers driven by transcription factor rearrangements. In this study, we describe the somatic landscape
of pediatric Ewing sarcoma. These tumors are among the most genetically normal cancers character-
ized to date, with only EWS – ETS rearrangements identifi ed in the majority of tumors . STAG2 loss, how-
ever, is present in more than 15% of Ewing sarcoma tumors; occurs by point mutation, rearrangement,
and likely nongenetic mechanisms; and is associated with disease dissemination. Perhaps the most
striking fi nding is the paucity of mutations in immediately targetable signal transduction pathways,
highlighting the need for new therapeutic approaches to target EWS – ETS fusions in this disease.
SIGNIFICANCE: We performed next-generation sequencing of Ewing sarcoma, a pediatric cancer
involving bone, characterized by expression of EWS – ETS fusions. We found remarkably few mutations.
However, we discovered that loss of STAG2 expression occurs in 15% of tumors and is associated with
metastatic disease, suggesting a potential genetic vulnerability in Ewing sarcoma . Cancer Discov; 4(11);
1326–41. ©2014 AACR.
1 Department of Pediatric Oncology, Dana-Farber Cancer Institute and Boston Children’s Hospital, Boston, Massachusetts . 2 Eli and Edythe L. Broad Institute, Cambridge, Massachusetts. 3 Bioinformatics Graduate Program, Boston University, Boston, Massachusetts. 4 Department of Pathology, Boston Children’s Hospital, Boston, Massachusetts. 5 Cancer Vaccine Center, Dana-Farber Cancer Institute, Boston, Massachusetts. 6 Department of Pediatric Oncology, Hospital Sant Joan de Déu, Barcelona, Spain. 7 Department of Medical Oncology, Dana-Farber Cancer Institute, Boston, Massachusetts. 8 Instituto Nacional de Medicina Genómica, Mexico City, Mexico. 9 Department of Pathology, Massachusetts General Hospital, Boston, Massachusetts. 10 Massachusetts General Hospital Cancer Center, Massachusetts General Hospital, Boston, Massachusetts.
Note: Supplementary data for this article are available at Cancer Discovery Online (http://cancerdiscovery.aacrjournals.org/).
B.D. Crompton and C. Stewart contributed equally to this article.
G. Getz, J. Mora, and K. Stegmaier jointly directed this work.
Corresponding Author: Kimberly Stegmaier, Dana-Farber Cancer Institute, 450 Brookline Avenue, D630, Boston, MA 02215. Phone: 617-632-4438; Fax: 617-632-4850; E-mail: [email protected]
doi: 10.1158/2159-8290.CD-13-1037
©2014 American Association for Cancer Research.
INTRODUCTION The sequencing of cancer genomes in aggressive pediatric
solid tumors, such as rhabdoid tumors and retinoblastoma,
has revealed remarkably stable genomes ( 1, 2 ). In both cases,
oncogenesis is thought, at least in part, to be driven by epi-
genetic deregulation. It has been hypothesized that pediatric
solid tumors notable for recurrent translocations involving
transcription factors will also have relatively stable genomes,
as has already been observed in acute myeloid leukemia and
rhabdomyosarcoma with recurrent cytogenetic transloca-
tions ( 3, 4 ). Studies to systematically address this hypothesis
are just beginning to emerge. Ewing sarcoma is an aggressive,
poorly differentiated tumor, typically arising from bone, and
is characterized by highly recurrent translocations involv-
ing ETS transcription factors, with EWS – FLI and EWS – ERG
translocations being the most common ( 5, 6 ). Ewing sarcoma
cells have a strict dependency on EWS–ETS fusion proteins,
supporting the notion that these translocations are a critical
oncogenic event in this disease ( 7 ). Although the EWS – FLI
rearrangement was described over 20 years ago, effective
therapy directly targeting this transcription factor abnormal-
ity has yet to be developed. New therapeutic strategies for
this disease are needed because the vast majority of children
with metastatic or relapsed Ewing sarcoma will die despite
intensive, multimodality therapy ( 8, 9 ). Moreover, even for
children who are cured, the long-term morbidity of cytotoxic
treatment is signifi cant ( 10 ).
Efforts to discover collaborating, and potentially targeta-
ble, genetic alterations in Ewing sarcoma tumors have pri-
marily focused on the study of copy-number alterations, with
several studies reporting copy-number gains of chromosome
8 in nearly 50% of tumors ( 11 ). However, with the exception
of focal deletions at the CDKN2A locus on 9p21, specifi c
genes of relevance have yet to be elucidated from these studies
( 12, 13 ). Furthermore, few recurrent somatic mutations have
been reported in Ewing sarcoma, with the notable exceptions
of TP53 (5%–20%) and more recently the cohesin complex
family member STAG2 (20%), with neither of these immi-
nently druggable ( 13–16 ). We sought to defi ne the genomic
landscape of pediatric Ewing sarcoma by integrating multiple
next-generation sequencing methods applied to a large panel
of human Ewing sarcoma tumors.
RESULTS Massively Parallel Sequencing of Ewing Sarcoma
We collected 116 pediatric Ewing sarcoma tumors from
112 patients and extracted high-quality DNA from 96 tumors
for sequencing, including 4 patients with multiple tumors.
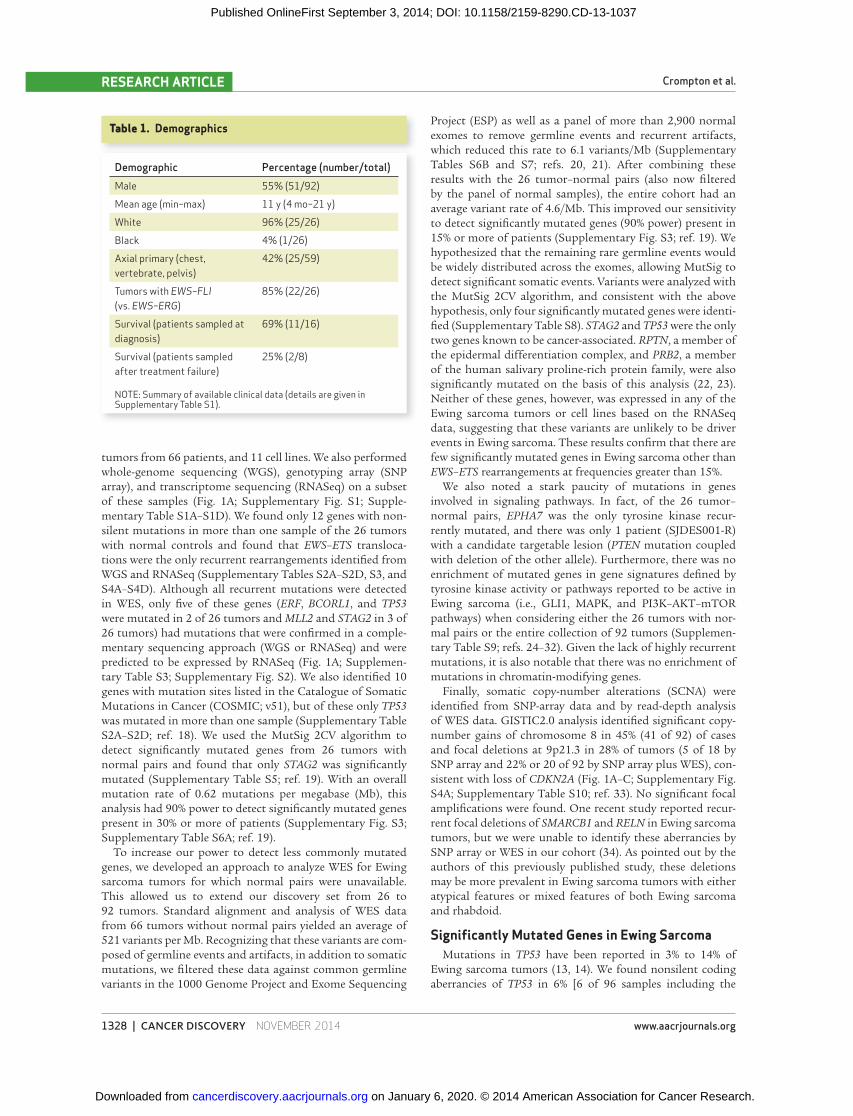
Clinical data and demographics were available for a subset
of these patients, which were consistent with epidemiologic
studies of pediatric Ewing sarcoma ( Table 1 and Supplemen-
tary Table S1A–S1D; ref. 17 ). We performed whole-exome
sequencing (WES) of tumor–normal pairs from 26 patients,
on January 6, 2020. © 2014 American Association for Cancer Research. cancerdiscovery.aacrjournals.org Downloaded from
Published OnlineFirst September 3, 2014; DOI: 10.1158/2159-8290.CD-13-1037
1328 | CANCER DISCOVERY�NOVEMBER 2014 www.aacrjournals.org
Crompton et al.RESEARCH ARTICLE
tumors from 66 patients, and 11 cell lines. We also performed
whole-genome sequencing (WGS), genotyping array (SNP
array), and transcriptome sequencing (RNASeq) on a subset
of these samples ( Fig. 1A ; Supplementary Fig. S1; Supple-
mentary Table S1A–S1D) . We found only 12 genes with non-
silent mutations in more than one sample of the 26 tumors
with normal controls and found that EWS – ETS transloca-
tions were the only recurrent rearrangements identifi ed from
WGS and RNASeq (Supplementary Tables S2A–S2D, S3, and
S4A–S4D). Although all recurrent mutations were detected
in WES, only fi ve of these genes ( ERF , BCORL1 , and TP53
were mutated in 2 of 26 tumors and MLL2 and STAG2 in 3 of
26 tumors) had mutations that were confi rmed in a comple-
mentary sequencing approach (WGS or RNASeq) and were
predicted to be expressed by RNASeq ( Fig. 1A ; Supplemen-
tary Table S3; Supplementary Fig. S2). We also identifi ed 10
genes with mutation sites listed in the Catalogue of Somatic
Mutations in Cancer (COSMIC; v51), but of these only TP53
was mutated in more than one sample (Supplementary Table
S2A–S2D; ref. 18 ). We used the MutSig 2CV algorithm to
detect signifi cantly mutated genes from 26 tumors with
normal pairs and found that only STAG2 was signifi cantly
mutated (Supplementary Table S5; ref. 19 ). With an overall
mutation rate of 0.62 mutations per megabase (Mb), this
analysis had 90% power to detect signifi cantly mutated genes
present in 30% or more of patients (Supplementary Fig. S3;
Supplementary Table S6A; ref. 19 ).
To increase our power to detect less commonly mutated
genes, we developed an approach to analyze WES for Ewing
sarcoma tumors for which normal pairs were unavailable.
This allowed us to extend our discovery set from 26 to
92 tumors. Standard alignment and analysis of WES data
from 66 tumors without normal pairs yielded an average of
521 variants per Mb. Recognizing that these variants are com-
posed of germline events and artifacts, in addition to somatic
mutations, we fi ltered these data against common germline
variants in the 1000 Genome Project and Exome Sequencing
Project (ESP) as well as a panel of more than 2,900 normal
exomes to remove germline events and recurrent artifacts,
which reduced this rate to 6.1 variants/Mb (Supplementary
Tables S6B and S7; refs. 20, 21 ). After combining these
results with the 26 tumor–normal pairs (also now fi ltered
by the panel of normal samples), the entire cohort had an
average variant rate of 4.6/Mb. This improved our sensitivity
to detect signifi cantly mutated genes (90% power) present in
15% or more of patients (Supplementary Fig. S3; ref. 19 ). We
hypothesized that the remaining rare germline events would
be widely distributed across the exomes, allowing MutSig to
detect signifi cant somatic events. Variants were analyzed with
the MutSig 2CV algorithm, and consistent with the above
hypothesis, only four signifi cantly mutated genes were identi-
fi ed (Supplementary Table S8). STAG2 and TP53 were the only
two genes known to be cancer-associated. RPTN , a member of
the epidermal differentiation complex, and PRB2 , a member
of the human salivary proline-rich protein family, were also
signifi cantly mutated on the basis of this analysis ( 22, 23 ).
Neither of these genes, however, was expressed in any of the
Ewing sarcoma tumors or cell lines based on the RNASeq
data, suggesting that these variants are unlikely to be driver
events in Ewing sarcoma. These results confi rm that there are
few signifi cantly mutated genes in Ewing sarcoma other than
EWS – ETS rearrangements at frequencies greater than 15%.
We also noted a stark paucity of mutations in genes
involved in signaling pathways. In fact, of the 26 tumor–
normal pairs, EPHA7 was the only tyrosine kinase recur-
rently mutated, and there was only 1 patient (SJDES001-R)
with a candidate targetable lesion ( PTEN mutation coupled
with deletion of the other allele). Furthermore, there was no
enrichment of mutated genes in gene signatures defi ned by
tyrosine kinase activity or pathways reported to be active in
Ewing sarcoma (i.e., GLI1, MAPK, and PI3K–AKT–mTOR
pathways) when considering either the 26 tumors with nor-
mal pairs or the entire collection of 92 tumors (Supplemen-
tary Table S9; refs. 24–32 ). Given the lack of highly recurrent
mutations, it is also notable that there was no enrichment of
mutations in chromatin-modifying genes.
Finally, somatic copy-number alterations (SCNA) were
identifi ed from SNP-array data and by read-depth analysis
of WES data. GISTIC2.0 analysis identifi ed signifi cant copy-
number gains of chromosome 8 in 45% (41 of 92) of cases
and focal deletions at 9p21.3 in 28% of tumors (5 of 18 by
SNP array and 22% or 20 of 92 by SNP array plus WES), con-
sistent with loss of CDKN2A ( Fig. 1A–C ; Supplementary Fig.
S4A; Supplementary Table S10; ref. 33 ). No signifi cant focal
amplifi cations were found. One recent study reported recur-
rent focal deletions of SMARCB1 and RELN in Ewing sarcoma
tumors, but we were unable to identify these aberrancies by
SNP array or WES in our cohort ( 34 ). As pointed out by the
authors of this previously published study, these deletions
may be more prevalent in Ewing sarcoma tumors with either
atypical features or mixed features of both Ewing sarcoma
and rhabdoid.
Signifi cantly Mutated Genes in Ewing Sarcoma Mutations in TP53 have been reported in 3% to 14% of
Ewing sarcoma tumors ( 13, 14 ). We found nonsilent coding
aberrancies of TP53 in 6% [6 of 96 samples including the
Table 1. Demographics
Demographic Percentage (number/total)
Male 55% (51/92)
Mean age (min–max) 11 y (4 mo–21 y)
White 96% (25/26)
Black 4% (1/26)
Axial primary (chest,
vertebrate, pelvis)
42% (25/59)
Tumors with EWS–FLI
(vs. EWS–ERG)
85% (22/26)
Survival (patients sampled at
diagnosis)
69% (11/16)
Survival (patients sampled
after treatment failure)
25% (2/8)
NOTE: Summary of available clinical data (details are given in Supplementary Table S1).
on January 6, 2020. © 2014 American Association for Cancer Research. cancerdiscovery.aacrjournals.org Downloaded from
Published OnlineFirst September 3, 2014; DOI: 10.1158/2159-8290.CD-13-1037

NOVEMBER 2014�CANCER DISCOVERY | 1329
The Genomics of Ewing Sarcoma RESEARCH ARTICLE
tumor trios described below; 95% confi dence interval (CI),
2%–13%] of Ewing sarcoma tumor samples ( Fig. 1A and D
and Supplementary Table S11A–S11D) . TP53 variants were
associated with a greater rate of SCNAs ( P = 0.025 by Mann–
Whitney test) across the genome but no signifi cant change
in tumor ploidy (Supplementary Fig. S4B and S4C). None
of the 51 tumors acquired at the time of patient diagnosis
had a TP53 mutation, whereas 25% of tumors acquired after
treatment (3 of 12; 95% CI, 6%–57%) were mutated at TP53
( P = 0.006 by Fisher exact test). Furthermore, relapses from
two different time points from a single patient (SJDES007-R1
and SJDES007-R2) acquired unique TP53 mutations (p.C176F
and p.C135F, respectively). Along with the striking observa-
tion that Ewing sarcoma is rarely diagnosed in families with
Li-Fraumeni syndrome, these data support the hypothesis
that TP53 mutations play a greater role in treatment resistance
Figure 1. Mutational landscape of Ewing sarcoma tumors. A, sample data, sequencing method, and recurrent aberrancies detected by massively parallel sequencing are indicated for 92 Ewing sarcoma tumors and 11 Ewing sarcoma cell lines. Box colors for each panel are indicated in the key. SNV, single-nucleotide variant. B, arm-level SCNAs from 92 Ewing sarcoma tumors determined by segmentation analysis of WES. C, focal SCNAs for 18 Ewing sarcoma tumors determined from SNP-array analysis. B and C, plotted are the q values for copy-number losses (blue) and gains (red) for each chromosomal arm or focal region calculated with GISTIC2.0 ( 33 ). Gains of chromosome 8 were the most signifi cant arm-level SCNA, and CDKN2A is located at the most signifi cant focal loss. RNASeq data demonstrated that ABCC12 was likely not expressed in any sample regardless of copy-number status. Focal deletions at 11q24.3 and 22q12.2 involve the FLI and EWS genes in the EWS – FLI rearranged samples. D, the locations of variants in STAG2 and TP53 indicated in linear protein domain models. Domain annotations are taken from recent publications ( 15 , 73 ). Numbers below each protein name indicate the number of amino acids in the full-length protein. Variant details are listed in Supplementary Table S11. Solid boxes, mutations identifi ed in tumors with normal pairs (including multiple tumors from the same patient); open triangles, variants from tumors without normal pairs after germline fi ltering; and open circles, vari-ants from cell lines after fi ltering. Mutations: MS, missense; FS, frameshift; NS, nonsense; SS, splice site. Protein domains: STAG, STAG superfamily; SCD, stromalin conservative domain; TADI/II, transcriptional-activation I and II; DNA, DNA binding; OD, tetramerization; CTD, carboxyl terminus .
Sample
STAG2
Chr 8
Chr 1q
CDKN2ATP53
DNATAD I/II
OD CTD
SCDSTAG
Protein domainsTumor–normal pairTumor onlyCell line
Sample cohort
FS SS MS MS NS MS MS MS
TP53(393 aa)
SS NS FS NS FS NS SS MS NS
STAG2(1231 aa)
A
B C D
1
2
3
4
5
6
7
8
9
10
11
12
13
15
17
19
21
X
510 0 5 10
Arm-level
−log10 (q−value)
Ch
rom
oso
me
1
2
3
4
5
6
7
8
9
10
11
12
13
15
17
19
21
X
510 0 5 10
Focal
−log10 (q−value)
CDKN2ACDKN2A
FLIFLI
EWS
ABCC12
Ch
rom
oso
me
WES
SNP-array
RNASeq
WGS
Tumor–normal pair
Cell line
Tumor only
Sequenced as indicated
Somatic mutation (SNV or indel)
Variant (no normal pair)
Copy-number gain
Translocation
Copy-number loss
on January 6, 2020. © 2014 American Association for Cancer Research. cancerdiscovery.aacrjournals.org Downloaded from
Published OnlineFirst September 3, 2014; DOI: 10.1158/2159-8290.CD-13-1037

1330 | CANCER DISCOVERY�NOVEMBER 2014 www.aacrjournals.org
Crompton et al.RESEARCH ARTICLE
or disease recurrence than in the initiation of Ewing sarcoma,
as previously suggested in the literature ( 13 ).
Mutations in STAG2 were recently identifi ed in several types
of cancer, including Ewing sarcoma ( 4 , 15 , 16 , 35–37 ). We iden-
tifi ed eight nonsilent single-nucleotide variants (SNV) or indels
in STAG2 in 96 tumors, including two distinct STAG2 muta-
tions in separate relapses from the same patient (SJDES007-R1
and SJDES007-R2), as well as a previously unreported STAG2 –
MAP7D3 fusion in a Ewing sarcoma cell line ( Fig. 1A and D
and Supplementary Table S11A–S11D) . We measured STAG2
expression by IHC in 73 tumors (including an extension cohort
of 20 tumors not sequenced) and found that 15% (11 of 73;
95% CI, 8%–25%) of tumors had complete or heterogeneous
loss of STAG2 expression. We also demonstrated loss of full-
length STAG2 expression in Ewing sarcoma cell lines by IHC
and/or Western immunoblotting and confi rmed that TTC466
expressed STAG2 – MAP7D3 fusion transcripts, resulting in
a loss of STAG2 expression ( Fig. 2A–C and Supplementary
Tables S4D and S12). Interestingly, one tumor and three cell
lines were observed to have loss of STAG2 expression without
evidence of somatic mutations, suggesting that there are other
mechanisms of STAG2 silencing in Ewing sarcoma.
In recent studies, there have been confl icting reports about
the association of STAG2 loss with increased aneuploidy in
cancer ( 15 , 35 , 36 , 38 ). We found that tumors with loss of
STAG2 expression had a slightly higher mean proportion of
the genome with SCNAs (0.15 for STAG2 positive vs. 0.36 for
STAG2 loss; P = 0.009 by Mann–Whitney test) but no differ-
ence in ploidy ( Fig. 2D and E ). However, we also noted that
some STAG2 mutations were identifi ed in tumors with TP53
mutations and/or from patients who had previously received
treatment, factors known to induce chromosomal instability.
In fact, we found that TP53 mutations occurred signifi cantly
more often than expected in samples with aberrant STAG2,
as determined by IHC or by the identifi cation of a mutation
when IHC was unavailable ( P = 0.014 by Fisher exact test).
When limiting our analysis to tumors that are TP53 wild-
type and obtained at diagnosis, we found that there was no
signifi cant difference in the rate of SCNAs in tumors with or
without loss of STAG2 expression (0.14 for STAG2 positive
vs. 0.27 for STAG2 loss; P = 0.108 by Mann–Whitney test;
Fig. 2F ). Furthermore, we did not observe any copy-number
changes in one tumor sample with a clonal STAG2 mutation
(SJDES006; Supplementary Fig. S4A). Rather, we observed
that 88% of patients (7 out of 8; 95% CI, 47%–100%) with
STAG2 loss at the time of diagnosis also presented with clini-
cal evidence of metastatic disease compared with only 27%
(14 of 51; 95% CI, 16%–42%) of those whose diagnostic tumor
sample expressed STAG2 ( P = 0.002 by Fisher exact test),
demonstrating that STAG2 loss is associated with disease
dissemination in Ewing sarcoma ( Fig. 2G ). Furthermore, we
also performed single-sample gene set enrichment analysis
(ssGSEA) to identify gene signatures that were enriched in
samples with STAG2 loss versus STAG2 expression. Because
of the small number of tumors with both loss of STAG2
expression and available RNASeq data, we combined RNASeq
data from tumors and cell lines for this analysis. Two of the
11 signatures that are enriched in samples with loss of STAG2
expression were gene sets associated with metastasis in cancer
( Fig. 2H–J and Supplementary Table S13).
Alterations in ETS Transcription Factors We identifi ed EWS – ETS rearrangements for all samples with
WGS and EWS – ETS fusion transcripts in all samples with
RNASeq data (Supplementary Table S4A–S4C). Reciprocal
ETS – EWS fusion transcripts were detected in only four sam-
ples, each with fi ve or fewer reads. In some cases, RNASeq
detected multiple EWS – ETS fusions, a phenomenon previously
reported in Ewing sarcoma ( 39–41 ). In all samples, at least one
fusion variant was expected to result in the translation of the
ETS portion of the chimeric protein in-frame. These in-frame
variants were always found to have higher expression than out-
of-frame variants in these samples, reaffi rming that alternative
splicing is an effective mechanism for expressing EWS–ETS
fusion proteins for rearrangements otherwise predicted to
yield out-of-frame and truncated fusion forms ( P < 0.0001
by Mann–Whitney test; Supplementary Table S4C). We also
found that wild-type FLI and ERG exons were poorly expressed
in EWS – ETS –expressing tumors ( Fig. 3A–C and Supplemen-
tary Table S14A and S14B). These data indicate that EWS – ETS
rearrangements are necessary for the expression of FLI and
ERG and that alternative splicing of EWS – ETS rearrangements
is sometimes necessary for the in-frame translation of these
ETS transcription factors in Ewing sarcoma.
Recent work in prostate cancer demonstrated that nonrear-
ranged ETS transcription factor aberrancies play a role in the
development of disease even in tumors expressing ETS fusions
and that ETS2 repressor factor ( ERF ) expression has also been
reported to attenuate ETS -associated tumorigenesis ( 42, 43 ).
Therefore, we looked for evidence of other ETS aberrancies in
our samples. Although mutations in ETS family genes were not
statistically enriched among the 92 tumors sequenced by GSEA,
we identifi ed three samples with nonsilent coding variants in
ERF (3%; 3 of 92; 95% CI, 1%–9%), leading to a relative decre-
ment in the expression of the ERF transcript for the only patient
with RNASeq data and an ERF mutation, SJDES012 [reads
per kilobase per million (RPKM) = 20.7, wild-type ERF RPKM;
range, 23.3–57.6; Supplementary Table S11A–S11D]. We also
identifi ed recurrent, focal deletions of the ETS1 gene (11%; 10
out of 92; 95% CI, 5%–19%), originating at the FLI breakpoint,
in Ewing sarcoma tumors. None of these samples, however, had
RNA available for determining the effect of deletion on ETS1
expression, and we did not identify point mutations in this gene
(Supplementary Fig. S5 and Supplementary Table S15).
Ewing Sarcoma Genomics after Treatment and in Established Cell Lines
Of the 26 tumors with available normal controls, 16 patients
were sampled at diagnosis and eight sampled after treatment.
For this cohort, upfront treatment used the same chemo-
therapy agents for all patients except one (Supplementary
Table S1A–S1D). Diagnostic and treated tumors differed sig-
nifi cantly in their mutation rates (0.37 vs. 1.11 mutations per
Mb, respectively; P = 0.0017 by Mann–Whitney test; Fig. 4A
and B ; Supplementary Table S6A). SNVs were predominantly
C to T transitions with the majority subcategorized as *CpG
to T mutations, a common pattern attributed to spontaneous
deamination of 5-methyl-cytosine and associated with cancers
with high levels of methylation ( 44, 45 ). In treated tumors,
there was a relative increase in substitutions of cytosine at TpC
on January 6, 2020. © 2014 American Association for Cancer Research. cancerdiscovery.aacrjournals.org Downloaded from
Published OnlineFirst September 3, 2014; DOI: 10.1158/2159-8290.CD-13-1037

NOVEMBER 2014�CANCER DISCOVERY | 1331
The Genomics of Ewing Sarcoma RESEARCH ARTICLE
Figure 2. Loss of STAG2 expression in Ewing sarcoma. A, IHC staining for STAG2 in Ewing sarcoma cell lines and tumors demonstrates a loss of STAG2 expression in mutated samples (red asterisk). The A673 Ewing cell line, expressing wild-type STAG2 , stained positive for STAG2 expression, whereas TC32, mutated at STAG2 , does not express STAG2 protein. Also shown are two primary Ewing sarcoma tumor samples stained for STAG2 expression. The tumor with a STAG2 mutation does not stain for STAG2 expression, whereas the tumor with wild-type STAG2 stains positive for STAG2 expression. B, Western immunoblot analysis of STAG2 protein expression in Ewing sarcoma cell lines with mutated (black box), rearranged (green box), and wild-type (white box) STAG2 . Mutations and rearrangements of STAG2 result in loss of expression of protein, but some cell lines with wild-type STAG2 also have loss of protein expression. C, top, schematic illustrating novel STAG2 – MAP7D3 fusion transcripts detected by RNASeq in the Ewing sarcoma cell line TTC466. Bottom, RT-PCR detected the presence of both STAG2 – MAP7D3 fusion forms in TTC466 but not in CADO-ES1 (negative control) Ewing sarcoma cell lines. D, scatter plot of tumor ploidy for tumors staining positive for STAG2 versus STAG2 loss (mean: 2.12 vs. 2.02; P = 0.585 by Mann–Whitney test). E, scatter plot of the fraction of the genome affected by SCNAs in all Ewing tumors staining positive for STAG2 versus STAG2 loss by IHC (mean: 0.15 vs. 0.36, respectively; P = 0.009 by Mann–Whitney test). F, the fraction of genome affected by SCNAs in TP53 wild-type diagnostic tumors staining positive for STAG2 versus STAG2 loss (mean: 0.14 vs. 0.27; P = 0.108 by Mann–Whitney test). G, 88% of patients with STAG2 loss by IHC at diagnosis presented with metastatic disease compared with 27% of patients whose diagnostic tumors expressed STAG2 ( P = 0.002 by Fisher exact test). H, heatmap of ssGSEA enrichment z scores for the signifi cant gene sets (SNR ≥ 1.5 and FDR q value <0.05) positively correlated with STAG2 loss (top) or STAG2 expression (bottom) . Geneset names are listed in Supplementary Table S13. I and J, GSEA plots of running enrichment scores for two metastatic signa-tures (j and k) signifi cantly enriched in STAG2 loss samples. **, P < 0.01.
STAG2 pos STAG2 loss
0
50
100
% o
f C
ase
s
Localized
Metastatic**
STAG2 pos STAG2 loss
–0.2
0.0
0.2
0.4
0.6
0.8
Fra
ctio
n o
f genom
e S
CN
A **
STAG2 pos STAG2 loss
–0.2
0.0
0.2
0.4
0.6
0.8
Fra
ctio
n o
f genom
e S
CN
A
ns
MutationTranslocation A
673
EW
8
TC
32
TC
71
EW
S502
EW
S834
RD
ES
SK
NE
P1
CA
DO
-ES
1
TT
C4
66
STAG2
STAG2
Vinculin
TTC466
S1/M
S2/M
CADO-ES1
S1/M
S2/M
Empty
S1/M
S2/M
Variant 1
Variant 2
1 12 13
STAG2 MAP7D3
Variant 1
Variant 2 2 12 13
SJD
ES
007-R
1S
JD
ES
018-R
EW
8E
WS
502
EW
S834
RD
ES
SK
NE
P1
TC
32
TT
C4
66
SJD
ES
028
SJD
ES
029
SJD
ES
001-R
SJD
ES
002-R
SJD
ES
003-R
SJD
ES
004
SJD
ES
00
5S
JD
ES
008
SJD
ES
010
SJD
ES
012
SJD
ES
013
SJD
ES
01
4-R
1S
JD
ES
015
SJD
ES
016
SJD
ES
017
SJD
ES
019
SJD
ES
020
SJD
ES
021
SJD
ES
022-R
A673
TC
71
STAG2
loss SNR1.82481.73861.72821.62411.5891.56091.5521.54761.52281.50491.5043–1.5825–1.6041–1.649–1.6846–1.992–2.0922
abcdefghijkl
mnopq
STAG2 pos STAG2 loss
0
1
2
3
4
5
Tum
or
plo
idy
ns
j0.450.400.350.300.250.200.150.100.050.00
P < 0.0001
FDR-0.0093
En
rich
me
nt
sco
re
LIAO_METASTASIS
k0.6
0.5
0.4
0.3
0.2
0.1
0.0
P-0.0063
FDR-0.0087
En
rich
me
nt
sco
re
BIDUS_METASTASIS_UP
A
D
H I
J
E F G
B
C** TC32 * SJDES006
SJDES014-R1A673
on January 6, 2020. © 2014 American Association for Cancer Research. cancerdiscovery.aacrjournals.org Downloaded from
Published OnlineFirst September 3, 2014; DOI: 10.1158/2159-8290.CD-13-1037

1332 | CANCER DISCOVERY�NOVEMBER 2014 www.aacrjournals.org
Crompton et al.RESEARCH ARTICLE
dinucleotides, a pattern attributed to the activity of APOBEC
enzymes in regions of DNA damage. However, there was no evi-
dence of kataegis or increase in APOBEC expression in treated
samples, patterns usually associated with APOBEC-induced
mutations ( Fig. 4C and D ; refs. 44–47 ). Although the analysis
of translocations was limited by the relative paucity of WGS
samples, there was a trend toward an increased number of rear-
rangements in treated samples compared with diagnostic sam-
ples, but there was no evidence of chromothripsis ( P = 0.057 by
Mann–Whitney test; Fig. 4E and F ; Supplementary Table S4A
and S4B; ref. 48 ). Finally, there was also a trend toward a higher
proportion of the genome in regions of SCNAs in tumors from
patients who had previously received treatment (0.17 diagnos-
tic vs. 0.27 relapse; P = 0.161 by Mann–Whitney test), although
no change in tumor ploidy was observed (Supplementary
Fig. S6A and S6B). We also found that copy-number gains of
chromosome 1q were signifi cantly more common in treated
samples (50%; 4 of 8; 95% CI, 16%–84%) than in diagnostic sam-
ples (14%; 7 of 51; 95% CI, 6%–26%; P = 0.03 by Fisher exact test).
In aggregate, both sequencing and copy-number data demon-
strate that anti-Ewing treatment regimens are associated with
an increase in somatic aberrancies in Ewing sarcoma tumors.
To determine whether well-established Ewing sarcoma cell
lines have retained features of Ewing sarcoma tumors, we
analyzed WES, SNP-array, RNASeq, IHC, and Western blot
analysis data from 11 cell lines (Supplementary Table S1C).
Because paired normal controls for cell lines are unavailable,
WES data were subjected to the same fi ltering process as
tumors for which we did not have matched normal samples
(Supplementary Table S16). We detected an EWS – ETS fusion
for all cell lines with RNASeq data (Supplementary Table S4C).
We found a signifi cantly increased rate of STAG2 mutations
(36%; 4 of 11; 95% CI, 11%–69%; P = 0.016), STAG2 loss by
Western blot analysis or IHC (70%; 7 of 10; 95% CI, 35%–93%;
P = 0.0006), TP53 mutations (64%; 7 of 11; 95% CI, 31%–89%;
P < 0.0001), CDKN2A deletion (55%; 6 of 11; 95% CI, 23%–83%;
P = 0.028), and chromosome 1q copy-number gain (55%; 6 of
11; 95% CI, 23%–83%; P = 0.011) in cell lines compared with
tumor samples by the Fisher exact test. There was no signifi -
cant difference in the rate of copy-number gains of chromo-
some 8 (6 of 11), and although there were more cell lines from
females (8 of 11) than from males, this did not reach statistical
signifi cance when compared with the gender of patients in
our study ( Fig. 5A ). We also performed principal component
analysis using the RNASeq data from all tumors and cell lines.
Projection of the fi rst two principal components, accounting
for the largest amount of variance in the samples, revealed
that cell lines and tumors clustered separately ( Fig. 5B ). How-
ever, only the fi rst principal component (PC1) was found to
signifi cantly discriminate tumors and cell lines ( P < 1 × 10 −14
Figure 3. Wild-type ETS genes are not expressed in Ewing sarcoma. A, schematic depicts the generation of gene-level and pre/postfusion RPKMs for EWS and ETS genes ( FLI and ERG ) from Ewing sarcoma tumor samples. Gene-level RPKMs for ETS genes (green) are derived from all exons for that gene. Reads generated from the wild-type allele or translocated allele cannot be distinguished. Prefusion EWS RPKMs (blue) are generated from all reads that map to the exons before the site of the EWS – ETS breakpoint (reads from rearranged and wild-type alleles cannot be distinguished). Postfusion EWS RPKMs (top, black) map to exons after the breakpoint. Prefusion ETS RPKMs (bottom, black) are derived from alleles before the EWS – ETS breakpoint. Postfusion ETS RPKMs (red) are derived from exons after the breakpoint (reads from the rearranged and wild-type alleles cannot be distinguished). B, left, gene-level RPKMs for FLI are plotted for each tumor with available RNASeq data. Tumors are grouped by whether they express a EWS – FLI or EWS – ERG fusion. Right, gene-level RPKMs for ERG are plotted for each tumor and grouped by fusion type. C, left, prefusion and postfusion EWS RPKMs for all tumors with RNASeq data. Because postfusion exons are not involved in the EWS – ETS rearrangement, expression of these exons indicates the expression of the wild-type EWS allele. Middle, prefusion and postfusion FLI RPKMs for EWS – FLI rearranged tumors. Right, prefusion and postfusion ERG RPKMs for EWS – ERG rearranged tumors. Expression of prefusion ETS exons depends on the wild-type promoter. Thus, prefusion RPKMs refl ect expression of wild-type ETS alleles.
FLI expression
EWS–FLI tumors EWS–ERG tumors
0
5
10
15
Ge
ne
-le
ve
l R
PK
M
EWS expression (all tumors)
Prefusion Postfusion
0
50
100
Pa
rtia
l g
en
e R
PK
MERG expression
EWS–FLI tumors EWS–ERG tumors
0
2
4
6
8
10
Ge
ne
-le
ve
l R
PK
M
FLI expression (EWS–FLI tumors)
Prefusion Postfusion
0
5
10
15
20
25
Pa
rtia
l g
en
e R
PK
M
ERG expression (EWS–ERG tumors)
Prefusion Postfusion
0
5
10
15
20
25
Pa
rtia
l g
en
e R
PK
M
EWS
EWS ETS
ETS
ETS
EWS prefusion EWS postfusion
ETS prefusion ETS postfusion
Gene-level ETS
EWS
A
C
B
Residual allele
WT allele
Residual allele
EWS–ETS
WT allele
on January 6, 2020. © 2014 American Association for Cancer Research. cancerdiscovery.aacrjournals.org Downloaded from
Published OnlineFirst September 3, 2014; DOI: 10.1158/2159-8290.CD-13-1037

NOVEMBER 2014�CANCER DISCOVERY | 1333
The Genomics of Ewing Sarcoma RESEARCH ARTICLE
0
2
4
Treated
SN
V r
ate
/Mb
C>T
C>A
C>G
A>G
A>C
A>T0
2
4
Diagnostic
SN
V r
ate
/Mb
G_G A_G
G_A
C_G
A_A
T_G
G_C
C_A
A_C
T_A
G_T
C_C
A_T
T_C
C_T T_T
SJDES010
SJDES008
SJDES009
SJDES006
SJDES007-R1 SJDES018-R
SJDES001-R
D
E F
Figure 4. Ewing sarcoma tumors acquire somatic aberrancies with treatment. A, coding mutations in 24 Ewing sarcoma tumor samples identifi ed from WES and WGS of patient tumors and paired normal tissue with available clinical data. Bars indicate the number of coding-region mutations in each tumor and are grouped by disease state (diagnostic or treated) and ordered by number of mutations (high to low) within each group. B, the rate of coding mutations is higher in tumors sequenced after treatment than in tumors from diagnostic samples. Plotted are the average mutation rates for diagnostic and treated samples ± the standard deviation (SD), P = 0.0017 by Mann–Whitney test. C, treated tumors have a lower fraction of *CpG to T transitions and a higher fraction of substitutions at cytosines in TpC dinucleotides. The NpN nomenclature indicates the dinucleotide sequence involved in the indicated mutation and * indicates the mutated base. Plotted are the fractions of SNVs for each mutational category ± the 95% CI; *, P < 0.05; **, P < 0.01 by z test. D, shown is the rate of SNVs by 3-base context from tumors acquired at diagnosis (left) or after treatment (right). Colors indicate the single-nucleotide change, and the location of each bar in the matrix indicates the fl anking bases. E and F, circos plots of seven tumors sequenced by WGS. Chromosomes displaying cytobands are arranged end-to-end in the outer ring with the inner ring showing segmented copy-number variations generated from exome sequencing. Interchromosomal rearrangements are displayed as purple arcs and intrachromosomal as green arcs. Rearrangements at t(21;22)(q22;q12) in SJDES010 and SJDES018-R indicate the EWS – ERG fusions in these samples. All other tumors demonstrate a translocation at t(11;22)(q24;q12), consistent with the EWS – FLI fusion.
0.0
0.5
1.0
1.5
2.0
Mu
tatio
ns p
er
Mb **
DiagnosticTreated
Diagnostic
Treated
A->C
A->G
A->T
C->
AC->
GC->
T
Tp*A->
T
Tp*C->
mut
*CpG
->T
0.0
0.2
0.4
0.6
Fra
ctio
n o
f S
NV
s
**
**
*
**
Indel
Nonsilent
Silent
20
40
60
80# M
uta
tions p
er
tum
or
SJD
ES
006
SJD
ES
013
SJD
ES
016
SJD
ES
017
SJD
ES
029
SJD
ES
020
SJD
ES
010
SJD
ES
005
SJD
ES
015
SJD
ES
019
SJD
ES
028
SJD
ES
021
SJD
ES
012
SJD
ES
004
SJD
ES
009
SJD
ES
008
SJD
ES
007-R
1
SJD
ES
018-R
SJD
ES
011-R
SJD
ES
001-R
SJD
ES
003-R
SJD
ES
014-R
1
SJD
ES
022-R
SJD
ES
002-R
Diagnostic TreatedA
B C
on January 6, 2020. © 2014 American Association for Cancer Research. cancerdiscovery.aacrjournals.org Downloaded from
Published OnlineFirst September 3, 2014; DOI: 10.1158/2159-8290.CD-13-1037

1334 | CANCER DISCOVERY�NOVEMBER 2014 www.aacrjournals.org
Crompton et al.RESEARCH ARTICLE
by the Student t test; Fig. 5C ). We then applied ssGSEA after
ranking the genes by their weighted contribution to PC1 and
found that cell lines were enriched for gene sets associated
with cell proliferation and metabolism, whereas tumors were
enriched for gene sets associated with the immune system
or signaling from the extracellular matrix ( Fig. 5D and Sup-
plementary Table S17). In summary, these data suggest that
although Ewing sarcoma cell lines possess the spectrum of
recurrent molecular events observed in EWS–ETS–positive pri-
mary tumors, they may be more representative of high-risk
disease because aberrancies associated with aggressive disease
(e.g., TP53 mutations and CDKN2A deletions) occur at a higher
frequency in the cell lines. Moreover, the transcriptional analy-
sis suggests, not surprisingly, that there is an interaction of
the primary tumors with the microenvironment, including
infi ltration with immune cells, and that there are differences
in growth properties between cell lines and primary Ewing sar-
coma tumors . However, additional differences in transcription
between the two were not identifi ed in our analysis, supporting
the notion that other aspects of cell line transcriptional pro-
gramming may more faithfully model tumor biology.
Clonal Evolution and Tumor Heterogeneity For 2 patients, we performed WES on tumor DNA from
both a primary tumor at diagnosis and a metastatic tumor
at relapse (Supplementary Fig. S7A and Supplementary
Figure 5. Characteristics of Ewing sarcoma cell lines. A, frequency of molecular aberrancies and gender in Ewing sarcoma cell lines (red) compared with tumor samples (black). STAG2 loss refers to absence of protein expression by Western blot analysis or IHC. There was a statistically signifi cant increase in the percentage of cell lines with STAG2 mutation ( P = 0.016), STAG2 loss ( P = 0.0006), TP53 mutations ( P < 0.0001), CDKN2A loss ( P = 0.028), and chromosome 1q gain ( P = 0.011) compared with tumor samples by Fisher exact test. *, P < 0.05; ***, P < 0.001; ****, P < 0.0001. B, projection on the fi rst two components of a principal component analysis applied to RNASeq data from Ewing sarcoma tumors and cell lines. Principal components are ordered on the basis of the percentage of explained variance in the data. Black dots indicate tumor samples and red indicate cell lines. Cell lines and tumors separate into distinct clusters. C, plot of the normalized P value (by −log 10 ) of Student t tests comparing the principal component scores for tumors versus cell lines. The red line indicates a P = 0.05. Only PC1 has a signifi cant P value. D, plot of FDR q value (normalized by −log 10 ) versus normal-ized enrichment score (NES) of ssGSEA applied to genes (ranked by PC1-weight) to identify Kyoto Encyclopedia of Genes and Genomes (KEGG) canonical pathways enriched by differences in Ewing sarcoma tumors versus cell lines. A negative NES indicates a pathway enriched in tumors and a positive NES indicates a pathway enriched in cell lines. Black dots indicate signifi cant pathways (FDR q value < 0.05) associated with environmental interactions with the extracellular membrane, transmembrane signaling, and the immune system. Red dots indicate signifi cant pathways associated with cellular prolifera-tion including cell division, growth, and metabolism. Signifi cantly enriched signatures are listed in Supplementary Table S17 .
ST
AG
2 m
ut
ST
AG
2 loss
TP
53 m
ut
CD
KN
2A d
el
Chr
1q g
ain
Chr
8 g
ain
Fem
ale
0
20
40
60
80
100P
erc
ent sam
ple
s
Tumors
Cell lines
*
*** ***** *
(Cell line)(Tumor)
–2 –1 0 1 20
2
4
6
8
NES
–lo
g10 (
FD
R)
Other
Environment
Proliferation
0 10 20 300
5
10
15
Principal component
–lo
g10 (
P )
PC 2-31
PC1
PC1 (25.9 %)
PC
2 (
9.7
%)
−40 0 40 80
−80
−40
040
Cell lineTumor
A B
C D
on January 6, 2020. © 2014 American Association for Cancer Research. cancerdiscovery.aacrjournals.org Downloaded from
Published OnlineFirst September 3, 2014; DOI: 10.1158/2159-8290.CD-13-1037

NOVEMBER 2014�CANCER DISCOVERY | 1335
The Genomics of Ewing Sarcoma RESEARCH ARTICLE
Tables S1D and S18). To explore clonal evolution, we esti-
mated the cancer cell fraction (CCF; fraction of tumor cells
containing each SNV and indel) for mutations in each tumor
( 49 ). For both patients, it was notable that there were muta-
tions at diagnosis predicted to be clonal or near-clonal (by a
CCF > 0.9) that were not identifi ed in the metastatic recurrent
tumor samples, suggesting either that mutational heteroge-
neity in the diagnostic sample was not detectable by stand-
ard tissue sampling techniques and sequencing read depth
or that metastasis occurred early in disease development,
before the emergence of the dominant clone in the primary
tumor ( Fig. 6A ). As might be expected, a portion of subclonal
Figure 6. Clonal evolution in Ewing sarcoma. A and B, Venn diagrams indicate the number of SNVs and indels detected in paired tumor samples by WES for mutations occurring at bases with adequate coverage to power mutation detection in both tumors. Purple circles include mutations identifi ed in the tumor sequenced from the 26 tumor–normal cohort, and the blue circles include mutations identifi ed in the subsequent relapse. “Cloud plots” indicate the cancer cell fraction (CCF) of these mutations by a central dot surrounded by a cloud. Light dots indicate single mutations. Black dots indicate multiple mutations with the same CCFs in both tumors. Clouds depict the 90% CI of each CCF estimate (smaller clouds represent higher certainty). A, left and middle, cloud plots demonstrate the overlap of mutations identifi ed in 2 patients from whom we sequenced a diagnostic tumor and relapsed metastatic tumor. Right top, MRI and CT images of primary pelvic tumor at diagnosis and lung metastasis at relapse for patient SJDES004. Right bottom, a model depicting the proposed evolution of a metastatic relapsed tumor from a primary tumor. Blue circles represent Ewing sarcoma cells. Symbols within cells represent clusters of mutations (circles) or specifi c mutations. Time moves from left to right with tumor sampling indicated by vertical lines. The large teardrop indicates the evolving relapsed cell population. Smaller, multicolored teardrops indicate subclonal populations of cells. The absence of some mutations at relapse that are estimated to be clonal at diagnosis indicates that metastatic (met) spread likely occurs after tumor initiation but before the emergence of the dominant clone in the primary tumor. B, left and middle, cloud plots demonstrate mutations identifi ed in two separate locally relapsed tumors from patients with Ewing sarcoma. Right top, MRI and PET images (left to right) from diagnosis, relapse 1 (R1), and relapse 2 (R2) from patient SJDES007 with Ewing sarcoma involving the scapula. Right bottom, schematic depicts the proposed mechanism of evolution from diagnosis to each relapse for tumors from patient SJDES007. At diagnosis, tumors likely contain a mutation in STAG2 (extrapolated from IHC demonstrating loss of STAG2 expression) that cannot be 100% clonal due to the presence of different STAG2 mutations at R1 and R2. The presence of clonal mutations in R1 that are not present in R2 (and vice versa) suggest that local relapses emerge from cells that have diverged from the primary tumor.
A
38 273
Re
lap
se
2 t
um
or
CC
F
SJDES007
Relapse 1 tumor CCF
1020
SJDES014
Relapse 1 tumor CCF
1 5 27
Re
lap
se
tu
mo
r C
CF
SJDES004
Diagnostic tumor CCF
2 10 8
SJDES016
Diagnostic tumor CCFInitiation Diagnosis Met relapse
B
EWS–ETS STAG2 (p.E756_splice) TP53 (p.C176F) TP53 (p.C135F)STAG2 (p.R614*)
Clonal diagnostic Subclonal at R1 Clonal at R2 Subclonal at R2Clonal at R1Clonal/near-clonal diagnostic
Diagnostic Relapse 1 Relapse 2
0.0 0.2 0.4 0.6 0.8 1.0
0.0
0.2
0.4
0.6
0.8
1.0
0.0 0.2 0.4 0.6 0.8 1.00
.00
.20
.40
.60
.81
.0
0.0 0.2 0.4 0.6 0.8 1.0
0.0
0.2
0.4
0.6
0.8
1.0
0.0 0.2 0.4 0.6 0.8 1.0
0.0
0.2
0.4
0.6
0.8
1.0
on January 6, 2020. © 2014 American Association for Cancer Research. cancerdiscovery.aacrjournals.org Downloaded from
Published OnlineFirst September 3, 2014; DOI: 10.1158/2159-8290.CD-13-1037

1336 | CANCER DISCOVERY�NOVEMBER 2014 www.aacrjournals.org
Crompton et al.RESEARCH ARTICLE
mutations at diagnosis became clonal at relapse, and recur-
rent metastatic tumors acquired new mutations. For two
additional patients, we were unable to obtain diagnostic sam-
ples for sequencing but were able to sequence tumors from
separate relapses (Supplementary Fig. S7B and Supplemen-
tary Tables S1D and S18). In both cases, relapses were local
to the site of the diagnostic tumor, but there was remarkably
little overlap in the mutations identifi ed at the fi rst relapse
(R1) compared with the subsequent relapse (R2). For patient
SJDES007, we confi rmed that the same genomic EWS – FLI
breakpoint identifi ed by WGS in R1 was also present in R2,
suggesting that these were not independent occurrences of
Ewing sarcoma in the same patient. These fi ndings indicate
that tumor heterogeneity in the primary tumor infl uences the
mutational profi le of tumors at relapse ( Fig. 6B ).
One striking observation from patient SJDES007 was the
fi nding that the TP53 and STAG2 mutations identifi ed in
tumor R1 were not detected at R2. Instead, mutations at dif-
ferent sites were detected in both of these genes at R2. This
convergent evolution is consistent with the fi nding that muta-
tions in these genes may co-occur more often than expected
by chance and suggests that they play an important role
in relapse ( Fig. 6B and Supplementary Table S11A–S11D).
Although copy-number loss in R2 could account for the loss
of the TP53 mutation initially seen in R1, copy-number loss is
unlikely to explain the presence of different STAG2 mutations
in tumors R1 and R2 because the STAG2 gene is located on
the X chromosome and this is a male patient (Supplementary
Fig. S7B). In fact, the absence of STAG2 expression in the
diagnostic sample (determined by IHC staining of a formalin-
fi xed paraffi n-embedded sample; Supplementary Table S12)
suggests that the tumor populations that gave rise to each
relapse had diverged before diagnosis, further supporting
the notion that tumor heterogeneity at diagnosis infl uences
tumor evolution at relapse. Finally, sequencing of tumors
sampled at R1 and R2 from patient SJDES014, an infant with
multiply relapsed chest wall Ewing sarcoma, demonstrated
that the EWS – FLI rearrangement was the only somatic muta-
tion in common to both relapses ( Fig. 6B and Supplementary
Tables S2B, S4C, and S18). Although analysis of this patient’s
normal exome did not reveal a mutation associated with a
known cancer predisposition, the patient’s unusually young
age at diagnosis and the absence of other clonal, tumor-
initiating events leads us to speculate that germline variants
or lineage-specifi c epigenetic changes may play an important
role in Ewing sarcoma oncogenesis for some patients.
DISCUSSION One ongoing debate in the pediatric oncology community
has focused on the utility of clinical-grade deep sequencing
of pediatric tumors to enable molecularly informed therapy,
matching genetic lesions with targeted drugs. In this regard,
our study reveals that Ewing sarcoma genomes are among
the most simple reported to date and demonstrates a marked
paucity of mutations in immediately targetable pathways,
such as mutations in the MAPK or PI3K–AKT–mTOR path-
ways. In the case of MAPK pathway mutations, a similar
observation was made in prostate cancer in which mutations
in the MAPK pathway were rare and observed only in ETS
fusion-negative tumors ( 43 ). Indeed, it has been suggested
that oncogenic ETS proteins can replace the need for MAPK
pathway mutations by the upregulation of a MAPK tran-
scriptional program ( 50 ). At relapse, the frequency of genetic
aberrancies is signifi cantly higher, although the paucity of
targetable lesions remains a challenge. This does raise the
point, however, that diagnostic and relapsed tumors are quite
different, supporting the notion that relapsed tissue warrants
biopsy and genomic characterization for optimal precision-
based therapy in the future.
On the one hand, the simplicity of the Ewing sarcoma
genome is disquieting in that there is not an immediately
translatable intervention. In addition, in the two cases with
paired relapse samples from the same patient, only the
minority of mutations were present in both relapses. These
results, however, do speak to the critical importance of under-
standing and either directly targeting the EWS – ETS fusion
event in this disease or identifying synthetic lethal vulner-
abilities in the presence of these fusion proteins. Toward
this end, by integrating multiple genomic approaches, we
addressed several previously outstanding questions regard-
ing the EWS – ETS fusions in Ewing sarcoma tumors. First, in
Ewing sarcoma, the reciprocal fusion, ETS – EWS , is generally
not expressed and thus unlikely to be relevant to disease
pathogenesis. This is in contrast to other fusions, such as
PML – RARA in acute promyelocytic leukemia, in which the
reciprocal fusion is thought to be critical to leukemogenesis
( 51 ). Second, although wild-type EWS is highly expressed in
Ewing sarcoma tumors, both wild-type FLI and wild-type
ERG are poorly expressed. Third, our data highlight the need
to better understand the role of nonrearranged ETS genes in
Ewing sarcoma even beyond the expressed EWS–ETS fusion
proteins.
One of the most striking recurrent events found in our
sequencing effort was mutations or rearrangements of the
STAG2 gene. In further support of a functional relevance
of STAG2 to Ewing sarcoma is the fi nding of unique STAG2
mutations at different relapses in 1 patient. Moreover, the
co-occurrence of these mutations with unique mutations in
TP53 at each relapse supports a likely functional interaction
of these two events in promoting disease recurrence. Indeed,
co-occurrence of STAG2 and TP53 mutations was observed
more often than expected by chance in Ewing sarcoma tumors.
All frameshift and nonsense mutations in STAG2 resulted in
the loss of protein expression in Ewing sarcoma tumors with
suffi cient tissue for evaluation by IHC. Moreover, we observed
additional samples with loss of STAG2 expression despite
normal coding sequences. STAG2 is a member of the cohesin
complex, a multimeric complex consisting of at least four
core proteins: a heterodimer of SMC1 and SMC3 forming
a hinged ring-like structure and two “clasp” proteins, STAG
and RAD21 ( 52, 53 ). Although mutations in multiple mem-
bers of the cohesin complex have been reported in cancer, in
this collection of Ewing sarcoma tumors, we observed recur-
rent mutations only in STAG2 , consistent with recent reports
( 4 , 16 , 54, 55 ). The cohesin complex is known to play a role
in the regulation of sister chromatid exchange during mito-
sis and meiosis, and in some reports, mutations in STAG2
are associated with aneuploidy ( 15 , 36 ). In Ewing sarcoma
tumors, however, there was no difference in tumor ploidy
on January 6, 2020. © 2014 American Association for Cancer Research. cancerdiscovery.aacrjournals.org Downloaded from
Published OnlineFirst September 3, 2014; DOI: 10.1158/2159-8290.CD-13-1037

NOVEMBER 2014�CANCER DISCOVERY | 1337
The Genomics of Ewing Sarcoma RESEARCH ARTICLE
among tumors expressing STAG2 or those with STAG2 loss.
Furthermore, we have identifi ed a STAG2 mutation in one
tumor sample with no copy-number alterations, suggesting
that the loss of STAG2 expression likely contributes to dis-
ease pathogenesis or progression through other mechanisms.
One alternative hypothesis is that mutations in STAG2 lead to
altered chromatin architecture and transcription, a putative
mechanism in the developmental disorders characterized by
mutations in the cohesin complex, such as Cornelia de Lange
Syndrome and Roberts Syndrome ( 53 , 56–59 ). Moreover,
despite a small sample size, it is notable that 88% of patients
with STAG2 loss at diagnosis also had metastatic disease,
in comparison to only 27% of patients with tumors express-
ing STAG2. Because of a lack of available follow-up data for
the majority of patients whose tumors were included in this
study, we were unable to defi nitively demonstrate that these
patients had a worse outcome. Although metastatic disease
is currently the most predictive marker of poor prognosis
in Ewing sarcoma, this hypothesis will need verifi cation in a
larger cohort. Thus, although loss-of-function mutations of
STAG2 in Ewing sarcoma may portend a poor prognosis, it
may also impart a new, targetable vulnerability for the devel-
opment of alternative treatment strategies.
In this study, we also identifi ed rare, recurrent mutations
in genes such as BCORL1 , MLL2 , and ERF , which did not
reach statistical signifi cance in this dataset. Indeed, one of the
shortcomings of comprehensive sequencing efforts for rare
pediatric tumors, such as this study, is the lack of adequate
samples to power the discovery of rare events. Assuming
a stable mutational frequency of 0.62 mutations per Mb,
we would need to sequence more than 200 tumor/normal
pairs to have 90% power to identify mutations present in
5% of patients and approximately 500 samples to detect sig-
nifi cant events in 3% of patients ( 19 ). With an incidence of
approximately 250 cases in the United States per year, such
an analysis will require a large multi-institutional effort or
meta-analysis as data from other Ewing sarcoma sequenc-
ing projects become available. However, we present here a
novel approach to utilizing tumors acquired from pathologic
discards that do not have paired normal tissue. Although
we expect to see an increase in false positives using this
approach, this analysis increased our confi dence that we were
not “missing” signifi cantly mutated, well-validated cancer-
associated genes expected to occur in 15% or more of patients
with Ewing sarcoma. It is yet to be seen whether this method
will be as informative for other cancer types, particularly
those with a much higher rate of somatic mutations. A
second shortcoming of our study is the lack of deep clinical
information for many of the samples. Prospective studies
to defi nitively address the relevance of STAG2 aberrancy on
long-term survival, for example, will be of future interest.
In summary, we report a massively parallel sequencing
analysis of ETS -rearranged Ewing sarcoma tumors and reveal
remarkably quiet genomes at the time of diagnosis. We
note nearly a 3-fold increase in the mutation rate of tumors
posttreatment, underscoring the notion that relapsed dis-
ease is genetically different from disease at diagnosis and
lending support to the debate about re-biopsy of pediatric
solid tumors at time of relapse. These studies emphasize the
importance of tackling the EWS – ETS fusion as a drug target
and also shed light on cohesin defects as another potential
vulnerability in this disease.
METHODS Samples
Tumor tissue and matched blood from patients with Ewing
sarcoma were collected with informed consent under a Hospital
Sant Joan de Déu (Barcelona, Spain), Institutional Review Board
(IRB)–approved protocol . Additional tumor tissue samples were col-
lected on an IRB-approved tissue discard protocol from Boston
Children’s Hospital (Boston, MA) and acquired through the Coop-
erative Human Tissue Network, Southern Division (Birmingham,
AL). Protocols were reviewed and approved by the Broad Institute’s
(Cambridge, MA) IRB. DNA and RNA were extracted from tumors
and cell lines using standard techniques.
Massively Parallel Sequencing Whole-exome sequencing Library construction followed proce-
dures as previously reported ( 60 ). Barcoded exon capture libraries
were pooled into batches of 96 samples for sequencing.
Whole-genome sequencing Creation of adaptor-ligated barcoded
libraries was performed as for hybrid capture, except that DNA was
sheared to a larger fragment size (adaptor-ligated fragment; range,
340–510 bp). To minimize molecular duplication and facilitate deep
and diverse sequence coverage, two libraries were prepared from each
sample.
Transcriptome sequencing RNA for each sample was converted
into a library of template molecules for sequencing according to the
protocol for the Illumina TruSeq unstranded RNA Sample Protocol
( 61 ). All libraries were sequenced on the Illumina HiSeq 2000 instru-
ment set to generate 76-bp paired-end reads for WES and RNASeq
and 101-bp paired-end reads for WGS.
Genotyping arrays Tumor–normal matched samples were proc-
essed and hybridized to Affymetrix SNP 6.0 arrays for genotyping
and copy-number analysis ( 62 ).
Contamination estimates SNP fi ngerprinting was used to cross-
check each sequenced lane from a tumor–normal pair against all
other lanes from that pair and to ensure matching between WES,
WGS, SNP array, and RNASeq. Cross-contamination was estimated
by using ContEst ( 63 ). All samples were found to have less than 4%
contamination.
Sequencing Analysis DNA sequence alignment and variant detection To prepare read
alignments for analysis, we processed all sequence data through the
Broad Institute’s data-processing pipeline, “Picard.” For each sample,
this pipeline combines data from multiple libraries and fl ow cell runs
into a single BAM fi le. This fi le contains reads aligned to the human
genome with quality scores recalibrated using the TableRecalibra-
tion tool from the Genome Analysis Toolkit (GATK; ref. 64 ). Reads
were aligned to the Human Genome Reference Consortium build
37 (GRCh37) using the Burrows-Wheeler Aligner. All BAM fi les were
deposited in the database of Genotypes and Phenotypes (dbGaP)
upon publication. Variant detection and analysis of the BAM fi les were
performed using the Broad Institute’s Cancer Genome Analysis infra-
structure program “Firehose.” Firehose facilitates comparison of BAM
fi les from matched tumor–normal pairs and coordinates execution of
specifi c modules including quality control, local realignment, muta-
tion calling, small insertion and deletion identifi cation, rearrangement
on January 6, 2020. © 2014 American Association for Cancer Research. cancerdiscovery.aacrjournals.org Downloaded from
Published OnlineFirst September 3, 2014; DOI: 10.1158/2159-8290.CD-13-1037

1338 | CANCER DISCOVERY�NOVEMBER 2014 www.aacrjournals.org
Crompton et al.RESEARCH ARTICLE
detection, variant annotation, computation of mutation rates, and
calculation of sequencing metrics. Module versioning and logging of
the specifi c analytic parameters is also tracked. Somatic SNVs and
indels were identifi ed using MuTect (Firehose CallSomaticMutations
v123; ref. 65 ), and Indelocator (Firehose CallIndelsPipeline v65; ref.
66 ), respectively. Each mutation was annotated by Oncotator (Firehose
OncotatorPipeline v81). We manually reviewed all somatic mutations
and indels identifi ed in the 26 tumor–normal pairs by the automated
pipeline using the Integrated Genomic Viewer (IGV; ref. 67 ). Manual
review removed approximately 20% of the somatic mutations from
subsequent analysis, consistent with a very low false-positive rate (∼0.1/
Mb). Genomic rearrangements were detected from WGS and WES data
using dRanger (Firehose dRanger v146) or manual review using IGV.
Somatic copy-number variants were detected from SNP-array data
using the Broad Institute’s copy-number pipeline and from WES data
using CapSeg (Firehose CapSegModule v77), which uses read depth
in the exome to estimate somatic copy-number changes across the
genome. SNP-array data were analyzed using the tool ABSOLUTE to
infer the tumor purity and ploidy ( 49 , 68 ).
Germline fi ltering for tumor-only and cell line samples We devised
a fi ltering approach to reduce the nonsomatic component of muta-
tions detected in tumor samples and cell lines without matched nor-
mal samples. The fi lter removed recurring germline mutations with
population minor allele frequencies exceeding 0.5% and removed any
candidate mutation occurring at sites of recurring artifacts identifi ed
in more than 15% of a panel of 2,913 normal exomes. The processing
for tumor-only and cell line data consisted of three steps.
1. Candidate mutation detection and raw fi ltering. After aligning tumor
and cell line data to the reference genome (GRCh37), we generated
candidate mutation lists with MuTect (Firehose CallSomatic-
Mutations v131; ref. 65 ) and Indelocator (Firehose CallIndel-
sPipeline v77; ref. 66 ) by pairing tumor samples with a normal
sample (SJDES001). Variants with less than 3 alternate allele
(alt) reads were removed. Also at this step, mutations outside the
coding regions were eliminated from consideration because non-
coding coverage is expected to vary between WES platforms ( 69 ).
2. Common population variant fi lter. Tumor and cell line variants were
fi ltered if the allele frequencies exceeded 0.5% in 1000 Genomes
Project phase I data (any major population group) or in African
American or European American populations in the ESP ( 20, 21 ).
3. Panel of normals fi lter ( PoN ). For remaining variants, corresponding
loci were examined in data from 2,913 normal samples. Each site
in each normal sample was classifi ed into one of the following
categories for each sample:
PoN(1): total read depth at loci < 8x (i.e., insuffi cient coverage)
PoN(2): alt count ≥ 10 and alt fraction ≥ 20%
PoN(3): alt count ≥ 3 and alt fraction > 20%
PoN(4): alt count ≥ 3 and alt fraction ≥ 3%
PoN(5): alt count ≥ 3 and alt fraction ≥ 1%
PoN(6): alt count ≥ 2 and alt fraction ≥ 0.3%
PoN(7): alt count ≥ 1 and alt fraction ≥ 0.1%
PoN(8): total depth ≥ 8 and none of previous criteria.
The fraction of the 2,913 normal samples in each of the eight cat-
egories was calculated for each candidate mutation site. Candidate
variants at loci that did not meet the following criteria were removed
from subsequent analysis:
Fraction samples PoN(1)<0.15 & PoN(2)<0.001 &
Sum(PoN(4:7))<0.15 & PoN(8)>0.7.
Although approximately 150 rare germline variants per tumor
sample pass this fi lter, we found that the nonsomatic:somatic ratio
of mutations was reduced to approximately 12:1 with this method
(based on the comparison of fi ltering of 26 tumors with and without
pairing of normal samples), which is suffi cient for MutSig 2CV to
identify signifi cantly recurring mutations above the background
germline mutation rate ( 19 ). Following the “panel of normal” fi lter,
SNVs were also subjected to “oxo-G” fi ltering to remove C>A artifact
from library preparation–associated oxidative damage ( 70 ).
Determining DNA somatic variant signifi cance GISTIC2.0
(Firehose Gistic2_Pipeline v99) was used to identify signifi cantly
recurring SCNAs from both SNP-array and WES data ( 33 ). Identi-
fi cation of gene mutations most likely to be driving tumorigenesis
( signifi cantly mutated genes) was performed by the MutSig 2CV
algorithm ( 19 ).
Estimating CCF Tumor purity and ploidy values were estimated
using the ABSOLUTE Toolkit ( 68 ) based on SCNAs and SNV allele
fractions. In samples without suffi cient aneuploidy for ABSOLUTE
to converge on a solution, a custom MATLAB script estimated purity
based on evidence from allele fraction distribution of mutations that
were consistent with clonal heterozygous somatic SNVs. The CCF of
each mutation was then estimated by ABSOLUTE or by the custom
MATLAB script using purity and ploidy estimates ( 49 ).
Transcriptome sequencing alignment and analysis The PRADA
pipeline was used for alignment of RNA sequenced reads (Firehose
BWATrancriptome v32) to a reference genome consisting of GRCh37
and the human transcriptome. Mutations detected from the WES
and WGS were compared with RNASeq data from the same samples
to estimate the mutation validation rate (Supplementary Fig. S2;
Firehose CrossvalidateMutations v15; ref. 66 ). RNA fusions were
identifi ed from the PRADA pipeline (Firehose RNAFusion v19) based
on reads containing mates mapping to two different coding regions.
Exon-level transcript expression from RNASeq data was evaluated
using RNA-SeQC (Firehose RNASeqMetrics v35; ref. 71 ). Reads
were then converted to gene-level expression by determining the
reads mapped to the genome per kilobase per million mapped reads
(RPKM) for each gene ( 72 ). We also calculated gene-fragment RPKMs
for the EWS , FLI , and ERG genes involved in EWS – ETS translocations.
RPKM calculations for prefusion exon regions and for postfusion
exon regions were performed separately for EWS , FLI , and ERG genes
in each tumor sample.
Cell Culture Ewing sarcoma cell lines were provided by the laboratory of
Dr. Todd Golub (Broad Institute) except for the EWS502 and
EWS834 cells, both of which were a gift from Dr. Jonathan Fletcher
(Brigham and Women’s Hospital, Boston, MA) and cultured as
previously described ( 32 ). CHLA-258 cells were grown in Iscove’s
Modifi ed Dulbecco’s Medium (Invitrogen) with 20% heat-inactivated
FBS (Gemini Bio-Products) and supplemented with 10 mg/L insulin,
5.5 mg/L transferrin, and 6.7 μg/L sodium selenite (ITS; Thermo
Fisher Scientifi c IST) and 0.7 mmol/L L -glutamine (Thermo Fisher
Scientifi c). Cell lines were authenticated with WES and RNASeq as
described in the article .
Please see the Supplementary Data for additional methods.
Disclosure of Potential Confl icts of Interest C. Rodriguez-Galindo is a consultant/advisory board member for
Novimmunue. No potential confl icts of interest were disclosed by
the other authors .
Authors’ Contributions Conception and design: T.R. Golub, J. Mora, K. Stegmaier
Development of methodology: C. Stewart, A. Taylor-Weiner, K.C.
Kurek, S.L. Carter, M. Suñol, M.S. Lawrence, M.D. Fleming, J. Mora
Acquisition of data (provided animals, acquired and managed
patients, provided facilities, etc.): B.D. Crompton, K.C. Kurek,
on January 6, 2020. © 2014 American Association for Cancer Research. cancerdiscovery.aacrjournals.org Downloaded from
Published OnlineFirst September 3, 2014; DOI: 10.1158/2159-8290.CD-13-1037
NOVEMBER 2014�CANCER DISCOVERY | 1339
The Genomics of Ewing Sarcoma RESEARCH ARTICLE
M.L. Calicchio, S.S. Mehta, A.R. Thorner, C. de Torres, C. Lavarino,
M. Suñol, D. Auclair, M.N. Rivera, C. Rodriguez-Galindo, M.D.
Fleming, T.R. Golub, J. Mora
Analysis and interpretation of data (e.g., statistical analysis,
biostatistics, computational analysis): B.D. Crompton, C. Stewart,
A. Taylor-Weiner, G. Alexe, K.C. Kurek, A. Kiezun, S.A. Shukla,
C. Lavarino, A. McKenna, A. Sivachenko, K. Cibulskis, M.S. Lawrence,
P. Stojanov, M. Rosenberg, I. Imaz-Rosshandler, A. Schwarz-Cruz y
Celis, M.D. Fleming, G. Getz, J. Mora, K. Stegmaier
Writing, review, and/or revision of the manuscript: B.D.
Crompton, C. Stewart, G. Alexe, M.L. Calicchio, S.A. Shukla, S.S.
Mehta, A.R. Thorner, C. de Torres, C. Lavarino, M. Suñol, D. Auclair,
C. Rodriguez-Galindo, M.D. Fleming, T.R. Golub, J. Mora, K. Stegmaier
Administrative, technical, or material support (i.e., reporting or
organizing data, constructing databases): B.D. Crompton, C. de Torres,
L. Ambrogio, D. Auclair, S. Seepo, J. Mora
Study supervision: M.D. Fleming, J. Mora, K. Stegmaier
Other (variant validation): B. Blumenstiel
Other (sequencing follow-up assay): M. DeFelice
Acknowledgments The authors thank the members of the Broad Institute Biological
Samples Platform, Genetic Analysis Platform, and Genome Sequenc-
ing Platform for their assistance. The authors also thank Elizabeth
Hwang for technical support for this project .
Grant Support This work was conducted as part of the Slim Initiative for Genomic
Medicine (SIGMA), a joint U.S.–Mexico project founded by the Carlos
Slim Health Institute. This work was also supported by a Stand Up
To Cancer Innovative Research Grant, grant number SU2C-AACR-
IRG0509 (Stand Up To Cancer is a program of the Entertainment
Industry Foundation administered by the American Association for
Cancer Research), Cookies for Kids’ Cancer, Golf Fights Cancer, Brian
MacIsaac Sarcoma Foundation (to K. Stegmaier), Hyundai Hope on
Wheels, Bear Necessities Pediatric Cancer Foundation, St. Baldrick’s
Foundation (to B.D. Crompton), Asociación Pablo Ugarte, Xarxa de
Bancs de tumors de Catalunya, and Instituto de Salud Carlos III Min-
isterio de Sanidad y Politica Social Dirección de Terapias Avanzadas y
Trasplantes Orden SAS/2481/2009 TRA-130 (to J. Mora).
Received December 26, 2013; revised August 19, 2014; accepted
August 29, 2014; published OnlineFirst September 3, 2014.
REFERENCES 1. Lee RS , Stewart C , Carter SL , Ambrogio L , Cibulskis K , Sougnez C ,
et al. A remarkably simple genome underlies highly malignant pediat-
ric rhabdoid cancers . J Clin Invest 2012 ; 122 : 2983 – 8 .
2. Zhang J , Benavente CA , McEvoy J , Flores-Otero J , Ding L , Chen X ,
et al. A novel retinoblastoma therapy from genomic and epigenetic
analyses . Nature 2012 ; 481 : 329 – 34 .
3. Shern JF , Chen L , Chmielecki J , Wei JS , Patidar R , Rosenberg M ,
et al. Comprehensive genomic analysis of rhabdomyosarcoma reveals
a landscape of alterations affecting a common genetic axis in fusion-
positive and fusion-negative tumors . Cancer Discov 2014 ; 4 : 216 – 31 .
4. Cancer Genome Atlas Research N . Genomic and epigenomic landscapes of
adult de novo acute myeloid leukemia . N Engl J Med 2013 ; 368 : 2059 – 74 .
5. Delattre O , Zucman J , Plougastel B , Desmaze C , Melot T , Peter M ,
et al. Gene fusion with an ETS DNA-binding domain caused by chro-
mosome translocation in human tumours . Nature 1992 ; 359 : 162 – 5 .
6. Sorensen PH , Lessnick SL , Lopez-Terrada D , Liu XF , Triche TJ , Denny
CT . A second Ewing’s sarcoma translocation, t(21;22), fuses the EWS
gene to another ETS-family transcription factor, ERG . Nat Genet
1994 ; 6 : 146 – 51 .
7. Smith R , Owen LA , Trem DJ , Wong JS , Whangbo JS , Golub TR , et al.
Expression profi ling of EWS/FLI identifi es NKX2.2 as a critical target
gene in Ewing’s sarcoma . Cancer Cell 2006 ; 9 : 405 – 16 .
8. Grier HE , Krailo MD , Tarbell NJ , Link MP , Fryer CJ , Pritchard DJ ,
et al. Addition of ifosfamide and etoposide to standard chemotherapy
for Ewing’s sarcoma and primitive neuroectodermal tumor of bone .
N Engl J Med 2003 ; 348 : 694 – 701 .
9. Stahl M , Ranft A , Paulussen M , Bolling T , Vieth V , Bielack S , et al.
Risk of recurrence and survival after relapse in patients with Ewing
sarcoma . Pediatr Blood Cancer 2011 ; 57 : 549 – 53 .
10. Ginsberg JP , Goodman P , Leisenring W , Ness KK , Meyers PA ,
Wolden SL , et al. Long-term survivors of childhood Ewing sarcoma:
report from the childhood cancer survivor study . J Natl Cancer Inst
2010 ; 102 : 1272 – 83 .
11. Shukla N , Schiffman J , Reed D , Davis IJ , Womer RB , Lessnick SL ,
et al. Biomarkers in Ewing sarcoma: the promise and challenge of per-
sonalized medicine. A report from the Children’s Oncology Group .
Front Oncol 2013 ; 3 : 141 .
12. Kovar H , Jug G , Aryee DN , Zoubek A , Ambros P , Gruber B , et al.
Among genes involved in the RB dependent cell cycle regulatory cas-
cade, the p16 tumor suppressor gene is frequently lost in the Ewing
family of tumors . Oncogene 1997 ; 15 : 2225 – 32 .
13. Huang HY , Illei PB , Zhao Z , Mazumdar M , Huvos AG , Healey JH ,
et al. Ewing sarcomas with p53 mutation or p16/p14ARF homozygous
deletion: a highly lethal subset associated with poor chemoresponse .
J Clin Oncol 2005 ; 23 : 548 – 58 .
14. Kovar H , Auinger A , Jug G , Aryee D , Zoubek A , Salzer-Kuntschik
M , et al. Narrow spectrum of infrequent p53 mutations and absence
of MDM2 amplifi cation in Ewing tumours . Oncogene 1993 ; 8 :
2683 – 90 .
15. Solomon DA , Kim T , Diaz-Martinez LA , Fair J , Elkahloun AG , Harris
BT , et al. Mutational inactivation of STAG2 causes aneuploidy in
human cancer . Science 2011 ; 333 : 1039 – 43 .
16. Brohl AS , Solomon DA , Chang W , Wang J , Song Y , Sindiri S , et al. The
genomic landscape of the Ewing sarcoma family of tumors reveals
recurrent STAG2 mutation . PLoS Genet 2014 ; 10 : e1004475 .
17. Jawad MU , Cheung MC , Min ES , Schneiderbauer MM , Koniaris
LG , Scully SP . Ewing sarcoma demonstrates racial disparities in
incidence-related and sex-related differences in outcome: an analysis
of 1631 cases from the SEER database, 1973–2005 . Cancer 2009 ; 115 :
3526 – 36 .
18. Bamford S , Dawson E , Forbes S , Clements J , Pettett R , Dogan A , et al.
The COSMIC (Catalogue of Somatic Mutations in Cancer) database
and website . Br J Cancer 2004 ; 91 : 355 – 8 .
19. Lawrence MS , Stojanov P , Mermel CH , Robinson JT , Garraway LA ,
Golub TR , et al. Discovery and saturation analysis of cancer genes
across 21 tumour types . Nature 2014 ; 505 : 495 – 501 .
20. Exome Variant Server NGESPE . Seattle, WA . 2014 . Available from:
http://evs.gs.washington.edu/EVS/ . Data retrieved April 2014.
21. Genomes Project C Abecasis GR , Auton A , Brooks LD , DePristo MA ,
Durbin RM , et al. An integrated map of genetic variation from 1,092
human genomes . Nature 2012 ; 491 : 56 – 65 .
22. Huber M , Siegenthaler G , Mirancea N , Marenholz I , Nizetic D ,
Breitkreutz D , et al. Isolation and characterization of human repetin,
a member of the fused gene family of the epidermal differentiation
complex . J Invest Dermatol 2005 ; 124 : 998 – 1007 .
23. Kim HS , Maeda N . Structures of two HaeIII-type genes in the
human salivary proline-rich protein multigene family . J Biol Chem
1986 ; 261 : 6712 – 8 .
24. Benini S , Manara MC , Cerisano V , Perdichizzi S , Strammiello R , Serra
M , et al. Contribution of MEK/MAPK and PI3-K signaling pathway
to the malignant behavior of Ewing’s sarcoma cells: therapeutic pros-
pects . Int J Cancer 2004 ; 108 : 358 – 66 .
25. Silvany RE , Eliazer S , Wolff NC , Ilaria RL . Interference with the
constitutive activation of ERK1 and ERK2 impairs EWS/FLI-1-
dependent transformation . Oncogene 2000 ; 19 : 4523 – 30 .
26. Zwerner JP , Joo J , Warner KL , Christensen L , Hu-Lieskovan S , Triche
TJ , et al. The EWS/FLI1 oncogenic transcription factor deregulates
GLI1 . Oncogene 2008 ; 27 : 3282 – 91 .
on January 6, 2020. © 2014 American Association for Cancer Research. cancerdiscovery.aacrjournals.org Downloaded from
Published OnlineFirst September 3, 2014; DOI: 10.1158/2159-8290.CD-13-1037

1340 | CANCER DISCOVERY�NOVEMBER 2014 www.aacrjournals.org
Crompton et al.RESEARCH ARTICLE
27. Beauchamp E , Bulut G , Abaan O , Chen K , Merchant A , Matsui W ,
et al. GLI1 is a direct transcriptional target of EWS-FLI1 oncoprotein .
J Biol Chem 2009 ; 284 : 9074 – 82 .
28. Joo J , Christensen L , Warner K , States L , Kang HG , Vo K , et al. GLI1
is a central mediator of EWS/FLI1 signaling in Ewing tumors . PLoS
ONE 2009 ; 4 : e7608 .
29. Zenali MJ , Zhang PL , Bendel AE , Brown RE . Morphoproteomic con-
fi rmation of constitutively activated mTOR, ERK, and NF-kappaB
pathways in Ewing family of tumors . Ann Clin Lab Sci 2009 ; 39 :
160 – 6 .
30. Mateo-Lozano S , Tirado OM , Notario V . Rapamycin induces the
fusion-type independent downregulation of the EWS/FLI-1 pro-
teins and inhibits Ewing’s sarcoma cell proliferation . Oncogene
2003 ; 22 : 9282 – 7 .
31. Martins AS , Mackintosh C , Martin DH , Campos M , Hernandez T ,
Ordonez JL , et al. Insulin-like growth factor I receptor pathway inhi-
bition by ADW742, alone or in combination with imatinib, doxoru-
bicin, or vincristine, is a novel therapeutic approach in Ewing tumor .
Clin Cancer Res 2006 ; 12 : 3532 – 40 .
32. Crompton BD , Carlton AL , Thorner AR , Christie AL , Du J , Calicchio
ML , et al. High-throughput tyrosine kinase activity profi ling identi-
fi es FAK as a candidate therapeutic target in Ewing sarcoma . Cancer
Res 2013 ; 73 : 2873 – 83 .
33. Mermel CH , Schumacher SE , Hill B , Meyerson ML , Beroukhim R ,
Getz G . GISTIC2.0 facilitates sensitive and confi dent localization of
the targets of focal somatic copy-number alteration in human can-
cers . Genome Biol 2011 ; 12 : R41 .
34. Jahromi MS , Putnam AR , Druzgal C , Wright J , Spraker-Perlman H ,
Kinsey M , et al. Molecular inversion probe analysis detects novel copy
number alterations in Ewing sarcoma . Cancer Genet 2012 ; 205 : 391 – 404 .
35. Balbas-Martinez C , Sagrera A , Carrillo-de-Santa-Pau E , Earl J , Marquez
M , Vazquez M , et al. Recurrent inactivation of STAG2 in bladder can-
cer is not associated with aneuploidy . Nat Genet 2013 ; 45 : 1464 – 9 .
36. Solomon DA , Kim JS , Bondaruk J , Shariat SF , Wang ZF , Elkahloun
AG , et al. Frequent truncating mutations of STAG2 in bladder cancer .
Nat Genet 2013 ; 45 : 1428 – 30 .
37. Evers L , Perez-Mancera PA , Lenkiewicz E , Tang N , Aust D , Knosel T ,
et al. STAG2 is a clinically relevant tumor suppressor in pancreatic
ductal adenocarcinoma . Genome Med 2014 ; 6 : 9 .
38. Taylor CF , Platt FM , Hurst CD , Thygesen HH , Knowles MA . Frequent
inactivating mutations of STAG2 in bladder cancer are associated
with low tumour grade and stage and inversely related to chromo-
somal copy number changes . Hum Mol Genet 2014 ; 23 : 1964 – 74 .
39. May WA , Gishizky ML , Lessnick SL , Lunsford LB , Lewis BC , Delattre
O , et al. Ewing sarcoma 11;22 translocation produces a chimeric
transcription factor that requires the DNA-binding domain encoded
by FLI1 for transformation . Proc Natl Acad Sci U S A 1993 ; 90 : 5752 – 6 .
40. Zucman J , Melot T , Desmaze C , Ghysdael J , Plougastel B , Peter M ,
et al. Combinatorial generation of variable fusion proteins in the
Ewing family of tumours . EMBO J 1993 ; 12 : 4481 – 7 .
41. Patocs B , Nemeth K , Garami M , Arato G , Kovalszky I , Szendroi M , et al.
Multiple splice variants of EWSR1-ETS fusion transcripts co-existing
in the Ewing sarcoma family of tumors . Cell Oncol 2013 ; 36 : 191 – 200 .
42. Sgouras DN , Athanasiou MA , Beal GJ , Fisher RJ , Blair DG , Mavrotha-
lassitis GJ . ERF: an ETS domain protein with strong transcriptional
repressor activity, can suppress ets-associated tumorigenesis and is
regulated by phosphorylation during cell cycle and mitogenic stimu-
lation . EMBO J 1995 ; 14 : 4781 – 93 .
43. Grasso CS , Wu YM , Robinson DR , Cao X , Dhanasekaran SM , Khan
AP , et al. The mutational landscape of lethal castration-resistant
prostate cancer . Nature 2012 ; 487 : 239 – 43 .
44. Lawrence MS , Stojanov P , Polak P , Kryukov GV , Cibulskis K ,
Sivachenko A , et al. Mutational heterogeneity in cancer and the
search for new cancer-associated genes . Nature 2013 ; 499 : 214 – 8 .
45. Alexandrov LB , Nik-Zainal S , Wedge DC , Aparicio SA , Behjati S ,
Biankin AV , et al. Signatures of mutational processes in human
cancer . Nature 2013 ; 500 : 415 – 21 .
46. Nik-Zainal S , Alexandrov LB , Wedge DC , Van Loo P , Greenman CD ,
Raine K , et al. Mutational processes molding the genomes of 21
breast cancers . Cell 2012 ; 149 : 979 – 93 .
47. Roberts SA , Lawrence MS , Klimczak LJ , Grimm SA , Fargo D , Stojanov
P , et al. An APOBEC cytidine deaminase mutagenesis pattern is wide-
spread in human cancers . Nat Genet 2013 ; 45 : 970 – 6 .
48. Korbel JO , Campbell PJ . Criteria for inference of chromothripsis in
cancer genomes . Cell 2013 ; 152 : 1226 – 36 .
49. Landau DA , Carter SL , Stojanov P , McKenna A , Stevenson K ,
Lawrence MS , et al. Evolution and impact of subclonal mutations in
chronic lymphocytic leukemia . Cell 2013 ; 152 : 714 – 26 .
50. Hollenhorst PC , Ferris MW , Hull MA , Chae H , Kim S , Graves BJ .
Oncogenic ETS proteins mimic activated RAS/MAPK signaling in
prostate cells . Genes Dev 2011 ; 25 : 2147 – 57 .
51. Pollock JL , Westervelt P , Kurichety AK , Pelicci PG , Grisolano JL , Ley
TJ . A bcr-3 isoform of RARalpha-PML potentiates the development
of PML-RARalpha–driven acute promyelocytic leukemia . Proc Natl
Acad Sci U S A 1999 ; 96 : 15103 – 8 .
52. Haering CH , Farcas AM , Arumugam P , Metson J , Nasmyth K . The
cohesin ring concatenates sister DNA molecules . Nature 2008 ;
454 : 297 – 301 .
53. Deardorff MA , Wilde JJ , Albrecht M , Dickinson E , Tennstedt S ,
Braunholz D , et al. RAD21 mutations cause a human cohesinopathy .
Am J Hum Genet 2012 ; 90 : 1014 – 27 .
54. Guo G , Sun X , Chen C , Wu S , Huang P , Li Z , et al. Whole-genome and
whole-exome sequencing of bladder cancer identifi es frequent altera-
tions in genes involved in sister chromatid cohesion and segregation .
Nat Genet 2013 ; 45 : 1459 – 63 .
55. Kon A , Shih LY , Minamino M , Sanada M , Shiraishi Y , Nagata Y , et al.
Recurrent mutations in multiple components of the cohesin complex
in myeloid neoplasms . Nat Genet 2013 ; 45 : 1232 – 7 .
56. Musio A , Selicorni A , Focarelli ML , Gervasini C , Milani D , Russo S ,
et al. X-linked Cornelia de Lange syndrome owing to SMC1L1 muta-
tions . Nat Genet 2006 ; 38 : 528 – 30 .
57. Kagey MH , Newman JJ , Bilodeau S , Zhan Y , Orlando DA , van Berkum
NL , et al. Mediator and cohesin connect gene expression and chroma-
tin architecture . Nature 2010 ; 467 : 430 – 5 .
58. Yan J , Enge M , Whitington T , Dave K , Liu J , Sur I , et al. Transcription
factor binding in human cells occurs in dense clusters formed around
cohesin anchor sites . Cell 2013 ; 154 : 801 – 13 .
59. Vega H , Waisfi sz Q , Gordillo M , Sakai N , Yanagihara I , Yamada M ,
et al. Roberts syndrome is caused by mutations in ESCO2, a human
homolog of yeast ECO1 that is essential for the establishment of
sister chromatid cohesion . Nat Genet 2005 ; 37 : 468 – 70 .
60. Gnirke A , Melnikov A , Maguire J , Rogov P , LeProust EM , Brockman
W , et al. Solution hybrid selection with ultra-long oligonucleotides
for massively parallel targeted sequencing . Nat Biotechnol 2009 ;
27 : 182 – 9 .
61. Levin JZ , Yassour M , Adiconis X , Nusbaum C , Thompson DA ,
Friedman N , et al. Comprehensive comparative analysis of strand-
specifi c RNA sequencing methods . Nat Methods 2010 ; 7 : 709 – 15 .
62. Cancer Genome Atlas Research N . Comprehensive genomic char-
acterization defi nes human glioblastoma genes and core pathways .
Nature 2008 ; 455 : 1061 – 8 .
63. Cibulskis K , McKenna A , Fennell T , Banks E , DePristo M , Getz G .
ContEst: estimating cross-contamination of human samples in next-
generation sequencing data . Bioinformatics 2011 ; 27 : 2601 – 2 .
64. McKenna A , Hanna M , Banks E , Sivachenko A , Cibulskis K , Kernytsky
A , et al. The Genome Analysis Toolkit: a MapReduce framework
for analyzing next-generation DNA sequencing data . Genome Res
2010 ; 20 : 1297 – 303 .
65. Cibulskis K , Lawrence MS , Carter SL , Sivachenko A , Jaffe D , Sougnez
C , et al. Sensitive detection of somatic point mutations in impure and
heterogeneous cancer samples . Nat Biotechnol 2013 ; 31 : 213 – 9 .
66. Imielinski M , Berger AH , Hammerman PS , Hernandez B , Pugh TJ ,
Hodis E , et al. Mapping the hallmarks of lung adenocarcinoma with
massively parallel sequencing . Cell 2012 ; 150 : 1107 – 20 .
on January 6, 2020. © 2014 American Association for Cancer Research. cancerdiscovery.aacrjournals.org Downloaded from
Published OnlineFirst September 3, 2014; DOI: 10.1158/2159-8290.CD-13-1037

NOVEMBER 2014�CANCER DISCOVERY | 1341
The Genomics of Ewing Sarcoma RESEARCH ARTICLE
67. Robinson JT , Thorvaldsdottir H , Winckler W , Guttman M , Lander
ES , Getz G , et al. Integrative genomics viewer . Nat Biotechnol 2011 ;
29 : 24 – 6 .
68. Carter SL , Cibulskis K , Helman E , McKenna A , Shen H , Zack T ,
et al. Absolute quantifi cation of somatic DNA alterations in human
cancer . Nat Biotechnol 2012 ; 30 : 413 – 21 .
69. Harrow J , Frankish A , Gonzalez JM , Tapanari E , Diekhans M , Kokoc-
inski F , et al. GENCODE: the reference human genome annotation
for The ENCODE Project . Genome Res 2012 ; 22 : 1760 – 74 .
70. Costello M , Pugh TJ , Fennell TJ , Stewart C , Lichtenstein L , Meldrim
JC , et al. Discovery and characterization of artifactual mutations
in deep coverage targeted capture sequencing data due to oxida-
tive DNA damage during sample preparation . Nucleic Acids Res
2013 ; 41 : e67 .
71. DeLuca DS , Levin JZ , Sivachenko A , Fennell T , Nazaire MD , Williams
C , et al. RNA-SeQC: RNA-seq metrics for quality control and process
optimization . Bioinformatics 2012 ; 28 : 1530 – 2 .
72. Mortazavi A , Williams BA , McCue K , Schaeffer L , Wold B . Mapping
and quantifying mammalian transcriptomes by RNA-Seq . Nat
Methods 2008 ; 5 : 621 – 8 .
73. Joerger AC , Fersht AR . The tumor suppressor p53: from structures to
drug discovery . Cold Spring Harb Perspect Biol 2010 ; 2 : a000919 .
on January 6, 2020. © 2014 American Association for Cancer Research. cancerdiscovery.aacrjournals.org Downloaded from
Published OnlineFirst September 3, 2014; DOI: 10.1158/2159-8290.CD-13-1037

2014;4:1326-1341. Published OnlineFirst September 3, 2014.Cancer Discovery Brian D. Crompton, Chip Stewart, Amaro Taylor-Weiner, et al. The Genomic Landscape of Pediatric Ewing Sarcoma
Updated version
10.1158/2159-8290.CD-13-1037doi:
Access the most recent version of this article at:
Material
Supplementary
http://cancerdiscovery.aacrjournals.org/content/suppl/2014/09/04/2159-8290.CD-13-1037.DC1
Access the most recent supplemental material at:
Cited articles
http://cancerdiscovery.aacrjournals.org/content/4/11/1326.full#ref-list-1
This article cites 72 articles, 14 of which you can access for free at:
Citing articles
http://cancerdiscovery.aacrjournals.org/content/4/11/1326.full#related-urls
This article has been cited by 49 HighWire-hosted articles. Access the articles at:
E-mail alerts related to this article or journal.Sign up to receive free email-alerts
Subscriptions
Reprints and
To order reprints of this article or to subscribe to the journal, contact the AACR Publications Department at
Permissions
Rightslink site. Click on "Request Permissions" which will take you to the Copyright Clearance Center's (CCC)
.http://cancerdiscovery.aacrjournals.org/content/4/11/1326To request permission to re-use all or part of this article, use this link
on January 6, 2020. © 2014 American Association for Cancer Research. cancerdiscovery.aacrjournals.org Downloaded from
Published OnlineFirst September 3, 2014; DOI: 10.1158/2159-8290.CD-13-1037