the geological application of wireline logs: a keynote ...loghawk.com/files/keynote_1_.pdf · 115 9...
TRANSCRIPT

115
9 Doveton, J. H., 2002, The geological application of wireline logs:A keynote perspective, in M. Lovell and N. Parkinson, eds.,Geological applications of well logs: AAPG Methods inExploration No. 13, p. 115–122.
The Geological Application of WirelineLogs: A Keynote Perspective
John H. DovetonKansas Geological Survey, University of Kansas, Lawrence, Kansas
ABSTRACT
Wireline logs have served generations of geologists as the principal medium for lithostratigraphiccorrelation in the subsurface. However, the expanding range of logging measurements, noveltechniques of analysis and display, and integrated geological studies have dramatically broad-
ened the scope of geological applications of wireline logs. Subsurface investigations can gain major newinsights into geology from these measurements that supplement traditional geological methods. Modernastronomy has benefited enormously from the expansion of observation beyond the narrow bounds of thevisible spectrum to the range from gamma-ray to radio wavelengths. To some extent, our studies of geol-ogy in the subsurface may progress in an analogous manner, but they will require innovative methods ofdatabase creation and data display that map raw digits into imagery at all scales, with immediate geologicimpact.
INTRODUCTION
The phrase the geological application of wireline log is something of a tautology; what other applications arethere? Because wireline tools make measurements of properties of rocks in the subsurface, their loggingrecords are intrinsically geological. To be sure, a semantic shift could be attempted to confine wireline logs togeophysics. However, even this proves increasingly difficult because, for example, the properties recorded bysome nuclear tools measure elemental concentrations by techniques similar to those used in geochemical lab-oratories. As another example, the resolution of borehole electrical imagery has long passed the point atwhich small-scale sedimentary features and trace fossils are observed and studied routinely. Fundamentally, ahost of rock properties is measured by logging tools, and these are part of the larger enterprise called geology.
But can logging data and their analysis by petrophysical methods be considered an integral part of geol-ogy? Petrophysical logs are a vital source of geologic information from the subsurface (where the vast bulk ofrocks resides), which otherwise would be a geophysical world pierced by occasional geological glimpses pro-vided by core and fragmentary drill cuttings. However, if assessments of subsurface geology from wirelinelogs are included within the fold of geology, it would probably be useful to make some distinction from theclassical geology of outcrop studies.

THE ROLE OF LOGS IN SUBSURFACE GEOLOGY
Science, by its very nature, is an agent for change. Newmodels or ways of looking at the world can gain ground onlythrough rethinking in an expanded synthesis. As in geology,developments in astronomy have changed both our under-standing of the universe and the methods used to study it. Butis an astronomer still identified by his use of an optical tele-scope? How does a specialist in stellar X rays relate to coreastronomy? What is the appropriate name for astronomicalstudies outside the visible spectrum? In truth, there has beena radical change in astronomy in this century. Ground-basedtelescopes have been limited to a rather “weathered” view ofthe universe because of atmospheric fluctuations and lightpollution from natural and man-made sources that perturbthe night sky. The operation of the orbital Hubble telescopehas moved optical observation above the disruptive atmos-phere, for fresh pictures that are rich in new detail. Perhapsthe excitement felt by an astronomer looking at Hubbleimages is akin to that of the field geologist who works for thefirst time with pristine core from a formation in the subsur-face that was seen previously only in its weathered outcropexpression.
More important, in this analogy with wireline-loggingtool sensors, the range of astronomical observation hasexpanded dramatically from the narrow keyhole of the visiblespectrum (Figure 1). Studies in the broader spectrum canhelp astronomy only in its fundamental purpose of a descrip-tive mapping of the universe. So, for example, the orbitingCompton Gamma Ray Observatory has done much to revo-lutionize our understanding of the universe from its observa-tions across an extraordinary six decades of the electromag-netic spectrum. Gamma-ray images show celestial features
that are invisible to conventional astronomy in a way analo-gous to that of the gamma-ray spectrum, which reveals pat-terns of striking geological significance in visually monoto-nous shales.
Interestingly enough, there appears to be no widely ac-cepted collective name that distinguishes these newer astro-nomical methods from classical telescopy, other than the“new astronomy” (Henbest and Marten, 1996). Clearly, thisterm will seem increasingly absurd as “new” ages to “old.”However, there are already signs that what is now novel andstrange will be absorbed as an organic part of mainstreamastronomy. Any distinction of a “new astronomy” will simplyfade away as its usefulness comes to an end. Perhaps someterm such as “virtual geology” might serve a similar role, as aterm that promotes the use of logs in subsurface geologybeyond providing formation tops for a lithostratigraphic cor-relation framework. Ultimately, methods that would now betermed petrophysical should become such an integral part ofsubsurface geological study that it would be hard to imaginethe practice of subsurface geology without them. At thatpoint, the geological application of wireline logs would be acore discipline of subsurface geology and would automati-cally be associated with that name. Until that time, “virtualgeology” or other unsatisfactory terms probably will be usedto describe newer methods that are receiving limited treat-ment in subsurface geology manuals and textbooks.
Finally, how should the spread of petrophysical methodsof subsurface geological investigation be incorporated withintraditional geology? In considering an answer, it is importantto consider the evolution of geological investigations in thiscentury. Until about forty years ago, comparatively little wasknown of the geology in the subsurface of southern England,although an impressive amount had been inferred from clas-sical field studies. On the face of it, this is a remarkable situa-
Doveton116
Figure 1. The electromagnetic spectrum.

tion for one of the most densely populated regions on theplanet, but it reflected the needs and concerns of society. Ear-lier in the century, field geological methods were instrumentalin the location and exploitation of coal resources and metallicores that fueled the Industrial Revolution. With the shift toliquid and gaseous fossil fuels, the higher demands ongroundwater, and the increasing concern about subsurfacecontaminants, borehole penetration of British rocks both off-shore and onshore has increased substantially. Clearly, theadditional information from the subsurface has advanced thecause of traditional geology. However, at the same time, manycritical rock properties of pore networks and fluid contents,which are target parameters of subsurface investigation, arenot accessible to the eye or hammer. Even if they were, theirsystematic analysis would require numerical estimates ratherthan visual descriptions.
Therefore, in satisfying the needs of contemporary soci-ety, tried and true field methods should be maintained vigor-ously, while new techniques and goals are incorporated. Ofcourse, much of this is already happening, with field studiesof reservoir- and aquifer-analog exposures at a hierarchy ofscales that cannot be matched in subsurface studies. Eventhe richest petrophysical data set is currently limited to de-scription of a very narrow borehole, while the coarse scale ofseismic resolution is still largely insensitive to important fea-tures that can be seen on the outcrop. Reliance on core stud-ies for subsurface geology has always been limited by theexpense of recovery but, sad to say, the perceived expense ofhousing existing core is now leading to the loss of large col-lections through cost-cutting measures, much precipitatedby mergers of oil companies. By contrast, the costs of digitaldata storage continue to fall, so that the preservation of pet-rophysical measurements is not under immediate threat,other than from simple neglect—a failure of geologists to ap-preciate the rich information content of logs concerning sub-surface geology.
SUBSURFACE VIRTUAL GEOLOGICAL MAPPING
Lang (1986) noted that the overwhelming use of geo-physical logs was as an aid for lithostratigraphic correlation.Almost certainly, this observation holds true today, but corre-lation is done increasingly on geologic workstations usingraster logs rather than by grappling with logs on paper copy(Montgomery, 1997). Raster logs are merely electronicimages of the paper copy, so correlation remains entirely apattern-recognition task for the geologist. Vector logs are cur-rently more expensive than raster logs but contain the digitalinformation that can be processed for compositional analysis.In addition, the digits of the vector log allow correlation by
automated methods. Regardless of whether done visually orby computer methods, the end result of correlation betweenwell logs is a set of formation tops that, when linked betweenborehole control, describe surfaces. The geometrical infor-mation in maps and cross sections is rich in its geologicalimplications regarding not only tectonic history but alsoregional sedimentary architecture (Figure 2). Automatedcorrelation methods have an additional advantage of beingable to consider several wells simultaneously in a 3-D synthe-sis that precludes geometrical impossibilities in their searchfor the most reasonable solution (Olea et al., 1997). A by-product of this approach can be the generation of a giant“dipmeter log” among boreholes (Figure 3); its patterns ofdip vectors show unconformities and records of compactionand tectonic movements.
The older electrical logs responded primarily to pore vol-umes and fluids; this inhibited more imaginative geologicalapplications, beyond the correlative tracing of unit bound-aries. However, in sedimentology, the study of vertical grain-size differences as an indication of depositional facies encour-aged the recognition of signatures in log-shape profiles, andmore detailed interpretation was made possible by electricalborehole imagery. This depositional-environment analysis hasbeen termed the “second age of log analysis” by Selley (1992),who also considered a third age to be the use of logs in theanalysis of diagenetic changes of leaching and cementation.
Everyone has a different reading of history, but it couldbe argued that a major shift in geological content occurredwith the introduction of nuclear logs. Up to that time, litho-logical typing tended to be restricted to a binary distinctionbetween rocks with low resistivity (typically shales) and rockswith relatively high resistivity (“nonshales”). To be sure, theintroduction of the first nuclear log, the gamma-ray log,maintained the focus on differentiation of shales from otherrock types, but subsequent refinement of the gamma-ray logto spectral estimates of potassium, uranium, and thoriumsources has markedly extended its range of geological appli-cation. In particular, the widespread proliferation of neutron-density- and photoelectric-logging measurements has madepossible the indirect estimation of mineral composition inlengthy sections and in multiple locations within many sedi-mentary basins. Computer processing of these compositionalprofiles (e.g., Figure 4) is relatively straightforward, usinginversion methods that follow the pioneering work of Savre(1963). Although geochemical logs are much rarer in occur-rence, extensions of this inversion procedure applied to mea-sured elemental concentrations led to mineralogical profilesof igneous, metamorphic, and sedimentary sequences thatcan be considered to be normative rock compositions (Dove-ton, 1986).
Compositional mapping of formations across a region inthe subsurface poses special problems, the resolution of
The Geological Application of Wireline Logs: A Keynote Perspective 117

Doveton
118
Figure 2. Regional lithostratigraphic section from automated correlation of gamma-ray logs of the Muncie Creek (Pennsylvanian) genetic unit in Kansas. The section crosses thecarbonate-dominated Upper Pennsylvanian shelf. The shelf has a pronounced carbonate-bank margin that downlaps into shales in the northern end of a flysch foredeep in theOuachita Basin of Oklahoma. Adapted from Olea et al. (1998). Lithostratigraphy is indicated by gamma-ray log; graphic patterns represent percentage of shale content ranges,with 0 to 20 shown as black, 20 to 60 as gray stipple, and greater than 60 percent as dark gray. White marks are intervals that are not correlated.

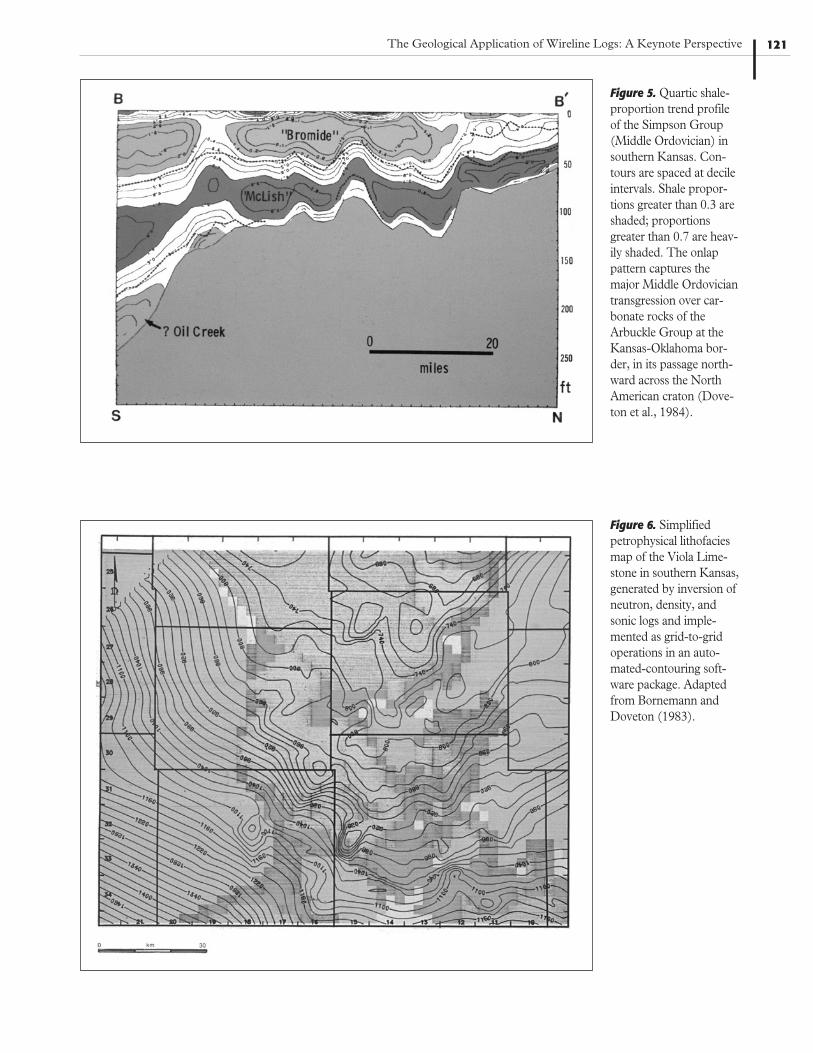
which is needed. Individual boreholes could be thought of as“outcrops,” but wireline logs of them have very limited lateralranges. Logs used in compositional estimation must be cor-rected for environmental conditions and normalized for mea-surement error. Broad trends in simple (one-component)compositional changes can be mapped in the three dimen-sions of depth and geographic axes, by interpolating statisti-cal moments of logs (Figure 5). Alternatively, kriged esti-mates can be mapped areally, based on semivariogram(autocorrelation) analysis of spatial variability of the loggedproperty, between wells. Mapping of multiple componentscan be done by a 2-D extension of the inversion procedure
that is used in individual wells. In this procedure, inversematrix coefficients are applied to map grids of log propertiesrather than to log responses of zones in depth. When appliedto the compositional estimation of relatively thick formations,these interpretive maps (e.g., Figure 6) have been validatedby “ground truth” provided by the more limited core control(Bornemann and Doveton, 1983 ).
Advances in technology are interesting in their own right,but in a cost-conscious age, practical applications and bene-fits are of primary concern. The Kansas Geological Surveycontinues to map surface geology, but it is asked more oftento address problems of the subsurface, concerning fossil
The Geological Application of Wireline Logs: A Keynote Perspective 119
Figure 3. Regional-dip plot from automated correlation of gamma-ray logs among three wells on the downthrown block of the Hum-boldt fault, northern Kansas. The increased throw with depth shows the Humboldt fault to be a growth fault, active over long geo-logic time; breaks in the dip pattern show an excellent match with known regional unconformities. Adapted from Olea et al (1997).

fuels, water, and plumes of pollutants. The principal sourceof subsurface data is the survey’s collection of hundreds ofthousands of paper wireline logs. Increasingly, this passivearchive of analog traces is being converted to digital data thatare stored in a dynamic medium. The Digital PetroleumAtlas and the Dakota Aquifer Program are two examples ofprojects in which both logging data and petrophysical imagesare immediately accessible on the World Wide Web(www.kgs.ukans.edu). In a more ambitious initiative, the sur-vey is compiling a statewide petrophysical database of mod-ern digital logs as the Kansas Virtual Geology Program.Although the core of the completed database will consist ofraw digits from individual wells, the data will be coupled withsoftware for analysis and display of regional geology. KansasVirtual Geology will be available on the Web and will serve asa virtual observatory of Kansas subsurface geology.
Special problems—such as interpolation and normaliza-tion—are to be surmounted, but Kansas Virtual Geology willbe used to reach beyond formation surface topology to map-ping of a wide variety of petrophysical properties and theirtransforms. Have these activities distracted the survey fromits historic mission of mapping and surveying the rocks ofKansas? It hardly seems so, when its core library is expandingto be one of the largest in the U.S. Midcontinent. With theincreasing availability of digital cameras, digital core imagesand logging data probably will be integrated closely in a sub-surface geological synthesis. Clearly, the road forward callsfor close integration of traditional and newer methods andinformation in the mapping of subsurface geology. The expe-rience of the Kansas Geological Survey is being replicated byother geological agencies, with variations dictated by localneeds and availability of subsurface information, principallywireline logs.
CONCLUSIONSAs demands of society increase for more sources of
water, more energy resources, environmental cleanup, andcontrols of pollution sources, studies of subsurface geologywill increase and prosper. The geological application of wire-line logs will be a key component of this work. Some geolo-gists might regret this development as being somewhat aliento the subject they learned as students. However, it is to behoped that informed reflection will show this to be an excitingopportunity to learn new skills—skills that open facets ofgeology that were unimaginable a generation ago.
Doveton120
Figure 4. Example of a compositional profile of a sequence ofMiddle Ordovician strata in northern Kansas, computed frominversion of gamma-ray, photoelectric-factor, neutron, anddensity logs.
The Geological Application of Wireline Logs: A Keynote Perspective 121
Figure 5. Quartic shale-proportion trend profileof the Simpson Group(Middle Ordovician) insouthern Kansas. Con-tours are spaced at decileintervals. Shale propor-tions greater than 0.3 areshaded; proportionsgreater than 0.7 are heav-ily shaded. The onlappattern captures themajor Middle Ordoviciantransgression over car-bonate rocks of theArbuckle Group at theKansas-Oklahoma bor-der, in its passage north-ward across the NorthAmerican craton (Dove-ton et al., 1984).
Figure 6. Simplifiedpetrophysical lithofaciesmap of the Viola Lime-stone in southern Kansas,generated by inversion ofneutron, density, andsonic logs and imple-mented as grid-to-gridoperations in an auto-mated-contouring soft-ware package. Adaptedfrom Bornemann andDoveton (1983).

Doveton122
REFERENCES CITEDBornemann, E., and J. H. Doveton, 1983, Lithofacies mapping of Viola
Limestone in south-central Kansas based on wireline logs: AAPG Bul-letin, v. 67, p. 609–623.
Doveton, J. H., 1986, Log analysis of subsurface geology: New York, WileyInterscience, 273 p.
Doveton, J. H., K. A. Zhu, and J. C. Davis, 1984, Three-dimensional trendmapping using gamma-ray well logs, Simpson Group, south-centralKansas: AAPG Bulletin, v. 69, no. 6, p. 690–703.
Henbest, N., and M. Marten, 1996, The new astronomy, 2nd. ed.: Cam-bridge University Press, 240 p.
Lang, W. H., 1986, Correlation with multiple logs: The Log Analyst, v. 27,p. 43–52.
Montgomery, S. I., 1997, Raster logs may be basis for a geologic worksta-tion: Oil & Gas Journal, April 7, p. 84–88.
Olea, R. A., J. C. Davis, and D. F. Merriam, 1997, Automatic regional wire-line log lithostratigraphic correlation in Kansas using CORRELATOR,in V. P. Glahn, ed., Proceedings of International Association of Miner-alogic Geologists, 1997, p. 341–348.
Olea, R. A., W. L. Watney, and J. C. Davis, 1998, High-resolution wirelinecorrelation for sequence stratigraphic analysis in southwest Kansas, inA. Buccianti, G. Nardi, and R. Potenza, eds., Proceedings of Interna-tional Association of Mineralogic Geologists, 1998, p. 639–644.
Savre, W. C., 1963, Determination of a more accurate porosity and mineralcomposition in complex lithologies with the use of sonic, neutron, anddensity surveys: Journal of Petroleum Technology, v. 15, p. 945–959.
Selley, R. C., 1992, The third age of wireline log analysis: Application toreservoir diagenesis, in A. Hurst, C. M. Griffiths, and P. F. Worthing-ton, eds., Geological application of wireline logs II: Geological Societyof London, Special Publication 65, p. 377–387.