the gerrymandering of school attendance zones and the ... · pdf filedrawing on...
TRANSCRIPT
The Gerrymandering of School AttendanceZones and the Segregation of Public Schools:
A Geospatial Analysis
Meredith P. RichardsSouthern Methodist University
In this study, I employ geospatial techniques to assess the impact of schoolattendance zone ‘‘gerrymandering’’ on the racial/ethnic segregation ofschools, using a large national sample of 15,290 attendance zones in 663districts. I estimate the effect of gerrymandering on school diversity andschool district segregation by comparing the racial/ethnic characteristics ofexisting attendance zones to those of counterfactual zones expected in theabsence of gerrymandering. Results indicate that the gerrymandering ofattendance zones generally exacerbates segregation, although it hasa weaker effect on the segregation of Whites from Blacks and Hispanics.Gerrymandering is particularly segregative in districts experiencing rapidracial/ethnic change. However, gerrymandering is associated with reduc-tions in segregation in a substantial minority of districts, notably thoseunder desegregation orders.
KEYWORDS: gerrymandering, attendance zones, segregation, geospatial analysis
In 1968, the Kerner Commission famously concluded that America was‘‘moving towards two societies, one black, one white—separate and
unequal’’ (U.S. National Advisory Commission on Civil Disorders, 1968). Inthe decades following the Kerner report, the Fair Housing Act of 1968 andother achievements of the civil rights era ushered in substantial improve-ments in residential segregation by race and ethnicity (Charles, 2003;Clark, 2002; Iceland, Weinberg, & Steinmetz, 2002; Logan, Stults, & Farley,2004; Timberlake & Iceland, 2007). Despite the strong association betweenwhere students live and where they attend school, segregation trends forpublic schools have been much less promising than residential trends
MEREDITH P. RICHARDS is an assistant professor of education policy and leadership atSouthern Methodist University, 3101 University Blvd., Dallas, TX 75205; e-mail:[email protected]. Her research focuses on exploring the effects of educationalpolicies on equity and stratification in schools and situating policies in their metro-politan and geographic contexts.
American Educational Research Journal
December 2014, Vol. 51, No. 6, pp. 1119–1157
DOI: 10.3102/0002831214553652
� 2014 AERA. http://aerj.aera.net

(Fiel, 2013; Frankenberg, Lee, & Orfield, 2003; Frankenberg & Orfield, 2012;G. Orfield, Kucsera, & Siegel-Hawley, 2012; Reardon & Owens, in press;Reardon, Yun, & Eitle, 2000; Stroub & Richards, 2013).
As a result of these trends, in the decades following Brown, schools wereconsistently less segregated than the neighborhoods in which they were situ-ated, suggesting that schools played an important role in ameliorating socialinequities by mitigating the association between patterns of residence andschool attendance (Reardon & Yun, 2001). However, as residential segregationhas continued to decline despite increases or, at best, plateaus in school seg-regation, schools are now often as segregated as the neighborhoods in whichthey are situated (Ong & Rickles, 2004), or even more segregated than theirneighborhoods (M. Orfield, 2002; Reardon & Yun, 2001; Saporito & Sohoni,2006, 2007; Sohoni & Saporito, 2009). This suggests that schools, which servedas mechanisms of racial integration after Brown, now are not only reproduc-ing existing patterns of residential segregation, but may also be actively facil-itating segregation beyond residential patterns.
This shift in the role of schools from an instrument of integration toa mechanism for segregation underscores the importance of understandingthe causal mechanisms by which public schools perpetuate stratificationby race and ethnicity. Accounts of changes in public school segregation gen-erally fall into two camps. First, a large body of work has considered theimpact of eroding legal support for desegregation efforts and the dismantlingof desegregation policies (Frankenberg et al., 2003; Logan, 2002; G. Orfield,Bachmeier, James, & Eitle, 1997; G. Orfield & Monfort, 1992; G. Orfield,Schley, Glass, & Reardon, 1993; G. Orfield & Yun, 1999; Reardon et al.,2000; Reardon & Yun, 2001). Consistent with this perspective, several studieshave empirically linked the end of desegregation and grants of unitary statusto subsequent resegregation in schools (An & Gamoran, 2009; Lutz, 2011;Reardon, Grewal, Kalogrides, & Greenberg, 2012).
Second, an emerging body of work has examined the expanding role ofschool choice as a mechanism of stratification beyond residential location,documenting associations between choice policies and racial/ethnic stratifi-cation, including charter schools (Bifulco & Ladd, 2007; Renzulli & Evans,2005), magnet schools (Saporito, 2003), private schools (Saporito &Sohoni, 2006, 2007), voucher programs (Brunner, Imazeki, & Ross, 2010),intradistrict choice/open enrollment (Holme & Wells, 2008), and interdistrictchoice (Holme & Richards, 2009). Despite the growing emphasis on publicschool choice, however, roughly four fifths of public school students stillattend the traditional school to which they are geographically assigned(National Center for Education Statistics [NCES], 2009).
An alternative, albeit related, explanation for increasing rates of schoolsegregation vis-a-vis residential segregation focuses on the role of educa-tional boundaries themselves. According to this perspective, schools maybe more segregated than residential patterns would suggest because
Richards
1120

educational institutions have established inequitable boundaries that allowschools to maximize the inequities of their surrounding areas. By carvingup a geographic area in a manner that is nonneutral with respect to therace of the student population, educational boundaries may have lastingand profound consequences for equity in American schools. Despite theirprofound effect on the educational opportunities of the vast majority of pub-lic school students, by determining who attends which schools and districts,educational boundaries have received scant empirical attention.
The bulk of empirical research on the effects of educational boundarieson segregation has focused on the indirect effects of boundaries on segrega-tion. Drawing on Tiebout’s (1956) theory of public choice, these perspec-tives generally argue that educational boundaries facilitate segregationthrough their effects on residential choices or ‘‘foot voting.’’ Individualschoose where to live as a function of their individual preferences and thepublic services offered by a given jurisdiction. Applied to the educationalcontext, because individuals choose where to live in part on the basis oftheir neighbors—often opting to live near people more similar to them interms of race/ethnicity—as well as on the basis of the school that their childwill attend, educational boundaries hold the potential to segregate(Clotfelter, 2004; Holme & Finnigan, in press; M. Orfield, 2002; Weiher,1991). Consistent with this perspective, research has demonstrated that met-ropolitan areas that are more ‘‘fragmented,’’ in that they have more educa-tional boundaries per capita, are more segregated than metropolitan areaswith relatively fewer educational boundaries to signal residential sorting(Bischoff, 2008). It should be emphasized that such accounts generallyexplain school segregation as a function of residential segregation alongschool boundaries. As such, they contribute little to understanding the differ-ences in segregation between schools and their neighborhoods.
This study adopts an alternative perspective on the role of educationalboundaries in perpetuating the problem of educational segregation andthe residential-educational segregation gap. Rather than focusing on theindirect role that educational boundaries play in facilitating residential deci-sions, I examine the direct effect that one important type of educationalboundary, school attendance zones, plays in structuring the equity ofschools. According to this perspective, by carving up the area of a districtin ways that are not racially neutral, ‘‘gerrymandered’’ boundaries may pro-vide an additional layer of stratification that exacerbates existing patterns ofresidential segregation. Alternately, however, gerrymandered boundariesmay serve to ameliorate residential segregation.
Attendance Zone Gerrymandering
Ample anecdotal and historical evidence suggests that the gerrymander-ing of school attendance zones was a common practice for school districts to
Gerrymandering of School Attendance Zones
1121

achieve greater homogeneity in response to racial diversity or change.Despite the absence of de jure segregation, northern school districts oftenresponded to the skyrocketing Black population in the 1940s and 1950sby achieving de facto segregation by drawing their school boundaries tomaintain racial separation (Clark, 1987; Leigh, 1997). As Gunnar Myrdalobserved, ‘‘[s]chool boundaries . . . are usually set at the boundary of thewhite and Negro neighborhoods’’ (Sugrue, 2009, p. 187). Jacobs (1998)describes how Columbus, Ohio, used school siting, as well as gerryman-dered and noncontiguous district boundaries, to maintain a ‘‘dual system’’in the 1970s. Although such efforts were deemed unconstitutional in Keyesv. Denver School District No. 1 (1973), they were only justiciable if it couldbe demonstrated that they resulted from discriminatory intent, often a diffi-cult evidentiary burden (Douglas, 1995). As a result, it has been reported thatschool districts in the post-Brown era responded to desegregation pressuresby locating schools and drawing their attendance boundaries to intensifysegregation and undermine integration efforts (Clark, 1987; G. Orfield &Eaton, 1997). Evidence from current zoning proceedings and case studiessuggests that districts continue to draw racially inequitable boundaries(League of Women Voters, 2008; M. Orfield & Luce, 2009; Siegel-Hawley,2013; Vaznis, 2009).
However, attendance zone boundaries may not always be gerryman-dered to segregate—indeed, it is both logically and historically feasiblethat they may be gerrymandered for the purpose of achieving greater inte-gration. Drawing race-conscious boundaries for the purposes of remedyingpast discrimination was endorsed by the Supreme Court in Swann v.Charlotte-Mecklenburg Board of Education (1971), a ruling that reinforcedthe irregular boundaries and busing strategies of the desegregation era.Proponents of integration have often decried the attempt to return to ‘‘neigh-borhood schools’’ (Frankenberg et al., 2003; G. Orfield & Eaton, 1997), argu-ing that the irregular boundaries and busing systems that are still employedby many districts as legacies of the desegregation era are necessary to pro-mote racial diversity in highly segregated areas. Indeed, in the only directexamination of the effects of educational gerrymandering, Clark (1987) con-cluded that gerrymandering of attendance zone boundaries in Topeka in the1950s and 1960s were either neutral or desegregative in nature. Morerecently, in his deciding opinion in Parents Involved v. Seattle SchoolDistrict No. 1 (2007), which rendered unconstitutional the use of studentrace in voluntary student assignment plans, Justice Kennedy endorsed theadoption of race-conscious districting plans as a means of achieving raciallybalanced schools. Thus, while race-conscious attendance zone boundariesmay be responsible in part for the resegregation of schools relative to neigh-borhoods, in other contexts they may also have the positive effect of amelio-rating severe patterns of residential segregation.
Richards
1122

The anecdotal and historical nature of prior evidence on gerrymander-ing in education highlights the necessity of empirical evidence examiningthe direct role that attendance zone boundaries play in perpetuating or ame-liorating racial inequities. Fortunately, advances in geospatial techniques,coupled with recent release of spatial data on educational boundaries,including school attendance boundaries via the School AttendanceBoundary Information System (SABINS), discussed at length below, haverendered empirical investigation of inherently spatial issues such asgerrymandering more methodologically tractable (Hogrebe & Tate, 2012).
In this vein, recent research directly examining contemporary publicschool attendance zones (Richards & Stroub, in press) has demonstratedthat attendance zone boundaries are highly gerrymandered. Using a largenational sample of 23,945 attendance zones from SABINS, Richards andStroub computed geospatial measures of gerrymandering derived from theelectoral literature. Using these metrics, Richards and Stroub concludedthat attendance zones are only slightly less gerrymandered than legislativedistricts. However, the researchers found significant variability ingerrymandering across contexts. Attendance zones of schools establishedsince 1991 are substantially more gerrymandered than those of schools ofschools established earlier, suggesting that attendance zone gerrymanderingmay be worsening over time. Gerrymandering was also particularly severe inschool districts in the formerly de jure segregated South, in suburban andrural districts outside the urban core, and in districts experiencing rapidincreases in racial/ethnic diversity. Interestingly, gerrymandering wasinversely related to segregation, such that districts with higher levels of seg-regation were less gerrymandered than less segregated districts.
Thus, empirical evidence on the gerrymandering of contemporary atten-dance zones indicates that school attendance zone gerrymandering is severe,and may be worsening over time. Moreover, it underscores the racial dimen-sion of gerrymandering. However, such correlational evidence cannot sub-stantiate any causal claims linking gerrymandering to the racial/ethnic ofsegregation of schools. In particular, it cannot distinguish between affirma-tive and segregative gerrymandering. That gerrymandering is particularlysevere in districts with low levels of segregation may indicate thatgerrymandering serves to integrate, and that boundaries are drawn affirma-tively in ways that reduce the racial/ethnic disparities among schools, asfound by Clark (1987). Alternately, it may suggest that gerrymandering isemployed as a segregative mechanism for subverting higher levels of resi-dential integration, consistent with historical and contemporary accounts(M. Orfield & Luce, 2009; Siegel-Hawley, 2010; Vaznis, 2009). Thus, wheredistricts are already highly residentially segregated by race, gerrymanderingmay not be employed to achieve racial segregation in schools.
Gerrymandering of School Attendance Zones
1123

Purpose of the Study
Prior research suggests that public school attendance zones are highlygerrymandered into irregular shapes. However, this correlational evidencedoes not provide direct evidence of the consequences of this gerrymander-ing for the racial/ethnic equity of schools. Historical evidence suggests thatthis gerrymandering may be segregative in nature, employed to intensifysegregation and undermine integration efforts. Alternately, gerrymanderingmay be an affirmative legacy of the desegregation era, serving to enhanceintegration in districts that are residentially segregated. In this study, I seekto disentangle these effects, providing initial evidence regarding whetherand in what contexts gerrymandering serves to segregate or integrate stu-dents by race and ethnicity. Toward that end, this study addresses the fol-lowing primary research questions, assessing the effects of gerrymanderingat the school and district levels:
Research Question 1. How does school attendance zone gerrymandering affectthe racial/ethnic diversity of schools?
Research Question 2. How does school attendance zone gerrymandering affectthe racial/ethnic segregation of school districts?
Prior evidence suggests that the severity of attendance zonegerrymandering varies widely across geographic and demographic contexts.As such, in addition to overall effects, I examine how the impact ofgerrymandering on racial/ethnic segregation differs across contexts, payingparticular attention to the dimensions of variability identified in priorresearch. I attend to differences in the impact of gerrymandering by schooldistrict locality (i.e., urban, suburban, town, rural), by state history of de juresegregation, and by school district desegregation status (i.e., under activedesegregation order, dismissed desegregation order, never under order).In addition, I examine how the effects of gerrymandering vary dependingon the level of racial/ethnic and socioeconomic change of the school district.
Gerrymandering as Student Exchange
In considering the issue of educational gerrymandering, this study isguided by a framework of ‘‘student exchange’’ adapted from the politicalrealm. Previous research on educational boundaries has focused on therole that boundaries play in the residential choices of individuals; by con-trast, the student exchange framework adopted in this study focuses onhow schools choose students through irregular boundaries that include cer-tain students at the expense of others. According to the student exchangeframework, the delineation of attendance zone and district boundaries pro-vides a mechanism for segregating schools beyond existing patterns of
Richards
1124

residential segregation. In addition, the student exchange framework alsoacknowledges the potentially affirmative role that irregular attendance zonesmay play in increasing diversity and maintaining integration by weakening thelink between residency and schools. Below, I formalize the framework of stu-dent exchange, situating it in the literature on electoral gerrymandering.
As Fischel (2009) has noted, the gerrymandering of educational bound-aries may be viewed not as an ‘‘accident of geography,’’ but as the manifes-tation of an intentional process engineered to include certain students at theexpense of others. In this vein, Angel and Parent (2011) have conceptualizedelectoral gerrymandering as the spatial manifestation of a process of ‘‘voterexchange,’’ which creates irregular boundaries by including voters in certaingeographic areas and excluding voters in others. Gerrymandering may bedefined from a voter exchange perspective as follows:
The distortion of an election district shape from a more compact toa less compact one by exchanging voters of one party (or minoritygroup) living close by for voters of another party (or minority group)living further away. (Angel & Parent, 2011, p. 96).
In a process of voter exchange through electoral gerrymandering, theboundaries of an otherwise geographically cohesive and efficient voting dis-trict are manipulated to achieve a more advantageous composition of voters,in terms of political affiliation or race, by excluding some nearby and replac-ing them with voters living farther away (League of United Latin AmericanCitizens v. Perry, 2006). Boundary distortion and irregularity is thereforean artifact of the process of ‘‘foraging’’ for desirable voters and ‘‘expelling’’undesirable voters (Angel & Parent, 2011). As Justice Stevens argued in hisdissenting opinion in Vieth v. Jubelirer (2004), the shape of a district ipsofacto is evidence of the process of electoral gerrymandering, in that ‘‘a dis-trict’s peculiar shape might be a symptom of an illicit process in the linedrawing purpose.’’ Of course, district shapes may diverge from optimalityfor a variety of reasons, including congruence with geographic boundaries,such as irregular coastlines or islands, and coterminity with other jurisdic-tional boundaries. However, it may be argued that the extent to which a dis-trict diverges from regularity, after accounting for these effects, may be inter-preted as evidence of a process of voter exchange.
Mirroring the ‘‘voter exchange’’ perspective on electoral gerrymander-ing, I adopt a ‘‘student exchange’’ perspective to understanding school atten-dance zone gerrymandering. Figure 1 illustrates how the process of studentexchange is manifested in the gerrymandering of attendance zone bound-aries. According to this perspective, the irregularity of attendance zonesreflects a process of student exchange wherein certain students nearby areexcluded in lieu of other students residing farther away. The constructionof attendance zones is therefore an exclusionary and inclusionary process
Gerrymandering of School Attendance Zones
1125

that ‘‘zones in’’ certain students and ‘‘zones out’’ others. Where gerrymander-ing is segregative, it would zone out more racially/ethnically dissimilar stu-dent in favor of more similar students. However, gerrymandering may alsobe affirmative, zoning out more racially/ethnically similar students in favoror more dissimilar students.
Method
Analytic Technique
As Figure 1 demonstrates, the student exchange framework is premisedon the assumption that we can compare an attendance zone’s actual bound-ary to the ‘‘natural’’ boundary that an attendance zone would be expected totake in the absence of gerrymandering. This boundary may then be com-pared to the current boundaries to determine the extent to which the atten-dance zone has been gerrymandered to exchange students. In this study, Iexploit this framework to assess the effect of school attendance zonegerrymandering on the racial/ethnic diversity of schools (ResearchQuestion 1) and the segregation among schools within districts (Research
Figure 1. Student exchange process as a function of school attendance zone
gerrymandering. The white star depicts location of the attendance zone’s school.
The dark gray figure depicts the existing, gerrymandered attendance zone. The
circle depicts the ‘‘natural,’’ compact attendance zone that would be expected
in the absence of gerrymandering. The hatched area indicates students ‘‘zoned
out’’ by gerrymandered district. The dotted area indicates students ‘‘zoned in’’
by gerrymandered district. The solid gray area indicates students in the ‘‘core
zone.’’
Source. Figure adapted from Angel and Parent (2011).
Richards
1126

Question 2). I employ geospatial techniques to compare the racial/ethniccharacteristics of students residing in existing school attendance zones tothose residing in natural zones that would be expected in the absence ofgerrymandering.
In illustrating the student exchange framework above, I operationalizethe natural zone of a school as a circle equal in land area to the actual atten-dance zone, centered on the geographic location of the focal school. Circlesare theoretically instructive because they represent the most compact possi-ble geometric shapes (Angel & Parent, 2011), in that (a) they maximize thearea contained within a perimeter of given length and (b) they minimize theperimeter for an area of given size. In considering the natural attendancezone for a given school, the circle is ideal because it does not perpetrateany exchange of students—all residents living in the circular zone are closerto the school than all residents not in the circular zone. Thus, the equal landarea circle may be interpreted as the natural zone that would exist if itsboundaries had not been intentionally manipulated to exchange students.
The equal land area circle provides a theoretical ideal to which existingattendance zones may be compared to assess the effects of gerrymanderingon an individual attendance zone. However, circular attendance zones donot constitute a feasible districting solution. While it is possible for a singleschool attendance zone to be circular, it is impracticable for all attendancezones in a district to be circular. Indeed, drawing circular attendance zonesof equal land area around each school location would result in a pattern ofattendance zones that would overlap in certain areas and exclude otherareas. Thus, it would result in a set of attendance zones that fail to servemany students in the district, while providing several school options to otherstudents.
Voronoi Polygonal Attendance Zones
Given the limitations of circles as a feasible redistricting solution, I adoptan alternative method of constructing the natural attendance zones of eachschool in the sample. Drawing on computational geometry, I define the nat-ural attendance zone for each school as the Voronoi polygon that corre-sponds to that school. At a basic level, a Voronoi diagram partitions thespace around a set of focal points, such that each point is contained in a sin-gle polygonal zone. The boundaries of each Voronoi polygon are definedsuch that all areas within a given focal point’s polygon are closer to that focalpoint than to any other focal point (Aurenhammer, 1991; Miles & Maillardet,1982; Okabe, Boots, Sugihara, & Chiu, 2000). Applied to the context ofschools, a Voronoi diagram for each school district is constructed aroundall of the schools in the district that serve students of the same grade level.The Voronoi polygonal attendance zone for each school is defined such thatall areas served by a given school’s polygonal attendance zone are closer to
Gerrymandering of School Attendance Zones
1127

that school than to any other school. Figure 2 provide an illustration ofVoronoi polygonal attendance zones constructed for a suburban district inthe South. The actual attendance zones for the district are also depictedfor comparison purposes.
In particular, Voronoi polygons have two desirable features that makethem useful for examining attendance zone gerrymandering. First, Voronoipolygons are completely convex—as such, they have no ‘‘nooks’’ or ‘‘cran-nies’’ that carve out certain areas. Thus, although they are not as geometri-cally compact as circles (i.e., there are areas in each polygon that are fartheraway from the focal school than areas not in the focal school), they are bydefinition not gerrymandered. As such, they provide a reasonable counter-factual attendance zoning scheme to examine the gerrymandering of atten-dance zones. Second, as noted above, Voronoi polygonal attendance zoneshave the property that all areas served by a given attendance zone polygonare closer to that school than to any other school. As a result, Voronoi polyg-onal attendance zones are optimally efficient in that they minimize the dis-tance between each student and the school to which they are assigned.
It is important to note, however, that Voronoi polygonal attendancezones have certain limitations. First, the Voronoi algorithm is insensitive topopulation density of a district. As such, Voronoi attendance zones mayincorporate more or fewer students than the current attendance zone.However, given that the placement of schools is generally sensitive to
Figure 2. School attendance zones. Left panel shows actual school attendance
zones for schools in Loudoun County Public Schools, a suburban district out-
side Washington, D.C. Right panel shows Voronoi zones constructed around
each school. School locations are marked with black dots.
Richards
1128
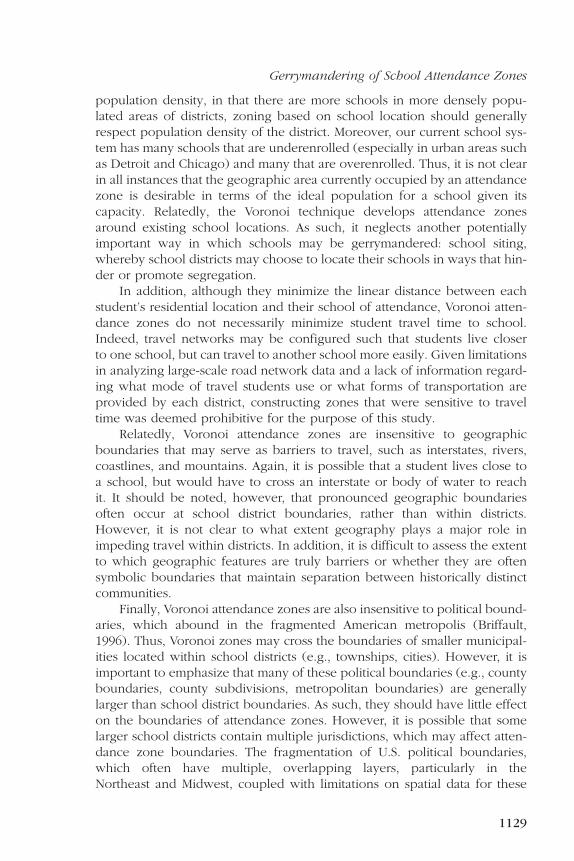
population density, in that there are more schools in more densely popu-lated areas of districts, zoning based on school location should generallyrespect population density of the district. Moreover, our current school sys-tem has many schools that are underenrolled (especially in urban areas suchas Detroit and Chicago) and many that are overenrolled. Thus, it is not clearin all instances that the geographic area currently occupied by an attendancezone is desirable in terms of the ideal population for a school given itscapacity. Relatedly, the Voronoi technique develops attendance zonesaround existing school locations. As such, it neglects another potentiallyimportant way in which schools may be gerrymandered: school siting,whereby school districts may choose to locate their schools in ways that hin-der or promote segregation.
In addition, although they minimize the linear distance between eachstudent’s residential location and their school of attendance, Voronoi atten-dance zones do not necessarily minimize student travel time to school.Indeed, travel networks may be configured such that students live closerto one school, but can travel to another school more easily. Given limitationsin analyzing large-scale road network data and a lack of information regard-ing what mode of travel students use or what forms of transportation areprovided by each district, constructing zones that were sensitive to traveltime was deemed prohibitive for the purpose of this study.
Relatedly, Voronoi attendance zones are insensitive to geographicboundaries that may serve as barriers to travel, such as interstates, rivers,coastlines, and mountains. Again, it is possible that a student lives close toa school, but would have to cross an interstate or body of water to reachit. It should be noted, however, that pronounced geographic boundariesoften occur at school district boundaries, rather than within districts.However, it is not clear to what extent geography plays a major role inimpeding travel within districts. In addition, it is difficult to assess the extentto which geographic features are truly barriers or whether they are oftensymbolic boundaries that maintain separation between historically distinctcommunities.
Finally, Voronoi attendance zones are also insensitive to political bound-aries, which abound in the fragmented American metropolis (Briffault,1996). Thus, Voronoi zones may cross the boundaries of smaller municipal-ities located within school districts (e.g., townships, cities). However, it isimportant to emphasize that many of these political boundaries (e.g., countyboundaries, county subdivisions, metropolitan boundaries) are generallylarger than school district boundaries. As such, they should have little effecton the boundaries of attendance zones. However, it is possible that somelarger school districts contain multiple jurisdictions, which may affect atten-dance zone boundaries. The fragmentation of U.S. political boundaries,which often have multiple, overlapping layers, particularly in theNortheast and Midwest, coupled with limitations on spatial data for these
Gerrymandering of School Attendance Zones
1129

entities, makes adjusting for these boundaries a complex task that falls out-side the purview of this study.
The Effect of Gerrymandering on Racial/Ethnic Diversity and Segregation
Using the actual school attendance boundaries and the Voronoi atten-dance zones for each school, I estimate the effects of gerrymandering onthe racial/ethnic diversity of schools and the segregation of school districtsby comparing the characteristics of students residing in actual attendancezones to those residing in their corresponding Voronoi attendance zones.First, I estimate the effect of gerrymandering on school attendance zoneracial/ethnic diversity by comparing the racial/ethnic diversity of eachschool attendance zone to the composition of its corresponding Voronoiattendance zones. Second, I estimate the effect of gerrymandering on schooldistrict racial/ethnic segregation by comparing the racial/ethnic segregationamong the actual attendance zones in each school district to the racial/ethnicsegregation among the Voronoi attendance zones in each school district.
School Racial/Ethnic Diversity
Although there are a number of different indices capturing racial/ethnicdiversity, this study employs Simpson’s diversity index, which is particularlyappealing owing to its intuitive interpretation. Simpson’s index may be inter-preted as the probability that two students in a given school belong to differentracial/ethnic categories. Specifically, Simpson’s index is calculated as follows,
D ¼ 1�Xri¼1
p2i
where r is the number of racial/ethnic groups in the district and pi refers toa particular racial/ethnic group’s proportion of the school or district popula-tion. Values of the Simpson index range from 0 to 1, where 0 means that allstudents belong to the same racial/ethnic group (i.e., perfect homogeneity)and 1 means that all students belong to different racial/ethnic groups (i.e.,perfect heterogeneity; for a detailed discussion of Simpson’s index, seeWhite, 1986).
For the purpose of this study, I assess five dimensions of racial/ethnicdiversity, computing each measure for each school attendance zone andits corresponding Voronoi polygon. I calculate a measure of total multiracialdiversity, addressing the diversity among students of five racial/ethnic cate-gories (i.e., Hispanic/Latino, non-Hispanic Asian, non-Hispanic Black, non-Hispanic White, and non-Hispanic Other). In addition to multiracial diver-sity, I calculate a measure of non-White diversity, as well as three dual-groupmeasures capturing Black-White, Hispanic-White, and Asian-White diversity.
Richards
1130

School District Racial/Ethnic Segregation
I calculate the racial/ethnic segregation of each school district usingTheil’s entropy index of segregation (H), which is increasingly common inthe segregation literature and is preferred to other measures (such as exposureand isolation) owing to its flexibility as a measure of multigroup or dual-groupsegregation and its ability to distinguish segregation from racial/ethnic compo-sition (see Logan & Oakley, 2004; Reardon & Firebaugh, 2002). Theil’s index ismeasure of the ‘‘evenness’’ with which students of different racial/ethnicgroups are distributed across the schools of a district. Specifically, the Theilindex quantifies how racially/ethnically diverse schools are, on average, rela-tive to the overall racial/ethnic diversity of their metropolitan area (Reardon etal., 2000). First, the entropy (or diversity) of each school in the district as wellas the district as a whole is calculated as follows,
E ¼Xri¼1
ðpiÞln1
pi
� �
where r is the number of racial/ethnic groups in the population and pi refersto each racial/ethnic group’s proportion of the school or district population.Theil’s entropy index is then calculated as a weighted average deviation inthe entropy between each school and the district as a whole, as follows,
H ¼Xni¼1
tiðE � EiÞET
� �
where n is the total number of schools in the district, ti is the total populationof school i, T is the total district population, and Ei and E represent theentropy of the school and district, respectively. The Theil index variesfrom 0 to 1, where 0 means that all schools have the same composition asthe metro area (i.e., perfect integration) and 1 means that all schools onlycontain students of a single, unique racial/ethnic group (i.e., perfect segre-gation; Iceland, 2004). Readers may refer to Reardon and Firebaugh (2002)for more detailed information regarding H.
I compute five dimensions of racial/ethnic segregation among eachschool district’s actual and Voronoi attendance zones, corresponding to thefive dimensions of diversity above. I compute a measure of total multiracialsegregation among all five racial/ethnic categories. I also calculate a measureof segregation among non-White students and three dual-group measurescapturing Black-White, Hispanic-White, and Asian-White segregation.
Contextual Covariates
In addition to examining the overall effect of gerrymandering on schooldiversity and school district segregation, I conduct a variety of disaggregationsto examine dimensions of variability in the effect of gerrymandering. As
Gerrymandering of School Attendance Zones
1131

discussed above, prior research (Richards & Stroub, in press) has found thatthe severity of school attendance zone gerrymandering varies significantlyacross school and district contexts, finding that gerrymandering is particularlysevere in districts located in the formerly de jure segregated South; in subur-ban, town, and rural areas (vs. cities); and in districts experiencing rapid racial,but not socioeconomic, change. However, it is unclear from this correlationalevidence whether the gerrymandering in these contexts is segregative or inte-grative. For example, it is unclear whether the more severe gerrymandering inschool districts in the formerly de jure segregated South worsens segregation,or whether it is an affirmative legacy of the busing systems of the desegrega-tion era. Toward that end, the analysis examines variability in the effect ofgerrymandering on segregation along these dimensions.
Data Sources
School Attendance Boundary Information System (SABINS)
Actual school attendance zone boundaries for the 2009–2010 schoolyear were obtained from SABINS, a National Science Foundation–fundedrepository of spatial attendance zone boundaries maintained by theCollege of William and Mary and the Minnesota Population Center (2011).Because districts supplied their boundaries to SABINS voluntarily, theSABINS database contains a nonrandom sample of the population of U.S.attendance zones. However, SABINS contains a large sample of publicschool attendance zones. SABINS contains attendance zone data for all statesand the District of Columbia, with the exception of Hawaii, and includes allattendance zones for the states of Delaware, Minnesota, and Oregon.
For the 2009–2010 school year, the SABINS database contains approxi-mately 213,000 attendance zone boundaries. Because districts have differentattendance zones for different grade levels (e.g., a student may be in a differ-ent attendance zone for first grade than for third grade), SABINS attendancezones are grade-level-specific. Thus, many schools have multiple attendancezone boundaries. In total, SABINS contains 2009–2010 attendance bound-aries of over 38,000 schools—roughly 40% of the population of traditionalU.S. public schools. Because the SABINS database has complete data formany of the largest districts in the country and complete data for several met-ropolitan areas, the schools in SABINS account for nearly 54% of all U.S.public school students (roughly 2.5 million of the 4.7 million enrolled in tra-ditional public schools nationally (calculations by author using SABINS andNCES CCD data).
Census 2010 Summary File 1
To compute the racial/ethnic characteristics of each actual and Voronoiattendance zone in the sample, Census 2010 block-level demographic
Richards
1132

estimates of the number of children under the age of 18 by race/ethnicitywere spatially linked to each attendance boundary. The census block isthe smallest unit of analysis at which the Census Bureau collects and tabu-lates decennial census data (U.S. Census Bureau, 2012). While the geo-graphic area of a census block may vary widely, in urban areas it is typicallythe size of a single city block. On average, there were approximately 208blocks in each school attendance zone in the sample.
Although not all individuals under the age of 18 are enrolled in publicschools (i.e., they may attend private or charter school, be too young forschool, have graduated, or have dropped out of school), it may be usedas a proxy for the characteristics of public school students residing in eachblock. Students were classified into one of five racial/ethnic categories par-alleling those collected by the National Center for Education StatisticsCommon Core of Data (NCES CCD): Hispanic/Latino, non-Hispanic Asian,non-Hispanic Black, non-Hispanic White, and non-Hispanic Other.
NCES CCD 2009–2010
School geographic coordinates (i.e., latitude and longitude) for eachschool attendance zone from the SABINS sample were obtained from theNCES CCD and used to create the Voronoi attendance zones for each district.Each school in the sample was classified by locality (i.e., city, suburb, town,rural) according to CCD designations. In addition, each school was classifiedaccording to whether it is located in one of the 17 states that were historicallysubject to de jure segregation (i.e., Alabama, Arkansas, Delaware, Florida,Georgia, Kentucky, Louisiana, Maryland, Mississippi, Missouri, NorthCarolina, Oklahoma, South Carolina, Tennessee, Texas, Virginia, and WestVirginia). Measures of school district demographic change were calculatedusing free/reduced-price lunch and race/ethnicity data from the 1999–2000and 2009–2010 NCES CCD.
School District Desegregation Order
Data on school districts’ historical and current desegregation status wereobtained from a database cataloging school district desegregation orderinformation produced by Reardon and colleagues in 2011. In the database,Reardon et al. document the status of districts ever subject to court-ordereddesegregation plans. Districts are classified as under active desegregationorder, formerly under a desegregation order that was dismissed, or neverunder desegregation order. It should be noted that the Reardon et al. data-base is not inclusive of all districts in the United States, they collected dataonly for medium- to large-sized districts and does not include data on dis-tricts that voluntarily desegregated, or districts required to desegregate bythe Department of Health, Education, and Welfare.
Gerrymandering of School Attendance Zones
1133

Sample
Several filters were applied to the full SABINS sample of school atten-dance zones to arrive at the final analytic sample for this analysis. Becausethe attendance zones of elementary schools are often the ‘‘building blocks’’of middle and high school attendance zones, in that they generally feed intomiddle school and high-school attendance zones (with some exceptions),the irregularities in middle school and high school boundaries are oftenaggregations of the irregularities in multiple smaller elementary schoolboundaries. Thus, I sought to limit the analysis to focus exclusively on ele-mentary school attendance zone boundaries. However, as noted above,because districts have different attendance zones for different grade levels,SABINS attendance zones are grade-level-specific. As such, ‘‘elementaryschools’’ were operationalized as schools with first grade attendance zoneboundaries in SABINS.
Second, the SABINS sample was filtered to include only school districtslocated in metropolitan statistical areas as defined by the U.S. Census. Third,only attendance zones that serve a single school were retained for analysis(thus excluding attendance zones with open enrollment patterns). Fourth,because school districts with only one attendance zone have attendancezone boundaries that are coterminous with district boundaries, these zonesdo not permit any boundary manipulation independent of district bound-aries and are therefore not of empirical interest. Thus, school attendancezones located in districts with only one attendance zone were also excludedfrom analysis. Finally, because the Voronoi technique involves redrawingattendance zones for all schools in a district, and cannot be conducted ona single school in isolation, the analysis was limited to only those schoolslocated in districts reporting all of their first grade attendance zones.
Application of these filters yielded a final analytic sample of 15,290school attendance zones in 663 school districts, 154 metropolitan statisticalareas, and 43 states. Table 1 demonstrates that the attendance zones in thesample account for 47% of the 32,371 schools in the population of interest(i.e., schools serving first grade, located in metropolitan areas with two ormore schools). In addition, the student population in the sample composes55% of the total population of students attending schools in the populationof interest. Table 1 summarizes the demographic and geographic character-istics of the analytic sample of attendance zones compared to populationvalues. The table reveals that the analytic sample is poorer (57% vs. 51%)and less White (38% vs. 48%) than the comparable population. This demo-graphic profile may reflect, in part, the overrepresentation of urban schoolsin the sample versus the population (51% vs. 39%). In addition, schools inthe sample were more likely to be located in the formerly de jure segregatedSouth than schools in the population (48% vs. 36%).
Richards
1134

Results
How Does Attendance Zone Gerrymandering Affect
the Racial/Ethnic Diversity of Schools?
In the first phase of analysis, I examine the effect of attendance zonegerrymandering on the racial/ethnic diversity of individual schools. Table
Table 1
Characteristics of Analytic Sample of Attendance Zones Versus Population
Analytic Sample of
Attendance Zones
School
Populationa
M SD M SD
% free/reduced-price lunch 56.7 30.2 51.4 30.2
Racial/ethnic composition
% White 38.4 31.5 47.6 33.6
% Black 23.9 29.0 19.0 26.2
% Hispanic 30.2 29.9 26.1 28.9
% Asian 5.9 9.1 5.8 11.0
% Other 1.7 4.3 1.5 12.1
Students per school 580.6 223.4 500.6 232.8
n % n %
State de jure segregation history
In de jure South 7,372 48.2 11,595 35.9
Not in de jure South 7,918 51.8 20,689 64.1
Desegregation status
Active 38 5.7 110 3.3
Dismissed 99 14.9 202 6.0
Never 46 6.9 114 3.4
Unknown 480 72.4 2,957 87.4
Locality
Urban 7,806 51.1 12,485 38.6
Suburban 5,389 35.2 13,162 40.7
Town 310 2.0 1,530 4.7
Rural 1,785 11.7 5,179 16.0
Total n
Students 8,872,604 16,197,302
Schools 15,290 32,371
Districts 663 3,383
Metropolitan areas 154 325
States 43 51
aPopulation of operational U.S. public schools serving first grade students located in met-ropolitan areas not classified as magnet or charter schools.
Gerrymandering of School Attendance Zones
1135

2 reports results of analyses comparing the racial/ethnic diversity of actualattendance zones to the racial/ethnic diversity of the Voronoi attendancezones. To provide a standardized frame of reference for interpreting themagnitude of the differences in diversity, the final column of the tablepresents the deviations in standard deviation units, computed by dividingthe difference between the means of diversity for actual and Voronoi atten-dance zones by the pooled standard deviation of the two zones (Rosnow &Rosenthal, 1996).
For four of the five dimensions of racial/ethnic diversity, actual atten-dance zones are significantly less diverse than the Voronoi attendance zones.However, the magnitude of these effects is relatively small. In terms of mul-tiracial diversity, attendance zones are on average 0.02 standard deviationsless diverse than Voronoi zones. Gerrymandering has a more pronouncedeffect on non-White diversity: Attendance zones are on average 0.04 stan-dard deviations less diverse than Voronoi zones. Gerrymandering hasa somewhat less pronounced effect between Whites and Hispanics (0.01SD units), and between Whites and Asians (0.02 SD units). Interestingly,actual attendance zones are significantly more Black-White diverse thanthe Voronoi zones. Again, however, the magnitude of the effect is fairlysmall. On average, attendance zones are 0.02 standard deviations moreBlack-White diverse than the Voronoi zones.
Variability in Effects
While overall gerrymandering is associated with slight decreases in theracial/ethnic diversity of schools, Table 3 reveals that there is considerable
Table 2
Average Racial/Ethnic Diversity of Actual and Voronoi Attendance Zones
Actual
Attendance Zones
Voronoi
Attendance Zones
Difference
(Actual – Voronoi)
M SD M SD
Percentage
Point
Effect Size
(SD)
Multiracial 0.461 0.188 0.465 0.185 20.003 20.018*
Non-White 0.472 0.209 0.479 0.206 20.008 20.037*
Black-White 0.224 0.168 0.223 0.166 0.001 0.004*
Hispanic-White 0.276 0.153 0.277 0.152 20.002 20.013*
Asian-White 0.174 0.153 0.176 0.151 20.003 20.019*
Note. Table reports average racial/ethnic diversity values for the actual and Voronoi atten-dance zones for each school in the sample. Effect size estimated as the standard deviationunit difference in diversity between the actual and Voronoi zones.*Comparison significant at p \ .001.
Richards
1136

variability in the magnitude of the effect. Across all five racial/ethnic dimen-sions of diversity, a slight majority of attendance zones are less diverse thantheir corresponding Voronoi zones, ranging from 57% for non-White diver-sity to 51% for Black-White diversity. Thus, although attendance zones areon average more Black-White diverse than their Voronoi zones,gerrymandering reduces Black-White diversity for a slight majority of atten-dance zones, suggesting that the average effect reported in Table 2 may bedriven by a small number of extreme cases.
The distribution reveals that although the average difference in diversitybetween actual and Voronoi zones is fairly small, gerrymandering is associ-ated with very large decreases in racial/ethnic diversity in a nontrivial num-ber of schools. Indeed, gerrymandering is associated with a large reductionin diversity of greater than 0.3 standard deviations in 9% to 12% of atten-dance zones (depending on the racial/ethnic dimension of diversity). Foranother 15% to 19% (depending on the racial/ethnic dimension),gerrymandering is associated with moderate decreases in diversity rangingfrom 0.1 to 0.3 standard deviations. However, it should also be emphasizedthat a large minority of actual attendance zones are more diverse than cor-responding Voronoi zones. Moreover, gerrymandering is associated withlarge increases in diversity of greater than 0.3 standard deviations in 5% to11% of schools, and with moderate increases in diversity of 0.1 to 0.3 stan-dard deviations in 13% to 15% of schools.
Taken together, results of the school-level analyses examining the effectof gerrymandering on school diversity suggest that attendance zones on aver-age serve to suppress the racial/ethnic diversity of schools. However, they alsounderscore the wide variability across contexts, with many schools experienc-ing increases in diversity attributable to gerrymandering. In the second phaseof analysis, I assess the net effects of these school-level changes in composi-tion on the overall segregation of school districts and examine how theseeffects vary across geographic and demographic contexts.
Case Illustration
Figure 3 provides an example of an actual school attendance zonelocated in a suburban district in the South to illustrate how gerrymanderingserves to reduce the diversity of attendance zones. Figure 3a depicts theactual attendance zone of the school in gray, overlaid by the outline ofthe Voronoi attendance zone that was constructed for that school. The figurereveals that the zone is moderately gerrymandered, with numerous indenta-tions and concavities on the northeast side. In the southwest side, the atten-dance zone has a ‘‘hole,’’ which has been zoned into a different school. InFigures 3b, 3c, and 3d, both attendance zones are shown layered on topof the census blocks for the area, shaded by the proportion of Hispanics,Blacks, and Whites in each block, respectively.
Gerrymandering of School Attendance Zones
1137

Table
3
Dis
trib
uti
on
of
Dif
fere
nce
inD
ivers
ity
Betw
een
Actu
al
an
dV
oro
no
iA
tten
dan
ce
Zo
nes
Multirac
ial
Non-W
hite
Bla
ck-W
hite
His
pan
ic-W
hite
Asi
an-W
hite
n%
n%
n%
n%
n%
Act
ual
atte
ndan
cezo
nes
less
div
ers
eth
anVoro
noi
0.5
1SD
sle
ssdiv
ers
e760
5.0
564
3.7
917
6.0
899
5.9
896
5.9
0.3
to0.5
SDs
less
div
ers
e883
5.8
826
5.4
838
5.5
886
5.8
762
5.0
0.1
to0.3
SDs
less
div
ers
e2,8
46
18.6
2,8
34
18.5
2,2
60
14.8
2,5
62
16.8
2,3
08
15.1
0to
0.1
SDs
less
div
ers
e3,7
09
24.3
4,4
39
29.0
3,7
39
24.5
3,6
28
23.7
4,0
71
26.7
Act
ual
atte
ndan
cezo
nes
more
div
ers
eth
anVoro
noi
0to
0.1
SDs
more
div
ers
e3,3
91
22.2
3,8
70
25.3
3,4
67
22.7
3,4
32
22.5
3,5
08
23.0
0.1
to0.3
SDs
more
div
ers
e2,3
48
15.4
2,0
17
13.2
2,1
53
14.1
2,2
53
14.7
2,1
71
14.2
0.3
to0.5
SDs
more
div
ers
e719
4.7
481
3.1
901
5.9
804
5.3
782
5.1
0.5
1SD
sm
ore
div
ers
e631
4.1
255
1.7
1,0
11
6.6
823
5.4
751
4.9
1138
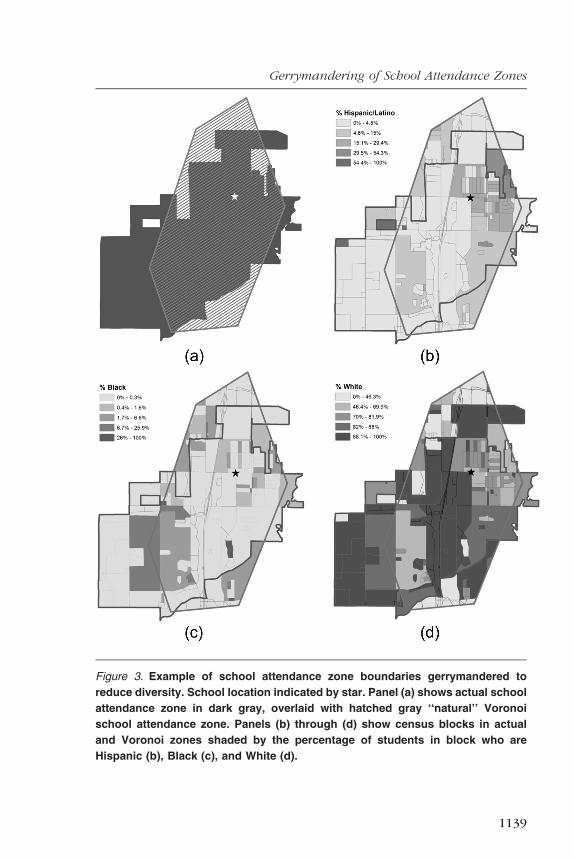
Figure 3. Example of school attendance zone boundaries gerrymandered to
reduce diversity. School location indicated by star. Panel (a) shows actual school
attendance zone in dark gray, overlaid with hatched gray ‘‘natural’’ Voronoi
school attendance zone. Panels (b) through (d) show census blocks in actual
and Voronoi zones shaded by the percentage of students in block who are
Hispanic (b), Black (c), and White (d).
Gerrymandering of School Attendance Zones
1139

Figure 3a reveals that the area of the actual attendance zone has rela-tively few Hispanic children. However, the areas zoned out by the atten-dance zone, particularly those in the northeast, tend to have higher propor-tions of Hispanic children. Notably, the ‘‘hole’’ that has been zoned out ofthe southwest part of the attendance zone has a particularly high proportionof Hispanic students. By contrast, the areas that have been zoned into theattendance zone generally have fewer Hispanic students, with the exceptionof a single block in the southwest corner of the zone. Figure 3c reveals a sim-ilar exclusionary pattern for areas with regard to Black students, as boundaryirregularity in the Northeast serves to exclude areas with higher proportionsof Black students. The exclusionary nature of the attendance zone is perhapsmost clear when examining the proportion of White students in each block.Figure 3d demonstrates that the areas zoned into the attendance zone in thesoutheast are predominantly White, while the areas zoned out in the northand northeast are predominantly non-White. The shading reveals a fairlyclear discontinuity in the proportion of Whites corresponding to the bound-ary of the school attendance zone.
As a result of the exchange of students perpetrated by this attendancezone, the zone is significantly more White, more Asian, less Black, andless Hispanic than its corresponding Voronoi zone. As a result, the diversityof the actual attendance zone is significantly lower than the diversity of itscorresponding Voronoi zone (0.45 vs. 0.53). Thus, for this school,gerrymandering is associated with a large 0.43 standard deviation reductionin diversity, placing it among the 11% of attendance zones with a multiracialeffect size of greater than 0.3 standard deviations.
How Does Attendance Zone Gerrymandering Affect
School District Racial/Ethnic Segregation?
The prior analysis demonstrates that at the level of the individual atten-dance zone, gerrymandering serves to slightly suppress school diversity.However, it also underscores the wide variability in effects, with nearly asmany schools experiencing decreases in diversity attributable togerrymandering as experiencing increases. Thus, at the district level,decreases in diversity in one school may be offset by increases in diversityin another school. In the second phase of analysis, I estimate the aggregateeffect of gerrymandering on the segregation of schools, computing measuresof segregation among actual and Voronoi attendance zones in each district.
Table 4 compares the average level of racial/ethnic segregation amongthe actual attendance zones to the average level of segregation amongVoronoi zones in the sample of districts. Again, to provide a standardizedframe of reference for interpreting the magnitude of the differences in seg-regation, the final column of the table presents the differences in standarddeviation units.
Richards
1140

Across all five dimensions of racial/ethnic segregation, the segregationamong actual attendance zones is significantly higher than the segregationamong Voronoi attendance zones. While the magnitude of these effects isrelatively small, they are comparable to or larger than the magnitude ofeffects for school diversity. Indeed, multiracial segregation among actualattendance zones is, on average, 0.03 standard deviations higher than multi-racial segregation among Voronoi zones. The difference in segregationamong non-Whites and between Whites and Asians are particularly pro-nounced. In terms of non-White segregation, the segregation among actualattendance zones is 0.06 standard deviations higher than segregation amongVoronoi zones. In terms of Asian-White segregation, the segregation amongactual attendance zones is 0.09 standard deviations higher than segregationamong Voronoi zones. While the magnitude of effects were smaller forBlack-White and Hispanic-White segregation (0.02 SD units for both), theysuggest that gerrymandering also serves to worsen segregation betweenBlacks and Whites and between Hispanics and non-Hispanic Whites.
The relatively larger magnitude of the effects of gerrymandering on seg-regation suggest that the relatively small effects of gerrymandering on thediversity of individual districts are compounded, yielding a cumulative effectof gerrymandering that has a more meaningful impact on segregation. While itis difficult to articulate what a standard deviation unit increase in segregationof 0.06, for example, means in terms of students’ experience of segregation, itis useful to contextualize the magnitude of these effects in terms of the mag-nitude of the changes in segregation over the past decades. Educators and
Table 4
Average School District Racial/Ethnic Segregation for
Actual and Voronoi Attendance Zones
Actual
Attendance Zones
Voronoi
Attendance Zones
Difference
(Actual – Voronoi)
M SD M SD
Percentage
Point
Effect
Size (SD)
Multiracial 0.070 0.073 0.068 0.070 0.002 0.025*
Non-White 0.063 0.063 0.060 0.061 0.003 0.055*
Black-White 0.109 0.125 0.107 0.121 0.002 0.018*
Hispanic-White 0.079 0.088 0.078 0.086 0.001 0.015*
Asian-White 0.066 0.070 0.060 0.065 0.006 0.088*
Note. Table reports average level of segregation among the actual and Voronoi attendancezones in each district in the sample. Segregation calculated using Theil’s entropy index.Effect size estimated as the standard deviation unit difference in segregation betweenactual and Voronoi zoning schemes.*Comparison significant at p \ .001.
Gerrymandering of School Attendance Zones
1141

Table
5
Dis
trib
uti
on
of
Dif
fere
nces
inD
istr
ict
Seg
reg
ati
on
Am
on
gA
ctu
al
an
dV
oro
no
iA
tten
dan
ce
Zo
nes
Multirac
ial
Non-W
hite
Bla
ck-W
hite
His
pan
ic-W
hite
Asi
an-W
hite
n%
n%
n%
n%
n%
Act
ual
atte
ndan
cezo
nes
more
segre
gat
ed
than
Voro
noi
0.3
1SD
sm
ore
segre
gat
ed
22
3.3
42
6.4
33
5.0
29
4.4
69
10.5
0.1
to0.3
SDs
more
segre
gat
ed
144
21.8
188
28.5
127
19.2
122
18.5
183
27.7
0to
0.1
SDs
more
segre
gat
ed
267
40.5
212
32.1
240
36.4
247
37.4
213
32.3
Act
ual
atte
ndan
cezo
nes
less
segre
gat
ed
than
Voro
noi
0to
0.1
SDs
less
segre
gat
ed
147
22.3
131
19.8
156
23.6
171
25.9
121
18.3
0.1
to0.3
SDs
less
segre
gat
ed
54
8.2
67
10.2
70
10.6
59
8.9
58
8.8
0.3
1SD
sle
ssse
gre
gat
ed
26
3.9
20
3.0
34
5.2
32
4.8
16
2.4
1142
researchers have expressed considerable concern regarding the resegregationof schools that occurred over the 1990s (Frankenberg et al., 2003; Frankenberg& Orfield, 2012; G. Orfield et al., 2012; Reardon et al., 2000; Reardon &Owens, 2014). In a recent study of segregation trends, Stroub and Richards(2013) found that metropolitan multiracial segregation increased by 0.07 stan-dard deviations between 1993 and 1998 (from 0.300 to 0.307), after which itstarted to gradually decline. As such, the differences in segregation betweenactual and Voronoi attendance zones are only slightly smaller in magnitudethan the increases in total segregation observed over the 1990s.
Thus, district-level findings regarding the effect of gerrymandering onsegregation suggest that overall, gerrymandering has a small but significantsegregative effect. In addition, while there is significant variability in effects,the segregative effect of gerrymandering on school district segregation is rel-atively more consistent than the effects on diversity for individual schools.Across all five racial/ethnic dimensions of segregation, segregation amongactual attendance zones is higher than segregation among Voronoi atten-dance zones for a substantial majority of school districts. Indeed,gerrymandering is associated with increases in multiracial segregation formore than 65% of districts. Moreover, gerrymandering is associated withincreases in segregation for more than 60% of districts on all other racial/eth-nic dimensions of segregation. Again, the distribution reveals that althoughthe average difference in segregation among actual and Voronoi districts isfairly modest, gerrymandering is associated with increases in segregationof more than 0.1 standard deviations for 23% to 38% of districts (dependingon the racial/ethnic dimension of segregation).
Interestingly, however, there is a substantial minority of school districtsfor which gerrymandering is associated with relatively substantial decreasesin segregation. Indeed, in 11% to 16% of districts, school districtgerrymandering is associated with a decrease in segregation of greaterthan 0.1 standard deviations. I conducted a post hoc outlier analysis exam-ining the desegregation status of school districts in the subset of districts forwhich attendance zones are more than 0.3 standard deviations less segre-gated than their Voronoi districts. Analysis revealed that a large proportionof the districts with integrative attendance zones are currently subject tocourt-ordered desegregation. Indeed, while only 6% of the analytic sampleis currently under desegregation order, districts under active desegregationorders account for 23% of the districts that are more than 0.3 standard devi-ations less segregated than their Voronoi zones (6 of 26). Similar patternswere detected for the other racial/ethnic dimensions of segregation.
Contextual Variation
I conduct supplemental analyses examining sources of variability in theeffect of gerrymandering on segregation, seeking to identify how the
Gerrymandering of School Attendance Zones
1143

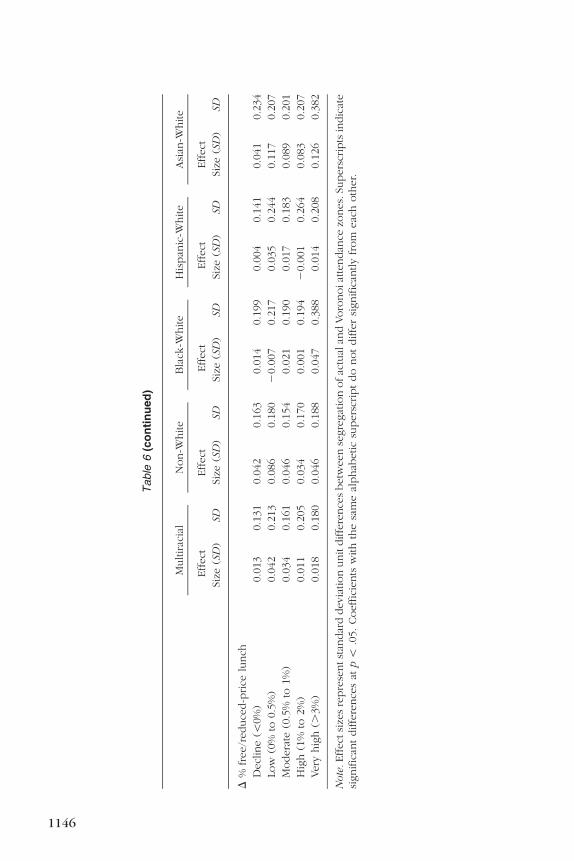
segregative and integrative effect of gerrymandering varies across geo-graphic and demographic contexts. As noted previously, recent researchhas found that attendance zone gerrymandering is particularly severe in dis-tricts located in the formerly de jure segregated South; in suburban, town,and rural areas (vs. cities); and in districts experiencing rapid racial, butnot socioeconomic, change. In addition, historical evidence, bolstered bythe outlier analysis conducted in the previous section, has suggested thatgerrymandering may be used affirmatively in districts with a history ofdesegregation orders. As such, I structure my analyses around these factors.Table 6 reports the unadjusted mean standard deviation unit differences insegregation between district segregation among actual and Voronoi atten-dance zones, disaggregated by school district geographic and demographiccontextual variables.
De Jure Segregation and Desegregation Status
Historical evidence suggests that gerrymandering may have been usedaffirmatively in the South and in districts under desegregation orders asa means of achieving integration. Although prior research has found thatattendance zones in the South are substantially more gerrymandered thanattendance zones outside of the South, analyses reveal that Southern atten-dance zones are not significantly more gerrymandered to segregate thanattendance zones in the rest of the United States.
However, more targeted analyses examining the relationship betweena school district’s history of desegregation order and the extent to which itis segregated to gerrymander reveal an interesting pattern. Across four ofthe five dimensions of segregation, school districts currently under desegre-gation orders were generally less gerrymandered to segregate than schooldistricts never under desegregation order or whose desegregation status isunknown, although these differences are only significant for multiracial,Black-White, and Hispanic-White segregation. The difference was particu-larly pronounced for Black-White segregation: school districts currentlyunder desegregation order have attendance zones that are 0.12 standarddeviations less gerrymandered to segregate Blacks and Whites than districtsnever under desegregation order or whose desegregation status is unknown.Moreover, on three of the five racial/ethnic dimensions of segregation,school districts currently under desegregation orders were not only less ger-rymandered to segregate—they were gerrymandered to integrate. Indeed,school districts currently under court-ordered desegregation have actualattendance zones that are 0.04 standard deviations less multiracially segre-gated, 0.09 standard deviations less Black-White segregated, and 0.02 stan-dard deviations less Hispanic-White segregated than their Voronoi zones.
Districts that were formerly under desegregation orders, but which havebeen released from court order, evince a different pattern. In terms of
Richards
1144

Table
6
Sta
nd
ard
ized
Dif
fere
nce
inS
eg
reg
ati
on
Am
on
gA
ctu
al
an
dV
oro
no
iA
tten
dan
ce
Zo
nes
by
Dis
tric
tC
hara
cte
risti
cs
Multirac
ial
Non-W
hite
Bla
ck-W
hite
His
pan
ic-W
hite
Asi
an-W
hite
Effect
Size
(SD
)SD
Effect
Size
(SD
)SD
Effect
Size
(SD
)SD
Effect
Size
(SD
)SD
Effect
Size
(SD
)SD
Stat
ede
jure
segre
gat
ion
his
tory
Inde
jure
South
0.0
31
0.2
20
0.0
59
0.1
92
0.0
25
0.3
21
0.0
35
0.2
53
0.1
12
0.3
15
Notin
de
jure
South
0.0
21
0.1
50
0.0
53
0.1
65
0.0
15
0.1
86
0.0
04
0.1
80
0.0
74
0.1
94
Dis
tric
tdese
gre
gat
ion
ord
er
Act
ive
20.0
40
a0.2
63
0.0
27
0.1
89
20.0
92
b0.3
21
20.0
15
b0.2
52
0.1
51
0.2
39
Dis
mis
sed
0.0
49
b0.2
15
0.0
54
0.2
08
0.0
03
c0.2
54
0.0
64
a0.2
33
0.1
14
0.1
98
Unknow
n/n
ever
0.0
25
a0.1
62
0.0
57
0.1
68
0.0
29
a0.2
34
0.0
09
b0.2
01
0.0
78
0.2
53
Dis
tric
tlo
cality
Urb
an0.0
48
0.1
75
0.0
75
0.1
40
0.0
43
0.2
15
0.0
40
0.2
23
0.1
25
a0.2
19
Suburb
an0.0
21
0.1
68
0.0
50
0.1
79
0.0
12
0.2
53
0.0
08
0.1
96
0.0
81
b0.2
47
Tow
n0.0
05
0.0
53
0.0
16
0.0
79
0.0
34
0.0
69
0.0
08
0.0
55
20.0
24
b0.0
94
Rura
l2
0.0
14
0.2
43
0.0
35
0.2
28
20.0
12
0.2
78
20.0
06
0.2
60
0.0
50
b0.2
99
Dis
tric
tdem
ogra
phic
chan
ge
Dm
ultirac
ialdiv
ers
ity
Decl
ine
tovery
low
gro
wth
(\1%
)0.0
33
a,b
0.1
42
0.0
63
a,b
0.1
65
0.0
06
b0.1
24
0.0
10
0.1
81
0.0
73
b0.1
98
Low
(2%
to9%
)2
0.0
04
b0.1
80
0.0
31
b0.1
74
20.0
22
b0.2
36
20.0
02
0.2
15
0.0
54
b0.1
49
Modera
te(1
0%
to16%
)0.0
11
b0.1
53
0.0
35
b0.1
37
20.0
03
b0.1
86
0.0
08
0.1
79
0.0
57
b0.1
63
Hig
h(1
7%
to24%
)0.0
07
b0.2
46
0.0
37
b0.2
00
20.0
19
b0.2
68
0.0
19
0.2
84
0.0
72
b0.2
77
Very
hig
h(.
24%
)0.0
71
a0.1
59
0.1
04
a0.1
67
0.1
13
a0.3
29
0.0
36
0.1
78
0.1
82
a0.3
55
(con
tin
ued
)
1145
Table
6(c
on
tin
ued
)
Multirac
ial
Non-W
hite
Bla
ck-W
hite
His
pan
ic-W
hite
Asi
an-W
hite
Effect
Size
(SD
)SD
Effect
Size
(SD
)SD
Effect
Size
(SD
)SD
Effect
Size
(SD
)SD
Effect
Size
(SD
)SD
D%
free/r
educe
d-p
rice
lunch
Decl
ine
(\0%
)0.0
13
0.1
31
0.0
42
0.1
63
0.0
14
0.1
99
0.0
04
0.1
41
0.0
41
0.2
34
Low
(0%
to0.5
%)
0.0
42
0.2
13
0.0
86
0.1
80
20.0
07
0.2
17
0.0
35
0.2
44
0.1
17
0.2
07
Modera
te(0
.5%
to1%
)0.0
34
0.1
61
0.0
46
0.1
54
0.0
21
0.1
90
0.0
17
0.1
83
0.0
89
0.2
01
Hig
h(1
%to
2%
)0.0
11
0.2
05
0.0
34
0.1
70
0.0
01
0.1
94
20.0
01
0.2
64
0.0
83
0.2
07
Very
hig
h(.
3%
)0.0
18
0.1
80
0.0
46
0.1
88
0.0
47
0.3
88
0.0
14
0.2
08
0.1
26
0.3
82
Note
.Effect
size
sre
pre
sentst
andar
ddevia
tion
unit
diffe
rence
sbetw
een
segre
gat
ion
ofac
tual
and
Voro
noiat
tendan
cezo
nes.
Supers
crip
tsin
dic
ate
signific
antdiffe
rence
sat
p\
.05.Coeffic
ients
with
the
sam
eal
phab
etic
supers
crip
tdo
notdiffe
rsi
gnific
antly
from
eac
hoth
er.
1146

multiracial, Black-White, and Hispanic-White segregation, districts releasedfrom desegregation orders are more segregatively gerrymandered than dis-tricts currently subject to active desegregation order. Indeed, districts thathave been released from desegregation orders have actual attendance zonesthat are 0.09 standard deviations more multiracially segregated, 0.10 stan-dard deviations more Black-White segregated, and 0.08 standard deviationsmore Hispanic-White segregated than districts that remain under activedesegregation order. Although attendance zones formerly under desegrega-tion orders are more gerrymandered to segregate than districts never underdesegregation order in terms of multiracial and Hispanic-White segregation,districts whose desegregation orders have been dismissed are slightly lessgerrymandered to segregate Blacks from Whites than districts never underdesegregation order.
District locality. Previous research has demonstrated that gerrymander-ing is particularly severe in suburban, town, and rural areas, whereas urbandistricts have relatively more regular and compact boundaries. However, thatfor four of the five measures of segregation, the effect of gerrymandering onsegregation is not significantly related to a school district’s locality. Thus,school districts on the periphery of metropolitan areas are no more gerry-mandered to segregate than school districts inside urban cores. Indeed,across all five dimensions of segregation, urban school districts are more ger-rymandered to segregate, although the differences are only statistically sig-nificant for Asian-White segregation.
District demographic change. Prior research has suggested thatgerrymandering is particularly severe in areas experiencing rapid racial/eth-nic change (Richards & Stroub, in press), and that segregative gerrymander-ing of boundaries may occur in response to rapid diversification (M. Orfield& Luce, 2013). Table 6 reports the average standard deviation unit differencein segregation between actual and Voronoi attendance zones for school dis-tricts as a function of their growth in racial/ethnic diversity over the pastdecade. Districts are classified into quintiles reflecting declines to very lowgrowth, low growth, moderate growth, high growth, and very high growthin racial/ethnic diversity.
Analyses reveal that segregative gerrymandering is positively related toracial/ethnic change. Across four of the five racial/ethnic dimensions of seg-regation, districts with very high growth in their multiracial diversity haveattendance zones that are more gerrymandered to segregate than districtswith more stable racial/ethnic compositions. Indeed, districts experiencingvery high increases in racial/ethnic diversity of greater than 24% are on aver-age 0.06 standard deviations more gerrymandered to multiracially segregate,0.07 standard deviations more gerrymandered to segregate non-Whites, 0.12standard deviations more gerrymandered to segregate Blacks and Whites,
Gerrymandering of School Attendance Zones
1147

and 0.13 standard deviations more gerrymandered to segregate Asians andWhites than districts with moderate growth in diversity.
Interestingly, there is a somewhat bimodal relationship between changein school district diversity and the segregative effect of gerrymandering. Interms of multiracial segregation and segregation among non-Whites, districtsexperiencing very high rates of racial/ethnic change were not significantlymore gerrymandered to segregate than districts experiencing declines orvery low increases in diversity.
Previous research found that the severity of gerrymandering is unrelatedto the level of socioeconomic change in a district. This analysis suggests thatsocioeconomic change is also unrelated to the segregative or integrativenature of gerrymandering. Indeed, the difference in segregation betweenactual and Voronoi attendance zones did not vary depending on the changein the proportion of students qualifying for free- or reduced-price lunch ina district. It should be noted that the vast majority of sampled districts expe-rienced only small changes in their proportion of economically disadvan-taged students over the past decade: the difference between the lowestand highest quintiles was less than 4 percentage points. Moreover, it shouldbe emphasized that free- and reduced-price lunch status is generally consid-ered a poor measure of socioeconomic status (Harwell & LeBeau, 2010),which may fail to capture broader economic shifts.
Summary and Case Illustration
In this study, I find that the irregular shapes of attendance zones gener-ally serve to worsen segregation beyond the natural Voronoi zones thatwould be expected in the absence of gerrymandering. While gerrymander-ing has a relatively small effect on the diversity of individual schools, theseare compounded into small but meaningful effects on segregation at theschool district level. Interestingly, however, analysis revealed thatgerrymandering has a relatively larger effect on segregation among non-Whites and between Whites and Asians, and a smaller effect on segregationbetween Whites and Blacks and Whites and Asians.
Findings also underscore the wide variability in the effects ofgerrymandering across contexts. Indeed, gerrymandering serves to integratein 30% to 40% of districts, depending on the racial/ethnic dimension of segre-gation. Gerrymandering is generally less segregative or integrative in schooldistricts that are currently under desegregation orders and is often more seg-regative in districts that have been released from their desegregation ordersthan in districts never subject to desegregation orders. Moreover,gerrymandering is particularly segregative in districts experiencing rapidincreases in diversity, although it also has a particularly strong segregativeeffect in some districts with relatively stable racial/ethnic compositions.
Richards
1148
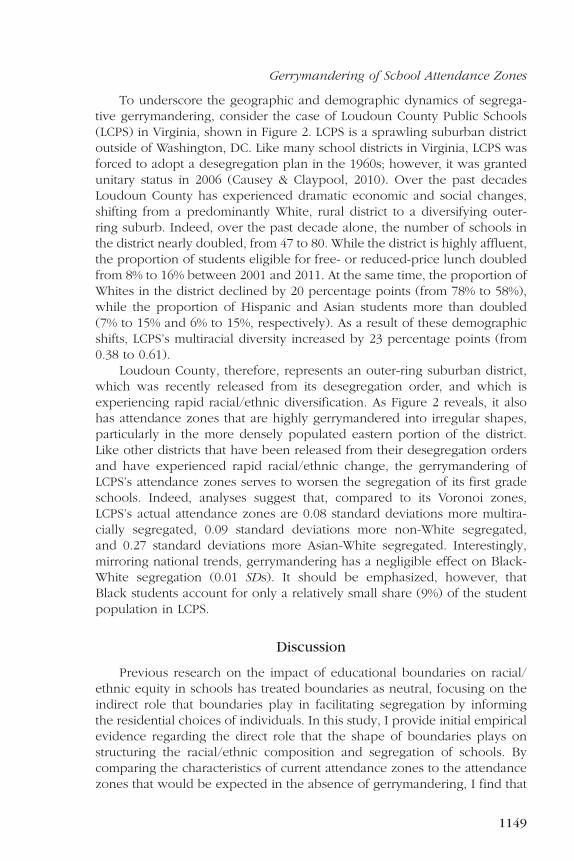
To underscore the geographic and demographic dynamics of segrega-tive gerrymandering, consider the case of Loudoun County Public Schools(LCPS) in Virginia, shown in Figure 2. LCPS is a sprawling suburban districtoutside of Washington, DC. Like many school districts in Virginia, LCPS wasforced to adopt a desegregation plan in the 1960s; however, it was grantedunitary status in 2006 (Causey & Claypool, 2010). Over the past decadesLoudoun County has experienced dramatic economic and social changes,shifting from a predominantly White, rural district to a diversifying outer-ring suburb. Indeed, over the past decade alone, the number of schools inthe district nearly doubled, from 47 to 80. While the district is highly affluent,the proportion of students eligible for free- or reduced-price lunch doubledfrom 8% to 16% between 2001 and 2011. At the same time, the proportion ofWhites in the district declined by 20 percentage points (from 78% to 58%),while the proportion of Hispanic and Asian students more than doubled(7% to 15% and 6% to 15%, respectively). As a result of these demographicshifts, LCPS’s multiracial diversity increased by 23 percentage points (from0.38 to 0.61).
Loudoun County, therefore, represents an outer-ring suburban district,which was recently released from its desegregation order, and which isexperiencing rapid racial/ethnic diversification. As Figure 2 reveals, it alsohas attendance zones that are highly gerrymandered into irregular shapes,particularly in the more densely populated eastern portion of the district.Like other districts that have been released from their desegregation ordersand have experienced rapid racial/ethnic change, the gerrymandering ofLCPS’s attendance zones serves to worsen the segregation of its first gradeschools. Indeed, analyses suggest that, compared to its Voronoi zones,LCPS’s actual attendance zones are 0.08 standard deviations more multira-cially segregated, 0.09 standard deviations more non-White segregated,and 0.27 standard deviations more Asian-White segregated. Interestingly,mirroring national trends, gerrymandering has a negligible effect on Black-White segregation (0.01 SDs). It should be emphasized, however, thatBlack students account for only a relatively small share (9%) of the studentpopulation in LCPS.
Discussion
Previous research on the impact of educational boundaries on racial/ethnic equity in schools has treated boundaries as neutral, focusing on theindirect role that boundaries play in facilitating segregation by informingthe residential choices of individuals. In this study, I provide initial empiricalevidence regarding the direct role that the shape of boundaries plays onstructuring the racial/ethnic composition and segregation of schools. Bycomparing the characteristics of current attendance zones to the attendancezones that would be expected in the absence of gerrymandering, I find that
Gerrymandering of School Attendance Zones
1149

first grade attendance zone boundaries generally serve to segregate studentsby race and ethnicity. It should be emphasized that the geospatial methodsemployed by this study cannot establish the intent of gerrymandering: Whilegerrymandered boundaries generally serve to segregate students by race/ethnicity, they were not necessarily intentionally manipulated to be raciallydiscriminatory. Moreover, in some districts, those under active desegregationorders, I find that attendance zones are affirmatively gerrymandered in waysthat reduce segregation.
Interestingly, the gerrymandering of attendance zone boundaries hasa weaker effect on Black-White and Hispanic-White segregation than on seg-regation among non-Whites and segregation between Whites and Asians.Thus, this suggests that mechanisms other than gerrymandering are largelyresponsible for the persistently high rates of segregation between Whitesand Blacks and Whites and Hispanics (G. Orfield et al., 2012; Stroub &Richards, 2013). One possible explanation for the weaker segregative effectof gerrymandering on these dimensions of segregation is legal. School dis-tricts may be concerned that boundaries that are gerrymandered in waysthat segregate Blacks and Whites may be more vulnerable to litigation as vio-lations of Keyes, as these historically disadvantaged groups have been thesubject of most desegregation litigation.
An alternate explanation regarding the relatively minor effect ofgerrymandering on Black-White segregation in particular is the geographicscale of segregation among U.S. public schools. Over the past decades, seg-regation has shifted from a largely within-district to a between-district phe-nomenon. Indeed, just 37% of total metropolitan segregation is within dis-tricts, while 63% lies across district boundaries (Stroub & Richards, 2013).This is particularly true for Black-White segregation: 79% of total Black-White segregation lies across district boundaries rather than within districtboundaries. Thus, as in the case of LCPS above, because few Black studentstend to be enrolled in predominantly White districts, the gerrymandering ofattendance zone boundaries within districts holds less potential to affectBlack-White segregation.
By contrast, a much smaller proportion of segregation between Asiansand Whites and among non-Whites lies across district boundaries (49%and 48%, respectively; Stroub & Richards, 2013). As a result, Asians aremore likely to be enrolled in districts with Whites and non-Whites aremore likely to be enrolled in districts with each other. As such, gerrymander-ing holds greater potential to segregate Asians from Whites and non-Whitesfrom each other. Thus, given the scale of public school segregation, it fol-lows that gerrymandering of attendance zones within districts is associatedwith particularly large increases in segregation among non-Whites andbetween Asians and Whites.
The finding that, on average, attendance zones are gerrymandered inways that exacerbate racial/ethnic segregation is consistent with historical
Richards
1150

and qualitative evidence that suggests that gerrymandering has been used seg-regatively (Clark, 1987; G. Orfield & Eaton, 1997; M. Orfield & Luce, 2009;Siegel-Hawley, 2013; Vaznis, 2009). However, consistent with historicalaccounts that gerrymandering has been used as a policy tool for achievingracial/ethnic balance in schools under court-ordered desegregation, I findthat gerrymandering is less segregative and often affirmative in districts underactive desegregation orders. This suggests that desegregation orders continueto be effective in increasing integration in the handful of school districts thatremain under court order. Troublingly, however, results indicate that districtsthat have been released from desegregation orders tend to be more segrega-tively gerrymandered than districts still subject to oversight and are even moregerrymandered to segregate than districts never subject to court-ordereddesegregation in terms of multiracial and Hispanic-White segregation.
Taken together, these findings suggest that more stringent oversight andmonitoring of local zoning practices may be an important policy lever forsuppressing the creation of segregatively gerrymandered attendance zoneboundaries. Moreover, this finding is troubling in light of the continued legalretrenchment on desegregation in schools. Facilitated by cases such asBoard of Education of Oklahoma City v. Dowell (1991), Freeman v. Pitts(1992), and Missouri v. Jenkins (1995), the past two decades witnessed themassive release of districts from court-ordered desegregation remedies(Holley-Walker, 2010, 2012). Thus, it is possible that we may witness anexacerbation of the segregative effect of gerrymandering as more school dis-tricts are granted unitary status and start to redraw their attendance zoneboundaries.
That attendance zones are particularly gerrymandered to segregate indistricts experiencing rapid racial/ethnic change is also concerning. Whilethis analysis does not permit any inference of intent, the findings are consis-tent with the argument that irregular boundaries may occur in response torapid diversification in formerly homogeneous White communities (M.Orfield & Luce, 2013; Siegel-Hawley, 2013). Given that the racial/ethnicdiversity of the U.S. population is expected to climb over the next decades,we can expect the racial/ethnic diversity of school districts to continue to risesteadily. While these increases in diversity hold the potential to integratepublic schools, it is also possible that districts will increasingly turn togerrymandering in response to these increases in diversity, a practice thatmay be facilitated by the weak federal oversight of Keyes violations andthe lack of legal traction for desegregation efforts.
Interestingly, districts that experienced very low growth in racial/ethnicdiversity also have boundaries that are particularly gerrymandered to segre-gate. While this seems somewhat counterintuitive, this may be a function ofthe greater stability of the attendance zones in these areas. Although theymay be changed for a variety of reasons, school attendance zone boundariesare generally modified when new schools are created, when old schools
Gerrymandering of School Attendance Zones
1151

close, or when population shifts cause asymmetries in the number of stu-dents enrolled in different schools across the district. In a district experienc-ing rapid racial/ethnic and population change, attendance zone boundariesmay change frequently. In more stable districts with little racial/ethnic orpopulation change, these boundaries may also be more stable. Over time,families may Tiebout sort by race/ethnicity across boundaries as they selecta residential location, considering school of attendance in their decision. Asa result of this process of sorting, attendance zone boundaries may come toresemble racial/ethnic boundaries. Thus, while the attendance zone bound-ary serves to segregate, it may have been integrative or race-neutral when itwas originally established.
The finding that attendance zone boundaries serve to reinforce racial/ethnic disparities in schools is concerning. However, the findings of thisstudy also offer grounds for cautious optimism. Although the courts havecontinued to limit the ways in which districts may voluntarily integrate stu-dents on the basis of individual race and ethnicity, attendance rezoning rep-resents a legally viable means of integration specifically endorsed by JusticeKennedy in Parents Involved. Moreover, because attendance zones are rela-tively fluid and are by law reviewed and modified frequently (e.g., inresponse to demographic changes or school openings or closures), theyare amenable to change. Indeed, a significant minority of districts are alreadygerrymandered in ways that enhance their integration, particularly those thatare under desegregation order. However, the foregoing analysis demon-strates that many districts could achieve moderate to large decreases in seg-regation through adopting attendance zones that are less gerrymandered,and therefore more compact, than their current zones. In addition, it shouldbe emphasized that gerrymandered attendance zones are inherently ineffi-cient. Although districts would not be expected to adopt Voronoi zones asa zoning scheme (owing to the limitations outlined earlier), analyses suggestthat many districts could achieve increases in integration while increasingefficiency and reducing travel time to school. Thus, rezoning is appealingin that it has the potential to facilitate a rare convergence between the inter-ests of equity and efficiency.
While attendance rezoning holds promise as a legal means of efficientintegration, it also raises a number of practical considerations. In the absenceof stronger state and federal oversight over local control of school atten-dance zone boundaries, the extent to which it is practical to modify schoolattendance zones may depend on the commitment of district leadership toequitable boundaries. While parental pressures certainly influence theschool attendance zoning process, superintendents and district staff exertconsiderable control over the rezoning agenda by in proposing new bound-aries, which are then subject to public review, modification, and, ultimately,approval by the local school board (Richards & Stroub, 2013). As such, cre-ation of more equitable school attendance zones may be largely a function
Richards
1152

of the motivation and political will of district leadership, underscoring theimportant role that school leaders play in fostering equity in schools.
A final note is warranted regarding the reciprocal relationship betweentraditional school attendance zones and schools of choice. While the vastmajority of public school students still attend traditional public schools(NCES CCD, 2013), a growing minority of students attend schools of choice,particularly charters, which operate outside the spatial boundaries of tradi-tional public schools. Likewise, school districts and states, such asMinnesota, are increasingly adopting open enrollment policies that allow stu-dents to attend schools other than the school to which they are geographicallyzoned (Holme & Wells, 2008). In contexts with strong choice markets, theavailability of plentiful and attractive choice options may suppress segregativegerrymandering, by providing alternative ‘‘escape valves’’ for certain families,while relegating less geographically mobile students to their neighborhoodschools. More fundamentally, however, the expansion of alternatives to tradi-tional neighborhood schools holds the potential to erode the salience of tra-ditional geographic boundaries that delineate school attendance zones.
Note
This study was supported in part by the Institute of Education Sciences, U.S.Department of Education, through Grant R305B100013-01. The opinions expressed arethose of the author and do not represent views of the U.S. Department of Education.
References
An, B. P., & Gamoran, A. (2009). Trends in school racial composition in the era ofunitary status. In C. E. Smrekar & E. B. Goldring (Eds.), From the courtroomto the classroom: The shifting landscape of school desegregation (pp. 19–48).Cambridge, MA: Harvard University Press.
Angel, S., & Parent, J. (2011). Non-compactness as a voter exchange: Towards a con-stitutional cure for gerrymandering. Northwestern Interdisciplinary Law Review,4, 89–145.
Aurenhammer, F. (1991). Voronoi diagrams—A survey of fundamental geometric datastructure. ACM Computing Surveys, 23, 345–405.
Bifulco, R., & Ladd, H. F. (2007). School choice, racial segregation, and test scoregaps: Evidence from North Carolina’s charter school program. Journal ofPolicy Analysis and Management, 26, 31–56.
Bischoff, K. (2008). School district fragmentation and racial residential segregation:How do boundaries matter? Urban Affairs Review, 44, 182–217.
Board of Education of Oklahoma City v. Dowell. 498 U.S. 237 (1991).Briffault, R. (1996). The local government boundary problem in metropolitan areas.
Stanford Law Review, 48, 1115–1171.Brunner, E., Imazeki, J., & Ross, S. (2010). Universal vouchers and racial and ethnic
segregation. Review of Economics and Statistics, 92, 912–927.Causey, E., & Claypool, J. (2010). Desegregation in Loudoun County Public Schools
1954–1970. Washington, DC: History Matters.
Gerrymandering of School Attendance Zones
1153
Charles, C. Z. (2003). The dynamics of racial residential segregation. Annual Reviewof Sociology, 29, 167–207.
Clark, W. A. V. (1987). Demographic change, attendance area adjustment and schoolsystem impacts. Population Research and Policy Review, 6, 199–222.
Clark, W. A. V. (2002). Residential segregation trends. In A. Thernstrom &S. Thernstrom (Eds.), Beyond the color line: New perspectives on race and ethnic-ity in America (pp. 83–94). Stanford, CA: Hoover Institution Press.
Clotfelter, C. (2004). After Brown: The rise and retreat of school desegregation.Princeton, NJ: Princeton University Press.
College of William and Mary and the Minnesota Population Center. (2011). SchoolAttendance Boundary Information System (SABINS): Version 1.0. Minneapolis:University of Minnesota. Retrieved from http://www.sabinsdata.org
Douglas, D. M. (1995). Reading, writing & race: The desegregation of the Charlotteschools. Chapel Hill: University of North Carolina Press.
Fiel, J. E. (2013). Decomposing school resegregation: Social closure, racial imbalance,and racial isolation. American Sociological Review, 78, 828–848.
Fischel, W. A. (2009). Making the grade: The economics evolution of American schooldistricts. Chicago, IL: University of Chicago Press.
Frankenberg, E., Lee, C., & Orfield, G. (2003). A multiracial society with segregatedschools: Are we losing the dream? Cambridge, MA: Harvard University CivilRights Project.
Frankenberg, E., & Orfield, G. (2012). The resegregation of urban schools: A hiddencrisis in American education. Cambridge, MA: Harvard Education Press.
Freeman v. Pitts. 503 U.S. 467 (1992).Harwell, M., & LeBeau, B. (2010). Student eligibility for free lunch as a SES measure in
education research. Educational Researcher, 39, 120–131.Hogrebe, M. C., & Tate, W. F. (2012). Geospatial perspective: Toward a visual political
literacy in education, health, and human services. Review of Research inEducation, 36, 67–94.
Holley-Walker, D. (2010). After unitary status: Examining voluntary integration strat-egies for Southern school districts. North Carolina Law Review, 88, 877–910.
Holley-Walker, D. (2012). A new era for desegregation. Georgia State University LawReview, 28, 423–466.
Holme, J. J., & Finnigan, K. S. (in press). School diversity, school district fragmenta-tion, and metropolitan policy. Teachers College Record.
Holme, J. J., & Richards, M. P. (2009). School choice and stratification in a regionalcontext: Examining the role of inter-district choice. Peabody Journal ofEducation, 84, 150–171.
Holme, J. J., & Wells, A. S. (2008). School choice beyond district borders: Lessons forthe reauthorization of NCLB from inter-district desegregation and open enroll-ment plans. New York, NY: Century Foundation.
Iceland, J. (2004). The multigroup entropy index (Also known as Theil’s H or theinformation theory index). Washington, DC: U.S. Census Bureau. Retrievedfrom http://www.census.gov/hhes/www/housing/housing_patterns/multigroup_entropy.pdf
Iceland, J., Weinberg, D. H., & Steinmetz, E. (2002). Racial and ethnic segregation inthe United States: 1980–2000 (Census 2000 Special Report Series CENSR-3).Washington, DC: U.S. Census Bureau.
Jacobs, G. S. (1998). Getting around Brown: Desegregation, development, and theColumbus public schools. Columbus: Ohio State University Press.
Keyes v. School District No. 1, Denver, Co., 413 U.S. 189 (1973).League of United Latin American Citizens v. Perry, 548 U.S. 399 (2006).
Richards
1154
League of Women Voters. (2008). School redistricting—New Hanover County.Retrieved from http://bettergov.nc.lwvnet.org/Redistricting.html
Leigh, P. R. (1997). Segregation by gerrymander: The creation of the Lincoln Heights(Ohio) school district. Journal of Negro Education, 66, 121–136.
Logan, J. R. (2002). Choosing segregation: Racial imbalance in American publicschools 1990–2000. Albany, NY: Lewis Mumford Center for ComparativeUrban and Regional Research.
Logan, J. R., & Oakley, D. (2004). The continuing legacy of the Brown decision: Courtaction and school segregation, 1960–2000. Albany: University at Albany, StateUniversity of New York, Lewis Mumford Center for Comparative Urban andRegional Research.
Logan, J. R., Stults, B., & Farley, R. (2004). Segregation of minorities in the metropolis:Two decades of change. Demography, 41, 1–22.
Lutz, B. F. (2011). The end of court-ordered desegregation. American EconomicJournal: Economic Policy, 3, 130-168.
Miles, R. E., & Maillardet, R. J. (1982). The basic structures of Voronoi and generalizedVoronoi polygons. Journal of Applied Probability, 19, 97–111.
Missouri v. Jenkins. 515 U.S. 70 (1995).National Center for Education Statistics. (2009). Fast facts: Public school choice pro-
grams. Retrieved from http://nces.ed.gov/fastfacts/display.asp?id=6Okabe, A., Boots, B., Sugihara, K., & Chiu, S. N. (2000). Spatial tessellations: Concepts
and applications of Voronoi diagrams. New York, NY: John Wiley.Ong, P. M., & Rickles, J. (2004). The continued nexus between school and residential
segregation. Berkeley Women’s Law Journal, 19, 379-394.Orfield, G., Bachmeier, M. D., James, D. R., & Eitle, T. (1997). Deepening segregation
in American public schools: A special report from the Harvard Project on SchoolDesegregation. Equity & Excellence in Education, 30, 5–24.
Orfield, G., & Eaton, S. (1997). Dismantling desegregation: The quiet reversal ofBrown v. Board of Education. New York, NY: New Press.
Orfield, G., Kucsera, J., & Siegel-Hawley, G. (2012). E Pluribus . . . separation:Deepening double segregation for more students. Los Angeles: University ofCalifornia, Los Angeles Civil Rights Project.
Orfield, G., & Monfort, F. (1992). Status of school desegregation: The next generation.Report to the National School Boards Association. Cambridge, MA: HarvardOpportunity Project.
Orfield, G., Schley, S., Glass, D., & Reardon, S. (1993). The growth of segregation inAmerican schools: Changing patterns of separation and poverty since 1968.Cambridge, MA: Harvard Project on School Desegregation.
Orfield, G., & Yun, J. T. (1999). Resegregation in American schools. Cambridge, MA:Harvard University Civil Rights Project.
Orfield, M. (2002). American metropolitics: The new suburban reality. Washington,DC: Brookings Institution.
Orfield, M., & Luce, T. F. (2009). Region: Planning the future of the Twin Cities.Minneapolis: University of Minnesota Press.
Orfield, M., & Luce, T. F. (2013). America’s racially diverse suburbs: Opportunitiesand challenges. Housing Policy Debate, 23, 395–430.
Parents Involved in Community Schools v. Seattle School District No. 1, 551 U.S. 701(2007).
Reardon, S. F., & Firebaugh, G. (2002). Measures of multigroup segregation.Sociological Methodology, 32, 33–67.
Gerrymandering of School Attendance Zones
1155

Reardon, S. F., Grewal, E., Kalogrides, D., & Greenberg, E. (2012). Brown fades: Theend of court-ordered school desegregation and the resegregation of Americanpublic schools. Journal of Policy Analysis and Management, 31, 876–904.
Reardon, S. F., & Owens, A. (in press). 60 years after Brown: Trends and consequen-ces of school segregation. Annual Review of Sociology.
Reardon, S., & Yun, S. F. (2001). Integrating neighborhoods, segregating schools: Theretreat from school desegregation in the South, 1990–2000. North Carolina LawReview, 81, 1563–1596.
Reardon, S. F., Yun, J. T., & Eitle, T. M. (2000). The changing structure of school seg-regation: Measurement and evidence of multiracial metropolitan-area schoolsegregation, 1989–1995. Demography, 37, 351–364.
Renzulli, L. A., & Evans, L. (2005). School choice, charter schools, and White flight inthe U.S. Social Problems, 52, 398–418.
Richards, M. P., & Stroub, K. J. (2013). School catchment zones, politically definedschool boundaries. In J. Ainsworth (Ed.), Sociology of education (Vol. 19, pp.671–672). Thousand Oaks, CA: Sage.
Richards, M. P., & Stroub, K. J. (in press). An accident of geography? Assessing thegerrymandering of public school attendance zones. Teachers College Record.
Rosnow, R., & Rosenthal, R. (1996). Computing contrasts, effect sizes, and counter-nulls on other people’s published data: General procedures for research com-puters. Psychological Methods, 1, 331–340.
Saporito, S. (2003). Private choices, public consequences: Magnet school choice andsegregation by race and poverty. Social Problems, 50, 181–203.
Saporito, S., & Sohoni, D. (2006). Coloring outside the lines: Racial segregation inpublic schools and their attendance boundaries. Sociology of Education, 79,81–105.
Saporito, S., & Sohoni, D. (2007). Mapping educational inequality: Concentrations ofpoverty among poor and minority students in public schools. Social Forces, 85,1227–1253.
Siegel-Hawley, G. (2010, August). Colored boundaries: School redistricting ina racially changing suburb. Paper presented at the 2010 annual meeting ofthe American Sociological Association, Atlanta, GA.
Siegel-Hawley, G. (2013). Educational gerrymandering? Race and attendance bound-aries in a racially changing suburb. Harvard Educational Review, 83, 580–612.
Sohoni, D., & Saporito, S. (2009). Mapping school segregation: Using GIS to exploreracial segregation between schools and their corresponding attendance areas.American Journal of Education, 115, 569–600.
Stroub, K. J., & Richards, M. P. (2013). From resegregation to reintegration: Trends inmetropolitan school segregation, 1993–2010. American Educational ResearchJournal, 50, 497–531.
Sugrue, T. J. (2009). Sweet land of liberty: The forgotten struggle for civil rights in theNorth. New York, NY: Random House.
Swann v. Charlotte-Mecklenburg Board of Education, 402 U.S. 1 (1971).Tiebout, C. M. (1956). A pure theory of local expenditures. Journal of Political
Economy, 64, 416–424.Timberlake, J. M., & Iceland, J. (2007). Change in racial and ethnic residential
inequality in American cities, 1970–2000. City & Community, 6, 335–365.U.S. Census Bureau. (2012). Geographic terms and concepts—Block. Retrieved from
https://www.census.gov/geo/reference/gtc/gtc_block.htmlU.S. National Advisory Commission on Civil Disorders. (1968). Report of the National
Advisory Commission on Civil Disorders. New York, NY: Bantam Books.
Richards
1156

Vaznis, J. (2009, February 26). New school zone plan could hurt poorest neighbor-hoods. Boston Globe. Retrieved from http://www.boston.com/news/local/massachusetts/articles/2009/02/25/new_school_zone_plan_could_hurt_poorest_neighborhoods/
Vieth v. Jubelirer, 541 U.S. 354 (2004).Weiher, G. R. (1991). The fractured metropolis: Political fragmentation and metropol-
itan segregation. Albany: State University of New York Press.White, M. (1986). Segregation and diversity measures in population distribution.
Population Index, 52, 198–221.
Manuscript received December 17, 2012Final revision received May 5, 2014
Accepted July 5, 2014
Gerrymandering of School Attendance Zones
1157