the gic weekly digest - amazon web services bloomberg, haver analytics, morgan stanley wealth...
TRANSCRIPT
The GIC Weekly Digest
February 5, 2018

Past performance is no guarantee of future results. Estimates of future performance are based on assumptions that may not be realized. This material is not a solicitation of any offer to buy or sell any security or other financial instrument or to participate in any trading strategy. Please refer to important information, disclosures and qualifications at the end of this material.
WEALTH MANAGEMENT INVESTMENT RESOURCES | CHARTBOOK | WEEKLY DIGEST
Weekly Summary (as of 2/2/2018)
Discussion Points From The GIC Weekly • While economic momentum remains strong, shifting
dynamics in both the rates and currency markets augurs growing caution that P/E multiples could be at risk.
• Economic surprises and earnings revisions may be cresting at the same time that stress from Washington is increasing.
• In our view, a garden-variety correction of as much as 10% is not out of the question. Still, our full-year S&P 500 target remains 2,750.
• Watch the level of the VIX and the gap between realized and anticipated volatility. Consider equity long/short hedge funds to manage market volatility.
Market Snapshot
Equities Closing Price Weekly ChangeS&P 500 2762.13 -3.82%DJ Industrial Average 25520.96 -4.11%NASDAQ Composite 7240.95 -3.51%
CommoditiesWTI Crude $65.45 -1.04%Gold Spot $1,333.39 -1.17%
CurrenciesEUR/USD 1.25 0.29%US Dollar Index (DXY) 89.20 0.14%
Fixed Income (Corporate) OASBarclays US Aggregate 85 -2Barclays US High Yield 324 13
US Treasury Yields Yield2-Year 2.14% 0.035-Year 2.59% 0.1210-Year 2.84% 0.1830-Year 3.09% 0.18
Source: Bloomberg, FactSet, Morgan Stanley Wealth Management GIC. Option-Adjusted Spread (OAS) is a measurement of the spread of a fixed income security rate and the risk-free rate of return, which is adjusted to take into account an embedded option. Equity risk premium is the excess return that an individual stock or the overall stock market provides over a risk-free rate. The risk-free rate represents the interest an investor would expect from an absolutely risk-free investment over a specified period of time.
As of February 2, 2018
Weekly Focus
Market/Asset Class Performance
• US equities finished down 3.82%, with Telecom and Utilities leading, and Materials and Energy lagging. The S&P 500 closed Friday down over 2%—its worst day since September 2016.
• Gold fell 1.17% and WTI crude oil prices retreated 1.04% on the week, closing at $65.45 per barrel.
• Rates rose meaningfully last week with the 10-year Treasury rising 18bps to 2.84%. The 2-year yield increased slightly to 2.14%. The 10’s 2’s yield curve steepened back to 70 bps.
• European equities (STOXX 600) finished the week down 2.89% (in USD) while Japanese equities fell 2.33% (TOPIX in USD). Emerging markets (MSCI EM) traded lower as well, losing 3.32% (in USD).
• The dollar stayed mostly flat last week, rising 0.14% after hitting its lowest value since December 2014. This occurred as the yen depreciated 1.44% to 110.17. The euro and the pound remained steady at 1.24 and 1.41, respectively.
Macro Growth Indicators
• Change in Nonfarm Payrolls came in at 200k, above expectations of 180k, while unemployment was unchanged at 4.1%.
• Average hourly earnings rose 0.3% month over month and 2.9% year over year—the fastest pace since 2009.
• University of Michigan consumer sentiment also beat expectations at 95.7, slightly ahead of estimates of 95.
• Japanese retail sales were much stronger than survey results, rising 0.9% month over month versus a projected decline of 0.4%.
Policy
• The FOMC kept interest rates unchanged in the 1.25-1.50% range on Wednesday. The statement from the committee expressed that recent economic data has been “solid,” risks remain “roughly balanced,” and that further hikes are warranted if conditions remain.
• The Congressional Budget Office warned that the US will hit the debt ceiling a month sooner than previously expected as a result of lost revenue from the recent tax cut. Congress will need to act by early March in order to avoid a government default.
• Some members of the ECB are pushing for the group to be more forthcoming in its discussions on rate guidance. They fear that opaqueness will create volatility and hurt the accelerating Eurozone economy.
Company Fundamentals
• 251 S&P 500 companies have reported earnings so far, with 79% reporting positive earnings surprises.
• Forward earnings for the S&P 500 increased to $156 from $153 for 2018.
Sentiment & Technicals
• AAII Bulls fell to 45%, as neutrals increased to 26% and bears rose slightly to 29%.
• The percent of NYSE stocks closing above their 200-day averages decreased slightly to 64% week over week.
Page 2 of 70

Past performance is no guarantee of future results. Estimates of future performance are based on assumptions that may not be realized. This material is not a solicitation of any offer to buy or sell any security or other financial instrument or to participate in any trading strategy. Please refer to important information, disclosures and qualifications at the end of this material.
WEALTH MANAGEMENT INVESTMENT RESOURCES | CHARTBOOK | WEEKLY DIGEST
-40%
-30%
-20%
-10%
0%
10%
20%
30%
-30
-20
-10
0
10
20
30
40
Capex Plans Index (3 Month Moving Avg, Left axis)
Equipment Investment (Year Over Year, Right axis)
Chart of the Week: Capital Spending Intentions at All-Time High
Source: Bloomberg, Haver Analytics, Morgan Stanley Wealth Management GIC. Morgan Stanley Capex Plans Index tracks how much businesses are likely to spend in the coming months.
Weekly Focus
Capex Plans Vs. Equipment Investment Data as of January 31, 2018
Despite Friday’s correction, stocks are still trading near all-time highs. We believe the one element that will contribute to a normalization of volatility from historically low levels is mean reversion in key economic variables. A data series that has seen an impressive rebound during the past year is the MS & Co. Capex Plans Index, which tends to lead equipment investment (see chart). While a rebound in capital spending has been anticipated for much of the cycle, recent readings are at all-time highs, reflecting high levels of both business and consumer confidence. Capital equipment investment has shown a strong high correlation with industrial production growth which, in turn, is linked to S&P 500 earnings.
Page 3 of 70

Past performance is no guarantee of future results. Estimates of future performance are based on assumptions that may not be realized. This material is not a solicitation of any offer to buy or sell any security or other financial instrument or to participate in any trading strategy. Please refer to important information, disclosures and qualifications at the end of this material.
WEALTH MANAGEMENT INVESTMENT RESOURCES | CHARTBOOK | WEEKLY DIGEST
2%
3%
4%
5%
6%
7%
8%
9%
1996
1997
1998
1999
2001
2002
2003
2004
2006
2007
2008
2009
2011
2012
2013
2014
2016
2017
Recession
Capex as a % of Sales
R&D as a % of Sales
Buybacks and Dividends as a % of Sales
0.0%
2.0%
4.0%
6.0%
8.0%
10.0%
12.0%
14.0%
1997 1999 2001 2003 2005 2007 2009 2011 2013 2015 2017
Buybacks and Dividends as a % of Sales
Capex + R&D as a % of sales
Market Spotlight: Business Investment Is Growing at the Fastest Pace in 15 Years
Weekly Focus
Source: FactSet, Morgan Stanley Wealth Management GIC
Business Investment Growing, While Buybacks and Dividends Are Falling Monthly Data as of October 1995 to December 2017
R&D and Capex Both Accelerating Monthly Data as of October 1995 to December 2017
Page 4 of 70

Past performance is no guarantee of future results. Estimates of future performance are based on assumptions that may not be realized. This material is not a solicitation of any offer to buy or sell any security or other financial instrument or to participate in any trading strategy. Please refer to important information, disclosures and qualifications at the end of this material.
WEALTH MANAGEMENT INVESTMENT RESOURCES | CHARTBOOK | WEEKLY DIGEST
Market Spotlight: Economic Cycle Is Approaching Record Length Weekly Focus
Source: OECD, Morgan Stanley& Co. Research, BEA, NBER, Morgan Stanley Wealth Management GIC. Note: The number labels represent the recovery period in quarters.
Current DM Recovery Already the Longest on Record Since the Mid-1970s Quarterly Data as of September 30, 2017
Current US Recovery Inching Towards the Record Expansion of the 1990s Quarterly Data as of December 31, 2017
57 19 28 29 24 34
-6%
-4%
-2%
0%
2%
4%
6%
8%
10%
US GDP YearOver Year
35 12 20 31
-6%
-4%
-2%
0%
2%
4%
6%
8%
10%
OECD GDP YearOver Year
4 40 24 34
Page 5 of 70

Past performance is no guarantee of future results. Estimates of future performance are based on assumptions that may not be realized. This material is not a solicitation of any offer to buy or sell any security or other financial instrument or to participate in any trading strategy. Please refer to important information, disclosures and qualifications at the end of this material.
WEALTH MANAGEMENT INVESTMENT RESOURCES | CHARTBOOK | WEEKLY DIGEST
Tactical Theme: Long European Equities Weekly Focus
-40 %
-30 %
-20 %
-10 %
0 %
10 %
1975 1981 1987 1993 1999 2005 2011 2017
MSCI Europe vs MSCI USA (Avg % Prem/Disc On P/E, P/B & P/D) Median
0%
10%
20%
30%
40%
50%
60%
70%
80%
90%
100%
MSCI Europe S&P 500
Real Estate
Utilities
Telecom
Information Technology
Energy
Materials
Consumer Discretionary
Health Care
Industrials
Consumer Staples
Financials
Overview – As we enter the new year, we should recognize the significance of 2017 to our European equities call. In 2017, MSCI Europe returned 26.3%, which was 4.5% more than the 21.8% of the S&P 500. However, much of this relative outperformance came in the first half of 2017, with Europe generally giving back most of this outperformance as idiosyncratic progress on tax reform lifted US equities in the latter half of the year. As we head into 2018, we believe Europe has a more attractive risk/reward skew than the US based on an improving economy, earnings growth that is finally turning a corner, a beneficial sector exposure, and attractive valuations.
Economic Data – As good as the US economic data has been recently, in many cases Europe has been ever more impressive. Eurozone manufacturing PMI hit 60.6 on its latest tick, well above the 55.1 seen in the US. Additionally, GDP has surprised to the upside, coming in at 2.6% year over year in 3Q17. On top of this, unemployment is back to levels last seen in 2005. With improving economic data, capital has flowed into the economy helping the euro appreciate to 1.23 vs the US dollar. This has aided US investor returns as we have recommended unhedged exposure to the region.
Earnings – While economic data is critical to the region’s continuing outperformance, even more important is the earnings story. Prior to 2017, Europe’s earnings declined for 6 straight years. However, 2017 posted very strong growth, with estimates pointing to up 27% for the year (even with an appreciating euro). For 2018, consensus estimates are calling for 13% earnings growth. While this is below the consensus growth estimate for the US at 14.4%, we would argue that in Europe the earnings growth is more organic and stable since a chunk of the US’s growth will come from a one-time lift due to tax reform.
Sector Exposures – Much of the reason why Europe underperformed over the last 5 years was due to a larger exposure in the region to commodities, financials, and EM (with tech notably absent). In fact, as shown in the chart to the right, Europe’s exposure to tech is only around 5% vs the US at around 24%. While this “value tilt” certainly hindered performance during the past cycle, with the global economic outlook finally improving, Europe’s tilt to these value sectors may actually provide potential considerable upside in 2018.
Valuations – Despite Europe’s rally in 2017, equities continue to have attractive valuations, trading at 15.2x consensus 12-month forward PE vs the S&P 500’s 18.5x 12-month forward PE (a ~17% discount). When looking at a combination of P/E, P/B, and price to dividend, European equities are trading at a 35% discount to the US, well below the long-term average. While a portion of the valuation discount is due to the sector differences mentioned above, there are likely other factors weighing down multiples such as skepticism that the economic and earnings recovery is real as well as whether the recent euro strength could derail it.
Risks – Global growth disappoints, tighter-than-expected monetary policy from ECB. Source: Bloomberg, Morgan Stanley Wealth Management Market Strategy as of 1/17/2018
MSCI Europe is at a 35% Discount to US on Forward P/E, P/B, & P/D
MSCI Europe Has a Value Tilt Compared to the S&P 500, Significantly Less Technology Exposure
Source: MSCI, IBES, Morgan Stanley & Co. Research as of 1/12/2018. Note: Average relative valuations use 12M forward data where available (forward P/E data starts in 1987) and trailing data where forward P/E not available – P/E = price / earnings; P/B = price / book; P/D = price / dividend
Page 6 of 70

Past performance is no guarantee of future results. Estimates of future performance are based on assumptions that may not be realized. This material is not a solicitation of any offer to buy or sell any security or other financial instrument or to participate in any trading strategy. Please refer to important information, disclosures and qualifications at the end of this material.
WEALTH MANAGEMENT INVESTMENT RESOURCES | CHARTBOOK | WEEKLY DIGEST
1.1%2.5%
3.5% 3.6%4.9%
10.1%
-2.0% -1.6% -1.8%
0.8%
-5%
0%
5%
10%
15%
20%
25%
30%
35%
40%
Model 3Benchmark
Model 3Tactical
MSCIUSA
MSCIEAFE
MSCIJapan
MSCIChina
BarclaysUS
Treasury
BarclaysUS
Municipal
BarclaysUS Agg
BarclaysGlobal HY
Year-to-Date 1-Year 3-Year (annualized)
Model 3 Strategic
Model 3 Tactical
Model 3 Benchmark
S&P 500
Citi 3M T Bill
Barclays US Agg
HFRX Global HF
MSCI ACWI
-3.0%
-2.0%
-1.0%
0.0%
1.0%
2.0%
3.0%
4.0%
0% 1% 2% 3% 4% 5% 6% 7% 8%R
etur
nsVolatility
GIC Balanced Growth Model Hypothetical Performance Comparison
Source: FactSet, Bloomberg, Morgan Stanley Wealth Management GIC. Barclays indices are Bloomberg Barclays Indices. Within alternatives, HFRX Indices are used as an estimate until HFRI and Credit Suisse indices become available. HFRI data is as of 12/31/17, Credit Suisse data is as of 12/31/17. HFRX data is used for HFRI indices from 1/1/2018 to 2/2/2018 and Credit Suisse indices from 1/1/2018 to 2/2/2018. Model 3 = GIC Balanced Growth Model and is shown for illustrative purposes only, representing the GIC’s moderate asset allocation profile aimed at balancing risk and return. Model 3 Benchmark as shown represents the average of the blended benchmark indices as selected by the GIC: 50% MSCI ACWI, 45% Bloomberg Barclays US Aggregate Bond Index, and 5% Citi 3-Month T-Bill Index. S&P 500 and HFRX Global HF indices are shown for illustrative purposes only and are meant to be representative of the US large-cap equity market and the overall hedge fund universe, respectively, to complement the benchmark indices and serve as further comparison for the asset classes included in Model 3 . Model 3 Strategic return and volatility represent the GIC’s proposed 7-year investment horizon. Model 3 Tactical return and volatility represent the GIC’s proposed 20-year investment horizon. The Global Investment Committee Asset Allocation Models are not provided as part of an investment advisory service offered by Morgan Stanley Wealth Management, are not available to be directly implemented as part of an investment advisory service and should not be regarded as a recommendation of any Morgan Stanley Wealth Management investment advisory service. Returns expressed in US dollars. The hypothetical Model 3 performance does not reflect the investment or performance of actual portfolios. Hypothetical performance results do not reflect advisory fees or brokerage commissions. Had the results reflected these costs, the hypothetical performance would have been lower. For more information about the risks to hypothetical performance please refer to the Risk Considerations section at the end of this material. Please refer to the GIC’s Tactical Asset Allocation Changes report dated August 11, 2016 and the GIC Profiles for more information regarding current model positioning. Standard deviation (volatility) is a measure of the dispersion of a set of data from its mean. Volatility as shown is measured over the most recent rolling six months.
YTD Hypothetical Model 3 Performance and Volatility
For Illustrative Purposes Only
Asset Class Performance (USD) As of February 2, 2018 As of February 2, 2018
Weekly Focus
Page 7 of 70
Past performance is no guarantee of future results. Estimates of future performance are based on assumptions that may not be realized. This material is not a solicitation of any offer to buy or sell any security or other financial instrument or to participate in any trading strategy. Please refer to important information, disclosures and qualifications at the end of this material.
WEALTH MANAGEMENT INVESTMENT RESOURCES | CHARTBOOK | WEEKLY DIGEST
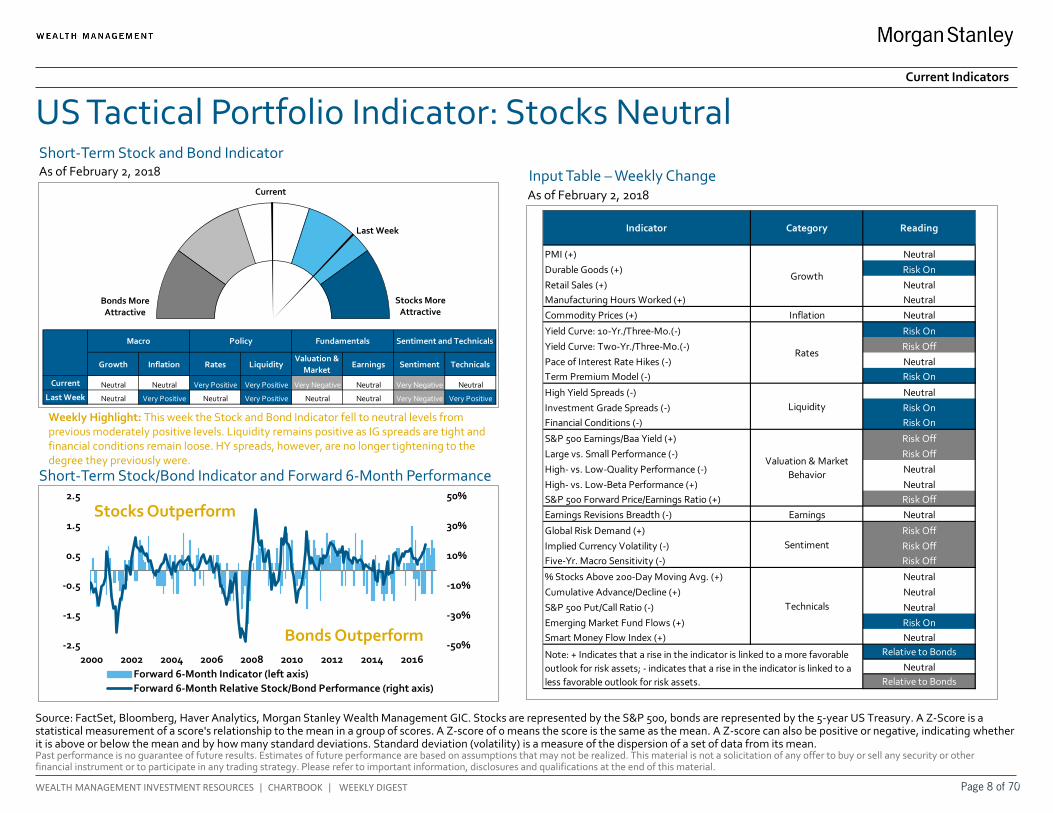
Indicator Category Reading
PMI (+) NeutralDurable Goods (+) Risk OnRetail Sales (+) NeutralManufacturing Hours Worked (+) NeutralCommodity Prices (+) Inflation Neutral
Yield Curve: 10-Yr./Three-Mo.(-) Risk OnYield Curve: Two-Yr./Three-Mo.(-) Risk OffPace of Interest Rate Hikes (-) NeutralTerm Premium Model (-) Risk On
High Yield Spreads (-) NeutralInvestment Grade Spreads (-) Risk OnFinancial Conditions (-) Risk On
S&P 500 Earnings/Baa Yield (+) Risk OffLarge vs. Small Performance (-) Risk OffHigh- vs. Low-Quality Performance (-) NeutralHigh- vs. Low-Beta Performance (+) NeutralS&P 500 Forward Price/Earnings Ratio (+) Risk OffEarnings Revisions Breadth (-) Earnings Neutral
Global Risk Demand (+) Risk OffImplied Currency Volatility (-) Risk OffFive-Yr. Macro Sensitivity (-) Risk Off
% Stocks Above 200-Day Moving Avg. (+) NeutralCumulative Advance/Decline (+) NeutralS&P 500 Put/Call Ratio (-) NeutralEmerging Market Fund Flows (+) Risk OnSmart Money Flow Index (+) Neutral
Relative to BondsNeutral
Relative to Bonds
Technicals
Note: + Indicates that a rise in the indicator is linked to a more favorable outlook for risk assets; - indicates that a rise in the indicator is linked to a less favorable outlook for risk assets.
Growth
Rates
Liquidity
Valuation & Market Behavior
Sentiment
Growth Inflation Rates LiquidityValuation &
MarketEarnings Sentiment Technicals
Current Neutral Neutral Very Positive Very Positive Very Negative Neutral Very Negative Neutral
Last Week Neutral Very Positive Neutral Very Positive Neutral Neutral Very Negative Very Positive
Macro Policy Fundamentals Sentiment and Technicals
-50%
-30%
-10%
10%
30%
50%
-2.5
-1.5
-0.5
0.5
1.5
2.5
2000 2002 2004 2006 2008 2010 2012 2014 2016Forward 6-Month Indicator (left axis)Forward 6-Month Relative Stock/Bond Performance (right axis)
Bonds More Attractive
Stocks More Attractive
Last Week
Current
Source: FactSet, Bloomberg, Haver Analytics, Morgan Stanley Wealth Management GIC. Stocks are represented by the S&P 500, bonds are represented by the 5-year US Treasury. A Z-Score is a statistical measurement of a score's relationship to the mean in a group of scores. A Z-score of 0 means the score is the same as the mean. A Z-score can also be positive or negative, indicating whether it is above or below the mean and by how many standard deviations. Standard deviation (volatility) is a measure of the dispersion of a set of data from its mean.
US Tactical Portfolio Indicator: Stocks Neutral As of February 2, 2018
Short-Term Stock/Bond Indicator and Forward 6-Month Performance
Current Indicators
Short-Term Stock and Bond Indicator
Input Table – Weekly Change
Stocks Outperform
Bonds Outperform
As of February 2, 2018
Weekly Highlight: This week the Stock and Bond Indicator fell to neutral levels from previous moderately positive levels. Liquidity remains positive as IG spreads are tight and financial conditions remain loose. HY spreads, however, are no longer tightening to the degree they previously were.
Page 8 of 70

Past performance is no guarantee of future results. Estimates of future performance are based on assumptions that may not be realized. This material is not a solicitation of any offer to buy or sell any security or other financial instrument or to participate in any trading strategy. Please refer to important information, disclosures and qualifications at the end of this material.
WEALTH MANAGEMENT INVESTMENT RESOURCES | CHARTBOOK | WEEKLY DIGEST
Source: Bloomberg, FactSet, dailysentimentindex.com, Morgan Stanley & Co., Morgan Stanley Wealth Management GIC. This page features Morgan Stanley & Co.’s proprietary US Equity Risk Indicator, which is a gauge of US equity market sentiment/positioning. It also features a table of some of the key sentiment, positioning, breadth and volatility measures that we watch on a regular basis. Each factor is ranked against its three-year history to provide some historical context. Equity Risk Indicator is a standardized measure of investor sentiment and positioning and earnings revision factors, compiled using a statistical Z-score methodology. A Z-Score is a statistical measurement of a score's relationship to the mean in a group of scores. A Z-score of 0 means the score is the same as the mean. A Z-score can also be positive or negative, indicating whether it is above or below the mean and by how many standard deviations. Standard deviation (volatility) is a measure of the dispersion of a set of data from its mean. (1) % rank inverted. Global Risk Demand Index (GRDI): Proprietary gauge of global risk asset sentiment. Daily Sentiment Index: Poll that tracks trader sentiment of US stocks. AAII % Bulls: Individual investor sentiment poll of US equities. Mutual Fund Beta: Measure of mutual fund volatility vs. S&P 500 volatility. Relative Strength Index: Measures momentum; >70=overbought; <30=oversold.
US Equity Market Indicators: US Stock Risk Elevated Current Indicators
Morgan Stanley Equity Risk Indicator As of January 26, 2018
Buy
Sell
• The US Equity Risk Indicator came in at 1.9 last week
• Sentiment polls and market breadth inputs remain bullish
Page 9 of 70

Past performance is no guarantee of future results. Estimates of future performance are based on assumptions that may not be realized. This material is not a solicitation of any offer to buy or sell any security or other financial instrument or to participate in any trading strategy. Please refer to important information, disclosures and qualifications at the end of this material.
WEALTH MANAGEMENT INVESTMENT RESOURCES | CHARTBOOK | WEEKLY DIGEST
0
20
40
60
80
100
120
140
160
Jan' 16 May' 16 Sep' 16 Jan' 17 May' 17 Sep' 17 Jan' 18
US 10Yr vs. 2Yr Spread
-100
-50
0
50
100
150
200
250
30010
20
40
1991
1993
1995
1997
1999
2001
2003
2005
2007
2009
2011
2013
2015
2017
VIX Index (log, 3M avg., lagged 30 months, LS)
US 10Yr vs. 2Yr Spread (inverted, RS)
Yield Curve Flattening
Source: Bloomberg, Morgan Stanley Wealth Management GIC
Current Indicators
VIX Index Vs. Yield Curve
As of February 2, 2018
US 10-Year vs 2-Year Spread
As of February 2, 2018
Page 10 of 70
Past performance is no guarantee of future results. Estimates of future performance are based on assumptions that may not be realized. This material is not a solicitation of any offer to buy or sell any security or other financial instrument or to participate in any trading strategy. Please refer to important information, disclosures and qualifications at the end of this material.
WEALTH MANAGEMENT INVESTMENT RESOURCES | CHARTBOOK | WEEKLY DIGEST
-0.7%
-0.6%
-0.5%
-0.4%
-0.3%
-0.2%
-0.1%
0.0%
0.1%
0.2%
Feb-17 Apr-17 Jun-17 Aug-17 Oct-17 Dec-17 Feb-18
-1.0%
-0.5%
0.0%
0.5%
1.0%
1.5%
2.0%
2.5%
3.0%
3.5%
2000 2002 2004 2006 2008 2010 2012 2014 2016 2018
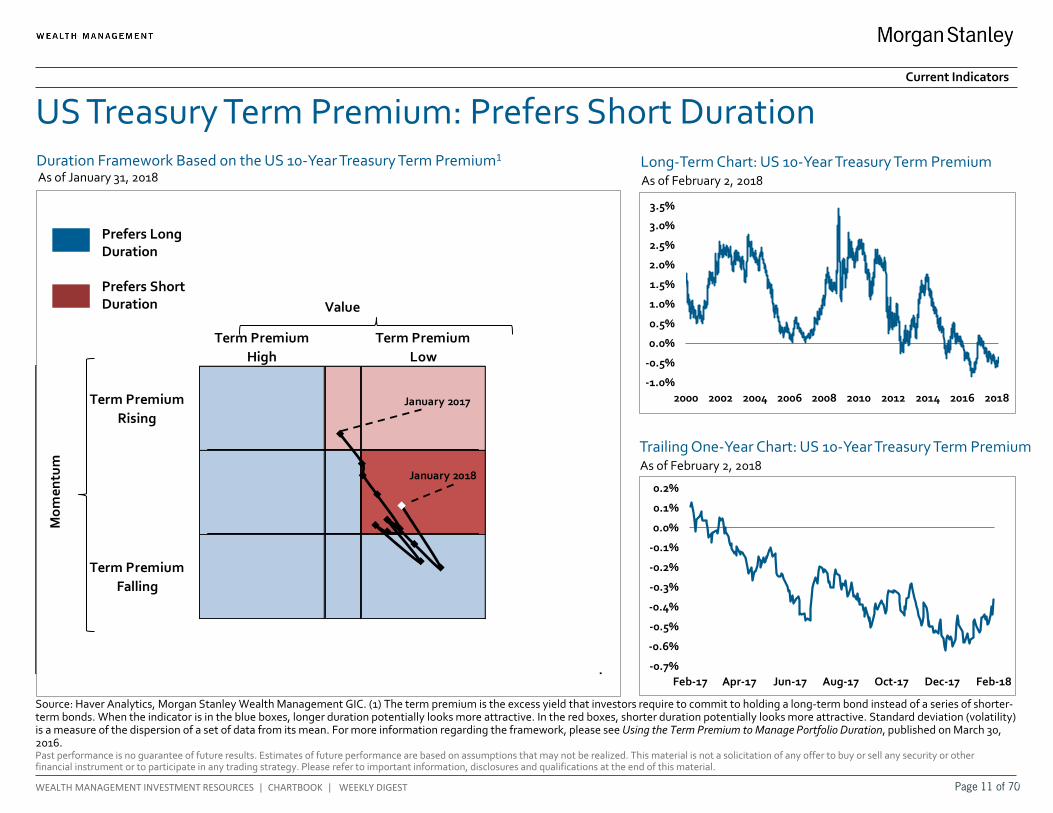
Duration Framework Based on the US 10-Year Treasury Term Premium1
US Treasury Term Premium: Prefers Short Duration
Source: Haver Analytics, Morgan Stanley Wealth Management GIC. (1) The term premium is the excess yield that investors require to commit to holding a long-term bond instead of a series of shorter-term bonds. When the indicator is in the blue boxes, longer duration potentially looks more attractive. In the red boxes, shorter duration potentially looks more attractive. Standard deviation (volatility) is a measure of the dispersion of a set of data from its mean. For more information regarding the framework, please see Using the Term Premium to Manage Portfolio Duration, published on March 30, 2016.
Term Premium High
Term Premium Low
Term Premium Rising
Short Duration
Term Premium Falling
Value
Mom
entu
m
January 2017
January 2018
Prefers Long Duration
Prefers Short Duration
Long-Term Chart: US 10-Year Treasury Term Premium As of February 2, 2018
Trailing One-Year Chart: US 10-Year Treasury Term Premium As of February 2, 2018
As of January 31, 2018
Current Indicators
Page 11 of 70

Past performance is no guarantee of future results. Estimates of future performance are based on assumptions that may not be realized. This material is not a solicitation of any offer to buy or sell any security or other financial instrument or to participate in any trading strategy. Please refer to important information, disclosures and qualifications at the end of this material.
WEALTH MANAGEMENT INVESTMENT RESOURCES | CHARTBOOK | WEEKLY DIGEST
VIX Index (Equities)
MOVE Index (Fixed Income)
CVIX Index (Currency)
US Equity, Fixed Income and Currency Volatility
Source: Bloomberg, Morgan Stanley Wealth Management GIC. Standard deviation (volatility) is a measure of the dispersion of a set of data from its mean.
As of February 2, 2018
As of February 2, 2018
As of February 2, 2018
Current Indicators
Page 12 of 70
Past performance is no guarantee of future results. Estimates of future performance are based on assumptions that may not be realized. This material is not a solicitation of any offer to buy or sell any security or other financial instrument or to participate in any trading strategy. Please refer to important information, disclosures and qualifications at the end of this material.
WEALTH MANAGEMENT INVESTMENT RESOURCES | CHARTBOOK | WEEKLY DIGEST
-1
-0.8
-0.6
-0.4
-0.2
0
0.2
0.4
0.6
0.8
1
1995 1997 1999 2001 2003 2005 2007 2009 2011 2013 2015 2017
15%
20%
25%
30%
35%
40%
45%
50%
2003 2005 2007 2009 2011 2013 2015 2017
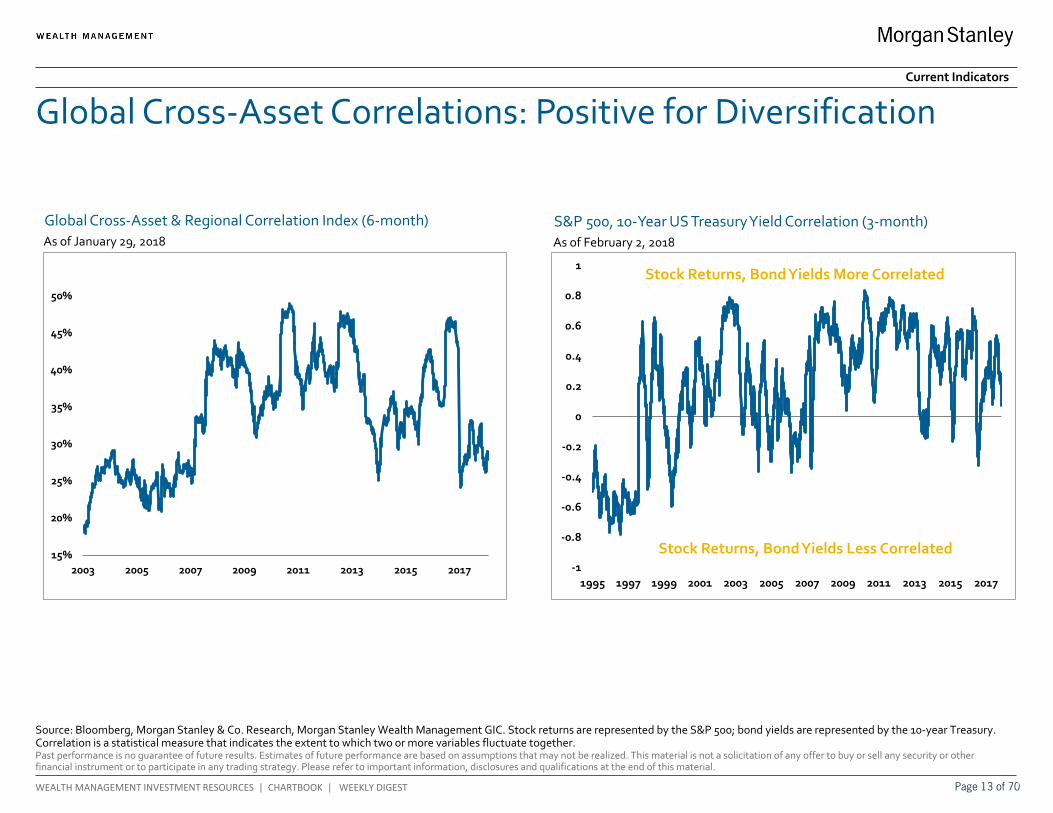
S&P 500, 10-Year US Treasury Yield Correlation (3-month)
Global Cross-Asset Correlations: Positive for Diversification
Source: Bloomberg, Morgan Stanley & Co. Research, Morgan Stanley Wealth Management GIC. Stock returns are represented by the S&P 500; bond yields are represented by the 10-year Treasury. Correlation is a statistical measure that indicates the extent to which two or more variables fluctuate together.
As of February 2, 2018
Current Indicators
Global Cross-Asset & Regional Correlation Index (6-month) As of January 29, 2018
Stock Returns, Bond Yields More Correlated
Stock Returns, Bond Yields Less Correlated
Page 13 of 70
Past performance is no guarantee of future results. Estimates of future performance are based on assumptions that may not be realized. This material is not a solicitation of any offer to buy or sell any security or other financial instrument or to participate in any trading strategy. Please refer to important information, disclosures and qualifications at the end of this material.
WEALTH MANAGEMENT INVESTMENT RESOURCES | CHARTBOOK | WEEKLY DIGEST
0.00
0.05
0.10
0.15
0.20
0.25
0.30
0.35
0.40
0.45
0.50
Pai
rwis
e Co
rrel
atio
n (T
raili
ng 3
M)
US EM Global Developed International
-50%
-40%
-30%
-20%
-10%
0%
10%
20%
30%
40%
50%
Jan '16 Apr '16 Jul '16 Oct '16 Jan '17 Apr '17 Jul '17 Oct '17 Jan '18S&P 500 MSCI ACWI 10-Year Treasury
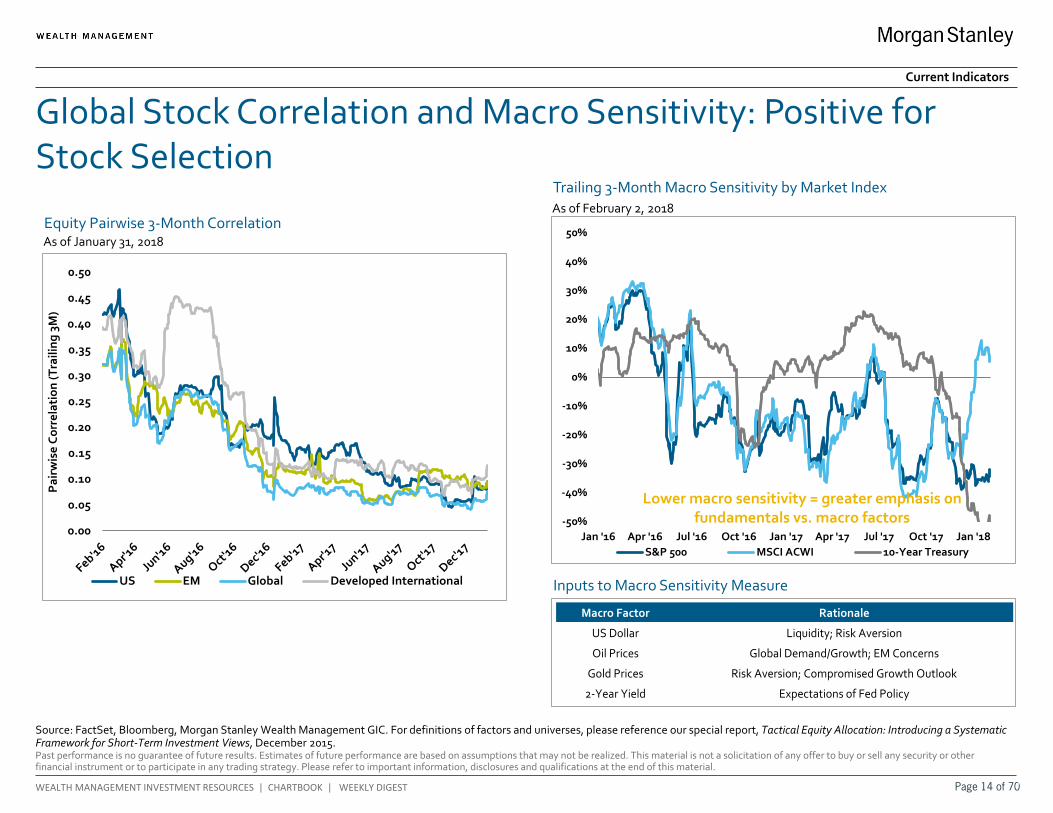
Equity Pairwise 3-Month Correlation
Global Stock Correlation and Macro Sensitivity: Positive for Stock Selection
Source: FactSet, Bloomberg, Morgan Stanley Wealth Management GIC. For definitions of factors and universes, please reference our special report, Tactical Equity Allocation: Introducing a Systematic Framework for Short-Term Investment Views, December 2015.
As of January 31, 2018
Trailing 3-Month Macro Sensitivity by Market Index As of February 2, 2018
Macro Factor Rationale
US Dollar Liquidity; Risk Aversion
Oil Prices Global Demand/Growth; EM Concerns
Gold Prices Risk Aversion; Compromised Growth Outlook
2-Year Yield Expectations of Fed Policy
Inputs to Macro Sensitivity Measure
Lower macro sensitivity = greater emphasis on fundamentals vs. macro factors
Current Indicators
Page 14 of 70
Past performance is no guarantee of future results. Estimates of future performance are based on assumptions that may not be realized. This material is not a solicitation of any offer to buy or sell any security or other financial instrument or to participate in any trading strategy. Please refer to important information, disclosures and qualifications at the end of this material.
WEALTH MANAGEMENT INVESTMENT RESOURCES | CHARTBOOK | WEEKLY DIGEST
-3
-2
-1
0
1
2
3
4
5
2007 2008 2009 2010 2011 2012 2013 2014 2015 2016 2017 2018Morgan Stanley Financial Conditions Index¹
QE1
QE1.5
QE2
Twist
LTRO
LTRO II
Draghi
QE3BOJQQE²
Fed Ends QE
BOJQQE+
ECBQE
China/OPEC FX Reserves Repatriated
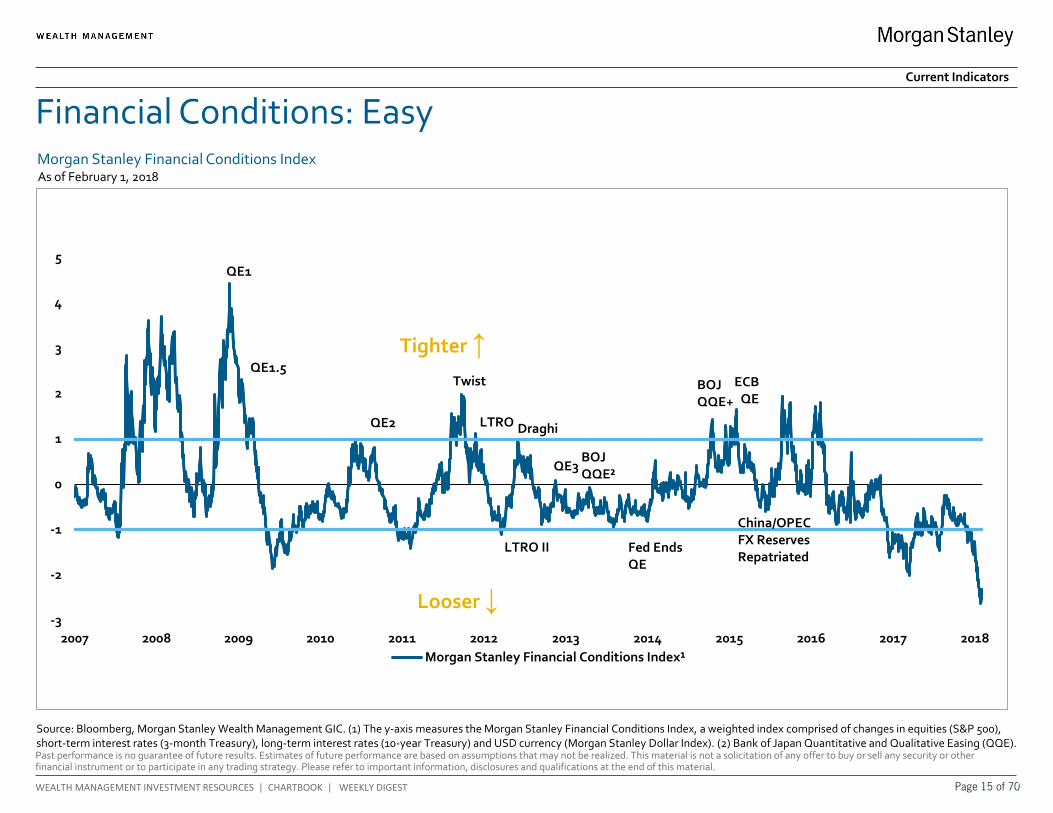
Morgan Stanley Financial Conditions Index
Source: Bloomberg, Morgan Stanley Wealth Management GIC. (1) The y-axis measures the Morgan Stanley Financial Conditions Index, a weighted index comprised of changes in equities (S&P 500), short-term interest rates (3-month Treasury), long-term interest rates (10-year Treasury) and USD currency (Morgan Stanley Dollar Index). (2) Bank of Japan Quantitative and Qualitative Easing (QQE).
Financial Conditions: Easy
Tighter ↑
Looser ↓
As of February 1, 2018
Current Indicators
Page 15 of 70

Past performance is no guarantee of future results. Estimates of future performance are based on assumptions that may not be realized. This material is not a solicitation of any offer to buy or sell any security or other financial instrument or to participate in any trading strategy. Please refer to important information, disclosures and qualifications at the end of this material.
WEALTH MANAGEMENT INVESTMENT RESOURCES | CHARTBOOK | WEEKLY DIGEST
-4
-3
-2
-1
0
1
2
3
4
2011 2012 2013 2014 2015 2016 2017
Morgan Stanley Standardized GRDI
Morgan Stanley Global Risk Demand Index
Global Risk Indicator: Sentiment Neutral
Source: Bloomberg, Morgan Stanley & Co. Research. (1) There is one composite market timing indicator (CMTI) and four components: the valuation, risk, fundamentals and capitulation indicators. They help decide the tactical outlook for equity markets for the next three-to-six months.
Morgan Stanley Europe Combined Market Timing Indicator1
Sell
Buy -1.5
-1.0
-0.5
0.0
0.5
1.0
2010 2011 2012 2013 2014 2015 2016 2017 2018
Combined Market Timing Indicator (CMTI)
Sell
Buy
As of January 31, 2018 As of January 18, 2018
Current Indicators
Page 16 of 70
Past performance is no guarantee of future results. Estimates of future performance are based on assumptions that may not be realized. This material is not a solicitation of any offer to buy or sell any security or other financial instrument or to participate in any trading strategy. Please refer to important information, disclosures and qualifications at the end of this material.
WEALTH MANAGEMENT INVESTMENT RESOURCES | CHARTBOOK | WEEKLY DIGEST
-2.5-2.0-1.5-1.0-0.50.00.51.01.52.02.5
2008 2009 2010 2011 2012 2013 2014 2015 2016 2017
-$80
-$60
-$40
-$20
$0
$20
$40
$60
$80
$100
Jan' 14 Jul' 14 Jan' 15 Jul' 15 Jan' 16 Jul' 16 Jan' 17 Jul' 17
US Bond Mutual Fund + ETF Net Flows (trailing 3M)
US Equity Mutual Fund + ETF Net Flows (trailing 3M)Bil. Crude Oil
Gold
Euro
Yen
Dollar
S&P 500
2 Yr Trsry
10 Yr Trsry
Legend
-14% 36%-61% -7%0.991
-29% 44%-51% 3%0.991
16% 30%-45% -2%0.991
-9% 87%-24% 37%0.991
-55% 69%-85% -17%0.991
40% 63%-75% -21%0.991
53% 78%3% 50%0.991
74% 74%2% 42%0.991
Min MaxCurrent Avg Since 2010
100%
47%
96%
31%
7%
92%
5%
32%
Percentile
35%
40%
45%
50%
55%
60%
65%
2002 2004 2006 2008 2010 2012 2014 2016EvercoreISI Hedge Fund Survey: Equities Net Exposure Average
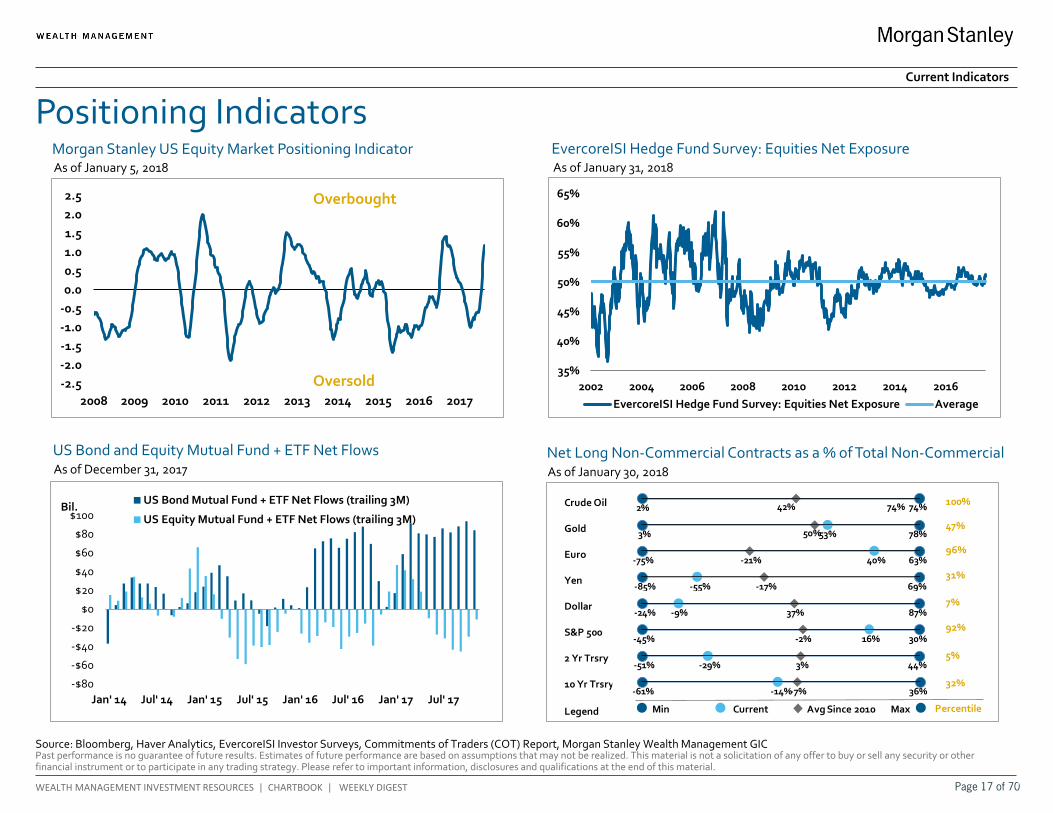
Positioning Indicators Current Indicators
Morgan Stanley US Equity Market Positioning Indicator
Source: Bloomberg, Haver Analytics, EvercoreISI Investor Surveys, Commitments of Traders (COT) Report, Morgan Stanley Wealth Management GIC
Net Long Non-Commercial Contracts as a % of Total Non-Commercial
EvercoreISI Hedge Fund Survey: Equities Net Exposure As of January 5, 2018 As of January 31, 2018
As of January 30, 2018
US Bond and Equity Mutual Fund + ETF Net Flows As of December 31, 2017
Overbought
Oversold
Page 17 of 70
Past performance is no guarantee of future results. Estimates of future performance are based on assumptions that may not be realized. This material is not a solicitation of any offer to buy or sell any security or other financial instrument or to participate in any trading strategy. Please refer to important information, disclosures and qualifications at the end of this material.
WEALTH MANAGEMENT INVESTMENT RESOURCES | CHARTBOOK | WEEKLY DIGEST
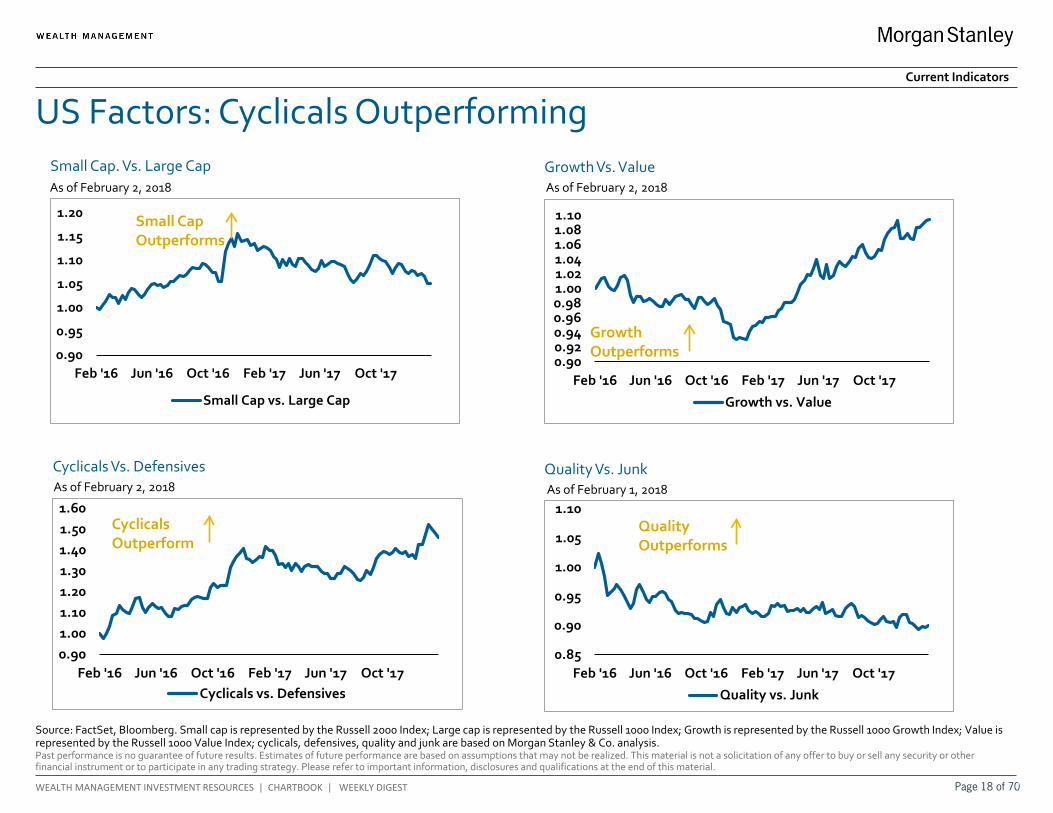
Small Cap. Vs. Large Cap
Growth Vs. Value
Cyclicals Vs. Defensives
US Factors: Cyclicals Outperforming
Quality Vs. Junk
Source: FactSet, Bloomberg. Small cap is represented by the Russell 2000 Index; Large cap is represented by the Russell 1000 Index; Growth is represented by the Russell 1000 Growth Index; Value is represented by the Russell 1000 Value Index; cyclicals, defensives, quality and junk are based on Morgan Stanley & Co. analysis.
0.90
0.95
1.00
1.05
1.10
1.15
1.20
Feb '16 Jun '16 Oct '16 Feb '17 Jun '17 Oct '17
Small Cap vs. Large Cap
0.900.920.940.960.981.001.021.041.061.081.10
Feb '16 Jun '16 Oct '16 Feb '17 Jun '17 Oct '17
Growth vs. Value
0.901.001.101.201.301.401.501.60
Feb '16 Jun '16 Oct '16 Feb '17 Jun '17 Oct '17Cyclicals vs. Defensives
0.85
0.90
0.95
1.00
1.05
1.10
Feb '16 Jun '16 Oct '16 Feb '17 Jun '17 Oct '17
Quality vs. Junk
Growth Outperforms
Small Cap Outperforms
Cyclicals Outperform
Quality Outperforms
As of February 2, 2018 As of February 2, 2018
As of February 2, 2018 As of February 1, 2018
Current Indicators
Page 18 of 70

Past performance is no guarantee of future results. Estimates of future performance are based on assumptions that may not be realized. This material is not a solicitation of any offer to buy or sell any security or other financial instrument or to participate in any trading strategy. Please refer to important information, disclosures and qualifications at the end of this material.
WEALTH MANAGEMENT INVESTMENT RESOURCES | CHARTBOOK | WEEKLY DIGEST
~70% ~10% ~20%
Asset Class Sector Subsector Total SignalFundamental Momentum
Valuation Technicals
Equities US Large-Cap Growth 6 Strong Weak Weak
Equities US Large-Cap Value 6 Neutral Weak Neutral
Equities US Mid-Cap Growth 8 Neutral Weak Neutral
Equities US Mid-Cap Value 7 Neutral Weak Neutral
Equities US Small-Cap Growth 8 Neutral Weak Neutral
Equities US Small-Cap Value 9 Neutral Neutral Weak
Equities International Ex-US 9 Strong Neutral Neutral
Equities International Europe 9 Strong Weak Neutral
Equities International Japan 7 Neutral Weak Neutral
Equities Emerging Markets 8 Neutral Weak Strong
Fixed-Income US Core Treasuries 1 Weak Weak Weak
Fixed-Income US Core Credit 2 Weak Strong Weak
Fixed-Income US Core MBS 1 Weak Strong Weak
Fixed-Income Other International 1 Weak Strong Weak
Fixed-Income Other Emerging Markets 1 Weak Neutral Weak
Fixed-Income Other High-Yield 8 Neutral Weak Weak
Fixed-Income Other TIPS 4 Weak Strong Weak
Alternatives Real Assets Commodities 9 Neutral Weak Neutral
Alternatives Real Assets MLPs 9 Strong Weak Weak
Alternatives Real Assets REITs 5 Strong Weak Weak
Currencies EUR/USD 8 Neutral Weak Strong
Currencies USD/JPY 8 Strong Strong Weak
Weighting
Dynamic Allocation Framework Signals
Source: Bloomberg, FactSet, Morgan Stanley Wealth Management GIC. Note: A total signal of 10 represents the highest score and a total signal of 1 represents the lowest score. For more details on the Dynamic Allocation Framework, please see US Equity Factor Dynamic Allocation Factsheet dated October 2017.
Current Indicators
Asset Class and Sector Factor Scores Based on Fundamentals, Valuation and Technicals Data as of February 3, 2018
Page 19 of 70
Past performance is no guarantee of future results. Estimates of future performance are based on assumptions that may not be realized. This material is not a solicitation of any offer to buy or sell any security or other financial instrument or to participate in any trading strategy. Please refer to important information, disclosures and qualifications at the end of this material.
WEALTH MANAGEMENT INVESTMENT RESOURCES | CHARTBOOK | WEEKLY DIGEST
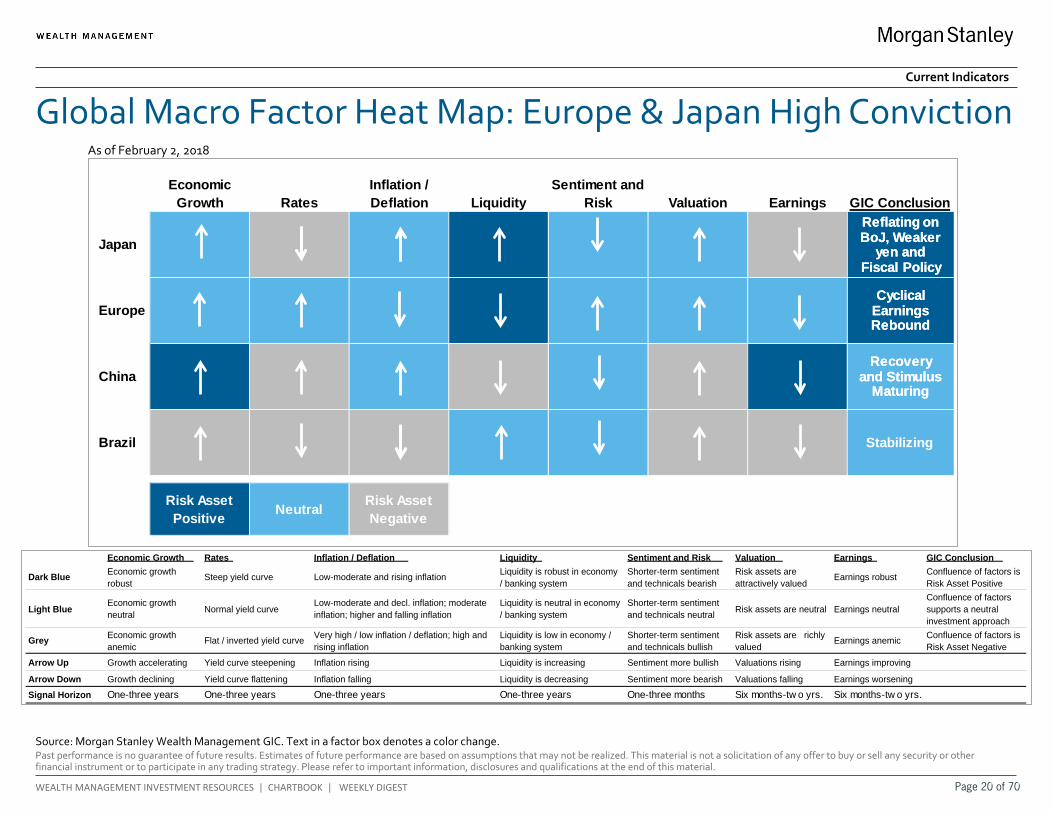
Economic Growth Rates
Inflation / Deflation Liquidity
Sentiment and Risk Valuation Earnings GIC Conclusion
Japan 0 -1 0 1 0 0 -1 1
Europe 0 0 0 1 0 0 0 1
China 1 -1 0 -1 0 -1 1 0
Brazil -1 -1 -1 0 0 -1 -1 0
Risk Asset Positive Neutral Risk Asset
Negative
Reflating on BoJ, Weaker
yen andFiscal Policy
Cyclical Earnings Rebound
Recovery and Stimulus
Maturing
Stabilizing
Reflating on BoJ, Weaker
yen andFiscal Policy
Cyclical Earnings Rebound
Recovery and Stimulus
Maturing
Stabilizing
Global Macro Factor Heat Map: Europe & Japan High Conviction As of February 2, 2018
Economic Growth Rates Inflation / Deflation Liquidity Sentiment and Risk Valuation Earnings GIC Conclusion
Dark Blue Economic growth robust
Steep yield curve Low-moderate and rising inflation Liquidity is robust in economy / banking system
Shorter-term sentiment and technicals bearish
Risk assets are attractively valued
Earnings robust Confluence of factors is Risk Asset Positive
Light Blue Economic growth neutral Normal yield curve
Low-moderate and decl. inflation; moderate inflation; higher and falling inflation
Liquidity is neutral in economy / banking system
Shorter-term sentiment and technicals neutral Risk assets are neutral Earnings neutral
Confluence of factors supports a neutral investment approach
Grey Economic growth anemic
Flat / inverted yield curve Very high / low inflation / deflation; high and rising inflation
Liquidity is low in economy / banking system
Shorter-term sentiment and technicals bullish
Risk assets are richly valued
Earnings anemic Confluence of factors is Risk Asset Negative
Arrow Up Growth accelerating Yield curve steepening Inflation rising Liquidity is increasing Sentiment more bullish Valuations rising Earnings improving
Arrow Down Growth declining Yield curve flattening Inflation falling Liquidity is decreasing Sentiment more bearish Valuations falling Earnings worseningSignal Horizon One-three years One-three years One-three years One-three years One-three months Six months-tw o yrs. Six months-tw o yrs.
Source: Morgan Stanley Wealth Management GIC. Text in a factor box denotes a color change.
Current Indicators
Page 20 of 70
Past performance is no guarantee of future results. Estimates of future performance are based on assumptions that may not be realized. This material is not a solicitation of any offer to buy or sell any security or other financial instrument or to participate in any trading strategy. Please refer to important information, disclosures and qualifications at the end of this material.
WEALTH MANAGEMENT INVESTMENT RESOURCES | CHARTBOOK | WEEKLY DIGEST
GIC Recommendations As of January 10, 2018
Source: Morgan Stanley Wealth Management GIC
Current Advice
• The global economic recovery began almost 2 years ago. The synchronous nature of the recovery is the broadest since the initial recovery in 2009 from the Great Recession, but the rate of change is close to peaking. We are also witnessing the strongest revenue and earnings growth in 5 years led by rising incremental margins—i.e., very high quality.
• We continue to recommend equities over fixed income given our constructive view on global economic and earnings growth, supportive financial conditions, the potential for global fiscal stimulus and cheap relative valuations.
• Individual and institutional investor sentiment and positioning for US equities is getting much more optimistic and full. We may have even entered the Euphoria stage we expected—the more speculative and lower-quality part of the rally.
• We prefer a barbell of positioning within equity portfolios—consider deep cyclical stocks, Financials and reasonably priced growth stocks. We expect high valuation and ultra-defensive/low-volatility strategies to underperform as global growth and pro-cyclical company earnings surprise to the upside. We favor dividend growth over dividend yield.
• We think Japan still offers an attractive opportunity for both stock picking and beta plays levered to global recovery. We forecast a strengthening/flat yen and therefore removed our currency hedges for Japanese equity positions.
• Many of the structural imbalances in emerging markets (EM) have improved. Concerns about EM from anti-trade “rhetoric” were overblown. Europe is tied to EM via its exports and banking system and has strong long-term valuation support as fears of political uncertainty and banking stress peaked last year. Organic earnings growth in Europe should outpace the US over the next several years. We do not recommend hedging currency risk for European equity investments.
• Within fixed income, we recommend US-only positioning with no exposure to high yield and some TIPS as inflation expectations recover further with a stable/weaker dollar, rising oil prices and tighter labor. We remain underweight longer maturities and other interest rate-sensitive assets like REITs where there are also some signs of credit risk.
• We believe oil prices could surprise on the upside this year. We maintain exposure via energy stocks and MLPs.
• Interest rates are likely to rise as inflation and growth expectations rise, but then fall again in the second half leaving high-quality fixed income investments with low, but positive returns for 2018. There may be a better time to add to duration later in the first half of 2018, in our view.
Page 21 of 70

Past performance is no guarantee of future results. Estimates of future performance are based on assumptions that may not be realized. This material is not a solicitation of any offer to buy or sell any security or other financial instrument or to participate in any trading strategy. Please refer to important information, disclosures and qualifications at the end of this material.
WEALTH MANAGEMENT INVESTMENT RESOURCES | CHARTBOOK | WEEKLY DIGEST
Asset Class Strategic Weight Tactical Weight Difference Benchmark Weight
Ultra Short Term F.I. 4% 4% 0% 5%
Equities 48% 58% 10% 50%US Equities 20% 26% 6%
US Large-Cap Growth 6% 9% 3%US Large-Cap Value 6% 9% 3%US Mid-Cap Growth 2% 2% 0%US Mid-Cap Value 2% 2% 0%US Small-Cap Growth 2% 2% 0%US Small-Cap Value 2% 2% 0%
International Equities 22% 25% 3%European Equities 15% 17% 2%Japan Equities 6% 8% 2%Asia Pacific ex Japan Equities 1% 0% -1%
Emerging & Frontier Markets Equities 6% 7% 1%
Fixed Income 31% 23% -8% 45%Short-Term Fixed Income 10% 12% 2%US Fixed Income Taxable 15% 9% -6%International Fixed Income 1% 0% -1%Inflation-Protection Securities 0% 2% 2%High Yield Fixed Income 4% 0% -4%Emerging Markets Fixed Income 1% 0% -1%
Alternatives 17% 15% -2% 0%Real Assets 8% 7% -1%
REITs 3% 0% -3%Commodities 0% 0% 0%Master Limited Partnerships 5% 7% 2%
Absolute Return Assets 4% 4% 0%Equity Hedge Assets 5% 4% -1%Equity Return Assets 0% 0% 0%
GIC Balanced Growth (Model 3) Current Allocations
Source: Morgan Stanley Wealth Management GIC. Note: Model 3 Benchmark is represented by 50% MSCI ACWI, 45% Bloomberg Barclays US Aggregate Bond Index, and 5% Citi 3-Month T-Bill Index.
Current Advice
As of January 31, 2018
Page 22 of 70

Past performance is no guarantee of future results. Estimates of future performance are based on assumptions that may not be realized. This material is not a solicitation of any offer to buy or sell any security or other financial instrument or to participate in any trading strategy. Please refer to important information, disclosures and qualifications at the end of this material.
WEALTH MANAGEMENT INVESTMENT RESOURCES | CHARTBOOK | WEEKLY DIGEST
++ + 0 + ++ Themes ++ + 0 + ++ Themes ++ + 0 + ++ Themes
US Global Japan and Europe Rates Credit Bank loans, preferredsLow Inflation
Protection
High Inflation
ProtectionMLPs, TIPs
Value Growth Financials, Energy, TechShort
DurationLong
DurationLadder 3 months to 3
yearsLow
VolatilityHigh
VolatilityGlobal macro, managed
futures
Small Large Neutral on Cap TaxableNon-
TaxableGeneral obligations
Low Leverage/
Alpha
High Leverage/
AlphaEquity L/S, event driven
Quality Junk IG HYRemoved High Yield
Exposure
Defensives Cyclicals Industrials, Energy US Int'l Non-sovereign
Active PassiveActive management outlook continue to
improveDeveloped
Emerging Markets
Hedged UnhedgedUnhedged in both Europe
and Japan
AlternativesEquities Fixed Income
Summary of Tactical Portfolio Construction Advice
Source: Morgan Stanley Wealth Management GIC. Note: ++ is most attractive, + is moderately attractive, 0 is neutral, - is moderately unattractive, -- is most unattractive.
Current Advice
-- - 0 + ++ Themes
Private EquitySmall and middle market buyout,
secondaries, co-investments, VC/growth equity
Private CreditDirect lending (senior secured),
structured credit, distressed
Private Real EstateSecondaries, core, demographic
trends, non-major markets
Private Alternatives
Cash Equities Fixed Income Alternatives
Underweight Overweight Underweight Equalweight
Asset Allocation
As of January 31, 2018
Page 23 of 70

Past performance is no guarantee of future results. Estimates of future performance are based on assumptions that may not be realized. This material is not a solicitation of any offer to buy or sell any security or other financial instrument or to participate in any trading strategy. Please refer to important information, disclosures and qualifications at the end of this material.
WEALTH MANAGEMENT INVESTMENT RESOURCES | CHARTBOOK | WEEKLY DIGEST
Our US Active/Passive Model
Source: Morningstar, FactSet, Bloomberg, Morgan Stanley Wealth Management GIC. Signal trend is based on the trailing 3 months. Trending up = more active, tending down = more passive.
Current Advice
Factor Model Weights for Select Styles and Current Signals As of February 2, 2018
Active vs. Passive Tactical & Strategic Allocations As of December 31, 2017
Active (%) Passive (%) Active (%) Passive (%)
Large Core45% 55% 45% 55%
Large Growth45% 55% 45% 55%
Large Value75% 25% 45% 55%
Mid Core85% 15% 55% 45%
Mid Growth85% 15% 55% 45%
Mid Value85% 15% 55% 45%
Small Core40% 60% 70% 30%
Small Growth70% 30% 70% 30%
Small Value40% 60% 70% 30%
Tactical (1 Year Horizon) Strategic (7 Year Horizon)Factors
Large Core
Mid Core
Small Core
Current SignalLast 6M Signal Trend
Last 12M Signal Trend
Value Dispersion 20% 25% 15% Moderate Active Active Active
S&P Macro Sensitivity Trend 14% 22% 12% Strong Active Active Active
Trailing Return Breadth 11% 6% 9% Strong Active Active Active
Trailing Global vs. US Return 11% 4% 12% Moderate Passive Passive Passive
Return Correlation 7% 13% 19% Moderate Active Passive Passive
Return Correlation Trend 16% 8% 8% Strong Passive Passive Passive
Yield Slope 2% 11% 3% Moderate Passive Active Passive
Yield Slope Trend 8% 3% 1% Moderate Active Active Active
Modeled Return Breadth 7% 6% 11% Strong Passive Passive Passive
Earnings Estimate Dispersion 5% 2% 10% Moderate Active Neutral Neutral
Page 24 of 70

Past performance is no guarantee of future results. Estimates of future performance are based on assumptions that may not be realized. This material is not a solicitation of any offer to buy or sell any security or other financial instrument or to participate in any trading strategy. Please refer to important information, disclosures and qualifications at the end of this material.
WEALTH MANAGEMENT INVESTMENT RESOURCES | CHARTBOOK | WEEKLY DIGEST
-$25
-$20
-$15
-$10
-$5
$0
$5
$10
$15
$0
$10
$20
$30
$40
$50
$60
Jan '16 May '16 Sep '16 Jan '17 May '17 Sep '17
Par
Val
ue (B
illio
ns)
Par
Val
ue (B
illio
ns)
2000-2016 Average Supply (left axis)Actual and Forecasted Redemptions (left axis)Net Supply Proxy (right axis)
US Municipal Market
Source: Thomson Reuters Municipal Market Data (MMD), Interactive Data, Morgan Stanley Wealth Management GIC
Municipal Bond Market Supply and Redemptions
10-Year Relative Value Ratio (Municipal Yield/Treasury Yield)
75%
80%
85%
90%
95%
100%
105%
110%
115%
120%
125%
130%
2010 2011 2012 2013 2014 2015 2016 2017 2018
% O
f Cor
resp
ondi
ng U
STs
10-Year RatioLong-Term Average (1990)Average Post JOBS Act (Sep 2011)
86%
As of December 2017 As of February 2, 2018
Munis Cheaper Relative to Treasuries
Munis Richer
Current Advice
Consistent with the dynamics discussed in our last review, municipals continued to underperform UST weakness this week (bear flattening during earlier trading sessions). Healthy bid lists and this week’s considerable decline in fund inflows, elicited by the household sector’s delayed response to rates, are harbingers for continued underperformance moving forward. Additionally, rich relative-value ratios suggest that tax-exempts hold a paltry buffer against future weakness. Consequently, municipals should follow any negative UST price trajectory downward (as has already occurred). Our objectives stand at: (1) exercise caution in the current period of low ratio / interest-rate weakness; (2) cautiously consider entry points once present UST weakness fully stabilizes/sustainably rallies; and (3) favor high-quality securities with short/low-to-neutral duration due to tight spreads and the flatter curve (6-12 year finals), but keep some dry powder as catalysts for further rate weakness remain.
Page 25 of 70

Past performance is no guarantee of future results. Estimates of future performance are based on assumptions that may not be realized. This material is not a solicitation of any offer to buy or sell any security or other financial instrument or to participate in any trading strategy. Please refer to important information, disclosures and qualifications at the end of this material.
WEALTH MANAGEMENT INVESTMENT RESOURCES | CHARTBOOK | WEEKLY DIGEST
Duration Yield Breakeven
Ratio Duration Yield
Breakeven Ratio
2YR Treasury 1.95 1.88 0.96 1.96 2.14 1.095YR Treasury 4.69 2.21 0.47 4.73 2.59 0.5510YR Treasury 8.73 2.41 0.28 8.75 2.84 0.3230YR Treasury 19.99 2.74 0.14 20.02 3.09 0.15Barclays Aggregate 5.98 2.71 0.45 6.17 3.06 0.50Investment Grade Corporate 7.58 3.25 0.43 7.51 3.54 0.47
AA Corporate 6.43 2.71 0.42 6.33 3.03 0.48A Corporate 7.61 3.03 0.40 7.55 3.36 0.45BBB Corporate 7.60 3.54 0.47 7.55 3.80 0.50
High Yield Corporate 3.86 5.72 1.48 4.03 5.92 1.47BB Corporate 4.39 4.37 1.00 4.58 4.61 1.01B Corporate 3.55 5.70 1.61 3.72 5.86 1.58CCC Corporate 3.17 8.45 2.67 3.31 8.52 2.57
Fixed-Rate Preferreds 3.87 1.85 0.48 5.15 3.14 0.61Leveraged Loan1 0.50 5.11 10.22 0.50 5.11 10.22
BB Loan 0.50 4.15 8.30 0.50 4.15 8.30B Loan 0.50 5.37 10.74 0.50 5.37 10.74
MBS 4.43 2.91 0.66 5.27 3.31 0.63CMBS 5.47 3.19 0.58 5.43 3.50 0.64
Asset Class Dec 29, 2017 Feb 2, 2018
US Fixed Income Positioning: Trim Low-Quality Allocations
Source: Morgan Stanley Wealth Management Fixed Income Strategy, Bloomberg Barclays indices, Bloomberg, S&P/LSTA, Morgan Stanley & Co. Research and Bank of America Merrill Lynch Fixed Rate Preferred Index. (1) Latest leveraged loan data is as of 7/31/2017. High yield is represented by the Bloomberg Barclays US High Yield Index, Investment grade, MBS and CMBS are represented by the Investment grade, MBS and CMBS portions of the Bloomberg Barclays Aggregate; fixed rate preferreds represented by the BofA Merrill Lynch Fixed Rate Preferred Securities Index. The BofA Merrill Lynch Fixed Rate Preferred Securities Index is used with permission from BofA Merrill Lynch. BOFA MERRILL LYNCH IS LICENSING THE BOFA MERRILL LYNCH INDICES “AS IS,” MAKES NO WARRANTIES REGARDING SAME, DOES NOT GUARANTEE THE SUITABILITY, QUALITY, ACCURACY, TIMELINESS AND/OR COMPLETENESS OF THE BOFA MERRILL LYNCH INDICES OR ANY DATA INCLUDED IN, RELATED TO, OR DERIVED THEREFROM, ASSUMES NO LIABILITY IN CONNECTION WITH THEIR USE, AND DOES NOT SPONSOR, ENDORSE OR RECOMMEND MORGAN STANLEY SMITH BARNEY LLC, OR ANY OF ITS PRODUCTS OR SERVICES.
Current Advice
US Breakeven Ratios
From a breakeven perspective, lower-quality fixed income sectors, like triple-C corporate credits and leveraged loans, have become significantly less attractive over the last year
As of February 2, 2018
Page 26 of 70
Past performance is no guarantee of future results. Estimates of future performance are based on assumptions that may not be realized. This material is not a solicitation of any offer to buy or sell any security or other financial instrument or to participate in any trading strategy. Please refer to important information, disclosures and qualifications at the end of this material.
WEALTH MANAGEMENT INVESTMENT RESOURCES | CHARTBOOK | WEEKLY DIGEST
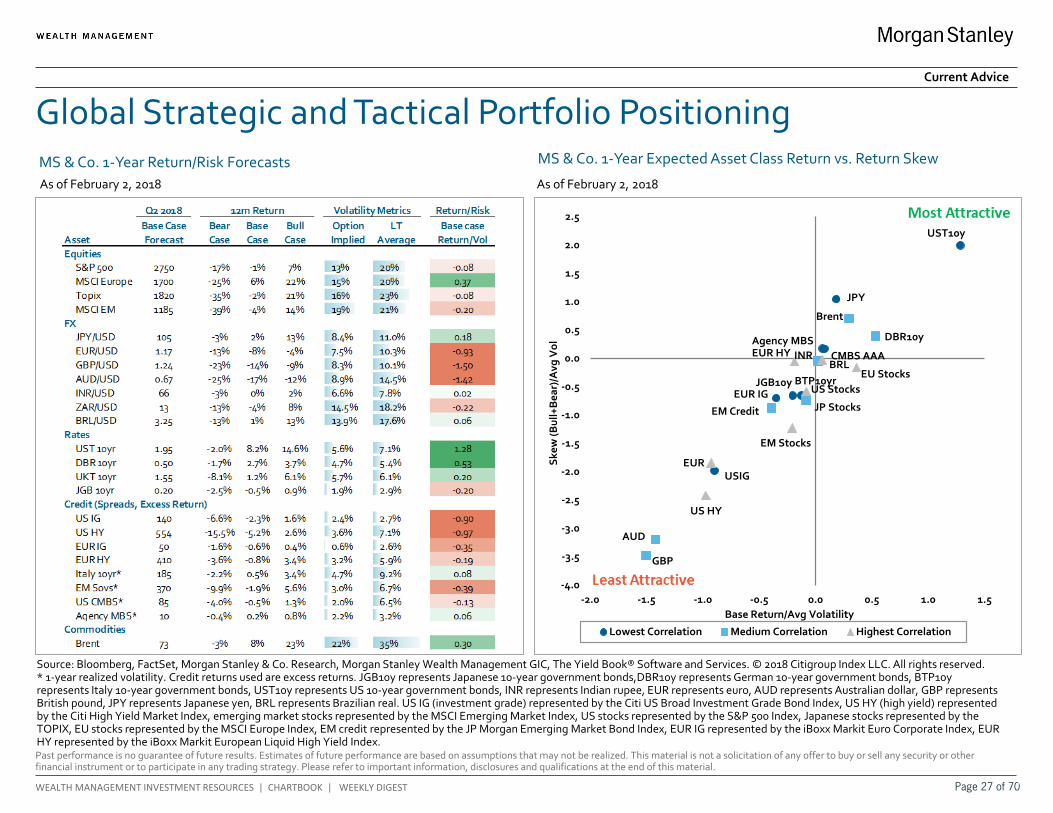
Global Strategic and Tactical Portfolio Positioning MS & Co. 1-Year Expected Asset Class Return vs. Return Skew
Source: Bloomberg, FactSet, Morgan Stanley & Co. Research, Morgan Stanley Wealth Management GIC, The Yield Book® Software and Services. © 2018 Citigroup Index LLC. All rights reserved. * 1-year realized volatility. Credit returns used are excess returns. JGB10y represents Japanese 10-year government bonds,DBR10y represents German 10-year government bonds, BTP10y represents Italy 10-year government bonds, UST10y represents US 10-year government bonds, INR represents Indian rupee, EUR represents euro, AUD represents Australian dollar, GBP represents British pound, JPY represents Japanese yen, BRL represents Brazilian real. US IG (investment grade) represented by the Citi US Broad Investment Grade Bond Index, US HY (high yield) represented by the Citi High Yield Market Index, emerging market stocks represented by the MSCI Emerging Market Index, US stocks represented by the S&P 500 Index, Japanese stocks represented by the TOPIX, EU stocks represented by the MSCI Europe Index, EM credit represented by the JP Morgan Emerging Market Bond Index, EUR IG represented by the iBoxx Markit Euro Corporate Index, EUR HY represented by the iBoxx Markit European Liquid High Yield Index.
Current Advice
MS & Co. 1-Year Return/Risk Forecasts As of February 2, 2018
UST10y
JPY
Agency MBS DBR10y
USIG
CMBS AAA
AUD
US StocksJGB10y
EUR
Brent
EUR IG
EM Credit
BTP10yrBRL
JP Stocks
GBP
EU Stocks
EM Stocks
INREUR HY
US HY
-4.0
-3.5
-3.0
-2.5
-2.0
-1.5
-1.0
-0.5
0.0
0.5
1.0
1.5
2.0
2.5
-2.0 -1.5 -1.0 -0.5 0.0 0.5 1.0 1.5
Skew
(Bul
l+B
ear)
/Avg
Vol
Base Return/Avg Volatility
Lowest Correlation Medium Correlation Highest Correlation
As of February 2, 2018
Page 27 of 70

Past performance is no guarantee of future results. Estimates of future performance are based on assumptions that may not be realized. This material is not a solicitation of any offer to buy or sell any security or other financial instrument or to participate in any trading strategy. Please refer to important information, disclosures and qualifications at the end of this material.
WEALTH MANAGEMENT INVESTMENT RESOURCES | CHARTBOOK | WEEKLY DIGEST
Source: FactSet, Morgan Stanley Wealth Management GIC. Other Developed Markets includes Canada, Australia, New Zealand, Hong Kong, and Singapore. Other Emerging Markets includes all MSCI Emerging Market countries except China and India. Developed Europe includes all MSCI Europe countries. Frontier Markets includes all MSCI Frontier Emerging Market countries. JPN represents Japan, GBR represents United Kingdom, USA represents United States, CNH (A) represents China A-Shares, CNH (H) represents China H-Shares, IND represents India. Information ratio is a ratio of portfolio returns above the returns of a benchmark (usually an index) to the volatility of those returns. For definitions of factors and universes, please reference our special report, Tactical Equity Allocation: Introducing a Systematic Framework for Short-Term Investment Views, dated December 2015. Note: ++ is most attractive, + is moderately attractive, 0 is neutral, - is moderately unattractive, -- is most unattractive.
Global Region/Sector Preferences
Global Top 10 Regions/Sectors Global Bottom 10 Regions/Sectors
USA Industrials Dev EUR Staples
GBR Discretionary IND Financials
USA Staples CNH (A) Healthcare
USA Discretionary Dev EUR REITs
JPN Discretionary Other Dev Mkt Util ities
Other Dev Mkt Discretionary IND Materials
Dev EUR Telecom CNH (A) Industrials
USA Tech CNH (A) Materials
USA Financials Dev EUR Tech
Other EM Energy CNH (A) Tech
GIC Tactical Equity Region/Sector Allocation Model Current Advice
Company Size & Style Tilt Preference by Region As of February 3, 2018
As of February 3, 2018
Small -- - 0 + ++ Large Growth -- - 0 + ++ Value
StyleMarket Cap
Emerging Markets
Reg
iona
l Pre
fere
nces
Other DM
Europe
United Kingdom
United States
Japan
As of February 3, 2018 Regional Factor Attractiveness Over NTM Relative to Global Equities
-- - 0 + ++Least Attractive Most Attractive
United States
Japan Europe UKOther
DMChina-A China-H India
Other EM
Deep Value - + 0 + + - ++ -- +
Near-Term Value - 0 + + + -- ++ -- +
Momentum + + - - - - ++ 0 +
Earnings Revisions ++ ++ - - 0 0 + -- -
Profitability + ++ 0 - - 0 -- + +
Earnings Quality ++ - - + + -- 0 - -
Total Yield + 0 + + + -- + -- 0
Capital Use + ++ 0 - 0 -- - -- 0
Total Score + + - 0 0 - ++ -- 0
NTM Forecasted IR 0.23 0.17 -0.05 0.10 0.08 -0.10 0.15 -0.22 0.05
Page 28 of 70
Past performance is no guarantee of future results. Estimates of future performance are based on assumptions that may not be realized. This material is not a solicitation of any offer to buy or sell any security or other financial instrument or to participate in any trading strategy. Please refer to important information, disclosures and qualifications at the end of this material.
WEALTH MANAGEMENT INVESTMENT RESOURCES | CHARTBOOK | WEEKLY DIGEST
US
JapanTaiwan
Australia
China H
Russia
United Kingdom
Norway South Korea
Italy
Hong KongSingapore
Canada Spain DenmarkBrazil Saudi ArabiaThailand
France South Africa
Ireland
Germany
Netherlands
Sweden
MexicoIndonesia
China ASwitzerland
India
Malaysia
-4%
-3%
-2%
-1%
0%
1%
2%
3%
4%
5% 10% 15% 20% 25% 30% 35%
Fore
cast
ed R
etur
n
Forecasted Volatility
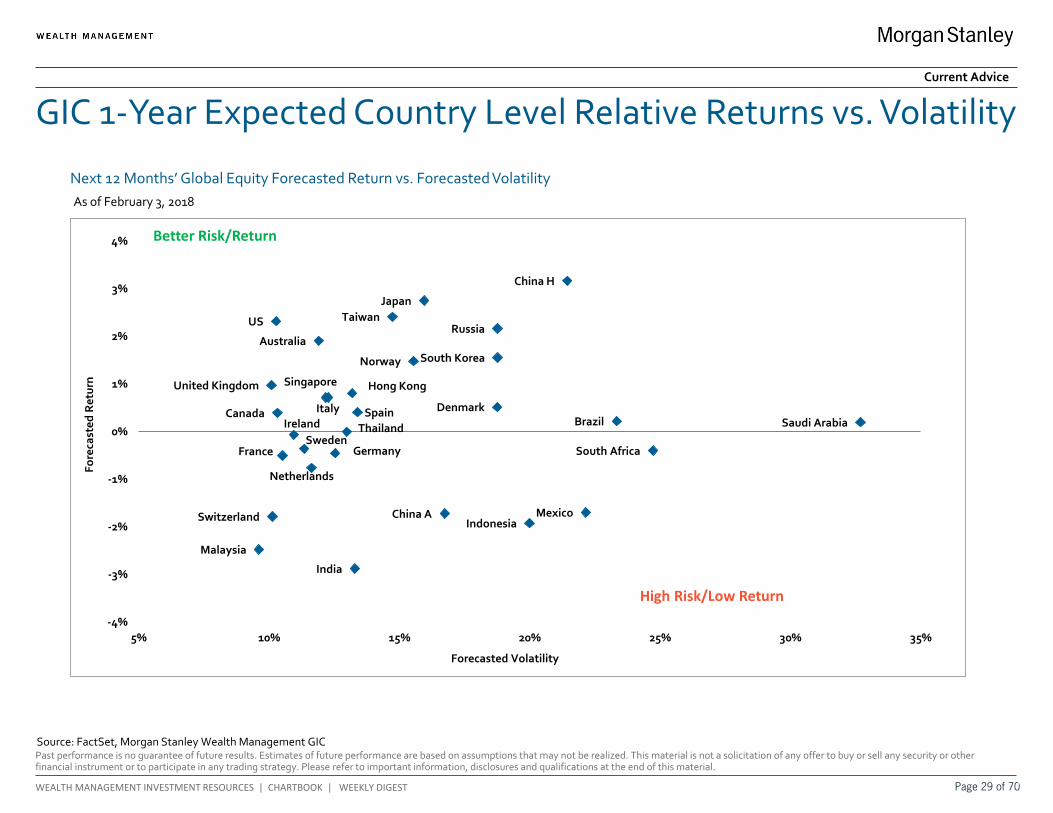
GIC 1-Year Expected Country Level Relative Returns vs. Volatility
Source: FactSet, Morgan Stanley Wealth Management GIC
Next 12 Months’ Global Equity Forecasted Return vs. Forecasted Volatility
Current Advice
Better Risk/Return
High Risk/Low Return
As of February 3, 2018
Page 29 of 70
Past performance is no guarantee of future results. Estimates of future performance are based on assumptions that may not be realized. This material is not a solicitation of any offer to buy or sell any security or other financial instrument or to participate in any trading strategy. Please refer to important information, disclosures and qualifications at the end of this material.
WEALTH MANAGEMENT INVESTMENT RESOURCES | CHARTBOOK | WEEKLY DIGEST
00.10.20.30.40.50.60.70.80.91
60
70
80
90
100
110
120
130
1999
2001
2003
2005
2007
2009
2011
2013
2015
2017
USD Likely to StrengthenDXY Index
Dollar Appreciates
Historical Signals of the Dollar Strength Indicator
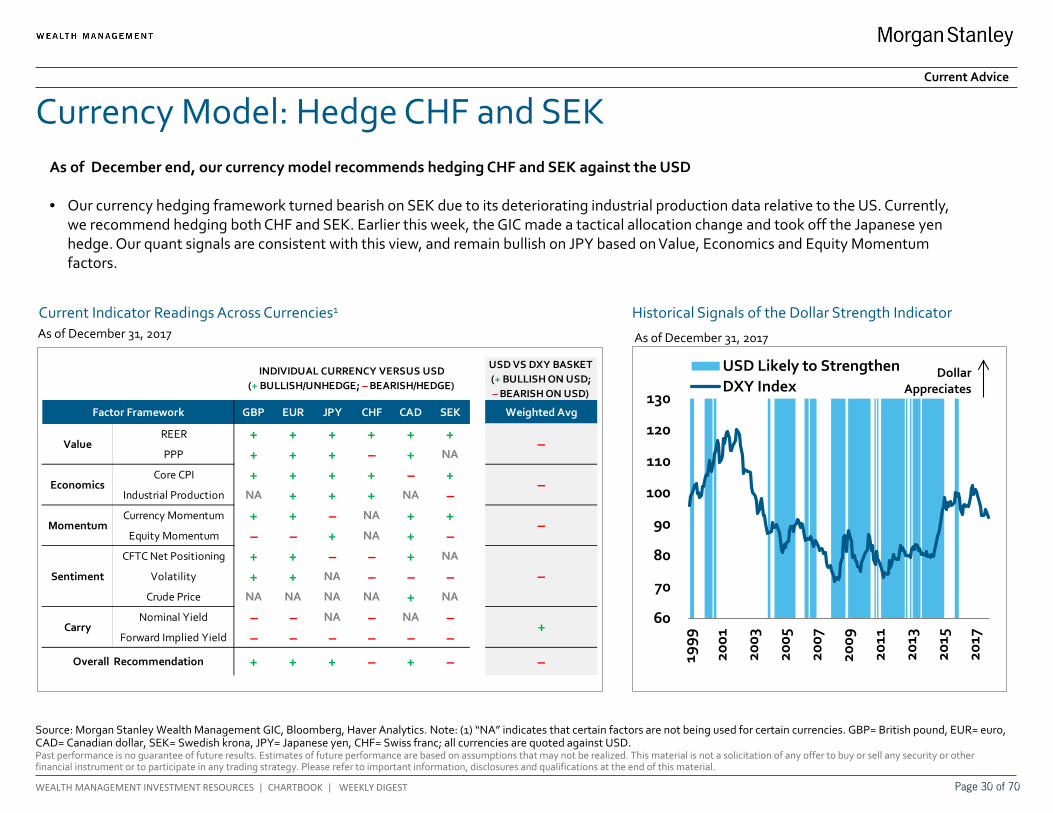
Currency Model: Hedge CHF and SEK
Source: Morgan Stanley Wealth Management GIC, Bloomberg, Haver Analytics. Note: (1) “NA” indicates that certain factors are not being used for certain currencies. GBP= British pound, EUR= euro, CAD= Canadian dollar, SEK= Swedish krona, JPY= Japanese yen, CHF= Swiss franc; all currencies are quoted against USD.
As of December 31, 2017
Current Advice
Current Indicator Readings Across Currencies1
As of December 31, 2017
USD VS DXY BASKET (+ BULLISH ON USD; – BEARISH ON USD)
GBP EUR JPY CHF CAD SEK Weighted Avg
REER + + + + + +PPP + + + – + NA
Core CPI + + + + – +Industrial Production NA + + + NA –Currency Momentum + + – NA + +
Equity Momentum – – + NA + –CFTC Net Positioning + + – – + NA
Volatility + + NA – – –Crude Price NA NA NA NA + NA
Nominal Yield – – NA – NA –Forward Implied Yield – – – – – –
+ + + – + – –
Carry
Factor Framework
Value
Economics
–
–
–
+
–
Momentum
Sentiment
INDIVIDUAL CURRENCY VERSUS USD (+ BULLISH/UNHEDGE; – BEARISH/HEDGE)
Overall Recommendation
As of December end, our currency model recommends hedging CHF and SEK against the USD • Our currency hedging framework turned bearish on SEK due to its deteriorating industrial production data relative to the US. Currently,
we recommend hedging both CHF and SEK. Earlier this week, the GIC made a tactical allocation change and took off the Japanese yen hedge. Our quant signals are consistent with this view, and remain bullish on JPY based on Value, Economics and Equity Momentum factors.
Page 30 of 70
Past performance is no guarantee of future results. Estimates of future performance are based on assumptions that may not be realized. This material is not a solicitation of any offer to buy or sell any security or other financial instrument or to participate in any trading strategy. Please refer to important information, disclosures and qualifications at the end of this material.
WEALTH MANAGEMENT INVESTMENT RESOURCES | CHARTBOOK | WEEKLY DIGEST
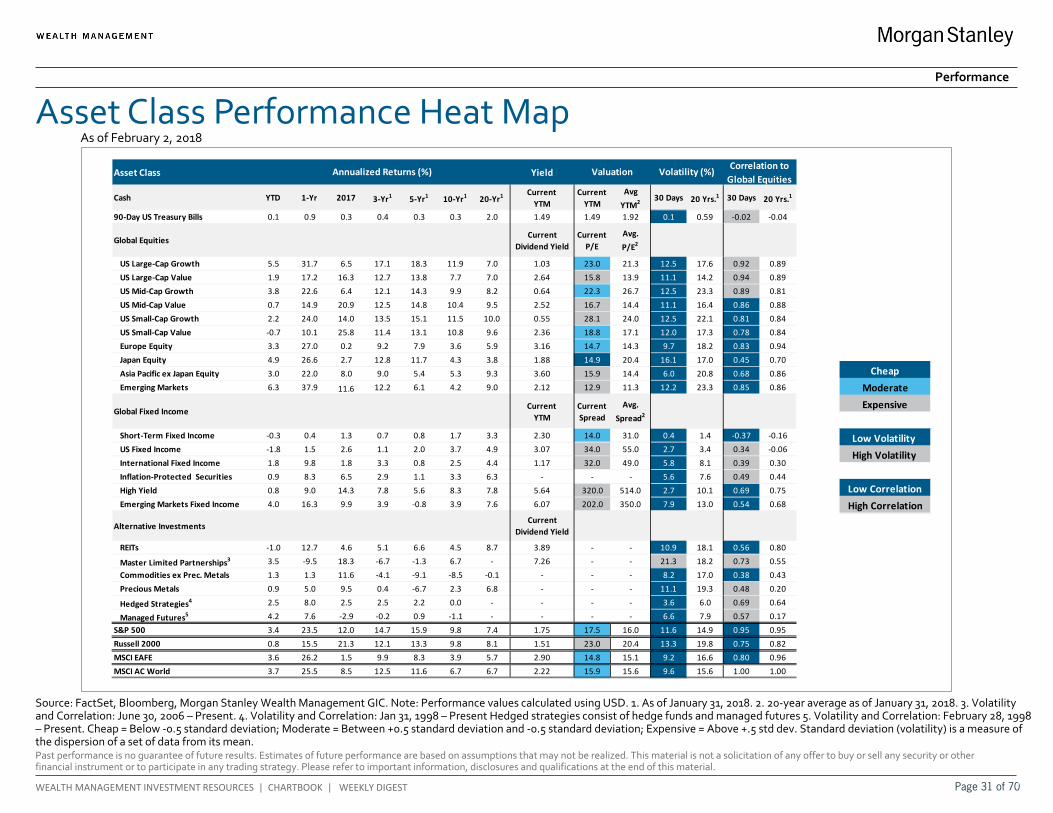
Asset Class Performance Heat Map
Source: FactSet, Bloomberg, Morgan Stanley Wealth Management GIC. Note: Performance values calculated using USD. 1. As of January 31, 2018. 2. 20-year average as of January 31, 2018. 3. Volatility and Correlation: June 30, 2006 – Present. 4. Volatility and Correlation: Jan 31, 1998 – Present Hedged strategies consist of hedge funds and managed futures 5. Volatility and Correlation: February 28, 1998 – Present. Cheap = Below -0.5 standard deviation; Moderate = Between +0.5 standard deviation and -0.5 standard deviation; Expensive = Above +.5 std dev. Standard deviation (volatility) is a measure of the dispersion of a set of data from its mean.
Performance
As of February 2, 2018
Moderate
High Volatility
High Correlation
Expensive
Cheap
Low Volatility
Low Correlation
Asset Class Yield
Cash YTD 1-Yr 2017 3-Yr1 5-Yr1 10-Yr1 20-Yr1 Current YTM
Current YTM
Avg YTM2 30 Days 20 Yrs.1 30 Days 20 Yrs.1
90-Day US Treasury Bills 0.1 0.9 0.3 0.4 0.3 0.3 2.0 1.49 1.49 1.92 0.1 0.59 -0.02 -0.04
Global Equities Current Dividend Yield
Current P/E
Avg. P/E2
US Large-Cap Growth 5.5 31.7 6.5 17.1 18.3 11.9 7.0 1.03 23.0 21.3 12.5 17.6 0.92 0.89 US Large-Cap Value 1.9 17.2 16.3 12.7 13.8 7.7 7.0 2.64 15.8 13.9 11.1 14.2 0.94 0.89 US Mid-Cap Growth 3.8 22.6 6.4 12.1 14.3 9.9 8.2 0.64 22.3 26.7 12.5 23.3 0.89 0.81 US Mid-Cap Value 0.7 14.9 20.9 12.5 14.8 10.4 9.5 2.52 16.7 14.4 11.1 16.4 0.86 0.88 US Small-Cap Growth 2.2 24.0 14.0 13.5 15.1 11.5 10.0 0.55 28.1 24.0 12.5 22.1 0.81 0.84 US Small-Cap Value -0.7 10.1 25.8 11.4 13.1 10.8 9.6 2.36 18.8 17.1 12.0 17.3 0.78 0.84 Europe Equity 3.3 27.0 0.2 9.2 7.9 3.6 5.9 3.16 14.7 14.3 9.7 18.2 0.83 0.94 Japan Equity 4.9 26.6 2.7 12.8 11.7 4.3 3.8 1.88 14.9 20.4 16.1 17.0 0.45 0.70 Asia Pacific ex Japan Equity 3.0 22.0 8.0 9.0 5.4 5.3 9.3 3.60 15.9 14.4 6.0 20.8 0.68 0.86 Emerging Markets 6.3 37.9 11.6 12.2 6.1 4.2 9.0 2.12 12.9 11.3 12.2 23.3 0.85 0.86
Global Fixed Income Current YTM
Current Spread
Avg. Spread2
Short-Term Fixed Income -0.3 0.4 1.3 0.7 0.8 1.7 3.3 2.30 14.0 31.0 0.4 1.4 -0.37 -0.16 US Fixed Income -1.8 1.5 2.6 1.1 2.0 3.7 4.9 3.07 34.0 55.0 2.7 3.4 0.34 -0.06 International Fixed Income 1.8 9.8 1.8 3.3 0.8 2.5 4.4 1.17 32.0 49.0 5.8 8.1 0.39 0.30 Inflation-Protected Securities 0.9 8.3 6.5 2.9 1.1 3.3 6.3 - - - 5.6 7.6 0.49 0.44 High Yield 0.8 9.0 14.3 7.8 5.6 8.3 7.8 5.64 320.0 514.0 2.7 10.1 0.69 0.75 Emerging Markets Fixed Income 4.0 16.3 9.9 3.9 -0.8 3.9 7.6 6.07 202.0 350.0 7.9 13.0 0.54 0.68
Alternative InvestmentsCurrent
Dividend Yield
REITs -1.0 12.7 4.6 5.1 6.6 4.5 8.7 3.89 - - 10.9 18.1 0.56 0.80
Master Limited Partnerships3 3.5 -9.5 18.3 -6.7 -1.3 6.7 - 7.26 - - 21.3 18.2 0.73 0.55 Commodities ex Prec. Metals 1.3 1.3 11.6 -4.1 -9.1 -8.5 -0.1 - - - 8.2 17.0 0.38 0.43 Precious Metals 0.9 5.0 9.5 0.4 -6.7 2.3 6.8 - - - 11.1 19.3 0.48 0.20
Hedged Strategies4 2.5 8.0 2.5 2.5 2.2 0.0 - - - - 3.6 6.0 0.69 0.64
Managed Futures5 4.2 7.6 -2.9 -0.2 0.9 -1.1 - - - - 6.6 7.9 0.57 0.17S&P 500 3.4 23.5 12.0 14.7 15.9 9.8 7.4 1.75 17.5 16.0 11.6 14.9 0.95 0.95Russell 2000 0.8 15.5 21.3 12.1 13.3 9.8 8.1 1.51 23.0 20.4 13.3 19.8 0.75 0.82MSCI EAFE 3.6 26.2 1.5 9.9 8.3 3.9 5.7 2.90 14.8 15.1 9.2 16.6 0.80 0.96MSCI AC World 3.7 25.5 8.5 12.5 11.6 6.7 6.7 2.22 15.9 15.6 9.6 15.6 1.00 1.00
Valuation Volatility (%) Correlation to Global Equities
Annualized Returns (%)
Page 31 of 70
Past performance is no guarantee of future results. Estimates of future performance are based on assumptions that may not be realized. This material is not a solicitation of any offer to buy or sell any security or other financial instrument or to participate in any trading strategy. Please refer to important information, disclosures and qualifications at the end of this material.
WEALTH MANAGEMENT INVESTMENT RESOURCES | CHARTBOOK | WEEKLY DIGEST
Americas As of 2/2/2018 1-Day 1-Day WTD MTD QTD YTD 1-Year Market Cap & Style 2/2/2018 1-Day 1-Day WTD MTD QTD YTD 1-Year Market Breadth Advances Declines UnchangedDJ Industrial Average 25,520.96 -665.75 -2.5% -4.1% -2.4% 3.3% 3.3% 31.4% Russell 1000 1,528.28 -32.68 -2.1% -3.8% -2.1% 3.3% 3.3% 23.0% AMEX 37 227 8S&P 500 2,762.13 -59.85 -2.1% -3.8% -2.2% 3.4% 3.4% 23.5% Russell 1000 Growth 1,413.37 -29.16 -2.0% -3.7% -2.3% 4.6% 4.6% 31.4% NASDAQ 402 1,999 149NASDAQ Composite 7,240.95 -144.92 -2.0% -3.5% -2.3% 4.9% 4.9% 30.0% Russell 1000 Value 1,243.86 -27.59 -2.2% -3.8% -1.9% 1.9% 1.9% 15.0% NYSE 137 1,739 36CBOE Market Volatility (VIX) 17.31 3.84 28.5% 56.2% 27.8% 56.8% 56.8% 45.1% S&P 500 2,762.13 -59.85 -2.1% -3.8% -2.2% 3.4% 3.4% 23.5%NYSE Composite 13,085.35 -296.62 -2.2% -4.0% -2.1% 2.3% 2.3% 19.7% S&P 500 Growth 1,606.50 -32.54 -2.0% -3.7% -2.2% 4.8% 4.8% 29.3% US LIBOR Rates 2/2/2018 1-Day (Net) 1-Day (% Chg)AMEX Composite 2,601.74 -81.89 -3.1% -4.9% -2.6% -2.1% -2.1% 9.6% S&P 500 Value 1,147.07 -26.60 -2.3% -4.0% -2.1% 2.0% 2.0% 17.0% 1-Month 1.580 0.00 0.0%S&P/TSX Composite 12,591.60 -315.00 -2.4% -4.4% -2.8% -2.5% -2.5% 9.6% Russell Mid Cap 2,109.73 -42.36 -2.0% -3.9% -2.1% 1.6% 1.6% 17.5% 3-Month 1.789 0.00 0.1%Mexico IPC 2,724.28 -26.48 -1.0% -1.2% 0.5% 8.7% 8.7% 20.9% Russell Mid Cap Growth 1,003.72 -20.39 -2.0% -3.9% -2.0% 3.5% 3.5% 25.4% 6-Month 1.992 0.01 0.5%Brazil Bovespa 26,129.82 -817.34 -3.0% -3.8% -2.0% 13.1% 13.1% 26.2% Russell Mid Cap Value 2,054.86 -40.87 -2.0% -3.9% -2.2% 0.1% 0.1% 11.5% 9-Month - - -
Russell 2000 1,547.27 -32.59 -2.1% -3.7% -1.7% 0.8% 0.8% 15.5% 1-Year 2.291 0.00 -0.1%Europe As of 2/2/2018 1-Day 1-Day WTD MTD QTD YTD 1-Year Russell 2000 Growth 965.67 -21.44 -2.2% -3.7% -1.8% 2.0% 2.0% 23.0%FTSE 100 10,536.92 -122.65 -1.2% -3.1% -1.4% 1.4% 1.4% 22.2% Russell 2000 Value 1,872.63 -37.09 -1.9% -3.8% -1.7% -0.4% -0.4% 8.5% US Bank Rates 2/2/2018 1-Day (Net) 1-Day (% Chg)STOXX 50 4,393.18 -71.00 -1.6% -3.0% -1.8% 4.5% 4.5% 29.2% Russell 3000 1,629.56 -34.81 -2.1% -3.8% -2.1% 3.1% 3.1% 22.4% Discount Rate 2 - -France CAC 40 6,689.59 -117.14 -1.7% -2.7% -1.7% 4.8% 4.8% 33.3% Russell 3000 Growth 1,146.91 -23.80 -2.0% -3.7% -2.3% 4.4% 4.4% 30.8% Prime Rate 4.5 - -Germany DAX 15,941.82 -285.75 -1.8% -3.9% -2.6% 2.7% 2.7% 27.1% Russell 3000 Value 1,639.29 -36.08 -2.2% -3.8% -1.9% 1.7% 1.7% 14.5% Federal Funds 1.41 - -Spain IBEX 35 12,732.34 -244.57 -1.9% -3.2% -1.9% 5.9% 5.9% 29.8%Netherlands AEX 685.89 -9.02 -1.3% -2.7% -1.4% 4.8% 4.8% 36.3% S&P 500 Sectors 2/2/2018 1-Day 1-Day WTD MTD QTD YTD 1-Year FX Rates As o 2/2/2018 1-Day (Net) 1-Day (% Chg)OMX Stockholm 30 200.72 -3.07 -1.5% -2.1% -0.7% 4.1% 4.1% 16.9% S&P 500 2,762.13 -59.85 -2.1% -3.8% -2.2% 3.4% 3.4% 23.5% US Dollar Spot Rate (DXY 89.20 0.52 0.6%Switzerland SMI 9,917.92 -80.92 -0.8% -2.5% -0.9% 2.9% 2.9% 22.7% Discretionary 841.07 -7.57 -0.9% -3.1% -2.0% 7.2% 7.2% 26.8% Euro/$ 1.25 0.00 -0.4%
Energy 536.43 -23.11 -4.1% -6.4% -3.1% 0.6% 0.6% 3.5% British Pound/$ 1.41 -0.01 -1.0%Asia As of 2/2/2018 1-Day 1-Day WTD MTD QTD YTD 1-Year Financials 487.21 -11.15 -2.2% -2.7% -1.2% 5.2% 5.2% 28.6% Swiss Franc/$ 1.07 -0.01 -0.5%Japan Nikkei 225 211.30 -3.05 -1.4% -3.0% 0.0% 4.5% 4.5% 28.3% Health Care 1,005.72 -13.70 -1.3% -5.0% -1.3% 5.3% 5.3% 24.6% Japanese Yen/$ 0.01 0.00 -0.7%Hang Seng Hong Kong 4,168.28 -5.15 -0.1% -1.7% -0.8% 8.9% 8.9% 45.0% Industrials 656.51 -13.54 -2.0% -3.3% -2.2% 3.0% 3.0% 23.4% Australian Dollar/$ 0.79 -0.01 -1.3%China Shenzhen Composite 289.07 0.03 0.0% -6.3% -3.2% -1.0% -1.0% 4.6% Info Tech 1,154.30 -35.23 -3.0% -4.1% -3.0% 4.4% 4.4% 37.8% Canadian Dollar/$ 0.80 -0.01 -1.3%ASX All Ordinaries 4,952.73 -22.42 -0.5% -0.6% 0.1% 2.8% 2.8% 19.9% Materials 378.94 -10.11 -2.6% -5.6% -3.9% 0.0% 0.0% 18.4% Hong Kong Dollar/$ 0.13 0.00 0.0%India S&P BSE SENSEX 546.74 -14.57 -2.6% -3.7% -3.2% 2.5% 2.5% 31.9% Staples 582.45 -10.50 -1.8% -3.8% -2.2% -0.7% -0.7% 10.7% Singapore Dollar/$ 0.76 -0.01 -0.9%Korea KOSPI 2.32 -0.07 -3.1% -3.8% -3.2% 0.8% 0.8% 29.4% Telecom 164.75 -4.34 -2.6% -1.3% -0.2% 0.4% 0.4% 3.7% Chinese Renminbi/$ 0.16 0.00 0.0%FTSE Bursa Malaysia KLCI 481.21 2.15 0.4% 0.6% 0.4% 8.8% 8.8% 31.6% Utilities 253.14 -1.83 -0.7% -2.3% -2.3% -5.3% -5.3% 5.7% Indian Rupee/$ 0.02 0.00 -0.5%
Real Estate 194.17 -2.02 -1.0% -2.4% -2.9% -4.7% -4.7% 5.6% Mexican Peso/$ 0.05 0.00 -1.3%Other As of 2/2/2018 1-Day 1-Day WTD MTD QTD YTD 1-Year Russian Ruble/$ 0.02 0.00 -1.0%DJ Equity All REIT 334.74 -3.30 -1.0% -2.9% -2.8% -5.8% -5.8% -1.4% MSCI Indices 2/2/2018 1-Day 1-Day WTD MTD QTD YTD 1-Year Brazilian Real/$ 0.31 -0.01 -1.6%CRB Index 443.46 0.08 0.0% 0.8% 0.0% 2.6% 2.6% 1.9% MSCI EAFE 2,123.82 -30.50 -1.4% -2.7% -1.3% 3.6% 3.6% 26.2%DJ UBS Commodity 89.12 -0.74 -0.8% -1.8% -0.8% 1.1% 1.1% 0.8% MSCI EM 1,230.83 -17.82 -1.4% -3.3% -1.9% 6.3% 6.3% 37.8%DJ UBS Precious Metals 358.32 -4.35 -1.2% -2.1% -1.0% 0.9% 0.9% 5.0% MSCI WORLD 2,171.54 -40.99 -1.9% -3.4% -1.9% 3.3% 3.3% 24.0%DJ UBS Ex Precious Metals 101.89 -0.78 -0.8% -1.8% -0.7% 1.3% 1.3% 1.3% MSCI ACWI 531.46 -9.75 -1.8% -3.4% -1.9% 3.7% 3.7% 25.5%HFRI Fund of Funds 6,125.13 - - - - 0.0% 0.0% 6.5% MSCI ACWI xUSA 317.41 -4.77 -1.5% -3.0% -1.6% 3.9% 3.9% 27.8%BarclayHedge BTop50 9,060.62 - - - - 0.0% 0.0% 0.9% MSCI USA 2,630.24 -56.24 -2.1% -3.8% -2.1% 3.5% 3.5% 23.4%Alerian MLP Index 282.32 -8.74 -3.0% -5.9% -2.1% 3.5% 3.5% -9.5% MSCI BRIC 365.36 -5.07 -1.4% -3.7% -2.3% 8.9% 8.9% 45.1%
MSCI EUROPE 163.23 -2.39 -1.4% -2.9% -1.4% 3.4% 3.4% 27.5%Commodities As of 2/2/2018 1-Day 1-Day WTD MTD QTD YTD 1-Year MSCI PACIFIC 2,976.97 -31.37 -1.0% -2.1% -0.1% 4.3% 4.3% 25.4%Gold - London AM Fixing $1,345.00 3.90 0.3% -0.7% 0.1% 3.7% 3.7% 9.9% MSCI PACIFIC x JAPAN 1,463.17 -8.57 -0.6% -1.2% -0.8% 3.0% 3.0% 23.1%Gold - London PM Fixing $1,331.15 -10.20 -0.8% -1.6% -1.0% 3.1% 3.1% 8.9% MSCI JAPAN 10.03 -0.09 -0.9% -2.5% 0.7% 5.0% 5.0% 27.2%Gold Spot $1,332.90 -15.80 -1.2% -1.2% -0.9% 2.3% 2.3% 9.6% MSCI BRAZIL 2,295.77 -81.44 -3.4% -4.1% -2.8% 13.6% 13.6% 27.2%Gold Futures $1,333.70 -10.60 -0.8% -1.4% -0.4% 1.9% 1.9% 9.6% MSCI RUSSIA 675.71 -9.68 -1.4% -0.3% -0.6% 11.9% 11.9% 18.8%Silver Futures $16.71 -0.45 -2.6% -4.2% -3.1% -2.5% -2.5% -4.1% MSCI INDIA 19.78 -0.55 -2.7% -4.6% -3.3% -0.1% -0.1% 29.1%Crude Oil Futures (WTI) $65.45 -0.35 -0.5% -1.0% 1.1% 8.3% 8.3% 22.2% MSCI CHINA 12.59 -0.06 -0.5% -3.8% -2.1% 10.1% 10.1% 59.8%Brent Crude Oil Futures $68.58 -1.07 -1.5% -2.8% -0.7% 2.6% 2.6% 21.3% MSCI MEXICO 5,754.49 -78.82 -1.4% -1.5% 0.1% 7.9% 7.9% 21.2%Copper Futures $3.19 -0.02 -0.7% -0.4% -0.3% -3.4% -3.4% 18.7% MSCI FRONTIER MARKET 664.78 -8.37 -1.2% -2.2% -1.4% 4.3% 4.3% 28.5%Natural Gas Futures $2.85 -0.01 -0.4% -18.8% -5.0% -3.6% -3.6% -10.7%Palladium Futures $1,044.95 20.25 2.0% -3.7% 2.1% -1.5% -1.5% 37.7%Platinum Futures $999.40 -8.40 -0.8% -1.5% -0.5% 7.0% 7.0% 0.0%
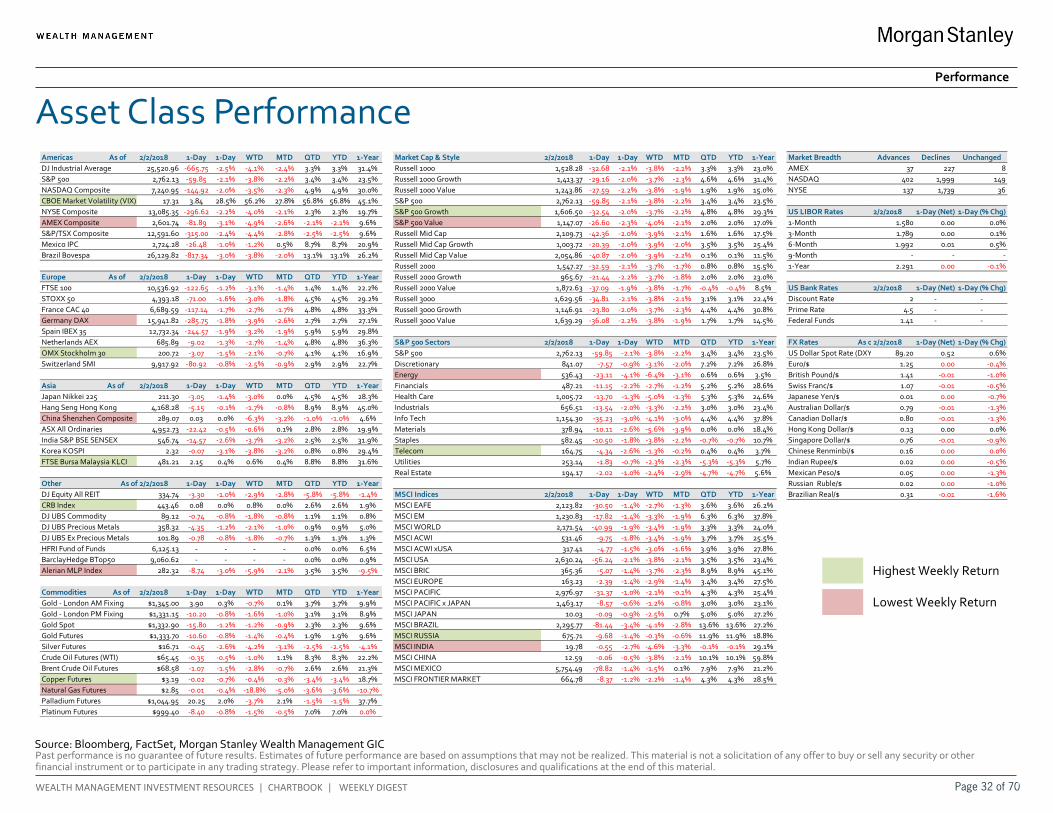
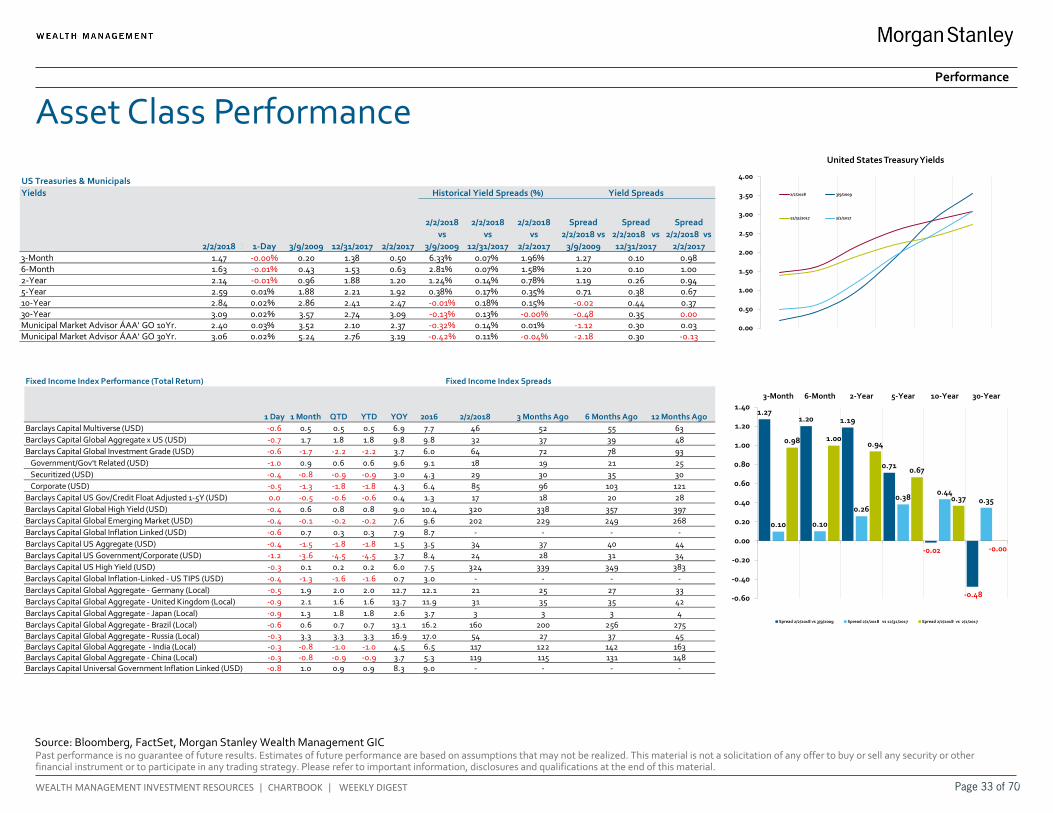
Asset Class Performance
Source: Bloomberg, FactSet, Morgan Stanley Wealth Management GIC
Performance
Highest Weekly Return
Lowest Weekly Return
Page 32 of 70
Past performance is no guarantee of future results. Estimates of future performance are based on assumptions that may not be realized. This material is not a solicitation of any offer to buy or sell any security or other financial instrument or to participate in any trading strategy. Please refer to important information, disclosures and qualifications at the end of this material.
WEALTH MANAGEMENT INVESTMENT RESOURCES | CHARTBOOK | WEEKLY DIGEST
1.271.20 1.19
0.71
-0.02
-0.48
0.10 0.10
0.260.38
0.440.35
0.98 1.000.94
0.67
0.37
-0.00
-0.60
-0.40
-0.20
0.00
0.20
0.40
0.60
0.80
1.00
1.20
1.403-Month 6-Month 2-Year 5-Year 10-Year 30-Year
Spread 2/2/2018 vs 3/9/2009 Spread 2/2/2018 vs 12/31/2017 Spread 2/2/2018 vs 2/2/2017
0.00
0.50
1.00
1.50
2.00
2.50
3.00
3.50
4.00
United States Treasury Yields
2/2/2018 3/9/2009
12/31/2017 2/2/2017
Asset Class Performance
Source: Bloomberg, FactSet, Morgan Stanley Wealth Management GIC
Performance
US Treasuries & MunicipalsYields
2/2/2018 D 1-Day 3/9/2009 12/31/2017 2/2/2017
2/2/2018 vs
3/9/2009
2/2/2018 vs
12/31/2017
2/2/2018 vs
2/2/2017
Spread 2/2/2018 vs
3/9/2009
Spread 2/2/2018 vs 12/31/2017
Spread 2/2/2018 vs
2/2/20173-Month 1.47 -0.00% 0.20 1.38 0.50 6.33% 0.07% 1.96% 1.27 0.10 0.986-Month 1.63 -0.01% 0.43 1.53 0.63 2.81% 0.07% 1.58% 1.20 0.10 1.002-Year 2.14 -0.01% 0.96 1.88 1.20 1.24% 0.14% 0.78% 1.19 0.26 0.945-Year 2.59 0.01% 1.88 2.21 1.92 0.38% 0.17% 0.35% 0.71 0.38 0.6710-Year 2.84 0.02% 2.86 2.41 2.47 -0.01% 0.18% 0.15% -0.02 0.44 0.3730-Year 3.09 0.02% 3.57 2.74 3.09 -0.13% 0.13% -0.00% -0.48 0.35 0.00Municipal Market Advisor ÁAA' GO 10Yr. 2.40 0.03% 3.52 2.10 2.37 -0.32% 0.14% 0.01% -1.12 0.30 0.03Municipal Market Advisor ÁAA' GO 30Yr. 3.06 0.02% 5.24 2.76 3.19 -0.42% 0.11% -0.04% -2.18 0.30 -0.13
Historical Yield Spreads (%) Yield Spreads
Fixed Income Index Performance (Total Return) Fixed Income Index Spreads
1 Day 1 Month QTD YTD YOY 2016 2/2/2018 3 Months Ago 6 Months Ago 12 Months AgoBarclays Capital Multiverse (USD) -0.6 0.5 0.5 0.5 6.9 7.7 46 52 55 63Barclays Capital Global Aggregate x US (USD) -0.7 1.7 1.8 1.8 9.8 9.8 32 37 39 48Barclays Capital Global Investment Grade (USD) -0.6 -1.7 -2.2 -2.2 3.7 6.0 64 72 78 93 Government/Gov't Related (USD) -1.0 0.9 0.6 0.6 9.6 9.1 18 19 21 25 Securitized (USD) -0.4 -0.8 -0.9 -0.9 3.0 4.3 29 30 35 30 Corporate (USD) -0.5 -1.3 -1.8 -1.8 4.3 6.4 85 96 103 121Barclays Capital US Gov/Credit Float Adjusted 1-5Y (USD) 0.0 -0.5 -0.6 -0.6 0.4 1.3 17 18 20 28Barclays Capital Global High Yield (USD) -0.4 0.6 0.8 0.8 9.0 10.4 320 338 357 397Barclays Capital Global Emerging Market (USD) -0.4 -0.1 -0.2 -0.2 7.6 9.6 202 229 249 268Barclays Capital Global Inflation Linked (USD) -0.6 0.7 0.3 0.3 7.9 8.7 - - - -Barclays Capital US Aggregate (USD) -0.4 -1.5 -1.8 -1.8 1.5 3.5 34 37 40 44Barclays Capital US Government/Corporate (USD) -1.2 -3.6 -4.5 -4.5 3.7 8.4 24 28 31 34Barclays Capital US High Yield (USD) -0.3 0.1 0.2 0.2 6.0 7.5 324 339 349 383Barclays Capital Global Inflation-Linked - US TIPS (USD) -0.4 -1.3 -1.6 -1.6 0.7 3.0 - - - -Barclays Capital Global Aggregate - Germany (Local) -0.5 1.9 2.0 2.0 12.7 12.1 21 25 27 33Barclays Capital Global Aggregate - United Kingdom (Local) -0.9 2.1 1.6 1.6 13.7 11.9 31 35 35 42Barclays Capital Global Aggregate - Japan (Local) -0.9 1.3 1.8 1.8 2.6 3.7 3 3 3 4Barclays Capital Global Aggregate - Brazil (Local) -0.6 0.6 0.7 0.7 13.1 16.2 160 200 256 275Barclays Capital Global Aggregate - Russia (Local) -0.3 3.3 3.3 3.3 16.9 17.0 54 27 37 45Barclays Capital Global Aggregate - India (Local) -0.3 -0.8 -1.0 -1.0 4.5 6.5 117 122 142 163Barclays Capital Global Aggregate - China (Local) -0.3 -0.8 -0.9 -0.9 3.7 5.3 119 115 131 148Barclays Capital Universal Government Inflation Linked (USD) -0.8 1.0 0.9 0.9 8.3 9.0 - - - -
Page 33 of 70
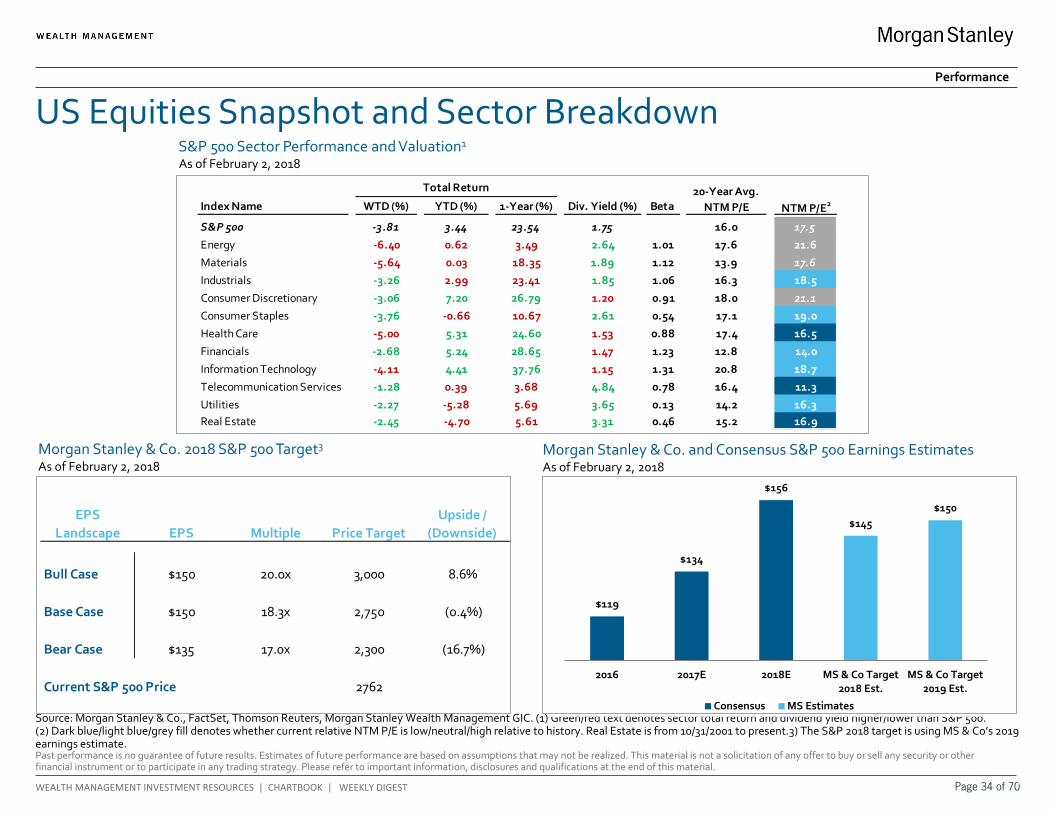
Past performance is no guarantee of future results. Estimates of future performance are based on assumptions that may not be realized. This material is not a solicitation of any offer to buy or sell any security or other financial instrument or to participate in any trading strategy. Please refer to important information, disclosures and qualifications at the end of this material.
WEALTH MANAGEMENT INVESTMENT RESOURCES | CHARTBOOK | WEEKLY DIGEST
US Equities Snapshot and Sector Breakdown
Source: Morgan Stanley & Co., FactSet, Thomson Reuters, Morgan Stanley Wealth Management GIC. (1) Green/red text denotes sector total return and dividend yield higher/lower than S&P 500. (2) Dark blue/light blue/grey fill denotes whether current relative NTM P/E is low/neutral/high relative to history. Real Estate is from 10/31/2001 to present.3) The S&P 2018 target is using MS & Co’s 2019 earnings estimate.
S&P 500 Sector Performance and Valuation1 As of February 2, 2018
Performance
Index Name WTD (%) YTD (%) 1-Year (%) Div. Yield (%) Beta NTM P/E2
S&P 500 -3.81 3.44 23.54 1.75 16.0 17.5
Energy -6.40 0.62 3.49 2.64 1.01 17.6 21.6
Materials -5.64 0.03 18.35 1.89 1.12 13.9 17.6
Industrials -3.26 2.99 23.41 1.85 1.06 16.3 18.5
Consumer Discretionary -3.06 7.20 26.79 1.20 0.91 18.0 21.1
Consumer Staples -3.76 -0.66 10.67 2.61 0.54 17.1 19.0
Health Care -5.00 5.31 24.60 1.53 0.88 17.4 16.5
Financials -2.68 5.24 28.65 1.47 1.23 12.8 14.0
Information Technology -4.11 4.41 37.76 1.15 1.31 20.8 18.7
Telecommunication Services -1.28 0.39 3.68 4.84 0.78 16.4 11.3
Utilities -2.27 -5.28 5.69 3.65 0.13 14.2 16.3Real Estate -2.45 -4.70 5.61 3.31 0.46 15.2 16.9
Total Return 20-Year Avg. NTM P/E
$119
$134
$156
$145$150
2016 2017E 2018E MS & Co Target2018 Est.
MS & Co Target2019 Est.
Consensus MS Estimates
Morgan Stanley & Co. and Consensus S&P 500 Earnings Estimates As of February 2, 2018
Morgan Stanley & Co. 2018 S&P 500 Target3 As of February 2, 2018
EPS Landscape EPS Multiple Price Target
Upside / (Downside)
Bull Case $150 20.0x 3,000 8.6%
Base Case $150 18.3x 2,750 (0.4%)
Bear Case $135 17.0x 2,300 (16.7%)
Current S&P 500 Price 2762
Page 34 of 70
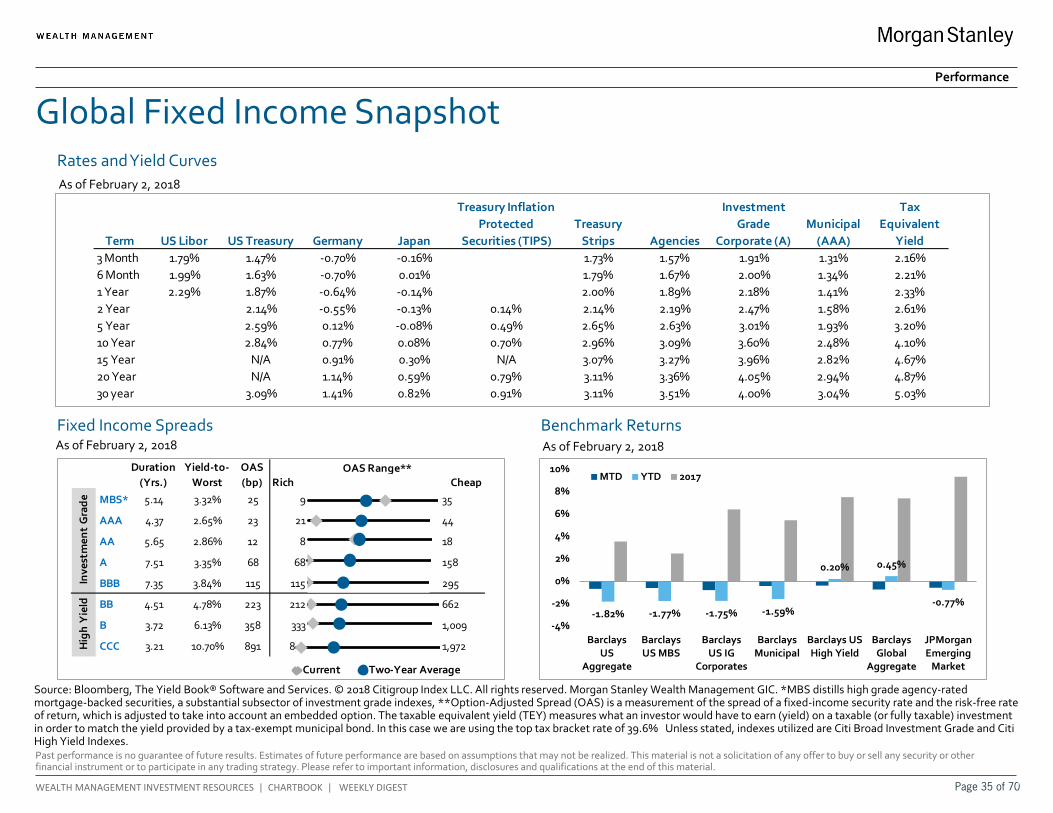
Past performance is no guarantee of future results. Estimates of future performance are based on assumptions that may not be realized. This material is not a solicitation of any offer to buy or sell any security or other financial instrument or to participate in any trading strategy. Please refer to important information, disclosures and qualifications at the end of this material.
WEALTH MANAGEMENT INVESTMENT RESOURCES | CHARTBOOK | WEEKLY DIGEST
Rich Cheap
MBS* 5.14 3.32% 25 9 35
AAA 4.37 2.65% 23 21 44
AA 5.65 2.86% 12 8 18
A 7.51 3.35% 68 68 158
BBB 7.35 3.84% 115 115 295
BB 4.51 4.78% 223 212 662
B 3.72 6.13% 358 333 1,009
CCC 3.21 10.70% 891 851 1,972
OAS Range**
Hig
h Y
ield
Inve
stm
ent
Gra
de
OAS (bp)
Yield-to-Worst
Duration(Yrs.)
Current Two-Year Average
Term US Libor US Treasury Germany Japan
Treasury Inflation Protected
Securities (TIPS)Treasury
Strips Agencies
Investment Grade
Corporate (A)Municipal
(AAA)
Tax Equivalent
Yield3 Month 1.79% 1.47% -0.70% -0.16% 1.73% 1.57% 1.91% 1.31% 2.16%6 Month 1.99% 1.63% -0.70% 0.01% 1.79% 1.67% 2.00% 1.34% 2.21%1 Year 2.29% 1.87% -0.64% -0.14% 2.00% 1.89% 2.18% 1.41% 2.33%2 Year 2.14% -0.55% -0.13% 0.14% 2.14% 2.19% 2.47% 1.58% 2.61%5 Year 2.59% 0.12% -0.08% 0.49% 2.65% 2.63% 3.01% 1.93% 3.20%10 Year 2.84% 0.77% 0.08% 0.70% 2.96% 3.09% 3.60% 2.48% 4.10%15 Year N/A 0.91% 0.30% N/A 3.07% 3.27% 3.96% 2.82% 4.67%20 Year N/A 1.14% 0.59% 0.79% 3.11% 3.36% 4.05% 2.94% 4.87%30 year 3.09% 1.41% 0.82% 0.91% 3.11% 3.51% 4.00% 3.04% 5.03%
-1.82% -1.77% -1.75% -1.59%
0.20% 0.45%
-0.77%
-4%
-2%
0%
2%
4%
6%
8%
10%
BarclaysUS
Aggregate
BarclaysUS MBS
BarclaysUS IG
Corporates
BarclaysMunicipal
Barclays USHigh Yield
BarclaysGlobal
Aggregate
JPMorganEmerging
Market
MTD YTD 2017
v
Global Fixed Income Snapshot
Source: Bloomberg, The Yield Book® Software and Services. © 2018 Citigroup Index LLC. All rights reserved. Morgan Stanley Wealth Management GIC. *MBS distills high grade agency-rated mortgage-backed securities, a substantial subsector of investment grade indexes, **Option-Adjusted Spread (OAS) is a measurement of the spread of a fixed-income security rate and the risk-free rate of return, which is adjusted to take into account an embedded option. The taxable equivalent yield (TEY) measures what an investor would have to earn (yield) on a taxable (or fully taxable) investment in order to match the yield provided by a tax-exempt municipal bond. In this case we are using the top tax bracket rate of 39.6% Unless stated, indexes utilized are Citi Broad Investment Grade and Citi High Yield Indexes.
v
Fixed Income Spreads As of February 2, 2018
Benchmark Returns As of February 2, 2018
Rates and Yield Curves As of February 2, 2018
Performance
Page 35 of 70
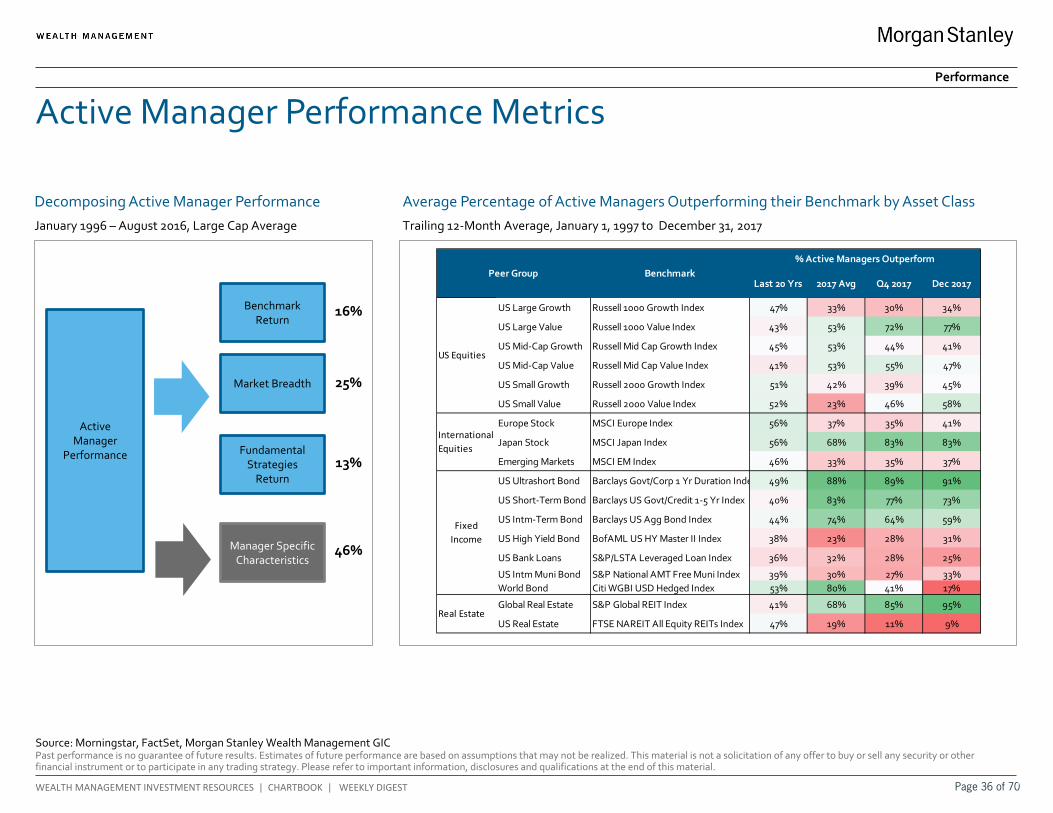
Past performance is no guarantee of future results. Estimates of future performance are based on assumptions that may not be realized. This material is not a solicitation of any offer to buy or sell any security or other financial instrument or to participate in any trading strategy. Please refer to important information, disclosures and qualifications at the end of this material.
WEALTH MANAGEMENT INVESTMENT RESOURCES | CHARTBOOK | WEEKLY DIGEST
Active Manager Performance Metrics
Source: Morningstar, FactSet, Morgan Stanley Wealth Management GIC
Performance
Decomposing Active Manager Performance January 1996 – August 2016, Large Cap Average
16%
25%
13%
46%
Last 20 Yrs 2017 Avg Q4 2017 Dec 2017
US Large Growth Russell 1000 Growth Index 47% 33% 30% 34%
US Large Value Russell 1000 Value Index 43% 53% 72% 77%
US Mid-Cap Growth Russell Mid Cap Growth Index 45% 53% 44% 41%
US Mid-Cap Value Russell Mid Cap Value Index 41% 53% 55% 47%
US Small Growth Russell 2000 Growth Index 51% 42% 39% 45%
US Small Value Russell 2000 Value Index 52% 23% 46% 58%
Europe Stock MSCI Europe Index 56% 37% 35% 41%
Japan Stock MSCI Japan Index 56% 68% 83% 83%
Emerging Markets MSCI EM Index 46% 33% 35% 37%
US Ultrashort Bond Barclays Govt/Corp 1 Yr Duration Inde 49% 88% 89% 91%
US Short-Term Bond Barclays US Govt/Credit 1-5 Yr Index 40% 83% 77% 73%
US Intm-Term Bond Barclays US Agg Bond Index 44% 74% 64% 59%
US High Yield Bond BofAML US HY Master II Index 38% 23% 28% 31%
US Bank Loans S&P/LSTA Leveraged Loan Index 36% 32% 28% 25%
US Intm Muni Bond S&P National AMT Free Muni Index 39% 30% 27% 33%World Bond Citi WGBI USD Hedged Index 53% 80% 41% 17%
Global Real Estate S&P Global REIT Index 41% 68% 85% 95%
US Real Estate FTSE NAREIT All Equity REITs Index 47% 19% 11% 9%Real Estate
Peer Group Benchmark% Active Managers Outperform
US Equities
International Equities
Fixed Income
Average Percentage of Active Managers Outperforming their Benchmark by Asset Class Trailing 12-Month Average, January 1, 1997 to December 31, 2017
Active Manager
Performance
Benchmark Return
Market Breadth
Fundamental Strategies
Return
Manager Specific Characteristics
Page 36 of 70

Past performance is no guarantee of future results. Estimates of future performance are based on assumptions that may not be realized. This material is not a solicitation of any offer to buy or sell any security or other financial instrument or to participate in any trading strategy. Please refer to important information, disclosures and qualifications at the end of this material.
WEALTH MANAGEMENT INVESTMENT RESOURCES | CHARTBOOK | WEEKLY DIGEST
Source: Bloomberg, Morgan Stanley Wealth Management GIC. Initial Jobless Claims, Consumer Comfort, Gas Prices, MBA Purchase Applications Index is the monthly average. 10-year average hourly earnings data is from 3/31/2007 to present.
US Economic Heat Map Growth
As of February 3, 2018 US Economic Data
Indicator As of Better/Worse Latest Prior 1 Month Change 1 Year Ago 5 Year Average 10 Year AveragePersonal Consumption Expenditures (Real PCE) Y/Y A Requesting Da Worse 2.8% 2.9% -0.1% 2.9% 2.7% 1.7%Personal Income Y/Y A Requesting Da Better 4.1% 3.8% 0.3% 1.6% 3.4% 3.2%Real Disposable Income Per Capital Y/Y A Requesting Da Better 1.4% 1.0% 0.4% -0.7% 1.1% 0.9%Retail Sales Y/Y A Requesting Da Worse 5.4% 6.0% -0.6% 3.8% 3.6% 2.7%Consumer Credit (Y/Y) A Requesting Da No Change 5.3% 5.3% 0.0% 2.9% 5.7% 4.1%Nonfarm Payroll Change M/M (Thousands) A Requesting Da Better 200 160 40 259 209 78Initial Jobless Claims Y/Y A Requesting Da Worse -3.5% -5.6% 2.1% -12.1% -8.1% -0.8%Consumer Confidence A Requesting Da Better 125 123 2 112 97 76Consumer Comfort A Requesting Da Better 53.9 51.7 2.2 46 42 35Average Hourly Earnings Y/Y A Requesting Da Better 2.9% 2.7% 0.2% 2.4% 2.3% 2.3%Auto Sales (SAAR, Millions) A Requesting Da Worse 17.1 17.8 -0.7 17.3 16.8 14.7Gas Prices (Dollars/Gallon) A Requesting Da Worse $2.60 $2.53 $0.07 $2.28 $2.72 $2.92
Industrial Production Y/Y A Requesting Da Better 3.6% 3.5% 0.1% 0.8% 1.0% 0.2%Capacity Utilization A Requesting Da Better 77.9% 77.2% 0.6% 76.0% 77.0% 75.8%Durable Goods New Orders Y/Y A Requesting Da Better 9.6% 9.5% 0.1% -0.7% 1.6% 1.3%Capital Goods New Orders Nondefense Ex Aircraft Y/Y A Requesting Da Worse 6.5% 10.7% -4.2% -0.1% -0.6% 0.5%ISM Manufacturing A Requesting Da Worse 59.1 59.3 -0.2 55.6 53.9 52.6ISM Manufacturing New Orders A Requesting Da Worse 65.4 67.4 -2.0 60.1 57.0 54.9ISM Manufacturing Employment A Requesting Da Worse 54.2 58.1 -3.9 54.8 52.8 51.8ISM Non-manufacturing A Requesting Da Worse 56.0 57.3 -1.3 56.7 56.0 53.7ISM Nonmanufacturing - New Orders A Requesting Da Worse 54.5 58.8 -4.3 60.8 58.1 55.5ISM Nonmanufacturing - Employment A Requesting Da Better 56.3 55.4 0.9 52.7 54.6 51.3Manufacturing and Trade Inventories Y/Y A Requesting Da Worse 3.2% 3.6% -0.4% 1.9% 3.1% 2.8%Business Inventory/Sales Ratio A Requesting Da Better 1.33 1.34 -0.01 1.40 1.35 1.32
Housing Starts (Thousands) A Requesting Da Worse 1192 1299 -107 1268 1084 886New Home Sales (Thousands) A Requesting Da Worse 625 689 -64 548 509 440MBA Purchase Applications Index A Requesting Da Better 253 240 13 236 207 219NAHB Housing Market Index A Requesting Da Worse 72 74 -2 67 58 39FHFA House Price Index (Y/Y) A Requesting Da Worse 6.5% 6.8% -0.3% 6.4% 6.1% 1.2%S&P Case Shiller Home Price Index (Y/Y) A Requesting Da Better 6.2% 6.1% 0.1% 5.3% 6.4% 0.8%Private Construction Spending (Y/Y) A Requesting Da Better 2.1% 1.7% 0.3% 13.4% 10.8% 2.0%
Public Construction Spending (Y/Y) A Requesting Da Better 4.4% 0.6% 3.9% -3.1% 0.3% -0.1%Monthly Federal Budget Balance (Billion) A Requesting Da Better -$23.2 -$138.5 $115.4 -$27.3 -$46.5 -$71.0
Trade Trade Balance (Billion) A Requesting Da Worse -$50.5 -$48.9 -$1.6 -$46.4 -$41.8 -$43.3
Consumption
Investment
Housing
Government
Latest vs.Most Recent
Better Unchanged Worse
Page 37 of 70
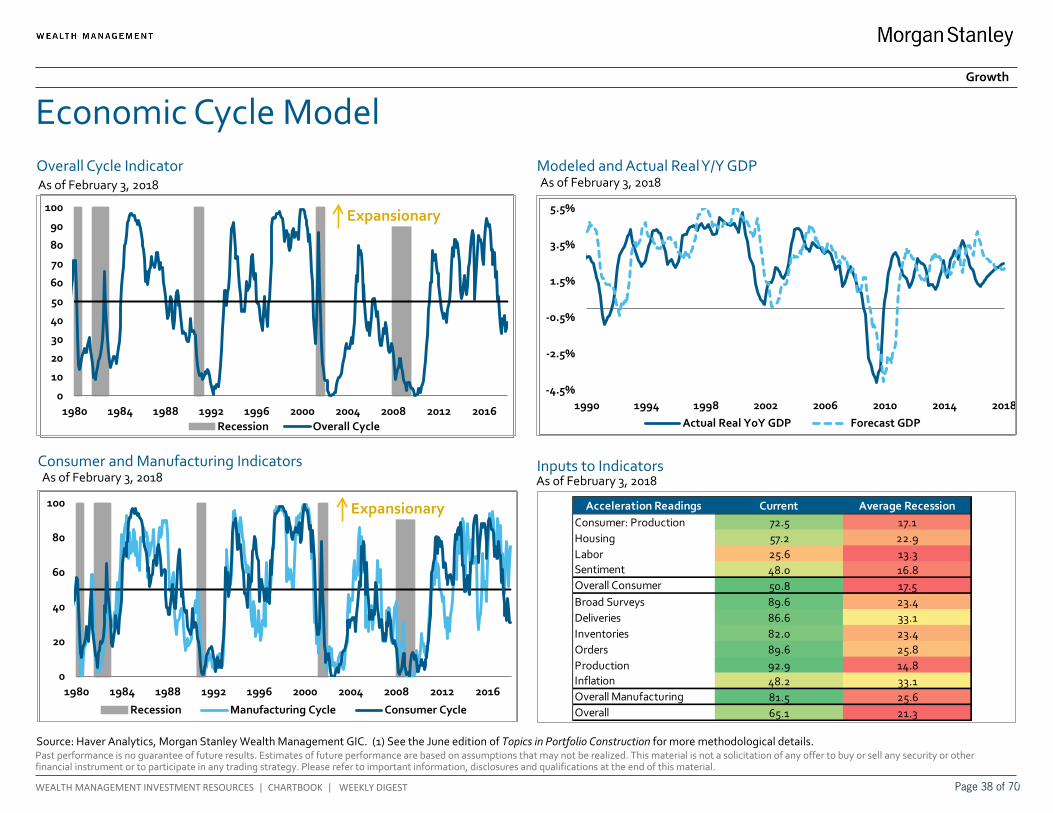
Past performance is no guarantee of future results. Estimates of future performance are based on assumptions that may not be realized. This material is not a solicitation of any offer to buy or sell any security or other financial instrument or to participate in any trading strategy. Please refer to important information, disclosures and qualifications at the end of this material.
WEALTH MANAGEMENT INVESTMENT RESOURCES | CHARTBOOK | WEEKLY DIGEST
0
10
20
30
40
50
60
70
80
90
100
1980 1984 1988 1992 1996 2000 2004 2008 2012 2016Recession Overall Cycle
0
20
40
60
80
100
1980 1984 1988 1992 1996 2000 2004 2008 2012 2016
Recession Manufacturing Cycle Consumer Cycle
-4.5%
-2.5%
-0.5%
1.5%
3.5%
5.5%
1990 1994 1998 2002 2006 2010 2014 2018Actual Real YoY GDP Forecast GDP
Economic Cycle Model Growth
Overall Cycle Indicator
Source: Haver Analytics, Morgan Stanley Wealth Management GIC. (1) See the June edition of Topics in Portfolio Construction for more methodological details.
As of February 3, 2018
Consumer and Manufacturing Indicators
Inputs to Indicators As of February 3, 2018
Modeled and Actual Real Y/Y GDP
Expansionary
Expansionary
As of February 3, 2018
As of February 3, 2018
Acceleration Readings Current Average RecessionConsumer: Production 72.5 17.1Housing 57.2 22.9Labor 25.6 13.3Sentiment 48.0 16.8Overall Consumer 50.8 17.5Broad Surveys 89.6 23.4Deliveries 86.6 33.1Inventories 82.0 23.4Orders 89.6 25.8Production 92.9 14.8Inflation 48.2 33.1Overall Manufacturing 81.5 25.6Overall 65.1 21.3
Page 38 of 70

Past performance is no guarantee of future results. Estimates of future performance are based on assumptions that may not be realized. This material is not a solicitation of any offer to buy or sell any security or other financial instrument or to participate in any trading strategy. Please refer to important information, disclosures and qualifications at the end of this material.
WEALTH MANAGEMENT INVESTMENT RESOURCES | CHARTBOOK | WEEKLY DIGEST
5.1%
-10%-8%-6%-4%-2%0%2%4%6%8%
2009 2010 2011 2012 2013 2014 2015 2016 2017
212k
-800
-600
-400
-200
0
200
400
2009 2010 2011 2012 2013 2014 2015 2016 2017 2018
Thou
sand
s
55.559.1
30
35
40
45
50
55
60
65
2009 2010 2011 2012 2013 2014 2015 2016 2017 2018
Markit Manufacturing PMI ISM Manufacturing PMI
8.4%
-40%
-30%
-20%
-10%
0%
10%
20%
30%
2009 2010 2011 2012 2013 2014 2015 2016 2017
Manufacturing Activity (50+ = Increasing) Nonfarm Payrolls Change (4-month average)
Durable Goods Orders Ex-Transportation (Y/Y) Retail Sales Ex Gas Y/Y (3-month average)
Source: Bloomberg, Haver Analytics, Markit, Morgan Stanley Wealth Management GIC
US Key Growth Indicators
As of January 2018
As of December 31, 2017 As of December 31, 2017
As of January 31, 2018
Growth
Page 39 of 70

Past performance is no guarantee of future results. Estimates of future performance are based on assumptions that may not be realized. This material is not a solicitation of any offer to buy or sell any security or other financial instrument or to participate in any trading strategy. Please refer to important information, disclosures and qualifications at the end of this material.
WEALTH MANAGEMENT INVESTMENT RESOURCES | CHARTBOOK | WEEKLY DIGEST
3
4
5
6
400
600
800
1000
1200
1400
2009 2010 2011 2012 2013 2014 2015 2016 2017
Mill
ions
Thou
sand
s
Housing Starts (SAAR, left axis)Existing Homes Sales (SAAR, right axis)
95.7
50
60
70
80
90
100
2009 2010 2011 2012 2013 2014 2015 2016 2017 2018
2.7%
1.5%
2.0%
2.5%
3.0%
3.5%
4.0%
2009 2010 2011 2012 2013 2014 2015 2016 2017 2018
University of Michigan Consumer Sentiment Index
Average Hourly Earnings Y/Y (3-month average)
US Housing (3-month average) Atlanta Fed GDPNow GDP Forecast
5.4%
0%
1%
2%
3%
4%
5%
6%
7%
2011 2012 2013 2014 2015 2016 2017
Source: Bloomberg, Morgan Stanley Wealth Management GIC
US Key Growth Indicators
As of February 2, 2018
As of December 31, 2017 As of February 1, 2018
As of January 31, 2018
Growth
Page 40 of 70

Past performance is no guarantee of future results. Estimates of future performance are based on assumptions that may not be realized. This material is not a solicitation of any offer to buy or sell any security or other financial instrument or to participate in any trading strategy. Please refer to important information, disclosures and qualifications at the end of this material.
WEALTH MANAGEMENT INVESTMENT RESOURCES | CHARTBOOK | WEEKLY DIGEST
94
95
96
97
98
99
100
101
102
103
104
2000 2002 2004 2006 2008 2010 2012 2014 2016
US Europe Japan China
48
49
50
51
52
53
54
55
56
57
58
2010 2012 2014 2016 2018
Global Composite PMI Global Manufacturing PMI Global Services PMI
Global Growth Metrics
Source: Haver Analytics, Markit Economics, OECD, Morgan Stanley Wealth Management GIC
Global Purchasing Manager Indices As of January 31, 2018
Growth
OECD Composite Leading Indicators As of November 30, 2017
Expanding
Contracting
Page 41 of 70

Past performance is no guarantee of future results. Estimates of future performance are based on assumptions that may not be realized. This material is not a solicitation of any offer to buy or sell any security or other financial instrument or to participate in any trading strategy. Please refer to important information, disclosures and qualifications at the end of this material.
WEALTH MANAGEMENT INVESTMENT RESOURCES | CHARTBOOK | WEEKLY DIGEST
-150
-130
-110
-90
-70
-50
-30
-10
10
30
50
70
90
110
Jan '15 Jul '15 Jan '16 Jul '16 Jan '17 Jul '17 Jan '18
US Europe Japan China
-30%
-20%
-10%
0%
10%
20%
30%
-2.0
-1.5
-1.0
-0.5
0.0
0.5
1.0
1.5
2009 2010 2011 2012 2013 2014 2015 2016 2017 2018
MS Global Trade Leading Indicator (left axis)US Exports Y/Y (3 month avg, right axis)
Global Growth Metrics
Source: Bloomberg, Morgan Stanley Wealth Management GIC
Citi Economic Surprise Indices As of February 2, 2018
Growth
Global Trade As of January 31, 2018
Page 42 of 70
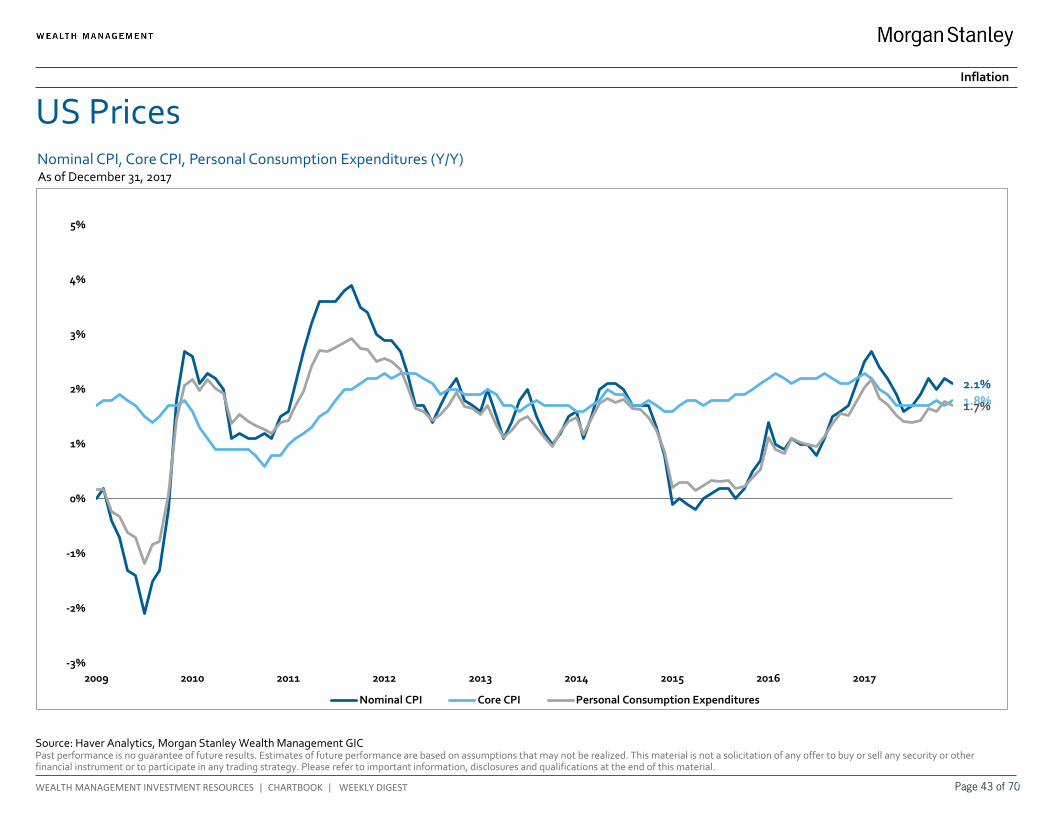
Past performance is no guarantee of future results. Estimates of future performance are based on assumptions that may not be realized. This material is not a solicitation of any offer to buy or sell any security or other financial instrument or to participate in any trading strategy. Please refer to important information, disclosures and qualifications at the end of this material.
WEALTH MANAGEMENT INVESTMENT RESOURCES | CHARTBOOK | WEEKLY DIGEST
2.1%1.8%1.7%
-3%
-2%
-1%
0%
1%
2%
3%
4%
5%
2009 2010 2011 2012 2013 2014 2015 2016 2017
Nominal CPI Core CPI Personal Consumption Expenditures
Nominal CPI, Core CPI, Personal Consumption Expenditures (Y/Y)
Source: Haver Analytics, Morgan Stanley Wealth Management GIC
US Prices
As of December 31, 2017
Inflation
Page 43 of 70

Past performance is no guarantee of future results. Estimates of future performance are based on assumptions that may not be realized. This material is not a solicitation of any offer to buy or sell any security or other financial instrument or to participate in any trading strategy. Please refer to important information, disclosures and qualifications at the end of this material.
WEALTH MANAGEMENT INVESTMENT RESOURCES | CHARTBOOK | WEEKLY DIGEST
-2.0%
-1.5%
-1.0%
-0.5%
0.0%
0.5%
1.0%
1.5%
2012 2013 2014 2015 2016 2017 2018US Europe Japan
-0.4%
-0.2%
0.0%
0.2%
0.4%
0.6%
0.8%
1.0%
1.2%
1.4%
1.6%
1.2%
1.4%
1.6%
1.8%
2.0%
2.2%
2.4%
2.6%
2.8%
3.0%
2012 2013 2014 2015 2016 2017 2018
US (left axis) Europe (left axis) Japan (right axis)
Global Inflation Expectations
Source: Bloomberg, Morgan Stanley Wealth Management GIC
Five-Year, Five-Year Inflation Swap Forward Rates As of February 2, 2018
Inflation
Real 10-Year Interest Rates As of February 2, 2018
Page 44 of 70

Past performance is no guarantee of future results. Estimates of future performance are based on assumptions that may not be realized. This material is not a solicitation of any offer to buy or sell any security or other financial instrument or to participate in any trading strategy. Please refer to important information, disclosures and qualifications at the end of this material.
WEALTH MANAGEMENT INVESTMENT RESOURCES | CHARTBOOK | WEEKLY DIGEST
1M 3M 6M 1Y YTD 10Y Ann.
Bloomberg Commod. Index 0.8 2.8 6.2 0.8 1.1 -8.5
Bloomberg Gold Index 1.2 3.9 3.9 7.7 1.8 2.1
Bloomberg Silver Index -2.9 -3.0 -1.2 -6.3 -2.5 -3.2
Bloomberg Grains Index 2.4 -0.9 -7.2 -13.1 3.3 -8.8
Bloomberg Indust. Metals Index -0.2 2.7 15.4 18.7 -0.6 -5.3
Brent Crude Oil 3.0 13.1 31.0 21.3 2.6 -3.7
Price Returns (%)
$10
$20
$40
$80
$160
1983 1987 1991 1995 1999 2003 2007 2011 2015
Log
Scal
e
WTI Spot
$20
$200
$2,000
1970 1975 1980 1985 1990 1995 2000 2005 2010 2015
Log
Scal
e
Gold Spot
Commodity Performance
Source: FactSet, Morgan Stanley Wealth Management GIC. Spot = current price level.
Commodity Performance Table
Gold Spot Price WTI Crude Oil Spot Price
As of February 2, 2018 As of February 2, 2018
As of February 2, 2018
Inflation
Page 45 of 70
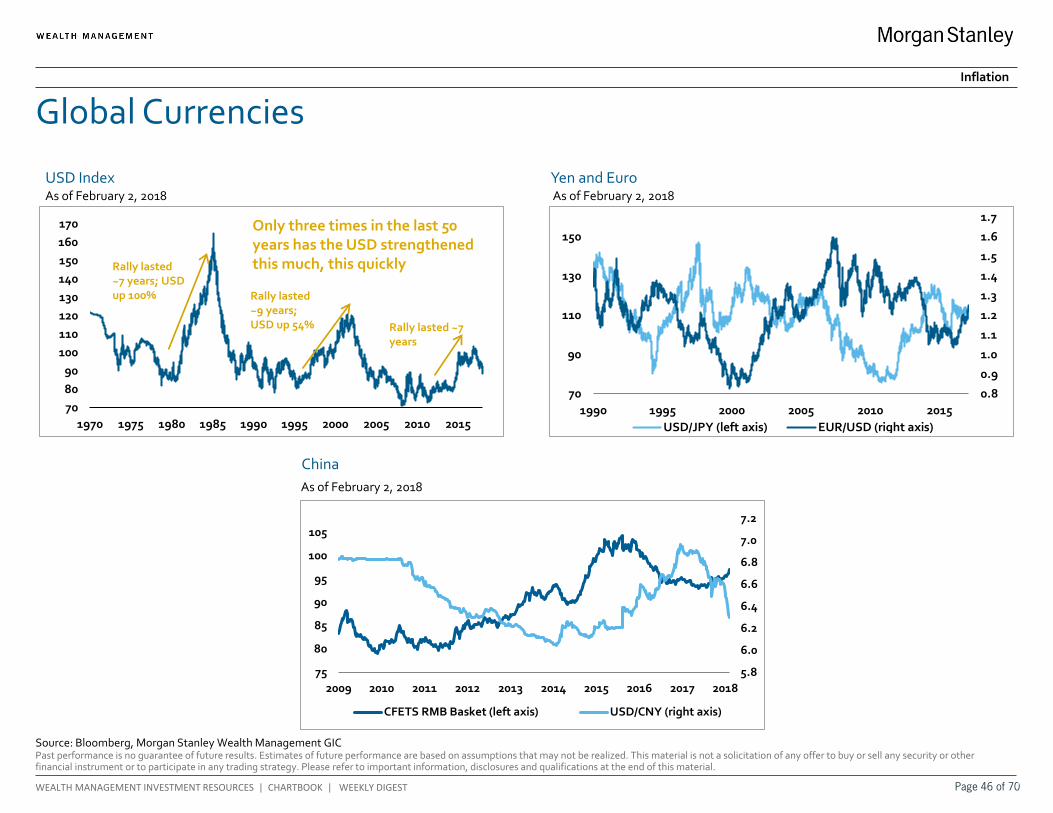
Past performance is no guarantee of future results. Estimates of future performance are based on assumptions that may not be realized. This material is not a solicitation of any offer to buy or sell any security or other financial instrument or to participate in any trading strategy. Please refer to important information, disclosures and qualifications at the end of this material.
WEALTH MANAGEMENT INVESTMENT RESOURCES | CHARTBOOK | WEEKLY DIGEST
5.8
6.0
6.2
6.4
6.6
6.8
7.0
7.2
75
80
85
90
95
100
105
2009 2010 2011 2012 2013 2014 2015 2016 2017 2018
CFETS RMB Basket (left axis) USD/CNY (right axis)
708090
100110120130140150160170
1970 1975 1980 1985 1990 1995 2000 2005 2010 2015
0.8
0.9
1.0
1.1
1.2
1.3
1.4
1.5
1.6
1.7
70
90
110
130
150
1990 1995 2000 2005 2010 2015USD/JPY (left axis) EUR/USD (right axis)
Global Currencies
Source: Bloomberg, Morgan Stanley Wealth Management GIC
Only three times in the last 50 years has the USD strengthened this much, this quickly Rally lasted
~7 years; USD up 100% Rally lasted
~9 years; USD up 54% Rally lasted ~7
years
USD Index Yen and Euro As of February 2, 2018 As of February 2, 2018
Inflation
China As of February 2, 2018
Page 46 of 70
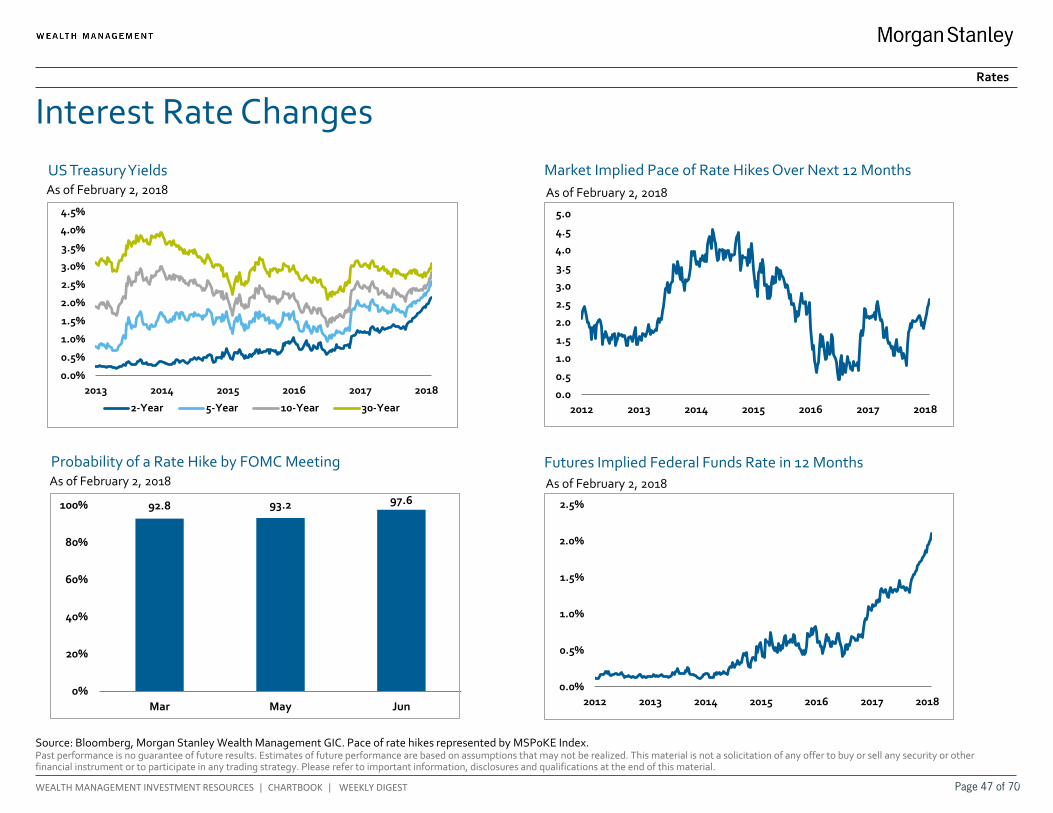
Past performance is no guarantee of future results. Estimates of future performance are based on assumptions that may not be realized. This material is not a solicitation of any offer to buy or sell any security or other financial instrument or to participate in any trading strategy. Please refer to important information, disclosures and qualifications at the end of this material.
WEALTH MANAGEMENT INVESTMENT RESOURCES | CHARTBOOK | WEEKLY DIGEST
92.8 93.2 97.6
0%
20%
40%
60%
80%
100%
Mar May Jun
0.0%
0.5%
1.0%
1.5%
2.0%
2.5%
3.0%
3.5%
4.0%
4.5%
2013 2014 2015 2016 2017 2018
2-Year 5-Year 10-Year 30-Year0.0
0.5
1.0
1.5
2.0
2.5
3.0
3.5
4.0
4.5
5.0
2012 2013 2014 2015 2016 2017 2018
0.0%
0.5%
1.0%
1.5%
2.0%
2.5%
2012 2013 2014 2015 2016 2017 2018
Futures Implied Federal Funds Rate in 12 Months
Market Implied Pace of Rate Hikes Over Next 12 Months
Probability of a Rate Hike by FOMC Meeting
Interest Rate Changes
Source: Bloomberg, Morgan Stanley Wealth Management GIC. Pace of rate hikes represented by MSP0KE Index.
As of February 2, 2018
Rates
US Treasury Yields As of February 2, 2018 As of February 2, 2018
As of February 2, 2018
Page 47 of 70
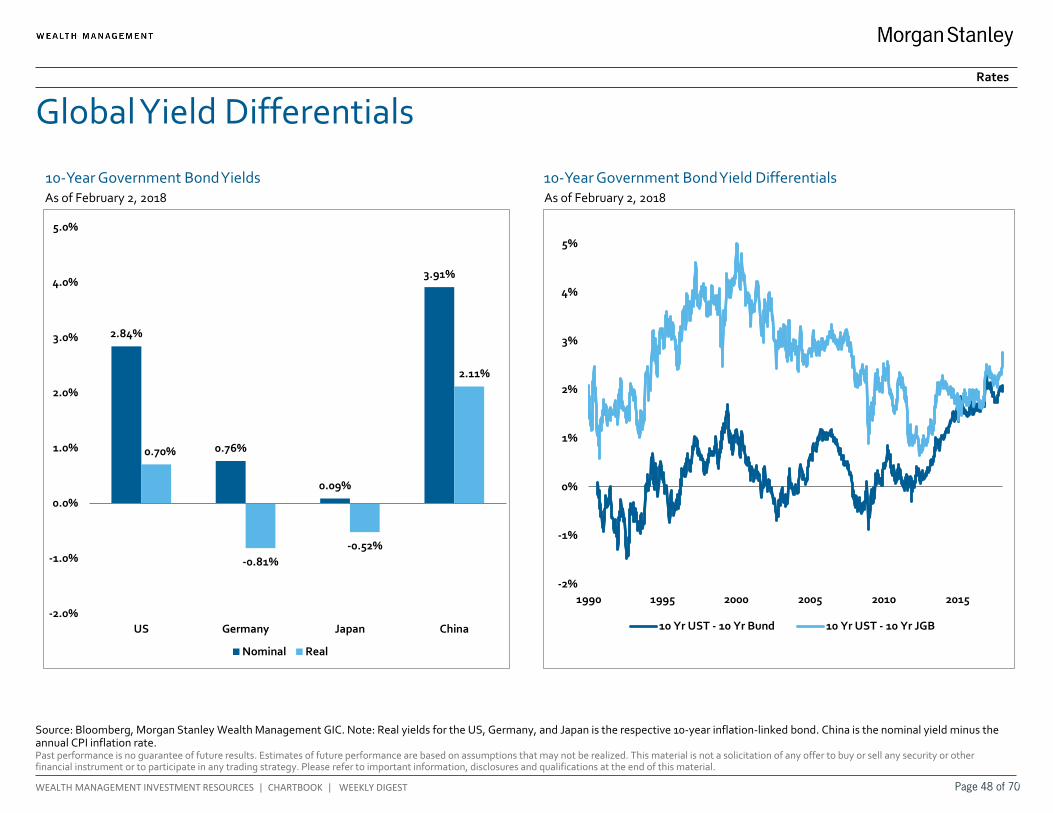
Past performance is no guarantee of future results. Estimates of future performance are based on assumptions that may not be realized. This material is not a solicitation of any offer to buy or sell any security or other financial instrument or to participate in any trading strategy. Please refer to important information, disclosures and qualifications at the end of this material.
WEALTH MANAGEMENT INVESTMENT RESOURCES | CHARTBOOK | WEEKLY DIGEST
-2%
-1%
0%
1%
2%
3%
4%
5%
1990 1995 2000 2005 2010 2015
10 Yr UST - 10 Yr Bund 10 Yr UST - 10 Yr JGB
2.84%
0.76%
0.09%
3.91%
0.70%
-0.81%-0.52%
2.11%
-2.0%
-1.0%
0.0%
1.0%
2.0%
3.0%
4.0%
5.0%
US Germany Japan China
Nominal Real
Global Yield Differentials
Source: Bloomberg, Morgan Stanley Wealth Management GIC. Note: Real yields for the US, Germany, and Japan is the respective 10-year inflation-linked bond. China is the nominal yield minus the annual CPI inflation rate.
10-Year Government Bond Yields 10-Year Government Bond Yield Differentials As of February 2, 2018 As of February 2, 2018
Rates
Page 48 of 70
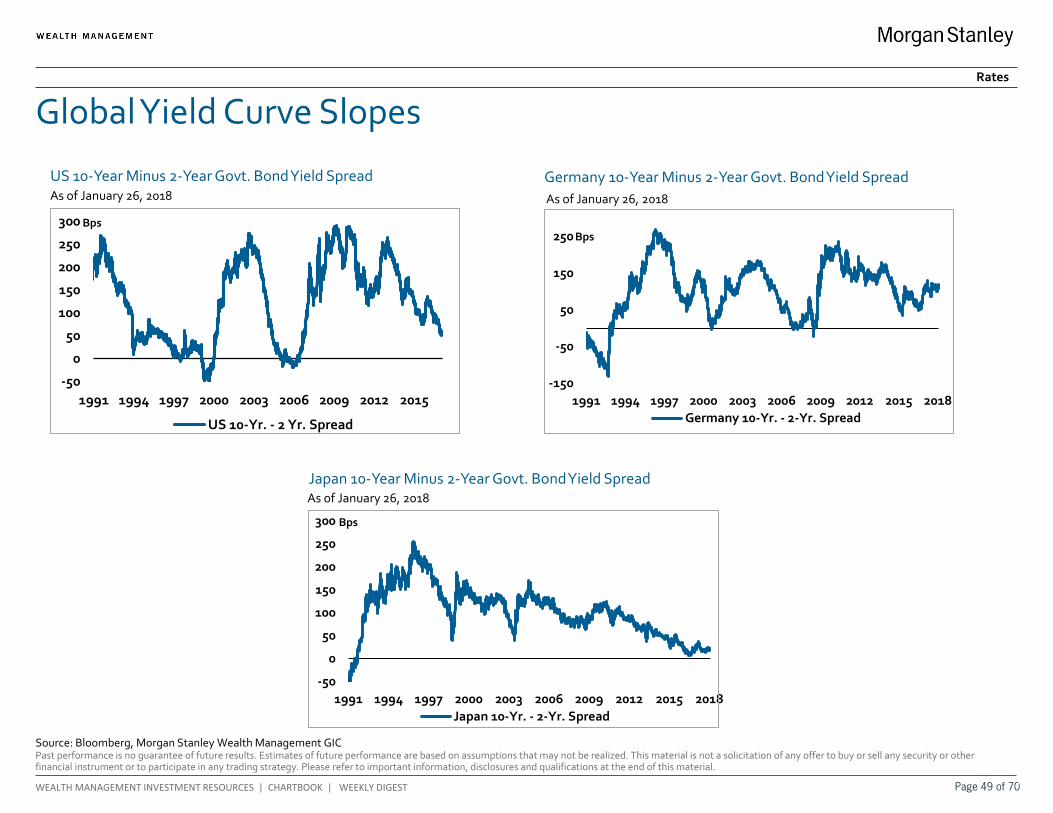
Past performance is no guarantee of future results. Estimates of future performance are based on assumptions that may not be realized. This material is not a solicitation of any offer to buy or sell any security or other financial instrument or to participate in any trading strategy. Please refer to important information, disclosures and qualifications at the end of this material.
WEALTH MANAGEMENT INVESTMENT RESOURCES | CHARTBOOK | WEEKLY DIGEST
-150
-50
50
150
250
1991 1994 1997 2000 2003 2006 2009 2012 2015 2018Germany 10-Yr. - 2-Yr. Spread
-50
0
50
100
150
200
250
300
1991 1994 1997 2000 2003 2006 2009 2012 2015 2018Japan 10-Yr. - 2-Yr. Spread
-50
0
50
100
150
200
250
300
1991 1994 1997 2000 2003 2006 2009 2012 2015
US 10-Yr. - 2 Yr. Spread
US 10-Year Minus 2-Year Govt. Bond Yield Spread
Germany 10-Year Minus 2-Year Govt. Bond Yield Spread
Japan 10-Year Minus 2-Year Govt. Bond Yield Spread
Global Yield Curve Slopes
Source: Bloomberg, Morgan Stanley Wealth Management GIC
Bps Bps
Bps
As of January 26, 2018
As of January 26, 2018
As of January 26, 2018
Rates
Page 49 of 70
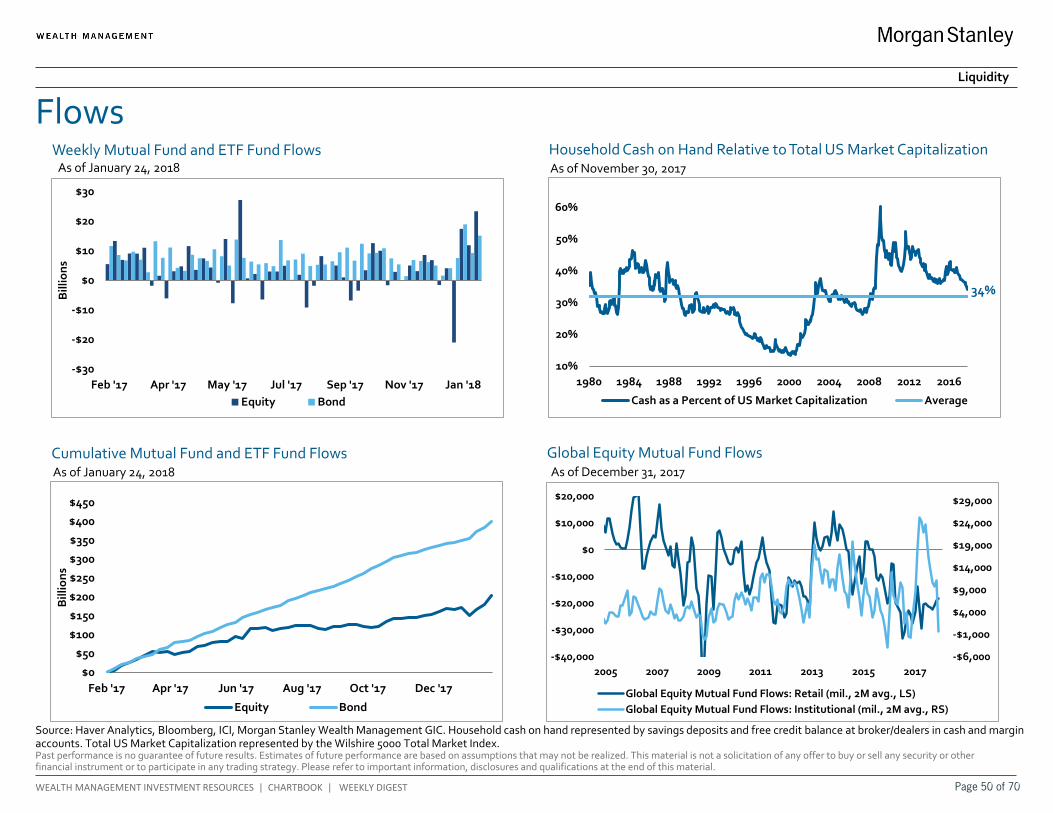
Past performance is no guarantee of future results. Estimates of future performance are based on assumptions that may not be realized. This material is not a solicitation of any offer to buy or sell any security or other financial instrument or to participate in any trading strategy. Please refer to important information, disclosures and qualifications at the end of this material.
WEALTH MANAGEMENT INVESTMENT RESOURCES | CHARTBOOK | WEEKLY DIGEST
-$30
-$20
-$10
$0
$10
$20
$30
Feb '17 Apr '17 May '17 Jul '17 Sep '17 Nov '17 Jan '18
Bill
ions
Equity Bond
-$6,000
-$1,000
$4,000
$9,000
$14,000
$19,000
$24,000
$29,000
-$40,000
-$30,000
-$20,000
-$10,000
$0
$10,000
$20,000
2005 2007 2009 2011 2013 2015 2017
Global Equity Mutual Fund Flows: Retail (mil., 2M avg., LS)Global Equity Mutual Fund Flows: Institutional (mil., 2M avg., RS)
Source: Haver Analytics, Bloomberg, ICI, Morgan Stanley Wealth Management GIC. Household cash on hand represented by savings deposits and free credit balance at broker/dealers in cash and margin accounts. Total US Market Capitalization represented by the Wilshire 5000 Total Market Index.
Flows Liquidity
Weekly Mutual Fund and ETF Fund Flows Household Cash on Hand Relative to Total US Market Capitalization
Global Equity Mutual Fund Flows
$0
$50
$100
$150
$200
$250
$300
$350
$400
$450
Feb '17 Apr '17 Jun '17 Aug '17 Oct '17 Dec '17
Bill
ions
Equity Bond
Cumulative Mutual Fund and ETF Fund Flows
As of January 24, 2018 As of November 30, 2017
As of January 24, 2018 As of December 31, 2017
34%
10%
20%
30%
40%
50%
60%
1980 1984 1988 1992 1996 2000 2004 2008 2012 2016
Cash as a Percent of US Market Capitalization Average
Page 50 of 70

Past performance is no guarantee of future results. Estimates of future performance are based on assumptions that may not be realized. This material is not a solicitation of any offer to buy or sell any security or other financial instrument or to participate in any trading strategy. Please refer to important information, disclosures and qualifications at the end of this material.
WEALTH MANAGEMENT INVESTMENT RESOURCES | CHARTBOOK | WEEKLY DIGEST
Tech Bubble
Financial Crisis
Feb 2, 2018
20-Year Average
Current Relative
to
Trailing P/E 28.9 12.1 22.5 19.5 1.15
Forward P/E 26.6 11.2 17.5 16.0 1.09
Trailing Normalized P/E 48.7 11.9 29.7 26.6 1.12
Shiller P/E 43.2 14.1 33.6 27.0 1.25
P/B 5.0 1.6 3.4 2.9 1.15
EV/EBITDA 16.5 9.0 13.6 10.6 1.29
Trailing PEG NA 1.0 1.6 1.4 1.13
Forward PEG NA 1.0 1.4 1.3 1.07
P/OCF 19.4 6.5 14.8 11.6 1.28
P/FCF 41.6 12.1 22.8 22.4 1.02
EV/Sales 3.0 1.4 2.7 1.9 1.44
S&P 500 in WTI Terms 55.7 16.4 42.2 32.4 1.30
S&P 500 in Gold Terms 5.4 0.8 2.1 2.3 0.89
Equity Risk Premium (bps) -225 588 287 282 1.02
0
5
10
15
20
25
30
35
1965 1970 1975 1980 1985 1990 1995 2000 2005 2010 2015
Overvalued (+1 Std Dev)
Median = 16.7
Undervalued (-1 Std Dev)
Expensive (+2 Std Dev)
Cheap (-2 Std Dev)
22.5
S&P 500 Current and Historical Valuation
Source: Bloomberg, FactSet, Morgan Stanley Wealth Management GIC. Tech Bubble data is 3/31/2000, Financial Crisis data is 2/28/2009. Trailing and Forward price-earnings to growth (PEG) ratio uses 10-year average. The Shiller P/E ratio, also known as the cyclically adjusted P/E ratio, uses a 10-year average of inflation-adjusted earnings to value the stock market. Equity risk premium is the excess return that an individual stock or the overall stock market provides over a risk-free rate. The risk-free rate represents the interest an investor would expect from an absolutely risk-free investment over a specified period of time. Standard deviation (volatility) is a measure of the dispersion of a set of data from its mean.
As of February 2, 2018
S&P 500 Trailing Price/Earnings Ratio with Historical Median
S&P 500 Current and Historical Valuation
As of February 2, 2018
Valuation
Page 51 of 70
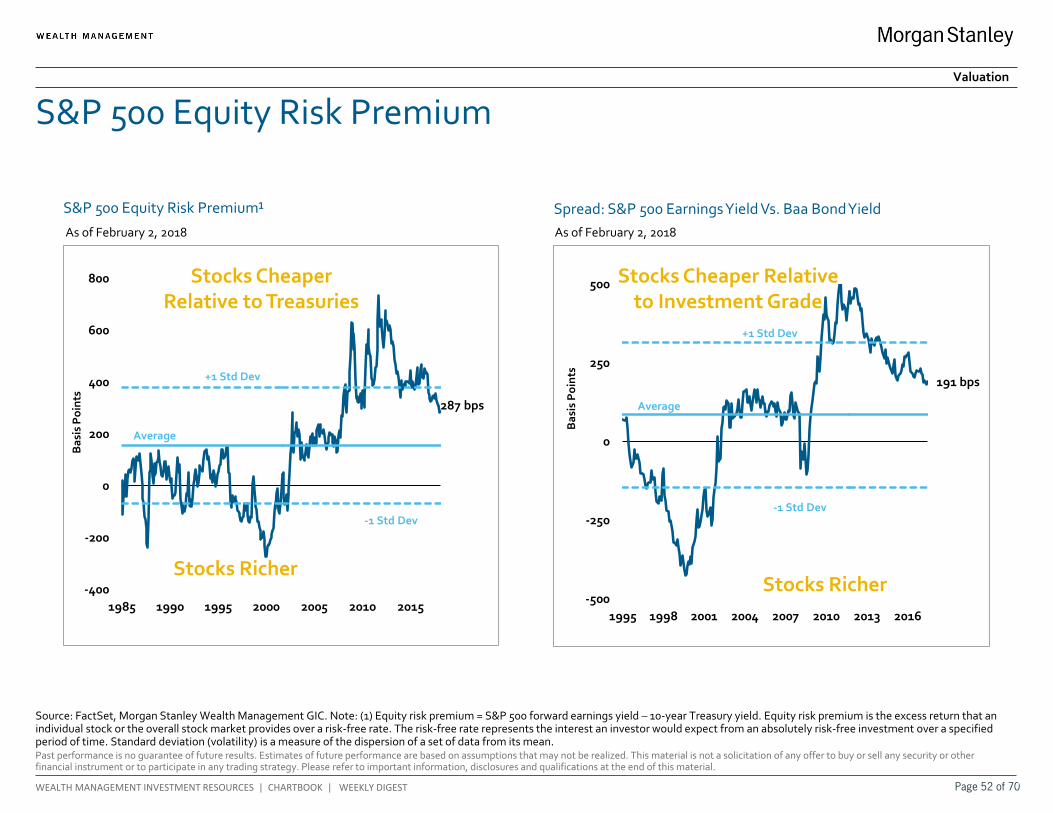
Past performance is no guarantee of future results. Estimates of future performance are based on assumptions that may not be realized. This material is not a solicitation of any offer to buy or sell any security or other financial instrument or to participate in any trading strategy. Please refer to important information, disclosures and qualifications at the end of this material.
WEALTH MANAGEMENT INVESTMENT RESOURCES | CHARTBOOK | WEEKLY DIGEST
287 bps
-400
-200
0
200
400
600
800
1985 1990 1995 2000 2005 2010 2015
Bas
is P
oint
s
+1 Std Dev
Average
-1 Std Dev
191 bps
-500
-250
0
250
500
1995 1998 2001 2004 2007 2010 2013 2016
Bas
is P
oint
s
+1 Std Dev
-1 Std Dev
Average
S&P 500 Equity Risk Premium
Source: FactSet, Morgan Stanley Wealth Management GIC. Note: (1) Equity risk premium = S&P 500 forward earnings yield – 10-year Treasury yield. Equity risk premium is the excess return that an individual stock or the overall stock market provides over a risk-free rate. The risk-free rate represents the interest an investor would expect from an absolutely risk-free investment over a specified period of time. Standard deviation (volatility) is a measure of the dispersion of a set of data from its mean.
S&P 500 Equity Risk Premium¹
Spread: S&P 500 Earnings Yield Vs. Baa Bond Yield
Stocks Cheaper Relative to Treasuries
Stocks Richer
Stocks Cheaper Relative to Investment Grade
Stocks Richer
As of February 2, 2018 As of February 2, 2018
Valuation
Page 52 of 70

Past performance is no guarantee of future results. Estimates of future performance are based on assumptions that may not be realized. This material is not a solicitation of any offer to buy or sell any security or other financial instrument or to participate in any trading strategy. Please refer to important information, disclosures and qualifications at the end of this material.
WEALTH MANAGEMENT INVESTMENT RESOURCES | CHARTBOOK | WEEKLY DIGEST
Interest Rate-Adjusted Shiller P/E Ratio
Source: Haver Analytics, Morgan Stanley Wealth Management GIC. The Shiller P/E ratio, also known as the cyclically adjusted P/E ratio, uses a 10-year average of inflation-adjusted earnings to value the stock market. This Shiller P/E Ratio was calculated using the after-tax earnings in the National Income and Product Accounts (NIPA) report published by the Bureau of Economic Analysis.
US Rate-Adjusted Shiller P/E Valuation
0x
5x
10x
15x
20x
25x
30x
35x
40x
45x
1926 1932 1938 1945 1951 1957 1964 1970 1976 1983 1989 1995 2002 2008 2014
Rate-Adjusted Shiller P/E Ratio Shiller P/E Ratio
As of January 31, 2018
Page 53 of 70

Past performance is no guarantee of future results. Estimates of future performance are based on assumptions that may not be realized. This material is not a solicitation of any offer to buy or sell any security or other financial instrument or to participate in any trading strategy. Please refer to important information, disclosures and qualifications at the end of this material.
WEALTH MANAGEMENT INVESTMENT RESOURCES | CHARTBOOK | WEEKLY DIGEST
500
1,000
1,500
2,000
2,500
3,000
3,500
4,000
2000 2004 2008 2012 2016 2020 2024
S&P 500 Projected S&P 500 Based on CAPE, Moved Ahead 10 Yrs.
EE0
500
1,000
1,500
2,000
2,500
3,000
3,500
4,000
1993 1995 1997 1999 2001 2003 2005 2007 2009 2011 2013 2015 2017
S&P 500 Index Fair Value S&P 500 Index
S&P 500 “Fair Value” Metrics
Source: Bloomberg, Haver Analytics, Robert Shiller, Morgan Stanley Wealth Management GIC. Note: (1) Fair value model is S&P 500 estimated earnings per share divided by Moody’s Baa bond yield. The Shiller P/E ratio, also known as the cyclically adjusted P/E ratio, uses a 10-year average of inflation-adjusted earnings to value the stock market.
S&P 500 Fair Value Model1 Projected S&P 500 Based on Shiller P/E Model (CAPE) As of February 2, 2018 As of December 31, 2017
Valuation
Overvalued
Undervalued
S&P 500 at 2,778
Page 54 of 70

Past performance is no guarantee of future results. Estimates of future performance are based on assumptions that may not be realized. This material is not a solicitation of any offer to buy or sell any security or other financial instrument or to participate in any trading strategy. Please refer to important information, disclosures and qualifications at the end of this material.
WEALTH MANAGEMENT INVESTMENT RESOURCES | CHARTBOOK | WEEKLY DIGEST
25
50
100
200
1983 1991 1999 2007 2015
Log
Scal
e
Real Price of Crude (WTI Crude/Gold)
3/31/1983 = 10010
100
1000
1927 1935 1943 1951 1959 1967 1975 1983 1991 1999 2007 2015
Log
Scal
e
S&P 500 in Gold Price Terms
12/31/1927 = 100
S&P 500 and WTI Crude Oil in Real (Gold) Terms
Source: FactSet, Morgan Stanley Wealth Management GIC. Spot = current price level. S&P 500 in gold price terms calculated by dividing the S&P 500 Index level by the spot price of gold.
Real Price of S&P 500 in Gold Price Terms Real Price of Crude (WTI Crude/Gold) As of February 2, 2018 As of February 2, 2018
Valuation
Page 55 of 70
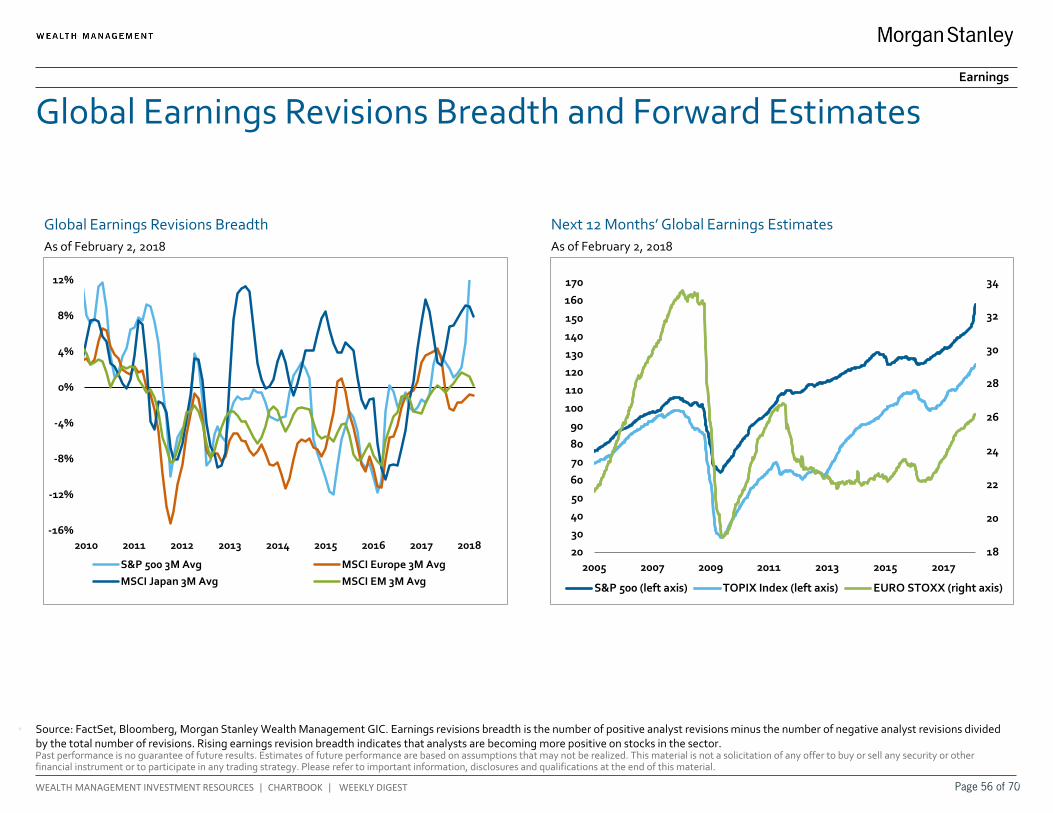
Past performance is no guarantee of future results. Estimates of future performance are based on assumptions that may not be realized. This material is not a solicitation of any offer to buy or sell any security or other financial instrument or to participate in any trading strategy. Please refer to important information, disclosures and qualifications at the end of this material.
WEALTH MANAGEMENT INVESTMENT RESOURCES | CHARTBOOK | WEEKLY DIGEST
-16%
-12%
-8%
-4%
0%
4%
8%
12%
2010 2011 2012 2013 2014 2015 2016 2017 2018
S&P 500 3M Avg MSCI Europe 3M AvgMSCI Japan 3M Avg MSCI EM 3M Avg
18
20
22
24
26
28
30
32
34
20
30
40
50
60
70
80
90
100
110
120
130
140
150
160
170
2005 2007 2009 2011 2013 2015 2017
S&P 500 (left axis) TOPIX Index (left axis) EURO STOXX (right axis)
Global Earnings Revisions Breadth
Next 12 Months’ Global Earnings Estimates
• Source: FactSet, Bloomberg, Morgan Stanley Wealth Management GIC. Earnings revisions breadth is the number of positive analyst revisions minus the number of negative analyst revisions divided by the total number of revisions. Rising earnings revision breadth indicates that analysts are becoming more positive on stocks in the sector.
Global Earnings Revisions Breadth and Forward Estimates
As of February 2, 2018 As of February 2, 2018
Earnings
Page 56 of 70
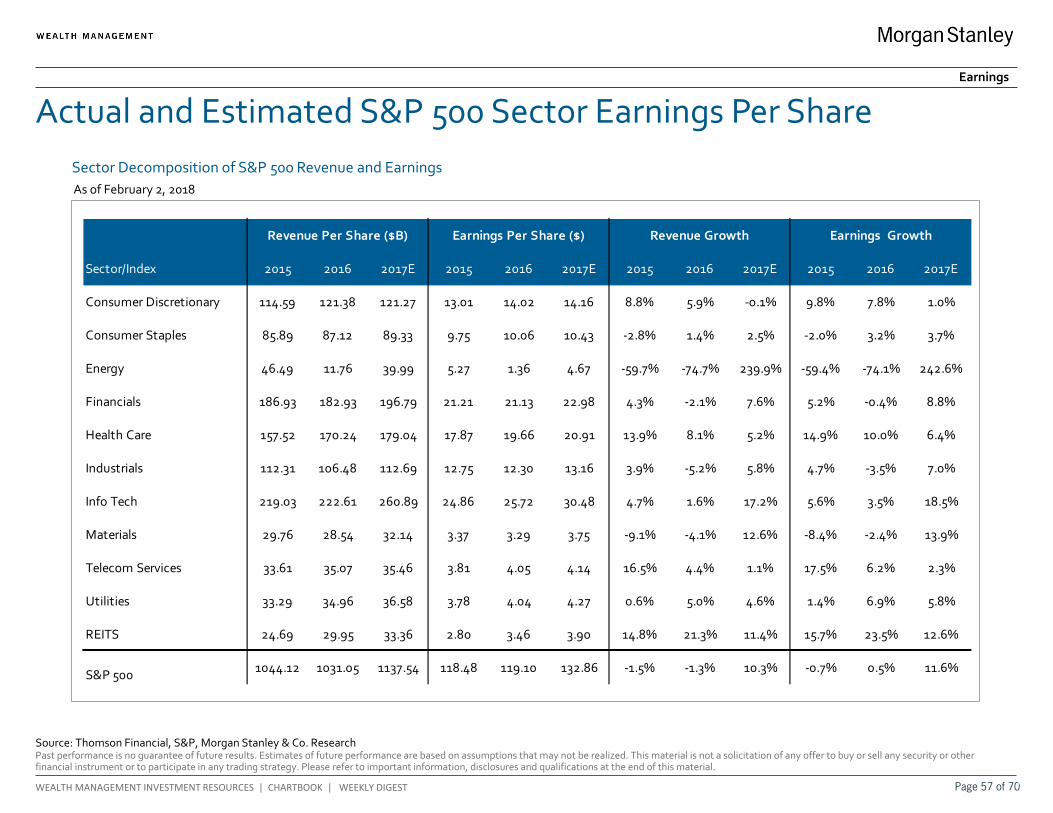
Past performance is no guarantee of future results. Estimates of future performance are based on assumptions that may not be realized. This material is not a solicitation of any offer to buy or sell any security or other financial instrument or to participate in any trading strategy. Please refer to important information, disclosures and qualifications at the end of this material.
WEALTH MANAGEMENT INVESTMENT RESOURCES | CHARTBOOK | WEEKLY DIGEST
Sector Decomposition of S&P 500 Revenue and Earnings
Source: Thomson Financial, S&P, Morgan Stanley & Co. Research
Actual and Estimated S&P 500 Sector Earnings Per Share Earnings
As of February 2, 2018
Sector/Index 2015 2016 2017E 2015 2016 2017E 2015 2016 2017E 2015 2016 2017E
Consumer Discretionary 114.59 121.38 121.27 13.01 14.02 14.16 8.8% 5.9% -0.1% 9.8% 7.8% 1.0%
Consumer Staples 85.89 87.12 89.33 9.75 10.06 10.43 -2.8% 1.4% 2.5% -2.0% 3.2% 3.7%
Energy 46.49 11.76 39.99 5.27 1.36 4.67 -59.7% -74.7% 239.9% -59.4% -74.1% 242.6%
Financials 186.93 182.93 196.79 21.21 21.13 22.98 4.3% -2.1% 7.6% 5.2% -0.4% 8.8%
Health Care 157.52 170.24 179.04 17.87 19.66 20.91 13.9% 8.1% 5.2% 14.9% 10.0% 6.4%
Industrials 112.31 106.48 112.69 12.75 12.30 13.16 3.9% -5.2% 5.8% 4.7% -3.5% 7.0%
Info Tech 219.03 222.61 260.89 24.86 25.72 30.48 4.7% 1.6% 17.2% 5.6% 3.5% 18.5%
Materials 29.76 28.54 32.14 3.37 3.29 3.75 -9.1% -4.1% 12.6% -8.4% -2.4% 13.9%
Telecom Services 33.61 35.07 35.46 3.81 4.05 4.14 16.5% 4.4% 1.1% 17.5% 6.2% 2.3%
Utilities 33.29 34.96 36.58 3.78 4.04 4.27 0.6% 5.0% 4.6% 1.4% 6.9% 5.8%
REITS 24.69 29.95 33.36 2.80 3.46 3.90 14.8% 21.3% 11.4% 15.7% 23.5% 12.6%
S&P 500 1044.12 1031.05 1137.54 118.48 119.10 132.86 -1.5% -1.3% 10.3% -0.7% 0.5% 11.6%
Revenue Per Share ($B) Earnings GrowthRevenue GrowthEarnings Per Share ($)
Page 57 of 70

Past performance is no guarantee of future results. Estimates of future performance are based on assumptions that may not be realized. This material is not a solicitation of any offer to buy or sell any security or other financial instrument or to participate in any trading strategy. Please refer to important information, disclosures and qualifications at the end of this material.
WEALTH MANAGEMENT INVESTMENT RESOURCES | CHARTBOOK | WEEKLY DIGEST
16.0%
-5%
0%
5%
10%
15%
20%
1Q14
2Q14
3Q14
4Q14
1Q15
2Q15
3Q15
4Q15
1Q16
2Q16
3Q16
4Q16
1Q17
2Q17
3Q17
4Q17
E1Q
18E
2Q18
E3Q
18E
4Q18
E
S&P 500 Ex-Energy Y/Y EPS Growth
16.7%
-10%-5%0%5%
10%15%20%25%
1Q14
2Q14
3Q14
4Q14
1Q15
2Q15
3Q15
4Q15
1Q16
2Q16
3Q16
4Q16
1Q17
2Q17
3Q17
4Q17
E1Q
18E
2Q18
E3Q
18E
4Q18
E
S&P 500 Y/Y EPS Growth
13.7%
0%
5%
10%
15%
1Q14
2Q14
3Q14
4Q14
1Q15
2Q15
3Q15
4Q15
1Q16
2Q16
3Q16
4Q16
1Q17
2Q17
3Q17
4Q17
E1Q
18E
2Q18
E3Q
18E
4Q18
ES&P 500 Ex-Energy and Financials Y/Y EPS Growth
S&P 500
S&P 500 Ex-Energy
Source: Thomson Financial, S&P, Morgan Stanley & Co. Research
S&P 500 Ex-Energy and Financials
Actual and Estimated S&P 500 Earnings Per Share Growth Earnings
As of February 2, 2018 As of February 2, 2018
As of February 2, 2018
Page 58 of 70

Past performance is no guarantee of future results. Estimates of future performance are based on assumptions that may not be realized. This material is not a solicitation of any offer to buy or sell any security or other financial instrument or to participate in any trading strategy. Please refer to important information, disclosures and qualifications at the end of this material.
WEALTH MANAGEMENT INVESTMENT RESOURCES | CHARTBOOK | WEEKLY DIGEST
Sector/Index Current Two Wks Ago End of 3Q Start of 2017Chg. Vs.
Two Wks AgoChg. Vs.
End of 3QChg. Vs.
Start of 2017Consumer Discretionary 1.5% 1.8% -2.2% 4.7% -0.3% 3.7% -3.2%
Consumer Staples 5.3% 3.9% 1.5% 7.3% 1.5% 3.9% -2.0%
Energy 135.3% 134.4% 158.8% 218.6% 0.9% -23.5% -83.3%
Financials 14.6% 13.9% -9.3% 5.9% 0.7% 23.9% 8.8%
Health Care 5.7% 3.8% 6.7% 8.6% 1.9% -1.0% -2.9%
Industrials 6.8% 4.6% 10.8% 7.1% 2.2% -4.0% -0.3%
Info Tech 18.8% 16.5% 21.7% 9.6% 2.3% -2.8% 9.2%
Materials 31.5% 23.8% 4.2% 3.8% 7.7% 27.2% 27.6%
Telecom 8.0% -0.3% -0.5% 2.9% 8.3% 8.5% 5.1%
Utilities 10.8% 11.4% -2.5% -1.8% -0.6% 13.3% 12.6%
Real Estate 9.6% 9.3% 14.2% 7.2% 0.3% -4.6% 2.4%
S&P 500 13.6% 11.8% 7.6% 10.0% 1.7% 6.0% 3.6%
Sector/Index Current Two Wks Ago End of 3Q Start of 2017Chg. Vs.
Two Wks AgoChg. Vs.
End of 3QChg. Vs.
2016Consumer Discretionary 1.0% 1.1% 1.7% 6.4% -0.1% -0.6% -5.4%
Consumer Staples 3.7% 3.3% 3.2% 8.2% 0.4% 0.5% -4.5%
Energy 242.6% 242.2% 236.6% 292.2% 0.4% 6.0% -49.6%
Financials 8.8% 8.6% 8.8% 11.7% 0.2% 0.0% -2.9%
Health Care 6.4% 5.9% 5.8% 8.0% 0.5% 0.6% -1.6%
Industrials 7.0% 6.5% 6.3% 6.4% 0.6% 0.7% 0.6%
Info Tech 18.5% 17.8% 17.4% 11.5% 0.7% 1.1% 7.0%
Materials 13.9% 12.3% 12.1% 13.8% 1.6% 1.8% 0.2%
Telecom 2.3% 0.4% 0.3% 4.2% 1.9% 2.0% -2.0%
Utilities 5.8% 5.9% 6.0% 2.2% -0.1% -0.2% 3.6%
Real Estate 12.6% 12.5% 12.5% 9.5% 0.1% 0.2% 3.1%
S&P 500 11.6% 11.1% 11.0% 12.2% 0.5% 0.6% -0.7%
S&P 500 4Q 2017 Y/Y EPS Growth Estimates and Revisions
S&P 500 2017 Y/Y EPS Growth Estimates and Revisions
Source: Thomson Financial, S&P, Morgan Stanley & Co. Research
S&P 500 Sector EPS Growth Estimates and Revisions As of February 2, 2018
Earnings
Page 59 of 70

Past performance is no guarantee of future results. Estimates of future performance are based on assumptions that may not be realized. This material is not a solicitation of any offer to buy or sell any security or other financial instrument or to participate in any trading strategy. Please refer to important information, disclosures and qualifications at the end of this material.
WEALTH MANAGEMENT INVESTMENT RESOURCES | CHARTBOOK | WEEKLY DIGEST
S&P 500 Sector Earnings Revisions Breadth Earnings
• Earnings revisions breadth is the number of positive analyst revisions minus the number of negative analyst revisions divided by the total number of revisions.
• Rising earnings revision breadth indicates that analysts are becoming more positive on stocks in the sector.
As of February 2, 2018 (Weekly)
Source: FactSet, Morgan Stanley Wealth Management GIC
-100%-75%-50%-25%
0%25%50%75%
2000 2002 2004 2006 2008 2010 2012 2014 2016Consumer Discretionary
-60%
-40%
-20%
0%
20%
40%
2000 2002 2004 2006 2008 2010 2012 2014 2016Consumer Staples
-100%-75%-50%-25%
0%25%50%75%
100%
2000 2002 2004 2006 2008 2010 2012 2014 2016Energy
-100%-75%-50%-25%
0%25%50%75%
2000 2002 2004 2006 2008 2010 2012 2014 2016Financials
-40%
-20%
0%
20%
40%
60%
2000 2002 2004 2006 2008 2010 2012 2014 2016Health Care
-100%-75%-50%-25%
0%25%50%75%
2000 2002 2004 2006 2008 2010 2012 2014 2016Information Technology
-100%-75%-50%-25%
0%25%50%75%
2000 2002 2004 2006 2008 2010 2012 2014 2016Materials
-75%-50%-25%
0%25%50%75%
2000 2002 2004 2006 2008 2010 2012 2014 2016Telecommunication Services
-100%-75%-50%-25%
0%25%50%75%
2000 2002 2004 2006 2008 2010 2012 2014 2016Industrials
-80%-60%-40%-20%
0%20%40%
2000 2002 2004 2006 2008 2010 2012 2014 2016Utilities
-80%-60%-40%-20%
0%20%40%
2002 2004 2006 2008 2010 2012 2014 2016Real Estate
Page 60 of 70
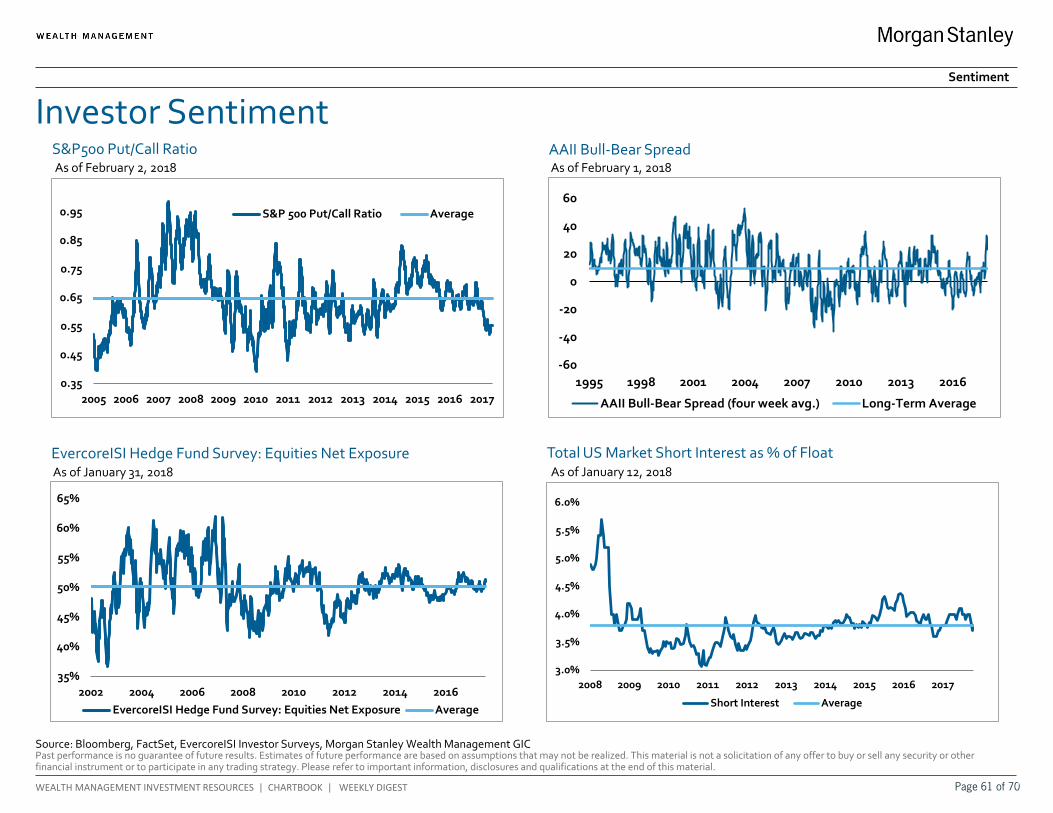
Past performance is no guarantee of future results. Estimates of future performance are based on assumptions that may not be realized. This material is not a solicitation of any offer to buy or sell any security or other financial instrument or to participate in any trading strategy. Please refer to important information, disclosures and qualifications at the end of this material.
WEALTH MANAGEMENT INVESTMENT RESOURCES | CHARTBOOK | WEEKLY DIGEST
3.0%
3.5%
4.0%
4.5%
5.0%
5.5%
6.0%
2008 2009 2010 2011 2012 2013 2014 2015 2016 2017
Short Interest Average
Investor Sentiment Sentiment
S&P500 Put/Call Ratio
Source: Bloomberg, FactSet, EvercoreISI Investor Surveys, Morgan Stanley Wealth Management GIC
0.35
0.45
0.55
0.65
0.75
0.85
0.95
2005 2006 2007 2008 2009 2010 2011 2012 2013 2014 2015 2016 2017
S&P 500 Put/Call Ratio Average
-60
-40
-20
0
20
40
60
1995 1998 2001 2004 2007 2010 2013 2016
AAII Bull-Bear Spread (four week avg.) Long-Term Average
Total US Market Short Interest as % of Float
35%
40%
45%
50%
55%
60%
65%
2002 2004 2006 2008 2010 2012 2014 2016EvercoreISI Hedge Fund Survey: Equities Net Exposure Average
EvercoreISI Hedge Fund Survey: Equities Net Exposure
As of February 2, 2018
As of January 31, 2018 As of January 12, 2018
AAII Bull-Bear Spread As of February 1, 2018
Page 61 of 70
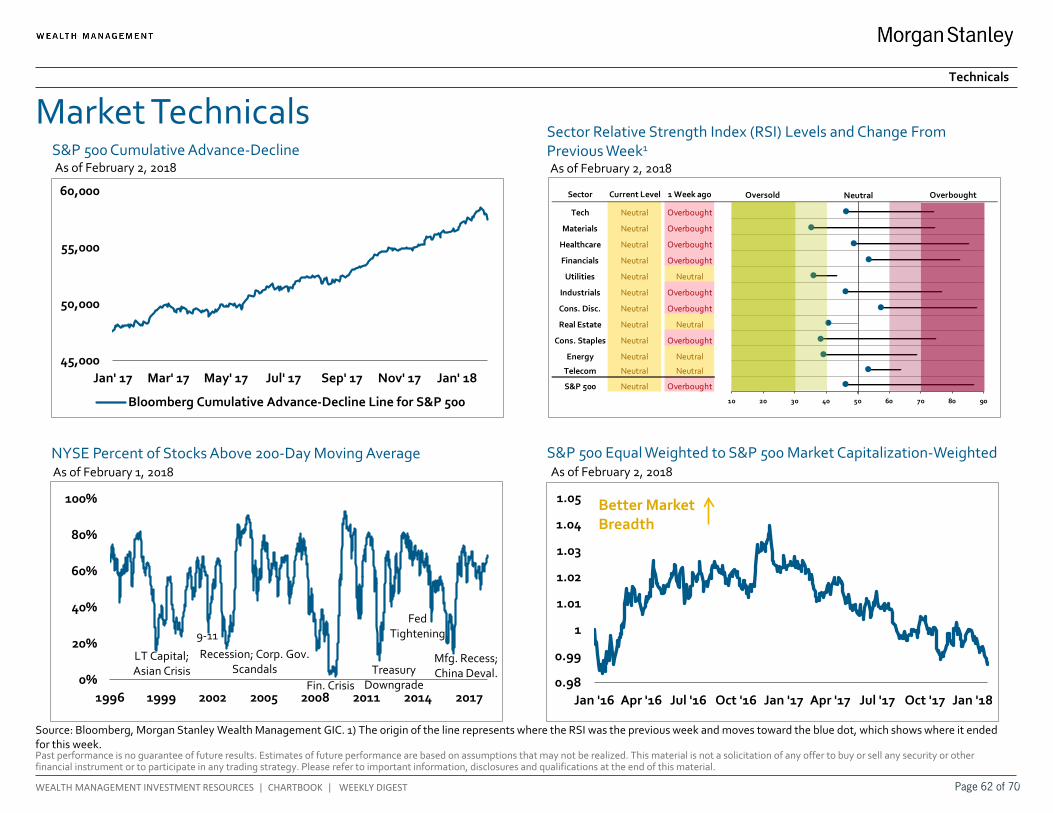
Past performance is no guarantee of future results. Estimates of future performance are based on assumptions that may not be realized. This material is not a solicitation of any offer to buy or sell any security or other financial instrument or to participate in any trading strategy. Please refer to important information, disclosures and qualifications at the end of this material.
WEALTH MANAGEMENT INVESTMENT RESOURCES | CHARTBOOK | WEEKLY DIGEST
Sector Current Level 1 Week ago
Tech Neutral Overbought
Materials Neutral Overbought
Healthcare Neutral Overbought
Financials Neutral Overbought
Utilities Neutral Neutral
Industrials Neutral Overbought
Cons. Disc. Neutral Overbought
Real Estate Neutral Neutral
Cons. Staples Neutral Overbought
Energy Neutral Neutral
Telecom Neutral Neutral
S&P 500 Neutral Overbought
10 20 30 40 50 60 70 80 90
10 20 30 40 50 60 70 80 90
10 20 30 40 50 60 70 80 90
10 20 30 40 50 60 70 80 90
10 20 30 40 50 60 70 80 90
10 20 30 40 50 60 70 80 90
10 20 30 40 50 60 70 80 90
10 20 30 40 50 60 70 80 90
10 20 30 40 50 60 70 80 90
10 20 30 40 50 60 70 80 90
10 20 30 40 50 60 70 80 90
10 20 30 40 50 60 70 80 90
Oversold Neutral Overbought
Market Technicals Technicals
S&P 500 Cumulative Advance-Decline
Sector Relative Strength Index (RSI) Levels and Change From Previous Week1
Source: Bloomberg, Morgan Stanley Wealth Management GIC. 1) The origin of the line represents where the RSI was the previous week and moves toward the blue dot, which shows where it ended for this week.
45,000
50,000
55,000
60,000
Jan' 17 Mar' 17 May' 17 Jul' 17 Sep' 17 Nov' 17 Jan' 18
Bloomberg Cumulative Advance-Decline Line for S&P 500
0.98
0.99
1
1.01
1.02
1.03
1.04
1.05
Jan '16 Apr '16 Jul '16 Oct '16 Jan '17 Apr '17 Jul '17 Oct '17 Jan '18
S&P 500 Equal Weighted to S&P 500 Market Capitalization-Weighted
0%
20%
40%
60%
80%
100%
1996 1999 2002 2005 2008 2011 2014 2017
LT Capital; Asian Crisis
9-11
Recession; Corp. Gov. Scandals
Fin. CrisisTreasury
Downgrade
Fed Tightening
Mfg. Recess;China Deval.
NYSE Percent of Stocks Above 200-Day Moving Average
As of February 2, 2018 As of February 2, 2018
As of February 1, 2018 As of February 2, 2018
Better Market Breadth
Page 62 of 70

Past performance is no guarantee of future results. Estimates of future performance are based on assumptions that may not be realized. This material is not a solicitation of any offer to buy or sell any security or other financial instrument or to participate in any trading strategy. Please refer to important information, disclosures and qualifications at the end of this material.
WEALTH MANAGEMENT INVESTMENT RESOURCES | CHARTBOOK | WEEKLY DIGEST
Morgan Stanley & Co. Key Market Forecasts
Bear Base BullEquities
S&P 500 2,822 2,300 2,750 3,000MSCI Europe 1,624 1,180 1,700 1,960Topix 1,870 1,190 1,820 2,240MSCI EM 1,249 740 1,185 1,420
FXUSD/JPY 109.4 94.5 105.0 110.3EUR/USD 1.25 1.11 1.17 1.23GBP/USD 1.43 1.12 1.24 1.30AUD/USD 0.80 0.60 0.67 0.70USD/INR 64.0 64.5 66.00 68.0USD/ZAR 11.9 11.5 13.0 14.5USD/BRL 3.17 2.90 3.25 3.80
Rates (%)US Treasury 10-Year 2.79 3.25 1.95 1.25German Bund 10-Year 0.72 1.05 0.50 0.40UK Gilt 10-Year 1.53 2.75 1.55 1.00Japanese Govt. Bond 10-Year 0.10 0.45 0.20 0.03
Credit Spreads (bps)US Investment Grade 89 195 140 83US High Yield 346 840 554 328EUR Investment Grade 32 70 50 30EM Sovereign 289 500 370 260US CMBS 71 125 85 65
CommoditiesBrent Crude Oil (spot) 66 65 72.5 83
Q4 2018 ForecastAs of February 1, 2018
Source: Bloomberg, FactSet, Morgan Stanley & Co, Morgan Stanley Wealth Management GIC, The Yield Book® Software and Services. © 2018 Citigroup Index LLC. All rights reserved.
As of February 1, 2018
Forecasts
Page 63 of 70

Morgan Stanley Wealth Management is the trade name of Morgan Stanley Smith Barney LLC, a registered broker-dealer in the United States.
The sole purpose of this material is to inform, and it in no way is intended to be an offer or solicitation to purchase or sell any security, other investment or service, or to attract any funds or deposits . Investments mentioned may not be suitable for all clients. Any product discussed herein may be purchased only after a client has carefully reviewed the offering memorandum and executed the subscription documents. Morgan Stanley Wealth Management has not considered the actual or desired investment objectives, goals, strategies, guidelines, or factual circumstances of any investor in any fund(s). Before making any investment, each investor should carefully consider the risks associated with the investment, as discussed in the applicable offering memorandum, and make a determination based upon their own particular circumstances, that the investment is consistent with their investment objectives and risk tolerance . Morgan Stanley Smith Barney LLC offers investment program services through a variety of investment programs, which are opened pursuant to written client agreements. Each program offers investment managers, funds and features that are not available in other programs; conversely, some investment managers, funds or investment strategies may be available in more than one program.
Morgan Stanley’s investment advisory programs may require a minimum asset level and, depending on your specific investment objectives and financial position, may not be suitable for you . Please see the Morgan Stanley Smith Barney LLC program disclosure brochure (the “Morgan Stanley ADV”) for more information in the investment advisory programs available. The Morgan Stanley ADV is available at www.morganstanley.com/ADV. Sources of Data. Information in this material in this report has been obtained from sources that we believe to be reliable, but we do not guarantee its accuracy, completeness or timeliness. Third-party data providers make no warranties or representations relating to the accuracy, completeness or timeliness of the data they provide and are not liable for any damages relating to this data. All opinions included in this material constitute the Firm’s judgment as of the date of this material and are subject to change without notice . This material was not prepared by the research departments of Morgan Stanley & Co. LLC or Morgan Stanley Smith Barney LLC. Some historical figures may be revised due to newly identified programs, firm restatements, etc.
Global Investment Manager Analysis (GIMA) Focus List, Approved List and Tactical Opportunities List; Watch Policy. GIMA uses two methods to evaluate investment products in applicable advisory programs: Focus (and investment products meeting this standard are described as being on the Focus List) and Approved (and investment products meeting this standard are described as being on the Approved List). In general, Focus entails a more thorough evaluation of an investment product than Approved. Sometimes an investment product may be evaluated using the Focus List process but then placed on the Approved List instead of the Focus List. Investment products may move from the Focus List to the Approved List, or vice versa. GIMA may also determine that an investment product no longer meets the criteria under either process and will no longer be recommended in investment advisory programs (in which case the investment product is given a “Not Approved” status). GIMA has a ‘Watch” policy and may describe a Focus List or Approved List investment product as being on “Watch” if GIMA identifies specific areas that (a) merit further evaluation by GIMA and (b) may, but are not certain to, result in the investment product becoming “Not Approved.” The Watch period depends on the length of time needed for GIMA to conduct its evaluation and for the investment manager or fund to address any concerns. Certain investment products on either the Focus List or Approved List may also be recommended for the Tactical Opportunities List based in part on tactical opportunities existing at a given time. The investment products on the Tactical Opportunities List change over time. For more information on the Focus List, Approved List, Tactical Opportunities List and Watch processes, please see the applicable Form ADV Disclosure Document for Morgan Stanley Wealth Management . Your Financial Advisor or Private Wealth Advisor can also provide upon request a copy of a publication entitled “Manager Selection Process.”
The Global Investment Committee is a group of seasoned investment professionals who meet regularly to discuss the global economy and markets. The committee determines the investment outlook that guides our advice to clients. They continually monitor developing economic and market conditions, review tactical outlooks and recommend model portfolio weightings, as well as produce a suite of strategy, analysis, commentary, portfolio positioning suggestions and other reports and broadcasts.
The GIC Asset Allocation Models are not available to be directly implemented as part of an investment advisory service and should not be regarded as a recommendation of any Morgan Stanley investment advisory service. The GIC Asset Allocation Models do not represent actual trading or any type of account or any type of investment strategies and none of the fees or other expenses (e .g. commissions, mark-ups, mark-downs, advisory fees, fund expenses) associated with actual trading or accounts are reflected in the GIC Asset Allocation Models which, when compounded over a period of years, would decrease returns.
The Global Investment Manager Analysis (GIMA) Services Only Apply to Certain Investment Advisory Programs GIMA evaluates certain investment products for the purposes of some – but not all – of Morgan Stanley Smith Barney LLC’s investment advisory programs (as described in more detail in the applicable Form ADV Disclosure Document for Morgan Stanley Wealth Management). If you do not invest through one of these investment advisory programs, Morgan Stanley Wealth Management is not obligated to provide you notice of any GIMA Status changes even though it may give notice to clients in other programs.
Strategy May Be Available as a Separately Managed Account or Mutual Fund Strategies are sometimes available in Morgan Stanley Wealth Management investment advisory programs both in the
DISCLOSURESPage 64 of 70

form of a separately managed account (“SMA”) and a mutual fund. These may have different expenses and investment minimums. Your Financial Advisor or Private Wealth Advisor can provide more information on whether any particular strategy is available in more than one form in a particular investment advisory program. In most Morgan Stanley Wealth Management investment advisory accounts, fees are deducted quarterly and have a compounding effect on performance. For example, on an advisory account with a 3% annual fee, if the gross annual performance is 6.00%, the compounding effect of the fees will result in a net performance of approximately 3.93% after one year, 1 after three years, and 21.23% after five years. Conflicts of Interest: GIMA’s goal is to provide professional, objective evaluations in support of the Morgan Stanley Wealth Management investment advisory programs. We have policies and procedures to help us meet this goal. However, our business is subject to various conflicts of interest. For example, ideas and suggestions for which investment products should be evaluated by GIMA come from a variety of sources, including our Morgan Stanley Wealth Management Financial Advisors and their direct or indirect managers, and other business persons within Morgan Stanley Wealth Management or its affiliates . Such persons may have an ongoing business relationship with certain investment managers or mutual fund companies whereby they, Morgan Stanley Wealth Management or its affiliates receive compensation from, or otherwise related to, those investment managers or mutual funds. For example, a Financial Advisor may suggest that GIMA evaluates an investment manager or fund in which a portion of his or her clients’ assets are already invested. While such a recommendation is permissible, GIMA is responsible for the opinions expressed by GIMA. See the conflicts of interest section in the applicable Form ADV Disclosure Document for Morgan Stanley Wealth Management for a discussion of other types of conflicts that may be relevant to GIMA’s evaluation of managers and funds. In addition, Morgan Stanley Wealth Management, MS & Co., managers and their affiliates provide a variety of services (including research, brokerage, asset management, trading, lending and investment banking services) for each other and for various clients, including issuers of securities that may be recommended for purchase or sale by clients or are otherwise held in client accounts, and managers in various advisory programs. Morgan Stanley Wealth Management, managers, MS & Co., and their affiliates receive compensation and fees in connection with these services. Morgan Stanley Wealth Management believes that the nature and range of clients to which such services are rendered is such that it would be inadvisable to exclude categorically all of these companies from an account .
Consider Your Own Investment Needs: The model portfolios and strategies discussed in the material are formulated based on general client characteristics including risk tolerance . This material is not intended to be a client-specific suitability analysis or recommendation, or offer to participate in any investment. Therefore, clients should not use this profile as the sole basis for investment decisions. They should consider all relevant information, including their existing portfolio, investment objectives, risk tolerance, liquidity needs and investment time horizon . Such a suitability determination may lead to asset allocation results that are materially different from the asset allocation shown in this profile. Talk to your Financial Advisor about what would be a suitable asset allocation for you, whether CGCM is a suitable program for you.
No obligation to notify – Morgan Stanley Wealth Management has no obligation to notify you when the model portfolios, strategies, or any other information, in this material changes .
Please consider the investment objectives, risks, fees, and charges and expenses of mutual funds, ETFs, closed end funds, unit investment trusts, and variable insurance products carefully before investing. The prospectus contains this and other information about each fund. To obtain a prospectus, contact your Financial Advisor or Private Wealth Advisor or visit the Morgan Stanley website at www.morganstanley.com. Please read it carefully before investing.
An investment in a money market fund is not insured or guaranteed by the Federal Deposit Insurance Corporation or any other government agency. Although the Fund seeks to preserve the value of your investment at $1.00 per share, it is possible to lose money by investing in the fund.
The type of mutual funds and ETFs discussed in this presentation utilizes nontraditional or complex investment strategies and /or derivatives. Examples of these types of funds include those that utilize one or more of the below noted investment strategies or categories or which seek exposure to the following markets: (1) commodities (e .g., agricultural, energy and metals), currency, precious metals; (2) managed futures; (3) leveraged, inverse or inverse leveraged; (4) bear market, hedging, long-short equity, market neutral; (5) real estate; (6) volatility (seeking exposure to the CBOE VIX Index). Investors should keep in mind that while mutual funds and ETFs may, at times, utilize nontraditional investment options and strategies, they should not be equated with unregistered privately offered alternative investments. Because of regulatory limitations, mutual funds and ETFs that seek alternative-like investment exposure must utilize a more limited investment universe. As a result, investment returns and portfolio characteristics of alternative mutual funds and ETFs may vary from traditional hedge funds pursuing similar investment objectives. Moreover, traditional hedge funds have limited liquidity with long “lock-up” periods allowing them to pursue investment strategies without having to factor in the need to meet client redemptions and ETFs trade on an exchange . On the other hand, mutual funds typically must meet daily client redemptions. This differing liquidity profile can have a material impact on the investment returns generated by a mutual or ETF pursuing an alternative investing strategy compared with a traditional hedge fund pursuing the same strategy.
Nontraditional investment options and strategies are often employed by a portfolio manager to further a fund’s investment objective and to help offset market risks . However, these features may be complex, making it more difficult to understand the fund’s essential characteristics and risks, and how it will perform in different market environments and over various periods of time . They may also expose the fund to increased volatility and unanticipated risks particularly when used in complex combinations and/or accompanied by the use of borrowing or “leverage.”
DISCLOSURESPage 65 of 70

KEY ASSET CLASS CONSIDERATIONS AND OTHER RISKS
Investing in the markets entails the risk of market volatility. The value of all types of investments, including stocks, mutual funds, exchange-traded funds (“ETFs”), closed-end funds, and unit investment trusts, may increase or decrease over varying time periods. To the extent the investments depicted herein represent international securities, you should be aware that there may be additional risks associated with international investing, including foreign economic, political, monetary and/or legal factors, changing currency exchange rates, foreign taxes, and differences in financial and accounting standards. These risks may be magnified in emerging markets and frontier markets. Small- and mid-capitalization companies may lack the financial resources, product diversification and competitive strengths of larger companies. In addition, the securities of small- and mid-capitalization companies may not trade as readily as, and be subject to higher volatility than, those of larger, more established companies. The value of fixed income securities will fluctuate and, upon a sale, may be worth more or less than their original cost or maturity value. Bonds are subject to interest rate risk, call risk, reinvestment risk, liquidity risk, and credit risk of the issuer. High yield bonds are subject to additional risks such as increased risk of default and greater volatility because of the lower credit quality of the issues. In the case of municipal bonds, income is generally exempt from federal income taxes. Some income may be subject to state and local taxes and to the federal alternative minimum tax. Capital gains, if any, are subject to tax. Treasury Inflation Protection Securities’ (TIPS) coupon payments and underlying principal are automatically increased to compensate for inflation by tracking the consumer price index (CPI). While the real rate of return is guaranteed, TIPS tend to offer a low return . Because the return of TIPS is linked to inflation, TIPS may significantly underperform versus conventional U.S. Treasuries in times of low inflation. There is no guarantee that investors will receive par if TIPS are sold prior to maturity. The returns on a portfolio consisting primarily of environmental, social, and governance-aware investments (“ESG”) may be lower or higher than a portfolio that is more diversified or where decisions are based solely on investment considerations. Because ESG criteria exclude some investments, investors may not be able to take advantage of the same opportunities or market trends as investors that do not use such criteria. The companies identified and investment examples are for illustrative purposes only and should not be deemed a recommendation to purchase, hold or sell any securities or investment products. They are intended to demonstrate the approaches taken by managers who focus on ESG criteria in their investment strategy. There can be no guarantee that a client's account will be managed as described herein. Options and margin trading involve substantial risk and are not suitable for all investors. Besides the general investment risk of holding securities that may decline in value and the possible loss of principal invested, closed-end funds may have additional risks related to declining market prices relative to net asset values (NAVs), active manager underperformance and potential leverage. Closed-end funds, unlike open-end funds, are not continuously offered. There is a one-time public offering and once issued, shares of closed-end funds are sold in the open market through a stock exchange. NAV is total assets less total liabilities divided by the number of shares outstanding. At the time an investor purchases shares of a closed-end fund, shares may have a market price that is above or below NAV. Portfolios that invest a large percentage of assets in only one industry sector (or in only a few sectors) are more vulnerable to price fluctuation than those that diversify among a broad range of sectors.
Alternative investments often are speculative and include a high degree of risk. Investors could lose all or a substantial amount of their investment. Alternative investments are suitable only for eligible, long-term investors who are willing to forgo liquidity and put capital at risk for an indefinite period of time. They may be highly illiquid and can engage in leverage and other speculative practices that may increase the volatility and risk of loss. Alternative Investments typically have higher fees than traditional investments. Investors should carefully review and consider potential risks before investing. Certain of these risks may include but are not limited to: Loss of all or a substantial portion of the investment due to leveraging, short-selling, or other speculative practices; Lack of liquidity in that there may be no secondary market for a fund; Volatility of returns; Restrictions on transferring interests in a fund; Potential lack of diversification and resulting higher risk due to concentration of trading authority when a single advisor is utilized; Absence of information regarding valuations and pricing; Complex tax structures and delays in tax reporting; Less regulation and higher fees than mutual funds; and Risks associated with the operations, personnel, and processes of the manager . As a diversified global financial services firm, Morgan Stanley Wealth Management engages in a broad spectrum of activities including financial advisory services, investment management activities, sponsoring and managing private investment funds, engaging in broker -dealer transactions and principal securities, commodities and foreign exchange transactions, research publication, and other activities . In the ordinary course of its business, Morgan Stanley Wealth Management therefore engages in activities where Morgan Stanley Wealth Management’s interests may conflict with the interests of its clients, including the private investment funds it manages . Morgan Stanley Wealth Management can give no assurance that conflicts of interest will be resolved in favor of its clients or any such fund. All expressions of opinion are subject to change without notice and are not intended to be a forecast of future events or results. Further, opinions regarding Alternative Investments expressed herein may differ from the opinions expressed by Morgan Stanley Wealth Management and/or other businesses/affiliates of Morgan Stanley Wealth Management. This is not a "research report" as defined by NASD Conduct Rule 2711 and was not prepared by the Research Departments of Morgan Stanley Smith Barney LLC or Morgan Stanley & Co. LLC or its affiliates. Certain information contained herein may constitute forward-looking statements. Due to various risks and uncertainties, actual events, results or the performance of a fund may differ materially from those reflected or contemplated in such forward-looking statements. Clients should carefully consider the investment objectives, risks, charges, and expenses of a fund before investing. While the HFRI indices are frequently used, they have limitations (some of which are typical of other widely used indices). These limitations include survivorship bias (the returns of the indices may not be representative of all the hedge funds in the universe because of the tendency of lower performing funds to leave the index); heterogeneity (not all hedge funds are alike or comparable to one another, and the index may not accurately reflect the performance of a described style); and limited data (many hedge funds do not report to indices, and the index may omit funds, the inclusion of which might significantly affect the performance shown . The HFRI indices are based on information self-reported by hedge fund managers that decide on their own, at any time, whether or not they want to provide, or continue to provide, information to HFR Asset Management, L .L.C. Results for funds that go out of business are included in the index until the date that they cease operations . Therefore, these indices may not be complete or accurate representations of the hedge fund
DISCLOSURESPage 66 of 70

universe, and may be biased in several ways. Composite index results are shown for illustrative purposes and do not represent the performance of a specific investment. Individual funds have specific tax risks related to their investment programs that will vary from fund to fund. Clients should consult their own tax and legal advisors as Morgan Stanley Wealth Management does not provide tax or legal advice. Interests in alternative investment products are offered pursuant to the terms of the applicable offering memorandum, are distributed by Morgan Stanley Smith Barney LLC and certain of its affiliates, and (1) are not FDIC-insured, (2) are not deposits or other obligations of Morgan Stanley or any of its affiliates, (3) are not guaranteed by Morgan Stanley and its affiliates, and (4) involve investment risks, including possible loss of principal. Morgan Stanley Smith Barney LLC is a registered broker-dealer, not a bank. This material is not to be reproduced or distributed to any other persons (other than professional advisors of the investors or prospective investors, as applicable, receiving this material) and is intended solely for the use of the persons to whom it has been delivered . This material is not for distribution to the general public. Past performance is no guarantee of future results. Actual results may vary. SIPC insurance does not apply to precious metals, other commodities, or traditional alternative investments. Interests in alternative investment products are offered pursuant to the terms of the applicable offering memorandum, are distributed by Morgan Stanley Smith Barney LLC and certain of its affiliates, and (1) are not FDIC-insured, (2) are not deposits or other obligations of Morgan Stanley or any of its affiliates, (3) are not guaranteed by Morgan Stanley and its affiliates, and (4) involve investment risks, including possible loss of principal. Morgan Stanley Smith Barney LLC is a registered broker-dealer, not a bank. In Consulting Group’s advisory programs, alternative investments are limited to US-registered mutual funds, separate account strategies and exchange-traded funds (ETFs) that seek to pursue alternative investment strategies or returns utilizing publicly traded securities. Investment products in this category may employ various investment strategies and techniques for both hedging and more speculative purposes such as short-selling, leverage, derivatives and options, which can increase volatility and the risk of investment loss. Alternative investments are not suitable for all investors. As a diversified global financial services firm, Morgan Stanley Wealth Management engages in a broad spectrum of activities including financial advisory services, investment management activities, sponsoring and managing private investment funds, engaging in broker-dealer transactions and principal securities, commodities and foreign exchange transactions, research publication, and other activities . In the ordinary course of its business, Morgan Stanley Wealth Management therefore engages in activities where Morgan Stanley Wealth Management’s interests may conflict with the interests of its clients, including the private investment funds it manages. Morgan Stanley Wealth Management can give no assurance that conflicts of interest will be resolved in favor of its clients or any such fund. Alternative investments involve complex tax structures, tax inefficient investing, and delays in distributing important tax information . Individual funds have specific risks related to their investment programs that will vary from fund to fund. Clients should consult their own tax and legal advisors as Morgan Stanley Wealth Management does not provide tax or legal advice.
While the HFRI indices are frequently used, they have limitations (some of which are typical of other widely used indices). These limitations include survivorship bias (the returns of the indices may not be representative of all the hedge funds in the universe because of the tendency of lower performing funds to leave the index); heterogeneity (not all hedge funds are alike or comparable to one another, and the index may not accurately reflect the performance of a described style); and limited data (many hedge funds do not report to indices, and the index may omit funds, the inclusion of which might significantly affect the performance shown. The HFRI indices are based on information self-reported by hedge fund managers that decide on their own, at any time, whether or not they want to provide, or continue to provide, information to HFR Asset Management, L.L.C. Results for funds that go out of business are included in the index until the date that they cease operations . Therefore, these indices may not be complete or accurate representations of the hedge fund universe, and may be biased in several ways .
It should be noted that the majority of hedge fund indexes are comprised of hedge fund manager returns. This is in contrast to traditional indexes, which are comprised of individual securities in the various market segments they represent and offer complete transparency as to membership and construction methodology. As such, some believe that hedge fund index returns have certain biases that are not present in traditional indexes. Some of these biases inflate index performance, while others may skew performance negatively. However, many studies indicate that overall hedge fund index performance has been biased to the upside. Some studies suggest performance has been inflated by up to 260 basis points or more annually depending on the types of biases included and the time period studied. Although there are numerous potential biases that could affect hedge fund returns, we identify some of the more common ones throughout this paper .
Self-selection bias results when certain manager returns are not included in the index returns and may result in performance being skewed up or down . Because hedge funds are private placements, hedge fund managers are able to decide which fund returns they want to report and are able to opt out of reporting to the various databases . Certain hedge fund managers may choose only to report returns for funds with strong returns and opt out of reporting returns for weak performers. Other hedge funds that close may decide to stop reporting in order to retain secrecy, which may cause a downward bias in returns.
Survivorship bias results when certain constituents are removed from an index. This often results from the closure of funds due to poor performance, “blow ups,” or other such events. As such, this bias typically results in performance being skewed higher. As noted, hedge fund index performance biases can result in positive or negative skew. However, it would appear that the skew is more often positive. While it is difficult to quantify the effects precisely, investors should be aware that idiosyncratic factors may be giving hedge fund index returns an artificial “lift” or upwards bias .
Hedge Funds of Funds and many funds of funds are private investment vehicles restricted to certain qualified private and institutional investors. They are often speculative and include a high degree of risk. Investors can lose all or a substantial amount of their investment. They may be highly illiquid, can engage in leverage and other speculative practices that may increase volatility and the risk of loss, and may be subject to large investment minimums and initial lockups. They involve complex tax structures, tax-inefficient investing and delays in distributing important tax information. Categorically,
DISCLOSURESPage 67 of 70

hedge funds and funds of funds have higher fees and expenses than traditional investments, and such fees and expenses can lower the returns achieved by investors . Funds of funds have an additional layer of fees over and above hedge fund fees that will offset returns. An investment in an exchange-traded fund involves risks similar to those of investing in a broadly based portfolio of equity securities traded on an exchange in the relevant securities market, such as market fluctuations caused by such factors as economic and political developments, changes in interest rates and perceived trends in stock and bond prices. An investment in a target date portfolio is subject to the risks attendant to the underlying funds in which it invests, in these portfolios the funds are the Consulting Group Capital Market funds. A target date portfolio is geared to investors who will retire and/or require income at an approximate year. The portfolio is managed to meet the investor’s goals by the pre-established year or “target date.” A target date portfolio will transition its invested assets from a more aggressive portfolio to a more conservative portfolio as the target date draws closer . An investment in the target date portfolio is not guaranteed at any time, including, before or after the target date is reached . Managed futures investments are speculative, involve a high degree of risk, use significant leverage, are generally illiquid, have substantial charges, subject investors to conflicts of interest, and are suitable only for the risk capital portion of an investor’s portfolio . Managed futures investments do not replace equities or bonds but rather may act as a complement in a well diversified portfolio. Managed Futures are complex and not appropriate for all investors. Rebalancing does not protect against a loss in declining financial markets. There may be a potential tax implication with a rebalancing strategy. Asset allocation and diversification do not assure a profit or protect against loss in declining financial markets. Past performance is no guarantee of future results. Actual results may vary.
Tax laws are complex and subject to change. Morgan Stanley Smith Barney LLC (“Morgan Stanley”), its affiliates and Morgan Stanley Financial Advisors and Private Wealth Advisors do not provide tax or legal advice and are not “fiduciaries” (under ERISA, the Internal Revenue Code or otherwise) with respect to the services or activities described herein except as otherwise provided in writing by Morgan Stanley and/or as described at www.morganstanley.com/disclosures/dol. Individuals are encouraged to consult their tax and legal advisors (a) before establishing a retirement plan or account, and (b) regarding any potential tax, ERISA and related consequences of any investments made under such plan or account.
Insurance products are offered in conjunction with Morgan Stanley Smith Barney LLC’s licensed insurance agency affiliates.
Indices are unmanaged. An investor cannot invest directly in an index. They are shown for illustration purposes only and do not show the performance of any specific investment. Reference to an index does not imply that the portfolio will achieve return, volatility or other results similar to the index. The composition of an index may not reflect the manner in which a portfolio is constructed in relation to expected or achieved returns, portfolio guidelines, restrictions, sectors, correlations, concentrations, volatility, or tracking error target, all of which are subject to change over time .
This material is not a financial plan and does not create an investment advisory relationship between you and your Morgan Stanley Financial Advisor. We are not your fiduciary either under the Employee Retirement Income Security Act of 1974 (ERISA) or the Internal Revenue Code of 1986, and any information in this report is not intended to form the primary basis for any investment decision by you, or an investment advice or recommendation for either ERISA or Internal Revenue Code purposes. Morgan Stanley Private Wealth Management will only prepare a financial plan at your specific request using Private Wealth Management approved financial planning signature.
We may act in the capacity of a broker or that of an advisor. As your broker, we are not your fiduciary and our interests may not always be identical to yours. Please consult with your Private Wealth Advisor to discuss our obligations to disclose to you any conflicts we may from time to time have and our duty to act in your best interest. We may be paid both by you and by others who compensate us based on what you buy. Our compensation, including that of your Private Wealth Advisor, may vary by product and over time.
Investment and services offered through Morgan Stanley Private Wealth Management, a division of Morgan Stanley Smith Barney LLC, Member SIPC.
Investment, insurance and annuity products offered through Morgan Stanley Smith Barney LLC are: NOT FDIC INSURED | MAY LOSE VALUE | NOT BANK GUARANTEED | NOT A BANK DEPOSIT | NOT INSURED BY ANY FEDERAL GOVERNMENT AGENCY
For index, indicator and survey definitions referenced in this report please visit the following: http://www.morganstanleyfa.com/public/projectfiles/id.pdf
GLOBAL INVESTMENT COMMITTEE (GIC) ASSET ALLOCATION MODELS: The Asset Allocation Models are created by Morgan Stanley Wealth Management’s GIC.
HYPOTHETICAL MODEL PERFORMANCE (GROSS): Hypothetical model performance results do not reflect the investment or performance of an actual portfolio following a GIC Strategy, but simply reflect actual historical performance of selected indices on a real-time basis over the specified period of time representing the GIC’s strategic and tactical allocations as of the date of this report . The past performance shown here is simulated performance based on benchmark indices, not investment results from an actual portfolio or actual trading. There can be large differences between hypothetical and actual performance results achieved by a particular asset allocation or trading strategy. Hypothetical performance results do not represent actual trading and are generally designed
DISCLOSURESPage 68 of 70

with the benefit of hindsight. Actual performance results of accounts vary due to, for example, market factors (such as liquidity) and client-specific factors (such as investment vehicle selection, timing of contributions and withdrawals, restrictions and rebalancing schedules). Clients would not necessarily have obtained the performance results shown here if they had invested in accordance with any GIC Asset Allocation Model for the periods indicated. Despite the limitations of hypothetical performance, these hypothetical performance results allow clients and Financial Advisors to obtain a sense of the risk/return trade-off of different asset allocation constructs. The hypothetical performance results in this report are calculated using the returns of benchmark indices for the asset classes, and not the returns of securities, fund or other investment products. Models may contain allocations to Hedge Funds, Private Equity and Private Real Estate. The benchmark indices for these asset classes are not issued on a daily basis. When calculating model performance on a day for which no benchmark index data is issued, we have assumed straight line growth between the index levels issued before and after that date.
FEES REDUCE THE PERFORMANCE OF ACTUAL ACCOUNTS: None of the fees or other expenses (e.g. commissions, mark-ups, mark-downs, fees) associated with actual trading or accounts are reflected in the GIC Asset Allocation Models. The GIC Asset Allocation Models and any model performance included in this presentation are intended as educational materials . Were a client to use these models in connection with investing, any investment decisions made would be subject to transaction and other costs which, when compounded over a period of years, would decrease returns . Information regarding Morgan Stanley’s standard advisory fees is available in the Form ADV Part 2, which is available at www.morganstanley.com/adv. The following hypothetical illustrates the compound effect fees have on investment returns: For example, if a portfolio’s annual rate of return is 15% for 5 years and the account pays 50 basis points in fees per annum, the gross cumulative five-year return would be 101.1% and the five-year return net of fees would be 96.8%. Fees and/or expenses would apply to clients who invest in investments in an account based on these asset allocations, and would reduce clients’ returns. The impact of fees and/or expenses can be material.
Variable annuities are long-term investments designed for retirement purposes and may be subject to market fluctuations, investment risk, and possible loss of principal . All guarantees, including optional benefits, are based on the financial strength and claims-paying ability of the issuing insurance company and do not apply to the underlying investment options. Optional riders may not be able to be purchased in combination and are available at an additional cost. Some optional riders must be elected at time of purchase. Optional riders may be subject to specific limitations, restrictions, holding periods, costs, and expenses as specified by the insurance company in the annuity contract. If you are investing in a variable annuity through a tax-advantaged retirement plan such as an IRA, you will get no additional tax advantage from the variable annuity. Under these circumstances, you should only consider buying a variable annuity because of its other features, such as lifetime income payments and death benefits protection. Taxable distributions (and certain deemed distributions) are subject to ordinary income tax and, if taken prior to age 59½, may be subject to a 10% federal income tax penalty. Early withdrawals will reduce the death benefit and cash surrender value.
Equity securities may fluctuate in response to news on companies, industries, market conditions and general economic environment. Ultrashort-term fixed income asset class is comprised of fixed income securities with high quality, very short maturities. They are therefore subject to the risks associated with debt securities such as credit and interest rate risk .
Master Limited Partnerships (MLPs) are limited partnerships or limited liability companies that are taxed as partnerships and whose interests (limited partnership units or limited liability company units) are traded on securities exchanges like shares of common stock. Currently, most MLPs operate in the energy, natural resources or real estate sectors. Investments in MLP interests are subject to the risks generally applicable to companies in the energy and natural resources sectors, including commodity pricing risk, supply and demand risk, depletion risk and exploration risk . Individual MLPs are publicly traded partnerships that have unique risks related to their structure. These include, but are not limited to, their reliance on the capital markets to fund growth, adverse ruling on the current tax treatment of distributions (typically mostly tax deferred), and commodity volume risk. The potential tax benefits from investing in MLPs depend on their being treated as partnerships for federal income tax purposes and, if the MLP is deemed to be a corporation, then its income would be subject to federal taxation at the entity level, reducing the amount of cash available for distribution to the fund which could result in a reduction of the fund’s value. MLPs carry interest rate risk and may underperform in a rising interest rate environment. MLP funds accrue deferred income taxes for future tax liabilities associated with the portion of MLP distributions considered to be a tax -deferred return of capital and for any net operating gains as well as capital appreciation of its investments; this deferred tax liability is reflected in the daily NAV, and, as a result, the MLP fund’s after-tax performance could differ significantly from the underlying assets even if the pre-tax performance is closely tracked.
Investing in commodities entails significant risks. Commodity prices may be affected by a variety of factors at any time, including but not limited to, (i) changes in supply and demand relationships, (ii) governmental programs and policies, (iii) national and international political and economic events, war and terrorist events, (iv) changes in interest and exchange rates, (v) trading activities in commodities and related contracts, (vi) pestilence, technological change and weather, and (vii) the price volatility of a commodity . In addition, the commodities markets are subject to temporary distortions or other disruptions due to various factors, including lack of liquidity, participation of speculators and government intervention . Physical precious metals are non-regulated products. Precious metals are speculative investments, which may experience short-term and long term price volatility. The value of precious metals investments may fluctuate and may appreciate or decline, depending on market conditions. Unlike bonds and stocks, precious metals do not make interest or dividend payments. Therefore, precious metals may not be suitable for investors who require current income. Precious metals are commodities that should be safely stored, which may impose additional costs on the investor .
DISCLOSURESPage 69 of 70
REITs investing risks are similar to those associated with direct investments in real estate: property value fluctuations, lack of liquidity, limited diversification and sensitivity to economic factors such as interest rate changes and market recessions. Risks of private real estate include: illiquidity; a long-term investment horizon with a limited or nonexistent secondary market; lack of transparency; volatility (risk of loss); and leverage. Principal is returned on a monthly basis over the life of a mortgage-backed security. Principal prepayment can significantly affect the monthly income stream and the maturity of any type of MBS, including standard MBS, CMOs and Lottery Bonds. Asset-backed securities generally decrease in value as a result of interest rate increases, but may benefit less than other fixed-income securities from declining interest rates, principally because of prepayments.
Yields are subject to change with economic conditions. Yield is only one factor that should be considered when making an investment decision. Credit ratings are subject to change. Duration, the most commonly used measure of bond risk, quantifies the effect of changes in interest rates on the price of a bond or bond portfolio. The longer the duration, the more sensitive the bond or portfolio would be to changes in interest rates. The majority of $25 and $1000 par preferred securities are “callable” meaning that the issuer may retire the securities at specific prices and dates prior to maturity. Interest/dividend payments on certain preferred issues may be deferred by the issuer for periods of up to 5 to 10 years, depending on the particular issue. The investor would still have income tax liability even though payments would not have been received. Price quoted is per $25 or $1,000 share, unless otherwise specified. Current yield is calculated by multiplying the coupon by par value divided by the market price. The initial interest rate on a floating-rate security may be lower than that of a fixed-rate security of the same maturity because investors expect to receive additional income due to future increases in the floating security’s underlying reference rate. The reference rate could be an index or an interest rate. However, there can be no assurance that the reference rate will increase. Some floating-rate securities may be subject to call risk. The market value of convertible bonds and the underlying common stock(s) will fluctuate and after purchase may be worth more or less than original cost. If sold prior to maturity, investors may receive more or less than their original purchase price or maturity value, depending on market conditions. Callable bonds may be redeemed by the issuer prior to maturity. Additional call features may exist that could affect yield. Some $25 or $1000 par preferred securities are QDI (Qualified Dividend Income) eligible. Information on QDI eligibility is obtained from third party sources. The dividend income on QDI eligible preferreds qualifies for a reduced tax rate. Many traditional ‘dividend paying’ perpetual preferred securities (traditional preferreds with no maturity date) are QDI eligible. In order to qualify for the preferential tax treatment all qualifying preferred securities must be held by investors for a minimum period – 91 days during a 180 day window period, beginning 90 days before the ex-dividend date.
Companies paying dividends can reduce or cut payouts at any time.
Nondiversification: For a portfolio that holds a concentrated or limited number of securities, a decline in the value of these investments would cause the portfolio’s overall value to decline to a greater degree than a less concentrated portfolio. The indices selected by Morgan Stanley Wealth Management to measure performance are representative of broad asset classes. Morgan Stanley Wealth Management retains the right to change representative indices at any time. Because of their narrow focus, sector investments tend to be more volatile than investments that diversify across many sectors and companies.
Growth investing does not guarantee a profit or eliminate risk. The stocks of these companies can have relatively high valuations. Because of these high valuations, an investment in a growth stock can be more risky than an investment in a company with more modest growth expectations. Value investing does not guarantee a profit or eliminate risk. Not all companies whose stocks are considered to be value stocks are able to turn their business around or successfully employ corrective strategies which would result in stock prices that do not rise as initially expected .
Any type of continuous or periodic investment plan does not assure a profit and does not protect against loss in declining markets. Since such a plan involves continuous investment in securities regardless of fluctuating price levels of such securities, the investor should consider his financial ability to continue his purchases through periods of low price levels .
This material is disseminated in the United States of America by Morgan Stanley Smith Barney LLC. Morgan Stanley Wealth Management is not acting as a municipal advisor to any municipal entity or obligated person within the meaning of Section 15B of the Securities Exchange Act (the “Municipal Advisor Rule”) and the opinions or views contained herein are not intended to be, and do not constitute, advice within the meaning of the Municipal Advisor Rule. This material, or any portion thereof, may not be reprinted, sold or redistributed without the written consent of Morgan Stanley Smith Barney LLC.
©2018 Morgan Stanley Smith Barney LLC. Member SIPC.
DISCLOSURESPage 70 of 70