the global diamond business 2014
TRANSCRIPT

The Global Diamond
Business 2014
(For Analysts and Diamond Traders)
Equity Communications
2014 Edition
www.diamondshades.com/diamondreport

Equity Communications 2014
www.diamondshades.com/diamondreport
Contents
page
1. Introduction 1
2. Supply 2
Production Summary 3
2014 Annual Research: Key Findings 3
Kimberley Process Certification Scheme Updates 2013 Data 5
2014 Review of Major Diamond Producers 6
De Beers plus 2013 Production and Sales 6
Rio Tinto Diamonds plus 2013 Production and Sales 8
Dominion Diamond Corporation plus 2013 Production and Sales 9
Alrosa plus 2013 Production and Sales 10
Marange (Zimbabwe) plus 2013 Production and Sales 12
SMC (Catoca) plus 2013 Production and Sales 13
Advanced Major New Projects 14
Gahcho Kue - Canada 14
Renard - Canada 14
Grib - Russia 15
Supply: Supplementary Charts and Tables 16
Supply and Demand Fundamentals 20
What Are Diamonds? 20
Top Ten Diamond Producer Countries 21
Gem Quality Diamonds and Industrial Diamonds 22
Eternal Appeal of Rare Diamonds 23
Rare Diamonds and The Wealthy 25
Exhibits: Diamonds and Luxury 26
Love Markets and Diamonds 29
Supply Outlook 31
What Lies Ahead - Winners and Losers for Next 10 Years 31
Global Exploration Review 32
Discovery of Rich Deposits Fuels Exploration 33
Supply Analysis and Production Forecasts 36
Methodology 36
Global Supply Facts 41
A Review of Contemporary Diamond Production 1994-2013 42
Forecast Diamond Production 46
Trends in Contemporary Production of Diamonds 2000-2013, 2009-2018 48
Global Diamond Production 2009-2013 versus 2014-2018 (ten years) 49
Mines On Their Way Out 57
Replacement Projects and Sources of Additional Supply 58
Diamond Supply: Review of Key Points 59

Equity Communications 2014
www.diamondshades.com/diamondreport
Contents...
page
3. Trade 62
Diamond Markets and Diamond Prices 63
Rough Diamond Markets 63
Formula Used By Expert Diamond Traders To Value Rough Diamonds 63
What Influences Rough Diamond Prices? 65
Polished Diamond Markets 73
Formula Used By Expert Diamond Traders To Value Polished Diamonds 73
What Influences Polished Diamond Prices? 73
Rough Diamond Prices versus Polished Diamond Prices 75
Diamond Trade in International Markets 78
2014 Annual Research: Key Findings 78
International Rough Diamonds Trade 80
Major Rough Diamond Trade Centers 81
Dubai Challenges Antwerp 82
Summary: Global Dynamics of Rough Diamonds Trade 83
International Polished Diamonds Trade 85
Polished Diamonds Trade Shifts East 88
Polished Diamonds Trade Review 90
Polished Diamonds Production and Forecasts 92
Rough Diamonds Processing and Beneficiation 96
Group A Processors versus Group B Processors 98
De Beers Shifts Focus to Southern Africa 100
Beneficiation 102
Shrewd Diamond Processors Adjust to New Realities 103
Diamond Jewelry Manufacturing 106
Bank Finance and Diamond Trade 107
Industry Banks Become Industry Custodians 108
Diamond Industry Finance post-GFC 111
Case Study: India 112
Outlook: Diamond Industry Finance 115
Lab-created Diamonds 118
Lab-created Diamonds versus Natural Diamonds 118
Why the huge fuss about lab-created diamonds in the diamond industry’s pipeline? 120
Trade: Supplementary Tables and Charts 122

Equity Communications 2014
www.diamondshades.com/diamondreport
Contents...
Page
4. Consumption 126
2013 Retail Consumption Review 127
2014 Annual Research: Key Findings 127
Five Key Drivers of Diamond Consumption 134
Economic Growth and Income Growth 136
Global Realignment Of Precious Jewelry Markets 136
Exhibits: India, China And Global Precious Jewelry Consumption 140
Exhibits: Adult Wealth Patterns 143
Availability of Credit (Consumer Finance) 148
How The US Market Has Responded To Polished Diamonds Price Changes 149
Exhibit: Diamond Jewelry Retailing in USA 152
Jewelry Consumption Culture 155
Financial Considerations in Jewelry Consumption 155
Demographics and Marriage Trends 160
Marriage Trends 160
Demographics 164
Luxury Brands Expansion 167
Exhibit: Tiffany and Co - Sales Impact of Stores in Gateway Cities 172
Development of Diamond Consumer Markets 174
Love Occasions Sustain Appeal of Diamonds 174
Progression of Top Three Retail Markets 177
Mainland China 177
Market Penetration 178
Gold Rules In China 179
Anticipated Growth of The Diamond Jewelry Market in China 182
Consumption Patterns 185
India 189
Gold Rules In India 190
Market Penetration and Consumption Patterns 191
USA 195
Bridal-Related Jewelry Sales 197
Future Global Demand For Diamonds 204
How Do We Predict Future Consumer Demand For Diamonds? 204
How Diamonds Are Introduced To New Consumers 207
Why 95% of The World Has Never Seen A Diamond In Real Life 208
How Jewelry Retailers Decide To Sell Diamonds 209
How A Mass-market For Diamonds Is Created 210
Can China Become A Mass-market For Diamond Jewelry? 212
Current State of Global Diamond Jewelry Consumption 214
Growth of Global Diamond Jewelry Sales 215

Equity Communications 2014
www.diamondshades.com/diamondreport
Contents...
Page
5. Special: Investing In Diamonds 227
Trading Diamonds For Profit 228
Analysis Of The Business Of Trading Diamonds 228
Why Diamond Trading Can Be Appealing 231
Exhibit: From Rough Diamond To Polished Diamond 232
Favorable Conditions For Diamond Trading 234
Diamond Industry Fundamentals Understood To Be Positive 237
Exhibit: De Beers Predicts Structural Deficit 237
How To Read Fundamentals Of Supply And Demand 239
Trading In Rough Diamond Markets 239
Trading In Polished Diamond Markets 244
The De Facto Investment Market For Diamonds 245
Accumulation Of Massive Diamond Stocks In The Pipeline 247
Speculators Sense An Opportunity For Great Profit 252
Exhibit: Diamond Industry Experts Say Consumer Demand Will Outpace Supply 254
Trading of Investment Grade Diamonds 262
Diamonds For Investors 262
What Makes A Diamond Rare? 263
Exhibits: Typical Examples Of Investment Grade Diamonds 266
Typical Properties Of Investment Grade Diamonds 269
Most Popular Diamonds For Investment Holdings 269
Typical Valuation Premiums For Investment Grade White Diamonds 270
Investment Funds For Diamonds 270
Annual Returns - Investment Grade Diamonds 271
The Promise Of Investment Grade Diamonds 274
Money Laundering, Tax Evasion and Diamonds 276
Exhibit: International Sentiment On Tax Havens More Negative 277
6. Conclusion 280
7. Supplementary Glossary of Terms 281
8. Index of Charts, Tables and Exhibits 283

Equity Communications 2014
www.diamondshades.com/diamondreport
Catalog of Charts, Tables and Exhibits
Guide to the Global Diamond Industry 2014
Catalog of Charts, Tables and Exhibits
Supply Section Page
Production Summary
2014 Annual Research: Key Findings
Chart 1: World Diamond Production 2004-2018F 4
Chart 2: Primary Producers: Rough Diamond Sales 2009-2013 4
KP Certification Scheme Updates
Chart 3: KP - World Diamond Production by Value 2013 vs 2012 5
Table 1: Diamond Production Value (Countries) US$/carat 2013 vs 2012 5
Supply: Supplementary Tables and Charts
Table 2: World Diamond Production Volume (Leading Producers) 2004-2013 16
Chart 4: Percentage Share of World Diamond Production (Leading Producers) 2009-2013 16
Table 3: Forecast Diamond Production (Diamond Producers) 2009-2018F 17
Table 4: Diamond Producers - Rough Diamond Sales (Value) 2009-2013 18
Chart 5: 2013 Rough Diamond Sales - Diamond Producers 19
Chart 6: Percentage Share of Rough Diamond Sales (Diamond Producers) 2009-2013 19
Supply and Demand Fundamentals
Chart 7: Map - Global Supply of Diamonds (Map of Key Diamond Regions 2013) 20
Table 5: Comparison of DRC and Namibia Diamond Production (2012) 20
Chart 8: 2013 World Diamond Production Volume and Value (Top Ten Producer Countries) 21
Chart 9: Production of Gem Quality, Near-Gem and Industrial Diamonds 2004-2013 22
Eternal Appeal of Rare Diamonds
Exhibit 1: Rare Diamonds Like These Fancy Pink Beauties 23
Exhibit 2: Argyle Red Diamonds 24
Chart 10: Number of Global High Networth Individuals 2010-2013 25
Diamonds and Luxury
Exhibit 3: i-phone 4 Diamond Rose 26
Exhibit 4: Montblanc Meisterstuck Mozart Jewelry "Gold" Fountain Pen 27
Exhibit 5: Mouwad's 637 carat L' Incomparable Diamond Necklace 28
Love Markets and Diamonds
Exhibit 6: Marriage Proposals with Diamond Ring 29
Exhibit 7: Diamond Engagement Ring 29
Exhibit 8: Bride and Groom Wearing Diamond Rings 30

Equity Communications 2014
www.diamondshades.com/diamondreport
Catalog of Charts, Tables and Exhibits...
Supply Section continued… Page
Supply Outlook
Exploration Review
Chart 11: De Beers Exploration Costs 1999-2012 32
Chart 12: De Beers Exploration Ground Holdings 2007-2012 32
Chart 13: Timeline - Discovery of Rich Diamond Deposits 1954 to Present 33
Supply Analysis and Production Forecasts
Global Supply Facts
Table 6: Global Diamond Supply 2013, Region, Territories, Market Share 41
Chart 14: History of Global Diamond Production From Antiquity to 2013 42
Chart 15: Canada Diamond Mines - Life of Mine Years (1995-2040) 43
Chart 16: Global Diamond Reserves 2000-2012 45
Forecast Diamond Production
Table 7: Classification of Producer Countries by Value of Production Footprint 46
Table 8: Market Share of Producer Group (Countries) by Volume and Value 2008-2012 47
Chart 17: Global production of Rough Diamonds (Top Ten Country Rankings) 2001-2013 48
Chart 18: Production Footprint of Gem and Near- Gem Diamonds (Top Ten) 2009-2018F 49
Chart 19: Global Diamond Production Volume (Countries) 2009-2013 versus 2014-2018F 50
Table 9: Global Diamond Production Volume (Countries) 2009-2013 versus 2014-2018F 50
Chart 20: Global Diamond Production Volume (Gem) 2009-2013 versus 2014-2018F 51
Table 10: Global Diamond Production Volume (Gem) 2009-2013 versus 2014-2018F 51
Chart 21: Global Diamond Production Value (Countries) 2009-2013 versus 2014-2018F 52
Table 11: Global Diamond Production Value (Countries) 2009-2013 versus 2014-2018F 52
Chart 22: Canada Diamond Mines - New Lease of Life 54
Chart 23: Sources of Additional Production Capacity for 2013-2018F 58

Equity Communications 2014
www.diamondshades.com/diamondreport
Catalog of Charts, Tables and Exhibits...
Trade Section Page
Diamond Markets and Diamond Prices
Rough Diamond Markets
Chart 24: Rough Diamond Import Prices 2004-2013 67
Chart 25: DTC Price Index 2002-2015F 69
Chart 26: Global Rough Diamonds Trade (Margins for Profitable Trade 2004-2013) 71
Chart 27: Rough Diamond Price Trends 2004-2013 71
Chart 28: Rough Diamond Export Prices 2004-2013 72
Polished Diamond Markets
Chart 29: China Polished Diamond Imports 2007-2013 74
Rough Diamond Prices versus Polished Diamond Prices
Chart 30: Polished and Rough Diamonds Price Index 2004-2013 75
Chart 31: Polished Diamonds Index 2004-2013 76
Diamond Trade in International Markets
Trade Summary: 2014 Annual Research: Key Findings
Chart 32: Global Diamond Trade Turnover 2007-2013 79
Chart 33: Rough and Polished Diamond Indices 2004-2013 79
Rough Diamonds Trade
Chart 34: Value of Rough Diamonds Trade 2004-2013 80
Chart 35: Major Trade Centers - Rough Diamond Trade Volume 2004-2013 81
Chart 36: Major Trade Centers - Rough Diamond Trade Value 2004-2013 81
Table 12: Dubai Challenges Antwerp 82
Chart 37: UAE versus Belgium - Imports of Rough Diamonds 2006-2013 82
Polished Diamonds Trade
Chart 38: Polished Diamonds Trade Turnover 2008-2012 85
Chart 39: Israel Exports of Polished Diamonds Value 1997-2012 86
Chart 40: Israel Exports of Polished Diamonds Volume 1997-2012 86
Chart 41: India Polished Diamonds Trade 2005-2013 87
Table 13: Global Ranking of Polished Diamond Imports 2007-2013 (Top Nine Countries) 88
Chart 42: Israel Net Polished Diamond Exports 2007 versus 2012 89
Chart 43: Belgium Gross Polished Diamond Exports 2007 versus 2012 89
Chart 44: India Polished Diamond Exports 2007 versus 2012 89

Equity Communications 2014
www.diamondshades.com/diamondreport
Catalog of Charts, Tables and Exhibits...
Trade Section continued… Page
Chart 45: Key Trade Centers - Trade Values 2002-2012(Price per Carat Trends) 90
Chart 46: USA Imports of Polished Diamonds 2002-2012 90
Chart 47: USA Exports of Polished Diamonds 2002-2012 90
Polished Diamonds Production and Forecasts
Chart 48: India Rough Diamond Imports 1990-1998 92
Chart 49: Belgium and India Rough Diamond Imports Versus Annual Production (1998-2013) 93
Chart 50: Global Production of Polished Diamonds 1997-2018F 94
Chart 51: Forecast Polished Diamonds Production 2012-2018F 94
Rough Diamonds Processing and Beneficiation
Chart 52: Net Flow of Rough Diamonds Trade - Market Share by Regions 2004-2013 96
Chart 53: Net Rough Diamonds Demand 2004-2013 96
Processing Market Share
Chart 54: Group A Processors Versus Group B Processors 98
Chart 55: De Beers Rough Diamond Sales - Global Versus Southern Africa 2006-2012 100
Chart 56: De Beers Sales in Southern Africa 2006-2011 100
Chart 57: Exports of Polished Diamonds Southern Africa 2009-2012 100
Beneficiation
Exhibit 9: Botswana Beneficiation Drive 2012 102
Exhibit 10: Tiffany and Co - Leading Global Luxury Brand 105
Exhibit 11: Chow Tai Fook - Greater China Focused and Largest Jewelry Company 105
Bank Finance and Diamond Trade
Industry Banks Become Diamond Industry Custodians
Chart 58: Diamond Industry Debt 2001-2011 108
Chart 59: Antwerp Diamond Bank Balance Sheet 1997-2012 110
Chart 60: Antwerp Diamond Bank Profitability 1997-2012 110
Diamond Industry Finance Post GFC
Chart 61: Market Share of Diamond Industry Debt by Trade Centre 2007-2011 112
Chart 62: India International Polished Diamonds Trade 2005-2013 113
Chart 63: India Diamond Industry Debt 2001-2013E 113
Chart 64: Rupee Rough and Polished Diamonds Indices 2004-2013 114
Trade Section: Supplementary Tables
Table 14: Rough Diamonds Supply and Net Flow 2004-2013 (carats) 122
Table 15: Rough Diamonds Supply and Net Flow 2004-2013 (value) 123
Table 16: Rough Diamonds Trade Data 2004-2013 (Production, Rough Diamond Imports and Exports) 124
Table 17: Production of Polished Diamonds 1997-2018F 125
Equity Communications 2014
www.diamondshades.com/diamondreport
Catalog of Charts, Tables and Exhibits...
Consumption Section Page
2013 Retail Consumption Review
2014 Annual Research: Key Findings
Chart 65: Global Retail Sales of Diamond Jewelry 2003-2014F 129
Chart 66: Retail Sales of Diamond Jewelry 2009-2013 (Top Markets and World Regions) 129
Table 18: Retail Sales of Diamond Jewelry 2012 and 2013 (Top Markets and World Regions) 130
Chart 67: 2013 Retail Sales of Diamond Jewelry (Top Markets and World Regions) 130
Chart 68: Retail Sales of Diamond Jewelry Top Markets (2013 versus 2008 Market Share) 131
Chart 69: Average Import Price - Polished Diamonds USA versus Japan 2003-2013 132
Chart 70: Average Polished Diamond Import Prices -Top Trade Markets (2002-2012) 132
Five Key Drivers of Diamond Consumption
Table 19: The Three Main Subdivisions of Retail Diamond Jewelry Consumption 134
Table 20: Changing First World Consumer 137
Table 21: Retail Forecast Next Five Years - Selected World Regions (Y-o-Y) 138
Special Exhibits: India, China and Global Precious Jewelry Consumption
Exhibit 12: Precious Metals Consumption in Jewelry (Top Markets) 1998-2002, 2011-2013 140
Exhibit 13: Global Production of Polished Diamonds 140
Exhibit 14: Gold Consumption in Jewelry (Top Markets) 1998-2002 Average, 2011-2013 141
Exhibit 15: Platinum Consumption in Jewelry (Top Markets) 1998-2002 Average, 2011-2013 141
Exhibit 16: Silver Consumption in Jewelry (Top Markets) 1998-2002 Average, 2011-2013 142
Exhibit 17: Polished Diamond Consumer Preferences in Leading Markets 142
Special Exhibits: Adult Wealth Patterns
Exhibit 18: Global Adult Wealth Pattern 2010-2013 143
Exhibit 19: China's Adult Wealth Pattern 2010-2013 144
Exhibit 20: Europe's Adult Wealth Pattern 2010-2013 145
Exhibit 21: North America's Adult Wealth Pattern 2010-2013 145
Exhibit 22: India's Adult Wealth Pattern 2010-2013 146
Exhibit 23: Global High-Networth Individuals 2010-2013 147
Availability of Credit (Consumer Finance)
Chart 71: Polished Diamonds Index versus Other Precious Jewelry Indices 2004-2013 148
Chart 72: USA Polished Diamonds Trade 1990-2012 149
Chart 73: USA Imports of Polished diamonds 2002-2012 150
Chart 74: USA Jewelry Stores Absorb Commodities Cost Increases 2002-2013 151
Chart 75: Number of Jewelry Store Establishments in USA 1998-2011 151
Exhibit 24: Jewelry Retailing In USA (Sterling Jewelers) 152
Chart 76: Chow Tai Fook Revenue by Geography 2012-2014 153
Chart 77: Chow Tai Fook POS Network 2012-2014 154

Equity Communications 2014
www.diamondshades.com/diamondreport
Catalog of Charts, Tables and Exhibits...
Consumption Section continued… Page
Jewelry Consumption Culture
Chart 78: Two Types of Markets for Precious Jewelry Consumption (World Map) 155
Table 22: Typical Margins for Gold Jewelry in India 156
Table 23: Typical Margins for Precious Jewelry Products in China 157
Table 24: Typical Margins for Precious Jewelry Products in EU 157
Demographics and Marriage Trends
Chart 79: Diamond Jewelry Consumption Breakdown (Top Markets) 160
Chart 80: Crude Marriage Rates for Selected Territories 1970-2011 161
Chart 81: Number of Registered Marriages for Selected Territories 1990-2012 161
Chart 82: Age at First Marriage USA 1970-2012 162
Chart 83: Age at First Marriage Selected Countries (1980 versus 2010) 163
Chart 84: Crude Birth Rate for Selected Territories 1950-2030 164
Chart 85: Japan Diamond Jewelry Sales 1991-2013 165
Chart 86: Japan imports of Polished Diamonds 1991-2013 165
Chart 87: Japan and USA Comparison of Polished Diamond Import Trends 1991-2013 165
Chart 88: Major Jewelry Consumption Markets, Population Ages 0 to 14 (1970-2012) 166
Luxury Brands Expansion
Chart 89: Total Wealth for Regions and Selected Countries 2000-2013 167
Chart 90: Share of World Wealth for Regions and Selected Countries 2000-2013 167
Chart 91: Tiffany and Co Retail Locations 2003-2013 168
Table 25: Luxury Retail Brands versus Regular Diamond Jewelry Retailers 170
Exhibit 25: Tiffany and Co - Sales Impacts of Stores Located in Gateway Cities 172
Development of Diamond Consumer markets
Love Occasions Sustain Appeal of Diamond
Chart 92: Diamond Jewelry Consumption Breakdown (Top Markets) 174
Chart 93: "Have you ever considered diamonds specifically as an investment?" 175
Table 26: "How important are the following criteria when deciding from which store to buy" 175
Progression of Top Three Retail Diamond Markets
Mainland China
Chart 94: Mainland China Diamond Jewelry Sales 2003-2013 177
Chart 95: Hong Kong Diamond Jewelry Sales 2003-2013 177
Chart 96: Chow Tai Fook Revenue by Product Category 2012-2014 179
Chart 97: China polished Diamond Imports 2007-2013 182
Chart 98: Chow Tai Fook Revenue by Geography 2012-2014 183
Chart 99: China Number of Registered Marriages 1990-2018F 185
Chart 100: Crude Birth Rate for China 1975-2005 185

Equity Communications 2014
www.diamondshades.com/diamondreport
Catalog of Charts, Tables and Exhibits...
Consumption Section continued… Page
India
Chart 101: India - Gold and Diamond Jewelry Demand by Region 190
Chart 102: India - Diamond Jewelry Sales 2003-2013 191
Chart 103: India - Diamond Jewelry Preferences by Region 192
Table 27: Diamond Jewelry Market Share of Retail Sales in India 193
Chart 104: Consumption Breakdown for Diamond Jewelry in India 193
USA
Chart 105: USA Diamond Jewelry Sales 1998-2012 195
Chart 106: 2013 USA Jewelry Store Sales 196
Chart 107: Consumption Breakdown for Diamond Jewelry in USA 197
Chart 108: Breakdown of Diamond Engagement Ring Sales 2012 198
Chart 109: 2013-2015 Retail Sales of Jewelry in USA 199
Chart 110: Age at First Marriage USA 200
Chart 111: USA Earnings and Unemployment Rate by Educational Attainment 201
Chart 112: USA Female Annual Personal Income 201
Chart 113: USA Average Annual Earnings by Highest Degree Earned 201
Chart 114: Crude Birth Rate for USA 1950-2030 202
Chart 115: Fertility Rate for USA 1950-2030 202
Chart 116: Number of Registered Marriages in USA 1990-2015F 203
Future Global Demand For Diamonds
How Do We Predict Future Consumer Demand for Diamonds?
Chart 117: Forecast Global Sales of Diamond Jewelry 2006-2016 204
Table 28: Wholesale Price of 1 carat Round Diamond (Illustrative) 205
How a Mass-market For Diamond Jewelry Is Created
Table 29: Percentage of First Time Brides Receiving Diamond Engagement Ring 210
Current State of Global Diamond Jewelry Consumption
Chart 118: Global Retail Sales of Diamond Jewelry - 2003, 2009 and 2013 214
Chart 119: Diamond Jewelry Sales Year-on-Year Growth 2004-2013 215
Table 30: Retail Sales Growth Leading Markets 2013 versus 2003, 2013 versus 2009 215
Table 31: Diamond Jewelry Sales Leading Markets (Market Share and Annual Growth) 216
Table 32: Key Diamond Jewelry Markets, Wealth and Demographics 217
Chart 120: Per Adult Consumption of Diamond Jewelry (Leading Markets and World) 217
Table 33: Number of Registered Marriages Leading Markets 2003, 2009, 2013 217
Table 34: Diamond Consumer Market Developers - Leading Markets 219
Table 35: Agglomerations With A Population Of Plus 1 Million Inhabitants (Key Markets) 220
Table 36: Number of Mega Cities in Key Diamond Consumer Markets 220

Equity Communications 2014
www.diamondshades.com/diamondreport
Catalog of Charts, Tables and Exhibits...
Trading Diamonds For Profit
Analysis of the Business of Trading Diamonds
Chart 121: Trading Diamonds in the Diamond Pipeline 228
Table 37: 2013 Diamond Pipeline Statistics 229
Why Diamond Trading Can Be Appealing
Table 38: Diamonds More Like Traded Art 231
Exhibit 26: From Rough Diamond to Polished Diamond 232
Chart 122: Differing Values for Diamonds 233
Table 39: From Rough Diamond to Polished Diamond (Business Considerations) 233
Table 40: Art of Valuing a Polished Diamond - Representative Factors Considered 233
Table 41: Wholesale Price of 1 carat Round Diamond (Illustrative) 234
Chart 123: Flow Chart of Diamond Trading in Pipeline 234
Diamond Industry Fundamentals Understood To Be Positive
Exhibit 27: De Beers Exhibit On Anticipated Structural Supply Deficit 237
How to Read Fundamentals of Diamond Supply and Demand
Table 42: De Beers Monopoly Curtailed 240
Table 43: Traders With Consignment Stocks - Market Share of Rough Diamond Sales 241
Table 44: Diamond Processing in India 242
Chart 124: Profitable Rough Diamonds Trade in Dubai 2003-2013 243
The De Facto Investment Market For Diamonds
Chart 125: Demand Sources - Precious Jewelry Commodities 245
Chart 126: Rough Diamond Price Trends 2004-2013 246
Chart 127: US Dollar and Indian Rupee Rough and polished Diamond Indices 2004-2013 246
Accumulation of Massive Diamond Stocks in the Pipeline
Chart 128: India Rough Diamond Imports Outpace Global Diamond Production 1998-2013 247
Chart 129: USA International Polished Diamonds Trade 1989-2013 247
Chart 130: India Rough Diamond Imports 1990-1998 248
Chart 131: Belgium, India Rough Diamond Imports Outpace Global Production 1998-2005 250
Chart 132: Diamond Banks Increase Credit to Industry 2001-2008 250
Chart 133: Diamond Producers Boost Production 1998-2009 251
Chart 134: De Beers Slashes Number of Sightholders 2001-2015 251
Exhibit 28: Diamond Industry Experts Say Consumer Demand Will Outpace Supply 253
Table 45: Diamond Industry Value Chain 2009 versus 2013 256
Chart 135: Precious Jewelry Commodities - Asset Volatility 2004-2011 258

Equity Communications 2014
www.diamondshades.com/diamondreport
Catalog of Charts, Tables and Exhibits...
Special Section: Investing in Diamonds continued… Page
Trading of Investment Grade Diamonds
Diamonds for Investors
Exhibit 29: An Exceptional 25.5ct Blue Diamond 262
What Makes A Diamond Rare?
Table 46: Color Scale for White Diamonds 263
Table 47: 12 Basic Hues for Colored Diamonds 264
Table 48: Clarity Grading Scale 265
Table 49: Alrosa 2013 Diamond Sales by Weight Class 265
Special Exhibits: Typical Examples of Investment Grade Diamonds
Exhibit 30: Gem Diamonds - Top 9 Diamonds Sold in 2013 266
Exhibit 31: Argyle Red Diamonds 267
Exhibit 32: D Color Flawless and D Color Internally Flawless 268
Table 50: Typical Properties of Investment Grade Diamonds 269
Table 51: Diamonds Most Commonly Traded For Investment Purposes 269
Chart 136: Different Premiums for Investment Grade White Diamonds 270
Chart 137: Value of Magnificent Diamond by Graff Diamonds 2005 versus 2012 272
Chart 138: Value of Archduke Joseph Diamond 1993 versus 2012 272
Money Laundering, Tax Evasion and Diamonds
Exhibit 33: International Sentiment on Tax Havens Turns Negative 277
Table 52: Global Ranking of Polished Diamond Imports 2007-2012 278

Equity Communications 2014
www.diamondshades.com/diamondreport
8. Index of Charts, Tables and Exhibits
Charts page
Chart 1: World Diamond Production 2004-2018F 4
Chart 2: Primary Producers: Rough Diamond Sales 2009-2013 4
Chart 3: KP - World Diamond Production by Value 2013 vs 2012 5
Chart 4: Percentage Share of World Diamond Production (Leading Producers) 2009-2013 16
Chart 5: 2013 Rough Diamond Sales - Diamond Producers 19
Chart 6: Percentage Share of Rough Diamond Sales (Diamond Producers) 2009-2013 19
Chart 7: Map - Global Supply of Diamonds (Map of Key Diamond Regions 2013) 20
Chart 8: 2013 World Diamond Production Volume and Value (Top Ten Producer Countries) 21
Chart 9: Production of Gem Quality, Near-Gem and Industrial Diamonds 2004-2013 22
Chart 10: Number of Global High Networth Individuals 2010-2013 25
Chart 11: De Beers Exploration Costs 1999-2012 32
Chart 12: De Beers Exploration Ground Holdings 2007-2012 32
Chart 13: Timeline - Discovery of Rich Diamond Deposits 1954 to Present 33
Chart 14: History of Global Diamond Production From Antiquity to 2013 42
Chart 15: Canada Diamond Mines - Life of Mine Years (1995-2040) 43
Chart 16: Global Diamond Reserves 2000-2012 45
Chart 17: Global production of Rough Diamonds (Top Ten Country Rankings) 2001-2013 48
Chart 18: Production Footprint of Gem and Near- Gem Diamonds (Top Ten) 2009-2018F 49
Chart 19: Global Diamond Production Volume (Countries) 2009-2013 versus 2014-2018F 50
Chart 20: Global Diamond Production Volume (Gem) 2009-2013 versus 2014-2018F 51
Chart 21: Global Diamond Production Value (Countries) 2009-2013 versus 2014-2018F 52
Chart 22: Canada Diamond Mines - New Lease of Life 54
Chart 23: Sources of Additional Production Capacity for 2013-2018F 58
Chart 24: Rough Diamond Import Prices 2004-2013 67
Chart 25: DTC Price Index 2002-2015F 69
Chart 26: Global Rough Diamonds Trade (Margins for Profitable Trade 2004-2013) 71
Chart 27: Rough Diamond Price Trends 2004-2013 71
Chart 28: Rough Diamond Export Prices 2004-2013 72
Chart 29: China Polished Diamond Imports 2007-2013 74
Chart 30: Polished and Rough Diamonds Price Index 2004-2013 75
Chart 31: Polished Diamonds Index 2004-2013 76
Chart 32: Global Diamond Trade Turnover 2007-2013 79
Chart 33: Rough and Polished Diamond Indices 2004-2013 79
Chart 34: Value of Rough Diamonds Trade 2004-2013 80
Chart 35: Major Trade Centers - Rough Diamond Trade Volume 2004-2013 81
Chart 36: Major Trade Centers - Rough Diamond Trade Value 2004-2013 81
Chart 37: UAE versus Belgium - Imports of Rough Diamonds 2006-2013 82
Chart 38: Polished Diamonds Trade Turnover 2008-2012 85
Chart 39: Israel Exports of Polished Diamonds Value 1997-2012 86
Chart 40: Israel Exports of Polished Diamonds Volume 1997-2012 86

Equity Communications 2014
www.diamondshades.com/diamondreport
8. Index of Charts, Tables and Exhibits...
Charts continued… page
Chart 41: India Polished Diamonds Trade 2005-2013 87
Chart 42: Israel Net Polished Diamond Exports 2007 versus 2012 89
Chart 43: Belgium Gross Polished Diamond Exports 2007 versus 2012 89
Chart 44: India Polished Diamond Exports 2007 versus 2012 89
Chart 45: Key Trade Centers - Trade Values 2002-2012(Price per Carat Trends) 90
Chart 46: USA Imports of Polished Diamonds 2002-2012 90
Chart 47: USA Exports of Polished Diamonds 2002-2012 90
Chart 48: India Rough Diamond Imports 1990-1998 92
Chart 49: Belgium and India Rough Diamond Imports Versus Annual Production (1998-2013) 93
Chart 50: Global Production of Polished Diamonds 1997-2018F 94
Chart 51: Forecast Polished Diamonds Production 2012-2018F 94
Chart 52: Net Flow of Rough Diamonds Trade - Market Share by Regions 2004-2013 96
Chart 53: Net Rough Diamonds Demand 2004-2013 96
Chart 54: Group A Processors Versus Group B Processors 98
Chart 55: De Beers Rough Diamond Sales - Global Versus Southern Africa 2006-2012 100
Chart 56: De Beers Sales in Southern Africa 2006-2011 100
Chart 57: Exports of Polished Diamonds Southern Africa 2009-2012 100
Chart 58: Diamond Industry Debt 2001-2011 108
Chart 59: Antwerp Diamond Bank Balance Sheet 1997-2012 110
Chart 60: Antwerp Diamond Bank Profitability 1997-2012 110
Chart 61: Market Share of Diamond Industry Debt by Trade Centre 2007-2011 112
Chart 62: India International Polished Diamonds Trade 2005-2013 113
Chart 63: India Diamond Industry Debt 2001-2013E 113
Chart 64: Rupee Rough and Polished Diamonds Indices 2004-2013 114
Chart 65: Global Retail Sales of Diamond Jewelry 2003-2014F 129
Chart 66: Retail Sales of Diamond Jewelry 2009-2013 (Top Markets and World Regions) 129
Chart 67: 2013 Retail Sales of Diamond Jewelry (Top Markets and World Regions) 130
Chart 68: Retail Sales of Diamond Jewelry Top Markets (2013 versus 2008 Market Share) 131
Chart 69: Average Import Price - Polished Diamonds USA versus Japan 2003-2013 132
Chart 70: Average Polished Diamond Import Prices -Top Trade Markets (2002-2012) 132
Chart 71: Polished Diamonds Index versus Other Precious Jewelry Indices 2004-2013 148
Chart 72: USA Polished Diamonds Trade 1990-2012 149
Chart 73: USA Imports of Polished diamonds 2002-2012 150
Chart 74: USA Jewelry Stores Absorb Commodities Cost Increases 2002-2013 151
Chart 75: Number of Jewelry Store Establishments in USA 1998-2011 151
Chart 76: Chow Tai Fook Revenue by Geography 2012-2014 153
Chart 77: Chow Tai Fook POS Network 2012-2014 154
Chart 78: Two Types of Markets for Precious Jewelry Consumption (World Map) 155
Chart 79: Diamond Jewelry Consumption Breakdown (Top Markets) 160
Chart 80: Crude Marriage Rates for Selected Territories 1970-2011 161

Equity Communications 2014
www.diamondshades.com/diamondreport
8. Index of Charts, Tables and Exhibits...
Charts continued… page
Chart 81: Number of Registered Marriages for Selected Territories 1990-2012 161
Chart 82: Age at First Marriage USA 1970-2012 162
Chart 83: Age at First Marriage Selected Countries (1980 versus 2010) 163
Chart 84: Crude Birth Rate for Selected Territories 1950-2030 164
Chart 85: Japan Diamond Jewelry Sales 1991-2013 165
Chart 86: Japan imports of Polished Diamonds 1991-2013 165
Chart 87: Japan and USA Comparison of Polished Diamond Import Trends 1991-2013 165
Chart 88: Major Jewelry Consumption Markets, Population Ages 0 to 14 (1970-2012) 166
Chart 89: Total Wealth for Regions and Selected Countries 2000-2013 167
Chart 90: Share of World Wealth for Regions and Selected Countries 2000-2013 167
Chart 91: Tiffany and Co Retail Locations 2003-2013 168
Chart 92: Diamond Jewelry Consumption Breakdown (Top Markets) 174
Chart 93: "Have you ever considered diamonds specifically as an investment?" 175
Chart 94: Mainland China Diamond Jewelry Sales 2003-2013 177
Chart 95: Hong Kong Diamond Jewelry Sales 2003-2013 177
Chart 96: Chow Tai Fook Revenue by Product Category 2012-2014 179
Chart 97: China polished Diamond Imports 2007-2013 182
Chart 98: Chow Tai Fook Revenue by Geography 2012-2014 183
Chart 99: China Number of Registered Marriages 1990-2018F 185
Chart 100: Crude Birth Rate for China 1975-2005 185
Chart 101: India - Gold and Diamond Jewelry Demand by Region 190
Chart 102: India - Diamond Jewelry Sales 2003-2013 191
Chart 103: India - Diamond Jewelry Preferences by Region 192
Chart 104: Consumption Breakdown for Diamond Jewelry in India 193
Chart 105: USA Diamond Jewelry Sales 1998-2012 195
Chart 106: 2013 USA Jewelry Store Sales 196
Chart 107: Consumption Breakdown for Diamond Jewelry in USA 197
Chart 108: Breakdown of Diamond Engagement Ring Sales 2012 198
Chart 109: 2013-2015 Retail Sales of Jewelry in USA 199
Chart 110: Age at First Marriage USA 200
Chart 111: USA Earnings and Unemployment Rate by Educational Attainment 201
Chart 112: USA Female Annual Personal Income 201
Chart 113: USA Average Annual Earnings by Highest Degree Earned 201
Chart 114: Crude Birth Rate for USA 1950-2030 202
Chart 115: Fertility Rate for USA 1950-2030 202
Chart 116: Number of Registered Marriages in USA 1990-2015F 203
Chart 117: Forecast Global Sales of Diamond Jewelry 2006-2016 204
Chart 118: Global Retail Sales of Diamond Jewelry - 2003, 2009 and 2013 214
Chart 119: Diamond Jewelry Sales Year-on-Year Growth 2004-2013 215
Chart 120: Per Adult Consumption of Diamond Jewelry (Leading Markets and World) 217

Equity Communications 2014
www.diamondshades.com/diamondreport
8. Index of Charts, Tables and Exhibits...
Charts continued… page
Chart 121: Trading Diamonds in the Diamond Pipeline 228
Chart 122: Differing Values for Diamonds 233
Chart 123: Flow Chart of Diamond Trading in Pipeline 234
Chart 124: Profitable Rough Diamonds Trade in Dubai 2003-2013 243
Chart 125: Demand Sources - Precious Jewelry Commodities 245
Chart 126: Rough Diamond Price Trends 2004-2013 246
Chart 127: US Dollar and Indian Rupee Rough and polished Diamond Indices 2004-2013 246
Chart 128: India Rough Diamond Imports Outpace Global Diamond Production 1998-2013 247
Chart 129: USA International Polished Diamonds Trade 1989-2013 247
Chart 130: India Rough Diamond Imports 1990-1998 248
Chart 131: Belgium, India Rough Diamond Imports Outpace Global Production 1998-2005 250
Chart 132: Diamond Banks Increase Credit to Industry 2001-2008 250
Chart 133: Diamond Producers Boost Production 1998-2009 251
Chart 134: De Beers Slashes Number of Sightholders 2001-2015 251
Chart 135: Precious Jewelry Commodities - Asset Volatility 2004-2011 258
Chart 136: Different Premiums for Investment Grade White Diamonds 270
Chart 137: Value of Magnificent Diamond by Graff Diamonds 2005 versus 2012 272
Chart 138: Value of Archduke Joseph Diamond 1993 versus 2012 272
Tables page
Table 1: Diamond Production Value (Countries) US$/carat 2013 vs 2012 5
Table 2: World Diamond Production Volume (Leading Producers) 2004-2013 16
Table 3: Forecast Diamond Production (Diamond Producers) 2009-2018F 17
Table 4: Diamond Producers - Rough Diamond Sales (Value) 2009-2013 18
Table 5: Comparison of DRC and Namibia Diamond Production (2012) 20
Table 6: Global Diamond Supply 2013, Region, Territories, Market Share 41
Table 7: Classification of Producer Countries by Value of Production Footprint 46
Table 8: Market Share of Producer Group (Countries) by Volume and Value 2008-2013 47
Table 9: Global Diamond Production Volume (Countries) 2009-2013 versus 2014-2018F 50
Table 10: Global Diamond Production Volume (Gem) 2009-2013 versus 2014-2018F 51
Table 11: Global Diamond Production Value (Countries) 2009-2013 versus 2014-2018F 52
Table 12: Dubai Challenges Antwerp 82
Table 13: Global Ranking of Polished Diamond Imports 2007-2013 (Top Nine Countries) 88
Table 14: Rough Diamonds Supply and Net Flow 2004-2013 (carats) 122
Table 15: Rough Diamonds Supply and Net Flow 2004-2013 (value) 123
Table 16: Rough Diamonds Trade Data 2004-2016 (Production, Rough Diamond Imports and Exports) 124
Table 17: Production of Polished Diamonds 1997-2018F 125
Table 18: Retail Sales of Diamond Jewelry 2012 and 2013 (Top Markets and World Regions) 130
Table 19: The Three Main Subdivisions of Retail Diamond Jewelry Consumption 134
Table 20: Changing First World Consumer 137

Equity Communications 2014
www.diamondshades.com/diamondreport
8. Index of Charts, Tables and Exhibits...
Tables continued… page
Table 21: Retail Forecast Next Five Years - Selected World Regions (Y-o-Y) 138
Table 22: Typical Margins for Gold Jewelry in India 156
Table 23: Typical Margins for Precious Jewelry Products in China 157
Table 24: Typical Margins for Precious Jewelry Products in EU 157
Table 25: Luxury Retail Brands versus Regular Diamond Jewelry Retailers 170
Table 26: "How important are the following criteria when deciding from which store to buy" 175
Table 27: Diamond Jewelry Market Share of Retail Sales in India 193
Table 28: Wholesale Price of 1 carat Round Diamond (Illustrative) 205
Table 29: Percentage of First Time Brides Receiving Diamond Engagement Ring 210
Table 30: Retail Sales Growth Leading Markets 2013 versus 2003, 2013 versus 2009 215
Table 31: Diamond Jewelry Sales Leading Markets (Market Share and Annual Growth) 216
Table 32: Key Diamond Jewelry Markets, Wealth and Demographics 217
Table 33: Number of Registered Marriages Leading Markets 2003, 2009, 2013 217
Table 34: Diamond Consumer Market Developers - Leading Markets 219
Table 35: Agglomerations With A Population Of Plus 1 Million Inhabitants (Key Markets) 220
Table 36: Number of Mega Cities in Key Diamond Consumer Markets 220
Table 37: 2013 Diamond Pipeline Statistics 229
Table 38: Diamonds More Like Traded Art 231
Table 39: From Rough Diamond to Polished Diamond (Business Considerations) 233
Table 40: Art of Valuing a Polished Diamond - Representative Factors Considered 233
Table 41: Wholesale Price of 1 carat Round Diamond (Illustrative) 234
Table 42: De Beers Monopoly Curtailed 240
Table 43: Traders With Consignment Stocks - Market Share of Rough Diamond Sales 241
Table 44: Diamond Processing in India 242
Table 45: Diamond Industry Value Chain 2009 versus 2013 256
Table 46: Color Scale for White Diamonds 263
Table 47: 12 Basic Hues for Colored Diamonds 264
Table 48: Clarity Grading Scale 265
Table 49: Alrosa 2013 Diamond Sales by Weight Class 265
Table 50: Typical Properties of Investment Grade Diamonds 269
Table 51: Diamonds Most Commonly Traded For Investment Purposes 269
Table 52: Global Ranking of Polished Diamond Imports 2007-2012 278

Equity Communications 2014
www.diamondshades.com/diamondreport
8. Index of Charts, Tables and Exhibits...
Exhibits page
Exhibit 1: Rare Diamonds Like These Fancy Pink Beauties 23
Exhibit 2: Argyle Red Diamonds 24
Exhibit 3: i-phone 4 Diamond Rose 26
Exhibit 4: Montblanc Meisterstuck Mozart Jewelry "Gold" Fountain Pen 27
Exhibit 5: Mouwad's 637 carat L' Incomparable Diamond Necklace 28
Exhibit 6: Marriage Proposals with Diamond Ring 29
Exhibit 7: Diamond Engagement Ring 29
Exhibit 8: Bride and Groom Wearing Diamond Rings 30
Exhibit 9: Botswana Beneficiation Drive 2012 102
Exhibit 10: Tiffany and Co - Leading Global Luxury Brand 105
Exhibit 11: Chow Tai Fook - Greater China Focused and Largest Jewelry Company 105
Exhibit 12: Precious Metals Consumption in Jewelry (Top Markets) 1998-2002, 2011-2013 140
Exhibit 13: Global Production of Polished Diamonds 140
Exhibit 14: Gold Consumption in Jewelry (Top Markets) 1998-2002 Average, 2011-2013 141
Exhibit 15: Platinum Consumption in Jewelry (Top Markets) 1998-2002 Average, 2011-2013 141
Exhibit 16: Silver Consumption in Jewelry (Top Markets) 1998-2002 Average, 2011-2013 142
Exhibit 17: Polished Diamond Consumer Preferences in Leading Markets 142
Exhibit 18: Global Adult Wealth Pattern 2010-2013 143
Exhibit 19: China's Adult Wealth Pattern 2010-2013 144
Exhibit 20: Europe's Adult Wealth Pattern 2010-2013 145
Exhibit 21: North America's Adult Wealth Pattern 2010-2013 145
Exhibit 22: India's Adult Wealth Pattern 2010-2013 146
Exhibit 23: Global High-Networth Individuals 2010-2013 147
Exhibit 24: Jewelry Retailing In USA (Sterling Jewelers) 152
Exhibit 25: Tiffany and Co - Sales Impacts of Stores Located in Gateway Cities 172
Exhibit 26: From Rough Diamond to Polished Diamond 232
Exhibit 27: De Beers Exhibit On Anticipated Structural Supply Deficit 237
Exhibit 28: Diamond Industry Experts Say Consumer Demand Will Outpace Supply 253
Exhibit 29: An Exceptional 25.5ct Blue Diamond 262
Exhibit 30: Gem Diamonds - Top 9 Diamonds Sold in 2013 266
Exhibit 31: Argyle Red Diamonds 267
Exhibit 32: D Color Flawless and D Color Internally Flawless 268
Exhibit 30: Gem Diamonds - Top 9 Diamonds Sold in 2013 266
Exhibit 31: Argyle Red Diamonds 267
Exhibit 32: D Color Flawless and D Color Internally Flawless 268
Exhibit 33: International Sentiment on Tax Havens Turns Negative 277

Equity Communications 2014
www.diamondshades.com/diamondreport
Blank Page
Please continue reading to next page...

167
Five Key Drivers of Diamond Consumption...
5. Luxury Brands Expansion
Chart 89:
Chart 90:
Charts Source: James Davies, Rodrigo Lluberas and Anthony Shorrocks, Credit Suisse Global Wealth
Data Book 2013. Equity Communications
Equity Communications 2014
www.diamondshades.com/diamondreport 168
Five Key Drivers of Diamond Consumption...
Premier luxury brands set to dominate diamond jewelry sales and global gateway cities set to dominate
diamond jewelry retailing...
Economic development efforts of key populous countries gained enough momentum to be significantly
impactful on the global stage by the beginning of this millennium. The ripple effects of this juggernaut have
been enormous, resulting in a transformational rearrangement of the world’s spheres of influence.
In essence, the number of people with money to spend is swelling worldwide, opening up new markets for
premium luxury goods. Accordingly, purveyors of luxury goods have expanded sales networks to these
emerging centers of wealth and attained great profit.
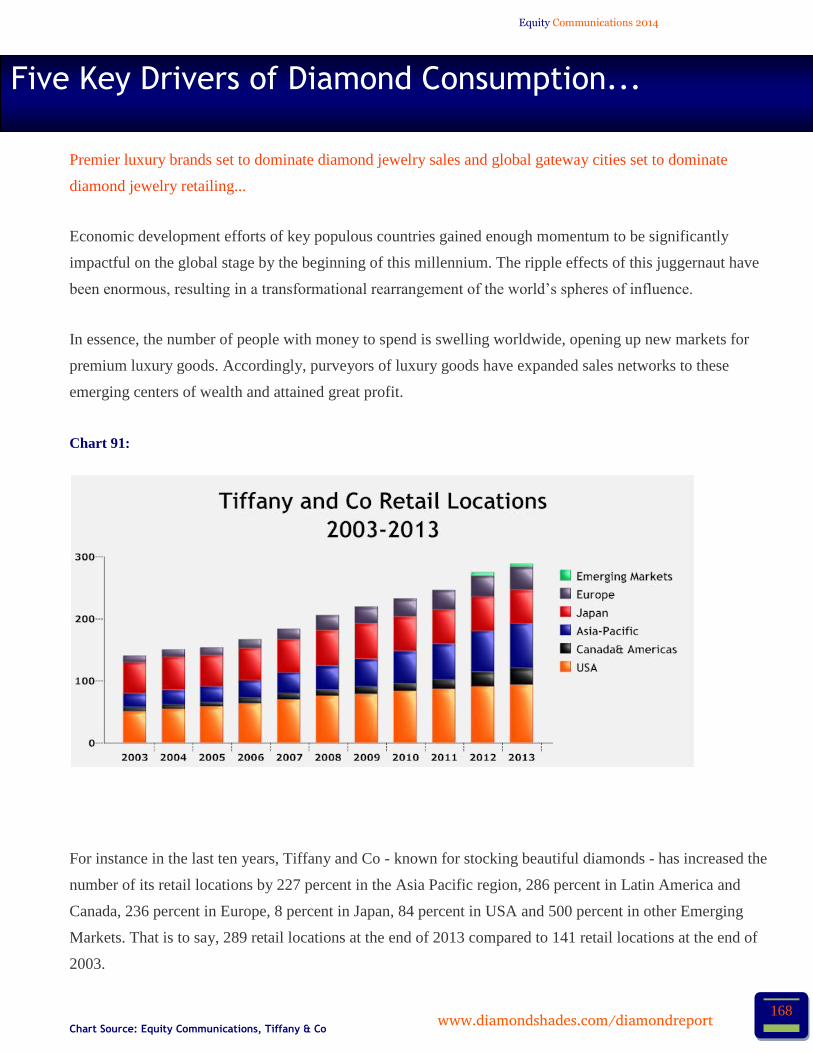
Chart 91:
For instance in the last ten years, Tiffany and Co - known for stocking beautiful diamonds - has increased the
number of its retail locations by 227 percent in the Asia Pacific region, 286 percent in Latin America and
Canada, 236 percent in Europe, 8 percent in Japan, 84 percent in USA and 500 percent in other Emerging
Markets. That is to say, 289 retail locations at the end of 2013 compared to 141 retail locations at the end of
2003.
Chart Source: Equity Communications, Tiffany & Co

Equity Communications 2014
www.diamondshades.com/diamondreport 169
Five Key Drivers of Diamond Consumption...
Prior to the Global Financial Crisis, about 85 percent of consumer demand for diamonds was located in
developed diamond markets such as USA, Canada and Japan. Post-crisis consumer demand for diamonds has
become a bit more globally diversified largely because of growing demand from emerging markets - led by
India and China.
However, while global expansion of diamond markets is a good thing for growth of the diamond industry, it
also increases competition for the best diamonds and intensifies competition for customers in the diamond
industry’s value chain.
Essentially, enhanced global competition for increasingly costly high quality diamonds - and the fact
that the world has become one market in the internet age - will disqualify even more jewelry retailers
and retail locations from the diamond business.
First, offline (brick and mortar) retail channels are losing consumer traffic to online (internet) retail channels.
The shift is global. Many retail locations that sell diamond jewelry become less profitable with reduced store
traffic because of high inventory carrying costs and lower margins.
At the same time, the online diamond business has really made things much more transparent and better for
customers since all the diamond choices out there are literally available at their fingertips. However, price
transparency at the retail level has introduced price competition to the industry and lowered polished
diamond prices by up to 40 percent over the years, to the continued ruin of retailer margins.
For the most part, consumers are now known to price-compare before finalizing a purchase. As you know,
the internet is the ideal environment to pits one seller versus the other and allows the laws of supply and
demand to set the most efficient price. Consequently, retailers who sell comparable diamonds at a premium
have been forced to reduce prices in order to move stock.
Correspondingly, there literally is even less margin for error in emerging diamond markets like India and
China where the adornment+investment factor is a huge component of jewelry consumption.

Equity Communications 2014
www.diamondshades.com/diamondreport 170
Five Key Drivers of Diamond Consumption...
For the above reasons, it is reasonable to assume that more of the diamond retailing business will migrate to
luxury retail brands and global gateway cities in the coming years.
There is emotional buying at the upper end of the consumer spectrum, therefore luxury brands have the
ability to defend higher margins in the face of rising costs and enhanced competition. Conversely, there is
value-driven buying at the lower end of the consumer spectrum, therefore regular jewelry retailers find it
harder to pass on higher costs to consumer.
Table 25:
Using the example of Tiffany, for one thing, the luxury brand retailer can sell sterling silver jewelry pieces
for US$300 and achieve great margin success because desirability of the brand is the most important thing
for its customers.
Diamonds, like silver, are a commodity; however, brands are not. Luxury brands have gained strong
desirability over time and this translates into pricing power. Pricing power translates into margin success and
ultimately profit.
Please continue reading to next page...
Luxury Retail Brands versus Regular Diamond Jewelry Retailers
Consumer Spectrum Customer Purchase Decision Customer Attachment Margins Marketing Budgets
Luxury Retail Brands Upper end Brand Emotion Strong Higher Gross (40-70%) Deep
Regular Jewelry Stores Lower end Value-driven Weak Lower Gross (20-50%) Shallow
Source: Equity Communications

Equity Communications 2014
www.diamondshades.com/diamondreport 171
Five Key Drivers of Diamond Consumption...
Turning now to the physical aspect of the diamond retailing business, we believe global gateway cities
are the prime real estate of the present and future since they provide the most potential for sustainable
diamond jewelry retailing.
Global gateway cities are cities that serve as cultural and economic hubs of a region. These cities possess the
ability to attract a constant flow of human traffic from within the country and from other countries -
becoming vast melting pots of people, trade and innovation. Cities like London, Paris, Milan, New York,
Miami, Beijing, Shanghai, Singapore, Dubai, Hong Kong, Miami, Moscow, Geneva, Tokyo and Berlin etc.
Global gateway cities are often quite divorced from the local economy of a region - taking cues from the
global economy - and tend to attract large numbers of wealthy travelers with money to spend. Unfortunately
for regular retailers, the downside is that global gateway cities are often the preserve of global luxury brands
that afford astronomical rents.
At the global level, emerging wealth flocks to gateway cities to purchase jewelry and luxury goods because
of higher luxury taxes at home and the prestige factor. For instance, Hong Kong has benefitted tremendously
from wealthy Mainlanders who visit the city for luxury shopping. London is also a popular shopping
destination for wealthy Africans.
Incidentally, tourist shopping in many of Europe's gateway cities has sustained luxury retail locations since
domestic demand is currently weak. For instance, foreign tourist spending represents more than a quarter of
Tiffany sales in Europe.
Please continue reading to next page...

Equity Communications 2014
www.diamondshades.com/diamondreport 172
Five Key Drivers of Diamond Consumption...
Exhibit 25: Tiffany and Co – Sales Impact of Stores Located in Global Gateway
Cities
Tiffany's New York Flagship store represents 8% of worldwide sales - about US$320 million. Sales
to foreign tourists account for approximately 45% of store sales.
Tiffany has 54 locations in Japan but the store located in the luxury shopping district of Ginza in
Tokyo accounts for more than 10% of total sales in Japan
Tiffany has 45 stores in Greater China but the store located on the prestigious Canton Road in Hong
Kong is the companies highest volume store in the region by a considerable distance. Canton Road is
very popular with tourists from the Mainland.
Sales in the U.K represent 40% of Tiffany's sales in Europe. The store located on Old Bond Street -
popular with tourists from all over the world - is Tiffany’s highest volume store in Europe.
Please continue reading to next page...

Equity Communications 2014
www.diamondshades.com/diamondreport 173
Five Key Drivers of Diamond Consumption...
Gateway cities will continue to attract wealthy shoppers therefore it makes sense for jewelry brands to
gravitate to such cities, particularly in the retailing of expensive high-quality jewelry. Furthermore, jewelry
brands have to strive to create the widest possible network of retail stores in gateway cities because
sometimes consumers will buy less in Hong Kong, less in Paris, more in Dubai, and more in London.
Dynamic things that change all the time such as the weather, taxes, airline routes and currency movements
are considered carefully by luxury goods shoppers in the planning of foreign shopping trips. In essence, the
shopping experience has become more important than ever and the appeal of different shopping destinations
changes all the time.
Naturally, only brands that travel well can go international. Travelling well also entails having adaptive
websites that provide the same high quality user experience whether access is from laptops, tablets, or
smartphones.
Numerous studies and surveys indicate that tourists use the internet to plan their shopping while still at home
and update shopping plans while on the go. The wealthy expect the same level of high quality service from
luxury brands no matter the location or device.
In the final analysis - by and large - pace of growth of emerging diamond consumer markets will depend on
the expansion strategies pursued by luxury brands like Tiffany, Van Cleefs and Arpels, Graff Diamonds and
other prestigious and well established jewelry brands like Chow Tai Fook in Greater China and Damas
Jewelry in the Middle East.
In established diamond markets like the USA, retailing of diamonds will consolidate into strong and well-
established national retail chains like Kay Jewelers and Jared both owned by Sterling Jewelers.
After all, these companies have some important advantages in common:
They possess the ability to capitalize on their stronger brand names, higher margins, stronger marketing and
advertising budgets, and deeper capital resources for sustainable diamond jewelry retailing in a global
environment that has become more competitive and volatile.

http://www.diamondshades.com/diamondreport/get-your-copy/