the global economy: low growth, low inflation, low ... · pdf filethe global economy: low...
TRANSCRIPT

The global economy: low growth,
low inflation, low interest rates
Gregorio De Felice
Chief Economist
Rome, November 24 2017
Agenda
2
1
A rather unusual global economic expansion
A closer look at Italy and the Eurozone
1

2
Growth is slower than in the pre-crisis period.
Offshoring in manufacturing is decelerating.
International trade flows are less dynamic.
Population in advanced countries is aging.
The economic cycle is one of the longest in the last 70 years.
Strongly supported by expansive monetary and fiscal policies.
The recovery is not producing inflation.
Participation in the labor market is low.
Productive flexibility is higher than in the past.
Margins in distribution are compressed.
The sharing economy has deflationary effects.
No particular financial disequilibria.
Some features of the current economic expansion

Global GDP (y/y, % change)
Source: IMF, Intesa Sanpaolo
3
A slow, but persistent economic expansion

Inward Foreign Direct Investments (% of GDP)
Source: Intesa Sanpaolo
4
The globalization wave is past
1.7
2.6 2.4
4.0
5.2
4.2
3.3
3.7
2.1
2.5 2.3
2.6
0.0
1.0
2.0
3.0
4.0
5.0
6.0
Romania Poland Thailand China
% o
f G
DP
1995-99 2000-08 2009-17

CPB index of global trade (y/y % change and long-term average)
Source: Thomson Reuters-Datastream, CPB
5
Global trade growth remains subdued
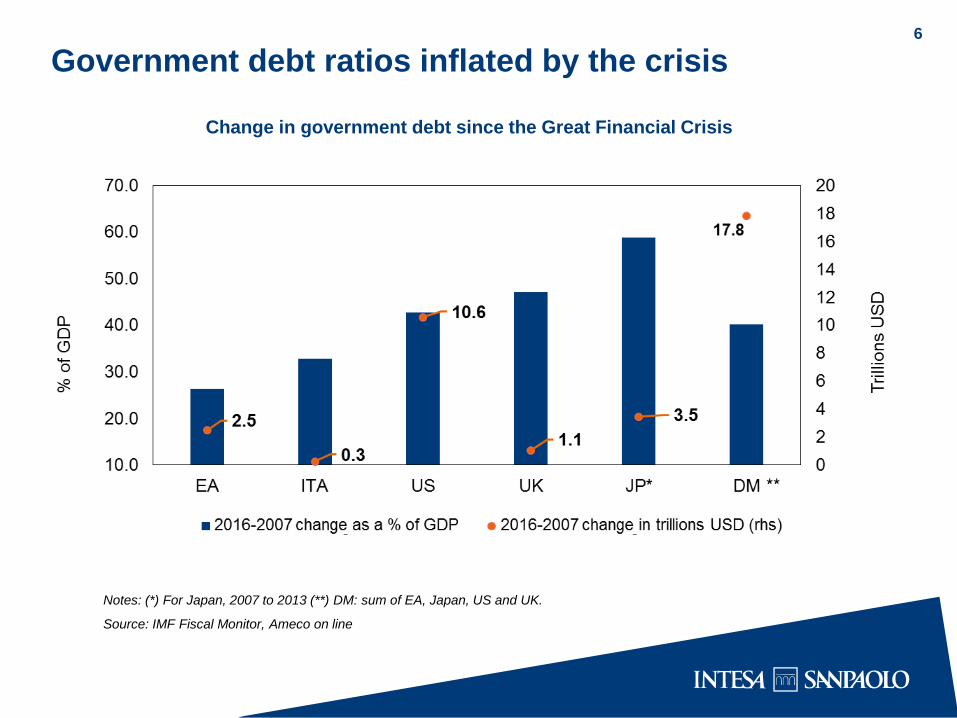
Change in government debt since the Great Financial Crisis
Notes: (*) For Japan, 2007 to 2013 (**) DM: sum of EA, Japan, US and UK.
Source: IMF Fiscal Monitor, Ameco on line
6
Government debt ratios inflated by the crisis
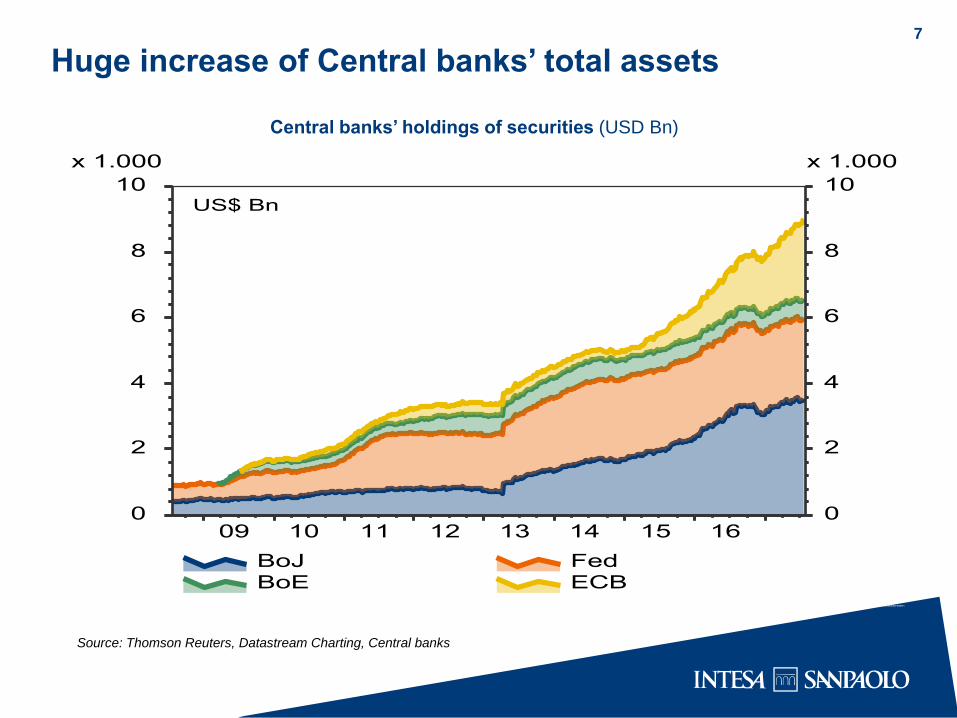
Central banks’ holdings of securities (USD Bn)
Source: Thomson Reuters, Datastream Charting, Central banks
7
Huge increase of Central banks’ total assets
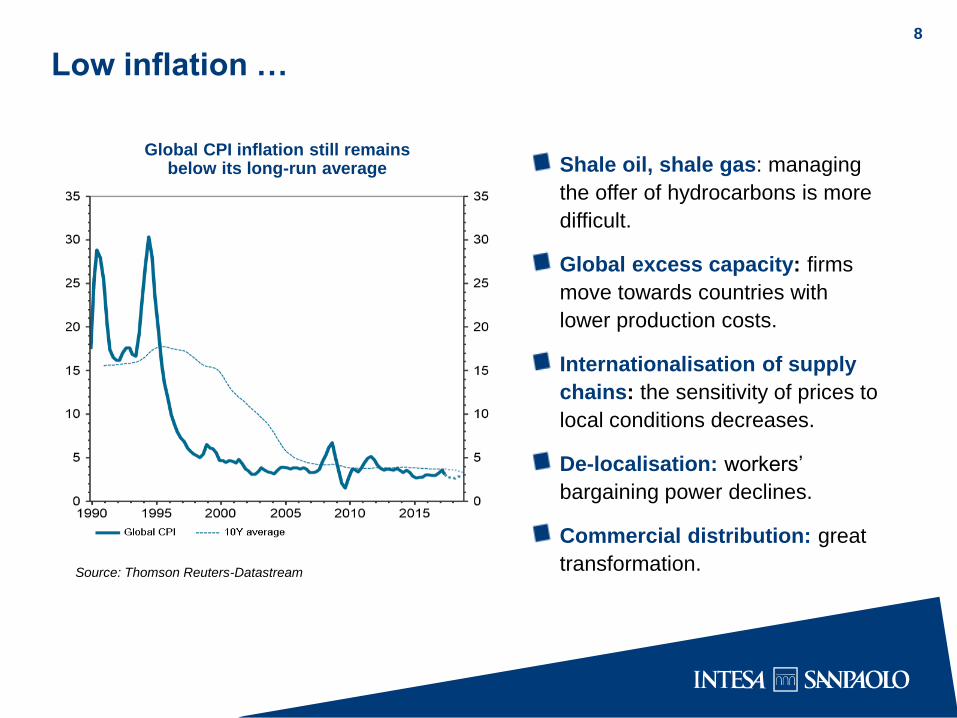
Low inflation …
Global CPI inflation still remains below its long-run average
Source: Thomson Reuters-Datastream
Shale oil, shale gas: managing
the offer of hydrocarbons is more
difficult.
Global excess capacity: firms
move towards countries with
lower production costs.
Internationalisation of supply
chains: the sensitivity of prices to
local conditions decreases.
De-localisation: workers’
bargaining power declines.
Commercial distribution: great
transformation.
8
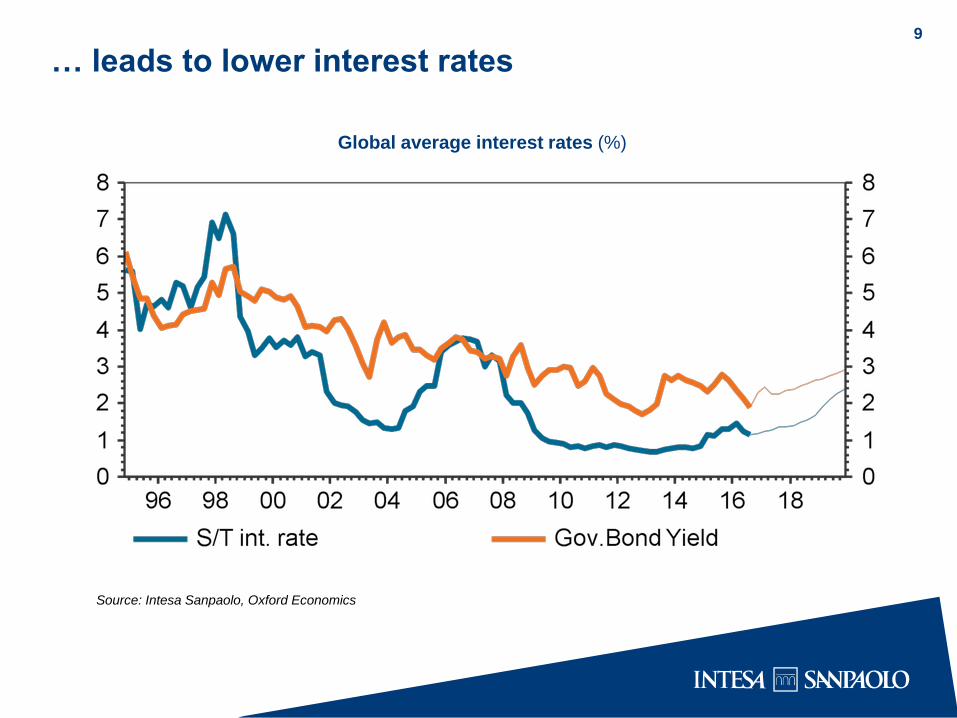
Global average interest rates (%)
Source: Intesa Sanpaolo, Oxford Economics
9
… leads to lower interest rates

Credit gap: 2017 vs. the pre-crisis years
Note: Credit-to-GDP gap is defined as the difference between the credit-to-GDP ratio and its long-term trend, in percentage points. Long-term trend is calculated using a one-sided Hodrick-Prescott filter with a smoothing parameter of 400,000.
Source: calculations on BIS data
10
Despite low interest rates, there is no evidence of credit excesses
-60.0 -50.0 -40.0 -30.0 -20.0 -10.0 0.0 10.0 20.0 30.0 40.0 50.0
Spain
Netherlands
UK
Italy
US
Belgium
Germany
France
Japan
Canada
China
31/03/2017
31/12/2006
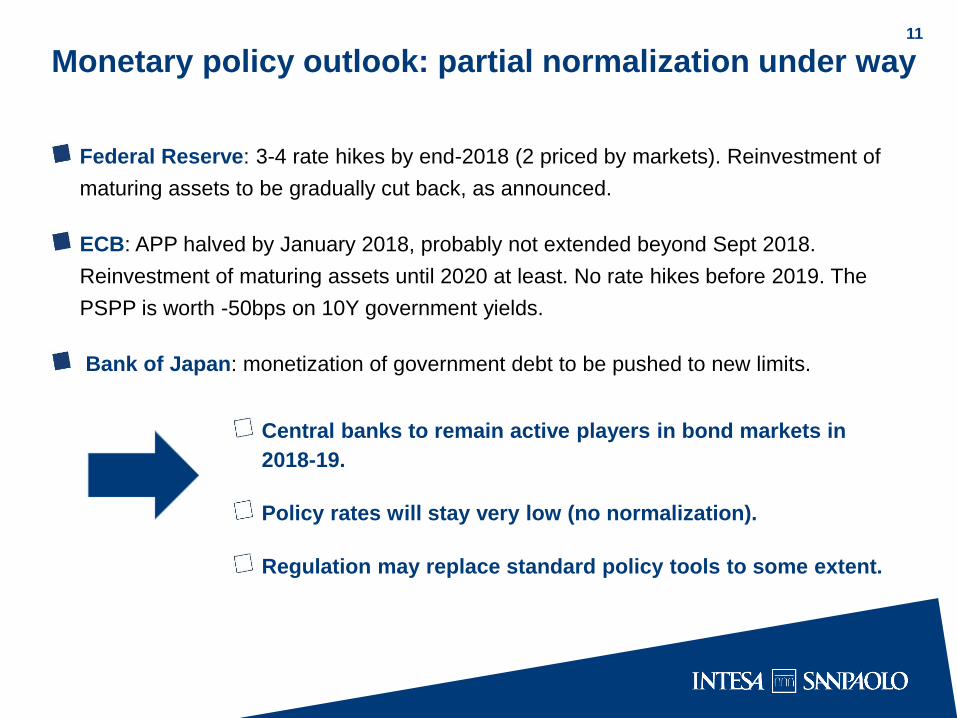
Monetary policy outlook: partial normalization under way 11
Federal Reserve: 3-4 rate hikes by end-2018 (2 priced by markets). Reinvestment of
maturing assets to be gradually cut back, as announced.
ECB: APP halved by January 2018, probably not extended beyond Sept 2018.
Reinvestment of maturing assets until 2020 at least. No rate hikes before 2019. The
PSPP is worth -50bps on 10Y government yields.
Bank of Japan: monetization of government debt to be pushed to new limits.
Central banks to remain active players in bond markets in
2018-19.
Policy rates will stay very low (no normalization).
Regulation may replace standard policy tools to some extent.
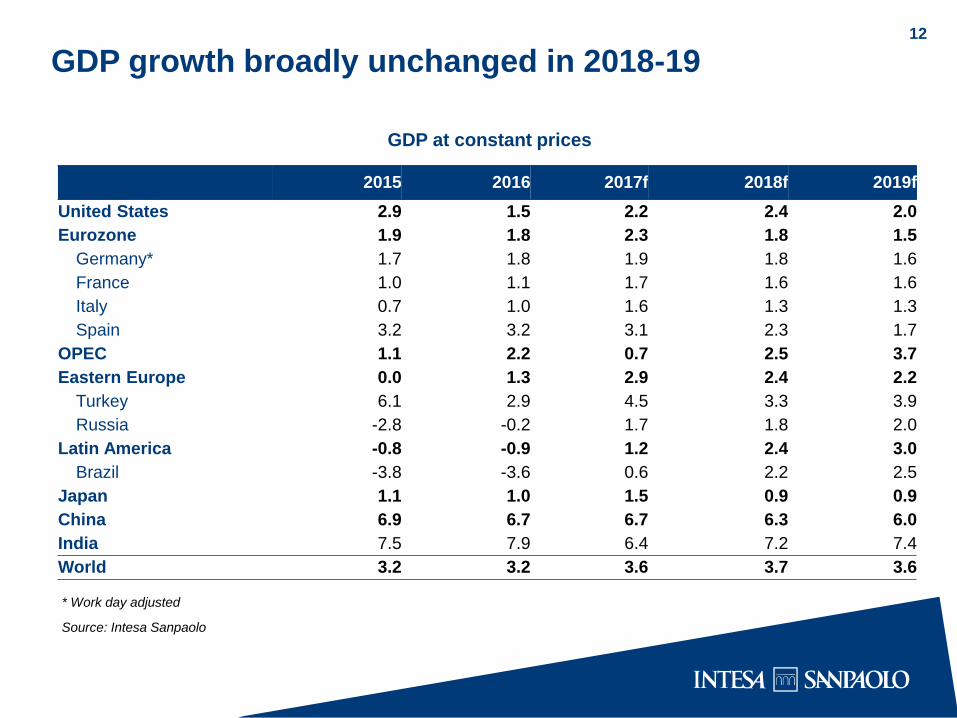
GDP growth broadly unchanged in 2018-19
2015 2016 2017f 2018f 2019f
United States 2.9 1.5 2.2 2.4 2.0
Eurozone 1.9 1.8 2.3 1.8 1.5
Germany* 1.7 1.8 1.9 1.8 1.6
France 1.0 1.1 1.7 1.6 1.6
Italy 0.7 1.0 1.6 1.3 1.3
Spain 3.2 3.2 3.1 2.3 1.7
OPEC 1.1 2.2 0.7 2.5 3.7
Eastern Europe 0.0 1.3 2.9 2.4 2.2
Turkey 6.1 2.9 4.5 3.3 3.9
Russia -2.8 -0.2 1.7 1.8 2.0
Latin America -0.8 -0.9 1.2 2.4 3.0
Brazil -3.8 -3.6 0.6 2.2 2.5
Japan 1.1 1.0 1.5 0.9 0.9
China 6.9 6.7 6.7 6.3 6.0
India 7.5 7.9 6.4 7.2 7.4
World 3.2 3.2 3.6 3.7 3.6
* Work day adjusted
Source: Intesa Sanpaolo
GDP at constant prices
12
What can kill this global expansion? 13
Major policy tightening? Very unlikely in next 2 years.
Saturation of demand for durable goods (vehicles especially)? Unlikely in a
synchronized way.
Building-up of excess capacity? Unlikely, the investment rate is still low among
advanced countries.
Political backlash of the trend towards a higher share of profits and more income
inequality.
Financial crisis: no signs of credit bubbles in advanced countries. However, signals are
far more worrying for China. Besides, there are signs of increasing financial distress for
nonfinancial companies in EM and some advanced countries.
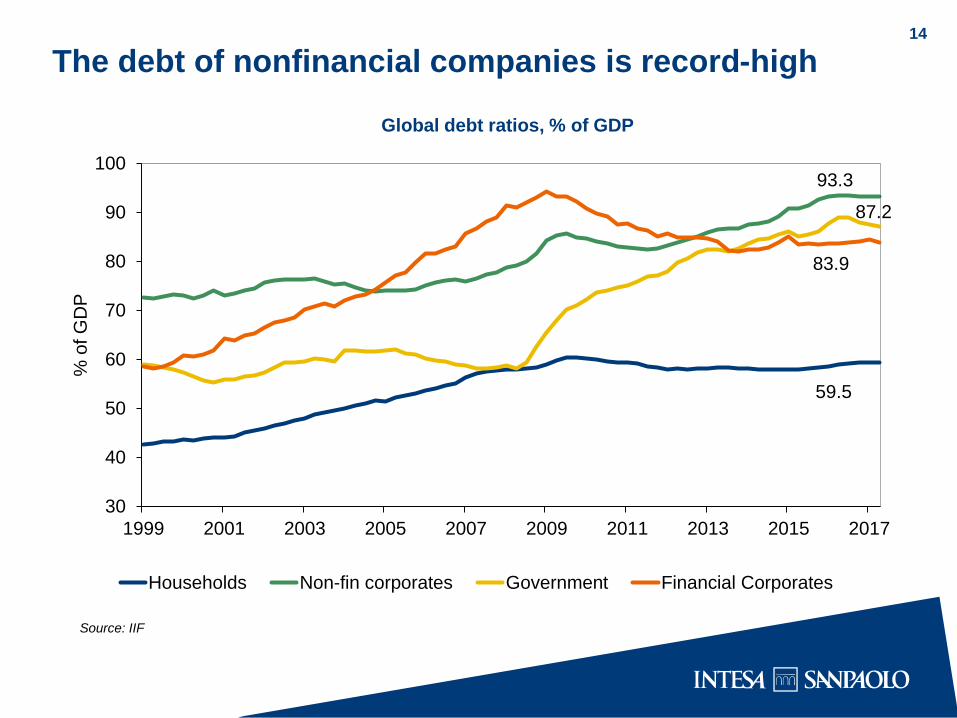
The debt of nonfinancial companies is record-high
Global debt ratios, % of GDP
Source: IIF
14
59.5
93.3
87.2
83.9
30
40
50
60
70
80
90
100
1999 2001 2003 2005 2007 2009 2011 2013 2015 2017
% o
f G
DP
Households Non-fin corporates Government Financial Corporates

Share of firms with ICR<1
Note: ICR = EBIT/interest expenses; data exclude financial corporates
Source: IIF, Global Debt Monitor
15
The share of firms under financial stress is rising in most countries

Agenda 16
2
1
A rather unusual global economic expansion
A closer look at Italy and the Eurozone

Euro Area: a long expansionary phase
2017 growth expected at 2.3%. The phase of maximum acceleration should be behind.
The appreciation of the effective exchange rate (+6% since early-April) will not derail
the recovery. Growth is expected at 1.8% and 1.5% in 2018 and 2019, respectively.
Recovery in the labour market is still fragile (employment and wages).
Inflation is still far from the 2% target.
Political risk remains in the background. The outcome of the Austrian elections and
the success of AfD in Germany indicate that populisms are still alive. Market worries
about the Catalan crisis seem to have receded.
17

18
The ECB will reduce purchases, mainly of government bonds
The overall worth of the EAPP has increased from 2,280 to 2,550 billion euros. The
residual amount to purchase by September 2018 is 420 billion euros..
Starting in January 2018, the share of government bonds will drop from 76% to
65% of the total EAPP.
In the euro area, we estimate net issues (net of Eurosystem purchases), including
the rollover of bonds reaching maturity, in negative territory by 45 billion euros,
compared to -202 billion in 2017 and -273 billion in 2016.
In Italy, based on our estimates, net issues net of official purchases will be positive
by 6 billion euros in 2018, compared to -38 billion this year.

In 2018, net issuance flows (net of ECB) will be still marginally negative in core countries
19
Note: Calculations assume that the ECB will extend the purchase programme
into 4Q 2018 as well, at a pace of 10 billion euros.
Source: ECB, Bloomberg, Intesa Sanpaolo
Euro area: net issuance net of PSPP and reinvestments (EUR Bn)
-250
-200
-150
-100
-50
0
50
2018 2017
Total Eurozone Core Euro Peripherals (IT, ES, PT, IE)

Italy: net issuance flows (net of ECB) will be nearly zero in 2018
20
Italy: net issuance net of PSPP and reinvestments (EUR Bn)
Note: Calculations assume that the ECB will extend the purchase programme
into 4Q 2018 as well, at a pace of 10 billion euros. Also, government bonds are
estimated to account for 80% of the PSPP.
Source: ECB, Bloomberg, Intesa Sanpaolo
50 48
3
- 51 -60
-40
-20
0
20
40
60
2018 2017
Net issues Net issues net PSPP & reinvestments

Italy: GDP growth higher than expected 21
Source: Thomson Reuters-Datastream Charting, Istat and Intesa Sanpaolo calculations
Italian GDP grew by 0.5%
qoq in Q3, up from 0.3% qoq
in Q2. Annual growth gained
pace to 1.8%, a record in 6
and a half years.
We expect the baton of
recovery to be passed from
consumption to
investments, which have
been rather disappointing in
recent quarters.
GDP gained pace in Q3, led by
acceleration in the industrial sector

19
20
21
22
23
24
25
40
41
42
43
44
45
46
Mar-08 Oct-09 May-11 Dec-12 Jul-14 Feb-16
Profit share
Investment rate (rhs)
Capital spending will be supported
by improving economic outlook
Core investments: there is room for stronger recovery 22
Firms have been reluctant to invest in the first stage of recovery. Profitability struggled
to rebound from recent lows.
Yet, obsolescence of equipment, expectations of ongoing recovery of final demand and
persisting accommodative financial conditions should lead to more significant growth
of core business investments in 2018.
Source: Intesa Sanpaolo calculations on Istat data
Profits and investments
(as a % of V.A.)
Note: Profit share = Gross operating surplus of non-financial
corporations divided by gross value added.
Source: Intesa Sanpaolo calculations on Istat data
gap
The Industry 4.0 Plan will be confirmed into 2018
Source: MISE
23
Hyper-amortization: a fiscal measure that allows companies to fiscally deduct a 250%
higher costs versus the cost paid for investments for the technological and digital
transformation of the companies.
Super-amortization: a 40% increase in tax deduction of the new capital good.
Capital goods – ”Sabatini Ter”: preferential financing (the incentive covers part of the
interests on the bank loans) to SME to facilitate the purchase of new machinery, capital
goods, equipment.
Guarantee Fund: to facilitate SME access to financing through state guarantee on bank
loans.
Patent box: Optional Tax Regime. The regime is an elective tax regime granting 50%
exemption from corporate tax and local tax on income derived from the licensing or the
exploitation of qualifying intellectual property.
Tax credit: a tax credit of 50% on incremental costs for R&D expenses.
In total, all these measures should be worth around 25 billion euros from 2016 to
2025.
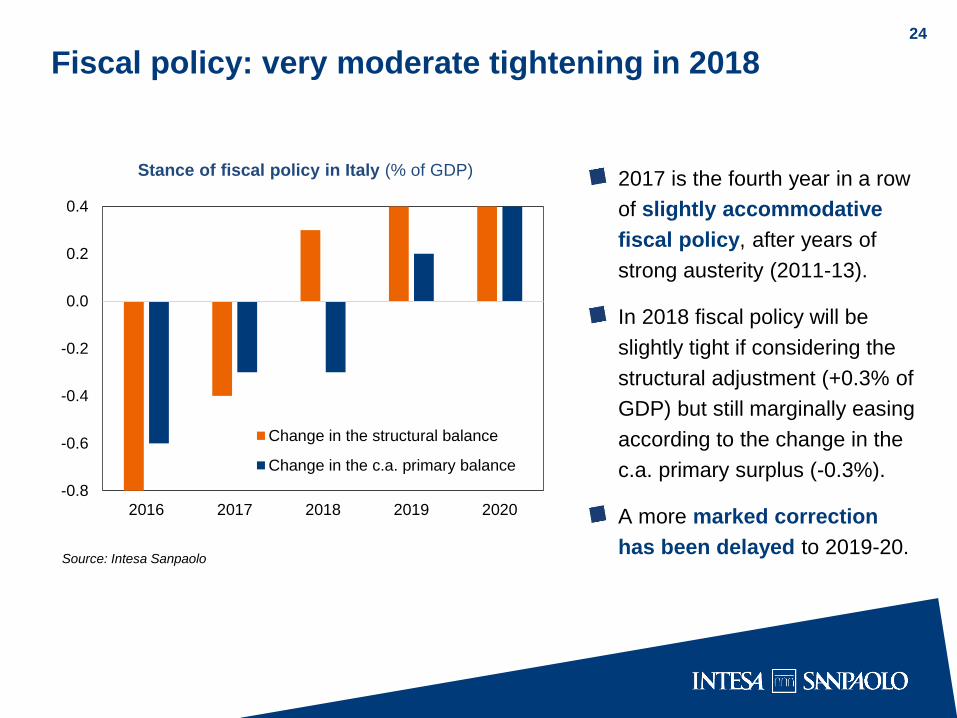
Fiscal policy: very moderate tightening in 2018 24
Source: Intesa Sanpaolo
Stance of fiscal policy in Italy (% of GDP) 2017 is the fourth year in a row
of slightly accommodative
fiscal policy, after years of
strong austerity (2011-13).
In 2018 fiscal policy will be
slightly tight if considering the
structural adjustment (+0.3% of
GDP) but still marginally easing
according to the change in the
c.a. primary surplus (-0.3%).
A more marked correction
has been delayed to 2019-20.
-0.8
-0.6
-0.4
-0.2
0.0
0.2
0.4
2016 2017 2018 2019 2020
Change in the structural balance
Change in the c.a. primary balance

Forming a government may not be easy
If compared with the previous system (almost entirely proportional, and different for the
two Houses of Parliament), the electoral reform reduces, but does not eliminate, the
risk of a hung parliament.
Under the new system coalitions will be “light” i.e. the Rosatellum allows merely
electoral agreements without a single coalition leader and programme. In the current
fragmented political framework, nothing would prevent parties, after the elections, to quit
coalitions and form a government with parties coming from a different electoral alliance.
It seems marginally more likely that a grand coalition government including the
Democratic Party, centrist parties and Forza Italia can count on the majority of seats in the
Parliament.
The Italian political system may have to develop soft forms of cooperation among
political parties, potentially allowing for minority governments and variable majorities on
measures which require parliamentary approval. Indeed, this system is working in other
European countries.
In the longer run, M5S could be open to negotiations/agreements with mainstream parties,
and accept the need for compromises.
25
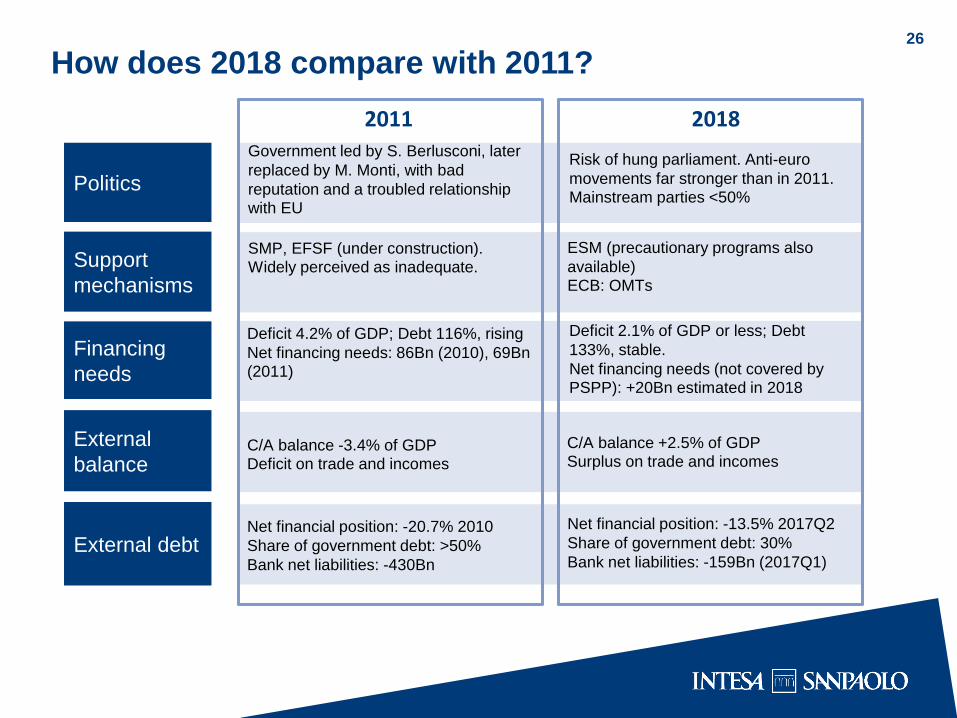
How does 2018 compare with 2011?
Politics
Support
mechanisms
Financing
needs
External
balance
External debt
2011 2018
ESM (precautionary programs also
available) ECB: OMTs
SMP, EFSF (under construction). Widely perceived as inadequate.
Government led by S. Berlusconi, later
replaced by M. Monti, with bad
reputation and a troubled relationship with EU
Risk of hung parliament. Anti-euro
movements far stronger than in 2011. Mainstream parties <50%
Deficit 4.2% of GDP; Debt 116%, rising
Net financing needs: 86Bn (2010), 69Bn
(2011)
Deficit 2.1% of GDP or less; Debt
133%, stable.
Net financing needs (not covered by PSPP): +20Bn estimated in 2018
C/A balance -3.4% of GDP Deficit on trade and incomes
C/A balance +2.5% of GDP
Surplus on trade and incomes
Net financial position: -20.7% 2010
Share of government debt: >50%
Bank net liabilities: -430Bn
Net financial position: -13.5% 2017Q2
Share of government debt: 30%
Bank net liabilities: -159Bn (2017Q1)
26

Appendix (1/2) Analyst Certification
The financial analysts who prepared this report, and whose names and roles appear on the next page, certify that:
(1) The views expressed on companies mentioned herein accurately reflect independent, fair and balanced personal views;
(2) No direct or indirect compensation has been or will be received in exchange for any views expressed.
Specific disclosures:
The analysts who prepared this report do not receive bonuses, salaries, or any other form of compensation that is based upon specific investment banking
transactions.
Important Disclosures
This research has been prepared by Intesa Sanpaolo S.p.A. and distributed by Banca IMI S.p.A. Milan, Banca IMI SpA-London Branch (a member of the London
Stock Exchange) and Banca IMI Securities Corp (a member of the NYSE and NASD). Intesa Sanpaolo S.p.A. accepts full responsibility for the contents of this report.
Please also note that Intesa Sanpaolo S.p.A. reserves the right to issue this document to its own clients. Banca IMI S.p.A. and Intesa Sanpaolo S.p.A. are both part of
the Gruppo Intesa Sanpaolo. Intesa Sanpaolo S.p.A. and Banca IMI S.p.A. are both Authorised by the Banca d’Italia and subject to limited regulation by the Financial
Conduct Authority and Prudential Regulation Authority.
Details of the extent of our regulation by the Financial Conduct Authority and Prudential Regulation Authority are available from us on request.
Opinions and estimates in this research are as at the date of this material and are subject to change without notice to the recipient. Information and opinions have
been obtained from sources believed to be reliable, but no representation or warranty is made as to their accuracy or correctness.
Past performance is not a guarantee of future results.
The investments and strategies discussed in this research may not be suitable for all investors. If you are in any doubt you should consult your investment advisor.
This report has been prepared solely for information purposes and is not intended as an offer or solicitation with respect to the purchase or sale of any financial
products. It should not be regarded as a substitute for the exercise of the recipient’s own judgement.
No Intesa Sanpaolo S.p.A. or Banca IMI S.p.A. entities accept any liability whatsoever for any direct, consequential or indirect loss arising from any use of material
contained in this report.
This document may only be reproduced or published together with the name of Intesa Sanpaolo S.p.A. and Banca IMI S.p.A..
Intesa Sanpaolo S.p.A. and Banca IMI S.p.A. have in place a Joint Conflicts Management Policy for managing effectively the conflicts of interest which might affect
the impartiality of all investment research which is held out, or where it is reasonable for the user to rely on the research, as being an impartial assessment of the
value or prospects of its subject matter. A copy of this Policy is available to the recipient of this research upon making a written request to the Compliance Officer,
Intesa Sanpaolo S.p.A., 90 Queen Street, London EC4N 1SA.
Intesa Sanpaolo S.p.A. has formalised a set of principles and procedures for dealing with conflicts of interest (“Research Po licy”). The Research Policy is clearly
explained in the relevant section of Banca IMI’s web site (www.bancaimi.com).
Member companies of the Intesa Sanpaolo Group, or their directors and/or representatives and/or employees and/or members of their households, may have a long
or short position in any securities mentioned at any time, and may make a purchase and/or sale, or offer to make a purchase and/or sale, of any of the securities from
time to time in the open market or otherwise.
Intesa Sanpaolo S.p.A. issues and circulates research to Qualified Institutional Investors in the USA only through Banca IMI Securities Corp., 1 William Street, New
York, NY 10004, USA, Tel: (1) 212 326 1199.

Appendix (2/2)
Residents in Italy: This document is intended for distribution only to professional investors as defined in art.31, Consob Regulation no. 11522 of 1.07.1998 either
as a printed document and/or in electronic form.
Person and residents in the UK: This document is not for distribution in the United Kingdom to persons who would be defined as private customers under rules of
FCA and PRA.
US persons: This document is intended for distribution in the United States only to Qualified Institutional Investors as defined in Rule 144a of the Securities Act of
1933. US Customers wishing to effect a transaction should do so only by contacting a representative at Banca IMI Securities Corp. in the US (see contact details
above).
Valuation Methodology
Trading Ideas are based on the market’s expectations, investors’ positioning and technical, quantitative or qualitative aspec ts. They take into account the key
macro and market events and to what extent they have already been discounted in yields and/or market spreads. They are also based on events which are
expected to affect the market trend in terms of yields and/or spreads in the short-medium term. The Trading Ideas may refer to both cash and derivative
instruments and indicate a precise target or yield range or a yield spread between different market curves or different maturities on the same curve. The relative
valuations may be in terms of yield, asset swap spreads or benchmark spreads.
Coverage Policy And Frequency Of Research Reports
Intesa Sanpaolo S.p.A. trading ideas are made in both a very short time horizon (the current day or subsequent days) or in a horizon ranging from one week to
three months, in conjunction with any exceptional event that affects the issuer’s operations.
In the case of a short note, we advise investors to refer to the most recent report published by Intesa Sanpaolo S.p.A’s Research Department for a full analysis of
valuation methodology, earnings assumptions and risks. Research is available on IMI’s web site (www.bancaimi.com) or by contacting your sales representative.
Report prepared by:
Gregorio De Felice, Chief Economist, Intesa Sanpaolo