the global gender gap report 2011
DESCRIPTION
The Global Gender Gap Index introduced by the World Economic Forum in 2006, is a framework for capturing the magnitude and scope of gender-based disparities and tracking their progress. The Index benchmarks national gender gaps on economic, political, education- and health-based criteria, and provides country rankings that allow for effective comparisons across regions and income groups, and over time. The rankings are designed to create greater awareness among a global audience of the challenges posed by gender gaps and the opportunities created by reducing them. The methodology and quantitative analysis behind the rankings are intended to serve as a basis for designing effective measures for reducing gender gaps.The Index is designed to measure gender-based gaps in access to resources and opportunities in individual countries rather than the actual levels of the available resources and opportunities in those countries. We do this in order to make the Global Gender Gap Index independent from countries’ the levels of development. In other words, the Index is constructed to rank countries on their gender gaps not on their development level. For example, rich countries have more education and health opportunities for all members of society and measures of education levels thus mainly reflect this well-known fact, although it is quite independent of the gender-related issues faced by each country at its own level of income. The Global Gender Gap Index, however, rewards countries for smaller gaps in access to these resources, regardless of the overall level of resources. Thus the Index penalizes or rewards countries based on the size of the gap between male and female enrolment rates, but not for the overall levels of education in the country.TRANSCRIPT

The Global Gender Gap Report 2011Ricardo Hausmann, Harvard UniversityLaura D. Tyson, University of California, BerkeleySaadia Zahidi, World Economic Forum
Insight Report

World Economic ForumGeneva, Switzerland 2011
The Global Gender Gap Report 2011
Ricardo Hausmann, Harvard University
Laura D. Tyson, University of California, Berkeley
Saadia Zahidi, World Economic Forum

The Global Gender Gap Report 2011 is published by the World Economic Forum. The Global Gender Gap Index 2011 is the result of collaboration with faculty at Harvard University and the University of California, Berkeley.
AT THE WORLD ECONOMIC FORUM
Professor Klaus SchwabFounder and Executive Chairman
Börge BrendeManaging Director
Saadia ZahidiSenior Director and Head of Constituents
Yasmina BekhoucheSenior Project Associate, Women Leaders and Gender Parity Programme
Silvia MagnoniCommunity Manager, Women Leaders and Gender Parity Programme
Marc CuénodTeam Coordinator and Research Associate, Constituents
AT HARVARD UNIVERSITY
Professor Ricardo HausmannDirector, Center for International Development
AT UNIVERSITY OF CALIFORNIA, BERKELEY
Professor Laura D. TysonS.K. and Angela Chan Professor of Global Management
Thank you to Hope Steele for her superb copyediting work and Neil Weinberg for his excellent interior graphic design and layout.
We are very grateful to Kamal Kamaoui and the World Economic Forum’s Publications team for their invaluable collaboration on the production of this Report.
The terms country and nation as used in this report do not in all cases refer to a territorial entity that is a state as understood by international law and practice. The term covers well-defined, geographically self-contained economic areas that may not be states but for which statistical data are maintained on a separate and independent basis.
World Economic Forum91-93 route de la CapiteCH-1223 Cologny/GenevaSwitzerlandTel.: +41 (0)22 869 1212Fax: +41 (0)22 786 2744E-mail: [email protected]
© 2011 World Economic ForumAll rights reserved.
No part of this publication may be reproduced or transmitted in any form or by any means, including photocopying and recording, or by any information storage and retrieval system.
ISBN 92-95044-62-2ISBN 978-92-95044-62-3
Contents
Preface ..........................................................................................................vby Klaus Schwab and Saadia Zahidi
PART 1: MEASURING THE GLOBAL GENDER GAP 1
The Global Gender Gap Index 2011 .....................................5by Ricardo Hausmann, Harvard UniversityLaura D. Tyson, University of California, BerkeleyYasmina Bekhouche, World Economic ForumSaadia Zahidi, World Economic Forum
Appendix A: Tracking the Gender Gap over Time ...........................35
Appendix B: Regional and Income Group Classifications, 2011 ......................................................................39
Appendix C: Spread of Minimum and Maximum Values by Indicator, 2011 ..............................................................41
Appendix D: Rankings by Indicator, 2011 ..........................................42
Appendix E: Policy Frameworks for Gender Equality .....................56
PART 2: COUNTRY PROFILES 79
List of Countries .....................................................................81
User’s Guide: How Country Profiles Work .......................83by Yasmina Bekhouche, Marc Cuénod and Saadia Zahidi, World Economic Forum
Country Profiles .....................................................................88
About the Authors and Project Team ............................................... 359
Acknowledgements.............................................................................. 363

Global Gender Gap Report 2011 Measuring the Global Gender Gap v
Given the complexity of the world today and the eco-nomic, demographic, environmental and political transfor-mations we face, we must commit to a new mindset, one that discards old prejudices and inertia and instead com-mits to new ideas and new solutions. Empowering and educating girls and women and leveraging their talent and leadership fully in the global economy, politics and society are fundamental elements of the new models required to succeed in today’s challenging landscape.
The most important determinant of a country’s com-petitiveness is its human talent—the skills, education and productivity of its workforce. Over time, a nation’s com-petitiveness depends significantly on whether and how it utilizes its human resource pool. Furthermore, innovation requires unique ideas, and the best ideas thrive in a di-verse environment. Countries and companies will thrive if women are educated and engaged as fundamental pillars of the economy, and diverse leadership is most likely to find innovative solutions to tackle the current economic challenges and to build equitable and sustainable growth. Governments play an important role in creating the right policy framework for improving women’s education and economic participation. However, it is also the imperative of companies to create ecosystems where the best talent, both male and female, can flourish.
As the world population surpasses the seven billion mark, we are in the midst of history’s most rapid demo-graphic transformations. Countries are in various stages of demographic transition—while some are experiencing a youth bulge, others are rapidly shifting towards an ageing population. Women—in their multiple roles as work-ers, as caregivers, as mothers and as the majority of the world’s older persons—are critical to making this transi-tion a successful one. We must think with a new mindset about issues of family and fertility. We must also take into account the implications of a shrinking working-age population and consider how efficiently the female half of that population is being leveraged. Some of these issues touch upon the core of the social fabric. However, from both a rights perspective and an efficiency viewpoint, it is imperative that we address these topics.
Women have emerged as key civic leaders in the up-rising that launched the Arab Spring. Their role must now be recognized by increasing gender equality in the politi-cal arena in that region and across the globe. In the world today, approximately 20 women serve as elected heads of state or government. At the ministerial and parliament levels, the global average is less than 20%. A system where women are not represented at the highest levels is both an
unequal and an inefficient system. We must design new measures to ensure that women are represented in political decision-making.
Through the Global Gender Gap Report series, the World Economic Forum has been quantifying the magni-tude of gender-based disparities and tracking their progress over time. By providing a comprehensive framework for benchmarking global gender gaps, the Report reveals those countries that are role models in dividing their resources equitably between women and men, regardless of the overall level of those resources. The Report is used by numerous universities, schools, researchers, media enti-ties, businesses, governments and individuals as a tool for their work. In 2008, we launched our Global Gender Parity Group and Regional Gender Parity Groups in Latin America, the Middle East, Africa and Asia. To date, these multi-stakeholder communities of highly influential lead-ers—50% women and 50% men—from business, politics, academia, media and civil society have jointly identified the biggest gaps in each region, and have collectively committed to strategies to improve and increase the use of female talent. In 2012, based on the work of this Group and to complement the gap analysis in the Report, we will release an online repository of information on practices that can help close economic participation gaps.
We would like to express our deep appreciation to Ricardo Hausmann, Director, Center for International Development, Harvard University and to Laura D. Tyson, Professor of Global Management, University of California, Berkeley, for their invaluable contributions to this Report. We would also like to thank Yasmina Bekhouche for her role in the 2011 Index development and Silvia Magnoni and Marc Cuénod for their support of this project at the World Economic Forum.
Our research, and the network of influential lead-ers who work with the World Economic Forum, aim to be at the forefront of driving change in mindset and policy. The Global Gender Gap Index was created with the specific intent of being comparable across time. The 2011 Report aggregates six years of data and provides a snapshot of the situation today as well as the changes over time, revealing a positive trend as the majority of coun-tries continue to make progress on closing the gender gap. It also provides unique new information on the policy frameworks that support women’s economic participa-tion. It is our hope that this Report will serve as a call to action to transform the pace of change on an issue that is fundamental to the growth and sustainability of the global economy and society.
PrefaceKLAUS SCHWAB, Founder and Executive Chairman, World Economic Forum
SAADIA ZAHIDI, Senior Director, World Economic Forum

Part 1Measuring the Global Gender Gap


The Global Gender Gap Index,1 introduced by the World Economic Forum in 2006, is a framework for captur-ing the magnitude and scope of gender-based disparities and tracking their progress. The Index benchmarks na-tional gender gaps on economic, political, education- and health-based criteria, and provides country rankings that allow for effective comparisons across regions and in-come groups, and over time. The rankings are designed to create greater awareness among a global audience of the challenges posed by gender gaps and the opportunities created by reducing them. The methodology and quanti-tative analysis behind the rankings are intended to serve as a basis for designing effective measures for reducing gen-der gaps.
The first part of this chapter reviews the underly-ing concepts employed in creating the Global Gender Gap Index and outlines the methods used to calculate the Index. The second part presents the 2011 rankings, global patterns and regional performance and calls attention to notable country cases. Next, we provide an overview of the links between gender gaps and the economic perfor-mance of countries. In the fourth part of this chapter, we include information on the trends revealed by the Index in the six years that we have been producing it.
The Country Profiles contained in Part 2 of this Report give a more detailed picture of the relative strengths and weaknesses of each country’s performance compared with that of other nations. The first page of each profile contains detailed information on the country’s perfor-mance in 2011. The second page of the profile shows the trends between 2006 and 2011 on the overall Index and four Subindexes as well as over 30 gender-related variables that reflect some of the legal and social factors that affect gender disparity in each country.
Measuring the Global Gender Gap
Three underlying conceptsThere are three basic concepts underlying the Global Gender Gap Index. First, it focuses on measuring gaps rather than levels. Second, it captures gaps in outcome variables rather than gaps in means or input variables.
Third, it ranks countries according to gender equality rather than women’s empowerment. These three concepts are briefly outlined below. For a description of how these concepts are captured by the construction techniques used in the creation of the Index, please see the section below on the Construction of the Index.
Gaps vs. levelsThe Index is designed to measure gender-based gaps in access to resources and opportunities in individual coun-tries rather than the actual levels of the available resources and opportunities in those countries. We do this in order to make the Global Gender Gap Index independent from countries’ the levels of development. In other words, the Index is constructed to rank countries on their gender gaps not on their development level. For example, rich countries have more education and health opportuni-ties for all members of society and measures of education levels thus mainly reflect this well-known fact, although it is quite independent of the gender-related issues faced by each country at its own level of income. The Global Gender Gap Index, however, rewards countries for smaller gaps in access to these resources, regardless of the overall level of resources. Thus the Index penalizes or re-wards countries based on the size of the gap between male and female enrolment rates, but not for the overall levels of education in the country.
Outcomes vs. meansThe second basic concept underlying the Global Gender Gap Index is that it evaluates countries based on outcome variables rather than input measures. Our aim is to pro-vide a snapshot of where men and women stand with regard to some fundamental outcome variables related to basic rights such as health, education, economic par-ticipation and political empowerment. Variables related to country-specific policies, culture or customs—factors that we consider to be “input” or “means” variables—are not included in the Index, but they are displayed in the Country Profiles. For example, the Index includes a variable comparing the gap between men and women in high-skilled jobs such as legislators, senior officials and
The Global Gender Gap Index 2011RICARDO HAUSMANN, Harvard University
LAURA D. TYSON, University of California, Berkeley
YASMINA BEKHOUCHE, World Economic Forum
SAADIA ZAHIDI, World Economic Forum
The Global Gender Gap Index, co-authored by Fiona Greig, Ricardo Hausmann, Laura D. Tyson and Saadia Zahidi, was first introduced in the World Economic Forum’s Global Gender Gap Report 2006. The authors are deeply grateful to Silvia Magnoni and Marc Cuénod for their excellent support in the production of this year’s chapter.
Global Gender Gap Report 2011 Measuring the Global Gender Gap 3

managers (an outcome variable) but does not include data on length of maternity leave (a policy variable).
Gender equality vs. women’s empowermentThe third distinguishing feature of the Global Gender Gap Index is that it ranks countries according to their proxim-ity to gender equality rather than to women’s empower-ment. Our aim is to focus on whether the gap between women and men in the chosen variables has declined, rather than whether women are “winning” the “battle of the sexes”. Hence, the Index rewards countries that reach the point where outcomes for women equal those for men, but it neither rewards nor penalizes cases in which women are outperforming men in particular variables.
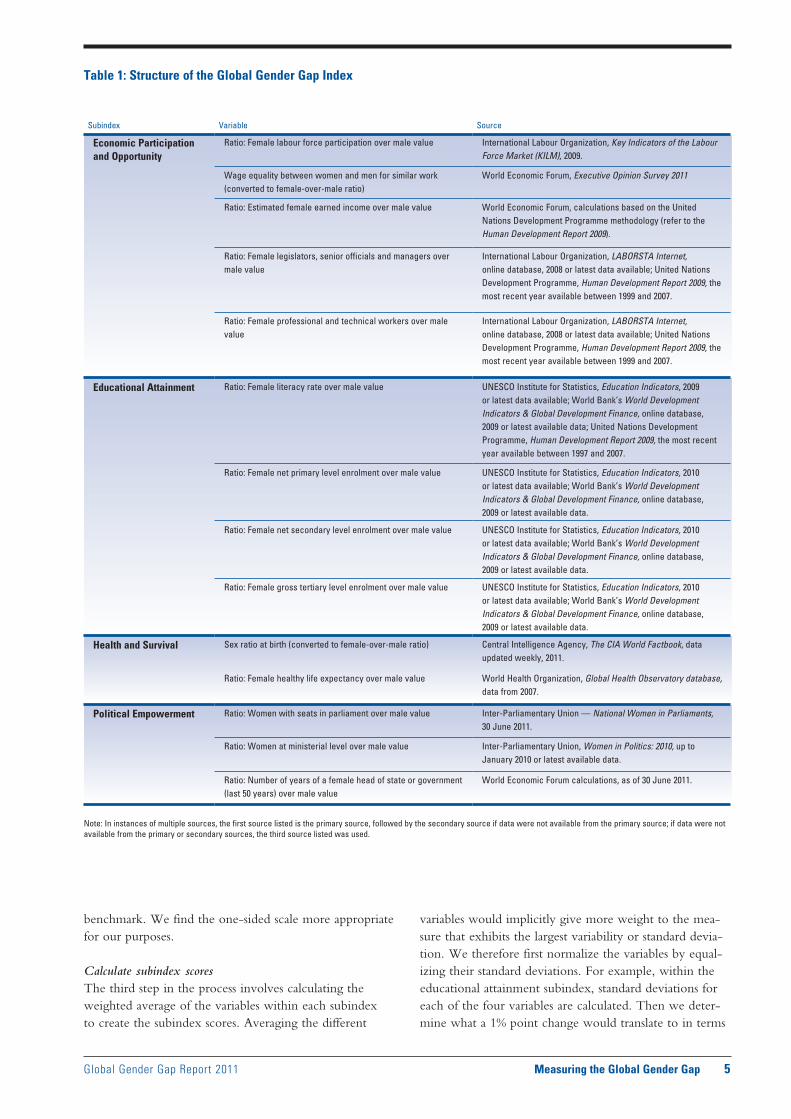
The four pillarsThe Global Gender Gap Index examines the gap between men and women in four fundamental categories: economic participation and opportunity, educational attainment, health and survival and political empowerment. Table 1 displays all four of these subindexes and the 14 different variables that compose them, along with the sources of data used for each.
Economic participation and opportunityThis area is captured through three concepts: the partici-pation gap, the remuneration gap and the advancement gap. The participation gap is captured through the differ-ence in labour force participation rates. The remunera-tion gap is captured through a hard data indicator (ratio of estimated female-to-male earned income) and a quali-tative variable calculated through the World Economic Forum’s Executive Opinion Survey (wage equality for similar work). Finally, the gap between the advancement of women and men is captured through two hard data statistics (the ratio of women to men among legislators, senior officials and managers, and the ratio of women to men among technical and professional workers).
Educational attainmentIn this category, the gap between women’s and men’s current access to education is captured through ratios of women to men in primary-, secondary- and tertiary-level education. A longer-term view of the country’s ability to educate women and men in equal numbers is captured through the ratio of the female literacy rate to the male literacy rate.
Health and survivalThis category attempts to provide an overview of the dif-ferences between women’s and men’s health. To do this, we use two variables. The first variable included in this subindex is the sex ratio at birth. This variable aims spe-cifically to capture the phenomenon of “missing women” prevalent in many countries with a strong son preference. Second, we use the gap between women’s and men’s
healthy life expectancy, calculated by the World Health Organization. This measure provides an estimate of the number of years that women and men can expect to live in good health by taking into account the years lost to violence, disease, malnutrition or other relevant factors.
Political empowermentThis category includes mainly measures of the gap be-tween men and women in political decision-making at the highest levels. This concept is captured through the ratio of women to men in minister-level positions and the ratio of women to men in parliamentary positions. In addition, we include the ratio of women to men in terms of years in executive office (prime minister or president) in the last 50 years. A clear drawback in this category is the absence of any variables capturing differences between the partici-pation of women and men at local levels of government. Should such data become available at a global level in future years, they will be considered for inclusion in the Global Gender Gap Index.
Construction of the IndexThe Global Gender Gap Index is constructed using a four-step process, outlined below.
Convert to ratiosFirst, all data are converted to female/male ratios. For ex-ample, a country with 20% of women in ministerial posi-tions is assigned a ratio of 20 women /80 men = 0.25 on this variable. This is to ensure that the Index is capturing gaps between women and men’s attainment levels, rather than the levels themselves.
Truncate data at equality benchmarkAs a second step, these ratios are truncated at the “equal-ity benchmark”. On all variables, except the two health variables, this equality benchmark is considered to be 1, meaning equal numbers of women and men. In the case of the sex ratio at birth, the equality benchmark is set to be 0.944,2 and the healthy life expectancy benchmark is set to be 1.06.3 Truncating the data at the equality bench-marks for each variable translates to assigning the same score to a country that has reached parity between women and men and one where women have surpassed men.
The type of scale chosen determines whether the Index is rewarding women’s empowerment or gender equality.4 To capture gender equality, two possible scales were considered. One was a negative-positive scale captur-ing the size and direction of the gender gap. This scale essentially penalizes either men’s advantage over women or women’s advantage over men, and gives the highest points to absolute equality. The second was a one-sided scale that measures how close women are to reaching par-ity with men but does not reward or penalize countries for having a gender gap in the other direction. Thus it does not reward countries for having exceeded the parity
4 Measuring the Global Gender Gap Global Gender Gap Report 2011
benchmark. We find the one-sided scale more appropriate for our purposes.
Calculate subindex scoresThe third step in the process involves calculating the weighted average of the variables within each subindex to create the subindex scores. Averaging the different
variables would implicitly give more weight to the mea-sure that exhibits the largest variability or standard devia-tion. We therefore first normalize the variables by equal-izing their standard deviations. For example, within the educational attainment subindex, standard deviations for each of the four variables are calculated. Then we deter-mine what a 1% point change would translate to in terms
Table 1: Structure of the Global Gender Gap Index
Subindex Variable Source
Economic Participation and Opportunity
Ratio: Female labour force participation over male value International Labour Organization, Key Indicators of the Labour Force Market (KILM), 2009.
Wage equality between women and men for similar work (converted to female-over-male ratio)
World Economic Forum, Executive Opinion Survey 2011
Ratio: Estimated female earned income over male value World Economic Forum, calculations based on the United Nations Development Programme methodology (refer to the Human Development Report 2009).
Ratio: Female legislators, senior officials and managers over male value
International Labour Organization, LABORSTA Internet, online database, 2008 or latest data available; United Nations Development Programme, Human Development Report 2009, the most recent year available between 1999 and 2007.
Ratio: Female professional and technical workers over male value
International Labour Organization, LABORSTA Internet, online database, 2008 or latest data available; United Nations Development Programme, Human Development Report 2009, the most recent year available between 1999 and 2007.
Educational Attainment Ratio: Female literacy rate over male value UNESCO Institute for Statistics, Education Indicators, 2009 or latest data available; World Bank’s World Development Indicators & Global Development Finance, online database, 2009 or latest available data; United Nations Development Programme, Human Development Report 2009, the most recent year available between 1997 and 2007.
Ratio: Female net primary level enrolment over male value UNESCO Institute for Statistics, Education Indicators, 2010 or latest data available; World Bank’s World Development Indicators & Global Development Finance, online database, 2009 or latest available data.
Ratio: Female net secondary level enrolment over male value UNESCO Institute for Statistics, Education Indicators, 2010 or latest data available; World Bank’s World Development Indicators & Global Development Finance, online database, 2009 or latest available data.
Ratio: Female gross tertiary level enrolment over male value UNESCO Institute for Statistics, Education Indicators, 2010 or latest data available; World Bank’s World Development Indicators & Global Development Finance, online database, 2009 or latest available data.
Health and Survival Sex ratio at birth (converted to female-over-male ratio) Central Intelligence Agency, The CIA World Factbook, data updated weekly, 2011.
Ratio: Female healthy life expectancy over male value World Health Organization, Global Health Observatory database, data from 2007.
Political Empowerment Ratio: Women with seats in parliament over male value Inter-Parliamentary Union — National Women in Parliaments, 30 June 2011.
Ratio: Women at ministerial level over male value Inter-Parliamentary Union, Women in Politics: 2010, up to January 2010 or latest available data.
Ratio: Number of years of a female head of state or government (last 50 years) over male value
World Economic Forum calculations, as of 30 June 2011.
Note: In instances of multiple sources, the first source listed is the primary source, followed by the secondary source if data were not available from the primary source; if data were not available from the primary or secondary sources, the third source listed was used.
Global Gender Gap Report 2011 Measuring the Global Gender Gap 5

of standard deviations by dividing 0.01 by the standard deviation for each variable. These four values are then used as weights to calculate the weighted average of the four variables. This way of weighting variables essentially allows us to make sure that each variable has the same relative impact on the subindex. For example, a variable with a small variability or standard deviation, such as pri-mary enrolment rate, gets a larger weight within the edu-cational attainment subindex than a variable with a larger variability, such as tertiary enrolment rate. Therefore, a country with a large gender gap in primary education (a variable where most countries have achieved near-parity between women and men) will be more heavily penal-ized. Similarly, within the health and survival subindex, in the case of the sex ratio variable, where most countries have a very high sex ratio and the spread of the data is small, the larger weight will penalize more heavily those countries that deviate from this value. Table 2 displays the values of the weights used in the Global Gender Gap Index 2006.5
Calculate final scoresIn the case of all subindexes, the highest possible score is 1 (equality) and the lowest possible score is 0 (inequality), thus binding the scores between inequality and equal-ity benchmarks.6 An un-weighted average of each sub-index score is taken to create the overall Global Gender Gap Index score. As in the case of the subindexes, this
final value is bound between 1 (equality) and 0 (inequal-ity), thus allowing for comparisons relative to ideal stan-dards of equality in addition to relative country rankings.7 The equality and inequality benchmarks remain fixed across time, allowing the reader to track individual coun-try progress in relation to an ideal standard of equality. Furthermore, we hope that the option of roughly inter-preting the final Index scores as a percentage value that reveals how much of the gender gap a country has closed makes the Index more intuitively appealing to readers.8
The Global Gender Gap Index 2011 rankingsWe aim to include a maximum number of countries in the Report every year, within the constraints posed by data availability. To be included in the Report, a country must have data available for a minimum of 12 indicators out of the 14 that enter the Index.
Country coverage 2011In 2011, we have been able to include all 134 countries covered in the 2010 edition of the Report as well as one new country—Burundi—thus resulting in a total of 135 countries. Of these, 114 have been included in the Report since the first edition and another 13 since the second edition.
Nearly 200 countries were considered for inclu-sion this year. Out of the 135 ultimately covered in
Table 2: Calculation of weights within each subindex
Standard Standard deviation Economic Participation and Opportunity Subindex deviation per 1% point change Weight
Ratio: Female labour force participation over male value 0.160 0.063 0.199
Wage equality between women and men for similar work (converted to female-over-male ratio) 0.103 0.097 0.310
Ratio: Estimated female earned income over male value 0.144 0.069 0.221
Ratio: Female legislators, senior officials, and managers over male value 0.214 0.047 0.149
Ratio: Female professional and technical workers over male value 0.262 0.038 0.121
TOTAL ............................................................................................................................................................................................................................... 1
Standard Standard deviation Educational Attainment Subindex deviation per 1% point change Weight
Ratio: Female literacy rate over male value 0.145 0.069 0.191
Ratio: Female net primary level enrolment over male value 0.060 0.167 0.459
Ratio: Female net secondary level enrolment over male value 0.120 0.083 0.230
Ratio: Female gross tertiary enrolment over male value 0.228 0.044 0.121
TOTAL ............................................................................................................................................................................................................................... 1
Standard Standard deviation Health and Survival Subindex deviation per 1% point change Weight
Ratio: Female healthy life expectancy over male value 0.023 0.441 0.307
Sex ratio at birth (converted to female-over-male ratio) 0.010 0.998 0.693
TOTAL ............................................................................................................................................................................................................................... 1
Standard Standard deviation Health and Survival Subindex deviation per 1% point change Weight
Ratio: Women with seats in parliament over male value 0.166 0.060 0.310
Ratio: Women at ministerial level over male value 0.208 0.048 0.247
Ratio: Number of years of a female head of state (last 50 years) over male value 0.116 0.086 0.443
TOTAL ............................................................................................................................................................................................................................... 1
6 Measuring the Global Gender Gap Global Gender Gap Report 2011
this Report, 19 countries had one data point missing: Angola (Professional and technical workers); Benin (Professional and technical workers); Brunei Darussalam (Women in parliament); Chad (Professional and techni-cal workers); Ghana (Professional and technical workers); Guyana (Enrolment in secondary education); Honduras (Enrolment in secondary education); India (Professional and technical workers); Jordan (Legislators and techni-cal workers); Kenya (Professional and technical workers); Luxembourg (Professional and technical workers); Malawi (Professional and technical workers); Maldives (Wage equality for similar work [survey]); Mali (Professional and technical workers); Pakistan (Estimated earned income [PPP US$]); Russian Federation (Enrolment in second-ary education); Singapore (Enrolment in tertiary educa-tion); Tunisia (Professional and technical workers); and Zimbabwe (Estimated earned income [PPP US$]).
Another 12 countries had two variables miss-ing: Albania (Legislators, senior officials and managers; Professional and technical workers); Bahamas (Wage equality for similar work [survey]; (Estimated earned income [PPP US$]); Burundi (Legislators, senior offi-cials and managers; Professional and technical workers); Côte d’Ivoire (Legislators, senior officials, and managers; Professional and technical workers); Cuba (Wage equal-ity for similar work [survey]; Estimated earned income [PPP US$]); Fiji (Wage equality for similar work (survey); Women in parliament); Gambia (Legislators, senior of-ficials, and managers; Professional and technical workers);
Guatemala (Legislators, senior officials, and manag-ers; Professional and technical workers); Mozambique (Legislators, senior officials, and managers; Professional and technical workers); Nigeria (Legislators, senior of-ficials, and managers; Professional and technical work-ers); Senegal (Legislators, senior officials, and manag-ers; Professional and technical workers); and Tajikistan (Legislators, senior officials, and managers; Professional and technical workers).
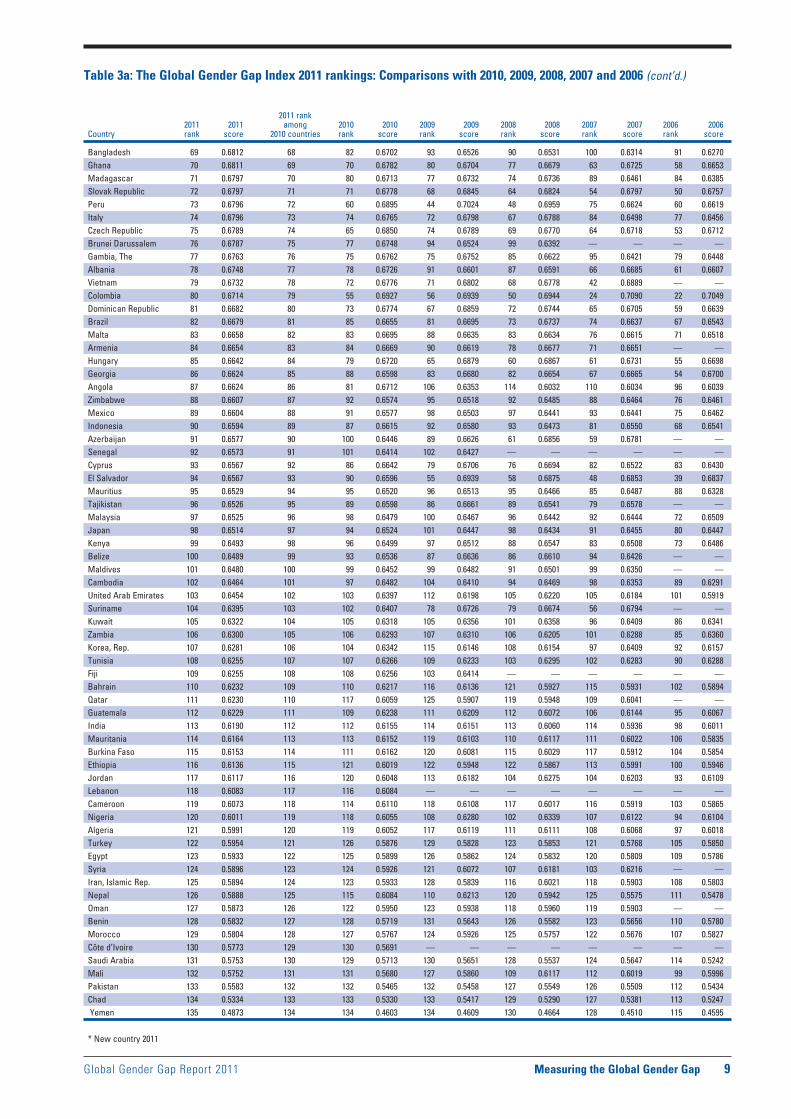
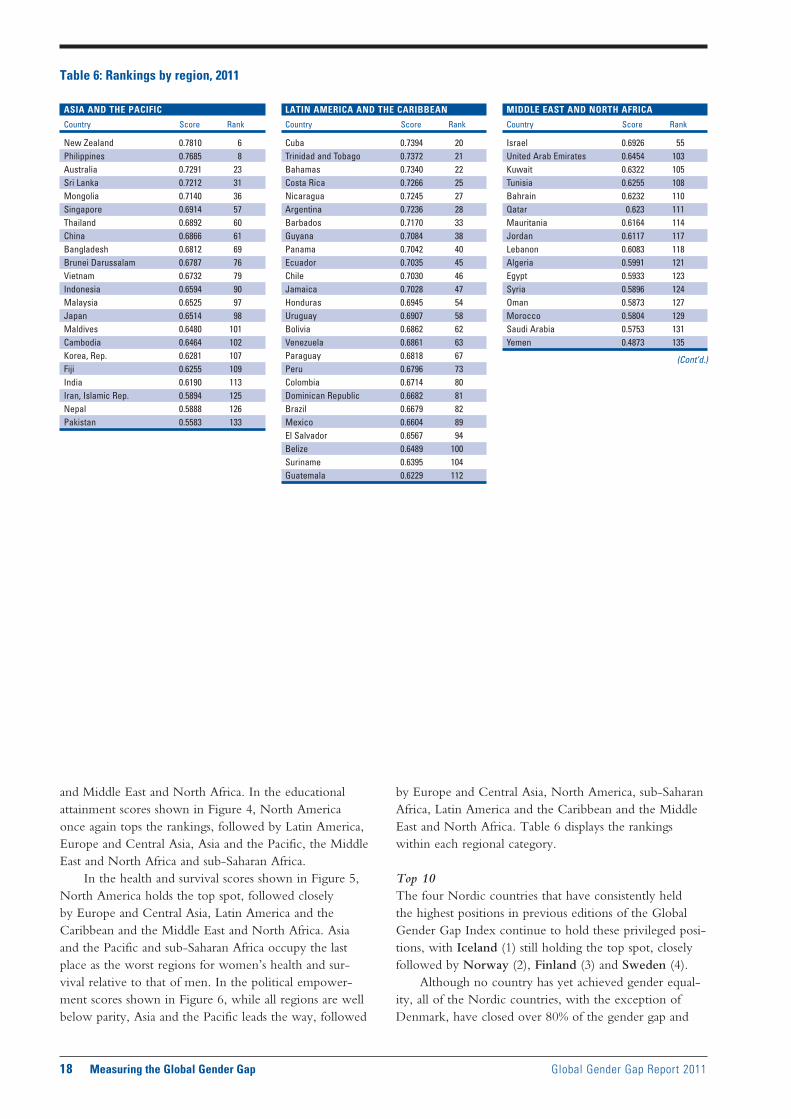
Global patternsThe detailed rankings from this year’s Index are shown in Tables 3 through 5.
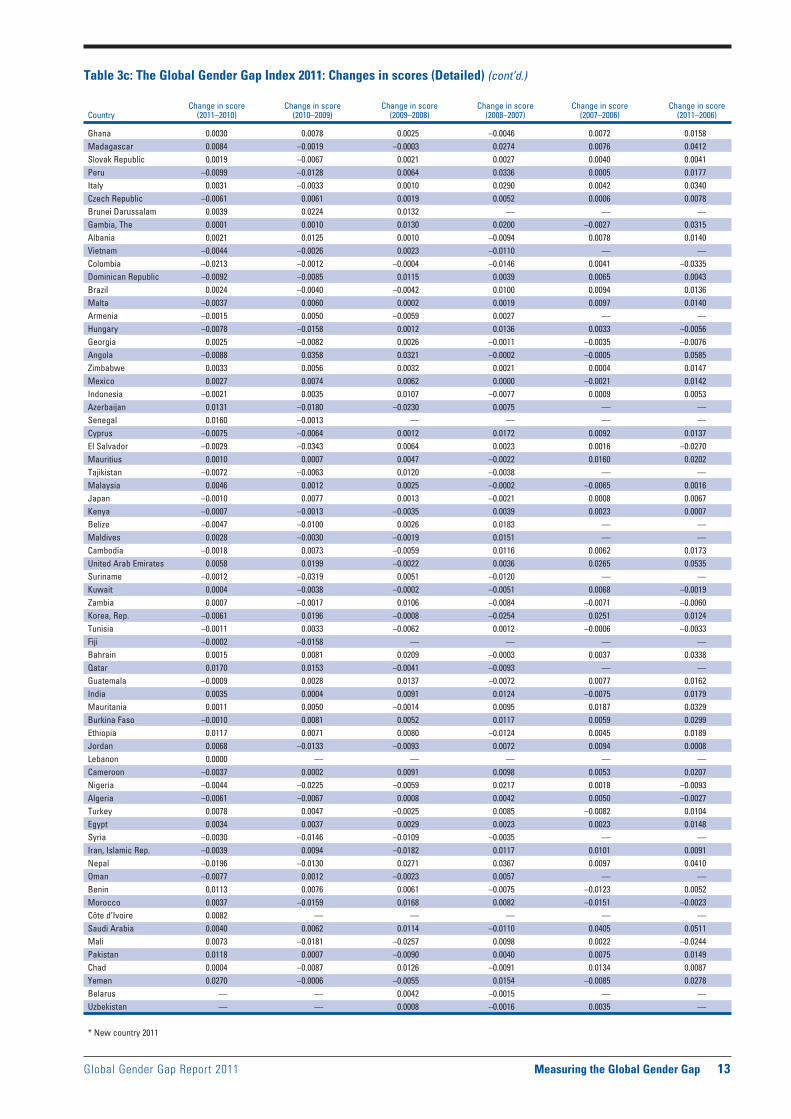
Table 3a displays the 2011 rankings and provides comparisons with rankings in 2010, 2009, 2008, 2007 and 2006. Table 3b displays the complete 2011 rankings, including the four subindex scores and ranks. Table 3c provides the year-to-year score changes over the last six years. Out of the 114 countries that have been covered in 2006, 2007, 2008, 2009, 2010 and 2011, 97 countries (85%) have improved their performance over the last four years, while 17 (15%) have shown widening gaps.
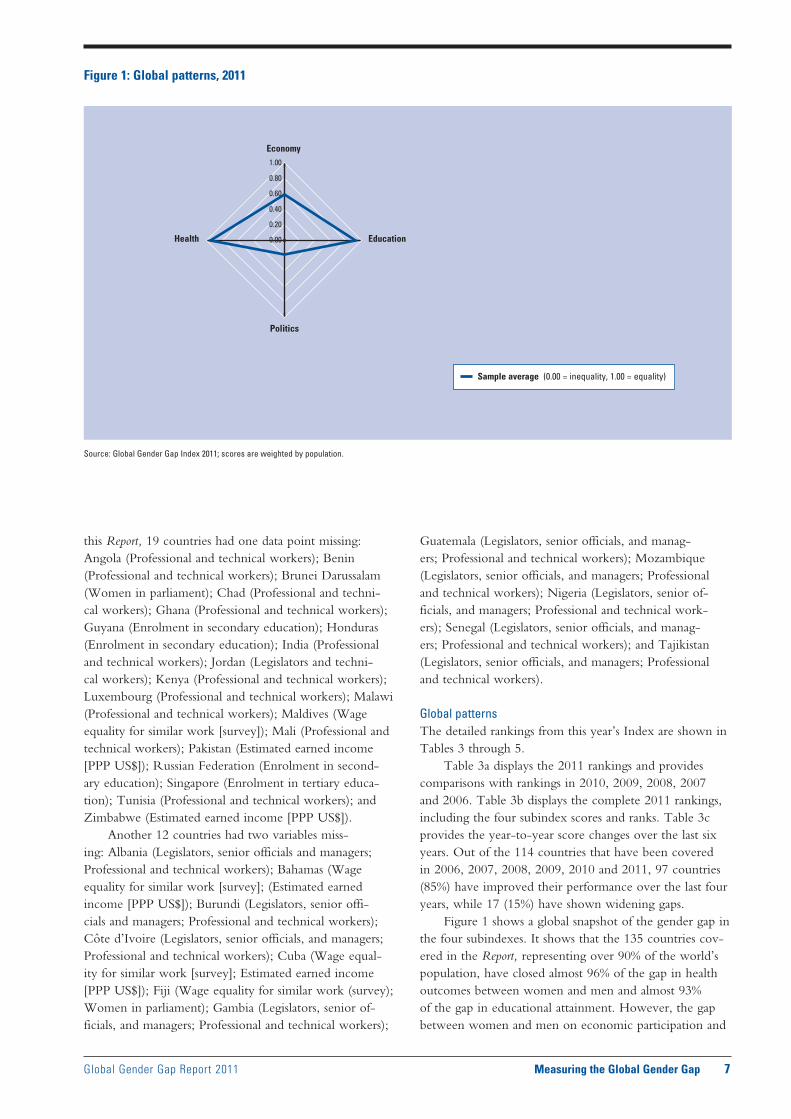
Figure 1 shows a global snapshot of the gender gap in the four subindexes. It shows that the 135 countries cov-ered in the Report, representing over 90% of the world’s population, have closed almost 96% of the gap in health outcomes between women and men and almost 93% of the gap in educational attainment. However, the gap between women and men on economic participation and
0.00
0.20
0.40
0.60
0.80
1.00
Economy
Education
Politics
Health
Sample average (0.00 = inequality, 1.00 = equality)
Figure 1: Global patterns, 2011
Source: Global Gender Gap Index 2011; scores are weighted by population.
Global Gender Gap Report 2011 Measuring the Global Gender Gap 7

8 Measuring the Global Gender Gap Global Gender Gap Report 2011
Table 3a: The Global Gender Gap Index 2011 rankings: Comparisons with 2010, 2009, 2008, 2007 and 2006
2011 rank 2011 2011 among 2010 2010 2009 2009 2008 2008 2007 2007 2006 2006 Country rank score 2010 countries rank score rank score rank score rank score rank score
Iceland 1 0.8530 1 1 0.8496 1 0.8276 4 0.7999 4 0.7836 4 0.7813Norway 2 0.8404 2 2 0.8404 3 0.8227 1 0.8239 2 0.8059 2 0.7994Finland 3 0.8383 3 3 0.8260 2 0.8252 2 0.8195 3 0.8044 3 0.7958Sweden 4 0.8044 4 4 0.8024 4 0.8139 3 0.8139 1 0.8146 1 0.8133Ireland 5 0.7830 5 6 0.7773 8 0.7597 8 0.7518 9 0.7457 10 0.7335New Zealand 6 0.7810 6 5 0.7808 5 0.7880 5 0.7859 5 0.7649 7 0.7509Denmark 7 0.7778 7 7 0.7719 7 0.7628 7 0.7538 8 0.7519 8 0.7462Philippines 8 0.7685 8 9 0.7654 9 0.7579 6 0.7568 6 0.7629 6 0.7516Lesotho 9 0.7666 9 8 0.7678 10 0.7495 16 0.7320 26 0.7078 43 0.6807Switzerland 10 0.7627 10 10 0.7562 13 0.7426 14 0.7360 40 0.6924 26 0.6997Germany 11 0.7590 11 13 0.7530 12 0.7449 11 0.7394 7 0.7618 5 0.7524Spain 12 0.7580 12 11 0.7554 17 0.7345 17 0.7281 10 0.7444 11 0.7319Belgium 13 0.7531 13 14 0.7509 33 0.7165 28 0.7163 19 0.7198 20 0.7078South Africa 14 0.7478 14 12 0.7535 6 0.7709 22 0.7232 20 0.7194 18 0.7125Netherlands 15 0.7470 15 17 0.7444 11 0.7490 9 0.7399 12 0.7383 12 0.7250United Kingdom 16 0.7462 16 15 0.7460 15 0.7402 13 0.7366 11 0.7441 9 0.7365United States 17 0.7412 17 19 0.7411 31 0.7173 27 0.7179 31 0.7002 23 0.7042Canada 18 0.7407 18 20 0.7372 25 0.7196 31 0.7136 18 0.7198 14 0.7165Latvia 19 0.7399 19 18 0.7429 14 0.7416 10 0.7397 13 0.7333 19 0.7091Cuba 20 0.7394 20 24 0.7253 29 0.7176 25 0.7195 22 0.7169 — —Trinidad and Tobago 21 0.7372 21 21 0.7353 19 0.7298 19 0.7245 46 0.6859 45 0.6797Bahamas 22 0.7340 22 36 0.7128 28 0.7179 — — — — — —Australia 23 0.7291 23 23 0.7271 20 0.7282 21 0.7241 17 0.7204 15 0.7163Burundi* 24 0.7270 — — — — — — — — — — —Costa Rica 25 0.7266 24 28 0.7194 27 0.7180 32 0.7111 28 0.7014 30 0.6936Mozambique 26 0.7251 25 22 0.7329 26 0.7195 18 0.7266 43 0.6883 — —Nicaragua 27 0.7245 26 30 0.7176 49 0.7002 71 0.6747 90 0.6458 62 0.6566Argentina 28 0.7236 27 29 0.7187 24 0.7211 24 0.7209 33 0.6982 41 0.6829Uganda 29 0.7220 28 33 0.7169 40 0.7067 43 0.6981 50 0.6833 47 0.6797Luxembourg 30 0.7216 29 26 0.7231 63 0.6889 66 0.6802 58 0.6786 56 0.6671Sri Lanka 31 0.7212 30 16 0.7458 16 0.7402 12 0.7371 15 0.7230 13 0.7199Namibia 32 0.7177 31 25 0.7238 32 0.7167 30 0.7141 29 0.7012 38 0.6864Barbados 33 0.7170 32 31 0.7176 21 0.7236 26 0.7188 — — — —Austria 34 0.7165 33 37 0.7091 42 0.7031 29 0.7153 27 0.7060 27 0.6986Portugal 35 0.7144 34 32 0.7171 46 0.7013 39 0.7051 37 0.6959 33 0.6922Mongolia 36 0.7140 35 27 0.7194 22 0.7221 40 0.7049 62 0.6731 42 0.6821Lithuania 37 0.7131 36 35 0.7132 30 0.7175 23 0.7222 14 0.7234 21 0.7077Guyana 38 0.7084 37 38 0.7090 35 0.7108 — — — — — —Moldova 39 0.7083 38 34 0.7160 36 0.7104 20 0.7244 21 0.7172 17 0.7128Panama 40 0.7042 39 39 0.7072 43 0.7024 34 0.7095 38 0.6954 31 0.6935Slovenia 41 0.7041 40 42 0.7047 52 0.6982 51 0.6937 49 0.6842 51 0.6745Poland 42 0.7038 41 43 0.7037 50 0.6998 49 0.6951 60 0.6756 44 0.6802Russian Federation 43 0.7037 42 45 0.7036 51 0.6987 42 0.6994 45 0.6866 49 0.6770Kyrgyz Republic 44 0.7036 43 51 0.6973 41 0.7058 41 0.7045 70 0.6653 52 0.6742Ecuador 45 0.7035 44 40 0.7072 23 0.7220 35 0.7091 44 0.6881 82 0.6433Chile 46 0.7030 45 48 0.7013 64 0.6884 65 0.6818 86 0.6482 78 0.6455Jamaica 47 0.7028 46 44 0.7037 48 0.7013 44 0.6980 39 0.6925 25 0.7014France 48 0.7018 47 46 0.7025 18 0.7331 15 0.7341 51 0.6824 70 0.6520Kazakhstan 49 0.7010 48 41 0.7055 47 0.7013 45 0.6976 32 0.6983 32 0.6928Croatia 50 0.7006 49 53 0.6939 54 0.6944 46 0.6967 16 0.7210 16 0.7145Bulgaria 51 0.6987 50 50 0.6983 38 0.7072 36 0.7077 25 0.7085 37 0.6870Estonia 52 0.6983 51 47 0.7018 37 0.7094 37 0.7076 30 0.7008 29 0.6944Macedonia, FYR 53 0.6966 52 49 0.6996 53 0.6950 53 0.6914 35 0.6967 28 0.6983Honduras 54 0.6945 53 54 0.6927 62 0.6893 47 0.6960 68 0.6661 74 0.6483Israel 55 0.6926 54 52 0.6957 45 0.7019 56 0.6900 36 0.6965 35 0.6889Greece 56 0.6916 55 58 0.6908 85 0.6662 75 0.6727 72 0.6648 69 0.6540Singapore 57 0.6914 56 56 0.6914 84 0.6664 84 0.6625 77 0.6609 65 0.6550Uruguay 58 0.6907 57 59 0.6897 57 0.6936 54 0.6907 78 0.6608 66 0.6549Tanzania 59 0.6904 58 66 0.6829 73 0.6797 38 0.7068 34 0.6969 24 0.7038Thailand 60 0.6892 59 57 0.6910 59 0.6907 52 0.6917 52 0.6815 40 0.6831China 61 0.6866 60 61 0.6881 60 0.6907 57 0.6878 73 0.6643 63 0.6561Bolivia 62 0.6862 61 76 0.6751 82 0.6693 80 0.6667 80 0.6574 87 0.6335Venezuela 63 0.6861 62 64 0.6863 69 0.6839 59 0.6875 55 0.6797 57 0.6664Ukraine 64 0.6861 63 63 0.6869 61 0.6896 62 0.6856 57 0.6790 48 0.6797Malawi 65 0.6850 64 68 0.6824 76 0.6738 81 0.6664 87 0.6480 81 0.6437Botswana 66 0.6832 65 62 0.6876 39 0.7071 63 0.6839 53 0.6797 34 0.6897Paraguay 67 0.6818 66 69 0.6804 66 0.6868 100 0.6379 69 0.6659 64 0.6556Romania 68 0.6812 67 67 0.6826 70 0.6805 70 0.6763 47 0.6859 46 0.6797
(Cont’d.)
Global Gender Gap Report 2011 Measuring the Global Gender Gap 9
Table 3a: The Global Gender Gap Index 2011 rankings: Comparisons with 2010, 2009, 2008, 2007 and 2006 (cont’d.)
2011 rank 2011 2011 among 2010 2010 2009 2009 2008 2008 2007 2007 2006 2006Country rank score 2010 countries rank score rank score rank score rank score rank score
Bangladesh 69 0.6812 68 82 0.6702 93 0.6526 90 0.6531 100 0.6314 91 0.6270Ghana 70 0.6811 69 70 0.6782 80 0.6704 77 0.6679 63 0.6725 58 0.6653Madagascar 71 0.6797 70 80 0.6713 77 0.6732 74 0.6736 89 0.6461 84 0.6385Slovak Republic 72 0.6797 71 71 0.6778 68 0.6845 64 0.6824 54 0.6797 50 0.6757Peru 73 0.6796 72 60 0.6895 44 0.7024 48 0.6959 75 0.6624 60 0.6619Italy 74 0.6796 73 74 0.6765 72 0.6798 67 0.6788 84 0.6498 77 0.6456Czech Republic 75 0.6789 74 65 0.6850 74 0.6789 69 0.6770 64 0.6718 53 0.6712Brunei Darussalem 76 0.6787 75 77 0.6748 94 0.6524 99 0.6392 — — — —Gambia, The 77 0.6763 76 75 0.6762 75 0.6752 85 0.6622 95 0.6421 79 0.6448Albania 78 0.6748 77 78 0.6726 91 0.6601 87 0.6591 66 0.6685 61 0.6607Vietnam 79 0.6732 78 72 0.6776 71 0.6802 68 0.6778 42 0.6889 — —Colombia 80 0.6714 79 55 0.6927 56 0.6939 50 0.6944 24 0.7090 22 0.7049Dominican Republic 81 0.6682 80 73 0.6774 67 0.6859 72 0.6744 65 0.6705 59 0.6639Brazil 82 0.6679 81 85 0.6655 81 0.6695 73 0.6737 74 0.6637 67 0.6543Malta 83 0.6658 82 83 0.6695 88 0.6635 83 0.6634 76 0.6615 71 0.6518Armenia 84 0.6654 83 84 0.6669 90 0.6619 78 0.6677 71 0.6651 — —Hungary 85 0.6642 84 79 0.6720 65 0.6879 60 0.6867 61 0.6731 55 0.6698Georgia 86 0.6624 85 88 0.6598 83 0.6680 82 0.6654 67 0.6665 54 0.6700Angola 87 0.6624 86 81 0.6712 106 0.6353 114 0.6032 110 0.6034 96 0.6039Zimbabwe 88 0.6607 87 92 0.6574 95 0.6518 92 0.6485 88 0.6464 76 0.6461Mexico 89 0.6604 88 91 0.6577 98 0.6503 97 0.6441 93 0.6441 75 0.6462Indonesia 90 0.6594 89 87 0.6615 92 0.6580 93 0.6473 81 0.6550 68 0.6541Azerbaijan 91 0.6577 90 100 0.6446 89 0.6626 61 0.6856 59 0.6781 — —Senegal 92 0.6573 91 101 0.6414 102 0.6427 — — — — — —Cyprus 93 0.6567 92 86 0.6642 79 0.6706 76 0.6694 82 0.6522 83 0.6430El Salvador 94 0.6567 93 90 0.6596 55 0.6939 58 0.6875 48 0.6853 39 0.6837Mauritius 95 0.6529 94 95 0.6520 96 0.6513 95 0.6466 85 0.6487 88 0.6328Tajikistan 96 0.6526 95 89 0.6598 86 0.6661 89 0.6541 79 0.6578 — —Malaysia 97 0.6525 96 98 0.6479 100 0.6467 96 0.6442 92 0.6444 72 0.6509Japan 98 0.6514 97 94 0.6524 101 0.6447 98 0.6434 91 0.6455 80 0.6447Kenya 99 0.6493 98 96 0.6499 97 0.6512 88 0.6547 83 0.6508 73 0.6486Belize 100 0.6489 99 93 0.6536 87 0.6636 86 0.6610 94 0.6426 — —Maldives 101 0.6480 100 99 0.6452 99 0.6482 91 0.6501 99 0.6350 — —Cambodia 102 0.6464 101 97 0.6482 104 0.6410 94 0.6469 98 0.6353 89 0.6291United Arab Emirates 103 0.6454 102 103 0.6397 112 0.6198 105 0.6220 105 0.6184 101 0.5919Suriname 104 0.6395 103 102 0.6407 78 0.6726 79 0.6674 56 0.6794 — —Kuwait 105 0.6322 104 105 0.6318 105 0.6356 101 0.6358 96 0.6409 86 0.6341Zambia 106 0.6300 105 106 0.6293 107 0.6310 106 0.6205 101 0.6288 85 0.6360Korea, Rep. 107 0.6281 106 104 0.6342 115 0.6146 108 0.6154 97 0.6409 92 0.6157Tunisia 108 0.6255 107 107 0.6266 109 0.6233 103 0.6295 102 0.6283 90 0.6288Fiji 109 0.6255 108 108 0.6256 103 0.6414 — — — — — —Bahrain 110 0.6232 109 110 0.6217 116 0.6136 121 0.5927 115 0.5931 102 0.5894Qatar 111 0.6230 110 117 0.6059 125 0.5907 119 0.5948 109 0.6041 — —Guatemala 112 0.6229 111 109 0.6238 111 0.6209 112 0.6072 106 0.6144 95 0.6067India 113 0.6190 112 112 0.6155 114 0.6151 113 0.6060 114 0.5936 98 0.6011Mauritania 114 0.6164 113 113 0.6152 119 0.6103 110 0.6117 111 0.6022 106 0.5835Burkina Faso 115 0.6153 114 111 0.6162 120 0.6081 115 0.6029 117 0.5912 104 0.5854Ethiopia 116 0.6136 115 121 0.6019 122 0.5948 122 0.5867 113 0.5991 100 0.5946Jordan 117 0.6117 116 120 0.6048 113 0.6182 104 0.6275 104 0.6203 93 0.6109Lebanon 118 0.6083 117 116 0.6084 — — — — — — — —Cameroon 119 0.6073 118 114 0.6110 118 0.6108 117 0.6017 116 0.5919 103 0.5865Nigeria 120 0.6011 119 118 0.6055 108 0.6280 102 0.6339 107 0.6122 94 0.6104Algeria 121 0.5991 120 119 0.6052 117 0.6119 111 0.6111 108 0.6068 97 0.6018Turkey 122 0.5954 121 126 0.5876 129 0.5828 123 0.5853 121 0.5768 105 0.5850Egypt 123 0.5933 122 125 0.5899 126 0.5862 124 0.5832 120 0.5809 109 0.5786Syria 124 0.5896 123 124 0.5926 121 0.6072 107 0.6181 103 0.6216 — —Iran, Islamic Rep. 125 0.5894 124 123 0.5933 128 0.5839 116 0.6021 118 0.5903 108 0.5803Nepal 126 0.5888 125 115 0.6084 110 0.6213 120 0.5942 125 0.5575 111 0.5478Oman 127 0.5873 126 122 0.5950 123 0.5938 118 0.5960 119 0.5903 — —Benin 128 0.5832 127 128 0.5719 131 0.5643 126 0.5582 123 0.5656 110 0.5780Morocco 129 0.5804 128 127 0.5767 124 0.5926 125 0.5757 122 0.5676 107 0.5827Côte d’Ivoire 130 0.5773 129 130 0.5691 — — — — — — — —Saudi Arabia 131 0.5753 130 129 0.5713 130 0.5651 128 0.5537 124 0.5647 114 0.5242Mali 132 0.5752 131 131 0.5680 127 0.5860 109 0.6117 112 0.6019 99 0.5996Pakistan 133 0.5583 132 132 0.5465 132 0.5458 127 0.5549 126 0.5509 112 0.5434Chad 134 0.5334 133 133 0.5330 133 0.5417 129 0.5290 127 0.5381 113 0.5247 Yemen 135 0.4873 134 134 0.4603 134 0.4609 130 0.4664 128 0.4510 115 0.4595
* New country 2011
10 Measuring the Global Gender Gap Global Gender Gap Report 2011
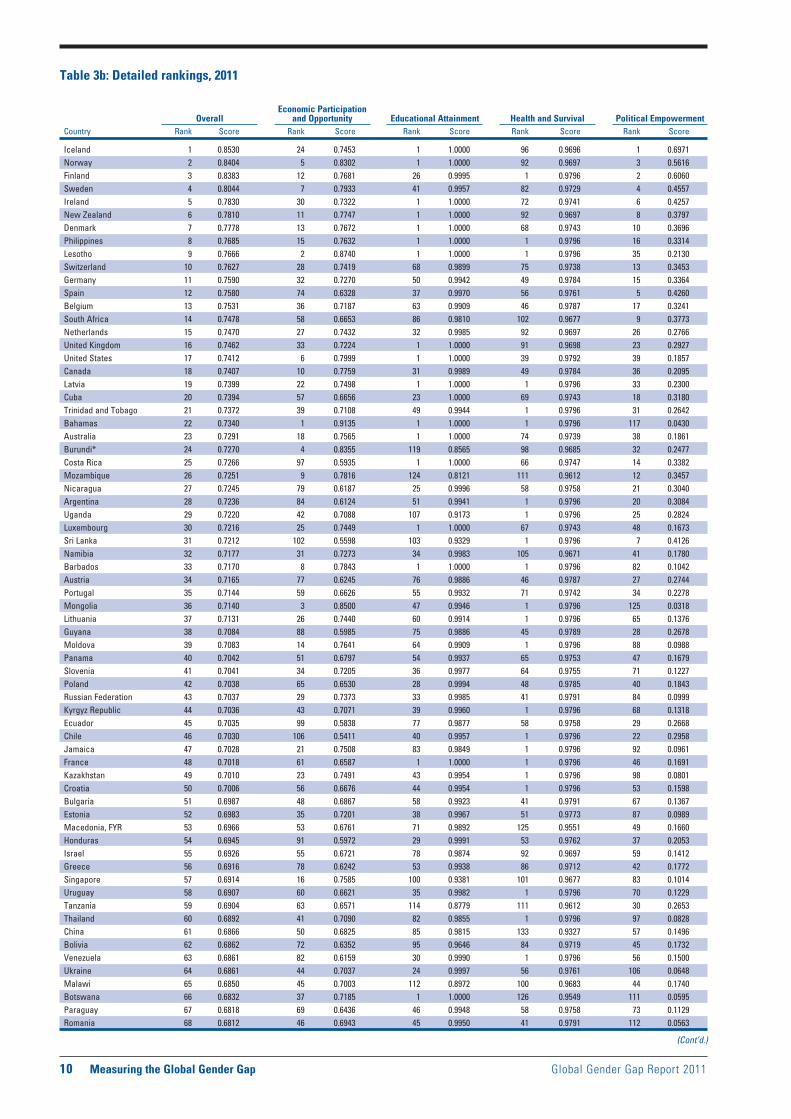
Table 3b: Detailed rankings, 2011
Country Rank Score Rank Score Rank Score Rank Score Rank Score
Iceland 1 0.8530 24 0.7453 1 1.0000 96 0.9696 1 0.6971Norway 2 0.8404 5 0.8302 1 1.0000 92 0.9697 3 0.5616Finland 3 0.8383 12 0.7681 26 0.9995 1 0.9796 2 0.6060Sweden 4 0.8044 7 0.7933 41 0.9957 82 0.9729 4 0.4557Ireland 5 0.7830 30 0.7322 1 1.0000 72 0.9741 6 0.4257New Zealand 6 0.7810 11 0.7747 1 1.0000 92 0.9697 8 0.3797Denmark 7 0.7778 13 0.7672 1 1.0000 68 0.9743 10 0.3696Philippines 8 0.7685 15 0.7632 1 1.0000 1 0.9796 16 0.3314Lesotho 9 0.7666 2 0.8740 1 1.0000 1 0.9796 35 0.2130Switzerland 10 0.7627 28 0.7419 68 0.9899 75 0.9738 13 0.3453Germany 11 0.7590 32 0.7270 50 0.9942 49 0.9784 15 0.3364Spain 12 0.7580 74 0.6328 37 0.9970 56 0.9761 5 0.4260Belgium 13 0.7531 36 0.7187 63 0.9909 46 0.9787 17 0.3241South Africa 14 0.7478 58 0.6653 86 0.9810 102 0.9677 9 0.3773Netherlands 15 0.7470 27 0.7432 32 0.9985 92 0.9697 26 0.2766United Kingdom 16 0.7462 33 0.7224 1 1.0000 91 0.9698 23 0.2927United States 17 0.7412 6 0.7999 1 1.0000 39 0.9792 39 0.1857Canada 18 0.7407 10 0.7759 31 0.9989 49 0.9784 36 0.2095Latvia 19 0.7399 22 0.7498 1 1.0000 1 0.9796 33 0.2300Cuba 20 0.7394 57 0.6656 23 1.0000 69 0.9743 18 0.3180Trinidad and Tobago 21 0.7372 39 0.7108 49 0.9944 1 0.9796 31 0.2642Bahamas 22 0.7340 1 0.9135 1 1.0000 1 0.9796 117 0.0430Australia 23 0.7291 18 0.7565 1 1.0000 74 0.9739 38 0.1861Burundi* 24 0.7270 4 0.8355 119 0.8565 98 0.9685 32 0.2477Costa Rica 25 0.7266 97 0.5935 1 1.0000 66 0.9747 14 0.3382Mozambique 26 0.7251 9 0.7816 124 0.8121 111 0.9612 12 0.3457Nicaragua 27 0.7245 79 0.6187 25 0.9996 58 0.9758 21 0.3040Argentina 28 0.7236 84 0.6124 51 0.9941 1 0.9796 20 0.3084Uganda 29 0.7220 42 0.7088 107 0.9173 1 0.9796 25 0.2824Luxembourg 30 0.7216 25 0.7449 1 1.0000 67 0.9743 48 0.1673Sri Lanka 31 0.7212 102 0.5598 103 0.9329 1 0.9796 7 0.4126Namibia 32 0.7177 31 0.7273 34 0.9983 105 0.9671 41 0.1780Barbados 33 0.7170 8 0.7843 1 1.0000 1 0.9796 82 0.1042Austria 34 0.7165 77 0.6245 76 0.9886 46 0.9787 27 0.2744Portugal 35 0.7144 59 0.6626 55 0.9932 71 0.9742 34 0.2278Mongolia 36 0.7140 3 0.8500 47 0.9946 1 0.9796 125 0.0318Lithuania 37 0.7131 26 0.7440 60 0.9914 1 0.9796 65 0.1376Guyana 38 0.7084 88 0.5985 75 0.9886 45 0.9789 28 0.2678Moldova 39 0.7083 14 0.7641 64 0.9909 1 0.9796 88 0.0988Panama 40 0.7042 51 0.6797 54 0.9937 65 0.9753 47 0.1679Slovenia 41 0.7041 34 0.7205 36 0.9977 64 0.9755 71 0.1227Poland 42 0.7038 65 0.6530 28 0.9994 48 0.9785 40 0.1843Russian Federation 43 0.7037 29 0.7373 33 0.9985 41 0.9791 84 0.0999Kyrgyz Republic 44 0.7036 43 0.7071 39 0.9960 1 0.9796 68 0.1318Ecuador 45 0.7035 99 0.5838 77 0.9877 58 0.9758 29 0.2668Chile 46 0.7030 106 0.5411 40 0.9957 1 0.9796 22 0.2958Jamaica 47 0.7028 21 0.7508 83 0.9849 1 0.9796 92 0.0961France 48 0.7018 61 0.6587 1 1.0000 1 0.9796 46 0.1691Kazakhstan 49 0.7010 23 0.7491 43 0.9954 1 0.9796 98 0.0801Croatia 50 0.7006 56 0.6676 44 0.9954 1 0.9796 53 0.1598Bulgaria 51 0.6987 48 0.6867 58 0.9923 41 0.9791 67 0.1367Estonia 52 0.6983 35 0.7201 38 0.9967 51 0.9773 87 0.0989Macedonia, FYR 53 0.6966 53 0.6761 71 0.9892 125 0.9551 49 0.1660Honduras 54 0.6945 91 0.5972 29 0.9991 53 0.9762 37 0.2053Israel 55 0.6926 55 0.6721 78 0.9874 92 0.9697 59 0.1412Greece 56 0.6916 78 0.6242 53 0.9938 86 0.9712 42 0.1772Singapore 57 0.6914 16 0.7585 100 0.9381 101 0.9677 83 0.1014Uruguay 58 0.6907 60 0.6621 35 0.9982 1 0.9796 70 0.1229Tanzania 59 0.6904 63 0.6571 114 0.8779 111 0.9612 30 0.2653Thailand 60 0.6892 41 0.7090 82 0.9855 1 0.9796 97 0.0828China 61 0.6866 50 0.6825 85 0.9815 133 0.9327 57 0.1496Bolivia 62 0.6862 72 0.6352 95 0.9646 84 0.9719 45 0.1732Venezuela 63 0.6861 82 0.6159 30 0.9990 1 0.9796 56 0.1500Ukraine 64 0.6861 44 0.7037 24 0.9997 56 0.9761 106 0.0648Malawi 65 0.6850 45 0.7003 112 0.8972 100 0.9683 44 0.1740Botswana 66 0.6832 37 0.7185 1 1.0000 126 0.9549 111 0.0595Paraguay 67 0.6818 69 0.6436 46 0.9948 58 0.9758 73 0.1129Romania 68 0.6812 46 0.6943 45 0.9950 41 0.9791 112 0.0563
(Cont’d.)
Health and Survival Political EmpowermentEducational AttainmentEconomic Participation
and OpportunityOverall

Global Gender Gap Report 2011 Measuring the Global Gender Gap 11
Table 3b: Detailed rankings, 2011 (cont’d.)
Country Rank Score Rank Score Rank Score Rank Score Rank Score
Bangladesh 69 0.6812 118 0.4932 108 0.9168 123 0.9557 11 0.3591Ghana 70 0.6811 17 0.7581 111 0.9027 104 0.9674 91 0.0962Madagascar 71 0.6797 52 0.6781 91 0.9720 81 0.9732 93 0.0957Slovakia 72 0.6797 73 0.6335 1 1.0000 1 0.9796 79 0.1059Peru 73 0.6796 85 0.6109 88 0.9796 108 0.9658 50 0.1622Italy 74 0.6796 90 0.5976 48 0.9945 75 0.9738 55 0.1525Czech Republic 75 0.6789 94 0.5961 1 1.0000 39 0.9792 60 0.1403Brunei Darussalam 76 0.6787 20 0.7552 52 0.9938 108 0.9658 132 0.0000Gambia, The 77 0.6763 19 0.7561 122 0.8320 1 0.9796 66 0.1375Albania 78 0.6748 38 0.7129 87 0.9809 135 0.9268 99 0.0784Vietnam 79 0.6732 40 0.7106 104 0.9257 130 0.9458 76 0.1107Colombia 80 0.6714 89 0.5984 42 0.9955 41 0.9791 74 0.1125Dominican Republic 81 0.6682 92 0.5969 1 1.0000 88 0.9711 80 0.1049Brazil 82 0.6679 68 0.6490 66 0.9904 1 0.9796 114 0.0526Malta 83 0.6658 110 0.5281 1 1.0000 72 0.9741 52 0.1611Armenia 84 0.6654 62 0.6580 27 0.9994 131 0.9419 108 0.0623Hungary 85 0.6642 64 0.6537 56 0.9926 1 0.9796 127 0.0310Georgia 86 0.6624 54 0.6725 67 0.9900 128 0.9480 120 0.0390Angola 87 0.6624 96 0.5937 126 0.7864 1 0.9796 24 0.2898Zimbabwe 88 0.6607 66 0.6503 102 0.9355 129 0.9458 75 0.1112Mexico 89 0.6604 109 0.5318 61 0.9913 1 0.9796 63 0.1390Indonesia 90 0.6594 101 0.5642 93 0.9671 106 0.9663 61 0.1400Azerbaijan 91 0.6577 70 0.6420 73 0.9891 132 0.9331 103 0.0665Senegal 92 0.6573 47 0.6884 123 0.8247 80 0.9734 58 0.1429Cyprus 93 0.6567 80 0.6175 89 0.9776 90 0.9701 109 0.0618El Salvador 94 0.6567 108 0.5405 72 0.9891 1 0.9796 72 0.1176Mauritius 95 0.6529 105 0.5441 74 0.9888 1 0.9796 86 0.0992Tajikistan 96 0.6526 49 0.6827 113 0.8839 122 0.9559 94 0.0881Malaysia 97 0.6525 95 0.5941 65 0.9906 78 0.9736 115 0.0517Japan 98 0.6514 100 0.5673 80 0.9862 1 0.9796 101 0.0724Kenya 99 0.6493 83 0.6159 101 0.9362 102 0.9677 100 0.0773Belize 100 0.6489 81 0.6162 1 1.0000 1 0.9796 132 0.0000Maldives 101 0.6480 86 0.6019 69 0.9896 111 0.9612 119 0.0392Cambodia 102 0.6464 75 0.6315 116 0.8651 1 0.9796 78 0.1093United Arab Emirates 103 0.6454 119 0.4898 59 0.9914 111 0.9612 62 0.1394Suriname 104 0.6395 114 0.5084 62 0.9911 70 0.9742 95 0.0843Kuwait 105 0.6322 107 0.5407 84 0.9834 111 0.9612 116 0.0435Zambia 106 0.6300 87 0.6005 120 0.8505 97 0.9690 84 0.0999Korea, Rep. 107 0.6281 117 0.4934 97 0.9481 78 0.9736 90 0.0972Tunisia 108 0.6255 126 0.4440 94 0.9662 110 0.9641 69 0.1278Fiji 109 0.6255 116 0.4972 70 0.9893 1 0.9796 123 0.0358Bahrain 110 0.6232 115 0.5079 81 0.9862 111 0.9612 122 0.0376Qatar 111 0.6230 104 0.5473 57 0.9924 127 0.9522 132 0.0000Guatemala 112 0.6229 113 0.5236 98 0.9460 1 0.9796 118 0.0422India 113 0.6190 131 0.3960 121 0.8369 134 0.9312 19 0.3119Mauritania 114 0.6164 120 0.4639 117 0.8601 1 0.9796 51 0.1620Burkina Faso 115 0.6153 76 0.6266 129 0.7563 98 0.9685 77 0.1097Ethiopia 116 0.6136 71 0.6373 131 0.7043 77 0.9737 64 0.1390Jordan 117 0.6117 127 0.4333 79 0.9869 89 0.9706 113 0.0558Lebanon 118 0.6083 123 0.4482 90 0.9773 1 0.9796 128 0.0282Cameroon 119 0.6073 112 0.5252 118 0.8597 111 0.9612 96 0.0830Nigeria 120 0.6011 93 0.5964 125 0.8090 121 0.9607 121 0.0384Algeria 121 0.5991 124 0.4452 96 0.9502 107 0.9661 124 0.0350Turkey 122 0.5954 132 0.3888 106 0.9200 62 0.9755 89 0.0972Egypt 123 0.5933 122 0.4573 110 0.9081 52 0.9768 126 0.0311Syria 124 0.5896 129 0.4090 109 0.9135 61 0.9756 110 0.0603Iran, Islamic Rep. 125 0.5894 125 0.4443 105 0.9251 85 0.9714 130 0.0166Nepal 126 0.5888 121 0.4606 128 0.7589 111 0.9612 43 0.1745Oman 127 0.5873 130 0.4068 99 0.9412 62 0.9755 129 0.0256Benin 128 0.5832 67 0.6494 133 0.6558 111 0.9612 104 0.0664Morocco 129 0.5804 128 0.4177 115 0.8653 87 0.9712 102 0.0672Côte d’Ivoire 130 0.5773 103 0.5569 130 0.7073 1 0.9796 105 0.0656Saudi Arabia 131 0.5753 133 0.3576 92 0.9674 53 0.9762 132 0.0000Mali 132 0.5752 111 0.5274 132 0.6927 55 0.9761 81 0.1048Pakistan 133 0.5583 134 0.3446 127 0.7782 123 0.9557 54 0.1547Chad 134 0.5334 98 0.5930 135 0.5158 111 0.9612 107 0.0638Yemen 135 0.4873 135 0.3180 134 0.6420 83 0.9727 131 0.0164
* New country 2011
Health and Survival Political EmpowermentEducational AttainmentEconomic Participation
and OpportunityOverall

12 Measuring the Global Gender Gap Global Gender Gap Report 2011
Table 3c: The Global Gender Gap Index 2011: Changes in scores (Detailed)
Change in score Change in score Change in score Change in score Change in score Change in scoreCountry (2010–2011) (2009–2010) (2008–2009) (2007–2008) (2006–2007) (2006–2011)
Iceland 0.0034 0.0220 0.0277 0.0164 0.0023 0.0717Norway 0.0000 0.0177 –0.0011 0.0180 0.0065 0.0410Finland 0.0123 0.0008 0.0057 0.0151 0.0086 0.0425Sweden 0.0020 –0.0116 0.0000 –0.0007 0.0014 –0.0089Ireland 0.0057 0.0177 0.0079 0.0061 0.0122 0.0495New Zealand 0.0002 –0.0072 0.0021 0.0210 0.0140 0.0301Denmark 0.0059 0.0091 0.0090 0.0019 0.0057 0.0315Philippines 0.0031 0.0076 0.0011 –0.0061 0.0113 0.0170Lesotho –0.0012 0.0183 0.0176 0.0242 0.0271 0.0859Switzerland 0.0065 0.0136 0.0066 0.0436 –0.0073 0.0630Germany 0.0060 0.0080 0.0055 –0.0224 0.0094 0.0066Spain 0.0026 0.0209 0.0063 –0.0162 0.0125 0.0261Belgium 0.0022 0.0344 0.0003 –0.0035 0.0120 0.0453South Africa –0.0056 –0.0175 0.0477 0.0038 0.0069 0.0353Netherlands 0.0026 –0.0046 0.0091 0.0016 0.0133 0.0220United Kingdom 0.0002 0.0058 0.0036 –0.0075 0.0076 0.0098United States 0.0001 0.0238 –0.0006 0.0177 –0.0039 0.0371Canada 0.0035 0.0176 0.0060 –0.0063 0.0034 0.0242Latvia –0.0030 0.0013 0.0019 0.0064 0.0242 0.0308Cuba 0.0142 0.0076 –0.0019 0.0026 — —Trinidad and Tobago 0.0019 0.0054 0.0054 0.0385 0.0062 0.0575Bahamas 0.0212 –0.0050 — — — —Australia 0.0020 –0.0011 0.0041 0.0037 0.0040 0.0128Burundi* — — — — — —Costa Rica 0.0072 0.0014 0.0069 0.0097 0.0078 0.0330Mozambique –0.0078 0.0134 –0.0071 0.0383 — —Nicaragua 0.0069 0.0175 0.0255 0.0289 –0.0108 0.0679Argentina 0.0049 –0.0024 0.0002 0.0227 0.0153 0.0407Uganda 0.0051 0.0102 0.0086 0.0148 0.0036 0.0423Luxembourg –0.0015 0.0342 0.0087 0.0016 0.0115 0.0545Sri Lanka –0.0246 0.0056 0.0032 0.0141 0.0031 0.0013Namibia –0.0062 0.0072 0.0026 0.0129 0.0147 0.0312Barbados –0.0006 –0.0060 0.0048 — — —Austria 0.0074 0.0060 –0.0121 0.0092 0.0074 0.0179Portugal –0.0026 0.0158 –0.0038 0.0092 0.0037 0.0223Mongolia –0.0054 –0.0026 0.0171 0.0318 –0.0090 0.0319Lithuania 0.0000 –0.0043 –0.0046 –0.0012 0.0157 0.0054Guyana –0.0005 –0.0019 — — — —Moldova –0.0077 0.0056 –0.0140 0.0071 0.0044 –0.0045Panama –0.0031 0.0048 –0.0071 0.0141 0.0019 0.0107Slovenia –0.0006 0.0066 0.0045 0.0094 0.0097 0.0296Poland 0.0001 0.0039 0.0047 0.0194 –0.0046 0.0236Russian Federation 0.0001 0.0049 –0.0007 0.0128 0.0096 0.0266Kyrgyz Republic 0.0063 –0.0086 0.0013 0.0392 –0.0088 0.0295Ecuador –0.0037 –0.0148 0.0129 0.0210 0.0448 0.0602Chile 0.0017 0.0129 0.0066 0.0336 0.0027 0.0576Jamaica –0.0008 0.0024 0.0032 0.0055 –0.0089 0.0014France –0.0007 –0.0306 –0.0010 0.0518 0.0303 0.0498Kazakhstan –0.0045 0.0043 0.0037 –0.0006 0.0054 0.0082Croatia 0.0066 –0.0004 –0.0023 –0.0243 0.0066 –0.0139Bulgaria 0.0004 –0.0089 –0.0005 –0.0007 0.0215 0.0118Estonia –0.0035 –0.0076 0.0018 0.0068 0.0064 0.0039Macedonia, FYR –0.0030 0.0046 0.0036 –0.0054 –0.0015 –0.0016Honduras 0.0017 0.0035 –0.0068 0.0300 0.0178 0.0462Israel –0.0031 –0.0061 0.0118 –0.0064 0.0076 0.0037Greece 0.0008 0.0245 –0.0064 0.0079 0.0107 0.0376Singapore 0.0000 0.0250 0.0039 0.0017 0.0059 0.0365Uruguay 0.0010 –0.0039 0.0029 0.0299 0.0058 0.0358Tanzania 0.0074 0.0032 –0.0271 0.0100 –0.0069 –0.0134Thailand –0.0018 0.0003 –0.0010 0.0102 –0.0016 0.0061China –0.0014 –0.0026 0.0029 0.0235 0.0082 0.0305Bolivia 0.0111 0.0058 0.0026 0.0093 0.0239 0.0527Venezuela –0.0002 0.0024 –0.0036 0.0078 0.0133 0.0197Ukraine –0.0008 –0.0027 0.0041 0.0065 –0.0006 0.0064Malawi 0.0025 0.0087 0.0074 0.0183 0.0044 0.0413Botswana –0.0044 –0.0195 0.0232 0.0041 –0.0100 –0.0065Paraguay 0.0014 –0.0064 0.0489 –0.0279 0.0103 0.0262Romania –0.0014 0.0020 0.0043 –0.0097 0.0062 0.0015Bangladesh 0.0110 0.0176 –0.0005 0.0216 0.0044 0.0542
(Cont’d.)
Global Gender Gap Report 2011 Measuring the Global Gender Gap 13
Table 3c: The Global Gender Gap Index 2011: Changes in scores (Detailed) (cont’d.)
Change in score Change in score Change in score Change in score Change in score Change in scoreCountry (2011–2010) (2010–2009) (2009–2008) (2008–2007) (2007–2006) (2011–2006)
Ghana 0.0030 0.0078 0.0025 –0.0046 0.0072 0.0158Madagascar 0.0084 –0.0019 –0.0003 0.0274 0.0076 0.0412Slovak Republic 0.0019 –0.0067 0.0021 0.0027 0.0040 0.0041Peru –0.0099 –0.0128 0.0064 0.0336 0.0005 0.0177Italy 0.0031 –0.0033 0.0010 0.0290 0.0042 0.0340Czech Republic –0.0061 0.0061 0.0019 0.0052 0.0006 0.0078Brunei Darussalam 0.0039 0.0224 0.0132 — — —Gambia, The 0.0001 0.0010 0.0130 0.0200 –0.0027 0.0315Albania 0.0021 0.0125 0.0010 –0.0094 0.0078 0.0140Vietnam –0.0044 –0.0026 0.0023 –0.0110 — —Colombia –0.0213 –0.0012 –0.0004 –0.0146 0.0041 –0.0335Dominican Republic –0.0092 –0.0085 0.0115 0.0039 0.0065 0.0043Brazil 0.0024 –0.0040 –0.0042 0.0100 0.0094 0.0136Malta –0.0037 0.0060 0.0002 0.0019 0.0097 0.0140Armenia –0.0015 0.0050 –0.0059 0.0027 — —Hungary –0.0078 –0.0158 0.0012 0.0136 0.0033 –0.0056Georgia 0.0025 –0.0082 0.0026 –0.0011 –0.0035 –0.0076Angola –0.0088 0.0358 0.0321 –0.0002 –0.0005 0.0585Zimbabwe 0.0033 0.0056 0.0032 0.0021 0.0004 0.0147Mexico 0.0027 0.0074 0.0062 0.0000 –0.0021 0.0142Indonesia –0.0021 0.0035 0.0107 –0.0077 0.0009 0.0053Azerbaijan 0.0131 –0.0180 –0.0230 0.0075 — —Senegal 0.0160 –0.0013 — — — —Cyprus –0.0075 –0.0064 0.0012 0.0172 0.0092 0.0137El Salvador –0.0029 –0.0343 0.0064 0.0023 0.0016 –0.0270Mauritius 0.0010 0.0007 0.0047 –0.0022 0.0160 0.0202Tajikistan –0.0072 –0.0063 0.0120 –0.0038 — —Malaysia 0.0046 0.0012 0.0025 –0.0002 –0.0065 0.0016Japan –0.0010 0.0077 0.0013 –0.0021 0.0008 0.0067Kenya –0.0007 –0.0013 –0.0035 0.0039 0.0023 0.0007Belize –0.0047 –0.0100 0.0026 0.0183 — —Maldives 0.0028 –0.0030 –0.0019 0.0151 — —Cambodia –0.0018 0.0073 –0.0059 0.0116 0.0062 0.0173United Arab Emirates 0.0058 0.0199 –0.0022 0.0036 0.0265 0.0535Suriname –0.0012 –0.0319 0.0051 –0.0120 — —Kuwait 0.0004 –0.0038 –0.0002 –0.0051 0.0068 –0.0019Zambia 0.0007 –0.0017 0.0106 –0.0084 –0.0071 –0.0060Korea, Rep. –0.0061 0.0196 –0.0008 –0.0254 0.0251 0.0124Tunisia –0.0011 0.0033 –0.0062 0.0012 –0.0006 –0.0033Fiji –0.0002 –0.0158 — — — —Bahrain 0.0015 0.0081 0.0209 –0.0003 0.0037 0.0338Qatar 0.0170 0.0153 –0.0041 –0.0093 — —Guatemala –0.0009 0.0028 0.0137 –0.0072 0.0077 0.0162India 0.0035 0.0004 0.0091 0.0124 –0.0075 0.0179Mauritania 0.0011 0.0050 –0.0014 0.0095 0.0187 0.0329Burkina Faso –0.0010 0.0081 0.0052 0.0117 0.0059 0.0299Ethiopia 0.0117 0.0071 0.0080 –0.0124 0.0045 0.0189Jordan 0.0068 –0.0133 –0.0093 0.0072 0.0094 0.0008Lebanon 0.0000 — — — — —Cameroon –0.0037 0.0002 0.0091 0.0098 0.0053 0.0207Nigeria –0.0044 –0.0225 –0.0059 0.0217 0.0018 –0.0093Algeria –0.0061 –0.0067 0.0008 0.0042 0.0050 –0.0027Turkey 0.0078 0.0047 –0.0025 0.0085 –0.0082 0.0104Egypt 0.0034 0.0037 0.0029 0.0023 0.0023 0.0148Syria –0.0030 –0.0146 –0.0109 –0.0035 — —Iran, Islamic Rep. –0.0039 0.0094 –0.0182 0.0117 0.0101 0.0091Nepal –0.0196 –0.0130 0.0271 0.0367 0.0097 0.0410Oman –0.0077 0.0012 –0.0023 0.0057 — —Benin 0.0113 0.0076 0.0061 –0.0075 –0.0123 0.0052Morocco 0.0037 –0.0159 0.0168 0.0082 –0.0151 –0.0023Côte d’Ivoire 0.0082 — — — — —Saudi Arabia 0.0040 0.0062 0.0114 –0.0110 0.0405 0.0511Mali 0.0073 –0.0181 –0.0257 0.0098 0.0022 –0.0244Pakistan 0.0118 0.0007 –0.0090 0.0040 0.0075 0.0149Chad 0.0004 –0.0087 0.0126 –0.0091 0.0134 0.0087Yemen 0.0270 –0.0006 –0.0055 0.0154 –0.0085 0.0278Belarus — — 0.0042 –0.0015 — —Uzbekistan — — 0.0008 –0.0016 0.0035 —
* New country 2011
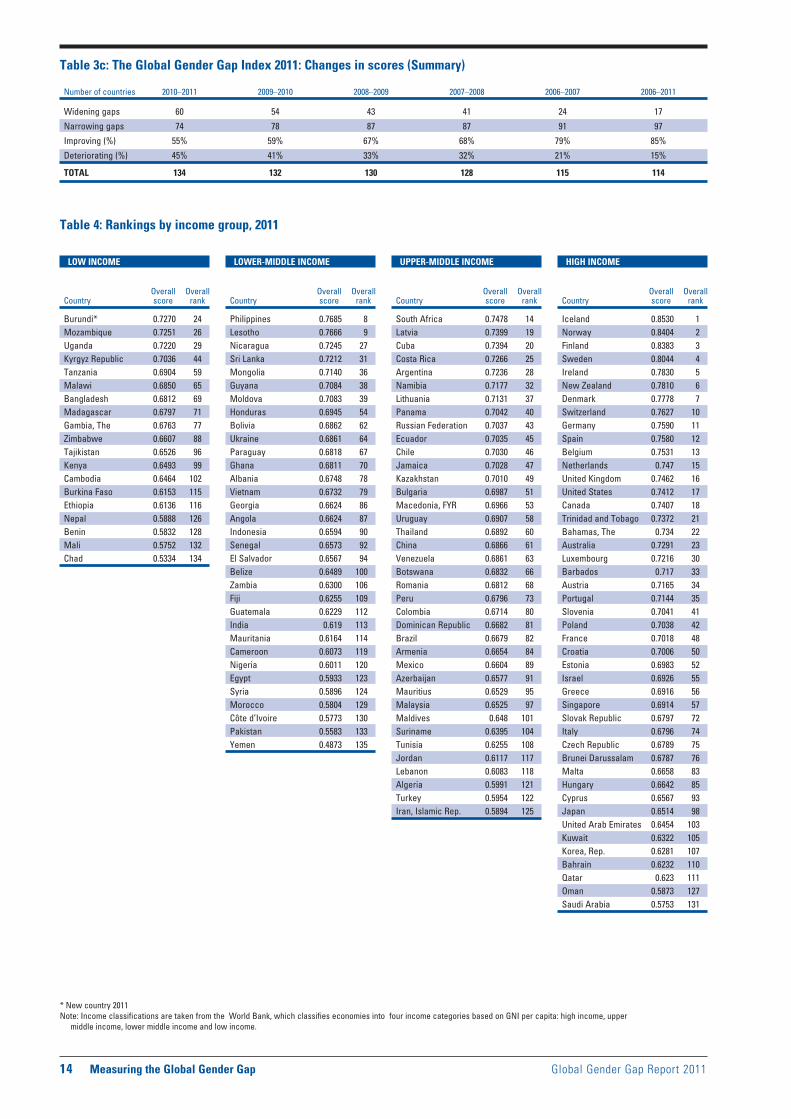
Table 3c: The Global Gender Gap Index 2011: Changes in scores (Summary)
Number of countries 2010–2011 2009–2010 2008–2009 2007–2008 2006–2007 2006–2011
Widening gaps 60 54 43 41 24 17
Narrowing gaps 74 78 87 87 91 97
Improving (%) 55% 59% 67% 68% 79% 85%
Deteriorating (%) 45% 41% 33% 32% 21% 15%
TOTAL 134 132 130 128 115 114
Table 4: Rankings by income group, 2011
LOW INCOME
Overall Overall Country score rank
Burundi* 0.7270 24Mozambique 0.7251 26Uganda 0.7220 29Kyrgyz Republic 0.7036 44Tanzania 0.6904 59Malawi 0.6850 65Bangladesh 0.6812 69Madagascar 0.6797 71Gambia, The 0.6763 77Zimbabwe 0.6607 88Tajikistan 0.6526 96Kenya 0.6493 99Cambodia 0.6464 102Burkina Faso 0.6153 115Ethiopia 0.6136 116Nepal 0.5888 126Benin 0.5832 128Mali 0.5752 132Chad 0.5334 134
LOWER-MIDDLE INCOME
Overall Overall Country score rank
Philippines 0.7685 8Lesotho 0.7666 9Nicaragua 0.7245 27Sri Lanka 0.7212 31Mongolia 0.7140 36Guyana 0.7084 38Moldova 0.7083 39Honduras 0.6945 54Bolivia 0.6862 62Ukraine 0.6861 64Paraguay 0.6818 67Ghana 0.6811 70Albania 0.6748 78Vietnam 0.6732 79Georgia 0.6624 86Angola 0.6624 87Indonesia 0.6594 90Senegal 0.6573 92El Salvador 0.6567 94Belize 0.6489 100Zambia 0.6300 106Fiji 0.6255 109Guatemala 0.6229 112India 0.619 113Mauritania 0.6164 114Cameroon 0.6073 119Nigeria 0.6011 120Egypt 0.5933 123Syria 0.5896 124Morocco 0.5804 129Côte d’Ivoire 0.5773 130Pakistan 0.5583 133Yemen 0.4873 135
UPPER-MIDDLE INCOME
Overall Overall Country score rank
South Africa 0.7478 14Latvia 0.7399 19Cuba 0.7394 20Costa Rica 0.7266 25Argentina 0.7236 28Namibia 0.7177 32Lithuania 0.7131 37Panama 0.7042 40Russian Federation 0.7037 43Ecuador 0.7035 45Chile 0.7030 46Jamaica 0.7028 47Kazakhstan 0.7010 49Bulgaria 0.6987 51Macedonia, FYR 0.6966 53Uruguay 0.6907 58Thailand 0.6892 60China 0.6866 61Venezuela 0.6861 63Botswana 0.6832 66Romania 0.6812 68Peru 0.6796 73Colombia 0.6714 80Dominican Republic 0.6682 81Brazil 0.6679 82Armenia 0.6654 84Mexico 0.6604 89Azerbaijan 0.6577 91Mauritius 0.6529 95Malaysia 0.6525 97Maldives 0.648 101Suriname 0.6395 104Tunisia 0.6255 108Jordan 0.6117 117Lebanon 0.6083 118Algeria 0.5991 121Turkey 0.5954 122Iran, Islamic Rep. 0.5894 125
HIGH INCOME
Overall Overall Country score rank
Iceland 0.8530 1Norway 0.8404 2Finland 0.8383 3Sweden 0.8044 4Ireland 0.7830 5New Zealand 0.7810 6Denmark 0.7778 7Switzerland 0.7627 10Germany 0.7590 11Spain 0.7580 12Belgium 0.7531 13Netherlands 0.747 15United Kingdom 0.7462 16United States 0.7412 17Canada 0.7407 18Trinidad and Tobago 0.7372 21Bahamas, The 0.734 22Australia 0.7291 23Luxembourg 0.7216 30Barbados 0.717 33Austria 0.7165 34Portugal 0.7144 35Slovenia 0.7041 41Poland 0.7038 42France 0.7018 48Croatia 0.7006 50Estonia 0.6983 52Israel 0.6926 55Greece 0.6916 56Singapore 0.6914 57Slovak Republic 0.6797 72Italy 0.6796 74Czech Republic 0.6789 75Brunei Darussalam 0.6787 76Malta 0.6658 83Hungary 0.6642 85Cyprus 0.6567 93Japan 0.6514 98United Arab Emirates 0.6454 103Kuwait 0.6322 105Korea, Rep. 0.6281 107Bahrain 0.6232 110Qatar 0.623 111Oman 0.5873 127Saudi Arabia 0.5753 131
* New country 2011Note: Income classifications are taken from the World Bank, which classifies economies into four income categories based on GNI per capita: high income, upper
middle income, lower middle income and low income.
14 Measuring the Global Gender Gap Global Gender Gap Report 2011
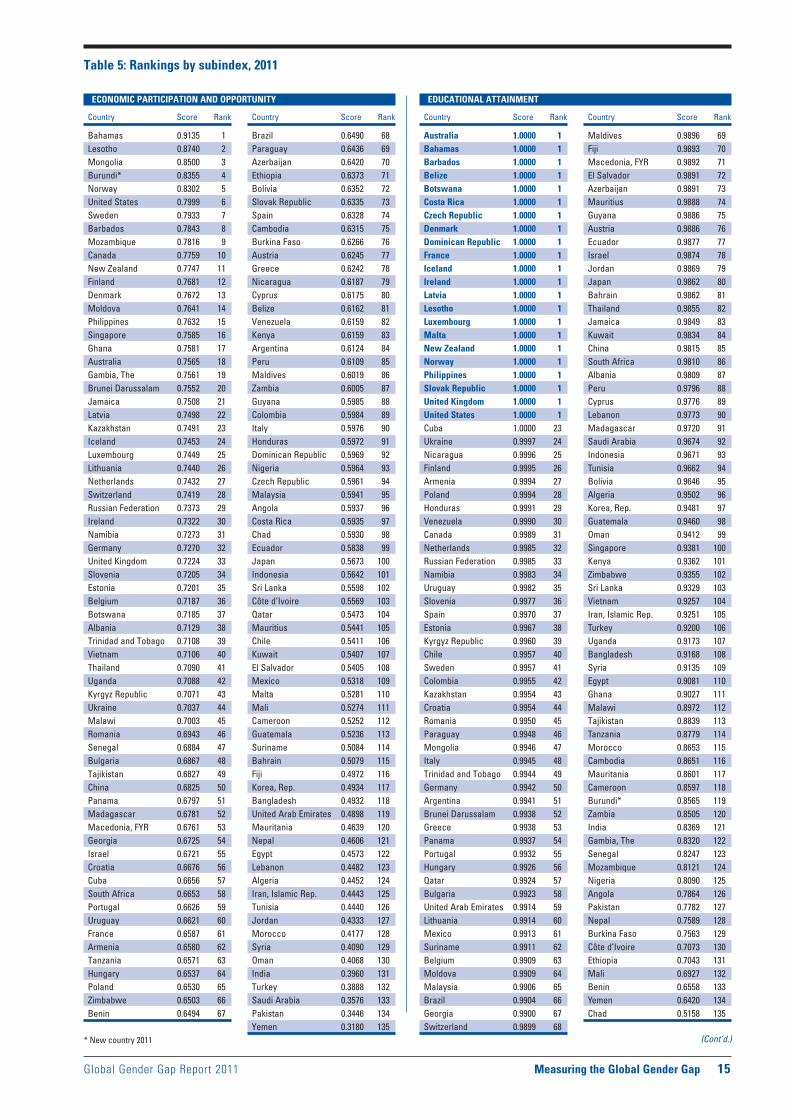
EDUCATIONAL ATTAINMENTECONOMIC PARTICIPATION AND OPPORTUNITY
Table 5: Rankings by subindex, 2011
Country Score Rank
Bahamas 0.9135 1Lesotho 0.8740 2Mongolia 0.8500 3Burundi* 0.8355 4Norway 0.8302 5United States 0.7999 6Sweden 0.7933 7Barbados 0.7843 8Mozambique 0.7816 9Canada 0.7759 10New Zealand 0.7747 11Finland 0.7681 12Denmark 0.7672 13Moldova 0.7641 14Philippines 0.7632 15Singapore 0.7585 16Ghana 0.7581 17Australia 0.7565 18Gambia, The 0.7561 19Brunei Darussalam 0.7552 20Jamaica 0.7508 21Latvia 0.7498 22Kazakhstan 0.7491 23Iceland 0.7453 24Luxembourg 0.7449 25Lithuania 0.7440 26Netherlands 0.7432 27Switzerland 0.7419 28Russian Federation 0.7373 29Ireland 0.7322 30Namibia 0.7273 31Germany 0.7270 32United Kingdom 0.7224 33Slovenia 0.7205 34Estonia 0.7201 35Belgium 0.7187 36Botswana 0.7185 37Albania 0.7129 38Trinidad and Tobago 0.7108 39Vietnam 0.7106 40Thailand 0.7090 41Uganda 0.7088 42Kyrgyz Republic 0.7071 43Ukraine 0.7037 44Malawi 0.7003 45Romania 0.6943 46Senegal 0.6884 47Bulgaria 0.6867 48Tajikistan 0.6827 49China 0.6825 50Panama 0.6797 51Madagascar 0.6781 52Macedonia, FYR 0.6761 53Georgia 0.6725 54Israel 0.6721 55Croatia 0.6676 56Cuba 0.6656 57South Africa 0.6653 58Portugal 0.6626 59Uruguay 0.6621 60France 0.6587 61Armenia 0.6580 62Tanzania 0.6571 63Hungary 0.6537 64Poland 0.6530 65Zimbabwe 0.6503 66Benin 0.6494 67
* New country 2011
Country Score Rank
Brazil 0.6490 68Paraguay 0.6436 69Azerbaijan 0.6420 70Ethiopia 0.6373 71Bolivia 0.6352 72Slovak Republic 0.6335 73Spain 0.6328 74Cambodia 0.6315 75Burkina Faso 0.6266 76Austria 0.6245 77Greece 0.6242 78Nicaragua 0.6187 79Cyprus 0.6175 80Belize 0.6162 81Venezuela 0.6159 82Kenya 0.6159 83Argentina 0.6124 84Peru 0.6109 85Maldives 0.6019 86Zambia 0.6005 87Guyana 0.5985 88Colombia 0.5984 89Italy 0.5976 90Honduras 0.5972 91Dominican Republic 0.5969 92Nigeria 0.5964 93Czech Republic 0.5961 94Malaysia 0.5941 95Angola 0.5937 96Costa Rica 0.5935 97Chad 0.5930 98Ecuador 0.5838 99Japan 0.5673 100Indonesia 0.5642 101Sri Lanka 0.5598 102Côte d’Ivoire 0.5569 103Qatar 0.5473 104Mauritius 0.5441 105Chile 0.5411 106Kuwait 0.5407 107El Salvador 0.5405 108Mexico 0.5318 109Malta 0.5281 110Mali 0.5274 111Cameroon 0.5252 112Guatemala 0.5236 113Suriname 0.5084 114Bahrain 0.5079 115Fiji 0.4972 116Korea, Rep. 0.4934 117Bangladesh 0.4932 118United Arab Emirates 0.4898 119Mauritania 0.4639 120Nepal 0.4606 121Egypt 0.4573 122Lebanon 0.4482 123Algeria 0.4452 124Iran, Islamic Rep. 0.4443 125Tunisia 0.4440 126Jordan 0.4333 127Morocco 0.4177 128Syria 0.4090 129Oman 0.4068 130India 0.3960 131Turkey 0.3888 132Saudi Arabia 0.3576 133Pakistan 0.3446 134Yemen 0.3180 135
Country Score Rank
Australia 1.0000 1Bahamas 1.0000 1Barbados 1.0000 1Belize 1.0000 1Botswana 1.0000 1Costa Rica 1.0000 1Czech Republic 1.0000 1Denmark 1.0000 1Dominican Republic 1.0000 1France 1.0000 1Iceland 1.0000 1Ireland 1.0000 1Latvia 1.0000 1Lesotho 1.0000 1Luxembourg 1.0000 1Malta 1.0000 1New Zealand 1.0000 1Norway 1.0000 1Philippines 1.0000 1Slovak Republic 1.0000 1United Kingdom 1.0000 1United States 1.0000 1Cuba 1.0000 23Ukraine 0.9997 24Nicaragua 0.9996 25Finland 0.9995 26Armenia 0.9994 27Poland 0.9994 28Honduras 0.9991 29Venezuela 0.9990 30Canada 0.9989 31Netherlands 0.9985 32Russian Federation 0.9985 33Namibia 0.9983 34Uruguay 0.9982 35Slovenia 0.9977 36Spain 0.9970 37Estonia 0.9967 38Kyrgyz Republic 0.9960 39Chile 0.9957 40Sweden 0.9957 41Colombia 0.9955 42Kazakhstan 0.9954 43Croatia 0.9954 44Romania 0.9950 45Paraguay 0.9948 46Mongolia 0.9946 47Italy 0.9945 48Trinidad and Tobago 0.9944 49Germany 0.9942 50Argentina 0.9941 51Brunei Darussalam 0.9938 52Greece 0.9938 53Panama 0.9937 54Portugal 0.9932 55Hungary 0.9926 56Qatar 0.9924 57Bulgaria 0.9923 58United Arab Emirates 0.9914 59Lithuania 0.9914 60Mexico 0.9913 61Suriname 0.9911 62Belgium 0.9909 63Moldova 0.9909 64Malaysia 0.9906 65Brazil 0.9904 66Georgia 0.9900 67Switzerland 0.9899 68
Country Score Rank
Maldives 0.9896 69Fiji 0.9893 70Macedonia, FYR 0.9892 71El Salvador 0.9891 72Azerbaijan 0.9891 73Mauritius 0.9888 74Guyana 0.9886 75Austria 0.9886 76Ecuador 0.9877 77Israel 0.9874 78Jordan 0.9869 79Japan 0.9862 80Bahrain 0.9862 81Thailand 0.9855 82Jamaica 0.9849 83Kuwait 0.9834 84China 0.9815 85South Africa 0.9810 86Albania 0.9809 87Peru 0.9796 88Cyprus 0.9776 89Lebanon 0.9773 90Madagascar 0.9720 91Saudi Arabia 0.9674 92Indonesia 0.9671 93Tunisia 0.9662 94Bolivia 0.9646 95Algeria 0.9502 96Korea, Rep. 0.9481 97Guatemala 0.9460 98Oman 0.9412 99Singapore 0.9381 100Kenya 0.9362 101Zimbabwe 0.9355 102Sri Lanka 0.9329 103Vietnam 0.9257 104Iran, Islamic Rep. 0.9251 105Turkey 0.9200 106Uganda 0.9173 107Bangladesh 0.9168 108Syria 0.9135 109Egypt 0.9081 110Ghana 0.9027 111Malawi 0.8972 112Tajikistan 0.8839 113Tanzania 0.8779 114Morocco 0.8653 115Cambodia 0.8651 116Mauritania 0.8601 117Cameroon 0.8597 118Burundi* 0.8565 119Zambia 0.8505 120India 0.8369 121Gambia, The 0.8320 122Senegal 0.8247 123Mozambique 0.8121 124Nigeria 0.8090 125Angola 0.7864 126Pakistan 0.7782 127Nepal 0.7589 128Burkina Faso 0.7563 129Côte d’Ivoire 0.7073 130Ethiopia 0.7043 131Mali 0.6927 132Benin 0.6558 133Yemen 0.6420 134Chad 0.5158 135
(Cont’d.)
Global Gender Gap Report 2011 Measuring the Global Gender Gap 15
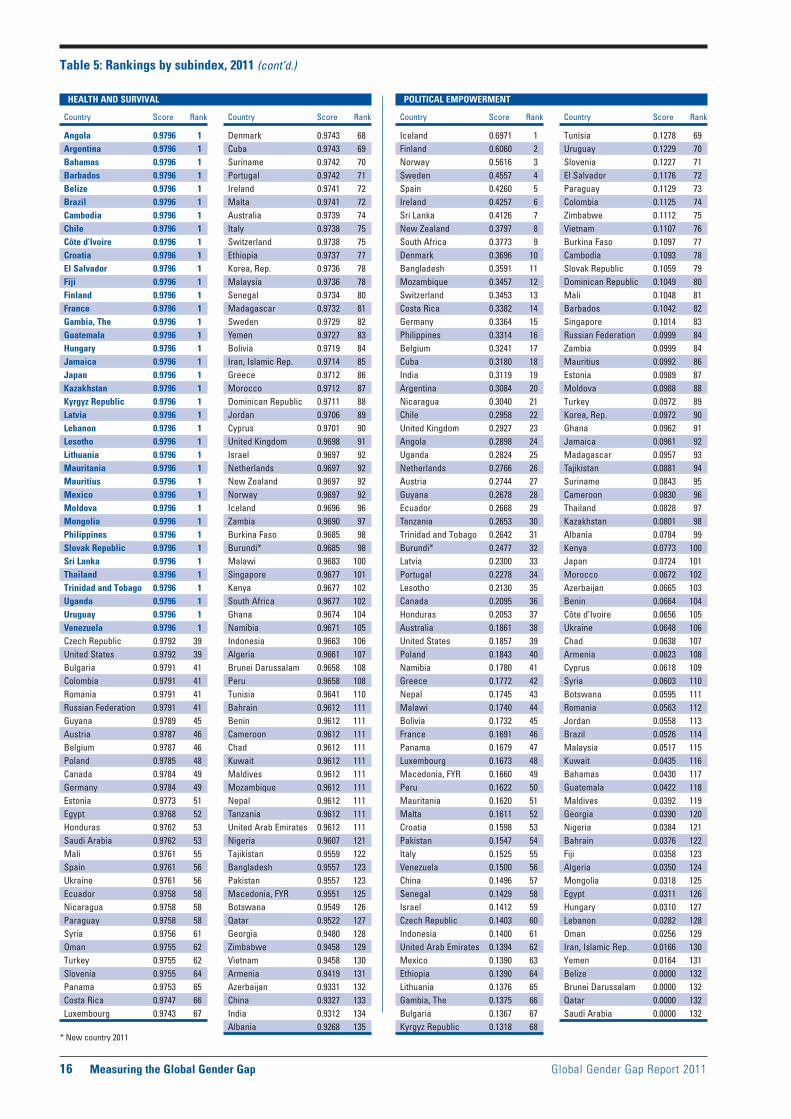
POLITICAL EMPOWERMENT HEALTH AND SURVIVAL
Table 5: Rankings by subindex, 2011 (cont’d.)
Country Score Rank
Angola 0.9796 1Argentina 0.9796 1Bahamas 0.9796 1Barbados 0.9796 1Belize 0.9796 1Brazil 0.9796 1Cambodia 0.9796 1Chile 0.9796 1Côte d’Ivoire 0.9796 1Croatia 0.9796 1El Salvador 0.9796 1Fiji 0.9796 1Finland 0.9796 1France 0.9796 1Gambia, The 0.9796 1Guatemala 0.9796 1Hungary 0.9796 1Jamaica 0.9796 1Japan 0.9796 1Kazakhstan 0.9796 1Kyrgyz Republic 0.9796 1Latvia 0.9796 1Lebanon 0.9796 1Lesotho 0.9796 1Lithuania 0.9796 1Mauritania 0.9796 1Mauritius 0.9796 1Mexico 0.9796 1Moldova 0.9796 1Mongolia 0.9796 1Philippines 0.9796 1Slovak Republic 0.9796 1Sri Lanka 0.9796 1Thailand 0.9796 1Trinidad and Tobago 0.9796 1Uganda 0.9796 1Uruguay 0.9796 1Venezuela 0.9796 1Czech Republic 0.9792 39United States 0.9792 39Bulgaria 0.9791 41Colombia 0.9791 41Romania 0.9791 41Russian Federation 0.9791 41Guyana 0.9789 45Austria 0.9787 46Belgium 0.9787 46Poland 0.9785 48Canada 0.9784 49Germany 0.9784 49Estonia 0.9773 51Egypt 0.9768 52Honduras 0.9762 53Saudi Arabia 0.9762 53Mali 0.9761 55Spain 0.9761 56Ukraine 0.9761 56Ecuador 0.9758 58Nicaragua 0.9758 58Paraguay 0.9758 58Syria 0.9756 61Oman 0.9755 62Turkey 0.9755 62Slovenia 0.9755 64Panama 0.9753 65Costa Rica 0.9747 66Luxembourg 0.9743 67
* New country 2011
Country Score Rank
Denmark 0.9743 68Cuba 0.9743 69Suriname 0.9742 70Portugal 0.9742 71Ireland 0.9741 72Malta 0.9741 72Australia 0.9739 74Italy 0.9738 75Switzerland 0.9738 75Ethiopia 0.9737 77Korea, Rep. 0.9736 78Malaysia 0.9736 78Senegal 0.9734 80Madagascar 0.9732 81Sweden 0.9729 82Yemen 0.9727 83Bolivia 0.9719 84Iran, Islamic Rep. 0.9714 85Greece 0.9712 86Morocco 0.9712 87Dominican Republic 0.9711 88Jordan 0.9706 89Cyprus 0.9701 90United Kingdom 0.9698 91Israel 0.9697 92Netherlands 0.9697 92New Zealand 0.9697 92Norway 0.9697 92Iceland 0.9696 96Zambia 0.9690 97Burkina Faso 0.9685 98Burundi* 0.9685 98Malawi 0.9683 100Singapore 0.9677 101Kenya 0.9677 102South Africa 0.9677 102Ghana 0.9674 104Namibia 0.9671 105Indonesia 0.9663 106Algeria 0.9661 107Brunei Darussalam 0.9658 108Peru 0.9658 108Tunisia 0.9641 110Bahrain 0.9612 111Benin 0.9612 111Cameroon 0.9612 111Chad 0.9612 111Kuwait 0.9612 111Maldives 0.9612 111Mozambique 0.9612 111Nepal 0.9612 111Tanzania 0.9612 111United Arab Emirates 0.9612 111Nigeria 0.9607 121Tajikistan 0.9559 122Bangladesh 0.9557 123Pakistan 0.9557 123Macedonia, FYR 0.9551 125Botswana 0.9549 126Qatar 0.9522 127Georgia 0.9480 128Zimbabwe 0.9458 129Vietnam 0.9458 130Armenia 0.9419 131Azerbaijan 0.9331 132China 0.9327 133India 0.9312 134Albania 0.9268 135
Country Score Rank
Iceland 0.6971 1Finland 0.6060 2Norway 0.5616 3Sweden 0.4557 4Spain 0.4260 5Ireland 0.4257 6Sri Lanka 0.4126 7New Zealand 0.3797 8South Africa 0.3773 9Denmark 0.3696 10Bangladesh 0.3591 11Mozambique 0.3457 12Switzerland 0.3453 13Costa Rica 0.3382 14Germany 0.3364 15Philippines 0.3314 16Belgium 0.3241 17Cuba 0.3180 18India 0.3119 19Argentina 0.3084 20Nicaragua 0.3040 21Chile 0.2958 22United Kingdom 0.2927 23Angola 0.2898 24Uganda 0.2824 25Netherlands 0.2766 26Austria 0.2744 27Guyana 0.2678 28Ecuador 0.2668 29Tanzania 0.2653 30Trinidad and Tobago 0.2642 31Burundi* 0.2477 32Latvia 0.2300 33Portugal 0.2278 34Lesotho 0.2130 35Canada 0.2095 36Honduras 0.2053 37Australia 0.1861 38United States 0.1857 39Poland 0.1843 40Namibia 0.1780 41Greece 0.1772 42Nepal 0.1745 43Malawi 0.1740 44Bolivia 0.1732 45France 0.1691 46Panama 0.1679 47Luxembourg 0.1673 48Macedonia, FYR 0.1660 49Peru 0.1622 50Mauritania 0.1620 51Malta 0.1611 52Croatia 0.1598 53Pakistan 0.1547 54Italy 0.1525 55Venezuela 0.1500 56China 0.1496 57Senegal 0.1429 58Israel 0.1412 59Czech Republic 0.1403 60Indonesia 0.1400 61United Arab Emirates 0.1394 62Mexico 0.1390 63Ethiopia 0.1390 64Lithuania 0.1376 65Gambia, The 0.1375 66Bulgaria 0.1367 67Kyrgyz Republic 0.1318 68
Country Score Rank
Tunisia 0.1278 69Uruguay 0.1229 70Slovenia 0.1227 71El Salvador 0.1176 72Paraguay 0.1129 73Colombia 0.1125 74Zimbabwe 0.1112 75Vietnam 0.1107 76Burkina Faso 0.1097 77Cambodia 0.1093 78Slovak Republic 0.1059 79Dominican Republic 0.1049 80Mali 0.1048 81Barbados 0.1042 82Singapore 0.1014 83Russian Federation 0.0999 84Zambia 0.0999 84Mauritius 0.0992 86Estonia 0.0989 87Moldova 0.0988 88Turkey 0.0972 89Korea, Rep. 0.0972 90Ghana 0.0962 91Jamaica 0.0961 92Madagascar 0.0957 93Tajikistan 0.0881 94Suriname 0.0843 95Cameroon 0.0830 96Thailand 0.0828 97Kazakhstan 0.0801 98Albania 0.0784 99Kenya 0.0773 100Japan 0.0724 101Morocco 0.0672 102Azerbaijan 0.0665 103Benin 0.0664 104Côte d’Ivoire 0.0656 105Ukraine 0.0648 106Chad 0.0638 107Armenia 0.0623 108Cyprus 0.0618 109Syria 0.0603 110Botswana 0.0595 111Romania 0.0563 112Jordan 0.0558 113Brazil 0.0526 114Malaysia 0.0517 115Kuwait 0.0435 116Bahamas 0.0430 117Guatemala 0.0422 118Maldives 0.0392 119Georgia 0.0390 120Nigeria 0.0384 121Bahrain 0.0376 122Fiji 0.0358 123Algeria 0.0350 124Mongolia 0.0318 125Egypt 0.0311 126Hungary 0.0310 127Lebanon 0.0282 128Oman 0.0256 129Iran, Islamic Rep. 0.0166 130Yemen 0.0164 131Belize 0.0000 132Brunei Darussalam 0.0000 132Qatar 0.0000 132Saudi Arabia 0.0000 132
16 Measuring the Global Gender Gap Global Gender Gap Report 2011
political empowerment remains wide: only 59% of the economic outcomes gap and only 19% of the political outcomes gap has been closed.
Table 4 shows the rankings of countries by income group; Table B2 in Appendix B displays the income group categories used. In 2011, in the high-income group, the Nordic countries lead the way while Saudi Arabia (131) is the lowest performing country in this category. In the upper-middle-income group, South Africa (14) ranks highest while Iran (125) occupies the lowest position. In the lower-middle-income group, the Philippines (8) comes out on top while Yemen (135) holds last position. In the lower-income group, Burundi (24) is the strongest performer while Chad (134) is in last place.
Table 5 shows the rankings of countries by subin-dex. In 2011, 22 countries have fully closed the gap in educational attainment, compared with 22 in 2010, 25 countries in 2009, 24 in 2008 and 15 in 2007. Chad, the lowest-ranking country on this subindex, has closed only about 52 percent of its gender gap. Thirty-eight countries have closed the gap in health and survival, compared with 37 in 2009, 36 in 2008 and 32 in 2007. China, India and Albania are the lowest-ranking countries on this sub-index. Eight countries have closed the gap in both the health and education subindexes. No country has closed the economic participation gap or the political empow-erment gap. On the economic participation and oppor-tunity subindex, the highest-ranking country (Bahamas)
has closed over 91% of its gender gap while the lowest ranking country (Yemen) has closed only 32% of its eco-nomic gender gap. There is similar variation in the politi-cal empowerment subindex. The highest-ranking country (Iceland) has closed almost 70% of its gender gap whereas the lowest-ranking country (Saudi Arabia) has closed none of the political empowerment gap according to this measure.
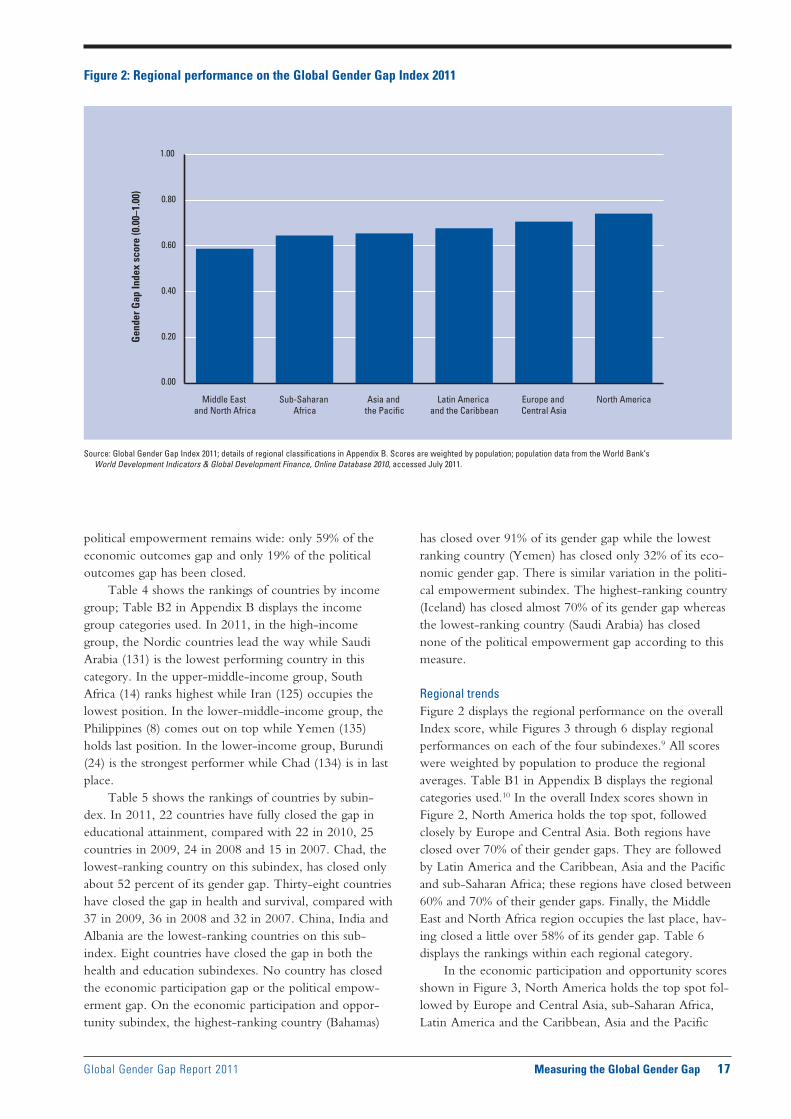
Regional trendsFigure 2 displays the regional performance on the overall Index score, while Figures 3 through 6 display regional performances on each of the four subindexes.9 All scores were weighted by population to produce the regional averages. Table B1 in Appendix B displays the regional categories used.10 In the overall Index scores shown in Figure 2, North America holds the top spot, followed closely by Europe and Central Asia. Both regions have closed over 70% of their gender gaps. They are followed by Latin America and the Caribbean, Asia and the Pacific and sub-Saharan Africa; these regions have closed between 60% and 70% of their gender gaps. Finally, the Middle East and North Africa region occupies the last place, hav-ing closed a little over 58% of its gender gap. Table 6 displays the rankings within each regional category.
In the economic participation and opportunity scores shown in Figure 3, North America holds the top spot fol-lowed by Europe and Central Asia, sub-Saharan Africa, Latin America and the Caribbean, Asia and the Pacific
0.00
0.20
0.40
0.60
0.80
1.00
Middle East and North Africa
Sub-Saharan Africa
Asia and the Pacific
Latin America and the Caribbean
Europe and Central Asia
North America
Gen
der G
ap In
dex
scor
e (0
.00–
1.00
)
Figure 2: Regional performance on the Global Gender Gap Index 2011
Source: Global Gender Gap Index 2011; details of regional classifications in Appendix B. Scores are weighted by population; population data from the World Bank’s World Development Indicators & Global Development Finance, Online Database 2010, accessed July 2011.
Global Gender Gap Report 2011 Measuring the Global Gender Gap 17
and Middle East and North Africa. In the educational attainment scores shown in Figure 4, North America once again tops the rankings, followed by Latin America, Europe and Central Asia, Asia and the Pacific, the Middle East and North Africa and sub-Saharan Africa.
In the health and survival scores shown in Figure 5, North America holds the top spot, followed closely by Europe and Central Asia, Latin America and the Caribbean and the Middle East and North Africa. Asia and the Pacific and sub-Saharan Africa occupy the last place as the worst regions for women’s health and sur-vival relative to that of men. In the political empower-ment scores shown in Figure 6, while all regions are well below parity, Asia and the Pacific leads the way, followed
by Europe and Central Asia, North America, sub-Saharan Africa, Latin America and the Caribbean and the Middle East and North Africa. Table 6 displays the rankings within each regional category.
Top 10The four Nordic countries that have consistently held the highest positions in previous editions of the Global Gender Gap Index continue to hold these privileged posi-tions, with Iceland (1) still holding the top spot, closely followed by Norway (2), Finland (3) and Sweden (4).
Although no country has yet achieved gender equal-ity, all of the Nordic countries, with the exception of Denmark, have closed over 80% of the gender gap and
Table 6: Rankings by region, 2011
ASIA AND THE PACIFIC
Country Score Rank
New Zealand 0.7810 6Philippines 0.7685 8Australia 0.7291 23Sri Lanka 0.7212 31Mongolia 0.7140 36Singapore 0.6914 57Thailand 0.6892 60China 0.6866 61Bangladesh 0.6812 69Brunei Darussalam 0.6787 76Vietnam 0.6732 79Indonesia 0.6594 90Malaysia 0.6525 97Japan 0.6514 98Maldives 0.6480 101Cambodia 0.6464 102Korea, Rep. 0.6281 107Fiji 0.6255 109India 0.6190 113Iran, Islamic Rep. 0.5894 125Nepal 0.5888 126Pakistan 0.5583 133
LATIN AMERICA AND THE CARIBBEAN
Country Score Rank
Cuba 0.7394 20Trinidad and Tobago 0.7372 21Bahamas 0.7340 22Costa Rica 0.7266 25Nicaragua 0.7245 27Argentina 0.7236 28Barbados 0.7170 33Guyana 0.7084 38Panama 0.7042 40Ecuador 0.7035 45Chile 0.7030 46Jamaica 0.7028 47Honduras 0.6945 54Uruguay 0.6907 58Bolivia 0.6862 62Venezuela 0.6861 63Paraguay 0.6818 67Peru 0.6796 73Colombia 0.6714 80Dominican Republic 0.6682 81Brazil 0.6679 82Mexico 0.6604 89El Salvador 0.6567 94Belize 0.6489 100Suriname 0.6395 104Guatemala 0.6229 112
MIDDLE EAST AND NORTH AFRICA
Country Score Rank
Israel 0.6926 55United Arab Emirates 0.6454 103Kuwait 0.6322 105Tunisia 0.6255 108Bahrain 0.6232 110Qatar 0.623 111Mauritania 0.6164 114Jordan 0.6117 117Lebanon 0.6083 118Algeria 0.5991 121Egypt 0.5933 123Syria 0.5896 124Oman 0.5873 127Morocco 0.5804 129Saudi Arabia 0.5753 131Yemen 0.4873 135
(Cont’d.)
18 Measuring the Global Gender Gap Global Gender Gap Report 2011
thus serve as models and useful benchmarks for interna-tional comparisons. While many global indexes tend to be tied to income levels, thus providing an advantage to the high-income Nordic economies, the Global Gender Gap Index is disassociated from the income and resource level of an economy and instead seeks to measure how equita-bly the available income, resources and opportunities are distributed between women and men. Despite this feature of the Index, these countries emerge as top performers and true leaders on gender equality.
All Nordic countries reached 99–100% literacy for both sexes several decades ago and display gender parity at both primary- and secondary-level education. At the ter-tiary level, in addition to very high levels of enrolment for
both women and men, the gender gap has been reversed and women now make up the majority of the high-skilled workforce. In Norway, Sweden and Iceland there are over 1.5 women for every man enrolled in tertiary educa-tion, and in Finland and Denmark women also make up the majority of those in tertiary education. The Nordic countries also exhibit very high healthy life expectancies for both women and men, with women living on average three to four healthy years longer than men.
While many developed economies have succeeded in closing the gender gap in education, few have succeeded in maximizing the returns from this investment. The Nordic countries are leaders in this area—all five coun-tries feature in the top 30 of the economic participation
Table 6: Rankings by region, 2011 (cont’d.)
NORTH AMERICA
Country Score Rank
United States 0.7412Canada 0.7407
SUB-SAHARAN AFRICA
Country Score Rank
Lesotho 0.7666 9South Africa 0.7478 14Burundi* 0.7270 24Mozambique 0.7251 26Uganda 0.7220 29Namibia 0.7177 32Tanzania 0.6904 59Malawi 0.6850 65Botswana 0.6832 66Ghana 0.6811 70Madagascar 0.6797 71Gambia, The 0.6763 77Angola 0.6624 87Zimbabwe 0.6607 88Senegal 0.6573 92Mauritius 0.6529 95Kenya 0.6493 99Zambia 0.6300 106Burkina Faso 0.6153 115Ethiopia 0.6136 116Cameroon 0.6073 119Nigeria 0.6011 120Benin 0.5832 128Côte d’Ivoire 0.5773 130Mali 0.5752 132Chad 0.5334 134
* New country 2011
EUROPE AND CENTRAL ASIA
Country Score Rank
Iceland 0.8530 1Norway 0.8404 2Finland 0.8383 3Sweden 0.8044 4Ireland 0.7830 5Denmark 0.7778 7Switzerland 0.7627 10Germany 0.7590 11Spain 0.7580 12Belgium 0.7531 13Netherlands 0.7470 15United Kingdom 0.7462 16Latvia 0.7399 19Luxembourg 0.7216 30Austria 0.7165 34Portugal 0.7144 35Lithuania 0.7131 37Moldova 0.7083 39Slovenia 0.7041 41Poland 0.7038 42Russian Federation 0.7037 43Kyrgyz Republic 0.7036 44France 0.7018 48Kazakhstan 0.7010 49Croatia 0.7006 50Bulgaria 0.6987 51Estonia 0.6983 52Macedonia, FYR 0.6966 53Greece 0.6916 56Ukraine 0.6861 64Romania 0.6812 68Slovak Republic 0.6797 72Italy 0.6796 74Czech Republic 0.6789 75Albania 0.6748 78Malta 0.6658 83Armenia 0.6654 84Hungary 0.6642 85Georgia 0.6624 86Azerbaijan 0.6577 91Cyprus 0.6567 93Tajikistan 0.6526 96Turkey 0.5954 122
Global Gender Gap Report 2011 Measuring the Global Gender Gap 19
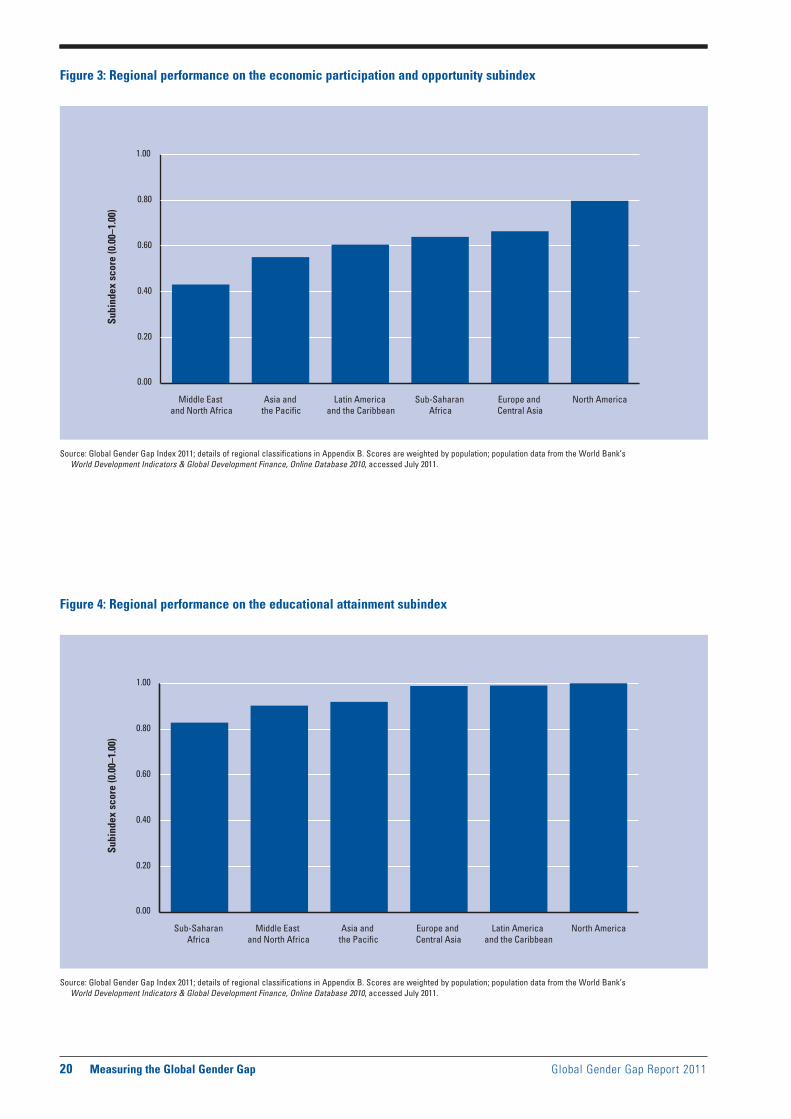
20 Measuring the Global Gender Gap Global Gender Gap Report 2011
0.00
0.20
0.40
0.60
0.80
1.00
Sub-SaharanAfrica
Middle East and North Africa
Asia and the Pacific
Latin America and the Caribbean
Europe and Central Asia
North America
Figure 3: Regional performance on the economic participation and opportunity subindex
0.00
0.20
0.40
0.60
0.80
1.00
Middle East and North Africa
Sub-Saharan Africa
Asia and the Pacific
Latin America and the Caribbean
Europe and Central Asia
North America
Subi
ndex
sco
re (0
.00–
1.00
)
Figure 4: Regional performance on the educational attainment subindex
Subi
ndex
sco
re (0
.00–
1.00
)
Source: Global Gender Gap Index 2011; details of regional classifications in Appendix B. Scores are weighted by population; population data from the World Bank’s World Development Indicators & Global Development Finance, Online Database 2010, accessed July 2011.
Source: Global Gender Gap Index 2011; details of regional classifications in Appendix B. Scores are weighted by population; population data from the World Bank’s World Development Indicators & Global Development Finance, Online Database 2010, accessed July 2011.

Global Gender Gap Report 2011 Measuring the Global Gender Gap 21
Figure 5: Regional performance on the health and survival subindex
Source: Global Gender Gap Index 2011; details of regional classifications in Appendix B. Scores are weighted by population; population data from the World Bank’s World Development Indicators & Global Development Finance, Online Database 2010, accessed July 2011.
0.00
0.20
0.40
0.60
0.80
1.00
Middle East and North Africa
Sub-Saharan Africa
Asia and the Pacific
Latin America and the Caribbean
Europe and Central Asia
North America
Subi
ndex
sco
re (0
.00–
1.00
)
Figure 6: Regional performance on the political empowerment subindex
Source: Global Gender Gap Index 2011; details of regional classifications in Appendix B. Scores are weighted by population; population data from the World Bank’s World Development Indicators & Global Development Finance, Online Database 2010, accessed July 2011.
0.00
0.20
0.40
0.60
0.80
1.00
Middle East and North Africa
Sub-Saharan Africa
Asia and the Pacific
Latin America and the Caribbean
Europe and Central Asia
North America
Subi
ndex
sco
re (0
.00–
1.00
)
and opportunity subindex. This occurs because of a com-bination of factors: the labour force participation rates for women are among the highest in the world; salary gaps between women and men are among the lowest in the world, although not non-existent; and women have abundant opportunities to rise to positions of leadership. These patterns vary across the Nordic countries, but on the whole these economies have made it possible for par-ents to combine work and family, resulting in high female participation rates, more shared participation in childcare, more equitable distribution of labour at home, better work-life balance for both women and men and in some cases a boost to declining fertility rates. Policies applied in these countries include mandatory paternal leave in com-bination with maternity leave, generous federally man-dated parental leave benefits provided by a combination of social insurance funds and employers, tax incentives and post-maternity re-entry programmes. Together these poli-cies have also led to relatively higher and rising birth rates occurring simultaneously with high female workforce par-ticipation in the Nordic countries, as compared with the situation in other OECD economies such as Germany, Japan, Italy and Spain where both birth rates and partici-pation are lower. The Nordic experience points to fewer problems with ageing in the future, as well as higher labour activity and a more robust economy. Finally there has also been success with a top-down approach to pro-moting women’s leadership—in Norway, publicly listed companies have been required to have 40% of each sex on their boards since 2008 and other countries are adopting similar measures.
The Nordic countries were also early starters in pro-viding women with the right to vote (Sweden in 1919, Norway in 1913, Iceland and Denmark in 1915, Finland in 1906). In Denmark, Sweden and Norway, political parties introduced voluntary gender quotas in the 1970s, resulting in high levels of female political representatives over the years. In Denmark, in fact, this quota has since been abandoned as no further stimulus is required. Today, Sweden has among the highest percentage of women in parliament in the world (45%) while the other Nordic countries are also successful in this respect. These coun-tries have a similarly strong record on the percentage of women in ministerial level positions.
Next in the top 10, Ireland (5) gains one spot in the rankings, replacing New Zealand (6) in 5th place. Both countries show improvement in scores relative to their own performance in 2010 but Ireland posts relatively larger gains. The remaining Nordic country—Denmark (7)—also holds a place among the top 10 and shows some gains in wage equality in 2011, rounding off the Nordic countries’ record as top performers. The Philippines (8) remains the highest-ranking country from Asia in the Index. It ranks 1st on both education and health and is also a very strong performer on economic participation (15) and political empowerment (16). The Philippines is
the only country in Asia this year to have closed the gen-der gap in both education and health and is among only eight countries in the world to have done so. Lesotho (9) loses one place in the rankings but remains the only country in sub-Saharan Africa to have no gap in both education and health. It is also the second-highest-ranking country among the 135 countries on the economic par-ticipation and opportunity subindex. Switzerland (10) remains among the top 10 for the second consecutive year and continues to show gains in educational attainment, economic participation and political empowerment.
Europe and Central AsiaThe Europe and Central Asia region has closed 71% of the gender gap and is second only to North America on the overall Global Gender Gap Index 2011 scores. The region has closed the gaps in health (98%) and educational attainment (99%), and is the second-highest-ranked region for the economic participation and opportunity subindex (65%) and the political empowerment subindex (19%). Five of the top 10 countries in the estimated earned in-come ratio and 7 of the top 10 in the professional and technical workers indicator are from this region. Similar trends can be seen across the political empowerment sub-index, where 50% of the highest-ranking countries come from Europe and Central Asia, with the Nordic countries dominating the top four places.
On the overall Index, 7 European countries rank among the top 10; a total of 13 European countries are among the top 20, including Germany (11), Spain (12), Belgium (13), the Netherlands (15), the United Kingdom (16) and Latvia (19).
Germany moves up to two positions, mainly because of improvements in the wage equality between men and women and in women’s estimated earned income, as well as to a slight increase in the political empowerment sub-index. Spain loses one place, but shows slight improve-ment in the areas of wage equality and women’s estimated earned income. Spain ranks 5th globally in the political empowerment subindex.
Belgium moves up to 13th position mainly as a re-sult of improvements in the subindex on economic par-ticipation and opportunity. Despite a slight decrease in women’s estimated earned income, the country regis-ters a larger increase in perceived wage equality. The Netherlands is next, gaining two places to reach the 15th position, with a minor decrease in the representation of women in parliament balanced out by improved wage equality and, particularly, women’s estimated earned in-come, ranking 8th on this indicator.
The Netherlands is followed by the United Kingdom, which slips down to 16th place, and by Latvia, which loses one place, mostly because of deterioration in the political empowerment subindex. Luxembourg (30) fol-lows next, losing four places relative to last year’s ranking, primarily because of a slight decrease in perceived wage
22 Measuring the Global Gender Gap Global Gender Gap Report 2011
equality. Austria gains three places, to reach 34th place overall. Its improved ranking is the result of a good per-formance across the subindex of women’s economic par-ticipation and opportunity. Next in the region’s rankings is Portugal (35), which loses three places because of small deteriorations in the category of estimated earned income, wage equality and female representation in parliament.
Lithuania (37) follows; despite an improved perfor-mance in educational attainment category, Lithuania lags behind other countries in the area of women’s economic participation and opportunity. Moldova comes next at 39th position (down five places from last year), closely followed by Slovenia (41), Poland (42), the Russian Federation (43) and Kyrgyz Republic (44). The Russian Federation gains two positions in the overall Index, build-ing on its strengths in the economic participation and op-portunity category.
France (48), Kazakhstan (49), Croatia (50), Bulgaria (51), Estonia (52) and Macedonia, FYR (53) are next in the rankings. France falls two places this year to take the 48th position, primarily because of a drop in the wage equality indicator; the country ranks last overall on the perceived wage equality survey indicator. However France also ranks among the top 10 in the world in the educational attainment subindex, showing a competitive advantage in developing an educated female talent pool. While Croatia gains three positions relative to last year, the other countries slip in the rankings. Macedonia, how-ever, shows a strong performance in the perceived wage equality category, ranking 7th overall.
Greece (56) and Ukraine (64) occupy the next places, followed by Romania (68), which—despite gain-ing positions in the educational attainment subindex—re-cords deterioration in women’s economic participation.
Slovakia (72), Italy (74), Czech Republic (75) and Albania (78) come next in the region. Italy holds the same position this year as last, despite improvements in the health subindex and in women’s economic participation. The country continues to be one of the lowest-ranking countries in the European Union. The Czech Republic slips 10 places this year. The most noticeable drop for the country is in the estimated earned income ratio (female/male) category, which falls from 0.57 to 0.48 as a result of a combined decrease in female values and an increase in male values. Notwithstanding an improved performance in the wage equality category, Albania keeps the same place as last year’s because of a below-average perfor-mance in the educational attainment subindex.
Malta (83) and Armenia (84) come next, hold-ing the same positions as in the 2010 rankings. Hungary (85) falls six places this year, the result of a combined drop in female values and an increase in male values, al-though the country performs relatively well in the areas of educational attainment and health, perceived wage equality and the estimated earned income ratio decrease. Additionally, Hungary is among the 10 lowest-ranking
countries worldwide in terms of political empowerment performance.
Georgia (86) follows next, gaining two places. At 91st place, Azerbaijan gains nine spots relative to last year. The gross tertiary level enrolment rate for women has increased from 14% to 19%, and the percentage of women in parliament has moved from 11% up to 16%.
Cyprus (93) slips down seven spots from the com-bined effect of lower scores in the tertiary level enrolment ratio and representation of women in parliament. Cyprus is the lowest-ranked EU country in the overall rankings. Tajikistan (96) follows next. Turkey (122) occupies the last place in the regional rankings. The country performs above average in the political empowerment of women—primarily women in parliament—and in the educational attainment category, but lags behind in the other two sub-indexes. Turkey ranks among the 10 worst performers in the economic participation and opportunity subindex.
North AmericaThe United States (17) continues to climb in the rank-ings, up this year from 19th place in 2010, although its score remains unchanged. The United States shows no gap in educational attainment, with very high levels of literacy for both women and men and very high levels of women’s enrolment in primary, secondary and tertiary education, with women outstripping men in tertiary-level education. The United States places 6th in the world in terms of economic participation and opportunity, the result of high rates of women’s labour force participa-tion and prominent numbers of women in legislative, senior official and managerial positions as well professional and technical worker positions. However, the perceived wage inequality for similar work remains high, placing the United States 68th in the world on this variable. The country has also posted significant gains in the politi-cal empowerment subindex, from 66th place out of 115 countries in 2006 to 39th place out of 135 countries in 2011.
Canada (18) gains two places in the rankings. Like the United States, Canada’s strength lies in educational attainment and economic participation. Canada has also improved its performance on political empowerment since the first edition of this Report. In 2006, Canada had closed 16% of the gender gap in this subindex; in 2011, it has closed 21% of this gap.
Latin America and the CaribbeanThe Latin America and the Caribbean region has closed 68% of its overall gender gap according to the Index methodology. The region performs well on the edu-cational attainment and health and survival subindexes, holding 2nd position just after North America but ahead of Europe and Central Asia. Thirteen countries in Latin America and the Caribbean have fully closed their gender gaps in the heath and survival subindex, and five countries
Global Gender Gap Report 2011 Measuring the Global Gender Gap 23
have fully closed gaps in educational attainment. The re-maining gaps are thus most concentrated in the economic participation and political empowerment subindexes. Out of the seven countries that have no women holding a ministerial position, three are from the region.
Cuba (20) is regaining the highest spot in the region after having lost it for the past three years and enters the top 20 countries. Cuba’s position is supported in particular by a high proportion of women among professional and technical workers (60%) and in parliament (43%). Cuba also has very high levels of enrolment in primary, second-ary and tertiary education for both women and men.
Trinidad and Tobago (21) stays in the same posi-tion in the rankings as last year, although its overall score improves slightly. It holds the second spot in the region, with 43% women among legislators, senior officials and managers and 34% women among ministerial positions. The next country from the region in the rankings is the Bahamas (22) which gains 14 places relative to its rank in 2010. This improvement is driven mainly by significant gains in the proportions of women among legislators, se-nior officials and managers (46%). The Bahamas also holds the 1st spot globally on the economic participation and opportunity, educational attainment and health and sur-vival subindexes.
Costa Rica (25), Nicaragua (27) and Argentina (28) follow next. Both Costa Rica and Nicaragua gain three places in the rankings. Costa Rica’s gain results from new data on primary enrolment as well as an increase in the estimated earned income of women (from US$ 6,788 to US$ 7,849). Costa Rica also holds the best score in the region on the political empowerment subindex. Nicaragua’s increase is driven mainly by a narrowing wage gap. Nicaragua’s performance over the last six years puts it among the top climbers of the 114 countries that have been included in the Report since 2006. Argentina moves up one spot in the overall rankings. This is the result of an increase in its economic participation and opportunity subindex score, although this is partially offset by a small increase in the primary enrolment gap.
Barbados (33), Guyana (38), Panama (40), Ecuador (45), Chile (46) and Jamaica (47) occupy the next posi-tions in the rankings. Barbados is one of three countries from the region that have closed the gender gap in both the education attainment and health and survival subin-dexes. Guyana maintains its position relative to last year although its overall score slightly falls because of small de-creases in literacy rate gaps as well as primary and tertiary enrolment gaps. Panama and Ecuador slip down one and five places, respectively, because of widening economic participation gaps. Chile moves up in the rankings, gain-ing two places. Chile’s strength lies in the area of political empowerment.
Jamaica is followed by Honduras (54), Uruguay (58), Bolivia (62), Venezuela (63), Paraguay (67) and Peru (73). Honduras stays in the same position as last year
while Uruguay gains one spot. Bolivia shows a significant improvement in its ranking, gaining 14 places. Bolivia’s leap in the rankings is the consequence of a significant decrease in the wage gap; it is now the highest-ranking country from the region on the estimated earned income indicator. Venezuela moves up one spot this year, and has the highest percentage of women professional and tech-nical workers (64%) in the region. Paraguay gains two positions, while Peru experiences a decline in the overall rankings (from 60th to 73rd position). This drop is caused mainly by a decrease in the number of women in parlia-ment, which fell from 28% to 22%.
Next in the rankings are Colombia (80), Dominican Republic (81) and Brazil (82). Colombia displays the big-gest drop in the region, falling from 55th to 80th posi-tion. While the percentage of women in parliament in the country has increased from 10% to 13%, this gain is offset by a drop in the female estimated earned income (from US$ 7,138 to US$ 5,718); female legislators, senior of-ficials and managers and female professional and technical workers. The Dominican Republic slips down eight spots relative to its performance last year because of decreases in perceived wage equality and estimated earned income.
Brazil gains three places in the rankings this year. This is the result of improvements in perceived wage equality for similar work (although Brazil is still ranked very low—124th—on this variable) and women’s estimated earned income (up from US$ 7,190 to US$ 7,865). The tenure of President Dilma Rousseff further boosts Brazil’s overall score. However, women’s labour force participation, at 64%, is still well below that of men (85%) and only 36% legislators, senior officials and managers’ positions are held by women. Women’s estimated earned income is a little under two-thirds that of men. While enrolment in pri-mary and secondary education for girls is high, it remains below that of boys. Finally, women hold only 9% of par-liamentary positions.
Brazil is followed by Mexico (89) and El Salvador (94). Mexico continues to climb the rankings, gaining two positions this year because of an improvement in the wage gap. Belize (100), Suriname (104) and Guatemala (112) occupy the last positions in the region. Belize shows a de-cline in the overall rankings, dropping from 93rd in 2010 to 100th place in 2011, as other countries narrow the gap faster. While Belize is notable for being one of the three countries in the region that have closed the gender gap in the educational attainment and health and survival subin-dexes, it is also the only country in Latin America and the Caribbean with no female parliamentarians. Suriname and Guatemala fall in the rankings by two and three places, respectively. Suriname holds the last rank of its region on the sex ratio at birth variable. Guatemala is the lowest-ranking country in the Latin America and Caribbean re-gion. It remains disadvantaged in the rankings because of a high gap in education, low political empowerment and low economic participation.
24 Measuring the Global Gender Gap Global Gender Gap Report 2011
The Middle East and North AfricaWith 59% of the gender gap closed, the Middle East and North Africa region occupies last place on overall average score compared with the other five regions. The Middle East and North Africa lags behind the other regions on the economic participation and opportunity and the po-litical empowerment subindexes. It is in 5th position on educational attainment (ahead of sub-Saharan Africa) and 4th position on health and survival (ahead of both sub-Saharan Africa and Asia and the Pacific).
The highest-ranking economies of the region have invested many resources in increasing women’s educa-tion levels—in Qatar, Kuwait, the United Arab Emirates, Tunisia, Algeria, Israel, Saudi Arabia, Lebanon and Jordan, the tertiary education enrolment rates of women are higher than those of men. However, these countries have had varying degrees of success at integrating women into the economy in order to reap the benefits of this investment.
Israel (55) continues to hold the top spot in the Middle East and North Africa region, favoured by a higher-than-average performance on the economic par-ticipation and opportunity subindex. However, Israel loses three places relative to its position last year. This is mainly the result of a widening perceived wage gap between women and men for similar work.
The United Arab Emirates (UAE) (103) continues to hold 1st position among the Arab countries and im-proves its performance relative to its own score of 2010. Kuwait (105), Tunisia (108) and Bahrain (110) follow in the rankings, supported by higher-than-average per-formances on education attainment and health and sur-vival. While Kuwait is the second-highest-ranking coun-try in the region, it is one of only 9 countries out of 135 that show a worsening gap in the literacy rate indicator. Tunisia falls one place in the rankings this year. In the absence of new political data, the political empowerment data have been repeated from last year in order to con-tinue to observe other changes in score. Bahrain’s ranking does not change despite a small overall gain in the score, as other countries move ahead faster.
Qatar (111), Mauritania (114), Jordan (117) and Lebanon (118) follow. Qatar’s strength lies in educa-tion, especially secondary and tertiary education, although reductions in wage gaps over the last year have boosted Qatar’s overall ranking by six places. Jordan gains three places, most notably through an increase the percentage of women in parliamentary positions (from 6% to 11%). Jordan’s key strength continues to lie in the area of edu-cation where primary, secondary and tertiary enrolment rates of girls are higher than those of boys. Lebanon loses two positions relative to last year, although it is the only country in the region to have achieved parity on the health and survival subindex.
The next places in the region are occupied by Algeria (121), Egypt (123) and Syria (124). Algeria slips
two spots relative to its performance last year. This is partly the result of a worsening perception of wage equal-ity between women and men for similar work. Egypt moves up two spots because of an improvement in pri-mary and secondary enrolment gaps and occupies 1st position on perceived wage equality for similar work. In the absence of new political data for Egypt, the political empowerment data have been repeated from last year in order to continue to observe other changes in score. Syria retains its position in the comparative rankings although it shows a small deterioration relative to its own perfor-mance last year.
Oman (127), Morocco (129), Saudi Arabia (131) and Yemen (135) remain the lowest-ranking Middle East and North African countries in the Index. Oman drops down, losing five places. This is partly the result of a wider gap in tertiary enrolment. Morocco and Saudi Arabia each slip two spots, although Saudi Arabia’s per-formance over the last six years puts it among the highest climbers of the 114 countries that have been included in the Report since 2006. Finally, Yemen continues to oc-cupy the last place in the region as well as in the overall rankings of 135 countries. While showing an absolute increase in the score, it remains the only country in the world to have closed less than 50% of its gender gap.
Asia and the PacificThe Asia and the Pacific region has closed just over 65% of the overall gender gap. The region ranks highest on political empowerment and lowest on health in com-parison with the other regional groupings. On education the region is in 4th place (behind North America, Latin America and the Caribbean and Europe and Central Asia) while on economic participation it is in 5th place (behind North America, Europe and Central Asia, Sub-Saharan Africa and Latin America and the Caribbean).
New Zealand (6) and the Philippines (8) lead the way in Asia and the Pacific and are the only two countries from the region to hold places in the top 10 of the global rankings. The Philippines gains one position since last year as a result of small gains in political empowerment and economic participation. Australia (23) follows next, continuing to hold a strong position in the rankings be-cause of high levels of education, economic participation and political empowerment.11 Sri Lanka (31) slips sev-eral places from its privileged position in the top 20 over the last five years. While it shows a higher-than-average performance in health and political empowerment, the gap between women and men’s estimated earned income widens and new data on tertiary education show a large gender gap among those enrolled in tertiary education.
The next places in the rankings are occupied by Mongolia (36), Singapore (57) and Thailand (60). While Singapore holds 16th position globally on the economic participation and opportunity subindex, there are persis-tent gaps in health, education and government. Thailand,
Global Gender Gap Report 2011 Measuring the Global Gender Gap 25

which this year elected its first female prime minister, loses some ground because of a stronger perceived wage gap, but the country remains well positioned, with women making up more than half of those enrolled in tertiary education and with a high overall labour force participa-tion rate for women.
China (61) maintains the same position as last year. While China remains the second-lowest-ranking country on the health and survival subindex (133)—the result of a disproportionate sex ratio at birth—although there have been minor improvements over the last year.12 While women’s labour force participation, at 74%, is high, men’s wages are growing faster than women’s wages. China is followed by Bangladesh (69), Brunei Darussalam (76) and Vietnam (79) in the region’s rankings.
Indonesia (90) takes the next spot. Although women and men in the country are enrolled in tertiary education in almost equal numbers, women still make up a fairly low percentage of the workforce, particularly in senior and highly skilled positions.
Malaysia (97) and Japan (98), Maldives (101), Cambodia (102), Korea, Rep. (107) and Fiji (109) are found in the lower half of the rankings within the region. Japan and Korea continue to be among the lowest-rank-ing OECD countries. Japan maintains a similar position to last year, although there are small losses in perceived wage gaps and estimated earned income. Women make up almost half of those receiving tertiary education but only about 9% of those occupying senior leadership positions, indicating an inefficient use of the female talent available in the country. Korea also loses some ground because of wage gaps, although this is partially offset by gains in health.
India (113), the Islamic Republic of Iran (125), Nepal (126) and Pakistan (133) occupy the last places in the regional rankings. India and Pakistan perform above average on the political empowerment of women, partic-ularly India, but they lag behind in the other three cat-egories. In particular, the persistent health, education and economic participation gaps will be detrimental to India’s growth; India is the lowest ranked of the BRIC econo-mies featured in the Index.13
Sub-Saharan AfricaThe sub-Saharan Africa region has closed 65% of its gen-der gap. The region performs well on the economic participation and opportunity subindex, ranking ahead of Latin America and the Caribbean, Asia and the Pacific and the Middle East and North Africa. Out of the top 15 per-formers on the labour force participation gender gap indi-cator, nine countries are from the region. However, poor enrolment rates and low levels of life expectancy continue to pose major challenges, with the region ranking towards the bottom on the health and survival and educational attainment subindexes. Out of the bottom five countries on the literacy rate indicator, four are from sub-Saharan
Africa. However, the region ranks ahead of Latin America and the Caribbean and the Middle East and North Africa on the political empowerment subindex.
Lesotho (9) continues to hold the top regional spot despite having lost one place, and is once again the only country from the region to have no gap in education or health. Lesotho is the second-best performer on the economic participation and opportunity subindex and among the highest climbers of the 114 countries that have been included in the Report since 2006. The next place in the region is occupied by South Africa (14), which is the only other sub-Saharan Africa country in the top 20. South Africa maintains the top spot in the region on political empowerment, especially on the percentage of women in parliament (45%). However, South Africa loses two places in the rankings this year as a result of a de-crease in the literacy rate ratio and tertiary enrolment.
South Africa is followed in the rankings by Burundi (24), which enters the Index for the first time this year. Burundi ranks 1st overall on labour force participation and is the only country among 135 where the female labour force participation rate (92%) is higher than that of men (88%). Mozambique (26) falls four places this year, primarily as a result of higher estimated earned in-come differentials. Uganda (29) and Namibia (32) fol-low next. In Uganda, which gains four places this year, women parliamentarians increase from 31% to 35%. Namibia slips in the rankings to 32nd position because of a worsening perception of wage equality between women and men for similar work and a decrease in the num-ber of women parliamentarians. Next in the rankings are Tanzania (59), Malawi (65), Botswana (66), Ghana (70), Madagascar (71) and Gambia (77). Tanzania gains seven places primarily because of an increase of women parlia-mentarians from 31% to 36%. Malawi gains three places and Botswana slips from the 62nd to the 66th position. However, Botswana is one of two African countries, in addition to Lesotho, that has achieved gender parity on education. Although Ghana’s ranking does not change, it shows an increase in its overall score. Madagascar gains nine spots in the rankings, primarily the result of gains in the education attainment subindex.
The next spots in the region are occupied by Angola (87), Zimbabwe (88), Senegal (92), Mauritius (95) and Kenya (99). Angola moves down in the rankings from 81st to 87th place, mainly because of lower wage equal-ity, but Angola’s performance over the last six years puts it among the highest climbers of the region after Lesotho. Zimbabwe’s gains are mainly driven by improvements in the wage equality and tertiary enrolment indicators. The country holds last place on the healthy life expectancy indicator. Senegal gains nine places relative to its rank in 2010. This is the result of significant improvement in the economic participation and opportunity and the politi-cal empowerment subindexes. Compared with last year,
26 Measuring the Global Gender Gap Global Gender Gap Report 2011

Mauritius shows no change in ranking, while Kenya falls three places.
Zambia (106), Burkina Faso (115), Ethiopia (116), Cameroon (119) and Nigeria (120) are all in the lower half of the rankings in the region. Ethiopia experiences an improvement in the overall rankings, rising from 121st place in 2010 to 116th in 2011. Ethiopia’s leap in the rankings is boosted by an increase in the number of women in parliament, which rose from 21% to 28%. However, the country holds the last position on the lit-eracy rate indicator. Cameroon and Nigeria both fall in the rankings—by five and two places, respectively. In the case of Cameroon, this is the result of a perceived decline in the wage equality for similar work and higher estimated earned income gaps. Nigeria’s drop can be attributed to a perceived decline in the wage equality as well as a de-crease in the percentage of women in parliament.
Nigeria is followed by Benin (128), Côte d’Ivoire (130), Mali (132) and Chad (134). Benin and Côte d’Ivoire remain in the same relative positions, although their overall scores improve marginally. Mali slips down one place compared with last year, although various in-dicators show improvement. Finally, Chad is the lowest-ranking country in the sub-Saharan Africa region, holding the last position on primary, secondary and tertiary enrol-ment indicators.
Gender gaps, economic performance and policy implicationsThe most important determinant of a country’s com-petitiveness is its human talent—the skills, education and productivity of its workforce—and women account for one-half of the potential talent base throughout the world. Closing gender gaps is thus a matter of human rights and equity; it is also one of efficiency. Figure 7 shows a plot of the Global Gender Gap Index 2011 scores against the Global Competitiveness Index 2011–2012 scores. Figure 8 plots the Global Gender Gap Index 2011 scores against GDP per capita. Figure 9 shows the relationship between the Global Gender Gap Index and the Human Development Index. The graphs confirm a correlation between gender equality and the level of competitiveness, GDP per capita and human development.
The correlation among competitiveness, income and development and gender gaps is evident despite the fact that the Global Gender Gap Index (unlike other gender indexes) explicitly eliminates any direct impact of the ab-solute levels of any of the variables (e.g., life expectancy, educational attainment, labour force participation) used in the Index. While correlation does not prove causality, it is consistent with the theory and mounting evidence that empowering women means a more efficient use of a na-tion’s human talent endowment and that reducing gender inequality enhances productivity and economic growth.
Over time, therefore, a nation’s competitiveness de-pends, among other things, on whether and how it edu-cates and utilizes its female talent. The data in the Global Gender Gap Index reveals four broad groups of countries: (1) countries that are generally closing health and educa-tion gaps and show high levels of women’s economic and political participation, (2) countries that are generally closing health and education gaps but show low levels of women’s economic and political participation, (3) coun-tries that have large health and education gaps as well as large gaps in women’s economic and political participation and (4) countries that have large health and education gaps but display small gaps in women’s economic and politi-cal participation. A basic illustration of these groupings is shown in Figure 10, which plots the educational attain-ment subindex against the economic participation and op-portunity subindex.
In the first broad group are countries that have made the investments in women’s health and education and generally see the returns on this investment in terms of women’s economic and political participation, such as the Nordics, the United States and the Philippines. These countries have not, however, fully closed economic and participation gaps—in particular, the gaps in senior posi-tions, wages and leadership levels still persist. According to recent research, the reduction in the male-female em-ployment gap has been an important driver of European economic growth in the last decade and closing this gap would have massive economic implications for developed economies, boosting US GDP by as much as 9% and euro zone GDP by as much as 13%.14 Innovation requires new, unique ideas—and the best ideas flourish in a diverse environment. There is evidence to show that companies benefit by successfully integrating the female half of the available talent pool across their internal leadership struc-tures,15 that women may have a propensity for making more inclusive, informed decisions and for engaging in less risky behaviour, and that gender-equal teams may be more successful. Additionally, in many countries women now account for more than half of the college and uni-versity graduates. As they begin to take up half of entry-level positions in several industries, as evident in the data from several OECD countries, it is a loss for companies if these highly skilled women are forced to choose between work and family at later stages of their career.16 Business leaders and policy-makers must therefore ensure that, in addition to removing barriers to women’s entry to the workforce, they put in place practices and policies that will provide equal opportunities for rising to positions of leadership within companies.
In the second broad group are countries that have made the key investments in women’s education and health but have generally not removed barriers to wom-en’s participation in the workforce and in decision-mak-ing, and are thus not seeing returns on their investments in the development of one half of their human capital.
Global Gender Gap Report 2011 Measuring the Global Gender Gap 27

Figure 7: Relationship between the Global Competitiveness Index 2011–2012 and the Global Gender Gap Index 2011
Source: Global Gender Gap Index 2011 and Global Competitiveness Index 2011–2012.Note: The Global Gender Gap Index and Global Competitiveness Index scales have been truncated to enhance readability.
0.40 0.50 0.60 0.70 0.80 0.90
2
3
4
5
6
Chad
Pakistan
Saudi Arabia
Egypt
Lesotho
China
United States
Norway
Sweden
IcelandSouth Africa
Philippines
Russian Federation
Japan
Mexico
Brazil
Yemen
Glo
bal C
ompe
titiv
enes
s In
dex
2011
–201
2 sc
ore
(1
–7 s
cale
)
Global Gender Gap Index 2011 score (0.00–1.00 scale)
Figure 8: Relationship between GDP per capita and the Global Gender Gap Index 2011 scores
Source: Global Gender Gap Index 2011 and the World Bank’s World dataBank: World Development Indicators & Global Development Finance, Online Database 2010, accessed June 2011.Note: The Global Gender Gap Index has been truncated to enhance readability.
0.40 0.45 0.50 0.55 0.60 0.65 0.70 0.75 0.80 0.85 0.90
0
10,000
30,000
50,000
70,000
90,000
Qatar
Norway
Iceland
United States
Japan
South AfricaPhilippines
Lesotho
Russian FederationMexico
Brazil
Luxembourg
ChinaIndia
Saudi Arabia
EgyptPakistan
Sweden
Yemen
Chad
GD
P pe
r cap
ita (c
onst
ant 2
005
inte
rnat
iona
l $)
Global Gender Gap Index 2011 score (0.00–1.00 scale)
28 Measuring the Global Gender Gap Global Gender Gap Report 2011

Figure 9: Relationship between the Human Development Index 2010 and the Global Gender Gap Index 2011
Source: Global Gender Gap Index 2011 and UNDP, International Human Development Indicators, Online Database 2010 (accessed October 2011).Note: Global Gender Gap Index and Human Development Index scales have been truncated to enhance readability.
0.40 0.50 0.60 0.70 0.80 0.90 1.00
0.2
0.4
0.6
0.8
1.0
Yemen
Pakistan
Norway
Mexico
Sweden
India
South Africa
United States
Egypt
Chad
Brazil
Lesotho
Iceland
Russian Federation
China
Saudi Arabia
Japan
Qatar
Philippines
Hum
an D
evel
opm
ent I
ndex
201
0 va
lues
Global Gender Gap Index 2011 score (0.00–1.00 scale)
Figure 10: Relationship between education and economic subindex scores
Source: Global Gender Gap Index 2011.
0.40 0.50 0.60 0.70 0.80 0.90 1.00 1.10
0.20
0.40
0.60
0.80
1.00
Chad
Benin Ethiopia Burkina FasoSenegal
Mozambique
Burundi
BahamasLesotho
NorwayUnited States
SwedenRussian Federation
PhilippinesIceland
South Africa
Brazil
China
Mali
Yemen
Pakistan India
Ghana
Japan
Brazil
Saudi Arabia
MexicoEgypt
Econ
omic
par
ticip
atio
n an
d op
port
unity
sub
inde
x sc
ores
(0.0
0–1.
00)
Educational attainment subindex scores (0.00–1.00 scale)
Global Gender Gap Report 2011 Measuring the Global Gender Gap 29
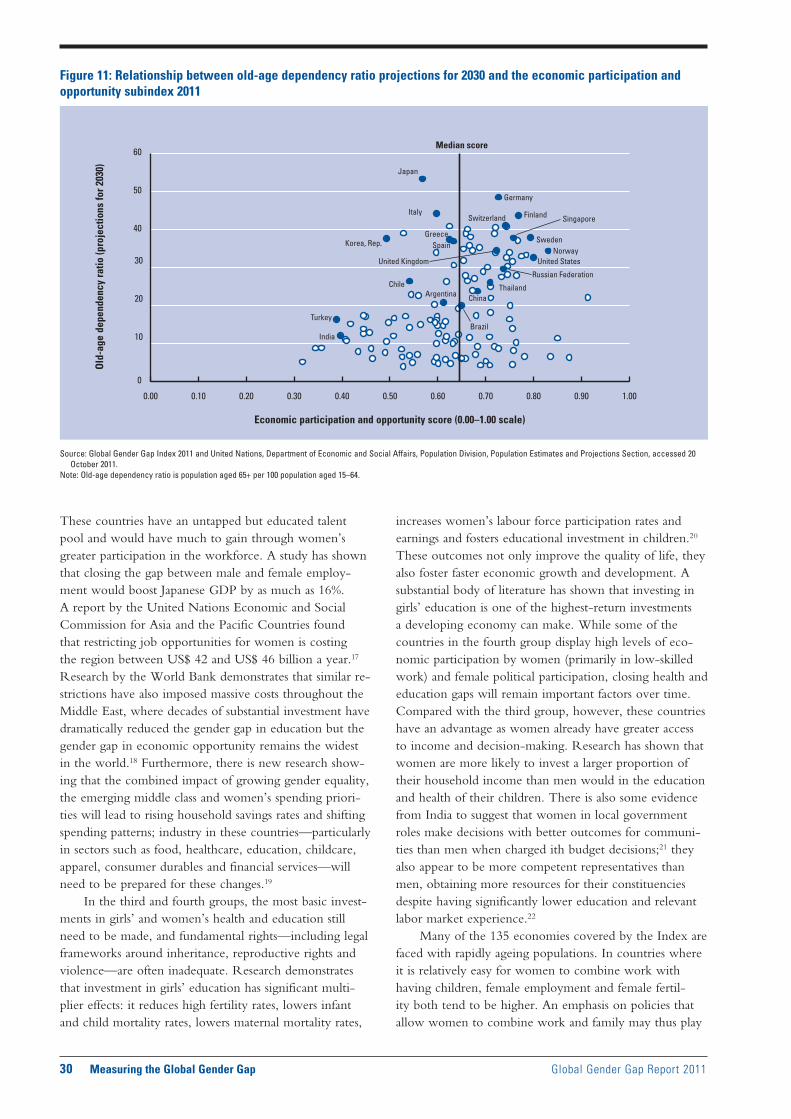
These countries have an untapped but educated talent pool and would have much to gain through women’s greater participation in the workforce. A study has shown that closing the gap between male and female employ-ment would boost Japanese GDP by as much as 16%. A report by the United Nations Economic and Social Commission for Asia and the Pacific Countries found that restricting job opportunities for women is costing the region between US$ 42 and US$ 46 billion a year.17 Research by the World Bank demonstrates that similar re-strictions have also imposed massive costs throughout the Middle East, where decades of substantial investment have dramatically reduced the gender gap in education but the gender gap in economic opportunity remains the widest in the world.18 Furthermore, there is new research show-ing that the combined impact of growing gender equality, the emerging middle class and women’s spending priori-ties will lead to rising household savings rates and shifting spending patterns; industry in these countries—particularly in sectors such as food, healthcare, education, childcare, apparel, consumer durables and financial services—will need to be prepared for these changes.19
In the third and fourth groups, the most basic invest-ments in girls’ and women’s health and education still need to be made, and fundamental rights—including legal frameworks around inheritance, reproductive rights and violence—are often inadequate. Research demonstrates that investment in girls’ education has significant multi-plier effects: it reduces high fertility rates, lowers infant and child mortality rates, lowers maternal mortality rates,
increases women’s labour force participation rates and earnings and fosters educational investment in children.20 These outcomes not only improve the quality of life, they also foster faster economic growth and development. A substantial body of literature has shown that investing in girls’ education is one of the highest-return investments a developing economy can make. While some of the countries in the fourth group display high levels of eco-nomic participation by women (primarily in low-skilled work) and female political participation, closing health and education gaps will remain important factors over time. Compared with the third group, however, these countries have an advantage as women already have greater access to income and decision-making. Research has shown that women are more likely to invest a larger proportion of their household income than men would in the education and health of their children. There is also some evidence from India to suggest that women in local government roles make decisions with better outcomes for communi-ties than men when charged ith budget decisions;21 they also appear to be more competent representatives than men, obtaining more resources for their constituencies despite having significantly lower education and relevant labor market experience.22
Many of the 135 economies covered by the Index are faced with rapidly ageing populations. In countries where it is relatively easy for women to combine work with having children, female employment and female fertil-ity both tend to be higher. An emphasis on policies that allow women to combine work and family may thus play
Figure 11: Relationship between old-age dependency ratio projections for 2030 and the economic participation and opportunity subindex 2011
Source: Global Gender Gap Index 2011 and United Nations, Department of Economic and Social Affairs, Population Division, Population Estimates and Projections Section, accessed 20 October 2011.
Note: Old-age dependency ratio is population aged 65+ per 100 population aged 15–64.
0.00 0.10 0.20 0.30 0.40 0.50 0.60 0.70 0.80 0.90 1.00
0
10
20
30
40
50
60
Japan
Italy
SpainGreece
Korea, Rep.
ChileArgentina
Brazil
ChinaThailand
Russian Federation
NorwaySweden
United Kingdom United States
SingaporeFinland
Germany
Switzerland
Turkey
India
Median score
Old
-age
dep
ende
ncy
ratio
(pro
ject
ions
for 2
030)
Economic participation and opportunity score (0.00–1.00 scale)
30 Measuring the Global Gender Gap Global Gender Gap Report 2011

a role beyond individual livelihoods and current prosperity by addressing the future problems posed by ageing popu-lations.23 Figure 11 plots the old-age dependency ratio projections for 2030 against the economic participation and opportunity subindex scores of 2011, revealing those countries among the set with high old-age dependency ratios that have low economic participation gaps and those that have high economic participation gaps.
The magnitude and particulars of gender gaps in countries around the world are the combined result of various socioeconomic and cultural variables, and the clos-ing or continuation of these gaps is intrinsically connected to the framework of national policies in place. New re-search is required to understand which policies are most effective in closing gender gaps and whether these are replicable and scalable. This year, we have provided sup-plementary information on policy variables in the Country Profiles. In addition, we have conducted a policies survey with ministries responsible for women in the 135 coun-tries covered in this Report. The preliminary results from almost 60 countries are presented in Appendix E.
Tracking the gender gap over timeThe Global Gender Gap Index was first published in 2006 with a view to creating a comprehensive gender par-ity index that is able to track gaps over time relative to an equality benchmark, thus providing information on a country’s progress relative to itself as well as to other countries.
Based on the six years of data available for the 114 countries that have been part of the Report since its in-ception, we find that the majority of countries covered have made progress on closing gender gaps. Figure A1 in Appendix A displays changes over time within the four subindexes. In 2006, 14% of the global political empower-ment gap had been closed; in 2011, over 18% of this gap has been closed. In 2006, 56% of the economic participa-tion gap had been closed; in 2011, almost 59% of this gap has been closed. In 2006, almost 92% of the educational attainment gap had been closed; in 2011, almost 93% of this gap has been closed. On health and survival, how-ever, there has been a small deterioration between 2006 and 2011, from 97% to 96%. Figure A2 displays changes over time on the Index score across different regions. All regions have shown improvements over the last six years except Europe and Central Asia.
Table A1 in Appendix A displays the full list of 114 countries covered between 2006 and 2011 ordered ac-cording to the percentage change in their score, relative to their score in 2006. Figure A3 displays these countries in a scatter plot divided into four quadrants: countries that were performing above the median score in 2006 and have shown progress between 2006 and 2011, countries that were performing above the median score in 2006 and have regressed between 2006 and 2011, those that were
performing below the median score in 2006 and have shown progress between 2006 and 2011 and those that were performing below the median score in 2006 and have regressed between 2006 and 2011. Overall, 85% of countries make progress between 2006 and 2011 while 15% either deteriorate or remain unchanged.
We were able to calculate the Global Gender Gap Index backwards to the year 2000 for a limited set of countries in order to take a longer-term look at trends. Table A2 in Appendix A displays the Global Gender Gap Index 2000–2011 for 39 countries where the relevant data were available. In all countries there was a net improve-ment in scores across the 10 years, with the exception of the Slovak Republic and Hungary. Switzerland, Finland, Belgium, Spain, Ireland and Costa Rica show the largest absolute increases in score, amounting to relative changes of more than 15% when compared with their perfor-mance in the year 2000.
In the Country Profiles readers can explore trends over the last six years on both the overall Index scores and ranks and the four subindex scores and ranks. It is impor-tant to note that there are gaps in international databases and not all countries have information available for all variables across all six years, nor are all data updated on an annual basis for each country by the international organi-zations that serve as our primary source of data.
ConclusionThe Global Gender Gap Report 2011 provides a compre-hensive overview of current performance and progress over the last six years. On average, over 96% of the gap in health outcomes, 93% of the gap in educational attain-ment, 59% of the gap in economic participation and 18% of the gap in political empowerment has been closed. No country in the world has achieved gender equality. The four highest-ranking countries—Iceland, Norway, Finland and Swede—have closed between 80 and 85% of their gender gaps, while the lowest ranking country—Yemen—has closed less than half of its gender gap.
The Global Gender Gap Index was developed in 2006 partially to address the need for a consistent and comprehensive measure for gender equality that can track a country’s progress over time. This edition of The Global Gender Gap Report reveals the trends observed in the data over the past six years and seeks to call attention to the need for more rapid progress in closing gender gaps. Out of the 114 countries covered in 2006–2011, 85% have im-proved their performance, while 15% have widening gaps. In some countries, progress is occurring in a relatively short time, regardless of whether they are starting out near the top or the bottom of the rankings and independent of their income. Countries such as Iceland, Switzerland, Lesotho, Saudi Arabia, Lesotho, United Arab Emirates and others have made much progress relative to their own situation in 2006. The same is true of those countries
Global Gender Gap Report 2011 Measuring the Global Gender Gap 31

that have lost ground over the last six years. While there have been minor losses in high-ranking countries such as Sweden, there have also been significant regressions in countries such as Mali, Nigeria and Morocco that were already at the lower end of the rankings.
The Index points to potential role models by reveal-ing those countries that—within their region or their income group—are leaders in having divided resources more equitably between women and men than other countries have, regardless of the overall level of resources available. In Europe, the Nordic countries are the best performers; in North America, the United States is now the leader. Cuba, Trinidad and Tobago, the Bahamas and Costa Rica are the top-ranking countries in Latin America and the Caribbean; Israel ranks the highest in the Middle East and North Africa; and in the Arab World, the United Arab Emirates is followed by Kuwait, Tunisia and Bahrain. In Asia and the Pacific, New Zealand, the Philippines, Australia and Sri Lanka are ranked high-est. Lesotho, South Africa and Burundi are the leaders in sub-Saharan Africa. Among income groups, the Nordic countries lead the way in the high-income group. In the upper-middle-income group, the leaders are South Africa and Latvia. The Philippines and Lesotho are the highest-ranking countries of the lower-middle-income group. Burundi and Mozambique are the strongest performers in the lower-income group. The detailed Country Profiles allow users to understand not only how close each coun-try lies relative to the equality benchmark in each of the four critical areas, but also provides a snapshot of the legal and social framework within which these outcomes are produced.
The Index continues to track the strong correlation between a country’s gender gap and its national competi-tiveness, income and development. A country’s competi-tiveness depends on its human talent—the skills, educa-tion and productivity of its workforce. Because women account for one-half of a country’s potential talent base, a nation’s competitiveness in the long term depends sig-nificantly on whether and how it educates and utilizes its women. Four broad groups of countries are evident in the Index: (1) countries that are generally closing health and education gaps and show high levels of women’s eco-nomic and political participation, (2) countries that are generally closing health and education gaps but show low levels of women’s economic and political participation, (3) countries that have large health and education gaps as well as large gaps in women’s economic and political participa-tion and (4) countries that have large health and educa-tion gaps but display small gaps in women’s economic and political participation.
This Report highlights the message to policy-makers that, in order to maximize competitiveness and develop-ment potential, each country should strive for gender equality—that is, should give women the same rights, responsibilities and opportunities as men. The Index does
not seek to set priorities for countries but rather to pro-vide a comprehensive set of data and a clear method for tracking gaps on critical indicators so that countries may set priorities within their own economic, political and cultural contexts. We are hopeful that the information contained in the Global Gender Gap Report series will also serve as a basis for further research that will facilitate a clearer understanding of the policies that are successful and those that are not, particularly as increasing numbers of policy-makers, employers and civil society seek out best practices and role models to incorporate gender equality into their practices and policies.
Notes 1 See Greig et al. “The Gender Gap Index 2006”.
2 This ratio is based on what is considered to be a “normal” sex ratio at birth: 1.06 males for every female born. See Klasen and Wink, “Missing Women: Revisiting the Debate”.
3 This ratio is based on the standards used in the UN’s Gender-Related Development Index, which uses 87.5 years as the maximum age for women and 82.5 years as the maximum age for men.
4 A first attempt to calculate the gender gap was made by the World Economic Forum in 2005; see Lopez-Claros and Zahidi, Women’s Empowerment: Measuring the Global Gender Gap. The 2005 Index, which was attempting to capture women’s empowerment, used a “feminist” scale that rewarded women’s supremacy over men (high-est score is assigned to the country with the biggest gap in favour of women).
5 The weights derived for the 2006 Index were used again this year and will be used in future years to allow for comparisons over time.
6 This is not strictly accurate in the case of the health variable, where the highest possible value a country can achieve is 0.9796. However, for purposes of simplicity we will refer to this value as 1 throughout the chapter and in all tables, figures and Country Profiles.
7 Because of the special equality benchmark value of 0.9796 for the health and survival subindex, it is not strictly accurate that the equal-ity benchmark for the overall index score is 1. This value is in fact (1 + 1 + 1 + 0.9796) / 4 = 0.9949. However, for purposes of simplicity, we will refer to the overall equality benchmark as 1 throughout this chapter.
8 Since the variables in the subindexes are weighted by the standard deviations, the final scores for the subindexes and the overall Index are not a pure measure of the gap vis-à-vis the equality benchmark and therefore cannot be strictly interpreted as percentage values measuring the closure of the gender gap. However, for ease of interpretation and intuitive appeal, we will be using the percentage concept as a rough interpretation of the final scores.
9 A population-weighted average of all scores within each region was taken to produce these charts.
10 Please note that we have modified our regional classifications from those used in previous editions of the Report.
11 Please note that these data do not take into account the recent elec-tion of Australia’s first female prime minister.
12 Sen, “Missing Women”, British Medical Journal and Klasen and Wink, “Missing Women: Revisiting the Debate”.
13 The BRIC countries are Brazil, the Russian Federation, India and China.
14 See Daly, “Gender Inequality, Growth and Global Ageing”.
15 Catalyst, “The Bottom Line”.
16 See Ibarra and Zahidi, The Corporate Gender Gap Report 2010.
17 ESCAP, Economic and Social Survey of Asia and the Pacific.
32 Measuring the Global Gender Gap Global Gender Gap Report 2011

18 See World Bank, “Gender and Development in the Middle East and North Africa.
19 Goldman Sachs Global Markets Institute, “The Power of the Purse”.
20 On the impact of female education on labour force participation and the educational attainment of the next generation, see Hausmann and Székely, “Inequality and the Family in Latin America”. On edu-cational investment in children, see Summers, “The Most Influential Investment”, 132.
21 See Beaman et al., “Powerful Women”.
22 Munshi and Rosensweig, “The Efficacy of Parochial Politics”.
23 Daly, “Gender Inequality, Growth and Global Ageing”.
ReferencesBartlett, L A, Mawji, S, Whitehead, S, Crouse, C, Dalil, S, Ionete, D,
Salama, P and the Afghan Mortality Study Team. Where Giving Birth is a Forecast of Death: Maternal Mortality in Four Districts of Afghanistan, 1999–2002. In The Lancet, 2005, 365 (9462): 864–870.
Beaman, L, Chattopadhyay, R, Duflo, E, Pande, R, and Topaloya, P. Powerful Women: Does Exposure Reduce Bias? http://econ-www.mit.edu/files/3122.
Catalyst. The Bottom Line: Connecting Corporate Performance and Gender Diversity. 2004. http://www.catalyst.org/publication/82/the-bottom-line-connecting-corporate-performance-and-gender-diversity.
Centre for Work Life Policy. http://www.worklifepolicy.org/.
CIA (Central Intelligence Agency). The CIA World Factbook, 2011.
Coale, A J. Excess Female Mortality and the Balance of the Sexes in the Population: An Estimate of the Number of Missing Females. In Population and Development Review, 1991, 17 (3): 517–523.
Daly, K. Gender Inequality, Growth and Global Ageing. Goldman Sachs Global Economics Paper No. 154, April 2007.
Dervarics, C. Closing the Gap in Male-Female Schooling. Population Reference Bureau, 2004. http://www.prb.org/Articles/2004/ClosingtheGapinMaleFemaleSchooling.aspx [accessed October 2009].
Duflo, E. Gender Equality in Development. BREAD Policy Paper No. 001, December 2005. http://econ-www.mit.edu/files/799.
ESCAP (Economic and Social Commission for Asia and the Pacific). Economic and Social Survey of Asia and the Pacific 2007: Surging Ahead in Uncertain Times. New York: United Nations, 2007.
Falkingham, J. The Impact of Maternal Health on Poverty. In id21 Health, id21 Research Highlight, 2 August 2007. http://www.id21.org/zinter/id21zinter.exe?a=0&i=InsightsHealth11art3&u=4ae36338.
Gertler, P, Martinez, S, Levine, D and Bretozzi, S. “Lost Presence and Presents: How Parental Death Affects Children“. Princeton University, 2004.
Goldman Sachs Global Markets Institute. The Power of the Purse: Gender Equality and Middle-Class Spending. 5 August 2009.
Greig, F, Hausmann, R, Tyson, L D and Zahidi, S. The Gender Gap Index 2006: A New Framework for Measuring Equality. In The Global Gender Gap Report 2006. Geneva: World Economic Forum, 2006.
Hausmann, R and Székely, M. Inequality and the Family in Latin America. In Population Matters: Demographic Change, Economic Growth, and Poverty in the Developing World, edited by N. Birdsall, A C Kelley, and S Sinding. New York: Oxford University Press, 2001.
Ibarra, H and Zahidi, S. The Corporate Gender Gap Report 2010. Geneva: World Economic Forum, 2010.
ILO (International Labour Organization), International programme on the elimination of child labour, World Day 2009. Give Girls a Chance: End Child Labour, 2009. Available at http://www.ilo.org/ipec/Campaignandadvocacy/WDACL/WorldDay2009/lang--en/index.htm [accessed October 2009].
———. LABORSTA Internet, online database, 2011.
Inter-Parliamentary Union. National Women in Parliaments, July 2011.
Jütting, J P, Morrisson, C Dayton-Johnson, J and Drechsler, D. Measuring Gender (In)equality: Introducing the Gender, Institutions and Development Data Base (GID). Working Paper No. 247. OECD Development Centre, March, 2006. http://www.oecd.org/datao-ecd/17/49/36228820.pdf.
Kilpatrick, S J, Crabtree, K E, Kemp, A and Geller, S. Preventability of Maternal Deaths: Comparison between Zambian and American Referral Hospitals. In Obstetrics & Gynecology, 2002, 100: 321–326.
Klasen, S and Wink, C. Missing Women: Revisiting the Debate. In Feminist Economics, 2003, 9 (2–3): 263–299.
Lopez-Claros, A and Zahidi, S. Women’s Empowerment: Measuring the Global Gender Gap. Geneva: World Economic Forum, 2005.
Mathers, C D, Iburg, K M Salomon, J A Tandon, A Chatterji, S Ustün, B and Murray, C J L. Global Patterns of Healthy Life Expectancy in the Year 2002. In BioMed Central Public Health, 2004, 4: 66. http://www.biomedcentral.com/1471-2458/4/66.
Matthews, Z. Improving the Health of Mothers and Babies. In id21 insights, health # 11, University of Sussex. http://www.id21.org/insights/insights-h11/art00.html/.
Munshi, K and Rosensweig, R. The Efficacy of Parochial Politics: Caste, Commitment, and Competence in Indian Local Governments. Center Discussion Paper No. 964. Economic Growth Center, Yale University, September 2008. http://www.econ.yale.edu/growth_pdf/cdp964.pdf.
Nardo, M, Saisana, M, Saltelli, A, Tarantola, and Hoffmann, A and Giovannini, E. Handbook on Constructing Composite Indicators: Methodology and User Guide, OECD Statistics Working Papers, 2005/3, OECD Publishing. doi:10.1787/533411815016.
Nike Foundation. The Girl Effect: Not Just about Girls: Engaging Men and Boys Is Key to Girls’ Ability to Achieve their Full Potential, 2009. http://www.nikefoundation.com/media_room.html [accessed October 2009].
PLAN. Girls in the Global Economy: Adding It All Up, 2009.
Sen, A. Development as Freedom. Oxford: Oxford University Press, 1999.
———. Missing Women. In British Medical Journal, 1992, 7 March, 304 (6827): 587–588.
Sen, G, George, A, and Ostlin, P (eds). Engendering International Health: The Challenge of Equity. Boston: MIT Press, 2002.
Summers, L. The Most Influential Investment. In Scientific American, 1992, August: 132.
Switlick, N, Geeta, K and Lule E. Acceleration Progress Towards Achieving the MDG to Improve Maternal Health: A Collection of Promising Approaches. April, 2005. Washington, DC: World Bank.
UNAIDS and WHO. AIDS Epidemic Update 2005. Joint Annual Report. December, 2005. Geneva: Joint United Nations Programme on HIV/AIDS (UNAIDS) and WHO. http://www.unaids.org/epi/2005/doc/report_pdf.asp.
UNDP (United Nations Development Programme). Human Development Report 2010.
———. Human Development Report 2006. Oxford: Oxford University Press, 2006.
———. Technical Note: Computing the Indices. In Human Development Report 2000. Oxford: Oxford University Press, 2000. http://hdr.undp.org/reports/global/2000/en/.
UNESCO (United Nations Educational, Scientific and Cultural Organization). Gender and Education for All: The Leap to Equality. Summary Report, 2003. Paris: UNESCO.
UNFPA (United Nations Population Fund). Safe Motherhood: Facts about Safe Motherhood, 2008. http://www.unfpa.org/mothers/facts.htm [accessed October 2009].
———. State of World Population 2004: Maternal Health. http://www.unfpa.org/swp/2004/english/ch7/page2.htm.
Global Gender Gap Report 2011 Measuring the Global Gender Gap 33
UNICEF (United Nations Children’s Fund). The State of the World’s Children 2009: Maternal and Newborn Health. New York: UNICEF, December 2008. http://www.unicef.org/sowc09/docs/SOWC09-FullReport-EN.pdf.
———. The State of the World’s Children 2004. http://www.unicef.org/sowc04/sowc04_girls_left_out.html [accessed October 2009].
United Nations, Department of Economic and Social Affairs, Population Division, Population Estimates and Projections Section. http:// esa.un.org/wpp/Excel-Data/population.htm.
United Nations Foundation. Why Invest in Adolescent Girls. http://www.unfoundation.org/global-issues/women-and-population/investing-adolescent-girls.html.
United Nations Secretariat, Population Division of the Department of Economic and Social Affairs. World Population Prospects: The 2008 Revision. http://esa.un.org/unpp/ [accessed October 2009].
Varkey, S, Gupta, S S. How Gender (In)Sensitive Are the Gender-Related Indices? In Bulletin of the World Health Organization, 2005, 83 (12): 954–956.
Wessel, H, Reitmaier, P, Dupret, A, Rocha, E, Cnattingius, S, Bergströmm, S. Deaths among Women of Reproductive Age in Cape Verde: Causes and Avoidability. In Acta Obstetricia et Gynecologica Scandinavica, 1999, 78 (3): 225–232; 2009: 2.
WHO (World Health Organization). World Health Report: Working Together for Health. April 2006, Geneva: WHO; p.xxiv in Merlin: All Mothers Matter. http://www.merlin.org.uk/images/libimages/1755.pdf [accessed October 2009].
———. The World Health Report 2007. 2007. Geneva: WHO.
———. Global Health Observatory database, data from 2007.
———. The World Health Report 2001, Statistical Annex: Explanatory Notes. 2001. Geneva: WHO.
World Bank. World dataBank: World Development Indicators & Global Development Finance, online database 2008, accessed July 2010.
———. Gender and Development in the Middle East and North Africa: Women in the Public Sphere. 2004. Washington, DC: World Bank.
———. Engendering Development through Gender Equality in Rights, Resources and Voice. World Bank Policy Research Report No. 21776. 2001. Washington, DC: World Bank.
———. Girl’s Education. Washington, DC: World Bank
http://web.worldbank.org/WBSITE/EXTERNAL/TOPICS/EXTEDUCATION/0,,contentMDK:20298916~menuPK:617572~pagePK:148956~piPK:216618~theSitePK:282386,00.html [accessed October 2009].
World Economic Forum. The Global Competitiveness Report 2010–2011. 2010. Geneva: World Economic Forum.
34 Measuring the Global Gender Gap Global Gender Gap Report 2011

Global Gender Gap Report 2011 Measuring the Global Gender Gap 35
Appendix A: Tracking the Gender Gap over Time
The six-year dataset for the Global Gender Gap Index indicates progress across all subindexes (Figure A1) ex-cept Health and Survival and across regions (Figure A2)
except Europe and Central Asia. Table A1 shows the biggest gainers and losers out of the 114 countries cov-ered in the Report between 2006 and 2011.
Figure A1: Global Gender Gap Index by subindex, 2006–2011
Source: Global Gender Gap Indexes, 2006–2011; scores are weighted by population. Population data are from the World Bank’s World Development Indicators & Global Development Finance, Online Database 2010, accessed July 2011.
0.00
0.20
0.40
0.60
0.80
1.00
Health and survival Educational attainment
Economic participation and opportunity
Political empowerment
Subi
ndex
sco
re (0
.00–
1.00
)
Figure A2: Global Gender Gap Index by region, 2006–2011
Source: Global Gender Gap Indexes, 2006-2011; scores are weighted by population; Population data are from the World Bank’s World Development Indicators & Global Development Finance, Online Database 2010, accessed July 2011. Details of regional classifications in Appendix B.
0.00
0.20
0.40
0.60
0.80
1.00
Europe and Central Asia
North AmericaLatin America and the Caribbean
Asia and the Pacific
Sub-Saharan AfricaMiddle East and North Africa
Glo
bal G
ende
r Gap
Inde
x sc
ore
(0.0
0–1.
00)
2006n 2007n 2008
n 2009n 2010n 2011
2006n 2007n 2008
n 2009n 2010n 2011
36 Measuring the Global Gender Gap Global Gender Gap Report 2011
Table A1: Change in score (2006–2011) as a percentage of 2006
Change in Percent change score relative to Country 2006 score 2011 score (2006–2011) 2006 score
Lesotho 0.6807 0.7666 0.0859 12.6Nicaragua 0.6566 0.7245 0.0679 10.3Saudi Arabia 0.5242 0.5753 0.0511 9.7Angola 0.6039 0.6624 0.0585 9.7Ecuador 0.6433 0.7035 0.0602 9.4Iceland 0.7813 0.8530 0.0717 9.2United Arab Emirates 0.5919 0.6454 0.0535 9.0Switzerland 0.6997 0.7627 0.0630 9.0Chile 0.6455 0.7030 0.0576 8.9Bangladesh 0.6270 0.6812 0.0542 8.6Trinidad and Tobago 0.6797 0.7372 0.0575 8.5Bolivia 0.6335 0.6862 0.0527 8.3Luxembourg 0.6671 0.7216 0.0545 8.2France 0.6520 0.7018 0.0498 7.6Nepal 0.5478 0.5888 0.0410 7.5Honduras 0.6483 0.6945 0.0462 7.1Ireland 0.7335 0.7830 0.0495 6.8Madagascar 0.6385 0.6797 0.0412 6.5Malawi 0.6437 0.6850 0.0413 6.4Belgium 0.7078 0.7531 0.0453 6.4Uganda 0.6797 0.7220 0.0423 6.2Yemen 0.4595 0.4873 0.0278 6.0Argentina 0.6829 0.7236 0.0407 6.0Greece 0.6540 0.6916 0.0376 5.7Bahrain 0.5894 0.6232 0.0338 5.7Mauritania 0.5835 0.6164 0.0329 5.6Singapore 0.6550 0.6914 0.0365 5.6Uruguay 0.6549 0.6907 0.0358 5.5Finland 0.7958 0.8383 0.0425 5.3Italy 0.6456 0.6796 0.0340 5.3United States 0.7042 0.7412 0.0371 5.3Norway 0.7994 0.8404 0.0410 5.1Burkina Faso 0.5854 0.6153 0.0299 5.1South Africa 0.7125 0.7478 0.0353 5.0Gambia, The 0.6448 0.6763 0.0315 4.9Costa Rica 0.6936 0.7266 0.0330 4.8Mongolia 0.6821 0.7140 0.0319 4.7China 0.6561 0.6866 0.0305 4.7Namibia 0.6864 0.7177 0.0312 4.6Slovenia 0.6745 0.7041 0.0296 4.4Kyrgyz Republic 0.6742 0.7036 0.0295 4.4Latvia 0.7091 0.7399 0.0308 4.3Denmark 0.7462 0.7778 0.0315 4.2New Zealand 0.7509 0.7810 0.0301 4.0Paraguay 0.6556 0.6818 0.0262 4.0Russian Federation 0.6770 0.7037 0.0266 3.9Spain 0.7319 0.7580 0.0261 3.6Cameroon 0.5865 0.6073 0.0207 3.5Poland 0.6802 0.7038 0.0236 3.5Canada 0.7165 0.7407 0.0242 3.4Portugal 0.6922 0.7144 0.0223 3.2Mauritius 0.6328 0.6529 0.0202 3.2Ethiopia 0.5946 0.6136 0.0189 3.2Netherlands 0.7250 0.7470 0.0220 3.0India 0.6011 0.6190 0.0179 3.0Venezuela 0.6664 0.6861 0.0197 3.0Pakistan 0.5434 0.5583 0.0149 2.7
Change in Percent change score relative to Country 2006 score 2011 score (2006–2011) 2006 score
Cambodia 0.6291 0.6464 0.0173 2.7Peru 0.6619 0.6796 0.0177 2.7Guatemala 0.6067 0.6229 0.0162 2.7Austria 0.6986 0.7165 0.0179 2.6Egypt 0.5786 0.5933 0.0148 2.6Ghana 0.6653 0.6811 0.0158 2.4Zimbabwe 0.6461 0.6607 0.0147 2.3Philippines 0.7516 0.7685 0.0170 2.3Mexico 0.6462 0.6604 0.0142 2.2Malta 0.6518 0.6658 0.0140 2.2Cyprus 0.6430 0.6567 0.0137 2.1Albania 0.6607 0.6748 0.0140 2.1Brazil 0.6543 0.6679 0.0136 2.1Korea, Rep. 0.6157 0.6281 0.0124 2.0Australia 0.7163 0.7291 0.0128 1.8Turkey 0.5850 0.5954 0.0104 1.8Bulgaria 0.6870 0.6987 0.0118 1.7Chad 0.5247 0.5334 0.0087 1.7Iran, Islamic Rep. 0.5803 0.5894 0.0091 1.6Panama 0.6935 0.7042 0.0107 1.5United Kingdom 0.7365 0.7462 0.0098 1.3Kazakhstan 0.6928 0.7010 0.0082 1.2Czech Republic 0.6712 0.6789 0.0078 1.2Japan 0.6447 0.6514 0.0067 1.0Ukraine 0.6797 0.6861 0.0064 0.9Benin 0.5780 0.5832 0.0052 0.9Thailand 0.6831 0.6892 0.0061 0.9Germany 0.7524 0.7590 0.0066 0.9Indonesia 0.6541 0.6594 0.0053 0.8Lithuania 0.7077 0.7131 0.0054 0.8Dominican Republic 0.6639 0.6682 0.0043 0.6Slovak Republic 0.6757 0.6797 0.0041 0.6Estonia 0.6944 0.6983 0.0039 0.6Israel 0.6889 0.6926 0.0037 0.5Malaysia 0.6509 0.6525 0.0016 0.2Romania 0.6797 0.6812 0.0015 0.2Jamaica 0.7014 0.7028 0.0014 0.2Sri Lanka 0.7199 0.7212 0.0013 0.2Jordan 0.6109 0.6117 0.0008 0.1Kenya 0.6486 0.6493 0.0007 0.1Macedonia, FYR 0.6983 0.6966 –0.0016 –0.2Kuwait 0.6341 0.6322 –0.0019 –0.3Morocco 0.5827 0.5804 –0.0023 –0.4Algeria 0.6018 0.5991 –0.0027 –0.4Tunisia 0.6288 0.6255 –0.0033 –0.5Moldova 0.7128 0.7083 –0.0045 –0.6Hungary 0.6698 0.6642 –0.0056 –0.8Botswana 0.6897 0.6832 –0.0065 –0.9Zambia 0.6360 0.6300 –0.0060 –0.9Sweden 0.8133 0.8044 –0.0089 –1.1Georgia 0.6700 0.6624 –0.0076 –1.1Nigeria 0.6104 0.6011 –0.0093 –1.5Tanzania 0.7038 0.6904 –0.0134 –1.9Croatia 0.7145 0.7006 –0.0139 –1.9El Salvador 0.6837 0.6567 –0.0270 –3.9Mali 0.5996 0.5752 –0.0244 –4.1Colombia 0.7049 0.6714 –0.0335 –4.8
Note: This table contains only those 114 countries that were covered consistently between 2006 and 2011.
Appendix A: Tracking the Gender Gap over Time (cont’d.)

Global Gender Gap Report 2011 Measuring the Global Gender Gap 37
Appendix A: Tracking the Gender Gap over Time (cont’d.)
Figure A3 plots the percentage change in score, relative to the actual score in 2006 for the same set of countries. The median score is 0.665. Finally, Table A2 presents the historical calculation made for the Index between 2000 and 2005, along with calculations from the published
Index in recent years, for 39 countries for which we were able to find complete data as far back as the year 2000. For a more detailed analysis by subindex and the calculation method, please refer to the Global Gender Gap Index 2007.
Figure A3: Percentage change relative to the Global Gender Gap Index 2006 score
0.10 0.20 0.30 0.40 0.50 0.60 0.70 0.80 0.90
–5
0
5
10
15
Lesotho
Brazil
MaliEl Salvador
Sweden
Colombia
Chad
Pakistan
Egypt
India
Yemen
Saudi Arabia
United StatesSouth Africa
United Arab Emirates
Iceland
Japan
Mexico
Philippines
China
Russian Federation
Norway
Median score
Countries below median score and improving
Countries above median score and regressing
Countries below median score and regressing
Countries above median score and improving
Perc
enta
ge c
hang
e in
sco
re
betw
een
2006
and
201
1 (%
)
Global Gender Gap Index 2006 score (0.00–1.00)
Source: Global Gender Gap Indexes 2006 and 2011.
38 Measuring the Global Gender Gap Global Gender Gap Report 2011
Appendix A: Tracking the Gender Gap over Time (cont’d.)
Table A2: Overview of historical data scores, 2000–2011 (selected countries)
GGG GGG GGG GGG GGG GGG GGG GGG GGG GGG GGG GGG Difference Index Index Index Index Index Index Index Index Index Index Index Index (2011 score– Country 2000 2001 2002 2003 2004 2005 2006 2007 2008 2009 2010 2011 2000 score)
Switzerland 0.6356 0.6398 0.6647 0.6717 0.6785 0.7016 0.6997 0.6924 0.7360 0.7426 0.7562 0.7627 0.1271
Finland 0.7240 0.7246 0.7672 0.7699 0.7731 0.7754 0.7958 0.8044 0.8195 0.8252 0.8260 0.8383 0.1143
Belgium 0.6414 0.6432 0.6646 0.6719 0.6838 0.6862 0.7078 0.7198 0.7163 0.7165 0.7509 0.7531 0.1117
Spain 0.6518 0.6544 0.6575 0.6672 0.6734 0.6727 0.7319 0.7444 0.7281 0.7345 0.7554 0.7580 0.1062
Ireland 0.6798 0.6850 0.6918 0.6888 0.7031 0.7105 0.7335 0.7457 0.7518 0.7597 0.7773 0.7830 0.1032
Costa Rica 0.6246 0.6282 0.6589 0.6497 0.6705 0.6868 0.6936 0.7014 0.7111 0.7180 0.7194 0.7266 0.1020
Iceland 0.7632 0.7633 0.7871 0.7890 0.7870 0.7903 0.7813 0.7836 0.7999 0.8276 0.8496 0.8530 0.0898
Chile 0.6180 0.6233 0.6451 0.6443 0.6452 0.6448 0.6455 0.6482 0.6818 0.6884 0.7013 0.7030 0.0850
Bangladesh 0.5963 0.6082 0.6133 0.6096 0.6203 0.6183 0.6270 0.6314 0.6531 0.6526 0.6702 0.6812 0.0849
Norway 0.7581 0.7596 0.7728 0.7763 0.7859 0.7842 0.7994 0.8059 0.8239 0.8227 0.8404 0.8404 0.0823
Trinidad and Tobago 0.6600 0.6598 0.6644 0.6633 0.6726 0.6740 0.6797 0.6859 0.7245 0.7298 0.7353 0.7372 0.0772
Denmark 0.7007 0.7114 0.7609 0.7616 0.7666 0.7709 0.7462 0.7519 0.7538 0.7628 0.7719 0.7778 0.0771
Netherlands 0.6737 0.6862 0.7045 0.7074 0.7093 0.7167 0.7250 0.7383 0.7399 0.7490 0.7444 0.7470 0.0733
Greece 0.6212 0.6234 0.6274 0.6315 0.6400 0.6449 0.6540 0.6648 0.6727 0.6662 0.6908 0.6916 0.0704
Italy 0.6147 0.6160 0.6262 0.6279 0.6398 0.6391 0.6456 0.6498 0.6788 0.6798 0.6765 0.6796 0.0649
Panama 0.6402 0.6412 0.6570 0.6636 0.6784 0.6793 0.6935 0.6954 0.7095 0.7024 0.7072 0.7042 0.0640
Korea, Rep. 0.5645 0.5637 0.5773 0.6019 0.5916 0.5898 0.6157 0.6409 0.6154 0.6146 0.6342 0.6281 0.0636
Sweden 0.7424 0.7505 0.7933 0.7982 0.7891 0.8031 0.8133 0.8146 0.8139 0.8139 0.8024 0.8044 0.0620
Turkey 0.5350 0.5456 0.5472 0.5447 0.5808 0.5711 0.5850 0.5768 0.5853 0.5828 0.5876 0.5954 0.0604
New Zealand 0.7213 0.7246 0.7651 0.7890 0.7614 0.7715 0.7509 0.7649 0.7859 0.7880 0.7808 0.7810 0.0597
Australia 0.6737 0.6823 0.6942 0.7078 0.7137 0.7125 0.7163 0.7204 0.7241 0.7282 0.7271 0.7291 0.0554
Latvia 0.6853 0.6976 0.6983 0.6984 0.6996 0.6986 0.7091 0.7333 0.7397 0.7416 0.7429 0.7399 0.0546
Portugal 0.6609 0.6619 0.6721 0.6659 0.6726 0.6763 0.6922 0.6959 0.7051 0.7013 0.7171 0.7144 0.0535
Canada 0.6882 0.6887 0.7070 0.7062 0.7112 0.7128 0.7165 0.7198 0.7136 0.7196 0.7372 0.7407 0.0525
Japan 0.6005 0.6007 0.6047 0.6097 0.6224 0.6280 0.6447 0.6455 0.6434 0.6447 0.6524 0.6514 0.0509
Mexico 0.6123 0.6172 0.6235 0.6212 0.6310 0.6309 0.6462 0.6441 0.6441 0.6503 0.6577 0.6604 0.0481
Croatia 0.6660 0.6666 0.6724 0.6884 0.6980 0.6882 0.7145 0.7210 0.6967 0.6944 0.6939 0.7006 0.0346
Malaysia 0.6184 0.6171 0.6219 0.6252 0.6131 0.6401 0.6509 0.6444 0.6442 0.6467 0.6479 0.6525 0.0341
Slovenia 0.6701 0.6751 0.6799 0.6783 0.6796 0.6771 0.6745 0.6842 0.6937 0.6982 0.7047 0.7041 0.0340
Israel 0.6657 0.6668 0.6708 0.6715 0.6758 0.6713 0.6889 0.6965 0.6900 0.7019 0.6957 0.6926 0.0269
Poland 0.6784 0.6778 0.6870 0.6883 0.6841 0.6787 0.6802 0.6756 0.6951 0.6998 0.7037 0.7038 0.0254
United Kingdom 0.7222 0.7224 0.7371 0.7614 0.7362 0.7402 0.7365 0.7441 0.7366 0.7402 0.7460 0.7462 0.0240
El Salvador 0.6336 0.6341 0.6382 0.6315 0.6409 0.6387 0.6837 0.6853 0.6875 0.6939 0.6596 0.6567 0.0231
Romania 0.6616 0.6617 0.6751 0.6833 0.6818 0.6821 0.6797 0.6859 0.6763 0.6805 0.6826 0.6812 0.0196
Lithuania 0.6984 0.7018 0.7131 0.7111 0.6927 0.6973 0.7077 0.7234 0.7222 0.7175 0.7132 0.7131 0.0147
Czech Republic 0.6670 0.6663 0.6670 0.7037 0.6586 0.6649 0.6712 0.6718 0.6770 0.6789 0.6850 0.6789 0.0119
Colombia 0.6656 0.6700 0.7215 0.7236 0.7184 0.7181 0.7049 0.7090 0.6944 0.6939 0.6927 0.6714 0.0058
Slovak Republic 0.6845 0.6822 0.6850 0.6860 0.6791 0.6855 0.6757 0.6797 0.6824 0.6845 0.6778 0.6797 –0.0048
Hungary 0.6697 0.6644 0.6982 0.6993 0.6878 0.6869 0.6698 0.6731 0.6867 0.6879 0.6720 0.6642 –0.0055
Notes: Countries are ordered by score difference, in descending order. GGG Index = Global Gender Gap Index.
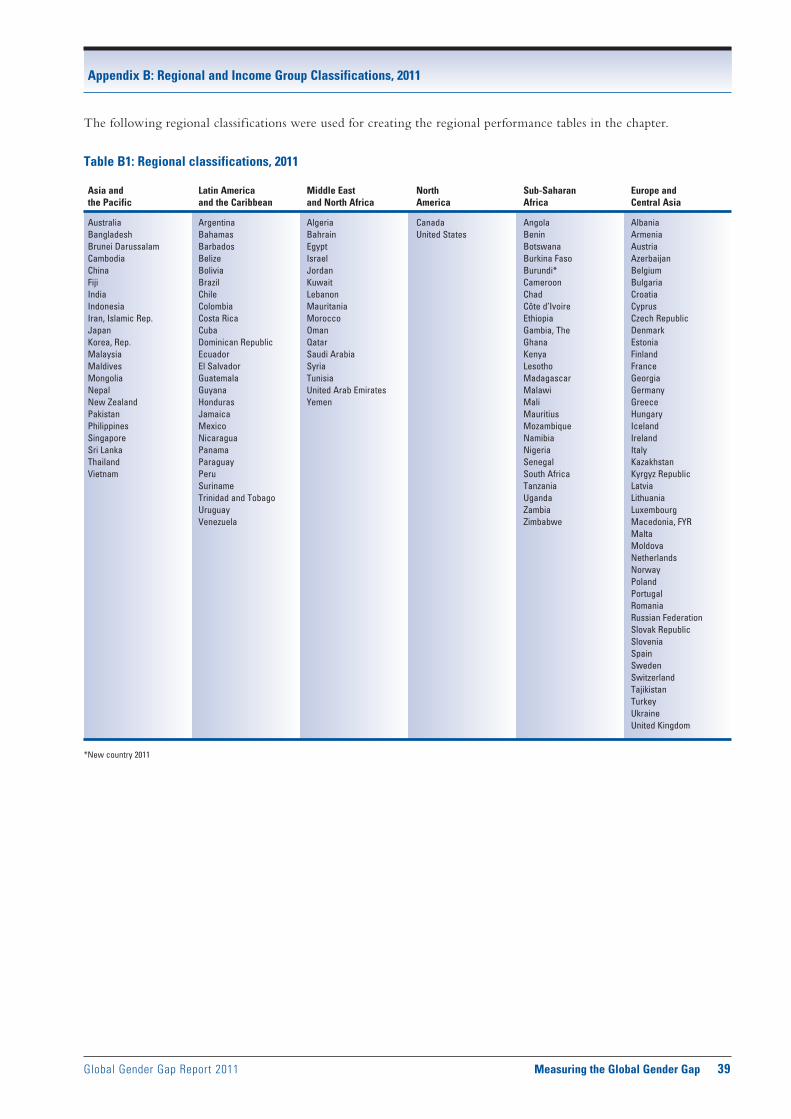
Global Gender Gap Report 2011 Measuring the Global Gender Gap 39
Appendix B: Regional and Income Group Classifications, 2011
Table B1: Regional classifications, 2011
Asia and Latin America Middle East North Sub-Saharan Europe and the Pacific and the Caribbean and North Africa America Africa Central Asia
Australia Argentina Algeria Canada Angola AlbaniaBangladesh Bahamas Bahrain United States Benin ArmeniaBrunei Darussalam Barbados Egypt Botswana AustriaCambodia Belize Israel Burkina Faso AzerbaijanChina Bolivia Jordan Burundi* BelgiumFiji Brazil Kuwait Cameroon BulgariaIndia Chile Lebanon Chad CroatiaIndonesia Colombia Mauritania Côte d’Ivoire CyprusIran, Islamic Rep. Costa Rica Morocco Ethiopia Czech RepublicJapan Cuba Oman Gambia, The DenmarkKorea, Rep. Dominican Republic Qatar Ghana EstoniaMalaysia Ecuador Saudi Arabia Kenya FinlandMaldives El Salvador Syria Lesotho FranceMongolia Guatemala Tunisia Madagascar GeorgiaNepal Guyana United Arab Emirates Malawi GermanyNew Zealand Honduras Yemen Mali GreecePakistan Jamaica Mauritius HungaryPhilippines Mexico Mozambique IcelandSingapore Nicaragua Namibia IrelandSri Lanka Panama Nigeria ItalyThailand Paraguay Senegal KazakhstanVietnam Peru South Africa Kyrgyz Republic Suriname Tanzania Latvia Trinidad and Tobago Uganda Lithuania Uruguay Zambia Luxembourg Venezuela Zimbabwe Macedonia, FYR Malta Moldova Netherlands Norway Poland Portugal Romania Russian Federation Slovak Republic Slovenia Spain Sweden Switzerland Tajikistan Turkey Ukraine United Kingdom
*New country 2011
The following regional classifications were used for creating the regional performance tables in the chapter.

40 Measuring the Global Gender Gap Global Gender Gap Report 2011
Table B2: Income classifications, 2011
Low Income Lower-Middle Income Upper-Middle Income High Income (US$1,005 or Less) (US$1,006–3,975) (US$3,976–12,275) (US$12,276 or more)
Bangladesh Albania Algeria AustraliaBenin Angola Argentina AustriaBurkina Faso Belize Armenia BahamasBurundi* Bolivia Azerbaijan BahrainCambodia Cameroon Botswana BarbadosChad Cote d’Ivoire Brazil BelgiumEthiopia Egypt Bulgaria Brunei DarussalamGambia, The El Salvador Chile CanadaKenya Fiji China CroatiaKyrgyz Republic Georgia Colombia CyprusMadagascar Ghana Costa Rica Czech RepublicMalawi Guatemala Cuba DenmarkMali Guyana Dominican Republic EstoniaMozambique Honduras Ecuador FinlandNepal India Iran, Islamic Rep. FranceTajikistan Indonesia Jamaica GermanyTanzania Lesotho Jordan GreeceUganda Mauritania Kazakhstan HungaryZimbabwe Moldova Latvia Iceland Mongolia Lebanon Ireland Morocco Lithuania Israel Nicaragua Macedonia, FYR Italy Nigeria Malaysia Japan Pakistan Maldives Korea, Rep. Paraguay Mauritius Kuwait Philippines Mexico Luxembourg Senegal Namibia Malta Sri Lanka Panama Netherlands Syria Peru New Zealand Ukraine Romania Norway Vietnam Russian Federation Oman Yemen South Africa Poland Zambia Suriname Portugal Thailand Qatar Tunisia Saudi Arabia Turkey Singapore Uruguay Slovak Republic Venezuela Slovenia Spain Sweden Switzerland Trinidad and Tobago United Arab Emirates United Kingdom United States
Note: Income classifications are taken from the World Bank’s World Development indicators, which classifies economies into four income categories based on GNI per capita (current US$): high income, upper-middle income, lower-middle income, and low income.
* New country 2011
Appendix B: Regional and Income Group Classifications, 2011 (cont’d.)

Global Gender Gap Report 2011 Measuring the Global Gender Gap 41
Appendix C: Spread of Minimum and Maximum Values by Indicator, 2011
The chart below shows the spread of the minimum and maximum values for each of the 14 variables of the Global Gender Gap Index. Each indicator is presented with its own scale of the minimum possible value and maximum possible value. For wage equality for similar work, this is a scale of 1 (worst value for women) to 7 (best value for women). For estimated earned income, the maximum value is 40,000 US dollars; this is the benchmark used in the calculation of the Index. For sex ratio at birth (female/male), the maximum value is a ratio of 0.944; this is the benchmark used in the cal-culation of the Index. For healthy life expectancy, the
maximum value listed is that of the country with the best performance on this indicator ( Japan; 78 years); this is not the benchmark used in the calculation of the Index. For years as head of state, the minimum value is 0 years and the maximum value is 50 years. All other variables are expressed as percentages with a minimum value of 0% and a maximum value of 100%.
Male values are represented with black bars and fe-male values with blue bars. In the case of variables with a value that represents a combined measure of the male and female situations (wage equality for similar work and sex ratio at birth), a grey bar is used.
Labo
ur fo
rce
parti
cipa
tion
Wag
e eq
ualit
y fo
r sim
ilar w
ork
Estim
ated
ear
ned
inco
me
Legi
slat
ors,
sen
ior o
ffici
als,
and
man
ager
s
Prof
essi
onal
and
tech
nica
l wor
kers
Lite
racy
rate
Enro
lmen
t in
prim
ary
educ
atio
n
Enro
lmen
t in
seco
ndar
y ed
ucat
ion
Enro
lmen
t in
terti
ary
educ
atio
n
Sex
ratio
at b
irth
(f/m
)
Heal
thy
life
expe
ctan
cy
Wom
en in
par
liam
ent
Wom
en in
min
iste
rial p
ositi
ons
Year
s w
ith fe
mal
e he
ad o
f sta
te
100100780.99410010010010010010040,0007100 50
0000000000010 0
Figure C1: Female and male ranges for Global Gender Gap Index 2011 indicators
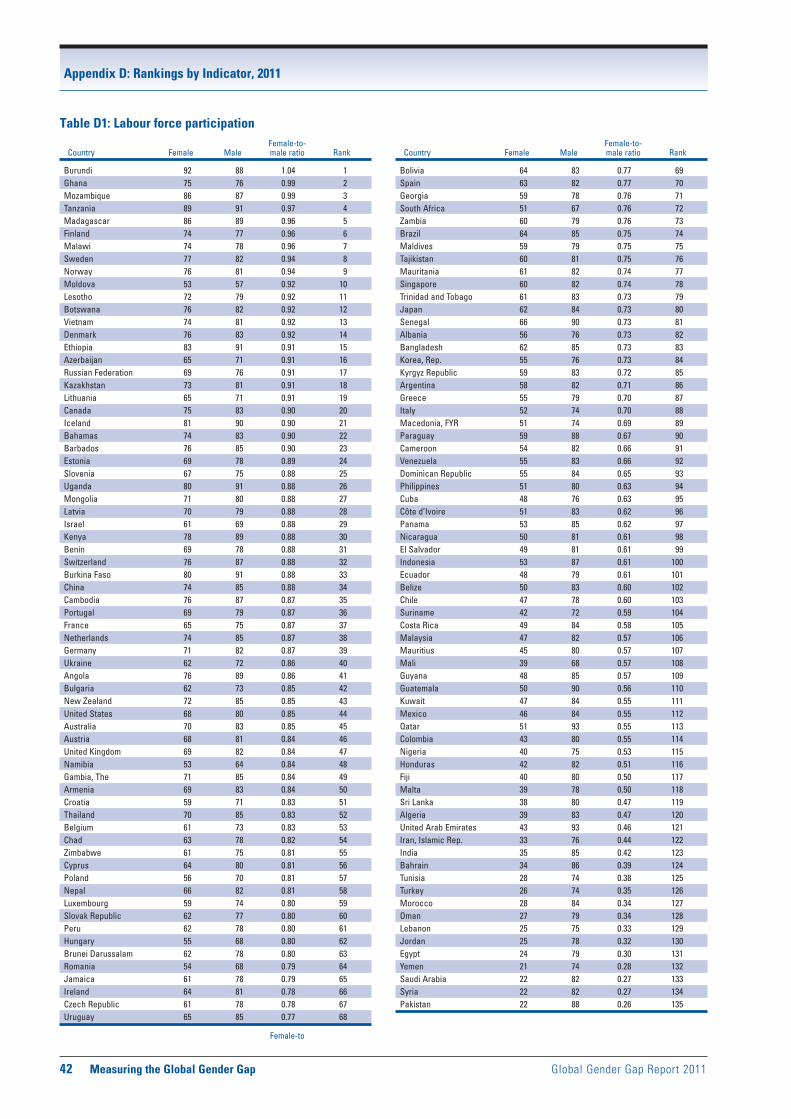
42 Measuring the Global Gender Gap Global Gender Gap Report 2011
Appendix D: Rankings by Indicator, 2011
Table D1: Labour force participation Female-to- Country Female Male male ratio Rank
Burundi 92 88 1.04 1Ghana 75 76 0.99 2Mozambique 86 87 0.99 3Tanzania 89 91 0.97 4Madagascar 86 89 0.96 5Finland 74 77 0.96 6Malawi 74 78 0.96 7Sweden 77 82 0.94 8Norway 76 81 0.94 9Moldova 53 57 0.92 10Lesotho 72 79 0.92 11Botswana 76 82 0.92 12Vietnam 74 81 0.92 13Denmark 76 83 0.92 14Ethiopia 83 91 0.91 15Azerbaijan 65 71 0.91 16Russian Federation 69 76 0.91 17Kazakhstan 73 81 0.91 18Lithuania 65 71 0.91 19Canada 75 83 0.90 20Iceland 81 90 0.90 21Bahamas 74 83 0.90 22Barbados 76 85 0.90 23Estonia 69 78 0.89 24Slovenia 67 75 0.88 25Uganda 80 91 0.88 26Mongolia 71 80 0.88 27Latvia 70 79 0.88 28Israel 61 69 0.88 29Kenya 78 89 0.88 30Benin 69 78 0.88 31Switzerland 76 87 0.88 32Burkina Faso 80 91 0.88 33China 74 85 0.88 34Cambodia 76 87 0.87 35Portugal 69 79 0.87 36France 65 75 0.87 37Netherlands 74 85 0.87 38Germany 71 82 0.87 39Ukraine 62 72 0.86 40Angola 76 89 0.86 41Bulgaria 62 73 0.85 42New Zealand 72 85 0.85 43United States 68 80 0.85 44Australia 70 83 0.85 45Austria 68 81 0.84 46United Kingdom 69 82 0.84 47Namibia 53 64 0.84 48Gambia, The 71 85 0.84 49Armenia 69 83 0.84 50Croatia 59 71 0.83 51Thailand 70 85 0.83 52Belgium 61 73 0.83 53Chad 63 78 0.82 54Zimbabwe 61 75 0.81 55Cyprus 64 80 0.81 56Poland 56 70 0.81 57Nepal 66 82 0.81 58Luxembourg 59 74 0.80 59Slovak Republic 62 77 0.80 60Peru 62 78 0.80 61Hungary 55 68 0.80 62Brunei Darussalam 62 78 0.80 63Romania 54 68 0.79 64Jamaica 61 78 0.79 65Ireland 64 81 0.78 66Czech Republic 61 78 0.78 67Uruguay 65 85 0.77 68
Female-to
Female-to- Country Female Male male ratio Rank
Bolivia 64 83 0.77 69Spain 63 82 0.77 70Georgia 59 78 0.76 71South Africa 51 67 0.76 72Zambia 60 79 0.76 73Brazil 64 85 0.75 74Maldives 59 79 0.75 75Tajikistan 60 81 0.75 76Mauritania 61 82 0.74 77Singapore 60 82 0.74 78Trinidad and Tobago 61 83 0.73 79Japan 62 84 0.73 80Senegal 66 90 0.73 81Albania 56 76 0.73 82Bangladesh 62 85 0.73 83Korea, Rep. 55 76 0.73 84Kyrgyz Republic 59 83 0.72 85Argentina 58 82 0.71 86Greece 55 79 0.70 87Italy 52 74 0.70 88Macedonia, FYR 51 74 0.69 89Paraguay 59 88 0.67 90Cameroon 54 82 0.66 91Venezuela 55 83 0.66 92Dominican Republic 55 84 0.65 93Philippines 51 80 0.63 94Cuba 48 76 0.63 95Côte d’Ivoire 51 83 0.62 96Panama 53 85 0.62 97Nicaragua 50 81 0.61 98El Salvador 49 81 0.61 99Indonesia 53 87 0.61 100Ecuador 48 79 0.61 101Belize 50 83 0.60 102Chile 47 78 0.60 103Suriname 42 72 0.59 104Costa Rica 49 84 0.58 105Malaysia 47 82 0.57 106Mauritius 45 80 0.57 107Mali 39 68 0.57 108Guyana 48 85 0.57 109Guatemala 50 90 0.56 110Kuwait 47 84 0.55 111Mexico 46 84 0.55 112Qatar 51 93 0.55 113Colombia 43 80 0.55 114Nigeria 40 75 0.53 115Honduras 42 82 0.51 116Fiji 40 80 0.50 117Malta 39 78 0.50 118Sri Lanka 38 80 0.47 119Algeria 39 83 0.47 120United Arab Emirates 43 93 0.46 121Iran, Islamic Rep. 33 76 0.44 122India 35 85 0.42 123Bahrain 34 86 0.39 124Tunisia 28 74 0.38 125Turkey 26 74 0.35 126Morocco 28 84 0.34 127Oman 27 79 0.34 128Lebanon 25 75 0.33 129Jordan 25 78 0.32 130Egypt 24 79 0.30 131Yemen 21 74 0.28 132Saudi Arabia 22 82 0.27 133Syria 22 82 0.27 134Pakistan 22 88 0.26 135

Global Gender Gap Report 2011 Measuring the Global Gender Gap 43
Appendix D: Rankings by Indicator, 2011 (cont’d.)
Table D2: Wage equality survey Female-to Country Survey data* -male ratio Rank
Egypt 5.96 0.85 1Lesotho 5.81 0.83 2Albania 5.75 0.82 3Malaysia 5.67 0.81 4Singapore 5.65 0.81 5Uganda 5.62 0.80 6Macedonia, FYR 5.56 0.79 7Kyrgyz Republic 5.55 0.79 8Gambia, The 5.53 0.79 9Mongolia 5.46 0.78 10Botswana 5.43 0.78 11Denmark 5.40 0.77 12Tunisia 5.39 0.77 13Nigeria 5.38 0.77 14Zimbabwe 5.38 0.77 15Burkina Faso 5.37 0.77 16Thailand 5.37 0.77 17Malawi 5.37 0.77 18Benin 5.36 0.77 19Bahrain 5.35 0.76 20Zambia 5.34 0.76 21Georgia 5.32 0.76 22Philippines 5.32 0.76 23Burundi 5.29 0.76 24Norway 5.26 0.75 25Ghana 5.26 0.75 26Brunei Darussalam 5.25 0.75 27Sweden 5.24 0.75 28New Zealand 5.22 0.75 29Sri Lanka 5.21 0.74 30Finland 5.21 0.74 31Senegal 5.21 0.74 32Cambodia 5.16 0.74 33Barbados 5.15 0.74 34United Arab Emirates 5.11 0.73 35Cameroon 5.11 0.73 36Ireland 5.10 0.73 37Canada 5.09 0.73 38Tajikistan 5.07 0.72 39Guyana 5.03 0.72 40Moldova 4.96 0.71 41Kazakhstan 4.95 0.71 42Iceland 4.93 0.70 43Belgium 4.88 0.70 44Ethiopia 4.86 0.69 45Namibia 4.85 0.69 46Mali 4.85 0.69 47Oman 4.84 0.69 48Armenia 4.82 0.69 49China 4.82 0.69 50Qatar 4.81 0.69 51Kenya 4.80 0.69 52Vietnam 4.80 0.69 53Azerbaijan 4.78 0.68 54Tanzania 4.76 0.68 55Netherlands 4.74 0.68 56United Kingdom 4.73 0.68 57Indonesia 4.72 0.67 58Malta 4.70 0.67 59Kuwait 4.70 0.67 60Trinidad and Tobago 4.69 0.67 61Luxembourg 4.67 0.67 62Morocco 4.65 0.66 63Syria 4.65 0.66 64Mozambique 4.65 0.66 65Slovenia 4.64 0.66 66South Africa 4.62 0.66 67United States 4.59 0.66 68
Female-to Country Survey data* -male ratio Rank
Saudi Arabia 4.58 0.65 69Lebanon 4.58 0.65 70Russian Federation 4.58 0.65 71Romania 4.57 0.65 72Chad 4.55 0.65 73Estonia 4.53 0.65 74Latvia 4.50 0.64 75Australia 4.50 0.64 76Algeria 4.47 0.64 77Costa Rica 4.47 0.64 78Greece 4.47 0.64 79Switzerland 4.43 0.63 80Suriname 4.42 0.63 81Jamaica 4.40 0.63 82Mauritius 4.38 0.63 83Jordan 4.36 0.62 84Lithuania 4.35 0.62 85India 4.35 0.62 86Madagascar 4.33 0.62 87Yemen 4.33 0.62 88Germany 4.32 0.62 89Argentina 4.28 0.61 90Venezuela 4.22 0.60 91Honduras 4.22 0.60 92Japan 4.21 0.60 93Colombia 4.19 0.60 94Ukraine 4.19 0.60 95Iran, Islamic Rep. 4.19 0.60 96Cyprus 4.17 0.60 97Ecuador 4.15 0.59 98Peru 4.14 0.59 99Angola 4.10 0.59 100Côte d’Ivoire 4.07 0.58 101Turkey 4.07 0.58 102Pakistan 4.03 0.58 103Bulgaria 4.03 0.58 104Bangladesh 3.99 0.57 105Panama 3.98 0.57 106Paraguay 3.97 0.57 107Portugal 3.95 0.56 108El Salvador 3.94 0.56 109Guatemala 3.92 0.56 110Mexico 3.90 0.56 111Dominican Republic 3.89 0.56 112Croatia 3.88 0.55 113Belize 3.86 0.55 114Bolivia 3.78 0.54 115Austria 3.78 0.54 116Nicaragua 3.74 0.53 117Nepal 3.72 0.53 118Slovak Republic 3.69 0.53 119Israel 3.68 0.53 120Uruguay 3.68 0.53 121Spain 3.68 0.53 122Poland 3.63 0.52 123Brazil 3.59 0.51 124Italy 3.57 0.51 125Korea, Rep. 3.57 0.51 126Czech Republic 3.52 0.50 127Chile 3.48 0.50 128Hungary 3.32 0.47 129Mauritania 3.31 0.47 130France 2.98 0.43 131Bahamas — — —Cuba — — —Fiji — — —Maldives — — —
* (1 = Not at all – significantly below those of men; 7 = Fully – equal to those of men)

44 Measuring the Global Gender Gap Global Gender Gap Report 2011
Appendix D: Rankings by Indicator, 2011 (cont’d.)
Table D3: Estimated earned income Female Male (with (with Female- 40,000 40,000 to-male Country Female Male cut-off) cut-off) ratio Rank
Luxembourg 59,570 108,458 40,000 40,000 1.00 1Norway 49,498 63,007 40,000 40,000 1.00 1Brunei Darussalam 38,656 62,967 38,656 40,000 0.97 3Switzerland 35,577 55,328 35,577 40,000 0.89 4United States 35,346 56,918 35,346 40,000 0.88 5Singapore 35,060 66,054 35,060 40,000 0.88 6Qatar 33,582 110,218 33,582 40,000 0.84 7Netherlands 33,295 48,187 33,295 40,000 0.83 8Sweden 32,990 41,830 32,990 40,000 0.82 9Australia 32,861 46,295 32,861 40,000 0.82 10Denmark 32,206 43,331 32,206 40,000 0.81 11Mongolia 3,141 3,912 3,141 3,912 0.80 12Burundi 349 437 349 437 0.80 13Bolivia 3,856 4,986 3,856 4,986 0.77 14Mozambique 767 1,010 767 1,010 0.76 15Canada 30,005 45,763 30,005 40,000 0.75 16Ghana 1,324 1,774 1,324 1,774 0.75 17Finland 29,593 41,166 29,593 40,000 0.74 18Lesotho 1,257 1,703 1,257 1,703 0.74 19Malawi 671 919 671 919 0.73 20Madagascar 845 1,164 845 1,164 0.73 21Ireland 28,910 52,450 28,910 40,000 0.72 22United Kingdom 28,354 42,217 28,354 40,000 0.71 23Croatia 16,600 23,629 16,600 23,629 0.70 24New Zealand 23,856 34,258 23,856 34,258 0.70 25Iceland 27,675 45,486 27,675 40,000 0.69 26Ethiopia 763 1,108 763 1,108 0.69 27Germany 27,457 45,570 27,457 40,000 0.69 28Vietnam 2,409 3,511 2,409 3,511 0.69 29Romania 11,662 17,043 11,662 17,043 0.68 30Lithuania 14,117 20,936 14,117 20,936 0.67 31Belgium 26,943 46,075 26,943 40,000 0.67 32Latvia 13,436 19,949 13,436 19,949 0.67 33Tanzania 1,096 1,630 1,096 1,630 0.67 34Moldova 2,317 3,448 2,317 3,448 0.67 35Burkina Faso 950 1,424 950 1,424 0.67 36Benin 1,202 1,808 1,202 1,808 0.66 37Cambodia 1,532 2,315 1,532 2,315 0.66 38Bulgaria 11,105 16,823 11,105 16,823 0.66 39Kenya 1,249 1,897 1,249 1,897 0.66 40Uganda 963 1,471 963 1,471 0.65 41Russian Federation 15,193 23,284 15,193 23,284 0.65 42China 5,331 8,215 5,331 8,215 0.65 43Angola 4,580 7,079 4,580 7,079 0.65 44France 25,870 41,922 25,870 40,000 0.65 45Barbados 15,119 23,507 15,119 23,507 0.64 46Israel 21,684 33,726 21,684 33,726 0.64 47Hungary 16,007 25,075 16,007 25,075 0.64 48Namibia 5,010 7,850 5,010 7,850 0.64 49Gambia, The 1,102 1,733 1,102 1,733 0.64 50Thailand 6,185 9,865 6,185 9,865 0.63 51Estonia 15,318 24,808 15,318 24,808 0.62 52Slovenia 20,797 33,769 20,797 33,769 0.62 53Kuwait 24,531 65,010 24,531 40,000 0.61 54Paraguay 3,430 5,594 3,430 5,594 0.61 55Kazakhstan 8,833 14,454 8,833 14,454 0.61 56Chad 988 1,616 988 1,616 0.61 57Brazil 7,865 12,946 7,865 12,946 0.61 58Ukraine 4,830 8,057 4,830 8,057 0.60 59Philippines 2,642 4,429 2,642 4,429 0.60 60Peru 6,399 10,850 6,399 10,850 0.59 61Jamaica 5,665 9,685 5,665 9,685 0.58 62Cyprus 22,737 39,394 22,737 39,394 0.58 63Spain 22,985 41,573 22,985 40,000 0.57 64Poland 13,886 24,292 13,886 24,292 0.57 65Senegal 1,324 2,317 1,324 2,317 0.57 66Slovak Republic 16,768 29,371 16,768 29,371 0.57 67Maldives 3,969 6,952 3,969 6,952 0.57 68
Female Male (with (with Female- 40,000 40,000 to-male Country Female Male cut-off) cut-off) ratio Rank
Portugal 18,218 32,057 18,218 32,057 0.57 69Tajikistan 1,433 2,525 1,433 2,525 0.57 70Mauritania 1,385 2,458 1,385 2,458 0.56 71Zambia 1,031 1,831 1,031 1,831 0.56 72Austria 22,528 55,934 22,528 40,000 0.56 73South Africa 7,411 13,225 7,411 13,225 0.56 74Bahrain 22,378 44,679 22,378 40,000 0.56 75Uruguay 9,549 17,092 9,549 17,092 0.56 76United Arab Emirates 22,101 75,089 22,101 40,000 0.55 77Costa Rica 7,849 14,261 7,849 14,261 0.55 78Trinidad and Tobago 18,276 33,290 18,276 33,290 0.55 79Bangladesh 1,000 1,823 1,000 1,823 0.55 80Panama 9,199 16,852 9,199 16,852 0.55 81Albania 6,172 11,327 6,172 11,327 0.54 82Italy 21,438 44,033 21,438 40,000 0.54 83Kyrgyz Republic 1,586 2,999 1,586 2,999 0.53 84Azerbaijan 6,691 12,721 6,691 12,721 0.53 85Argentina 10,035 19,217 10,035 19,217 0.52 86Japan 20,572 44,892 20,572 40,000 0.51 87Cameroon 1,484 2,926 1,484 2,926 0.51 88Macedonia, FYR 7,509 14,818 7,509 14,818 0.51 89Greece 19,842 39,561 19,842 39,561 0.50 90Venezuela 8,200 16,413 8,200 16,413 0.50 91Armenia 3,586 7,218 3,586 7,218 0.50 92Botswana 8,823 17,952 8,823 17,952 0.49 93Dominican Republic 5,533 11,306 5,533 11,306 0.49 94Nicaragua 1,722 3,579 1,722 3,579 0.48 95Czech Republic 16,651 34,848 16,651 34,848 0.48 96Malta 15,962 33,736 15,962 33,736 0.47 97Ecuador 5,275 11,249 5,275 11,249 0.47 98Colombia 5,718 12,302 5,718 12,302 0.46 99Côte d’Ivoire 1,067 2,312 1,067 2,312 0.46 100Belize 4,136 9,081 4,136 9,081 0.46 101Suriname 4,654 10,251 4,654 10,251 0.45 102Mali 736 1,647 736 1,647 0.45 103Chile 8,845 19,897 8,845 19,897 0.44 104Mexico 8,813 19,871 8,813 19,871 0.44 105Guatemala 2,927 6,605 2,927 6,605 0.44 106Malaysia 8,365 19,486 8,365 19,486 0.43 107Mauritius 7,656 18,115 7,656 18,115 0.42 108Indonesia 2,487 5,915 2,487 5,915 0.42 109El Salvador 3,981 9,594 3,981 9,594 0.41 110Guyana 1,872 4,537 1,872 4,537 0.41 111Nigeria 1,283 3,119 1,283 3,119 0.41 112Korea, Rep. 15,830 38,590 15,830 38,590 0.41 113Iran, Islamic Rep. 6,564 16,386 6,564 16,386 0.40 114Georgia 2,771 7,030 2,771 7,030 0.39 115Honduras 2,148 5,538 2,148 5,538 0.39 116Fiji 2,455 6,536 2,455 6,536 0.38 117Nepal 628 1,689 628 1,689 0.37 118Algeria 4,328 11,944 4,328 11,944 0.36 119Sri Lanka 2,542 7,070 2,542 7,070 0.36 120India 1,518 4,960 1,518 4,960 0.31 121Jordan 2,456 8,581 2,456 8,581 0.29 122Tunisia 3,617 12,875 3,617 12,875 0.28 123Turkey 5,602 21,660 5,602 21,660 0.26 124Morocco 1,828 7,257 1,828 7,257 0.25 125Lebanon 5,186 21,288 5,186 21,288 0.24 126Egypt 2,167 9,138 2,167 9,138 0.24 127Oman 8,866 38,285 8,866 38,285 0.23 128Syria 1,657 7,745 1,657 7,745 0.21 129Yemen 857 4,046 857 4,046 0.21 130Saudi Arabia 7,157 36,727 7,157 36,727 0.19 131Bahamas — — — — — —Cuba — — — — — —Zimbabwe — — — — — —Pakistan — — — — — —

Global Gender Gap Report 2011 Measuring the Global Gender Gap 45
Appendix D: Rankings by Indicator, 2011 (cont’d.)
Table D4: Legislators, senior officials and managers Female-to- Country Female Male male ratio Rank
Jamaica 59 41 1.44 1Philippines 55 45 1.21 2Lesotho 52 48 1.08 3Fiji 51 49 1.04 4Panama 48 52 0.93 5Mongolia 47 53 0.90 6Bahamas 46 54 0.86 7Trinidad and Tobago 43 57 0.77 8Barbados 43 57 0.77 9United States 43 57 0.74 10Latvia 41 59 0.71 11Belize 41 59 0.70 12Nicaragua 41 59 0.69 13Honduras 41 59 0.68 14Uruguay 40 60 0.68 15Lithuania 40 60 0.67 16New Zealand 40 60 0.67 17Colombia 40 60 0.66 18Ukraine 39 61 0.63 19France 39 61 0.63 20Kazakhstan 38 62 0.62 21Moldova 38 62 0.61 22Germany 38 62 0.61 23Russian Federation 37 63 0.59 24Australia 37 63 0.58 25Hungary 36 64 0.57 26Estonia 36 64 0.57 27Poland 36 64 0.57 28Brazil 36 64 0.56 29Canada 36 64 0.56 30Namibia 36 64 0.56 31Slovenia 35 65 0.55 32Kyrgyz Republic 35 65 0.54 33Brunei Darussalam 35 65 0.54 34United Kingdom 35 65 0.53 35Paraguay 34 66 0.52 36Georgia 34 66 0.51 37Uganda 33 67 0.50 38Italy 33 67 0.50 39Iceland 33 67 0.50 40Belgium 33 67 0.49 41Bulgaria 32 68 0.48 42Spain 32 68 0.48 43Sweden 32 68 0.48 44Ghana 32 68 0.47 45Israel 32 68 0.47 46Ireland 32 68 0.47 47Singapore 31 69 0.46 48Norway 31 69 0.46 49Portugal 31 69 0.45 50Luxembourg 31 69 0.45 51Mexico 31 69 0.44 52Venezuela 31 69 0.44 53Dominican Republic 31 69 0.44 54Botswana 30 70 0.44 55Cuba 30 70 0.44 56Costa Rica 30 70 0.44 57Switzerland 30 70 0.43 58South Africa 30 70 0.43 59Slovak Republic 30 70 0.42 60Finland 30 70 0.42 61Romania 29 71 0.42 62Bolivia 29 71 0.41 63Macedonia, FYR 29 71 0.40 64Greece 28 72 0.40 65Austria 28 72 0.39 66Czech Republic 28 72 0.39 67Suriname 28 72 0.39 68
Female-to- Country Female Male male ratio Rank
Ecuador 28 72 0.38 69Netherlands 27 73 0.38 70Croatia 27 73 0.36 71Guyana 25 75 0.34 72El Salvador 25 75 0.33 73Chile 24 76 0.32 74Malaysia 24 76 0.32 75Sri Lanka 24 76 0.32 76Armenia 24 76 0.31 77Denmark 24 76 0.31 78Thailand 24 76 0.31 79Mauritius 23 77 0.30 80Argentina 23 77 0.30 81Bahrain 22 78 0.29 82Vietnam 22 78 0.28 83Madagascar 22 78 0.28 84Indonesia 22 78 0.28 85Mali 20 80 0.25 86Peru 19 81 0.24 87Zambia 19 81 0.23 88Malta 17 83 0.21 89China 17 83 0.20 90Tanzania 16 84 0.20 91Cyprus 16 84 0.19 92Ethiopia 16 84 0.19 93Angola 15 85 0.18 94Malawi 15 85 0.18 94Zimbabwe 15 85 0.18 94Maldives 14 86 0.17 97Burkina Faso 14 86 0.16 98Kuwait 14 86 0.16 99Nepal 14 86 0.16 100Cambodia 14 86 0.16 101Iran, Islamic Rep. 13 87 0.15 102Chad 13 87 0.15 103Morocco 13 87 0.15 104Egypt 11 89 0.12 105Syria 10 90 0.11 106Cameroon 10 90 0.11 107United Arab Emirates 10 90 0.11 108Bangladesh 10 90 0.11 109Turkey 10 90 0.11 110Korea, Rep. 10 90 0.11 111Japan 9 91 0.10 112Oman 9 91 0.10 113Tunisia 9 91 0.10 113Lebanon 8 92 0.09 115Mauritania 8 92 0.09 116Azerbaijan 7 93 0.08 117Saudi Arabia 7 93 0.08 118Benin 7 93 0.08 119Qatar 7 93 0.07 120Kenya 5 95 0.05 121Algeria 5 95 0.05 122India 3 97 0.03 123Pakistan 3 97 0.03 124Yemen 2 98 0.02 125Albania — — — —Burundi — — — —Côte d’Ivoire — — — —Gambia, The — — — —Guatemala — — — —Jordan — — — —Mozambique — — — —Nigeria — — — —Senegal — — — —Tajikistan — — — —
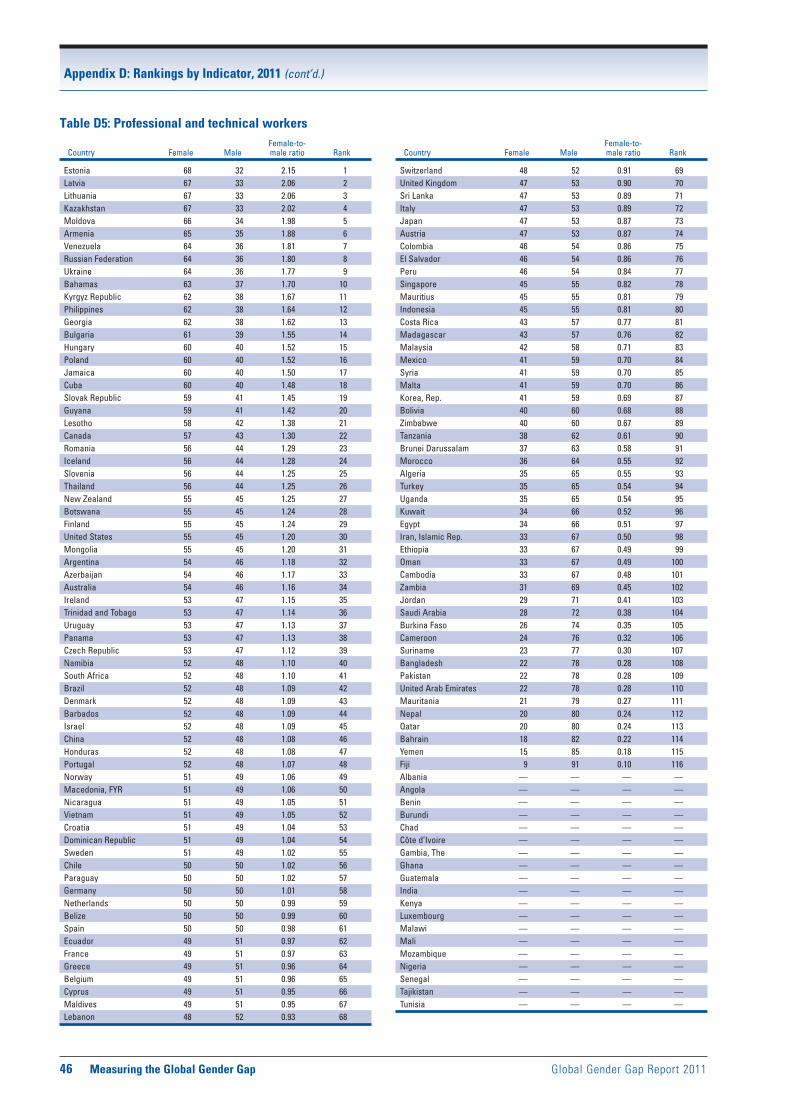
46 Measuring the Global Gender Gap Global Gender Gap Report 2011
Appendix D: Rankings by Indicator, 2011 (cont’d.)
Table D5: Professional and technical workers Female-to- Country Female Male male ratio Rank
Estonia 68 32 2.15 1Latvia 67 33 2.06 2Lithuania 67 33 2.06 3Kazakhstan 67 33 2.02 4Moldova 66 34 1.98 5Armenia 65 35 1.88 6Venezuela 64 36 1.81 7Russian Federation 64 36 1.80 8Ukraine 64 36 1.77 9Bahamas 63 37 1.70 10Kyrgyz Republic 62 38 1.67 11Philippines 62 38 1.64 12Georgia 62 38 1.62 13Bulgaria 61 39 1.55 14Hungary 60 40 1.52 15Poland 60 40 1.52 16Jamaica 60 40 1.50 17Cuba 60 40 1.48 18Slovak Republic 59 41 1.45 19Guyana 59 41 1.42 20Lesotho 58 42 1.38 21Canada 57 43 1.30 22Romania 56 44 1.29 23Iceland 56 44 1.28 24Slovenia 56 44 1.25 25Thailand 56 44 1.25 26New Zealand 55 45 1.25 27Botswana 55 45 1.24 28Finland 55 45 1.24 29United States 55 45 1.20 30Mongolia 55 45 1.20 31Argentina 54 46 1.18 32Azerbaijan 54 46 1.17 33Australia 54 46 1.16 34Ireland 53 47 1.15 35Trinidad and Tobago 53 47 1.14 36Uruguay 53 47 1.13 37Panama 53 47 1.13 38Czech Republic 53 47 1.12 39Namibia 52 48 1.10 40South Africa 52 48 1.10 41Brazil 52 48 1.09 42Denmark 52 48 1.09 43Barbados 52 48 1.09 44Israel 52 48 1.09 45China 52 48 1.08 46Honduras 52 48 1.08 47Portugal 52 48 1.07 48Norway 51 49 1.06 49Macedonia, FYR 51 49 1.06 50Nicaragua 51 49 1.05 51Vietnam 51 49 1.05 52Croatia 51 49 1.04 53Dominican Republic 51 49 1.04 54Sweden 51 49 1.02 55Chile 50 50 1.02 56Paraguay 50 50 1.02 57Germany 50 50 1.01 58Netherlands 50 50 0.99 59Belize 50 50 0.99 60Spain 50 50 0.98 61Ecuador 49 51 0.97 62France 49 51 0.97 63Greece 49 51 0.96 64Belgium 49 51 0.96 65Cyprus 49 51 0.95 66Maldives 49 51 0.95 67Lebanon 48 52 0.93 68
Female-to- Country Female Male male ratio Rank
Switzerland 48 52 0.91 69United Kingdom 47 53 0.90 70Sri Lanka 47 53 0.89 71Italy 47 53 0.89 72Japan 47 53 0.87 73Austria 47 53 0.87 74Colombia 46 54 0.86 75El Salvador 46 54 0.86 76Peru 46 54 0.84 77Singapore 45 55 0.82 78Mauritius 45 55 0.81 79Indonesia 45 55 0.81 80Costa Rica 43 57 0.77 81Madagascar 43 57 0.76 82Malaysia 42 58 0.71 83Mexico 41 59 0.70 84Syria 41 59 0.70 85Malta 41 59 0.70 86Korea, Rep. 41 59 0.69 87Bolivia 40 60 0.68 88Zimbabwe 40 60 0.67 89Tanzania 38 62 0.61 90Brunei Darussalam 37 63 0.58 91Morocco 36 64 0.55 92Algeria 35 65 0.55 93Turkey 35 65 0.54 94Uganda 35 65 0.54 95Kuwait 34 66 0.52 96Egypt 34 66 0.51 97Iran, Islamic Rep. 33 67 0.50 98Ethiopia 33 67 0.49 99Oman 33 67 0.49 100Cambodia 33 67 0.48 101Zambia 31 69 0.45 102Jordan 29 71 0.41 103Saudi Arabia 28 72 0.38 104Burkina Faso 26 74 0.35 105Cameroon 24 76 0.32 106Suriname 23 77 0.30 107Bangladesh 22 78 0.28 108Pakistan 22 78 0.28 109United Arab Emirates 22 78 0.28 110Mauritania 21 79 0.27 111Nepal 20 80 0.24 112Qatar 20 80 0.24 113Bahrain 18 82 0.22 114Yemen 15 85 0.18 115Fiji 9 91 0.10 116Albania — — — —Angola — — — —Benin — — — —Burundi — — — —Chad — — — —Côte d’Ivoire — — — —Gambia, The — — — —Ghana — — — —Guatemala — — — —India — — — —Kenya — — — —Luxembourg — — — —Malawi — — — —Mali — — — —Mozambique — — — —Nigeria — — — —Senegal — — — —Tajikistan — — — —Tunisia — — — —
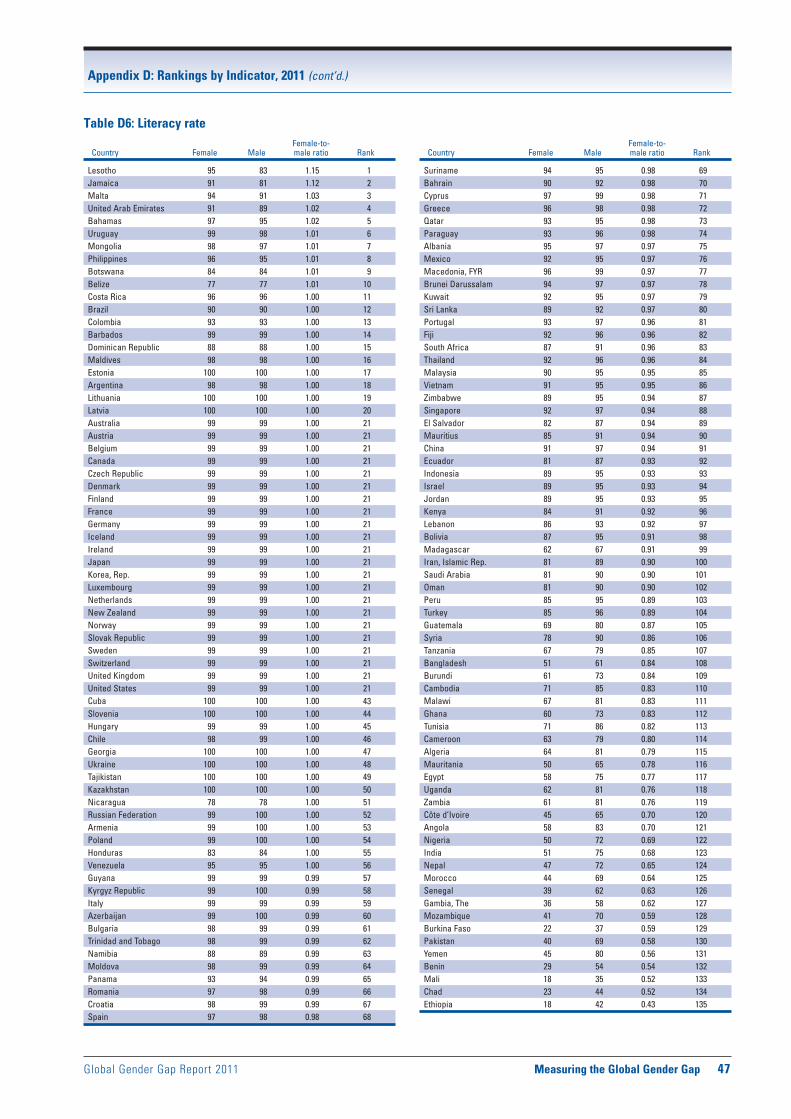
Global Gender Gap Report 2011 Measuring the Global Gender Gap 47
Appendix D: Rankings by Indicator, 2011 (cont’d.)
Table D6: Literacy rate Female-to- Country Female Male male ratio Rank
Lesotho 95 83 1.15 1Jamaica 91 81 1.12 2Malta 94 91 1.03 3United Arab Emirates 91 89 1.02 4Bahamas 97 95 1.02 5Uruguay 99 98 1.01 6Mongolia 98 97 1.01 7Philippines 96 95 1.01 8Botswana 84 84 1.01 9Belize 77 77 1.01 10Costa Rica 96 96 1.00 11Brazil 90 90 1.00 12Colombia 93 93 1.00 13Barbados 99 99 1.00 14Dominican Republic 88 88 1.00 15Maldives 98 98 1.00 16Estonia 100 100 1.00 17Argentina 98 98 1.00 18Lithuania 100 100 1.00 19Latvia 100 100 1.00 20Australia 99 99 1.00 21Austria 99 99 1.00 21Belgium 99 99 1.00 21Canada 99 99 1.00 21Czech Republic 99 99 1.00 21Denmark 99 99 1.00 21Finland 99 99 1.00 21France 99 99 1.00 21Germany 99 99 1.00 21Iceland 99 99 1.00 21Ireland 99 99 1.00 21Japan 99 99 1.00 21Korea, Rep. 99 99 1.00 21Luxembourg 99 99 1.00 21Netherlands 99 99 1.00 21New Zealand 99 99 1.00 21Norway 99 99 1.00 21Slovak Republic 99 99 1.00 21Sweden 99 99 1.00 21Switzerland 99 99 1.00 21United Kingdom 99 99 1.00 21United States 99 99 1.00 21Cuba 100 100 1.00 43Slovenia 100 100 1.00 44Hungary 99 99 1.00 45Chile 98 99 1.00 46Georgia 100 100 1.00 47Ukraine 100 100 1.00 48Tajikistan 100 100 1.00 49Kazakhstan 100 100 1.00 50Nicaragua 78 78 1.00 51Russian Federation 99 100 1.00 52Armenia 99 100 1.00 53Poland 99 100 1.00 54Honduras 83 84 1.00 55Venezuela 95 95 1.00 56Guyana 99 99 0.99 57Kyrgyz Republic 99 100 0.99 58Italy 99 99 0.99 59Azerbaijan 99 100 0.99 60Bulgaria 98 99 0.99 61Trinidad and Tobago 98 99 0.99 62Namibia 88 89 0.99 63Moldova 98 99 0.99 64Panama 93 94 0.99 65Romania 97 98 0.99 66Croatia 98 99 0.99 67Spain 97 98 0.98 68
Female-to- Country Female Male male ratio Rank
Suriname 94 95 0.98 69Bahrain 90 92 0.98 70Cyprus 97 99 0.98 71Greece 96 98 0.98 72Qatar 93 95 0.98 73Paraguay 93 96 0.98 74Albania 95 97 0.97 75Mexico 92 95 0.97 76Macedonia, FYR 96 99 0.97 77Brunei Darussalam 94 97 0.97 78Kuwait 92 95 0.97 79Sri Lanka 89 92 0.97 80Portugal 93 97 0.96 81Fiji 92 96 0.96 82South Africa 87 91 0.96 83Thailand 92 96 0.96 84Malaysia 90 95 0.95 85Vietnam 91 95 0.95 86Zimbabwe 89 95 0.94 87Singapore 92 97 0.94 88El Salvador 82 87 0.94 89Mauritius 85 91 0.94 90China 91 97 0.94 91Ecuador 81 87 0.93 92Indonesia 89 95 0.93 93Israel 89 95 0.93 94Jordan 89 95 0.93 95Kenya 84 91 0.92 96Lebanon 86 93 0.92 97Bolivia 87 95 0.91 98Madagascar 62 67 0.91 99Iran, Islamic Rep. 81 89 0.90 100Saudi Arabia 81 90 0.90 101Oman 81 90 0.90 102Peru 85 95 0.89 103Turkey 85 96 0.89 104Guatemala 69 80 0.87 105Syria 78 90 0.86 106Tanzania 67 79 0.85 107Bangladesh 51 61 0.84 108Burundi 61 73 0.84 109Cambodia 71 85 0.83 110Malawi 67 81 0.83 111Ghana 60 73 0.83 112Tunisia 71 86 0.82 113Cameroon 63 79 0.80 114Algeria 64 81 0.79 115Mauritania 50 65 0.78 116Egypt 58 75 0.77 117Uganda 62 81 0.76 118Zambia 61 81 0.76 119Côte d’Ivoire 45 65 0.70 120Angola 58 83 0.70 121Nigeria 50 72 0.69 122India 51 75 0.68 123Nepal 47 72 0.65 124Morocco 44 69 0.64 125Senegal 39 62 0.63 126Gambia, The 36 58 0.62 127Mozambique 41 70 0.59 128Burkina Faso 22 37 0.59 129Pakistan 40 69 0.58 130Yemen 45 80 0.56 131Benin 29 54 0.54 132Mali 18 35 0.52 133Chad 23 44 0.52 134Ethiopia 18 42 0.43 135

48 Measuring the Global Gender Gap Global Gender Gap Report 2011
Appendix D: Rankings by Indicator, 2011 (cont’d.)
Table D7: Enrolment in primary education Female-to- Country Female Male male ratio Rank
Bangladesh 90 83 1.08 1Mauritania 79 74 1.07 2Lesotho 75 71 1.05 3Malawi 93 88 1.05 4Namibia 91 87 1.05 5Senegal 74 72 1.04 6Armenia 86 83 1.03 7Czech Republic 91 88 1.03 8Gambia, The 68 66 1.03 9Uganda 94 91 1.03 10Denmark 96 94 1.03 11Bahamas 92 90 1.02 12Zambia 92 90 1.02 13United States 92 90 1.02 14Philippines 93 91 1.02 15Malta 92 90 1.02 16Honduras 98 96 1.02 17Botswana 88 86 1.02 18Ecuador 96 94 1.02 19Ireland 97 96 1.02 20Luxembourg 97 95 1.02 21Jordan 90 89 1.02 22Costa Rica 88 87 1.01 23Burundi 100 98 1.01 24El Salvador 95 93 1.01 25Zimbabwe 91 89 1.01 26Mauritius 95 93 1.01 27Tanzania 97 96 1.01 28Kenya 83 82 1.01 29Slovak Republic 92 91 1.01 30Israel 97 96 1.01 31Barbados 97 96 1.01 32Brunei Darussalam 93 92 1.01 33Austria 98 97 1.01 34Tunisia 99 98 1.01 35Ghana 76 76 1.01 36Australia 97 96 1.01 37Macedonia, FYR 87 86 1.01 38Sri Lanka 95 95 1.01 39Portugal 99 98 1.01 40Iran, Islamic Rep. 100 99 1.01 41Madagascar 99 98 1.01 42New Zealand 99 99 1.01 43Bolivia 94 93 1.01 44Latvia 93 93 1.01 45Dominican Republic 80 80 1.01 46Bulgaria 97 96 1.01 47Greece 100 99 1.00 48Ukraine 89 88 1.00 49China 97 97 1.00 50Peru 95 94 1.00 51Canada 100 99 1.00 52Belgium 99 99 1.00 53Nicaragua 92 92 1.00 54Poland 96 95 1.00 55Iceland 98 98 1.00 56Norway 99 99 1.00 57United Kingdom 100 99 1.00 58France 99 98 1.00 59Belize 97 97 1.00 60Spain 100 100 1.00 61Cuba 99 99 1.00 62Japan 99 99 1.00 63Mexico 98 98 1.00 64Venezuela 92 92 1.00 65Finland 96 96 1.00 66Russian Federation 92 92 1.00 67Paraguay 85 85 1.00 68
Female-to- Country Female Male male ratio Rank
South Africa 85 85 1.00 69Malaysia 94 94 1.00 70Switzerland 94 94 1.00 71Germany 97 97 1.00 72Netherlands 99 99 1.00 73Uruguay 98 99 1.00 74Croatia 89 89 1.00 75Slovenia 97 98 1.00 76Romania 90 91 0.99 77Cyprus 98 99 0.99 78Kazakhstan 89 90 0.99 79Kyrgyz Republic 83 84 0.99 80Qatar 93 94 0.99 81Fiji 89 90 0.99 82Estonia 94 95 0.99 83Guyana 95 96 0.99 84Sweden 96 96 0.99 85Panama 97 97 0.99 86Trinidad and Tobago 92 93 0.99 87Chile 94 95 0.99 88Italy 98 99 0.99 89Colombia 89 90 0.99 90Mongolia 90 91 0.99 91Suriname 90 91 0.99 92Hungary 90 91 0.99 93Argentina 98 99 0.99 94Thailand 89 91 0.99 95Korea, Rep. 98 100 0.99 96Moldova 87 88 0.98 97Oman 77 78 0.98 98Bahrain 97 98 0.98 99Lebanon 89 91 0.98 100Azerbaijan 84 86 0.98 101United Arab Emirates 89 90 0.98 102Lithuania 93 94 0.98 103Algeria 93 95 0.98 104Brazil 93 95 0.98 105Georgia 98 100 0.98 106Albania 84 86 0.98 107Kuwait 87 89 0.98 108Maldives 95 97 0.98 109Turkey 94 96 0.98 110Indonesia 94 97 0.97 111Saudi Arabia 85 88 0.97 112Egypt 92 95 0.97 113Guatemala 94 97 0.97 114Jamaica 79 82 0.97 115Morocco 88 91 0.97 116India 88 91 0.96 117Tajikistan 95 99 0.96 118Cambodia 87 90 0.96 119Vietnam 91 96 0.95 120Syria 92 97 0.95 121Mozambique 90 95 0.94 122Ethiopia 80 85 0.94 123Singapore — — 0.93 124Nigeria 58 64 0.90 125Benin 86 97 0.89 126Burkina Faso 59 67 0.89 127Cameroon 86 97 0.88 128Angola 48 55 0.86 129Mali 69 81 0.85 130Pakistan 60 72 0.84 131Côte d’Ivoire 52 62 0.83 132Yemen 66 79 0.83 133 Nepal 64 78 0.82 134Chad 50 72 0.70 135
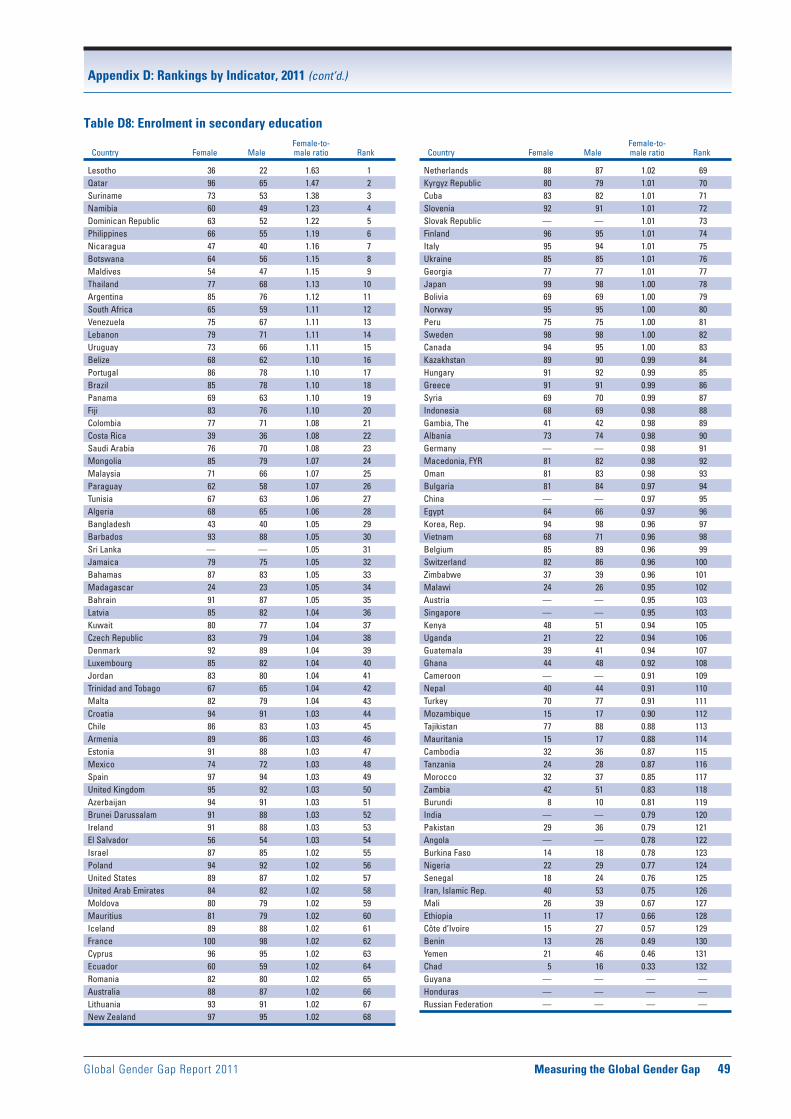
Global Gender Gap Report 2011 Measuring the Global Gender Gap 49
Appendix D: Rankings by Indicator, 2011 (cont’d.)
Table D8: Enrolment in secondary education Female-to- Country Female Male male ratio Rank
Lesotho 36 22 1.63 1Qatar 96 65 1.47 2Suriname 73 53 1.38 3Namibia 60 49 1.23 4Dominican Republic 63 52 1.22 5Philippines 66 55 1.19 6Nicaragua 47 40 1.16 7Botswana 64 56 1.15 8Maldives 54 47 1.15 9Thailand 77 68 1.13 10Argentina 85 76 1.12 11South Africa 65 59 1.11 12Venezuela 75 67 1.11 13Lebanon 79 71 1.11 14Uruguay 73 66 1.11 15Belize 68 62 1.10 16Portugal 86 78 1.10 17Brazil 85 78 1.10 18Panama 69 63 1.10 19Fiji 83 76 1.10 20Colombia 77 71 1.08 21Costa Rica 39 36 1.08 22Saudi Arabia 76 70 1.08 23Mongolia 85 79 1.07 24Malaysia 71 66 1.07 25Paraguay 62 58 1.07 26Tunisia 67 63 1.06 27Algeria 68 65 1.06 28Bangladesh 43 40 1.05 29Barbados 93 88 1.05 30Sri Lanka — — 1.05 31Jamaica 79 75 1.05 32Bahamas 87 83 1.05 33Madagascar 24 23 1.05 34Bahrain 91 87 1.05 35Latvia 85 82 1.04 36Kuwait 80 77 1.04 37Czech Republic 83 79 1.04 38Denmark 92 89 1.04 39Luxembourg 85 82 1.04 40Jordan 83 80 1.04 41Trinidad and Tobago 67 65 1.04 42Malta 82 79 1.04 43Croatia 94 91 1.03 44Chile 86 83 1.03 45Armenia 89 86 1.03 46Estonia 91 88 1.03 47Mexico 74 72 1.03 48Spain 97 94 1.03 49United Kingdom 95 92 1.03 50Azerbaijan 94 91 1.03 51Brunei Darussalam 91 88 1.03 52Ireland 91 88 1.03 53El Salvador 56 54 1.03 54Israel 87 85 1.02 55Poland 94 92 1.02 56United States 89 87 1.02 57United Arab Emirates 84 82 1.02 58Moldova 80 79 1.02 59Mauritius 81 79 1.02 60Iceland 89 88 1.02 61France 100 98 1.02 62Cyprus 96 95 1.02 63Ecuador 60 59 1.02 64Romania 82 80 1.02 65Australia 88 87 1.02 66Lithuania 93 91 1.02 67New Zealand 97 95 1.02 68
Female-to- Country Female Male male ratio Rank
Netherlands 88 87 1.02 69Kyrgyz Republic 80 79 1.01 70Cuba 83 82 1.01 71Slovenia 92 91 1.01 72Slovak Republic — — 1.01 73Finland 96 95 1.01 74Italy 95 94 1.01 75Ukraine 85 85 1.01 76Georgia 77 77 1.01 77Japan 99 98 1.00 78Bolivia 69 69 1.00 79Norway 95 95 1.00 80Peru 75 75 1.00 81Sweden 98 98 1.00 82Canada 94 95 1.00 83Kazakhstan 89 90 0.99 84Hungary 91 92 0.99 85Greece 91 91 0.99 86Syria 69 70 0.99 87Indonesia 68 69 0.98 88Gambia, The 41 42 0.98 89Albania 73 74 0.98 90Germany — — 0.98 91Macedonia, FYR 81 82 0.98 92Oman 81 83 0.98 93Bulgaria 81 84 0.97 94China — — 0.97 95Egypt 64 66 0.97 96Korea, Rep. 94 98 0.96 97Vietnam 68 71 0.96 98Belgium 85 89 0.96 99Switzerland 82 86 0.96 100Zimbabwe 37 39 0.96 101Malawi 24 26 0.95 102Austria — — 0.95 103Singapore — — 0.95 103Kenya 48 51 0.94 105Uganda 21 22 0.94 106Guatemala 39 41 0.94 107Ghana 44 48 0.92 108Cameroon — — 0.91 109Nepal 40 44 0.91 110Turkey 70 77 0.91 111Mozambique 15 17 0.90 112Tajikistan 77 88 0.88 113Mauritania 15 17 0.88 114Cambodia 32 36 0.87 115Tanzania 24 28 0.87 116Morocco 32 37 0.85 117Zambia 42 51 0.83 118Burundi 8 10 0.81 119India — — 0.79 120Pakistan 29 36 0.79 121Angola — — 0.78 122Burkina Faso 14 18 0.78 123Nigeria 22 29 0.77 124Senegal 18 24 0.76 125Iran, Islamic Rep. 40 53 0.75 126Mali 26 39 0.67 127Ethiopia 11 17 0.66 128Côte d’Ivoire 15 27 0.57 129Benin 13 26 0.49 130Yemen 21 46 0.46 131Chad 5 16 0.33 132Guyana — — — —Honduras — — — —Russian Federation — — — —
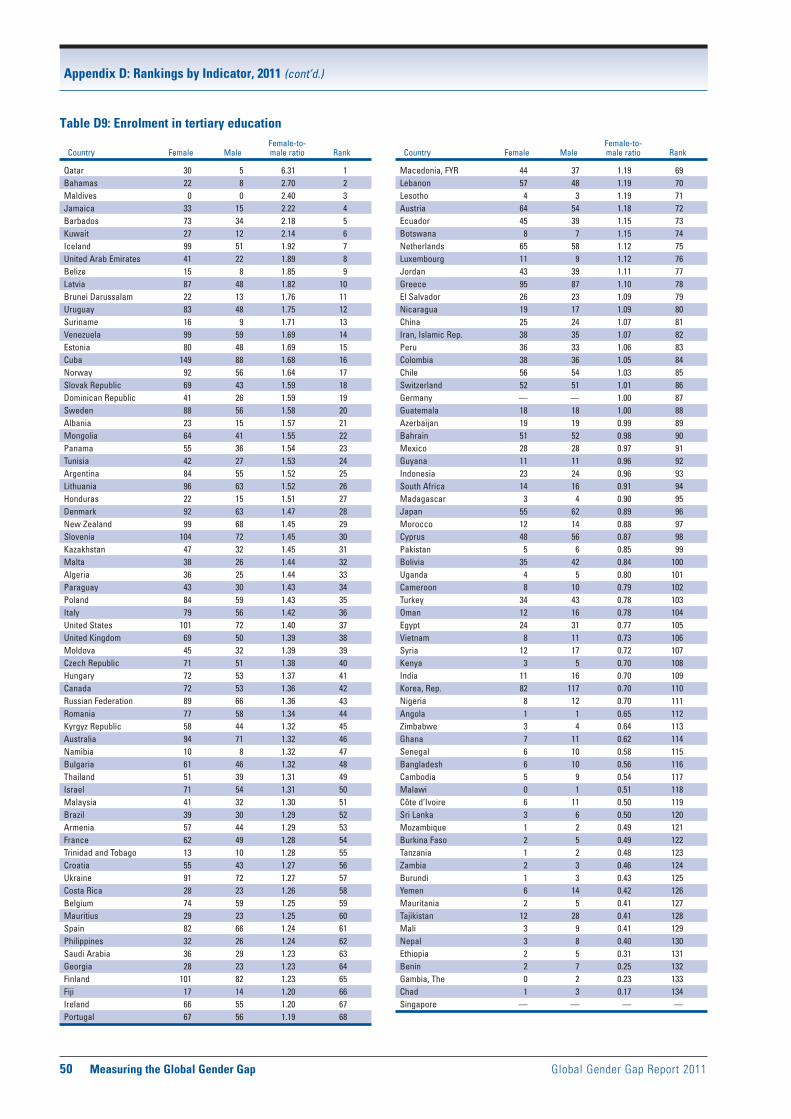
50 Measuring the Global Gender Gap Global Gender Gap Report 2011
Appendix D: Rankings by Indicator, 2011 (cont’d.)
Table D9: Enrolment in tertiary education Female-to- Country Female Male male ratio Rank
Qatar 30 5 6.31 1Bahamas 22 8 2.70 2Maldives 0 0 2.40 3Jamaica 33 15 2.22 4Barbados 73 34 2.18 5Kuwait 27 12 2.14 6Iceland 99 51 1.92 7United Arab Emirates 41 22 1.89 8Belize 15 8 1.85 9Latvia 87 48 1.82 10Brunei Darussalam 22 13 1.76 11Uruguay 83 48 1.75 12Suriname 16 9 1.71 13Venezuela 99 59 1.69 14Estonia 80 48 1.69 15Cuba 149 88 1.68 16Norway 92 56 1.64 17Slovak Republic 69 43 1.59 18Dominican Republic 41 26 1.59 19Sweden 88 56 1.58 20Albania 23 15 1.57 21Mongolia 64 41 1.55 22Panama 55 36 1.54 23Tunisia 42 27 1.53 24Argentina 84 55 1.52 25Lithuania 96 63 1.52 26Honduras 22 15 1.51 27Denmark 92 63 1.47 28New Zealand 99 68 1.45 29Slovenia 104 72 1.45 30Kazakhstan 47 32 1.45 31Malta 38 26 1.44 32Algeria 36 25 1.44 33Paraguay 43 30 1.43 34Poland 84 59 1.43 35Italy 79 56 1.42 36United States 101 72 1.40 37United Kingdom 69 50 1.39 38Moldova 45 32 1.39 39Czech Republic 71 51 1.38 40Hungary 72 53 1.37 41Canada 72 53 1.36 42Russian Federation 89 66 1.36 43Romania 77 58 1.34 44Kyrgyz Republic 58 44 1.32 45Australia 94 71 1.32 46Namibia 10 8 1.32 47Bulgaria 61 46 1.32 48Thailand 51 39 1.31 49Israel 71 54 1.31 50Malaysia 41 32 1.30 51Brazil 39 30 1.29 52Armenia 57 44 1.29 53France 62 49 1.28 54Trinidad and Tobago 13 10 1.28 55Croatia 55 43 1.27 56Ukraine 91 72 1.27 57Costa Rica 28 23 1.26 58Belgium 74 59 1.25 59Mauritius 29 23 1.25 60Spain 82 66 1.24 61Philippines 32 26 1.24 62Saudi Arabia 36 29 1.23 63Georgia 28 23 1.23 64Finland 101 82 1.23 65Fiji 17 14 1.20 66Ireland 66 55 1.20 67Portugal 67 56 1.19 68
Female-to- Country Female Male male ratio Rank
Macedonia, FYR 44 37 1.19 69Lebanon 57 48 1.19 70Lesotho 4 3 1.19 71Austria 64 54 1.18 72Ecuador 45 39 1.15 73Botswana 8 7 1.15 74Netherlands 65 58 1.12 75Luxembourg 11 9 1.12 76Jordan 43 39 1.11 77Greece 95 87 1.10 78El Salvador 26 23 1.09 79Nicaragua 19 17 1.09 80China 25 24 1.07 81Iran, Islamic Rep. 38 35 1.07 82Peru 36 33 1.06 83Colombia 38 36 1.05 84Chile 56 54 1.03 85Switzerland 52 51 1.01 86Germany — — 1.00 87Guatemala 18 18 1.00 88Azerbaijan 19 19 0.99 89Bahrain 51 52 0.98 90Mexico 28 28 0.97 91Guyana 11 11 0.96 92Indonesia 23 24 0.96 93South Africa 14 16 0.91 94Madagascar 3 4 0.90 95Japan 55 62 0.89 96Morocco 12 14 0.88 97Cyprus 48 56 0.87 98Pakistan 5 6 0.85 99Bolivia 35 42 0.84 100Uganda 4 5 0.80 101Cameroon 8 10 0.79 102Turkey 34 43 0.78 103Oman 12 16 0.78 104Egypt 24 31 0.77 105Vietnam 8 11 0.73 106Syria 12 17 0.72 107Kenya 3 5 0.70 108India 11 16 0.70 109Korea, Rep. 82 117 0.70 110Nigeria 8 12 0.70 111Angola 1 1 0.65 112Zimbabwe 3 4 0.64 113Ghana 7 11 0.62 114Senegal 6 10 0.58 115Bangladesh 6 10 0.56 116Cambodia 5 9 0.54 117Malawi 0 1 0.51 118Côte d’Ivoire 6 11 0.50 119Sri Lanka 3 6 0.50 120Mozambique 1 2 0.49 121Burkina Faso 2 5 0.49 122Tanzania 1 2 0.48 123Zambia 2 3 0.46 124Burundi 1 3 0.43 125Yemen 6 14 0.42 126Mauritania 2 5 0.41 127Tajikistan 12 28 0.41 128Mali 3 9 0.41 129Nepal 3 8 0.40 130Ethiopia 2 5 0.31 131Benin 2 7 0.25 132Gambia, The 0 2 0.23 133Chad 1 3 0.17 134Singapore — — — —
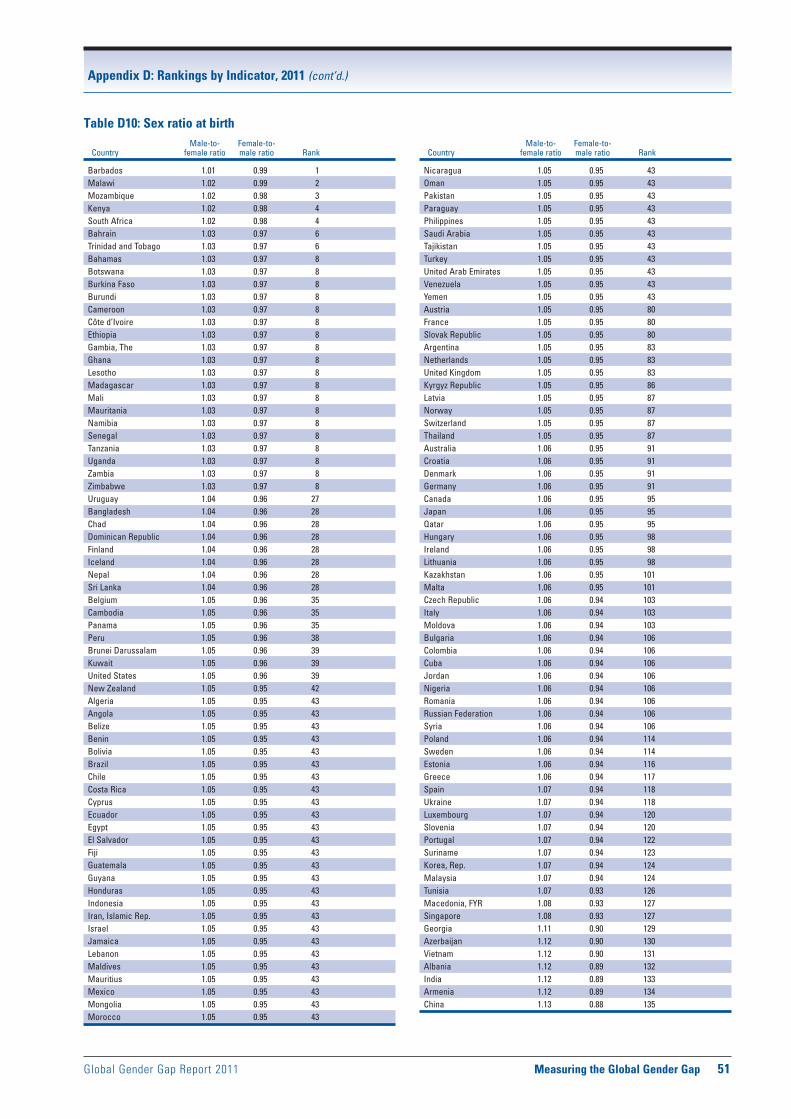
Global Gender Gap Report 2011 Measuring the Global Gender Gap 51
Appendix D: Rankings by Indicator, 2011 (cont’d.)
Table D10: Sex ratio at birth Male-to- Female-to- Country female ratio male ratio Rank
Barbados 1.01 0.99 1Malawi 1.02 0.99 2Mozambique 1.02 0.98 3Kenya 1.02 0.98 4South Africa 1.02 0.98 4Bahrain 1.03 0.97 6Trinidad and Tobago 1.03 0.97 6Bahamas 1.03 0.97 8Botswana 1.03 0.97 8Burkina Faso 1.03 0.97 8Burundi 1.03 0.97 8Cameroon 1.03 0.97 8Côte d’Ivoire 1.03 0.97 8Ethiopia 1.03 0.97 8Gambia, The 1.03 0.97 8Ghana 1.03 0.97 8Lesotho 1.03 0.97 8Madagascar 1.03 0.97 8Mali 1.03 0.97 8Mauritania 1.03 0.97 8Namibia 1.03 0.97 8Senegal 1.03 0.97 8Tanzania 1.03 0.97 8Uganda 1.03 0.97 8Zambia 1.03 0.97 8Zimbabwe 1.03 0.97 8Uruguay 1.04 0.96 27Bangladesh 1.04 0.96 28Chad 1.04 0.96 28Dominican Republic 1.04 0.96 28Finland 1.04 0.96 28Iceland 1.04 0.96 28Nepal 1.04 0.96 28Sri Lanka 1.04 0.96 28Belgium 1.05 0.96 35Cambodia 1.05 0.96 35Panama 1.05 0.96 35Peru 1.05 0.96 38Brunei Darussalam 1.05 0.96 39Kuwait 1.05 0.96 39United States 1.05 0.96 39New Zealand 1.05 0.95 42Algeria 1.05 0.95 43Angola 1.05 0.95 43Belize 1.05 0.95 43Benin 1.05 0.95 43Bolivia 1.05 0.95 43Brazil 1.05 0.95 43Chile 1.05 0.95 43Costa Rica 1.05 0.95 43Cyprus 1.05 0.95 43Ecuador 1.05 0.95 43Egypt 1.05 0.95 43El Salvador 1.05 0.95 43Fiji 1.05 0.95 43Guatemala 1.05 0.95 43Guyana 1.05 0.95 43Honduras 1.05 0.95 43Indonesia 1.05 0.95 43Iran, Islamic Rep. 1.05 0.95 43Israel 1.05 0.95 43Jamaica 1.05 0.95 43Lebanon 1.05 0.95 43Maldives 1.05 0.95 43Mauritius 1.05 0.95 43Mexico 1.05 0.95 43Mongolia 1.05 0.95 43Morocco 1.05 0.95 43
Male-to- Female-to- Country female ratio male ratio Rank
Nicaragua 1.05 0.95 43Oman 1.05 0.95 43Pakistan 1.05 0.95 43Paraguay 1.05 0.95 43Philippines 1.05 0.95 43Saudi Arabia 1.05 0.95 43Tajikistan 1.05 0.95 43Turkey 1.05 0.95 43United Arab Emirates 1.05 0.95 43Venezuela 1.05 0.95 43Yemen 1.05 0.95 43Austria 1.05 0.95 80France 1.05 0.95 80Slovak Republic 1.05 0.95 80Argentina 1.05 0.95 83Netherlands 1.05 0.95 83United Kingdom 1.05 0.95 83Kyrgyz Republic 1.05 0.95 86Latvia 1.05 0.95 87Norway 1.05 0.95 87Switzerland 1.05 0.95 87Thailand 1.05 0.95 87Australia 1.06 0.95 91Croatia 1.06 0.95 91Denmark 1.06 0.95 91Germany 1.06 0.95 91Canada 1.06 0.95 95Japan 1.06 0.95 95Qatar 1.06 0.95 95Hungary 1.06 0.95 98Ireland 1.06 0.95 98Lithuania 1.06 0.95 98Kazakhstan 1.06 0.95 101Malta 1.06 0.95 101Czech Republic 1.06 0.94 103Italy 1.06 0.94 103Moldova 1.06 0.94 103Bulgaria 1.06 0.94 106Colombia 1.06 0.94 106Cuba 1.06 0.94 106Jordan 1.06 0.94 106Nigeria 1.06 0.94 106Romania 1.06 0.94 106Russian Federation 1.06 0.94 106Syria 1.06 0.94 106Poland 1.06 0.94 114Sweden 1.06 0.94 114Estonia 1.06 0.94 116Greece 1.06 0.94 117Spain 1.07 0.94 118Ukraine 1.07 0.94 118Luxembourg 1.07 0.94 120Slovenia 1.07 0.94 120Portugal 1.07 0.94 122Suriname 1.07 0.94 123Korea, Rep. 1.07 0.94 124Malaysia 1.07 0.94 124Tunisia 1.07 0.93 126Macedonia, FYR 1.08 0.93 127Singapore 1.08 0.93 127Georgia 1.11 0.90 129Azerbaijan 1.12 0.90 130Vietnam 1.12 0.90 131Albania 1.12 0.89 132India 1.12 0.89 133Armenia 1.12 0.89 134China 1.13 0.88 135

52 Measuring the Global Gender Gap Global Gender Gap Report 2011
Appendix D: Rankings by Indicator, 2011 (cont’d.)
Table D11: Healthy life expectancy Female-to- Country Female Male male ratio Rank
Russian Federation 65 55 1.18 1Lithuania 68 58 1.17 2Estonia 71 61 1.16 3Ukraine 64 55 1.16 4Latvia 68 59 1.15 5Kazakhstan 60 53 1.13 6Mongolia 62 55 1.13 7Hungary 69 62 1.11 8Belize 63 57 1.11 9Suriname 64 58 1.10 10Thailand 65 59 1.10 11Bulgaria 69 63 1.10 12Poland 70 64 1.09 13Slovak Republic 70 64 1.09 13Uruguay 70 64 1.09 13Korea, Rep. 74 68 1.09 16El Salvador 63 58 1.09 17Moldova 63 58 1.09 17Philippines 64 59 1.08 19Trinidad and Tobago 64 59 1.08 19Georgia 67 62 1.08 21Bahamas 68 63 1.08 22Romania 68 63 1.08 22Lesotho 41 38 1.08 24Cambodia 55 51 1.08 25Argentina 69 64 1.08 26Colombia 69 64 1.08 26Chile 72 67 1.07 28Uganda 44 41 1.07 29Kyrgyz Republic 59 55 1.07 30Slovenia 74 69 1.07 31Finland 75 70 1.07 32France 76 71 1.07 33Spain 76 71 1.07 33Guatemala 62 58 1.07 35Japan 78 73 1.07 36Angola 47 44 1.07 37Armenia 63 59 1.07 38Côte d’Ivoire 48 45 1.07 39Fiji 64 60 1.07 39Lebanon 64 60 1.07 39Mauritius 65 61 1.07 42Sri Lanka 65 61 1.07 42Brazil 66 62 1.06 44Jamaica 66 62 1.06 44Malaysia 66 62 1.06 44Vietnam 66 62 1.06 44Venezuela 68 64 1.06 48Barbados 69 65 1.06 49Mexico 69 65 1.06 49Mauritania 52 49 1.06 51Croatia 70 66 1.06 52Gambia, The 53 50 1.06 53Czech Republic 72 68 1.06 54United States 72 68 1.06 54Portugal 73 69 1.06 56Guyana 55 52 1.06 57Austria 74 70 1.06 58Belgium 74 70 1.06 58Canada 75 71 1.06 60Germany 75 71 1.06 60Luxembourg 75 71 1.06 60Singapore 75 71 1.06 60Egypt 62 59 1.05 64Honduras 64 61 1.05 65Saudi Arabia 64 61 1.05 65Mali 43 41 1.05 67Syria 65 62 1.05 68
Female-to- Country Female Male male ratio Rank
Ecuador 66 63 1.05 69Nicaragua 66 63 1.05 69Paraguay 66 63 1.05 69Oman 67 64 1.05 72Turkey 67 64 1.05 72China 68 65 1.05 74Panama 68 65 1.05 74Costa Rica 71 68 1.04 76Cuba 71 68 1.04 76Denmark 73 70 1.04 78Greece 74 71 1.04 79Ireland 74 71 1.04 79Malta 74 71 1.04 79Australia 75 72 1.04 82Sweden 75 72 1.04 82Italy 76 73 1.04 84Switzerland 76 73 1.04 84Ethiopia 51 49 1.04 86Senegal 52 50 1.04 87Madagascar 53 51 1.04 88Yemen 55 53 1.04 89Bolivia 59 57 1.04 90Iran, Islamic Rep. 62 60 1.03 91Morocco 63 61 1.03 92Dominican Republic 64 62 1.03 93Jordan 64 62 1.03 93Tunisia 67 65 1.03 95Cyprus 71 69 1.03 96United Kingdom 73 71 1.03 97Israel 74 72 1.03 98Netherlands 74 72 1.03 98New Zealand 74 72 1.03 98Norway 74 72 1.03 98Iceland 75 73 1.03 102Zambia 40 39 1.03 103Burkina Faso 43 42 1.02 104Burundi 43 42 1.02 104Malawi 44 43 1.02 106Kenya 48 47 1.02 107South Africa 48 47 1.02 107Ghana 50 49 1.02 109Namibia 53 52 1.02 110India 57 56 1.02 111Azerbaijan 60 59 1.02 112Indonesia 61 60 1.02 113Algeria 63 62 1.02 114Macedonia, FYR 66 65 1.02 115Brunei Darussalam 67 66 1.02 116Peru 67 66 1.02 116Albania 64 64 1.00 118Bahrain 66 66 1.00 118Benin 50 50 1.00 118Cameroon 45 45 1.00 118Chad 40 40 1.00 118Kuwait 69 69 1.00 118Maldives 64 64 1.00 118Mozambique 42 42 1.00 118Nepal 55 55 1.00 118Nigeria 42 42 1.00 118Tanzania 45 45 1.00 118United Arab Emirates 68 68 1.00 118Tajikistan 57 58 0.98 130Bangladesh 55 56 0.98 131Pakistan 55 56 0.98 131Botswana 48 49 0.98 133Qatar 66 68 0.97 134Zimbabwe 38 40 0.95 135

Global Gender Gap Report 2011 Measuring the Global Gender Gap 53
Appendix D: Rankings by Indicator, 2011 (cont’d.)
Table D12: Women in parliament Female-to- Country Female Male male ratio Rank
Sweden 45 55 0.82 1South Africa 45 56 0.80 2Cuba 43 57 0.76 3Iceland 43 57 0.75 4Finland 43 58 0.74 5Norway 40 60 0.66 6Netherlands 39 61 0.65 7Belgium 39 61 0.65 7Mozambique 39 61 0.64 9Costa Rica 39 61 0.63 10Angola 39 61 0.63 10Argentina 39 62 0.63 12Denmark 38 62 0.61 13Spain 37 63 0.58 14Tanzania 36 64 0.56 15Uganda 35 65 0.54 16New Zealand 34 66 0.51 17Nepal 33 67 0.50 18Germany 33 67 0.49 19Ecuador 32 68 0.48 20Burundi 32 68 0.47 21Macedonia, FYR 31 69 0.45 22Guyana 30 70 0.43 23Switzerland 29 71 0.41 24Trinidad and Tobago 29 71 0.40 25Austria 28 72 0.39 26Ethiopia 28 72 0.39 27Tunisia 28 72 0.38 28Portugal 27 74 0.36 29Mexico 26 74 0.36 30Bolivia 25 75 0.34 31Canada 25 75 0.33 32Australia 25 75 0.33 32Vietnam 24 76 0.32 34Namibia 24 76 0.32 34Lesotho 24 76 0.32 36Croatia 24 77 0.31 37Kyrgyz Republic 23 77 0.30 38Senegal 23 77 0.29 39United Arab Emirates 23 78 0.29 40Singapore 22 78 0.29 41Pakistan 22 78 0.29 41Philippines 22 78 0.28 43Mauritania 22 78 0.28 43United Kingdom 22 78 0.28 45Czech Republic 22 78 0.28 45Peru 22 79 0.27 47Italy 21 79 0.27 48China 21 79 0.27 48Cambodia 21 79 0.27 50Malawi 21 79 0.26 51Dominican Republic 21 79 0.26 51Bulgaria 21 79 0.26 51Nicaragua 21 79 0.26 54Poland 20 80 0.25 55Luxembourg 20 80 0.25 55Latvia 20 80 0.25 55Estonia 20 80 0.25 58Israel 19 81 0.24 59Lithuania 19 81 0.24 60Tajikistan 19 81 0.23 61El Salvador 19 81 0.23 61France 19 81 0.23 63Moldova 19 81 0.23 64Mauritius 19 81 0.23 64Bangladesh 19 81 0.23 66Indonesia 18 82 0.22 67Honduras 18 82 0.22 67
Female-to- Country Female Male male ratio Rank
Kazakhstan 18 82 0.22 69Greece 17 83 0.21 70Venezuela 17 83 0.20 71United States 17 83 0.20 72Albania 16 84 0.20 73Slovak Republic 16 84 0.19 74Azerbaijan 16 84 0.19 74Burkina Faso 15 85 0.18 76Uruguay 15 85 0.18 77Zimbabwe 15 85 0.18 78Korea, Rep. 15 85 0.17 79Ireland 15 86 0.17 80Slovenia 14 86 0.17 81Turkey 14 86 0.17 82Chile 14 86 0.17 82Zambia 14 86 0.16 84Russian Federation 14 86 0.16 84Cameroon 14 86 0.16 86Thailand 13 87 0.15 87Jamaica 13 87 0.15 87Chad 13 87 0.15 89Colombia 13 87 0.15 90Paraguay 13 88 0.14 91Madagascar 13 88 0.14 91Syria 12 88 0.14 93Bahamas 12 88 0.14 94Guatemala 12 88 0.14 95Romania 11 89 0.13 96Japan 11 89 0.13 97Jordan 11 89 0.12 98India 11 89 0.12 98Cyprus 11 89 0.12 100Morocco 11 90 0.12 101Mali 10 90 0.11 102Barbados 10 90 0.11 103Malaysia 10 90 0.11 104Suriname 10 90 0.11 105Kenya 10 90 0.11 105Armenia 9 91 0.10 107Hungary 9 91 0.10 108Côte d’Ivoire 9 91 0.10 109Malta 9 91 0.10 110Brazil 9 91 0.09 111Panama 9 92 0.09 112Benin 8 92 0.09 113Ghana 8 92 0.09 114Ukraine 8 92 0.09 115Botswana 8 92 0.09 116Kuwait 8 92 0.08 117Algeria 8 92 0.08 117Gambia, The 8 93 0.08 119Maldives 7 94 0.07 120Georgia 7 94 0.07 120Sri Lanka 6 94 0.06 122Mongolia 4 96 0.04 123Nigeria 4 96 0.04 124Lebanon 3 97 0.03 125Iran, Islamic Rep. 3 97 0.03 126Bahrain 3 98 0.03 127Egypt 2 98 0.02 128Yemen 0 100 0.00 129Saudi Arabia 0 100 0.00 130Qatar 0 100 0.00 130Oman 0 100 0.00 130Belize 0 100 0.00 130Brunei Darussalam — — — —Fiji — — — —

54 Measuring the Global Gender Gap Global Gender Gap Report 2011
Appendix D: Rankings by Indicator, 2011 (cont’d.)
Table D13: Women in ministerial positions Female-to- Country Female Male male ratio Rank
Finland 63 37 1.71 1Spain 53 47 1.13 2Norway 53 47 1.11 3Chile 45 55 0.83 4Iceland 45 55 0.83 4Sweden 45 55 0.82 6Switzerland 43 57 0.75 7Denmark 42 58 0.73 8Austria 38 62 0.63 9Nicaragua 38 62 0.63 9Honduras 36 64 0.56 11Costa Rica 35 65 0.54 12Trinidad and Tobago 34 66 0.53 13South Africa 34 66 0.52 14Belgium 33 67 0.50 15Germany 33 67 0.50 15United States 33 67 0.50 15Ecuador 33 68 0.48 18Uganda 32 68 0.47 19Lesotho 32 68 0.46 20Gambia, The 31 69 0.45 21Greece 31 69 0.45 21Guyana 31 69 0.45 21Portugal 31 69 0.45 21Canada 30 70 0.42 25Burundi 29 71 0.40 26New Zealand 29 71 0.40 26Angola 28 72 0.38 28Poland 28 72 0.38 28Malawi 27 73 0.38 30Tanzania 27 73 0.37 31Luxembourg 27 73 0.36 32Panama 27 73 0.36 32France 26 74 0.36 34Mozambique 26 74 0.35 35Venezuela 26 74 0.35 35Cuba 25 75 0.33 37Malta 25 75 0.33 37Namibia 24 76 0.32 39Netherlands 24 76 0.31 40Australia 23 77 0.30 41Mauritania 23 77 0.30 42United Kingdom 23 77 0.29 43Peru 22 78 0.29 44Slovenia 22 78 0.29 44Italy 22 78 0.28 46Paraguay 22 78 0.28 46Ghana 22 78 0.28 48Colombia 21 79 0.27 49Ireland 21 79 0.27 49Latvia 21 79 0.27 49Mali 21 79 0.27 49Uruguay 21 79 0.27 49Argentina 20 80 0.25 54Bolivia 20 80 0.25 54Zimbabwe 19 81 0.23 56Burkina Faso 18 82 0.22 57Bulgaria 18 82 0.21 58Czech Republic 18 82 0.21 58Madagascar 17 83 0.21 60Suriname 17 83 0.20 61Russian Federation 17 83 0.20 62United Arab Emirates 17 83 0.20 62Zambia 17 83 0.20 62Bangladesh 16 84 0.19 65Croatia 16 84 0.19 66El Salvador 15 85 0.18 67Kenya 15 85 0.18 68
Female-to- Country Female Male male ratio Rank
Indonesia 14 86 0.17 69Lithuania 14 86 0.17 69Philippines 14 86 0.16 71Benin 13 87 0.15 72Slovak Republic 13 87 0.15 72Senegal 13 87 0.15 74Côte d’Ivoire 13 88 0.14 75Jamaica 13 88 0.14 75Korea, Rep. 13 88 0.14 75Thailand 13 88 0.14 75Botswana 12 88 0.13 79Cameroon 12 88 0.13 79Japan 12 88 0.13 79China 12 88 0.13 82Armenia 11 89 0.13 83Morocco 11 89 0.13 83Bahrain 11 89 0.12 85Mexico 11 89 0.12 86India 10 90 0.11 87Kyrgyz Republic 10 90 0.11 87Mauritius 10 90 0.11 87Cambodia 10 90 0.11 90Nigeria 10 90 0.11 90Macedonia, FYR 10 90 0.11 92Egypt 9 91 0.10 93Oman 9 91 0.10 93Cyprus 9 91 0.10 95Fiji 9 91 0.10 95Dominican Republic 9 91 0.10 97Estonia 8 92 0.09 98Nepal 8 92 0.08 99Turkey 8 92 0.08 99Pakistan 8 93 0.08 101Ethiopia 7 93 0.08 102Brazil 7 93 0.08 103Mongolia 7 93 0.08 103Chad 7 93 0.07 105Jordan 7 93 0.07 105Lebanon 7 93 0.07 105Albania 7 93 0.07 108Israel 7 93 0.07 108Kuwait 7 93 0.07 108Malaysia 7 93 0.07 108Maldives 7 93 0.07 108Romania 6 94 0.07 113Syria 6 94 0.07 113Sri Lanka 6 94 0.06 115Tajikistan 6 94 0.06 115Yemen 6 94 0.06 115Barbados 6 94 0.06 118Georgia 6 94 0.06 118Moldova 5 95 0.06 120Kazakhstan 5 95 0.05 121Singapore 5 95 0.05 121Ukraine 4 96 0.05 123Vietnam 4 96 0.04 124Tunisia 4 96 0.04 125Algeria 4 96 0.04 126Iran, Islamic Rep. 3 97 0.03 127Azerbaijan 3 97 0.03 128Bahamas 0 100 0.00 129Belize 0 100 0.00 129Brunei Darussalam 0 100 0.00 129Guatemala 0 100 0.00 129Hungary 0 100 0.00 129Qatar 0 100 0.00 129Saudi Arabia 0 100 0.00 129
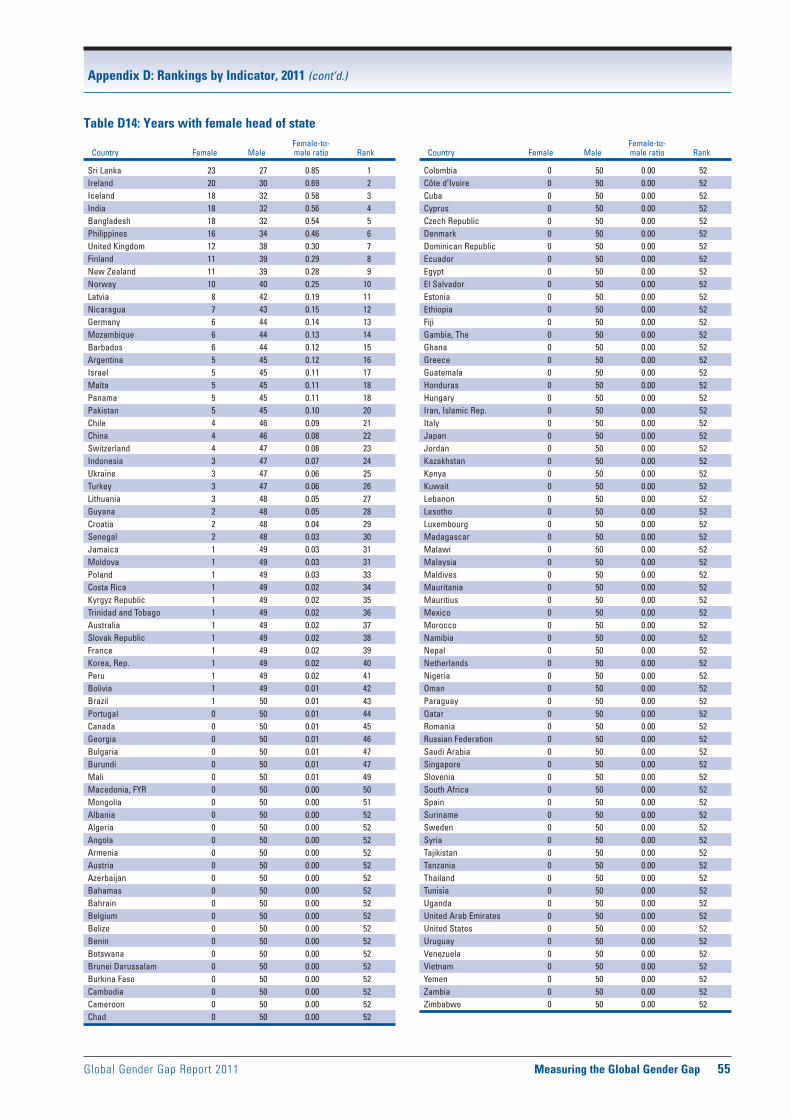
Global Gender Gap Report 2011 Measuring the Global Gender Gap 55
Appendix D: Rankings by Indicator, 2011 (cont’d.)
Table D14: Years with female head of state Female-to- Country Female Male male ratio Rank
Sri Lanka 23 27 0.85 1Ireland 20 30 0.69 2Iceland 18 32 0.58 3India 18 32 0.56 4Bangladesh 18 32 0.54 5Philippines 16 34 0.46 6United Kingdom 12 38 0.30 7Finland 11 39 0.29 8New Zealand 11 39 0.28 9Norway 10 40 0.25 10Latvia 8 42 0.19 11Nicaragua 7 43 0.15 12Germany 6 44 0.14 13Mozambique 6 44 0.13 14Barbados 6 44 0.12 15Argentina 5 45 0.12 16Israel 5 45 0.11 17Malta 5 45 0.11 18Panama 5 45 0.11 18Pakistan 5 45 0.10 20Chile 4 46 0.09 21China 4 46 0.08 22Switzerland 4 47 0.08 23Indonesia 3 47 0.07 24Ukraine 3 47 0.06 25Turkey 3 47 0.06 26Lithuania 3 48 0.05 27Guyana 2 48 0.05 28Croatia 2 48 0.04 29Senegal 2 48 0.03 30Jamaica 1 49 0.03 31Moldova 1 49 0.03 31Poland 1 49 0.03 33Costa Rica 1 49 0.02 34Kyrgyz Republic 1 49 0.02 35Trinidad and Tobago 1 49 0.02 36Australia 1 49 0.02 37Slovak Republic 1 49 0.02 38France 1 49 0.02 39Korea, Rep. 1 49 0.02 40Peru 1 49 0.02 41Bolivia 1 49 0.01 42Brazil 1 50 0.01 43Portugal 0 50 0.01 44Canada 0 50 0.01 45Georgia 0 50 0.01 46Bulgaria 0 50 0.01 47Burundi 0 50 0.01 47Mali 0 50 0.01 49Macedonia, FYR 0 50 0.00 50Mongolia 0 50 0.00 51Albania 0 50 0.00 52Algeria 0 50 0.00 52Angola 0 50 0.00 52Armenia 0 50 0.00 52Austria 0 50 0.00 52Azerbaijan 0 50 0.00 52Bahamas 0 50 0.00 52Bahrain 0 50 0.00 52Belgium 0 50 0.00 52Belize 0 50 0.00 52Benin 0 50 0.00 52Botswana 0 50 0.00 52Brunei Darussalam 0 50 0.00 52Burkina Faso 0 50 0.00 52Cambodia 0 50 0.00 52Cameroon 0 50 0.00 52Chad 0 50 0.00 52
Female-to- Country Female Male male ratio Rank
Colombia 0 50 0.00 52Côte d’Ivoire 0 50 0.00 52Cuba 0 50 0.00 52Cyprus 0 50 0.00 52Czech Republic 0 50 0.00 52Denmark 0 50 0.00 52Dominican Republic 0 50 0.00 52Ecuador 0 50 0.00 52Egypt 0 50 0.00 52El Salvador 0 50 0.00 52Estonia 0 50 0.00 52Ethiopia 0 50 0.00 52Fiji 0 50 0.00 52Gambia, The 0 50 0.00 52Ghana 0 50 0.00 52Greece 0 50 0.00 52Guatemala 0 50 0.00 52Honduras 0 50 0.00 52Hungary 0 50 0.00 52Iran, Islamic Rep. 0 50 0.00 52Italy 0 50 0.00 52Japan 0 50 0.00 52Jordan 0 50 0.00 52Kazakhstan 0 50 0.00 52Kenya 0 50 0.00 52Kuwait 0 50 0.00 52Lebanon 0 50 0.00 52Lesotho 0 50 0.00 52Luxembourg 0 50 0.00 52Madagascar 0 50 0.00 52Malawi 0 50 0.00 52Malaysia 0 50 0.00 52Maldives 0 50 0.00 52Mauritania 0 50 0.00 52Mauritius 0 50 0.00 52Mexico 0 50 0.00 52Morocco 0 50 0.00 52Namibia 0 50 0.00 52Nepal 0 50 0.00 52Netherlands 0 50 0.00 52Nigeria 0 50 0.00 52Oman 0 50 0.00 52Paraguay 0 50 0.00 52Qatar 0 50 0.00 52Romania 0 50 0.00 52Russian Federation 0 50 0.00 52Saudi Arabia 0 50 0.00 52Singapore 0 50 0.00 52Slovenia 0 50 0.00 52South Africa 0 50 0.00 52Spain 0 50 0.00 52Suriname 0 50 0.00 52Sweden 0 50 0.00 52Syria 0 50 0.00 52Tajikistan 0 50 0.00 52Tanzania 0 50 0.00 52Thailand 0 50 0.00 52Tunisia 0 50 0.00 52Uganda 0 50 0.00 52United Arab Emirates 0 50 0.00 52United States 0 50 0.00 52Uruguay 0 50 0.00 52Venezuela 0 50 0.00 52Vietnam 0 50 0.00 52Yemen 0 50 0.00 52Zambia 0 50 0.00 52Zimbabwe 0 50 0.00 52

56 Measuring the Global Gender Gap Global Gender Gap Report 2011
Appendix E: Policy Frameworks for Gender Equality
The magnitude and type of gender gaps in countries around the world are the combined result of various socioeconomic and cultural variables. Policy can play a key role in influencing gender equality, both negatively and positively. In particular, those policies that influ-ence whether and how women can combine work with family can be one of the drivers of women’s economic participation.
In order to complement the data presented in this Report and to build a more comprehensive picture of the policy environment, the World Economic Forum has conducted a new survey of national policy frameworks relating to parental leave, availability of childcare, type of taxation and workplace equality.
The survey targeted ministries of women’s affairs or ministries with similar portfolios (e.g., ministries of social development, ministries of family policies) based on an extensive database of the relevant ministries compiled by a research team at the Council of Women World Leaders in Washington, DC. The survey was carried out by expert officers within the ministries, who in many cases col-laborated with other applicable ministries in the country (e.g., ministries of finance or of welfare) for questions that cut across the domain of responsibility of more than one ministry.
The survey contained over 30 questions covering four relevant themes: family leave, daycare assistance, taxa-tion system and equality and work.
• Familyleave: Maternity, paternity and parental leave—or any other type of additional shared leave—are closely associated with women’s economic par-ticipation in many parts of the world and are thus an important element of policies aimed at a more effi-cient use of a country’s human capital pool.1
• Childcareassistance: Childcare is an important factor in allowing women to reconcile professional and family obligations because women tend to bear the majority of the caregiving responsibility in the majority of countries. For example, a well-established daycare system can be a long-term investment that supports women in employment, thereby improving the efficiency of labour markets. In some parts of the developed world, research has shown that daycare assistance may impact fertility rates.2
• Taxationsystem: Tax legislation may contain potentially discriminatory provisions that treat men and women differently.3 For example, gender-biased taxation might alter the disposable income available to men and women in a family and thus may have implications for the economic and social decision-making at the household level.
• Equalityandwork: Legislative structures may help prevent gender-based discrimination in society and create an ecosystem of support for women through, among other policies, obligatory and voluntary quotas in public and private entities, targeted subsidies to female businesses and supervisory bodies monitoring the implementation of national policies.
The full set survey questions are displayed in Box 1. Given the substantial differences of national policy sys-tems around the world, the survey was designed to pres-ent both quantitative and qualitative data. The survey’s goal was solely to provide country-level information on national policies with possible gender implications; we do not aim to benchmark countries on policy-making crite-ria. The survey concepts and design were created with the valuable input of the OECD Development Centre, the Nordic Gender Institute, the ILO, the Ministry of Foreign Affairs of Sweden and the Council of Women World Leaders.
Over 130 countries were targeted; responses were obtained from 59 ministries, including those in Albania, Armenia, Australia, Austria, Azerbaijan, Bahamas, Barbados, Belgium, Bulgaria, Canada, Chile, Colombia, Costa Rica, Croatia, Cyprus, Czech Republic, Denmark, Dominican Republic, Estonia, Ethiopia, Finland, Germany, Greece, Iceland, Ireland, Israel, Jamaica, Japan, Korea, Rep., Kuwait, Latvia, Lesotho, Liberia, Lithuania, Luxembourg, Madagascar, Malaysia, Mali, Malta, Mauritius, Mexico, Moldova, Namibia, Netherlands, New Zealand, Norway, Philippines, Portugal, the Russian Federation, the Slovak Republic, Slovenia, Spain, Suriname, Sweden, Switzerland, Turkey, the United Arab Emirates, the United Kingdom and the United States. The survey collection process was implemented over a three-month period whereby the World Economic Forum worked in close collaboration with the Council of Women World Leaders. When surveys were partially completed and when relevant supplemental information
This appendix was written by Saadia Zahidi and Silvia Magnoni, World Economic Forum. We are deeply grateful for the support of Laura Liswood, Heather McAuliffe and Maren Maland at the Council of Women World Leaders.
Global Gender Gap Report 2011 Measuring the Global Gender Gap 57
Appendix E: Policy Frameworks for Gender Equality (cont’d.)
was available through other sources, internal research was carried out to complete the database.
TableE1 displays the complete set of responses obtained in relation to family leave.
FigureE1 displays the accumulated length of time available in the form of leave to the mother, to the father or to either parent. In order to create this chart we have interpreted some of the data in order to harmonize and compare within countries. However, comparisons should not be made across countries as data are not strictly com-parable across countries. All leave available to one specific parent are grouped under one category, independently of the nature of such leave (e.g., maternity leave and parental leave available to the mother only have been grouped in the same category). Child sick leave, breastfeeding leave, annual leave, vacation leave and other leave of a similar nature are not accounted for in the figure. Both paid and unpaid leave were taken into account. The calculations include ordinary leave only; special cases (e.g., adop-tion, difficult pregnancy, more than one child) are not considered. When data are provided in days and no spe-cific indication is given by respondents (calendar days vs. working days), we assumed that numbers refer to work-ing days. When a country presents different figures for the same leave in the public and in the private sector, the sector with the highest figure is taken into account. In the case of federated states, federally mandated provisions only are included in the computation. Countries without a federally mandated legislation for maternity/paternity/parental leaves are thus not considered (e.g., the United States). When the application of these criteria did not allow for clear interpretation, countries were excluded (e.g., Moldova).
FigureE2shows the prevalence of different types of childcare systems among the 59 countries covered in the survey.
TableE2 displays the responses obtained on questions relating to the country’s type of taxation system. Individual taxation tends to be most favourable for women; joint taxa-tion tends to be least favourable. Income-splitting is a form of family taxation where income can be transferred to fam-ily members with more favourable tax brackets (with limits defined by attribution rules).
TableE3 and FiguresE3throughE9 display the results on all equality- and work-related questions in the survey.
Notes 1 World Economic Forum, The Global Gender Gap Report 2010,
http://www3.weforum.org/docs/WEF_GenderGap_Report_2010.pdf.
2 OECD (2011), Doing Better for Families, www.oecd.org/social/family/doingbetter.
3 For more information on the taxation and gender equality nexus, please see OECD, Gender and Taxation: Why care about Taxation and Gender Equality? http://www.oecd.org/dataoecd/47/39/ 44896295.pdf.

58 Measuring the Global Gender Gap Global Gender Gap Report 2011
Appendix E: Policy Frameworks for Gender Equality (cont’d.)
Box 1: Survey Questions
CONTACT INFORMATION
• Name of the country• Name of the Ministry• Respondent’s name• Department name
FAMILY LEAVE
• During the first year after a child’s birth:1
— Does your country provide mandatory maternity leave and how long is it? [Mothers only: Leave from work that a woman is entitled to take before, at and after the time that she gives birth]
— Does your country provide paternity leave and how long is it? [Fathers only: Leave from work that a man is entitled to take after the birth of a child or within a short period thereafter, simultaneously with the mother’s leave]
— Does your country provide any remaining leave (i.e. parental leave) that can be used by either parent to take care of an infant, and how long is it?
• Maternity leave: what percentage of mothers use maternity leave and return to work after the birth of the first child in 2000 and 2010? Please indicate if your answer is based on data or opinion.
• Paternity leave: what is the percentage of working fathers who benefited from paternity leave in 2000 and 2010? Please indicate if your answer is based on data or opinion.
• Additional leave: what is the share of take-out of additional shared leave days (i.e. parental leave, home-care leave, family leave) between mothers and fathers in 2000 and 2010? Please indicate if your answer is based on data or opinion.
• What is on average the percentage of wage paid during:
— Maternity leave? Please explain if the payment varies according to specific variables (i.e. length of the period of leave, collective agreements, ceilings)
— Paternity leave? Please explain if the payment varies according to specific variables (i.e. length of the period of leave, collective agreements, ceilings)
— Any other additional shared leave (i.e. parental leave, home-care leave, family leave)? Are they paid or unpaid? Please explain if there are differences between the mother and the father’s pay percentage.
• Who is the provider (social security and/or employer; other) of the wage/benefits disbursed under maternity and/or paternity and/or shared leave coverage?
• Are all organizations and/or sectors in your country subjected to these policies (i.e. private sector, public sector, self-employed parents)?
• If not, please specify which organizations and/or sectors are not impacted by these policies and/or present specific excep-tions
• When were maternity and paternity leave rights introduced in your country?
CHILDCARE ASSISTANCE
• Which of these seven options does your country offer?
— Public daycare assistance—with allowance or subvention
— Public daycare assistance—without allowance or subvention
— Private daycare assistance—with allowance
— Private daycare assistance—without allowance
— Homecare assistance2—with allowance
— Homecare assistance—without allowance
— Informal family assistance3—with no allowance. Which category of assisting family members is contributing to the majority of day care duties?
• For each of these options indicate, when applicable, amount of the allowance/subvention and percentage of families with children under the age of schooling using this offer.
TAXATION SYSTEM
• Please indicate the type of tax system available at national level: individual, income-splitting,4 joint filing or other tax system for:
— Married couples
— Unmarried couples
(Cont’d.)

Global Gender Gap Report 2011 Measuring the Global Gender Gap 59
Appendix E: Policy Frameworks for Gender Equality (cont’d.)
Box 1: Survey Questions (cont’d.)
• Does your government provide any childcare deductions to married couples with children?
• If so, are childcare deductions or any other child-related allowances allocated to the mother, to the father or to both?
• Are childcare deductions or any other child-related allowances also applicable to non-married couples?
• If so, who are they allocated to: the mother, the father or both?
EQUALITY AND WORK
• Reply to each of the following questions, indicating when applicable the relevant constitutional articles or legislative provisions:
— Does your country have any legislation which prohibits discrimination on grounds of gender?
— Does your country have any legislation which stipulates specific gender-neutral practices at the workplace (e.g. equal pay for the same work, equal opportunities for recruitment, training, career advancement)? Does it apply to both the private and public sector?
— Does your country have any legislation which ensures a minimum mandatory percentage of both genders in corporate boards? If relevant, indicate the mandatory percentage.
— Does your country have any legislation which ensures a minimum mandatory percentage of both genders in parliament/other political assemblies at national, regional and local level? If relevant, indicate the mandatory percentage.
— Does your country have an authority specifically deemed to monitor the implementation of the above-mentioned legislation and/or institute legal proceedings for claims and possible compensation? If relevant, indicate the name of the authority.
— Does your country have any gender equality labels available at national level? If relevant, indicate the type of label.
— Does your country provide allowances such as tax-free allowances or any sort of subventions to female entrepreneurs? If relevant, indicate the type(s) of allowances/subventions and the number of women entrepreneurs who have benefited from these allowances in 2010 (or any other year, for which statistics are available).
Note: The grey highlights indicate those questions in the survey that have not received a critical mass of replies from respondents and that are consequently not considered in this Appendix.
Notes
1 If your country has a mandatory offer going beyond the first year after a child’s birth, please explain further.
2 One parent stays home. The other parent is working.
3 Childcare provided by members of the family. Both parents are working.
4 Income-splitting is a form of family taxation, where income can be transferred to family members with more favourable tax brackets (with limits defined by attribution rules).

60 Measuring the Global Gender Gap Global Gender Gap Report 2011
Appendix E: Policy Frameworks for Gender Equality (cont’d.)
Table E1: Maternity, paternity and additional shared leaves Table E1: Maternity, paternity and additional shared leaves (cont’d.)
Country Length of maternity leaveMaternity leave benefits
(% of wages paid) Length of paternity leave CountryPaternity leave benefits
(% of wages paid)Additional shared leave
(i.e., parental leave)Additional shared leave benefits
(% of wages paid)
Albania 5 weeks before, 6 weeks after birth. After 6 weeks of postnatal period, the woman might either work or benefit from social insurance scheme (about 52 weeks).
80% for the prenatal period and 150 days after birth; 50% for the remaining period. The maternity benefit for self-employed women is equal to the basic level of retirement pension.
— Albania — The employee who has a child up to 3 years old has the right to paid leave (max. 15 days/year when the child is sick), as well as to an additional unpaid leave (max. 30 days/year). Leave is given to the spouse who effectively cares for the child. Otherwise it’s given to both of them.
—
Armenia 140 days (70 days of pregnancy and 70 after birth).
Employed mothers who are on maternity leave receive monthly child care allowances, before the child reaches the age of 2.
— Armenia — Additional leave is provided until the child reaches the age of 3. The leave is provided to the mother, the father, the stepmother, stepfather or to the legal guardian. The husband of the pregnant woman can take an extra non-paid leave, duration of which cannot surpass 2 months.
—
Australia 52 weeks. 18 weeks at national minimum wage.
Industrial instrument entitlement for paid maternity leave: 100% of pre-birth earnings. Parental Leave Pay: National Minimum Wage.
3 weeks, concurrent with the mother’s leave.
Australia Industrial instrument entitlement for paid paternity leave: 100% of pre-birth earnings.
Up to 52 weeks, unpaid, to be shared between the mother and the father. An employee is entitled to request up to an additional 12 months’ unpaid parental leave, providing s/he has already taken (or intend to take) 12 months’ unpaid parental leave.
100
Austria 16 weeks: 8 weeks before and 8 weeks after birth.
100 — Austria — Parental leave. Employees—women and men—are entitled to parental leave until the 2nd birthday of their child, when they are living with the child in the same household.
Childcare allowance: 80% of last income, up to a ceiling. Flat-rate child care allowance is also provided.
Azerbaijan 10 weeks before, 8 weeks after birth. 100 14 days. Azerbaijan Unpaid. Parental leave for both mothers and fathers until the child reaches the age of 3.
During the first period of parental leave (until the infant reaches the age of 1.5 years old): benefits equal to 2 equivalents of minimum salary; from the age of 1.5 years old until the age of 3 years old: benefits equal to 1 equivalents of minimum salary.
Bahamas Min. 12 weeks. 33 -1/3% of insurable wage payable by the National Insurance Board. 56 -2/3% of wages payable by the employer.
— Bahamas — Family leave, unpaid, for a period not exceeding one week/year. Mothers enjoy an additional leave (6 weeks) in case of illness following the birth of the child.
Unpaid.
Barbados 12 weeks. In public service, it is practice for maternity leave to be granted for a period of up to 4 months.
— — Barbados — — —
Belgium Female employees—15 weeks: at least 1 week before birth (+ 5 optional weeks), at least 9 weeks after birth (+ max. 5 optional weeks). Independent female workers—max. 8 weeks.
Private sector: 82% for first month + 75% thereafter up to a ceiling. Public sector: statutory civil servants 100%; contracted civil servants, as for private sector.
2 weeks within 4 months after the birth of the child; not mandatory; not applicable to independent male workers.
Belgium 100% for the first 3 days; 82% for the remaining period (up to a ceiling).
Parental leave: 3 months of parental leave for each child from the child’s birth until s/he is 12 years old. Valid for both parents. Employees who work full-time can take this parental leave on a part-time regime.
Fixed monthly payment.
Note: Blank cells mean that data are not available or not applicable. (Cont’d.)
Global Gender Gap Report 2011 Measuring the Global Gender Gap 61
Appendix E: Policy Frameworks for Gender Equality (cont’d.)
Table E1: Maternity, paternity and additional shared leaves Table E1: Maternity, paternity and additional shared leaves (cont’d.)
Country Length of maternity leaveMaternity leave benefits
(% of wages paid) Length of paternity leave CountryPaternity leave benefits
(% of wages paid)Additional shared leave
(i.e., parental leave)Additional shared leave benefits
(% of wages paid)
Albania 5 weeks before, 6 weeks after birth. After 6 weeks of postnatal period, the woman might either work or benefit from social insurance scheme (about 52 weeks).
80% for the prenatal period and 150 days after birth; 50% for the remaining period. The maternity benefit for self-employed women is equal to the basic level of retirement pension.
— Albania — The employee who has a child up to 3 years old has the right to paid leave (max. 15 days/year when the child is sick), as well as to an additional unpaid leave (max. 30 days/year). Leave is given to the spouse who effectively cares for the child. Otherwise it’s given to both of them.
—
Armenia 140 days (70 days of pregnancy and 70 after birth).
Employed mothers who are on maternity leave receive monthly child care allowances, before the child reaches the age of 2.
— Armenia — Additional leave is provided until the child reaches the age of 3. The leave is provided to the mother, the father, the stepmother, stepfather or to the legal guardian. The husband of the pregnant woman can take an extra non-paid leave, duration of which cannot surpass 2 months.
—
Australia 52 weeks. 18 weeks at national minimum wage.
Industrial instrument entitlement for paid maternity leave: 100% of pre-birth earnings. Parental Leave Pay: National Minimum Wage.
3 weeks, concurrent with the mother’s leave.
Australia Industrial instrument entitlement for paid paternity leave: 100% of pre-birth earnings.
Up to 52 weeks, unpaid, to be shared between the mother and the father. An employee is entitled to request up to an additional 12 months’ unpaid parental leave, providing s/he has already taken (or intend to take) 12 months’ unpaid parental leave.
100
Austria 16 weeks: 8 weeks before and 8 weeks after birth.
100 — Austria — Parental leave. Employees—women and men—are entitled to parental leave until the 2nd birthday of their child, when they are living with the child in the same household.
Childcare allowance: 80% of last income, up to a ceiling. Flat-rate child care allowance is also provided.
Azerbaijan 10 weeks before, 8 weeks after birth. 100 14 days. Azerbaijan Unpaid. Parental leave for both mothers and fathers until the child reaches the age of 3.
During the first period of parental leave (until the infant reaches the age of 1.5 years old): benefits equal to 2 equivalents of minimum salary; from the age of 1.5 years old until the age of 3 years old: benefits equal to 1 equivalents of minimum salary.
Bahamas Min. 12 weeks. 33 -1/3% of insurable wage payable by the National Insurance Board. 56 -2/3% of wages payable by the employer.
— Bahamas — Family leave, unpaid, for a period not exceeding one week/year. Mothers enjoy an additional leave (6 weeks) in case of illness following the birth of the child.
Unpaid.
Barbados 12 weeks. In public service, it is practice for maternity leave to be granted for a period of up to 4 months.
— — Barbados — — —
Belgium Female employees—15 weeks: at least 1 week before birth (+ 5 optional weeks), at least 9 weeks after birth (+ max. 5 optional weeks). Independent female workers—max. 8 weeks.
Private sector: 82% for first month + 75% thereafter up to a ceiling. Public sector: statutory civil servants 100%; contracted civil servants, as for private sector.
2 weeks within 4 months after the birth of the child; not mandatory; not applicable to independent male workers.
Belgium 100% for the first 3 days; 82% for the remaining period (up to a ceiling).
Parental leave: 3 months of parental leave for each child from the child’s birth until s/he is 12 years old. Valid for both parents. Employees who work full-time can take this parental leave on a part-time regime.
Fixed monthly payment.
Note: Blank cells mean that data are not available or not applicable. (Cont’d.)
62 Measuring the Global Gender Gap Global Gender Gap Report 2011
Appendix E: Policy Frameworks for Gender Equality (cont’d.)
Table E1: Maternity, paternity and additional shared leaves Table E1: Maternity, paternity and additional shared leaves (cont’d.)
Country Length of maternity leaveMaternity leave benefits
(% of wages paid) Length of paternity leave CountryPaternity leave benefits
(% of wages paid)Additional shared leave
(i.e., parental leave)Additional shared leave benefits
(% of wages paid)
Bulgaria 58.6 weeks for pregnancy and childbirth, of which 45 weeks before birth. Breastfeeding maternity leave is also available.
90 15 days. Bulgaria 90 With the agreement of the mothers, when the child is 6 months old, insured fathers may use the leave for the rest of the 410 calendar days instead of the mother. For the time during which the father uses this leave, the leave of the mother is discontinued. An additional 6-month unpaid leave is granted for raising a child until completion of 8 years of age.
Cash compensation is provided for parental leave. An additional 6-month unpaid leave is granted for raising a child until completion of 8 years of age.
Canada 15 weeks. 55% (excl. Quebec). 5 weeks for biological fathers (Quebec only). Canada — 35 weeks. Biological parents: fixed monthly benefit. Slightly higher parental benefits apply to adoptive parents.
Chile 6 weeks before, 12 weeks after birth. Breastfeeding maternity leave is also available.
100, up to a ceiling. 5 working days. Chile 100 Mothers and fathers share a paid leave in case of disease of a 1-year-old or younger child. Breast-feeding and child feeding leave could be used by the father in the case of the mother’s decease.
—
Colombia 14 weeks, of which 2 weeks before birth. Breastfeeding maternity leave is also available.
100 8 days. Colombia 100 — —
Costa Rica 4 weeks before, 12 weeks after birth. 100 — Costa Rica — — —
Croatia 14 weeks, of which 4 weeks before and 10 weeks after birth.
100 — Croatia — Parental leave: 24 weeks for employed or self-employed parent after 6 months of age of the child or meeting other legal requirements. It can be used individually, simultaneously or alternately. If the father uses the right to parental leave in the duration of at least 12 weeks, parental leave is extended for 8 weeks.
80
Cyprus 18 weeks, of which min. 2 weeks and max. 6 weeks before birth.
75 — Cyprus — Parental leave: 13 weeks each parent, until the child reaches the age of 8. Fathers can use parental leave right after the birth of the child.
Unpaid, social security benefits available.
Czech Republic 28 weeks, of which 6 weeks before birth. Maternal leave cannot be shorter than 14 weeks and cannot be ended earlier than 6 weeks after the birth.
70 — Czech Republic — Parental leave: for both parents until the child reaches age of 3.
Parental allowance varies according to the length of the period of leave. Care benefits: 60.
Denmark 18 weeks, of which 4 weeks before and 14 weeks after birth. 2 weeks are mandatory.
100 (or maternity leave benefit equivalent to the unemployment benefit rate).
2 weeks within the first 14 weeks after birth. Denmark 100% (or paternity leave benefit equivalent to the unemployment benefit rate).
32 weeks to each parent. 100% during 10-week parental leave.
Dominican Republic 6 weeks before and 6 weeks after birth. 100 — Dominican Republic — — —
Note: Blank cells mean that data are not available or not applicable. (Cont’d.)
Global Gender Gap Report 2011 Measuring the Global Gender Gap 63
Appendix E: Policy Frameworks for Gender Equality (cont’d.)
Table E1: Maternity, paternity and additional shared leaves Table E1: Maternity, paternity and additional shared leaves (cont’d.)
Country Length of maternity leaveMaternity leave benefits
(% of wages paid) Length of paternity leave CountryPaternity leave benefits
(% of wages paid)Additional shared leave
(i.e., parental leave)Additional shared leave benefits
(% of wages paid)
Bulgaria 58.6 weeks for pregnancy and childbirth, of which 45 weeks before birth. Breastfeeding maternity leave is also available.
90 15 days. Bulgaria 90 With the agreement of the mothers, when the child is 6 months old, insured fathers may use the leave for the rest of the 410 calendar days instead of the mother. For the time during which the father uses this leave, the leave of the mother is discontinued. An additional 6-month unpaid leave is granted for raising a child until completion of 8 years of age.
Cash compensation is provided for parental leave. An additional 6-month unpaid leave is granted for raising a child until completion of 8 years of age.
Canada 15 weeks. 55% (excl. Quebec). 5 weeks for biological fathers (Quebec only). Canada — 35 weeks. Biological parents: fixed monthly benefit. Slightly higher parental benefits apply to adoptive parents.
Chile 6 weeks before, 12 weeks after birth. Breastfeeding maternity leave is also available.
100, up to a ceiling. 5 working days. Chile 100 Mothers and fathers share a paid leave in case of disease of a 1-year-old or younger child. Breast-feeding and child feeding leave could be used by the father in the case of the mother’s decease.
—
Colombia 14 weeks, of which 2 weeks before birth. Breastfeeding maternity leave is also available.
100 8 days. Colombia 100 — —
Costa Rica 4 weeks before, 12 weeks after birth. 100 — Costa Rica — — —
Croatia 14 weeks, of which 4 weeks before and 10 weeks after birth.
100 — Croatia — Parental leave: 24 weeks for employed or self-employed parent after 6 months of age of the child or meeting other legal requirements. It can be used individually, simultaneously or alternately. If the father uses the right to parental leave in the duration of at least 12 weeks, parental leave is extended for 8 weeks.
80
Cyprus 18 weeks, of which min. 2 weeks and max. 6 weeks before birth.
75 — Cyprus — Parental leave: 13 weeks each parent, until the child reaches the age of 8. Fathers can use parental leave right after the birth of the child.
Unpaid, social security benefits available.
Czech Republic 28 weeks, of which 6 weeks before birth. Maternal leave cannot be shorter than 14 weeks and cannot be ended earlier than 6 weeks after the birth.
70 — Czech Republic — Parental leave: for both parents until the child reaches age of 3.
Parental allowance varies according to the length of the period of leave. Care benefits: 60.
Denmark 18 weeks, of which 4 weeks before and 14 weeks after birth. 2 weeks are mandatory.
100 (or maternity leave benefit equivalent to the unemployment benefit rate).
2 weeks within the first 14 weeks after birth. Denmark 100% (or paternity leave benefit equivalent to the unemployment benefit rate).
32 weeks to each parent. 100% during 10-week parental leave.
Dominican Republic 6 weeks before and 6 weeks after birth. 100 — Dominican Republic — — —
Note: Blank cells mean that data are not available or not applicable. (Cont’d.)

64 Measuring the Global Gender Gap Global Gender Gap Report 2011
Appendix E: Policy Frameworks for Gender Equality (cont’d.)
Table E1: Maternity, paternity and additional shared leaves Table E1: Maternity, paternity and additional shared leaves (cont’d.)
Country Length of maternity leaveMaternity leave benefits
(% of wages paid) Length of paternity leave CountryPaternity leave benefits
(% of wages paid)Additional shared leave
(i.e., parental leave)Additional shared leave benefits
(% of wages paid)
Estonia 20 weeks, of which 14 weeks can be taken before birth. Employees who go on pregnancy and maternity leave less than 30 days prior to their due date have their leave reduced by this amount.
100 2 weeks; can be used during the 2 months before birth or during the 2 months after birth.
Estonia Paid on the basis of the father’s average wages, up to a ceiling.
Parental leave: 156,4 weeks until the child reaches the age of 3. One parent at a time.
Different types of parental benefits, incl. 100% benefit.
Ethiopia 4 weeks before and 8 weeks after birth 100 5 days after birth. Ethiopia Unpaid. — —
Finland 105 working days Approximately 70%; minimum allowance. Up to 18 days after birth; can be taken in up to 4 separate periods. Fathers can also take a full month of paternity leave (“daddy month”), between 13 and 36 working days; mothers not eligible for Maternity or Parental Allowance during the daddy month.
Finland Approximately 70%; minimum allowance. Parental leave can be shared between parents, but both cannot be on parental leave at the same time (with exceptions). Up to 2 separate periods of min. 12 working days each parent. Parental Allowance covers 158 working days. After parental allowance/extended paternity allowance, parents can take child care leave with full employment security until the child ages 3. Minimum length: 1 month.
Approximately 70%; minimum allowance.
Germany 6 weeks before and 8 weeks after birth. 2 weeks mandatory.
100 — Germany — Parental leave: for both father and mother for a period of 3 years each.
Unpaid. Financial support in the form of parental allowance for a period of 14 months: 67%.
Greece 17 weeks: 8 weeks before and 9 weeks after birth.
Public sector: 100. Private sector: the employer’s obligation to pay remuneration during the maternity leave is limited to the payment of remuneration corresponding to 15 days of work (first year service), 1 month work (after first year of service).
If the mother does not use maternity leave, the father is entitled to it.
Greece Varies based on income. Private sector: insured mothers entitled to a special 24-week leave after maternity leave. Public sector: 104-week unpaid leave to mothers, at any time before the child completes 6 years of age.
a) Leave to bring up one’s child: unpaid, b) leave to take care of one’s child: paid, c) “Special provision for the protection of maternity” (to which the mother only is entitled), 6 months: minimum wage (social subsidy).
Iceland 2 weeks, mandatory + additional 11 weeks. 80, up to a ceiling. 13 weeks Iceland Approximately 80%; up to a ceiling. 13 weeks. Unpaid.
Ireland 26 weeks paid; up to 16 weeks unpaid. 100 for public sector and certain private sectors.
— Ireland — Parental Leave: 13 weeks for both mother and father, to be taken before the child is 8 years.
Parental Leave: unpaid.
Israel 26 weeks (14 weeks paid) for women who have worked with the same employer/at the same place of employment for a period of at least 12 months; 14 weeks (7 weeks paid) for women who have worked for a shorter period. Mothers benefit for extended unpaid maternity leave.
100 The father can take part of the leave instead of the mother, starting from 6 weeks (up to 14 weeks) after birth. If the mother of the baby has decided to split her maternity leave during an extended period of hospitalization, the father may take unpaid leave during that time.
Israel 100 No parental leave. Parents can take leave from their sick or vacation days if the child is sick.
Absence because of child sickness. Paid.
Jamaica Up to 8 weeks. Leave without pay for an additional period not exceeding 65 working days. In particular cases, the grant of leave—unpaid—can be authorized for periods in excess of 65 working days.
100 — Jamaica — — —
Japan Up to 6 weeks before birth; 8 weeks after birth.
Min. 2/3 of working salary (approx. 66%). No. However, spousal maternity leave available at corporate level.
Japan Min. 50%. Child care leave: 1 year to each parent. It can be taken simultaneously. If fathers take child care leave within 8 weeks after birth, they can take child care leave again.
Min. 50%.
Note: Blank cells mean that data are not available or not applicable. (Cont’d.)

Global Gender Gap Report 2011 Measuring the Global Gender Gap 65
Appendix E: Policy Frameworks for Gender Equality (cont’d.)
Table E1: Maternity, paternity and additional shared leaves Table E1: Maternity, paternity and additional shared leaves (cont’d.)
Country Length of maternity leaveMaternity leave benefits
(% of wages paid) Length of paternity leave CountryPaternity leave benefits
(% of wages paid)Additional shared leave
(i.e., parental leave)Additional shared leave benefits
(% of wages paid)
Estonia 20 weeks, of which 14 weeks can be taken before birth. Employees who go on pregnancy and maternity leave less than 30 days prior to their due date have their leave reduced by this amount.
100 2 weeks; can be used during the 2 months before birth or during the 2 months after birth.
Estonia Paid on the basis of the father’s average wages, up to a ceiling.
Parental leave: 156,4 weeks until the child reaches the age of 3. One parent at a time.
Different types of parental benefits, incl. 100% benefit.
Ethiopia 4 weeks before and 8 weeks after birth 100 5 days after birth. Ethiopia Unpaid. — —
Finland 105 working days Approximately 70%; minimum allowance. Up to 18 days after birth; can be taken in up to 4 separate periods. Fathers can also take a full month of paternity leave (“daddy month”), between 13 and 36 working days; mothers not eligible for Maternity or Parental Allowance during the daddy month.
Finland Approximately 70%; minimum allowance. Parental leave can be shared between parents, but both cannot be on parental leave at the same time (with exceptions). Up to 2 separate periods of min. 12 working days each parent. Parental Allowance covers 158 working days. After parental allowance/extended paternity allowance, parents can take child care leave with full employment security until the child ages 3. Minimum length: 1 month.
Approximately 70%; minimum allowance.
Germany 6 weeks before and 8 weeks after birth. 2 weeks mandatory.
100 — Germany — Parental leave: for both father and mother for a period of 3 years each.
Unpaid. Financial support in the form of parental allowance for a period of 14 months: 67%.
Greece 17 weeks: 8 weeks before and 9 weeks after birth.
Public sector: 100. Private sector: the employer’s obligation to pay remuneration during the maternity leave is limited to the payment of remuneration corresponding to 15 days of work (first year service), 1 month work (after first year of service).
If the mother does not use maternity leave, the father is entitled to it.
Greece Varies based on income. Private sector: insured mothers entitled to a special 24-week leave after maternity leave. Public sector: 104-week unpaid leave to mothers, at any time before the child completes 6 years of age.
a) Leave to bring up one’s child: unpaid, b) leave to take care of one’s child: paid, c) “Special provision for the protection of maternity” (to which the mother only is entitled), 6 months: minimum wage (social subsidy).
Iceland 2 weeks, mandatory + additional 11 weeks. 80, up to a ceiling. 13 weeks Iceland Approximately 80%; up to a ceiling. 13 weeks. Unpaid.
Ireland 26 weeks paid; up to 16 weeks unpaid. 100 for public sector and certain private sectors.
— Ireland — Parental Leave: 13 weeks for both mother and father, to be taken before the child is 8 years.
Parental Leave: unpaid.
Israel 26 weeks (14 weeks paid) for women who have worked with the same employer/at the same place of employment for a period of at least 12 months; 14 weeks (7 weeks paid) for women who have worked for a shorter period. Mothers benefit for extended unpaid maternity leave.
100 The father can take part of the leave instead of the mother, starting from 6 weeks (up to 14 weeks) after birth. If the mother of the baby has decided to split her maternity leave during an extended period of hospitalization, the father may take unpaid leave during that time.
Israel 100 No parental leave. Parents can take leave from their sick or vacation days if the child is sick.
Absence because of child sickness. Paid.
Jamaica Up to 8 weeks. Leave without pay for an additional period not exceeding 65 working days. In particular cases, the grant of leave—unpaid—can be authorized for periods in excess of 65 working days.
100 — Jamaica — — —
Japan Up to 6 weeks before birth; 8 weeks after birth.
Min. 2/3 of working salary (approx. 66%). No. However, spousal maternity leave available at corporate level.
Japan Min. 50%. Child care leave: 1 year to each parent. It can be taken simultaneously. If fathers take child care leave within 8 weeks after birth, they can take child care leave again.
Min. 50%.
Note: Blank cells mean that data are not available or not applicable. (Cont’d.)

66 Measuring the Global Gender Gap Global Gender Gap Report 2011
Appendix E: Policy Frameworks for Gender Equality (cont’d.)
Table E1: Maternity, paternity and additional shared leaves Table E1: Maternity, paternity and additional shared leaves (cont’d.)
Country Length of maternity leaveMaternity leave benefits
(% of wages paid) Length of paternity leave CountryPaternity leave benefits
(% of wages paid)Additional shared leave
(i.e., parental leave)Additional shared leave benefits
(% of wages paid)
Korea, Rep. 90-day maternity leave before and after birth. The postpartum period shall account for more than 45 days of the entire period of maternity leave.
100, up to a ceiling. 3 days. Korea, Rep. Unpaid. Parental leave: 1 year, until the child is 6. In case of a dual income couple, each parent is entitled to a 12-month parental leave before the child enters elementary school. They can opt for the divided use of parental leave once only.
40
Kuwait A paid pre-delivery sickness leave of unspecified period, 8 weeks paid delivery leave, maternity leave for 16 weeks.
Full pay delivery leave for 8 weeks, full pay maternity leave for 4 weeks and half pay for 12 weeks.
— Kuwait — Mother’s leave, min. 6 months and max. 3 years.
Unpaid.
Latvia 112 calendar days: 2 weeks before and 2 weeks after birth mandatory.
80, up to a ceiling. 10 calendar days. Latvia 80, up to a ceiling. Parental leave: 1 year and 1/2 for each parent up to the day the child reaches the age of 8 years.
70
Lesotho 12 weeks. 100 — Lesotho — 2 hours for nursing per day for 6 months (mother only).
Both paid and unpaid.
Liberia 12 weeks, of which 1 month before, 2 months after birth.
100 No, but under consideration. Liberia — No, but there is provision for general annual leave of 1 month.
—
Lithuania 18 weeks: 70 calendar days before, 56 calendar days after birth.
100 4 weeks: from birth until the child is 1 month old.
Lithuania 100 Granted parental leave until the child reaches 3 years old.
100% (70%; 40%). Varies according to the chosen duration of the allowance.
Luxembourg 8 weeks before, 8 weeks after birth. 100 2 days. Luxembourg 100 Parental leave: 6-month full-time leave or 12-month part-time leave. Family leave and sick leave available.
—
Madagascar Public sector: 12 weeks. Private sector: 14 consecutive weeks, of which 8 weeks after birth.
100 Public sector: 15 days from birthday. Private sector: 3 days from birthday.
Madagascar 100 Paid leave: 4 weeks per calendar year of actual service.
—
Malaysia Public sector: 8 weeks up to 12 weeks. Private sector: 8 weeks.
100 Public sector: 1 week. Private sector: none. Malaysia 100 Public sector: period of leave determined by the officer. Not more than 5 years for the entire service period.
Unpaid leave and half paid leave.
Mali 14 weeks. 6 weeks before, 8 weeks after birth.
100 3 days. Mali — — —
Malta 14 weeks. 100 1–2 days (variable upon sectors). Malta 100 3 months for both parents. Unpaid.
Mauritius Generally 12 weeks. 100 Private sector: 5 continuous working days. Public sector: normal casual leave + up to 8 days leave from accumulated vacation leave.
Mauritius 100 There is no parental leave provided; however, either parent can take a leave without pay of 9 months.
Unpaid, if there is no more vacation leave left in an individual’s bank.
Mexico 6 weeks before and 6 after birth. 100% (50% in case of leave extension). Federal law does not provide paternity leave. Some federal institutions have related provisions.
Mexico 100; where paternity leave is available. No. But mothers and fathers have 6 working days/semester for maternal/parental care.
—
Note: Blank cells mean that data are not available or not applicable. (Cont’d.)
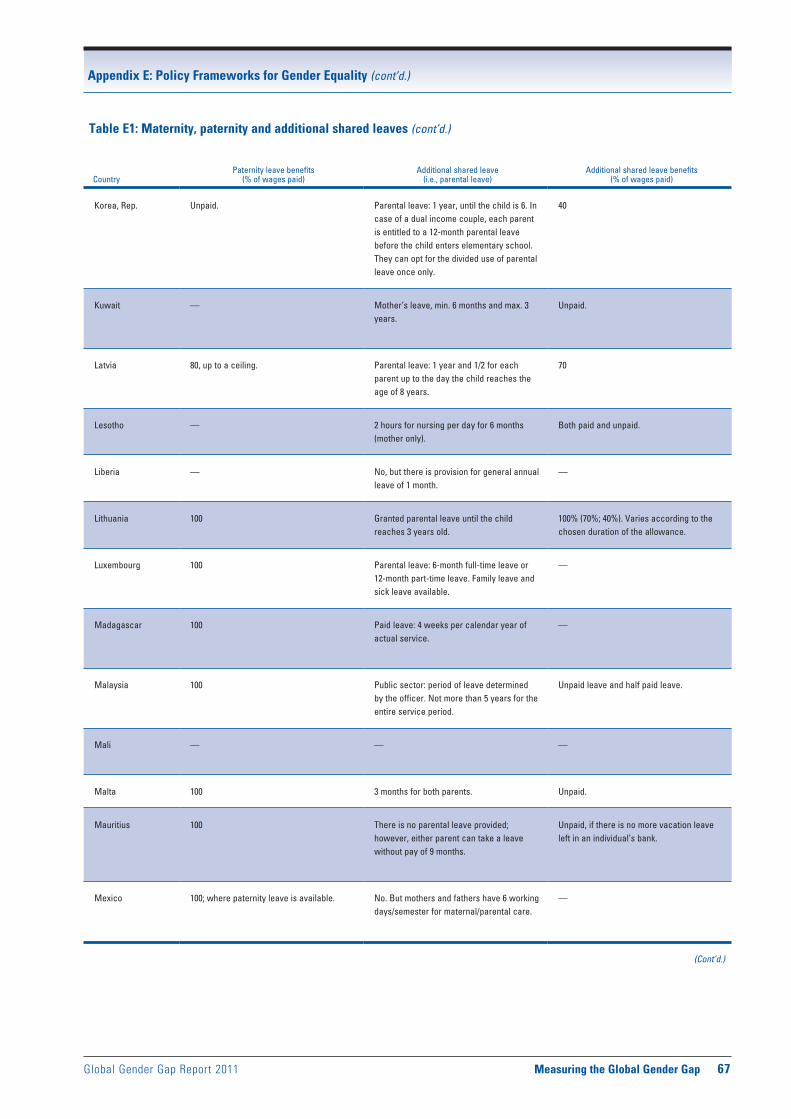
Global Gender Gap Report 2011 Measuring the Global Gender Gap 67
Appendix E: Policy Frameworks for Gender Equality (cont’d.)
Table E1: Maternity, paternity and additional shared leaves Table E1: Maternity, paternity and additional shared leaves (cont’d.)
Country Length of maternity leaveMaternity leave benefits
(% of wages paid) Length of paternity leave CountryPaternity leave benefits
(% of wages paid)Additional shared leave
(i.e., parental leave)Additional shared leave benefits
(% of wages paid)
Korea, Rep. 90-day maternity leave before and after birth. The postpartum period shall account for more than 45 days of the entire period of maternity leave.
100, up to a ceiling. 3 days. Korea, Rep. Unpaid. Parental leave: 1 year, until the child is 6. In case of a dual income couple, each parent is entitled to a 12-month parental leave before the child enters elementary school. They can opt for the divided use of parental leave once only.
40
Kuwait A paid pre-delivery sickness leave of unspecified period, 8 weeks paid delivery leave, maternity leave for 16 weeks.
Full pay delivery leave for 8 weeks, full pay maternity leave for 4 weeks and half pay for 12 weeks.
— Kuwait — Mother’s leave, min. 6 months and max. 3 years.
Unpaid.
Latvia 112 calendar days: 2 weeks before and 2 weeks after birth mandatory.
80, up to a ceiling. 10 calendar days. Latvia 80, up to a ceiling. Parental leave: 1 year and 1/2 for each parent up to the day the child reaches the age of 8 years.
70
Lesotho 12 weeks. 100 — Lesotho — 2 hours for nursing per day for 6 months (mother only).
Both paid and unpaid.
Liberia 12 weeks, of which 1 month before, 2 months after birth.
100 No, but under consideration. Liberia — No, but there is provision for general annual leave of 1 month.
—
Lithuania 18 weeks: 70 calendar days before, 56 calendar days after birth.
100 4 weeks: from birth until the child is 1 month old.
Lithuania 100 Granted parental leave until the child reaches 3 years old.
100% (70%; 40%). Varies according to the chosen duration of the allowance.
Luxembourg 8 weeks before, 8 weeks after birth. 100 2 days. Luxembourg 100 Parental leave: 6-month full-time leave or 12-month part-time leave. Family leave and sick leave available.
—
Madagascar Public sector: 12 weeks. Private sector: 14 consecutive weeks, of which 8 weeks after birth.
100 Public sector: 15 days from birthday. Private sector: 3 days from birthday.
Madagascar 100 Paid leave: 4 weeks per calendar year of actual service.
—
Malaysia Public sector: 8 weeks up to 12 weeks. Private sector: 8 weeks.
100 Public sector: 1 week. Private sector: none. Malaysia 100 Public sector: period of leave determined by the officer. Not more than 5 years for the entire service period.
Unpaid leave and half paid leave.
Mali 14 weeks. 6 weeks before, 8 weeks after birth.
100 3 days. Mali — — —
Malta 14 weeks. 100 1–2 days (variable upon sectors). Malta 100 3 months for both parents. Unpaid.
Mauritius Generally 12 weeks. 100 Private sector: 5 continuous working days. Public sector: normal casual leave + up to 8 days leave from accumulated vacation leave.
Mauritius 100 There is no parental leave provided; however, either parent can take a leave without pay of 9 months.
Unpaid, if there is no more vacation leave left in an individual’s bank.
Mexico 6 weeks before and 6 after birth. 100% (50% in case of leave extension). Federal law does not provide paternity leave. Some federal institutions have related provisions.
Mexico 100; where paternity leave is available. No. But mothers and fathers have 6 working days/semester for maternal/parental care.
—
Note: Blank cells mean that data are not available or not applicable. (Cont’d.)
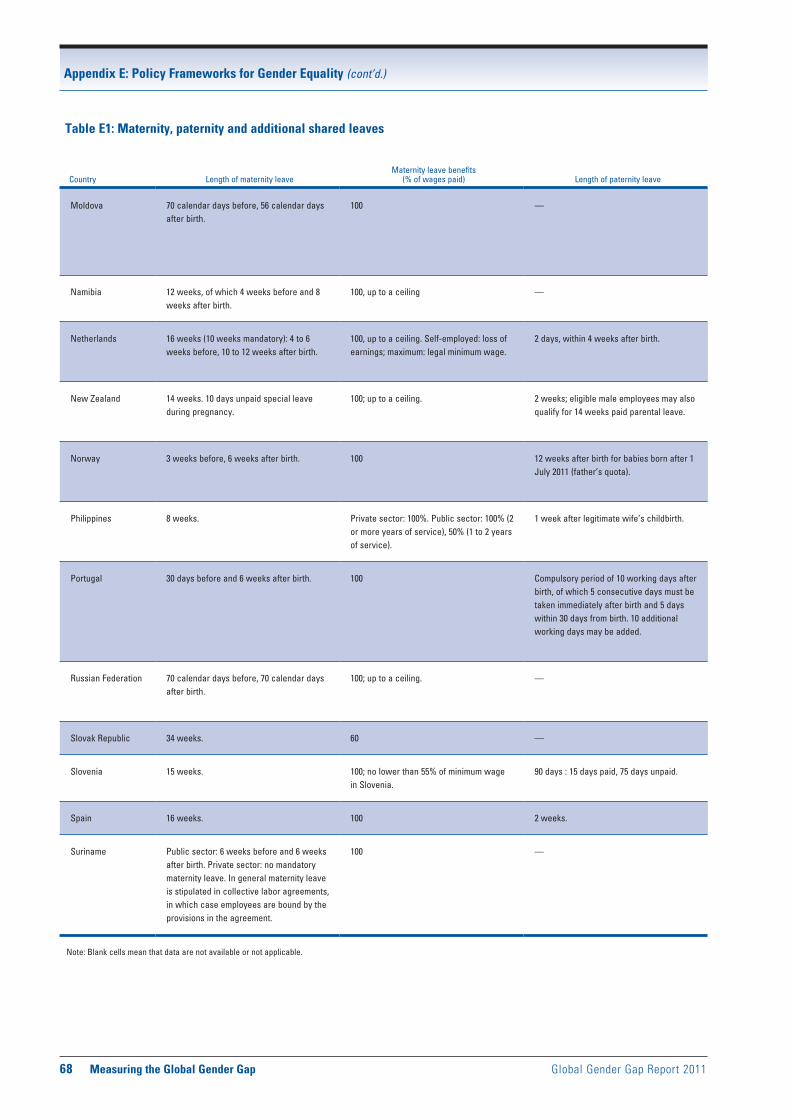
68 Measuring the Global Gender Gap Global Gender Gap Report 2011
Appendix E: Policy Frameworks for Gender Equality (cont’d.)
Table E1: Maternity, paternity and additional shared leaves Table E1: Maternity, paternity and additional shared leaves (cont’d.)
Country Length of maternity leaveMaternity leave benefits
(% of wages paid) Length of paternity leave CountryPaternity leave benefits
(% of wages paid)Additional shared leave
(i.e., parental leave)Additional shared leave benefits
(% of wages paid)
Moldova 70 calendar days before, 56 calendar days after birth.
100 — Moldova — Partially paid parental leave for child care until the child ages 3; additional unpaid leave to care for children aged 3 to 6 years (mothers, fathers and other caregivers in the family).
30% (until the child reaches 3); unpaid (child aged 3–6).
Namibia 12 weeks, of which 4 weeks before and 8 weeks after birth.
100, up to a ceiling — Namibia — — —
Netherlands 16 weeks (10 weeks mandatory): 4 to 6 weeks before, 10 to 12 weeks after birth.
100, up to a ceiling. Self-employed: loss of earnings; maximum: legal minimum wage.
2 days, within 4 weeks after birth. Netherlands 100; no ceiling. Parental leave: 26 weeks per parent per child, non-transferable. Emergency and care leaves available.
Parental leave: no statutory payment (dependent on collective agreements).
New Zealand 14 weeks. 10 days unpaid special leave during pregnancy.
100; up to a ceiling. 2 weeks; eligible male employees may also qualify for 14 weeks paid parental leave.
New Zealand Unpaid. 52 weeks, incl. 14-week paid parental leave, which may be taken by either partner or shared by both partners.
Parental leave is paid.
Norway 3 weeks before, 6 weeks after birth. 100 12 weeks after birth for babies born after 1 July 2011 (father’s quota).
Norway 100 26 weeks or 36 weeks (depending on the received payment). Extended to 47/57 weeks.
Parental leave: 26 weeks with 100% pay or 36 weeks with 80% pay. Up to 1 year unpaid leave for each child.
Philippines 8 weeks. Private sector: 100%. Public sector: 100% (2 or more years of service), 50% (1 to 2 years of service).
1 week after legitimate wife’s childbirth. Philippines 100 1 week (solo parents). Special leave privileges for government workers.
100
Portugal 30 days before and 6 weeks after birth. 100 Compulsory period of 10 working days after birth, of which 5 consecutive days must be taken immediately after birth and 5 days within 30 days from birth. 10 additional working days may be added.
Portugal 100 Initial Parental Leave: granted to employed mother and father, to be shared. Max. 120–150 consecutive days, by the parents’ joint decision. Extended Parental Leave: granted to one or to both parents alternately, max. 3 months.
Initial Parental Leave: 120 days = 100%; 150 days = 80% (mother only). If the father benefits for initial parental leave as well, the payment increases to 100% and 83%, respectively. Extended Parental Leave: 25%
Russian Federation 70 calendar days before, 70 calendar days after birth.
100; up to a ceiling. — Russian Federation — Child care leave available to both mother and father until the child turns 3 years of age.
Child care: 40%.
Slovak Republic 34 weeks. 60 — Slovak Republic — Parental leave: up to the age of 3 Monthly Parental Allowance.
Slovenia 15 weeks. 100; no lower than 55% of minimum wage in Slovenia.
90 days : 15 days paid, 75 days unpaid. Slovenia 100; with a minimum value and a ceiling. 260 days. Paid parental leave: 100%.
Spain 16 weeks. 100 2 weeks. Spain 100 10 weeks. —
Suriname Public sector: 6 weeks before and 6 weeks after birth. Private sector: no mandatory maternity leave. In general maternity leave is stipulated in collective labor agreements, in which case employees are bound by the provisions in the agreement.
100 — Suriname — — —
Note: Blank cells mean that data are not available or not applicable. (Cont’d.)
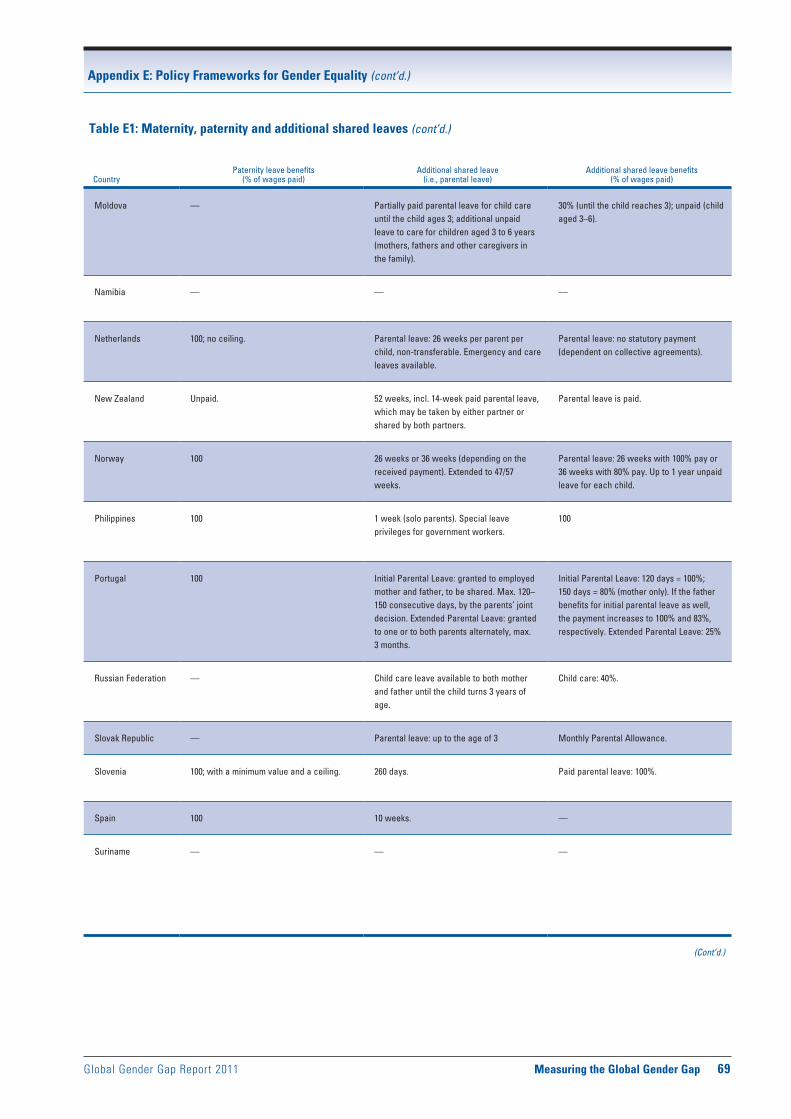
Global Gender Gap Report 2011 Measuring the Global Gender Gap 69
Appendix E: Policy Frameworks for Gender Equality (cont’d.)
Table E1: Maternity, paternity and additional shared leaves Table E1: Maternity, paternity and additional shared leaves (cont’d.)
Country Length of maternity leaveMaternity leave benefits
(% of wages paid) Length of paternity leave CountryPaternity leave benefits
(% of wages paid)Additional shared leave
(i.e., parental leave)Additional shared leave benefits
(% of wages paid)
Moldova 70 calendar days before, 56 calendar days after birth.
100 — Moldova — Partially paid parental leave for child care until the child ages 3; additional unpaid leave to care for children aged 3 to 6 years (mothers, fathers and other caregivers in the family).
30% (until the child reaches 3); unpaid (child aged 3–6).
Namibia 12 weeks, of which 4 weeks before and 8 weeks after birth.
100, up to a ceiling — Namibia — — —
Netherlands 16 weeks (10 weeks mandatory): 4 to 6 weeks before, 10 to 12 weeks after birth.
100, up to a ceiling. Self-employed: loss of earnings; maximum: legal minimum wage.
2 days, within 4 weeks after birth. Netherlands 100; no ceiling. Parental leave: 26 weeks per parent per child, non-transferable. Emergency and care leaves available.
Parental leave: no statutory payment (dependent on collective agreements).
New Zealand 14 weeks. 10 days unpaid special leave during pregnancy.
100; up to a ceiling. 2 weeks; eligible male employees may also qualify for 14 weeks paid parental leave.
New Zealand Unpaid. 52 weeks, incl. 14-week paid parental leave, which may be taken by either partner or shared by both partners.
Parental leave is paid.
Norway 3 weeks before, 6 weeks after birth. 100 12 weeks after birth for babies born after 1 July 2011 (father’s quota).
Norway 100 26 weeks or 36 weeks (depending on the received payment). Extended to 47/57 weeks.
Parental leave: 26 weeks with 100% pay or 36 weeks with 80% pay. Up to 1 year unpaid leave for each child.
Philippines 8 weeks. Private sector: 100%. Public sector: 100% (2 or more years of service), 50% (1 to 2 years of service).
1 week after legitimate wife’s childbirth. Philippines 100 1 week (solo parents). Special leave privileges for government workers.
100
Portugal 30 days before and 6 weeks after birth. 100 Compulsory period of 10 working days after birth, of which 5 consecutive days must be taken immediately after birth and 5 days within 30 days from birth. 10 additional working days may be added.
Portugal 100 Initial Parental Leave: granted to employed mother and father, to be shared. Max. 120–150 consecutive days, by the parents’ joint decision. Extended Parental Leave: granted to one or to both parents alternately, max. 3 months.
Initial Parental Leave: 120 days = 100%; 150 days = 80% (mother only). If the father benefits for initial parental leave as well, the payment increases to 100% and 83%, respectively. Extended Parental Leave: 25%
Russian Federation 70 calendar days before, 70 calendar days after birth.
100; up to a ceiling. — Russian Federation — Child care leave available to both mother and father until the child turns 3 years of age.
Child care: 40%.
Slovak Republic 34 weeks. 60 — Slovak Republic — Parental leave: up to the age of 3 Monthly Parental Allowance.
Slovenia 15 weeks. 100; no lower than 55% of minimum wage in Slovenia.
90 days : 15 days paid, 75 days unpaid. Slovenia 100; with a minimum value and a ceiling. 260 days. Paid parental leave: 100%.
Spain 16 weeks. 100 2 weeks. Spain 100 10 weeks. —
Suriname Public sector: 6 weeks before and 6 weeks after birth. Private sector: no mandatory maternity leave. In general maternity leave is stipulated in collective labor agreements, in which case employees are bound by the provisions in the agreement.
100 — Suriname — — —
Note: Blank cells mean that data are not available or not applicable. (Cont’d.)

70 Measuring the Global Gender Gap Global Gender Gap Report 2011
Appendix E: Policy Frameworks for Gender Equality (cont’d.)
Table E1: Maternity, paternity and additional shared leaves Table E1: Maternity, paternity and additional shared leaves (cont’d.)
Country Length of maternity leaveMaternity leave benefits
(% of wages paid) Length of paternity leave CountryPaternity leave benefits
(% of wages paid)Additional shared leave
(i.e., parental leave)Additional shared leave benefits
(% of wages paid)
Sweden 2 weeks mandatory leave. Can be used before or after confinement. A mother has an optional right to 7-week maternity leave before birth and 7 weeks after birth.
Parental benefit: 80%, up to a ceiling, for the first 390 days. Fixed daily compensation for the remaining 90 days.
10 optional nursing days in connection to birth. Can be used within 2 months from the birth.
Sweden 80; up to a ceiling. The mother and father are both entitled to 240 optional days of parental benefit (in total, 480 calendar days), of which 60 are reserved to each parent, while the other days can be transferred to the other parent. Other leaves for childminding available.
80; up to a ceiling. Collective agreements often provide supplementary pay, raising the payment percentage to 90%.
Switzerland Min. 14 weeks after birth. 80; up to a ceiling. No statutory paternity leave. Switzerland — Leave for taking care of a sick child: max. 3 days.
—
Turkey 16 weeks: 8 weeks before and 8 weeks after birth. The unused leave prior to birth can be added to the post natal leave period. Breastfeeding leaves available.
100 Public sector only: 10 days. Turkey — 24 months. Unpaid.
United Arab Emirates
Public sector: 60 days. Private sector: 45 days.
Public sector: 100%. Private sector: 100% (1 year of service), 50% (<1 year of service).
Public sector only: 3 consecutive working days after birth. Private sector: none.
United Arab Emirates
100; public sector only. No shared leave, max. 100-day leave (combined leaves) for mothers (public sector only).
Public sector only: 100% (annual leave, sick leave) and unpaid leave.
United Kingdom 2 weeks mandatory after birth. Statutory Maternity Leave is available for 52 weeks.
Statutory Maternity Pay (SMP): paid for up to 39 weeks. 90% for the first 6 weeks followed by the lesser of that 90% rate or a flat rate payment for up to 33 weeks. Maternity Allowance: is paid to working women who do not qualify for SMP, up to 39 weeks. 90% (with ceiling).
2 weeks within the first 8 weeks after birth. Fathers may also be able to take up to 26 weeks’ additional paternity leave if the mother returns to work before the end of her 52-week maternity leave period.
United Kingdom 90% capped at a flat rate for 2 weeks. Parental Leave: 13 weeks until the child’s 5th birthday. Additional Paternity Leave enables the father to take any remaining leave available to the mother after the 20th week of maternity leave as long as she has returned to the workplace.
Additional Paternity Leave: 90% capped at a flat rate.
United States The United States does not have federal or state laws mandating maternity leave. However, the federal Family and Medical Leave Act (FMLA) provides for 12 weeks/year of unpaid leave. It is the right of the individual to choose to take FMLA. Some individual states may have laws that set forth broader protections for working mothers than are provided under the FMLA.
No paid leave to new parents. Any wages disbursed to a parent on such leave would be set by the mother’s individual employer or a state having a paid leave law. Currently only 6 states have laws providing paid family leave for employees. Payments are less than the employee’s usual salary (e.g., CA: 55%; NJ: around 65%).
No federal or state laws directing or mandating paternity leave.
United States There is no national program; any wages disbursed to a parent on such leave would be set by the father’s individual employer or a state having a paid leave law.
The federal Family and Medical Leave Act (FMLA) mandates that employers having at least 50 employees must provide eligible employees with up to 12 weeks/year of unpaid, job-protected leave to care for themselves or the employee’s spouse, child, or parent who has a serious medical condition. When available, the leave duration changes from state to state.
—
Note: Blank cells mean that data are not available or not applicable.
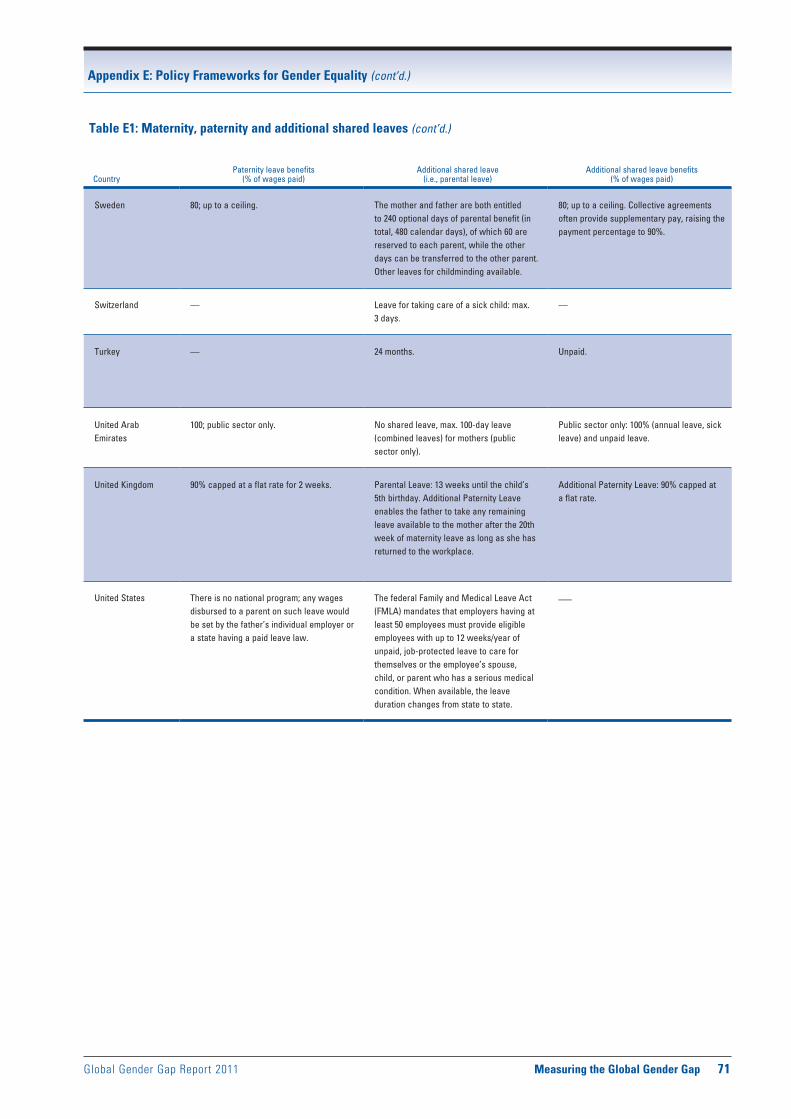
Global Gender Gap Report 2011 Measuring the Global Gender Gap 71
Appendix E: Policy Frameworks for Gender Equality (cont’d.)
Table E1: Maternity, paternity and additional shared leaves Table E1: Maternity, paternity and additional shared leaves (cont’d.)
Country Length of maternity leaveMaternity leave benefits
(% of wages paid) Length of paternity leave CountryPaternity leave benefits
(% of wages paid)Additional shared leave
(i.e., parental leave)Additional shared leave benefits
(% of wages paid)
Sweden 2 weeks mandatory leave. Can be used before or after confinement. A mother has an optional right to 7-week maternity leave before birth and 7 weeks after birth.
Parental benefit: 80%, up to a ceiling, for the first 390 days. Fixed daily compensation for the remaining 90 days.
10 optional nursing days in connection to birth. Can be used within 2 months from the birth.
Sweden 80; up to a ceiling. The mother and father are both entitled to 240 optional days of parental benefit (in total, 480 calendar days), of which 60 are reserved to each parent, while the other days can be transferred to the other parent. Other leaves for childminding available.
80; up to a ceiling. Collective agreements often provide supplementary pay, raising the payment percentage to 90%.
Switzerland Min. 14 weeks after birth. 80; up to a ceiling. No statutory paternity leave. Switzerland — Leave for taking care of a sick child: max. 3 days.
—
Turkey 16 weeks: 8 weeks before and 8 weeks after birth. The unused leave prior to birth can be added to the post natal leave period. Breastfeeding leaves available.
100 Public sector only: 10 days. Turkey — 24 months. Unpaid.
United Arab Emirates
Public sector: 60 days. Private sector: 45 days.
Public sector: 100%. Private sector: 100% (1 year of service), 50% (<1 year of service).
Public sector only: 3 consecutive working days after birth. Private sector: none.
United Arab Emirates
100; public sector only. No shared leave, max. 100-day leave (combined leaves) for mothers (public sector only).
Public sector only: 100% (annual leave, sick leave) and unpaid leave.
United Kingdom 2 weeks mandatory after birth. Statutory Maternity Leave is available for 52 weeks.
Statutory Maternity Pay (SMP): paid for up to 39 weeks. 90% for the first 6 weeks followed by the lesser of that 90% rate or a flat rate payment for up to 33 weeks. Maternity Allowance: is paid to working women who do not qualify for SMP, up to 39 weeks. 90% (with ceiling).
2 weeks within the first 8 weeks after birth. Fathers may also be able to take up to 26 weeks’ additional paternity leave if the mother returns to work before the end of her 52-week maternity leave period.
United Kingdom 90% capped at a flat rate for 2 weeks. Parental Leave: 13 weeks until the child’s 5th birthday. Additional Paternity Leave enables the father to take any remaining leave available to the mother after the 20th week of maternity leave as long as she has returned to the workplace.
Additional Paternity Leave: 90% capped at a flat rate.
United States The United States does not have federal or state laws mandating maternity leave. However, the federal Family and Medical Leave Act (FMLA) provides for 12 weeks/year of unpaid leave. It is the right of the individual to choose to take FMLA. Some individual states may have laws that set forth broader protections for working mothers than are provided under the FMLA.
No paid leave to new parents. Any wages disbursed to a parent on such leave would be set by the mother’s individual employer or a state having a paid leave law. Currently only 6 states have laws providing paid family leave for employees. Payments are less than the employee’s usual salary (e.g., CA: 55%; NJ: around 65%).
No federal or state laws directing or mandating paternity leave.
United States There is no national program; any wages disbursed to a parent on such leave would be set by the father’s individual employer or a state having a paid leave law.
The federal Family and Medical Leave Act (FMLA) mandates that employers having at least 50 employees must provide eligible employees with up to 12 weeks/year of unpaid, job-protected leave to care for themselves or the employee’s spouse, child, or parent who has a serious medical condition. When available, the leave duration changes from state to state.
—
Note: Blank cells mean that data are not available or not applicable.

72 Measuring the Global Gender Gap Global Gender Gap Report 2011
Appendix E: Policy Frameworks for Gender Equality (cont’d.)
0 50 100 150 200 250 300 350
United Kingdom
United Arab Emirates
Turkey
Switzerland
Sweden
Suriname
Spain
Slovenia
Slovak Republic
Russian Federation
Portugal
Philippines
Norway
New Zealand
Netherlands
Namibia
Mexico
Mauritius
Malta
Mali
Malaysia
Madagascar
Luxembourg
Lithuania
Liberia
Lesotho
Latvia
Kuwait
Korea, Rep.
Japan
Jamaica
Israel
Ireland
Iceland
Greece
Germany
Finland
Ethiopia
Estonia
Dominican Republic
Denmark
Czech Republic
Cyprus
Croatia
Costa Rica
Colombia
Chile
Canada
Bulgaria
Belgium
Barbados
Bahamas
Azerbaijan
Austria
Australia
Armenia
Albania
Weeks
Figure E1: Length of accumulated leave available to parents
n Leave available to the mother (weeks)
n Leave available to the father (weeks)
Additional leave available to either the mother or the father (weeks)
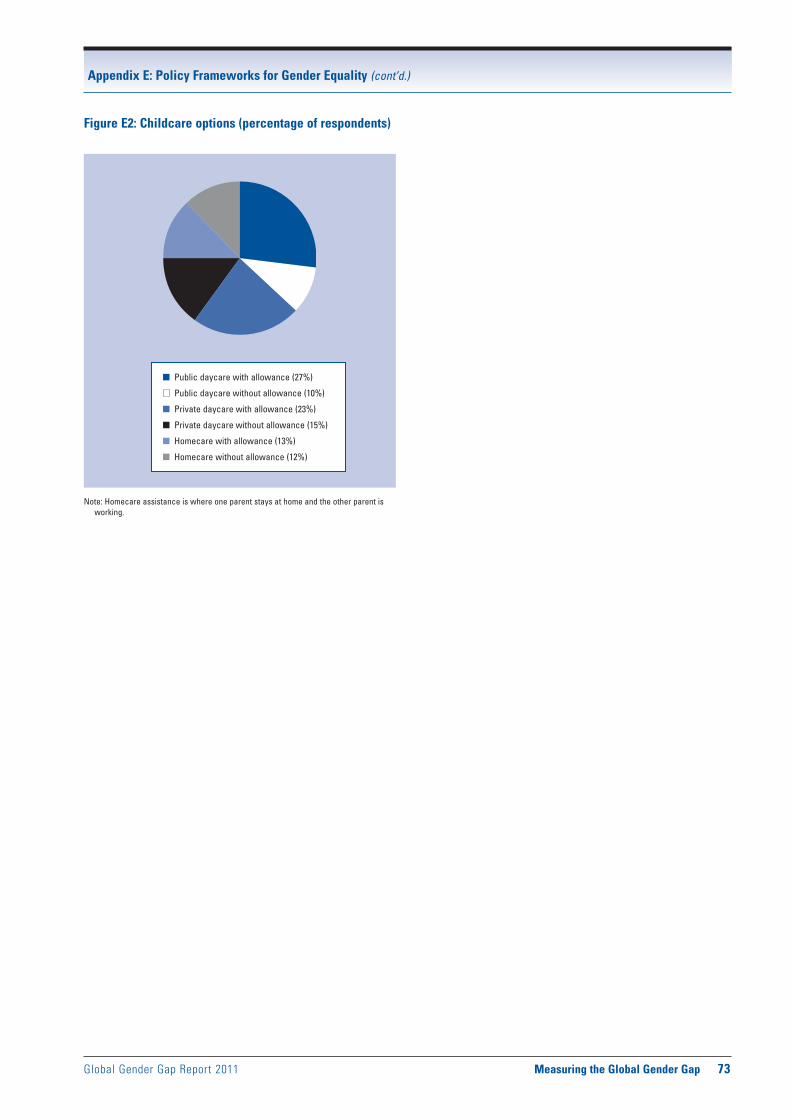
Global Gender Gap Report 2011 Measuring the Global Gender Gap 73
Appendix E: Policy Frameworks for Gender Equality (cont’d.)
Figure E2: Childcare options (percentage of respondents)
Note: Homecare assistance is where one parent stays at home and the other parent is working.
n Public daycare with allowance (27%)
Public daycare without allowance (10%)
n Private daycare with allowance (23%)
n Private daycare without allowance (15%)
n Homecare with allowance (13%)
n Homecare without allowance (12%)
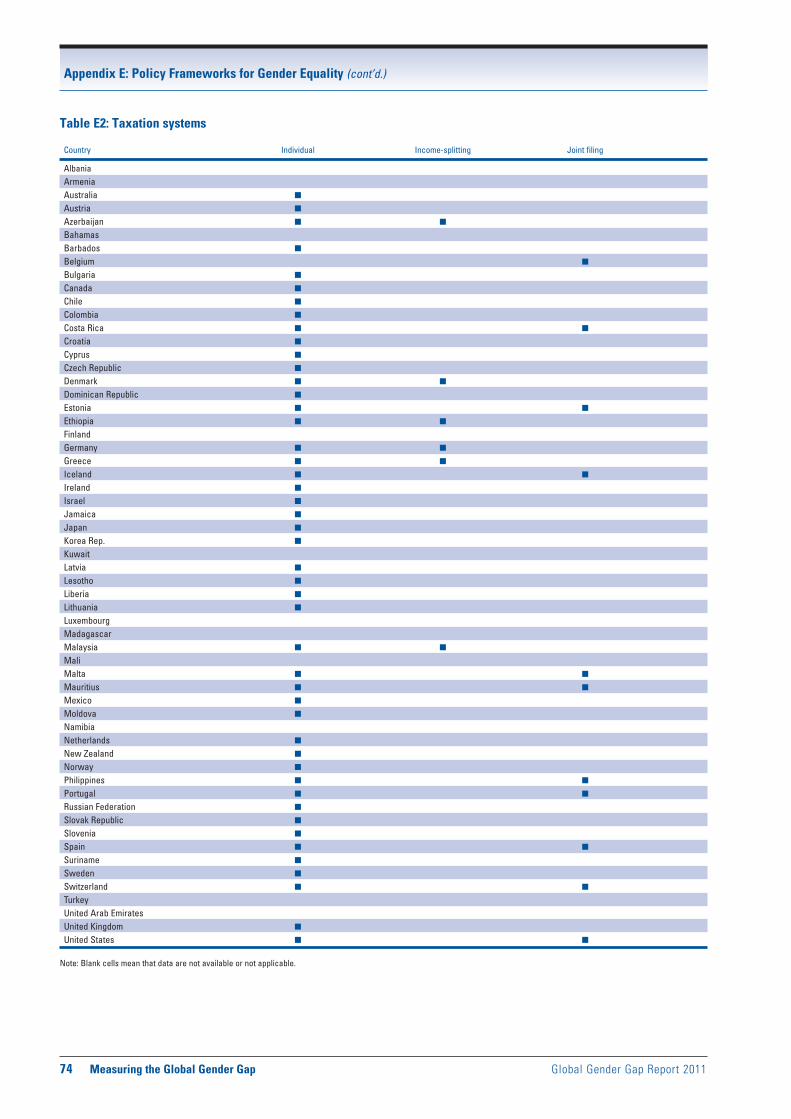
74 Measuring the Global Gender Gap Global Gender Gap Report 2011
Appendix E: Policy Frameworks for Gender Equality (cont’d.)
Table E2: Taxation systems
Country Individual Income-splitting Joint filing
Albania Armenia Australia n Austria n Azerbaijan n n Bahamas Barbados n Belgium n
Bulgaria n Canada n Chile n Colombia n Costa Rica n n
Croatia n Cyprus n Czech Republic n Denmark n n Dominican Republic n Estonia n n
Ethiopia n n Finland Germany n n Greece n n Iceland n n
Ireland n Israel n Jamaica n Japan n Korea Rep. n Kuwait Latvia n Lesotho n Liberia n Lithuania n Luxembourg Madagascar Malaysia n n Mali Malta n n
Mauritius n n
Mexico n Moldova n Namibia Netherlands n New Zealand n Norway n Philippines n n
Portugal n n
Russian Federation n Slovak Republic n Slovenia n Spain n n
Suriname n Sweden n Switzerland n n
Turkey United Arab Emirates United Kingdom n United States n n
Note: Blank cells mean that data are not available or not applicable.

Global Gender Gap Report 2011 Measuring the Global Gender Gap 75
Appendix E: Policy Frameworks for Gender Equality (cont’d.)
Table E3: Legislative support
Legislation Legislation Legislation Legislation imposing for mandatory % for mandatory % Allowances/ prohibiting gender-neutral of both genders of both genders subventions gender-based practices in corporate in political Monitoring Gender equality to female Country discrimination at workplace boards assemblies authority labels* entrepreneurs
Albania n n n n Armenia n n n Australia n n n n n
Austria n n n n Azerbaijan n n n n Bahamas n n Barbados n Belgium n n n n n n Bulgaria n n n n n
Canada n n n Chile n n n n Colombia n n n n n n n
Costa Rica n n n n n n
Croatia n n n n n n
Cyprus n n n Czech Republic n n n n Denmark n n n Dominican Republic n n n n n
Estonia n n n Ethiopia n n n n n n n
Finland Germany n n n n Greece n n n n n n
Iceland n n n n n n n
Ireland n n n n n n
Israel n n n n Jamaica n n Japan n n n Korea, Rep. n n n n n n
Kuwait n n n n
Latvia n n n n n
Lesotho n n n Liberia n n Lithuania n n n n Luxembourg n n n n Madagascar n n Malaysia n n n
Mali n n n
Malta n n n n n n
Mauritius n n n Mexico n n n n n Moldova n n Namibia n n n n n Netherlands n n n n New Zealand n n n Norway n n n n n
Philippines n n n n Portugal n n n n n n
Russian Federation n Slovak Republic n n n Slovenia n n n n Spain n n n n n Suriname n n n
Sweden n n n Switzerland n n n n Turkey n n n n
United Arab Emirates n n United Kingdom n n n United States n n n n
Note: Blank cells mean that data are not available or not applicable.* Gender equality labels are labels, awards and initiatives rewarding leading organizations committed to gender equality at work.

76 Measuring the Global Gender Gap Global Gender Gap Report 2011
Appendix E: Policy Frameworks for Gender Equality (cont’d.)
Figure E3: Legislation prohibiting gender-based discrimination
n Yes (95%)
No (5%)
Figure E5: Legislation for mandatory percentage of both genders in corporate boards
n Yes (20%)
No (80%)
Figure E6: Legislation for mandatory percentage of both genders in political assemblies
n Yes (32%)
No (68%)
Figure E4: Legislation imposing gender-neutral practices at workplace
n Yes (88%)
No (12%)
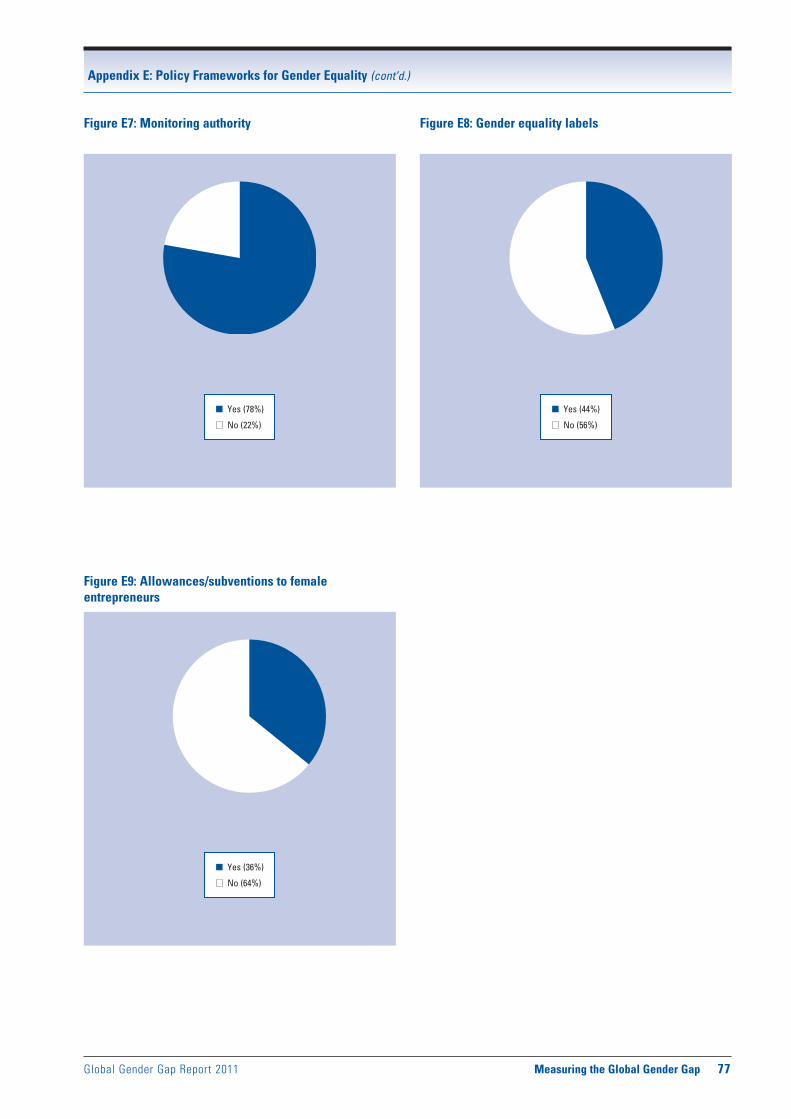
Global Gender Gap Report 2011 Measuring the Global Gender Gap 77
Appendix E: Policy Frameworks for Gender Equality (cont’d.)
Figure E7: Monitoring authority
n Yes (78%)
No (22%)
Figure E9: Allowances/subventions to female entrepreneurs
n Yes (36%)
No (64%)
Figure E8: Gender equality labels
n Yes (44%)
No (56%)

Part 2Country Profiles

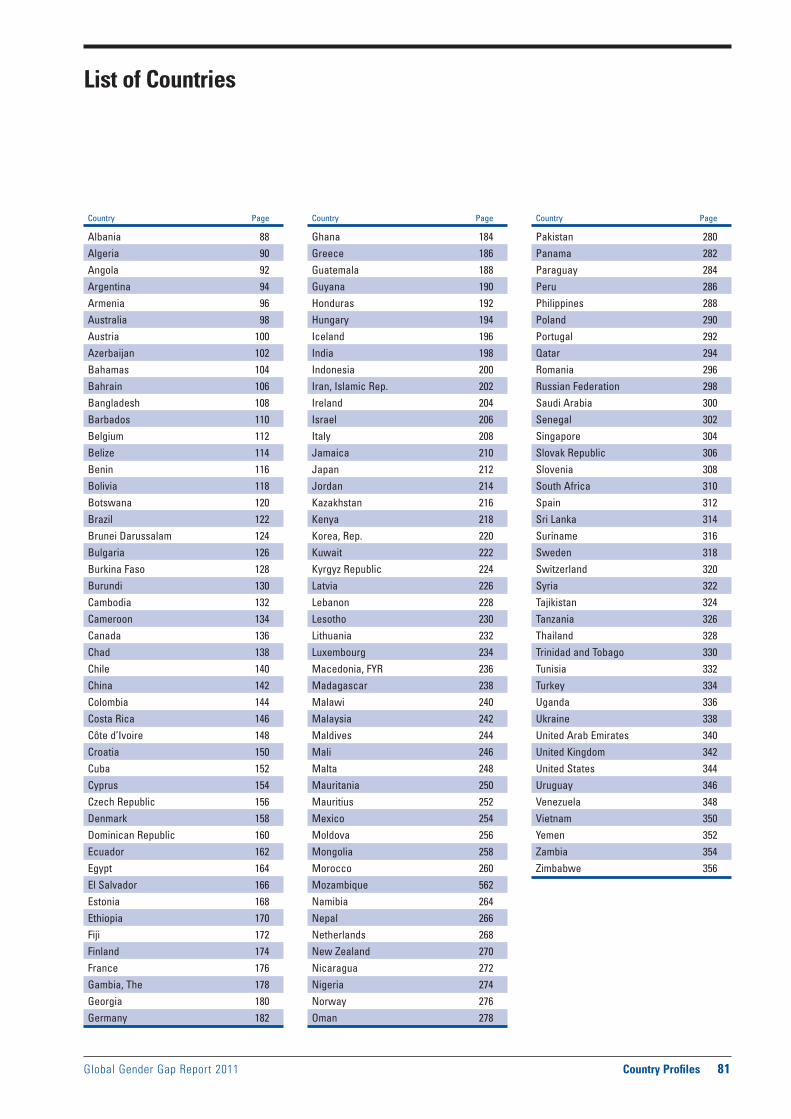
List of Countries
Country Page
Albania 88Algeria 90Angola 92Argentina 94Armenia 96Australia 98Austria 100Azerbaijan 102Bahamas 104Bahrain 106Bangladesh 108Barbados 110Belgium 112Belize 114Benin 116Bolivia 118Botswana 120Brazil 122Brunei Darussalam 124Bulgaria 126Burkina Faso 128Burundi 130Cambodia 132Cameroon 134Canada 136Chad 138Chile 140China 142Colombia 144Costa Rica 146Côte d’Ivoire 148Croatia 150Cuba 152Cyprus 154Czech Republic 156Denmark 158Dominican Republic 160Ecuador 162Egypt 164El Salvador 166Estonia 168Ethiopia 170Fiji 172Finland 174France 176Gambia, The 178Georgia 180Germany 182
Country Page
Ghana 184Greece 186Guatemala 188Guyana 190Honduras 192Hungary 194Iceland 196India 198Indonesia 200Iran, Islamic Rep. 202Ireland 204Israel 206Italy 208Jamaica 210Japan 212Jordan 214Kazakhstan 216Kenya 218Korea, Rep. 220Kuwait 222Kyrgyz Republic 224Latvia 226Lebanon 228Lesotho 230Lithuania 232Luxembourg 234Macedonia, FYR 236Madagascar 238Malawi 240Malaysia 242Maldives 244Mali 246Malta 248Mauritania 250Mauritius 252Mexico 254Moldova 256Mongolia 258Morocco 260Mozambique 562Namibia 264Nepal 266Netherlands 268New Zealand 270Nicaragua 272Nigeria 274Norway 276Oman 278
Country Page
Pakistan 280Panama 282Paraguay 284Peru 286Philippines 288Poland 290Portugal 292Qatar 294Romania 296Russian Federation 298Saudi Arabia 300Senegal 302Singapore 304Slovak Republic 306Slovenia 308South Africa 310Spain 312Sri Lanka 314Suriname 316Sweden 318Switzerland 320Syria 322Tajikistan 324Tanzania 326Thailand 328Trinidad and Tobago 330Tunisia 332Turkey 334Uganda 336Ukraine 338United Arab Emirates 340United Kingdom 342United States 344Uruguay 346Venezuela 348Vietnam 350Yemen 352Zambia 354Zimbabwe 356
Global Gender Gap Report 2011 Country Profiles 81


Global Gender Gap Report 2011 Country Profiles 83
Country Profiles: Page 1The �rst page of the Country Pro�les displays some key indicators for each country, followed by details of each of the 14 indicators that are used to build the Global Gender Gap Index.
Key IndicatorsThe �rst section presents the following indicators:
• TheGlobalGenderGapIndex2011giveseachcoun-try’s overall performance in closing the gender gap on a 0-to-1 scale and its rank out of 135 reviewed countries.
• Totalpopulation(inmillionsofinhabitants):Sourceisthe World Bank’s World Development Indicators & Global Development Finance Online Database (accessed August 2011).
• PopulationGrowth(annualpercentage):SourceistheWorld Bank’s World Development Indicators & Global Development Finance Online Database (accessed August 2011).
• GDP(constant2000US$,inbillionsofUSdollars):Source is the World Bank’s World Development Indicators & Global Development Finance Online Database (accessed August 2011).
• GDPpercapitaPPP(constant2005internationaldol-lars): Source is the World Bank’s World Development Indicators & Global Development Finance Online Database (accessed August 2011).
• Thespiderchartintheupperright-handsidecomparesthe country’s score for each of the four subindexes of The Global Gender Gap Report 2011 with the average score across all 135 countries. The centre of the chart corresponds to the lowest possible score (0), while the outermost corners of the chart correspond to the high-est possible score (1), or equality. Please note that the equality benchmark is 1 for all variables, except sex ratio at birth (0.944) and healthy life expectancy (1.06). Therefore, the equality benchmark of 1 for the health and survival subindex is not strictly accurate.
Female-to-male ratio
0.00 = INEQUALITY 1.00 = EQUALITY 1.50
0.00 = INEQUALITY 1.00 = EQUALITY 1.50
0.00 = INEQUALITY 1.00 = EQUALITY 1.50
0.00 = INEQUALITY 1.00 = EQUALITY 1.50
Female-to-male ratio
Female-to-male ratio
Female-to-male ratio
10 Country Profi les Global Gender Gap Report 2011
Sample Female-to- Rank Score average Female Male male ratio
country score sample average
0.00 = inequality 1.00 = equality
0.00
0.20
0.40
0.60
0.80
1.00Economy
Education
Politics
Health
Rank Score (out of 135 countries) (0.00 = inequality, 1.00 = equality)
Gender Gap Subindexes
Economic Participation and Opportunity ......... 38 0.713 0.588
Labour force participation .................................... 82 0.73 0.68 56 76 0.73
Wage equality for similar work (survey) .............. 3 0.82 0.65 — — 0.82
Estimated earned income (PPP US$) ................. 82 0.54 0.52 6,172 11,327 0.54
Legislators, senior offi cials, and managers ......— — 0.26 — — —
Professional and technical workers ..................— — 0.64 — — —
Educational Attainment ........................................ 87 0.981 0.928
Literacy rate ............................................................ 75 0.97 0.86 95 97 0.97
Enrolment in primary education ........................ 107 0.98 0.98 84 86 0.98
Enrolment in secondary education ..................... 90 0.98 0.90 73 74 0.98
Enrolment in tertiary education ............................. 1 1.00 0.86 23 15 1.57
Health and Survival ............................................. 135 0.927 0.956
Sex ratio at birth (female/male) ......................... 132 0.89 0.92 — — 0.89
Healthy life expectancy ...................................... 118 1.00 1.04 64 64 1.00
Political Empowerment ........................................ 99 0.078 0.185
Women in parliament ............................................ 73 0.20 0.22 16 84 0.20
Women in ministerial positions ......................... 108 0.07 0.18 7 93 0.07
Years with female head of state (last 50) .......... 52 0.00 0.16 0 50 0.00
AlbaniaGender Gap Index 2011 78 0.675
Key Indicators
Total population (millions) 3.17
Population growth (%) 0.44
GDP (US$ billions) 6.14
GDP (PPP) per capita 7,745
User’s Guide: How Country Profiles WorkYASMINA BEKHOUCHE
MARC CUÉNOD
SAADIA ZAHIDI
World Economic Forum

84 Country Profiles Global Gender Gap Report 2011
Gender Gap SubindexesThis section gives an overview of each country’s rank-ings and the scores on the four subindexes of The Global Gender Gap Report 2011.
• ForeachofthevariablesthatenterintotheGlobalGender Gap Index 2011, column one in this section displays ranks, column two displays the country scores, column three displays the population-weighted sample average (135 countries), column four displays the female value, column �ve displays the male value and, �nally, column six displays the female-to-male ratio. To calculate the Index, all ratios were truncated at the equality benchmark of 1 (for more details, please refer to chapter) and thus the highest score possible is 1—except for the sex ratio at birth (0.944) and the healthy life expectancy (1.06). In the case of countries where women surpass men on particular variables, the reader can refer to the exact female and male values as well as the female-to-male ratio to understand the magnitude of the female advantage.
• Thebarchartsvisuallydisplaythefemale-to-maleratiofor each of the 14 variables, allowing the reader to see clearly when the female-to-male ratio is above or below the equality benchmark. Values above 1 (the equality benchmark) favour women and values below 1 favour men. Please note that the equality benchmark is 1 for all variables except sex ratio at birth (0.944) and healthy life expectancy (1.06). Therefore, the equality benchmark of 1 in the bar charts for these two variables is not strictly accurate. Finally, in the few cases where ratio exceeds the scale of the bar chart (which ends at 1.5), the reader should refer to the number under the “female-to-male ratio” column for the actual value.
• Thefemaleandmalevaluesaredisplayedwithoutdecimals in order to facilitate reading. For example, the values for women in parliament or women in ministe-rial positions are on a scale of 0 to 100 and the value of the number of years with a female head of state is on a scale of 0 to 50. Due to rounding, data that represent less than six months are displayed as zero. The reader can refer to the female-over-male ratio in order to see the accurate picture.
• Thelabourforceparticipationratereferstothe15-to-64-year-old age bracket.
• Theestimatedearnedincomevaluehasbeencal-culated using the methodology of the United Nations Development Programme (UNDP)’s Human Development Report 2007/2008 (displayed in technical note 1, addendum, p. 361). According to the UNDP, because of lack of gender-disaggregated income data, female and male earned income �gures are crudely estimated on the basis of data on the ratio of the female non-agricultural wage to the male non-agricultural
wage, the female and male percentage share of the eco-nomically active population, the total female and male population and the GDP per capita in purchase power parity (PPP) (current international $). The wage ratios used in this calculation are based on data for the most recent year available. Please note that for the purpose of index calculations, the UNDP scales downward the female and male values to re�ect the maximum values of adult literacy (99%), gross enrolment ratios (100%) and the estimated earned income (40,000) (PPP US$).
• Forthe“legislators,seniorofficialsandmanagers”andthe “professional and technical workers” variables, we have previously reported Major Group 1 (Totally and Economically Active Population) and Major-Sub Group 1D (Economically Active Population, by occupation and status in employment) from the ILO’s ISCO (88) – International Standard Classi�cation of Occupations. We are now continuing to use Major Group Employment and Major Sub-Group 2C (Total Employment, by occupation) (thousands) in order to remain consistent with the data obtained from the UNDP.
• EstimatesforcountriesthathaveimplementedtheInternational Standard Classi�cation of Occupations (ISCO-88) are not strictly comparable with those for countries using the previous classi�cation (ISCO-68).
• Forestimationpurposes,avalueof99%literacyrateis used for developed countries. This is because these countries no longer use the traditional measure of lit-eracy, on which the UIS literacy data are used, which is based on the individual or household response to the question “Can you read and write” on a national census or household survey. Many countries are now undertaking “literacy assessments” in order to measure “functional levels of literacy”.
• Dataupdatesarenotmadeinallmajorinternationaldatabases annually. The ministerial positions data from the IPU has not been updated this year. Labour force participation data and life expectancy data had also not been revised at the time of Index calculations in 2011.
• Theabbreviation“femaleheadofstate”isusedtodescribe an elected female head of state or head of government. Some overlap between ministers and head of states who hold a ministerial position might occur. Egypt and Tunisia’s political empowerment data has been repeated from last year in order to view other changes without the added distortion of missing data or complete removal of a country from the Index.

Global Gender Gap Report 2011 Country Profiles 85
Country Profiles: Page 2
Evolution 2006–2011The �rst section of the second page of the Country Pro�les presents the evolution of the overall performance of countries in the Global Gender Gap Index from 2006 to 2011 (or a shorter period if a country was included after 2006) and in the four subindexes (economic partici-pation and opportunity, educational attainment, health and survival and political empowerment), measured by changes in rank and score (on a 0-to-1 scale).
Evolution of Scores 2006–2011
The second section of this page provides a graph depicting the evolution of countries’ performance across the overall Gender Gap Index and the four subindexes (on a 0-to-1 scale).
Additional DataThe last section compiles a selection of internationally available data that provide a more comprehensive over-view of a country’s gender gap, and includes social and policy indicators. These data were not used to calculate the Global Gender Gap Index 2011. The indicators in this section are displayed in �ve broad categories: Economic Empowerment, Education, Marriage and Childbearing, Social Institutions and Political Rights and Childcare Ecosystem.
Economic Empowerment
• Femaleandmaleadultunemploymentrates(%offemale labour force and male labour force, respectively): Source is the World Bank’s World dataBank, World Development Indicators, online database, 2009 or latest available data (accessed May 2011).
• Womeninnon-agriculturalpaidlabour(%oftotal labour force): Source is the United Nations, Department of Economic and Social A�airs, UN Statistics division, Millennium Development Goals Indicators, 2008 or latest available data and the World Bank’s World dataBank, World Development Indicators, online database, 2009 or latest available data (accessed May 2011).
• Inheritancepracticesinfavourofmaleheirs:Sourceis the OECD’s Gender, Institutions and Development Database 2009 (GID-DB) (accessed May 2011). The numbers are on a 0-to-1 scale, where 1 is the worst possible score and 0 the best possible score.
• Firmswithfemaleparticipationinownership(%of�rms): Source is the World Bank’s World dataBank, World Development Indicators, online database, 2010 or latest available data (accessed May 2011).
Global Gender Gap Report 2011 Country Profi les 11
Economic Participation and Opportunity Educational Attainment Health and Survival Political Empowerment
Evolution 2006–2011
1 Survey data, responses on a 1-to-7 scale (1 = worst score, 7 = best score)2 Data on a 0-to-1 scale (1 = worst score, 0 = best score)3 Data on a 1-to-5 scale (1 = worst score, 5 = best score)4 Bracketed numbers show the range between the uncertainties, estimated
to contain the true maternal mortality ratio with a 95% probability
ECONOMIC EDUCATIONAL HEALTH AND POLITICAL OVERALL PARTICIPATION ATTAINMENT SURVIVAL EMPOWERMENT
Rank Score Rank Score Rank Score Rank Score Rank Score
0.0
0.2
0.4
0.6
0.8
1.0
2006 2007 2008 2009 2010 2011
Additional Data
Economic EmpowermentFemale adult unemployment rate (% of female labour force) .......28Male adult unemployment rate (% of male labour force) ..............19Women in non-agricultural paid labour
(% of total labour force) ....................................................................33Inheritance practices in favour of male heirs2 ..............................0.00Firms with female participation in ownership (% of fi rms) ............11Women’s access to land ownership2 .............................................0.50Women’s access to bank loans2 ......................................................0.00Women’s access to property other than land2 .............................0.50Women’s access to fi nance programmes3 .........................................1Ability of women to rise to positions of
enterprise leadership1 ....................................................................5.67
EducationFemale teachers, primary education (%) ..........................................82Female teachers, secondary education (%) .....................................62Female teachers, tertiary education (%) ...........................................41Female school life expectancy, primary to secondary (years)......10Male school life expectancy, primary to secondary (years) .........10
Marriage and ChildbearingMean age of marriage for women (years) ........................................23Early marriage (% women, aged 15–19) ..............................................8Fertility rate (births per woman) .......................................................1.90Adolescent fertility rate (births per 1,000 women, aged 15–19) ....17Antenatal care coverage, at least one visit (%) ...............................97Births attended by skilled health staff (%) ........................................99Maternal mortality ratio (per 100,000 live births)4 ...............31 [19-50]Contraceptive prevalence, married women (%) ..............................60Female HIV prevalence, aged 15–49 (%) .......................................... —Male HIV prevalence, aged 15–49 (%) .............................................. —Infant mortality rate (per 1,000 live births) ........................................13Overall population sex ratio (male/female) ....................................0.97
Social Institutions and Political RightsPaternal versus maternal authority2................................................0.50Female genital mutilation2 .................................................................0.00Acceptance or legality of polygamy2 ..............................................0.00Existence of legislation punishing acts
of violence against women2 ..........................................................0.75Year women received right to vote ................................................1920Quota type ................................................Legislated candidate quotasExistence of legislation prohibiting
gender-based discrimination ........................................................ Yes
Childcare EcosystemLength of maternity leave ........................................ 365 calendar daysMaternity leave benefi ts (% of wages paid) ................................. 80%
prior to birth and for 150 days after birth, and 50% for the rest of the leave period
Provider of maternity coverage ..................Social insurance systemLength of paternity leave ..................................................................... —Paternity leave benefi ts (% of wages paid) ..................................... —Daycare options ......................................................................Public and
private day care centres with allowance
AlbaniaGender Gap Index 2011 (out of 135 countries) 78 0.675 38 0.713 87 0.981 135 0.927 99 0.078
Gender Gap Index 2010 (out of 134 countries) 78 0.673 51 0.681 52 0.994 131 0.937 97 0.079
Gender Gap Index 2009 (out of 134 countries) 91 0.660 63 0.653 73 0.991 122 0.955 125 0.041
Gender Gap Index 2008 (out of 130 countries) 87 0.659 62 0.649 68 0.991 118 0.955 119 0.041
Gender Gap Index 2007 (out of 128 countries) 66 0.668 36 0.689 48 0.992 116 0.955 117 0.038
Gender Gap Index 2006 (out of 115 countries) 61 0.661 38 0.661 58 0.989 110 0.955 105 0.038
86 Country Profiles Global Gender Gap Report 2011
to secondary (years): Source of these two variables is the UNESCO Institute of Statistic’s Education Statistics online database, 2010 or latest available data (accessed August 2011).
Marriage and Childbearing
• Meanageofmarriageforwomen(years):SourceistheUnited Nations, Department of Economic and Social A�airs, UN Statistics Division, Statistics and Indicators on Women and Men 2010 (accessed May 2011).
• Earlymarriage(%womenaged15–19):SourceistheOECD’s Gender, Institutions and Development Database 2009 (GID-DB) (accessed May 2011). Share of girls between 15 and 19 years of age who are currently mar-ried, divorced or widowed (accessed May 2011).
• Fertilityrate(birthsperwoman):SourceistheWorldHealth Organization’s Global Health Observatory, World Health Statistics, Demographic and Socioeconomic Statistics, 2009 (accessed May 2011).
• Adolescentfertilityrate(birthsper1,000womenaged15–19): Source is the World Health Organization, Global Health Observatory, Health-related Millennium Development Goals, Maternal health, 2008 or latest avail-able data (accessed May 2011).
• Antenatalcarecoverage–atleastonevisit(%):Sourceis the World Health Organization, Global Health Observatory, Health-related Millennium Development Goals, Maternal health, 2010 or latest available data (accessed May 2011).
• Birthsattendedbyskilledhealthstaff(percentage):Source is the World Health Organization, Global Health Observatory, Health-related Millennium Development Goals, Maternal health, 2010 or latest available data (accessed May 2011).
• Maternalmortalityratio(per100,000livebirths):Source is the World Health Organization, Global Health Observatory, Health-related Millennium Development Goals, MDG 5: Maternal health (accessed May 2011)
• Contraceptiveprevalenceofmarriedwomen(per-centage, any method): Source is the United Nations, Department of Economic and Social A�airs, Statistics Division, Statistics and Indicators on Women and Men, 2008 or latest available data (accessed May 2011).
• FemaleHIVprevalence,aged15–49(%)andmaleHIV prevalence, aged 15–49 (%): Source is UNAIDS, Unpublished table based on 2010 UNAIDS Report on the Global AIDS Epidemic (provided by the UNAIDS in September 2011).
• Infantmortalityrate(per1,000livebirths):Sourceis the World Health Organization, Global Health
• Women’saccesstolandownership,Women’saccesstobank loan, Women’s access to property other than land: Source of all these variables is the OECD’s Gender, Institutions and Development Database 2009 (GID-DB) (accessed May 2011). The numbers are on a 0-to-1 scale, where 1 is the worst possible score and 0 the best possible score.
• Women’saccesstofinanceprogrammes:SourceistheEconomist Intelligence Unit, the Women’s Economic Opportunity Index (accessed July 2011). It assesses three types of programmes: (1) initiatives to provide �nancial accounts to women (for example, current accounts, sav-ings accounts and deposit accounts); (2) outreach e�orts aimed at improving women entrepreneurs’ access to credit/loans/lines of credit, etc.; and (3) provision of �nancial literacy and/or risk-management programmes to women. The scoring for this indicator is as follows:1 = None of the three programmes are available; 2 = Only one of the three programmes is available, but it is limited in scope (less than 20% of women in the formal sector have access); 3 = Two of the three programmes are available, but they are modest in scope (about 50% of women in the formal sector have access)/or only one of the three programmes is available, but it is reason-ably broad in scope (about 70% of women in the formal sector have access); 4 = Two of the three programmes are available, and they are reasonably broad in scope (about 70% of women in the formal sector have access)/or women’s access to �nancial services is already very broad, so these programmes are largely unnecessary; 5 = All three programmes are available, they are com-prehensive in scope/ or women’s access to �nancial services is already widespread, so these programmes are unnecessary. The numbers are on a 1-to-5 scale, where 1 is the worst possible score and 5 the best possible score.
• Abilityofwomentorisetoenterpriseleadership:Source is the World Economic Forum’s Executive Opinion Survey 2011. Survey question is as follows: “In your country, do businesses provide women the same opportunities as men to rise to positions of leader-ship? (1 = no, women are unable to rise to positions of leadership; 7 = yes, women are often in management positions)”.
Education
• Femaleteachersinprimaryeducation(percentage),female teachers in secondary education (percentage) and female teachers in tertiary education (percentage): Source of all these variables is the UNESCO Institute for Statistics Education Statistics online database, 2010 or latest available data (accessed May 2011).
• Femaleschoollifeexpectancy,primarytosecond-ary (years) and male school life expectancy, primary
Global Gender Gap Report 2011 Country Profiles 87
Observatory, Health-related Millennium Development Goals, Child mortality, 2009 (accessed May 2011).
• Overallpopulationsexratio(male/female):Sourceisthe United Nations, Department of Economic and Social A�airs, UN Statistics Division, Statistics and Indicators on Women and Men 2010 or latest available data (accessed May 2011).
Social Institutions and Political Rights
• Paternalversusmaternalauthority,Femalegenitalmutilation, Acceptance or legality of polygamy and Existence of legislation punishing acts of violence against women: Source of all these variables is the OECD’s Gender, Institutions and Development Database 2009 (GID-DB) (accessed May 2011). The numbers are on a 0-to-1 scale, where 1 is the worst possible score and 0 the best possible score.
• Yearwomenreceivedtherighttovote:SourceistheUNDP’s Human Development Report 2009 (accessed May 2011). Data refer to the year in which the right to vote or stand for election on a universal and equal basis was recognized. Where two years are shown, the �rst refers to the �rst partial recognition of the right to vote or stand for election.
• Quotatype:SourceisTheInternationalInstituteforDemocracy and Electoral Assistance, The Stockholm University and The Inter-Parliamentarian Union, QuotaProject, Global Database of Quotas for women (accessed in September 2011) (www.quotaproject.org).
• Existenceoflegislationprohibitinggender-baseddis-crimination: Source is a special survey by the World Economic Forum. Refer to Appendix E for more details.
Childcare Ecosystem
• Lengthofpaidmaternityleave,Maternityleaveben-e�ts (% of wages paid in covered period) and Provider of maternity coverage: Source is the United Nations, Department of Economic and Social A�airs, Statistics Division, Statistics and Indicators on Women and Men (accessed May 2011). The data presented refer to laws and regulations in force at the time of the compila-tion of the information (between 2004 and 2009). Last updated in December 2010.
• Lengthofpaternityleave,Paternityleavebenefits:Source is a special survey by the World Economic Forum. Refer to Appendix E for more details.
• Daycareoptions:SourceisaspecialsurveybytheWorld Economic Forum. Refer to Appendix E for more details.

Female-to-male ratio
0.00 = INEQUALITY 1.00 = EQUALITY 1.50
0.00 = INEQUALITY 1.00 = EQUALITY 1.50
0.00 = INEQUALITY 1.00 = EQUALITY 1.50
0.00 = INEQUALITY 1.00 = EQUALITY 1.50
Female-to-male ratio
Female-to-male ratio
Female-to-male ratio
88 Country Profiles Global Gender Gap Report 2011
Sample Female-to- Rank Score average Female Male male ratio
country score sample average
0.00 = inequality 1.00 = equality
0.00
0.20
0.40
0.60
0.80
1.00Economy
Education
Politics
Health
Rank Score(out of 135 countries) (0.00 = inequality, 1.00 = equality)
Gender Gap Subindexes
Economic Participation and Opportunity ......... 38 0.713 0.588
Labour force participation .................................... 82 0.73 0.68 56 76 0.73
Wage equality for similar work (survey) .............. 3 0.82 0.65 — — 0.82
Estimated earned income (PPP US$) ................. 82 0.54 0.52 6,172 11,327 0.54
Legislators, senior officials, and managers ......— — 0.26 — — —
Professional and technical workers ..................— — 0.64 — — —
Educational Attainment ........................................ 87 0.981 0.928
Literacy rate ............................................................ 75 0.97 0.86 95 97 0.97
Enrolment in primary education ........................ 107 0.98 0.98 84 86 0.98
Enrolment in secondary education ..................... 90 0.98 0.90 73 74 0.98
Enrolment in tertiary education ............................. 1 1.00 0.86 23 15 1.57
Health and Survival ............................................. 135 0.927 0.956
Sex ratio at birth (female/male) ......................... 132 0.89 0.92 — — 0.89
Healthy life expectancy ...................................... 118 1.00 1.04 64 64 1.00
Political Empowerment ........................................ 99 0.078 0.185
Women in parliament ............................................ 73 0.20 0.22 16 84 0.20
Women in ministerial positions ......................... 108 0.07 0.18 7 93 0.07
Years with female head of state (last 50) .......... 52 0.00 0.16 0 50 0.00
AlbaniaGender Gap Index 2011 78 0.675
Key Indicators
Total population (millions) 3.17
Population growth (%) 0.44
GDP (US$ billions) 6.14
GDP (PPP) per capita 7,745
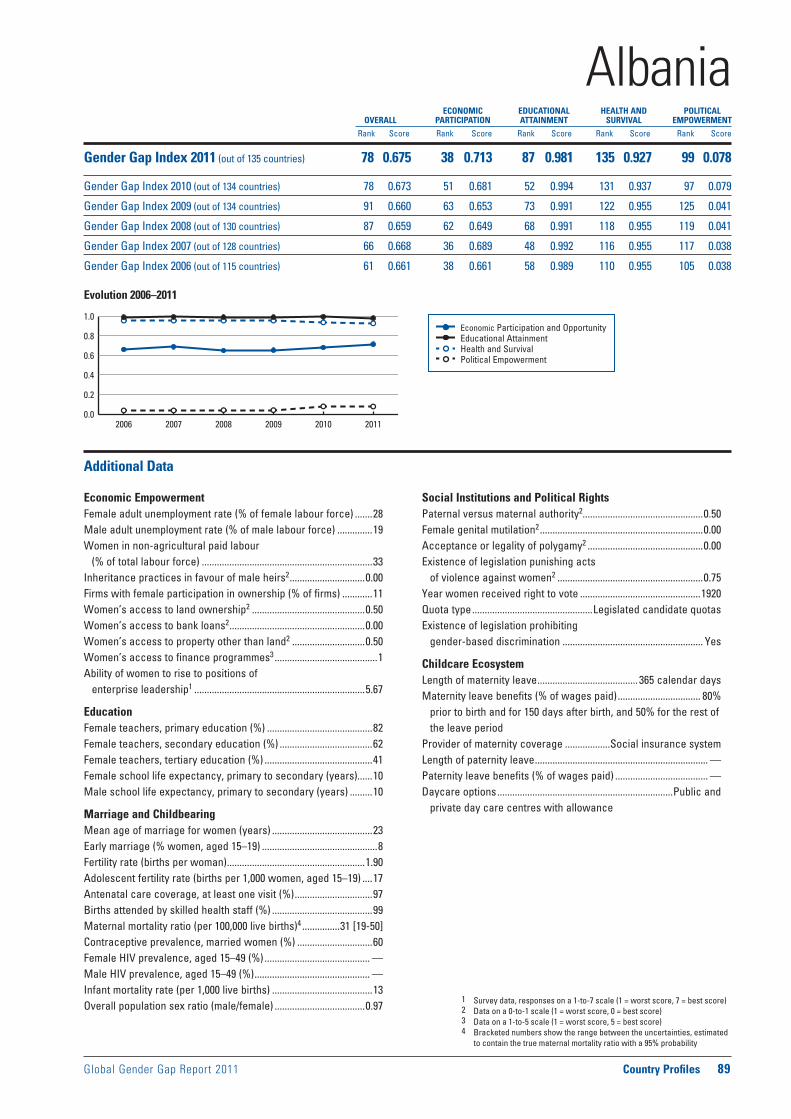
Global Gender Gap Report 2011 Country Profiles 89
Economic Participation and Opportunity Educational Attainment Health and Survival Political Empowerment
Evolution 2006–2011
1 Survey data, responses on a 1-to-7 scale (1 = worst score, 7 = best score)2 Data on a 0-to-1 scale (1 = worst score, 0 = best score)3 Data on a 1-to-5 scale (1 = worst score, 5 = best score)4 Bracketed numbers show the range between the uncertainties, estimated
to contain the true maternal mortality ratio with a 95% probability
ECONOMIC EDUCATIONAL HEALTH AND POLITICAL OVERALL PARTICIPATION ATTAINMENT SURVIVAL EMPOWERMENT
Rank Score Rank Score Rank Score Rank Score Rank Score
0.0
0.2
0.4
0.6
0.8
1.0
2006 2007 2008 2009 2010 2011
Additional Data
Economic EmpowermentFemale adult unemployment rate (% of female labour force) .......28Male adult unemployment rate (% of male labour force) ..............19Women in non-agricultural paid labour
(% of total labour force) ....................................................................33Inheritance practices in favour of male heirs2 ..............................0.00Firms with female participation in ownership (% of firms) ............11Women’s access to land ownership2 .............................................0.50Women’s access to bank loans2 ......................................................0.00Women’s access to property other than land2 .............................0.50Women’s access to finance programmes3 .........................................1Ability of women to rise to positions of
enterprise leadership1 ....................................................................5.67
EducationFemale teachers, primary education (%) ..........................................82Female teachers, secondary education (%) .....................................62Female teachers, tertiary education (%) ...........................................41Female school life expectancy, primary to secondary (years)......10Male school life expectancy, primary to secondary (years) .........10
Marriage and ChildbearingMean age of marriage for women (years) ........................................23Early marriage (% women, aged 15–19) ..............................................8Fertility rate (births per woman) .......................................................1.90Adolescent fertility rate (births per 1,000 women, aged 15–19) ....17Antenatal care coverage, at least one visit (%) ...............................97Births attended by skilled health staff (%) ........................................99Maternal mortality ratio (per 100,000 live births)4 ...............31 [19-50]Contraceptive prevalence, married women (%) ..............................60Female HIV prevalence, aged 15–49 (%) .......................................... —Male HIV prevalence, aged 15–49 (%) .............................................. —Infant mortality rate (per 1,000 live births) ........................................13Overall population sex ratio (male/female) ....................................0.97
Social Institutions and Political RightsPaternal versus maternal authority2................................................0.50Female genital mutilation2 .................................................................0.00Acceptance or legality of polygamy2 ..............................................0.00Existence of legislation punishing acts
of violence against women2 ..........................................................0.75Year women received right to vote ................................................1920Quota type ................................................Legislated candidate quotasExistence of legislation prohibiting
gender-based discrimination ........................................................ Yes
Childcare EcosystemLength of maternity leave ........................................ 365 calendar daysMaternity leave benefits (% of wages paid) ................................. 80%
prior to birth and for 150 days after birth, and 50% for the rest of the leave period
Provider of maternity coverage ..................Social insurance systemLength of paternity leave ..................................................................... —Paternity leave benefits (% of wages paid) ..................................... —Daycare options ......................................................................Public and
private day care centres with allowance
AlbaniaGender Gap Index 2011 (out of 135 countries) 78 0.675 38 0.713 87 0.981 135 0.927 99 0.078
Gender Gap Index 2010 (out of 134 countries) 78 0.673 51 0.681 52 0.994 131 0.937 97 0.079
Gender Gap Index 2009 (out of 134 countries) 91 0.660 63 0.653 73 0.991 122 0.955 125 0.041
Gender Gap Index 2008 (out of 130 countries) 87 0.659 62 0.649 68 0.991 118 0.955 119 0.041
Gender Gap Index 2007 (out of 128 countries) 66 0.668 36 0.689 48 0.992 116 0.955 117 0.038
Gender Gap Index 2006 (out of 115 countries) 61 0.661 38 0.661 58 0.989 110 0.955 105 0.038
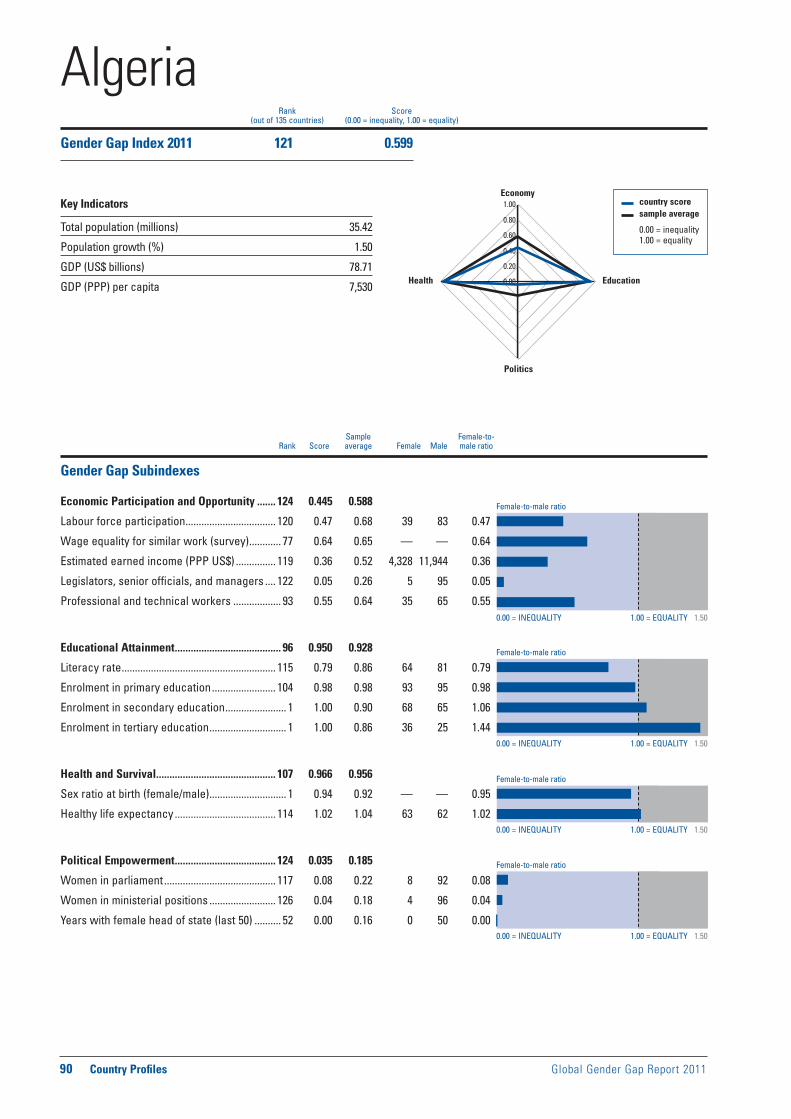
Female-to-male ratio
0.00 = INEQUALITY 1.00 = EQUALITY 1.50
0.00 = INEQUALITY 1.00 = EQUALITY 1.50
0.00 = INEQUALITY 1.00 = EQUALITY 1.50
0.00 = INEQUALITY 1.00 = EQUALITY 1.50
Female-to-male ratio
Female-to-male ratio
Female-to-male ratio
90 Country Profiles Global Gender Gap Report 2011
Sample Female-to- Rank Score average Female Male male ratio
country score sample average
0.00 = inequality 1.00 = equality
0.00
0.20
0.40
0.60
0.80
1.00Economy
Education
Politics
Health
Rank Score(out of 135 countries) (0.00 = inequality, 1.00 = equality)
Gender Gap Subindexes
Economic Participation and Opportunity ....... 124 0.445 0.588
Labour force participation .................................. 120 0.47 0.68 39 83 0.47
Wage equality for similar work (survey) ............ 77 0.64 0.65 — — 0.64
Estimated earned income (PPP US$) ............... 119 0.36 0.52 4,328 11,944 0.36
Legislators, senior officials, and managers .... 122 0.05 0.26 5 95 0.05
Professional and technical workers .................. 93 0.55 0.64 35 65 0.55
Educational Attainment ........................................ 96 0.950 0.928
Literacy rate .......................................................... 115 0.79 0.86 64 81 0.79
Enrolment in primary education ........................ 104 0.98 0.98 93 95 0.98
Enrolment in secondary education ....................... 1 1.00 0.90 68 65 1.06
Enrolment in tertiary education ............................. 1 1.00 0.86 36 25 1.44
Health and Survival ............................................. 107 0.966 0.956
Sex ratio at birth (female/male) ............................. 1 0.94 0.92 — — 0.95
Healthy life expectancy ...................................... 114 1.02 1.04 63 62 1.02
Political Empowerment ...................................... 124 0.035 0.185
Women in parliament .......................................... 117 0.08 0.22 8 92 0.08
Women in ministerial positions ......................... 126 0.04 0.18 4 96 0.04
Years with female head of state (last 50) .......... 52 0.00 0.16 0 50 0.00
AlgeriaGender Gap Index 2011 121 0.599
Key Indicators
Total population (millions) 35.42
Population growth (%) 1.50
GDP (US$ billions) 78.71
GDP (PPP) per capita 7,530

Global Gender Gap Report 2011 Country Profiles 91
Economic Participation and Opportunity Educational Attainment Health and Survival Political Empowerment
Evolution 2006–2011
1 Survey data, responses on a 1-to-7 scale (1 = worst score, 7 = best score)2 Data on a 0-to-1 scale (1 = worst score, 0 = best score)3 Data on a 1-to-5 scale (1 = worst score, 5 = best score)4 Bracketed numbers show the range between the uncertainties, estimated
to contain the true maternal mortality ratio with a 95% probability
ECONOMIC EDUCATIONAL HEALTH AND POLITICAL OVERALL PARTICIPATION ATTAINMENT SURVIVAL EMPOWERMENT
Rank Score Rank Score Rank Score Rank Score Rank Score
0.0
0.2
0.4
0.6
0.8
1.0
2006 2007 2008 2009 2010 2011
Additional Data
Economic EmpowermentFemale adult unemployment rate (% of female labour force) .......10Male adult unemployment rate (% of male labour force) ..............11Women in non-agricultural paid labour
(% of total labour force) ....................................................................13Inheritance practices in favour of male heirs2 ..............................0.50Firms with female participation in ownership (% of firms) ............15Women’s access to land ownership2 .............................................0.50Women’s access to bank loans2 ......................................................0.00Women’s access to property other than land2 .............................0.00Women’s access to finance programmes3 .........................................2Ability of women to rise to positions of
enterprise leadership1 ....................................................................4.01
EducationFemale teachers, primary education (%) ..........................................51Female teachers, secondary education (%) .....................................49Female teachers, tertiary education (%) ...........................................38Female school life expectancy, primary to secondary (years)......12Male school life expectancy, primary to secondary (years) .........12
Marriage and ChildbearingMean age of marriage for women (years) ........................................29Early marriage (% women, aged 15–19) ..............................................4Fertility rate (births per woman) .......................................................2.40Adolescent fertility rate (births per 1,000 women, aged 15–19) ......4Antenatal care coverage, at least one visit (%) ...............................89Births attended by skilled health staff (%) ........................................95Maternal mortality ratio (per 100,000 live births)4 ...........120 [61-220]Contraceptive prevalence, married women (%) ..............................61Female HIV prevalence, aged 15–49 (%) ......................................<0.10Male HIV prevalence, aged 15–49 (%) ............................................0.10Infant mortality rate (per 1,000 live births) ........................................29Overall population sex ratio (male/female) ....................................1.02
Social Institutions and Political RightsPaternal versus maternal authority2................................................1.00Female genital mutilation2 .................................................................0.00Acceptance or legality of polygamy2 ..............................................0.50Existence of legislation punishing acts
of violence against women2 ..........................................................0.75Year women received right to vote ................................................1962Quota type ..........................................................................No legislated;
voluntary political party quotasExistence of legislation prohibiting
gender-based discrimination .......................................................... —
Childcare EcosystemLength of maternity leave ........................................................14 weeksMaternity leave benefits (% of wages paid) ...................................100Provider of maternity coverage ...................................Social securityLength of paternity leave ..................................................................... —Paternity leave benefits (% of wages paid) ..................................... — Daycare options .................................................................................... —
AlgeriaGender Gap Index 2011 (out of 135 countries) 121 0.599 124 0.445 96 0.950 107 0.966 124 0.035
Gender Gap Index 2010 (out of 134 countries) 119 0.605 119 0.467 99 0.953 106 0.966 123 0.035
Gender Gap Index 2009 (out of 134 countries) 117 0.612 119 0.470 99 0.951 91 0.971 120 0.056
Gender Gap Index 2008 (out of 130 countries) 111 0.611 115 0.468 96 0.949 86 0.971 115 0.056
Gender Gap Index 2007 (out of 128 countries) 108 0.607 113 0.464 96 0.942 85 0.971 111 0.049
Gender Gap Index 2006 (out of 115 countries) 97 0.602 103 0.443 84 0.944 78 0.971 98 0.049
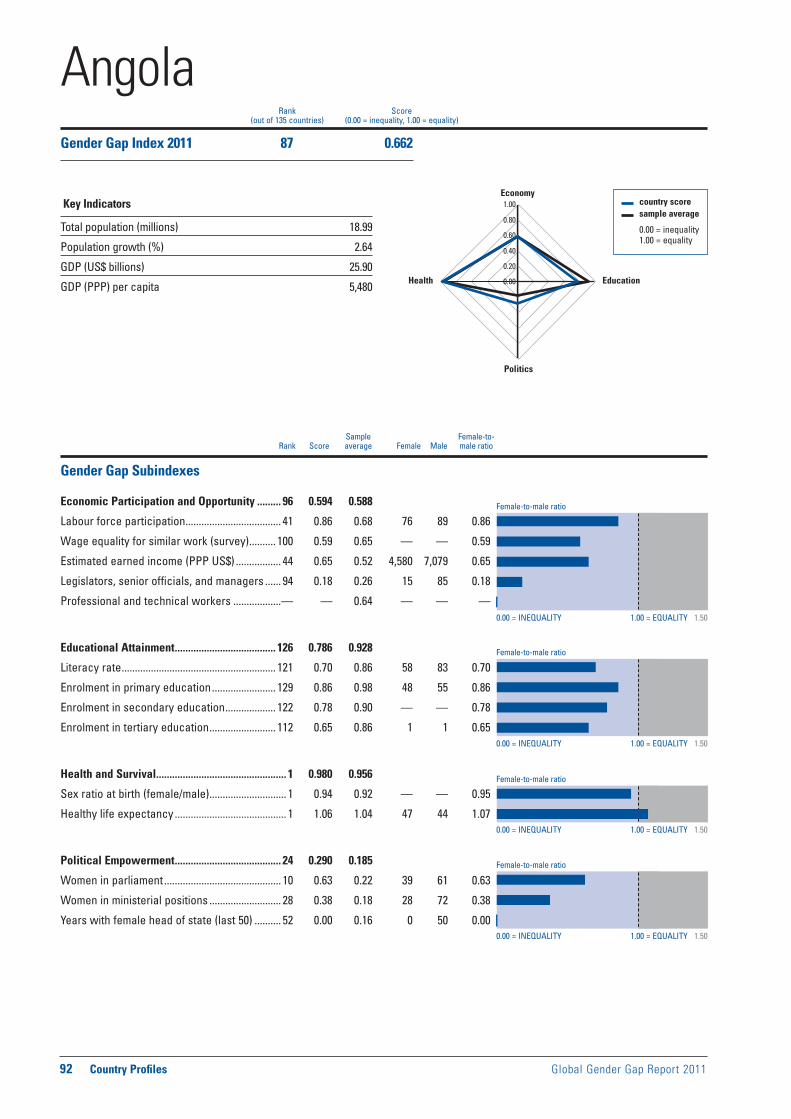
Female-to-male ratio
0.00 = INEQUALITY 1.00 = EQUALITY 1.50
0.00 = INEQUALITY 1.00 = EQUALITY 1.50
0.00 = INEQUALITY 1.00 = EQUALITY 1.50
0.00 = INEQUALITY 1.00 = EQUALITY 1.50
Female-to-male ratio
Female-to-male ratio
Female-to-male ratio
92 Country Profiles Global Gender Gap Report 2011
Sample Female-to- Rank Score average Female Male male ratio
country score sample average
0.00 = inequality 1.00 = equality
0.00
0.20
0.40
0.60
0.80
1.00Economy
Education
Politics
Health
Rank Score(out of 135 countries) (0.00 = inequality, 1.00 = equality)
Gender Gap Subindexes
Economic Participation and Opportunity ......... 96 0.594 0.588
Labour force participation .................................... 41 0.86 0.68 76 89 0.86
Wage equality for similar work (survey) .......... 100 0.59 0.65 — — 0.59
Estimated earned income (PPP US$) ................. 44 0.65 0.52 4,580 7,079 0.65
Legislators, senior officials, and managers ...... 94 0.18 0.26 15 85 0.18
Professional and technical workers ..................— — 0.64 — — —
Educational Attainment ...................................... 126 0.786 0.928
Literacy rate .......................................................... 121 0.70 0.86 58 83 0.70
Enrolment in primary education ........................ 129 0.86 0.98 48 55 0.86
Enrolment in secondary education ................... 122 0.78 0.90 — — 0.78
Enrolment in tertiary education ......................... 112 0.65 0.86 1 1 0.65
Health and Survival ................................................. 1 0.980 0.956
Sex ratio at birth (female/male) ............................. 1 0.94 0.92 — — 0.95
Healthy life expectancy .......................................... 1 1.06 1.04 47 44 1.07
Political Empowerment ........................................ 24 0.290 0.185
Women in parliament ............................................ 10 0.63 0.22 39 61 0.63
Women in ministerial positions ........................... 28 0.38 0.18 28 72 0.38
Years with female head of state (last 50) .......... 52 0.00 0.16 0 50 0.00
AngolaGender Gap Index 2011 87 0.662
Key Indicators
Total population (millions) 18.99
Population growth (%) 2.64
GDP (US$ billions) 25.90
GDP (PPP) per capita 5,480

Global Gender Gap Report 2011 Country Profiles 93
Economic Participation and Opportunity Educational Attainment Health and Survival Political Empowerment
Evolution 2006–2011
1 Survey data, responses on a 1-to-7 scale (1 = worst score, 7 = best score)2 Data on a 0-to-1 scale (1 = worst score, 0 = best score)3 Data on a 1-to-5 scale (1 = worst score, 5 = best score)4 Bracketed numbers show the range between the uncertainties, estimated
to contain the true maternal mortality ratio with a 95% probability
ECONOMIC EDUCATIONAL HEALTH AND POLITICAL OVERALL PARTICIPATION ATTAINMENT SURVIVAL EMPOWERMENT
Rank Score Rank Score Rank Score Rank Score Rank Score
0.0
0.2
0.4
0.6
0.8
1.0
2006 2007 2008 2009 2010 2011
Additional Data
Economic EmpowermentFemale adult unemployment rate (% of female labour force) ...... —Male adult unemployment rate (% of male labour force) ............. —Women in non-agricultural paid labour
(% of total labour force) ....................................................................24Inheritance practices in favour of male heirs2 ..............................0.50Firms with female participation in ownership (% of firms) ........... —Women’s access to land ownership2 .............................................0.50Women’s access to bank loans2 ......................................................0.50Women’s access to property other than land2 .............................0.50Women’s access to finance programmes3 ...................................... —Ability of women to rise to positions of
enterprise leadership1 ....................................................................4.10
EducationFemale teachers, primary education (%) ......................................... —Female teachers, secondary education (%) .....................................30Female teachers, tertiary education (%) ...........................................20Female school life expectancy, primary to secondary (years)........4Male school life expectancy, primary to secondary (years) ...........5
Marriage and ChildbearingMean age of marriage for women (years) ........................................19Early marriage (% women, aged 15–19) ............................................36Fertility rate (births per woman) .......................................................5.80Adolescent fertility rate (births per 1,000 women, aged 15–19) ..165Antenatal care coverage, at least one visit (%) ...............................68Births attended by skilled health staff (%) ........................................49Maternal mortality ratio (per 100,000 live births)4 ......610 [270-1,400]Contraceptive prevalence, married women (%) ................................6Female HIV prevalence, aged 15–49 (%) ........................................2.40Male HIV prevalence, aged 15–49 (%) ............................................1.60Infant mortality rate (per 1,000 live births) ........................................98Overall population sex ratio (male/female) ....................................0.97
Social Institutions and Political RightsPaternal versus maternal authority2................................................0.50Female genital mutilation2 ................................................................... —Acceptance or legality of polygamy2 ..............................................1.00Existence of legislation punishing acts
of violence against women2 ..........................................................0.50Year women received right to vote ................................................1975Quota type ................................................Legislated candidate quotasExistence of legislation prohibiting
gender-based discrimination .......................................................... —
Childcare EcosystemLength of maternity leave ........................................................12 weeksMaternity leave benefits (% of wages paid) ...................................100Provider of maternity coverage ......... Social security and employerLength of paternity leave ..................................................................... —Paternity leave benefits (% of wages paid) ..................................... —Daycare options .................................................................................... —
AngolaGender Gap Index 2011 (out of 135 countries) 87 0.662 96 0.594 126 0.786 1 0.980 24 0.290
Gender Gap Index 2010 (out of 134 countries) 81 0.671 76 0.630 125 0.785 1 0.980 24 0.290
Gender Gap Index 2009 (out of 134 countries) 106 0.635 96 0.583 127 0.778 1 0.980 36 0.201
Gender Gap Index 2008 (out of 130 countries) 114 0.603 87 0.584 122 0.778 1 0.980 103 0.071
Gender Gap Index 2007 (out of 128 countries) 110 0.603 87 0.585 119 0.779 1 0.980 92 0.070
Gender Gap Index 2006 (out of 115 countries) 96 0.604 69 0.587 107 0.779 1 0.980 81 0.070
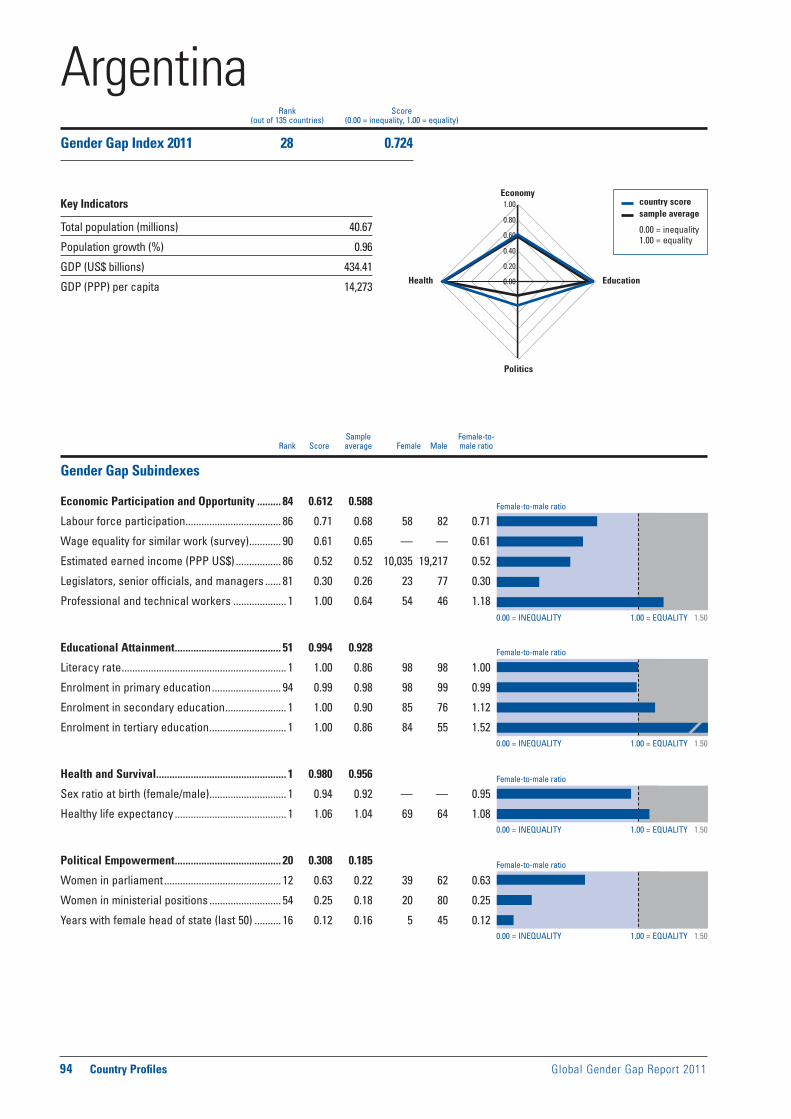
Female-to-male ratio
0.00 = INEQUALITY 1.00 = EQUALITY 1.50
0.00 = INEQUALITY 1.00 = EQUALITY 1.50
0.00 = INEQUALITY 1.00 = EQUALITY 1.50
0.00 = INEQUALITY 1.00 = EQUALITY 1.50
Female-to-male ratio
Female-to-male ratio
Female-to-male ratio
94 Country Profiles Global Gender Gap Report 2011
Sample Female-to- Rank Score average Female Male male ratio
country score sample average
0.00 = inequality 1.00 = equality
0.00
0.20
0.40
0.60
0.80
1.00Economy
Education
Politics
Health
Rank Score(out of 135 countries) (0.00 = inequality, 1.00 = equality)
Gender Gap Subindexes
Economic Participation and Opportunity ......... 84 0.612 0.588
Labour force participation .................................... 86 0.71 0.68 58 82 0.71
Wage equality for similar work (survey) ............ 90 0.61 0.65 — — 0.61
Estimated earned income (PPP US$) ................. 86 0.52 0.52 10,035 19,217 0.52
Legislators, senior officials, and managers ...... 81 0.30 0.26 23 77 0.30
Professional and technical workers .................... 1 1.00 0.64 54 46 1.18
Educational Attainment ........................................ 51 0.994 0.928
Literacy rate .............................................................. 1 1.00 0.86 98 98 1.00
Enrolment in primary education .......................... 94 0.99 0.98 98 99 0.99
Enrolment in secondary education ....................... 1 1.00 0.90 85 76 1.12
Enrolment in tertiary education ............................. 1 1.00 0.86 84 55 1.52
Health and Survival ................................................. 1 0.980 0.956
Sex ratio at birth (female/male) ............................. 1 0.94 0.92 — — 0.95
Healthy life expectancy .......................................... 1 1.06 1.04 69 64 1.08
Political Empowerment ........................................ 20 0.308 0.185
Women in parliament ............................................ 12 0.63 0.22 39 62 0.63
Women in ministerial positions ........................... 54 0.25 0.18 20 80 0.25
Years with female head of state (last 50) .......... 16 0.12 0.16 5 45 0.12
ArgentinaGender Gap Index 2011 28 0.724
Key Indicators
Total population (millions) 40.67
Population growth (%) 0.96
GDP (US$ billions) 434.41
GDP (PPP) per capita 14,273

Global Gender Gap Report 2011 Country Profiles 95
Economic Participation and Opportunity Educational Attainment Health and Survival Political Empowerment
Evolution 2006–2011
1 Survey data, responses on a 1-to-7 scale (1 = worst score, 7 = best score)2 Data on a 0-to-1 scale (1 = worst score, 0 = best score)3 Data on a 1-to-5 scale (1 = worst score, 5 = best score)4 Bracketed numbers show the range between the uncertainties, estimated
to contain the true maternal mortality ratio with a 95% probability
ECONOMIC EDUCATIONAL HEALTH AND POLITICAL OVERALL PARTICIPATION ATTAINMENT SURVIVAL EMPOWERMENT
Rank Score Rank Score Rank Score Rank Score Rank Score
0.0
0.2
0.4
0.6
0.8
1.0
2006 2007 2008 2009 2010 2011
Additional Data
Economic EmpowermentFemale adult unemployment rate (% of female labour force) .......10Male adult unemployment rate (% of male labour force) ................6Women in non-agricultural paid labour
(% of total labour force) ....................................................................45Inheritance practices in favour of male heirs2 ..............................0.00Firms with female participation in ownership (% of firms) ........... —Women’s access to land ownership2 .............................................0.00Women’s access to bank loans2 ......................................................0.00Women’s access to property other than land2 .............................0.00Women’s access to finance programmes3 .........................................1Ability of women to rise to positions of
enterprise leadership1 ....................................................................4.09
EducationFemale teachers, primary education (%) ..........................................87Female teachers, secondary education (%) .....................................69Female teachers, tertiary education (%) ...........................................52Female school life expectancy, primary to secondary (years)......12Male school life expectancy, primary to secondary (years) .........12
Marriage and ChildbearingMean age of marriage for women (years) ........................................25Early marriage (% women, aged 15–19) ............................................12Fertility rate (births per woman) .......................................................2.20Adolescent fertility rate (births per 1,000 women, aged 15–19) ....65Antenatal care coverage, at least one visit (%) ...............................91Births attended by skilled health staff (%) ........................................99Maternal mortality ratio (per 100,000 live births)4 ...............70 [61-77]Contraceptive prevalence, married women (%) ..............................65Female HIV prevalence, aged 15–49 (%) ........................................0.30Male HIV prevalence, aged 15–49 (%) ............................................0.60Infant mortality rate (per 1,000 live births) ........................................13Overall population sex ratio (male/female) ....................................0.96
Social Institutions and Political RightsPaternal versus maternal authority2................................................0.00Female genital mutilation2 .................................................................0.00Acceptance or legality of polygamy2 ..............................................0.00Existence of legislation punishing acts
of violence against women2 ..........................................................0.25Year women received right to vote ................................................1947Quota type ............................................................. Legislated candidate
quotas; voluntary political party quotasExistence of legislation prohibiting
gender-based discrimination .......................................................... —
Childcare EcosystemLength of maternity leave ........................................................... 90 daysMaternity leave benefits (% of wages paid) ..................................100,
in addition, a means-tested birth grant is paid in lump sumProvider of maternity coverage .............................. Family allowance
funds (financed through state and employer contributions)Length of paternity leave ..................................................................... —Paternity leave benefits (% of wages paid) ..................................... —Daycare options .................................................................................... —
ArgentinaGender Gap Index 2011 (out of 135 countries) 28 0.724 84 0.612 51 0.994 1 0.980 20 0.308
Gender Gap Index 2010 (out of 134 countries) 29 0.719 87 0.602 47 0.995 1 0.980 20 0.298
Gender Gap Index 2009 (out of 134 countries) 24 0.721 89 0.603 57 0.994 1 0.980 14 0.308
Gender Gap Index 2008 (out of 130 countries) 24 0.721 80 0.607 57 0.994 1 0.980 15 0.303
Gender Gap Index 2007 (out of 128 countries) 33 0.698 75 0.613 33 0.996 1 0.980 25 0.204
Gender Gap Index 2006 (out of 115 countries) 41 0.683 82 0.551 29 0.997 1 0.980 23 0.204

Female-to-male ratio
0.00 = INEQUALITY 1.00 = EQUALITY 1.50
0.00 = INEQUALITY 1.00 = EQUALITY 1.50
0.00 = INEQUALITY 1.00 = EQUALITY 1.50
0.00 = INEQUALITY 1.00 = EQUALITY 1.50
Female-to-male ratio
Female-to-male ratio
Female-to-male ratio
96 Country Profiles Global Gender Gap Report 2011
Sample Female-to- Rank Score average Female Male male ratio
country score sample average
0.00 = inequality 1.00 = equality
0.00
0.20
0.40
0.60
0.80
1.00Economy
Education
Politics
Health
Rank Score(out of 135 countries) (0.00 = inequality, 1.00 = equality)
Gender Gap Subindexes
Economic Participation and Opportunity ......... 62 0.658 0.588
Labour force participation .................................... 50 0.84 0.68 69 83 0.84
Wage equality for similar work (survey) ............ 49 0.69 0.65 — — 0.69
Estimated earned income (PPP US$) ................. 92 0.50 0.52 3,586 7,218 0.50
Legislators, senior officials, and managers ...... 77 0.31 0.26 24 76 0.31
Professional and technical workers .................... 1 1.00 0.64 65 35 1.88
Educational Attainment ........................................ 27 0.999 0.928
Literacy rate ............................................................ 53 1.00 0.86 99 100 1.00
Enrolment in primary education ............................ 1 1.00 0.98 86 83 1.03
Enrolment in secondary education ....................... 1 1.00 0.90 89 86 1.03
Enrolment in tertiary education ............................. 1 1.00 0.86 57 44 1.29
Health and Survival ............................................. 131 0.942 0.956
Sex ratio at birth (female/male) ......................... 134 0.89 0.92 — — 0.89
Healthy life expectancy .......................................... 1 1.06 1.04 63 59 1.07
Political Empowerment ...................................... 108 0.062 0.185
Women in parliament .......................................... 107 0.10 0.22 9 91 0.10
Women in ministerial positions ........................... 83 0.13 0.18 11 89 0.13
Years with female head of state (last 50) .......... 52 0.00 0.16 0 50 0.00
ArmeniaGender Gap Index 2011 84 0.665
Key Indicators
Total population (millions) 3.09
Population growth (%) 0.24
GDP (US$ billions) 4.05
GDP (PPP) per capita 4,842
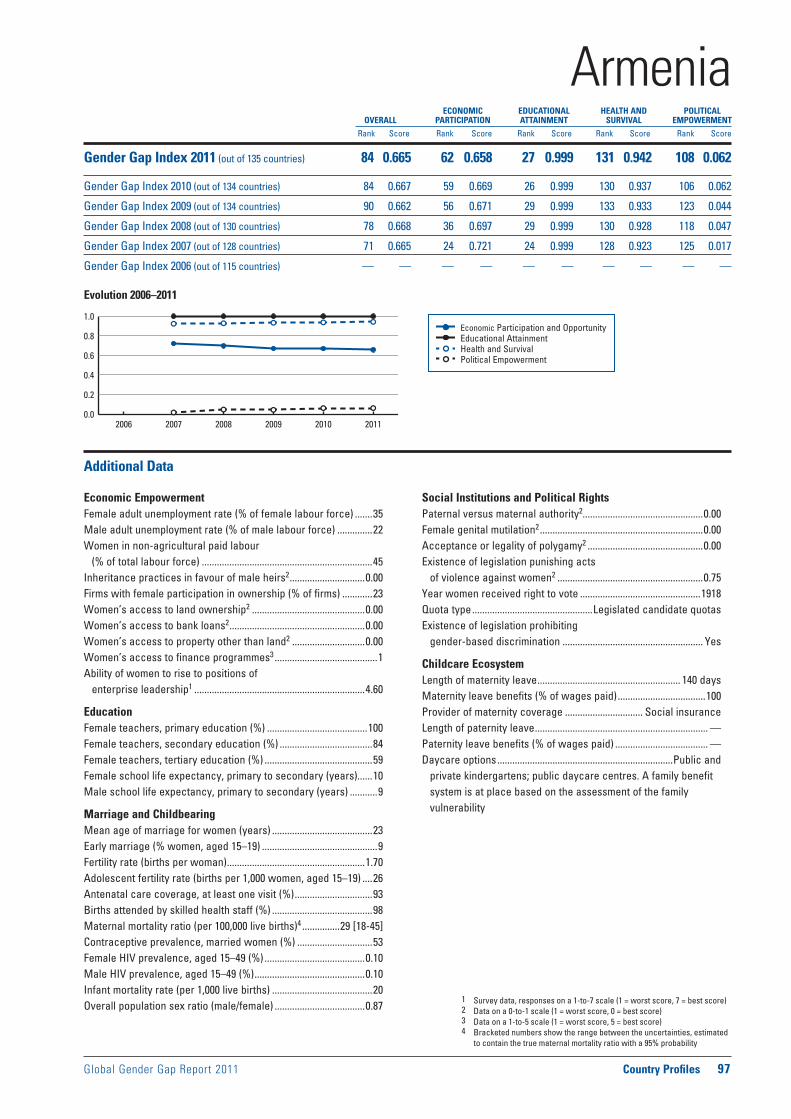
Global Gender Gap Report 2011 Country Profiles 97
Economic Participation and Opportunity Educational Attainment Health and Survival Political Empowerment
Evolution 2006–2011
1 Survey data, responses on a 1-to-7 scale (1 = worst score, 7 = best score)2 Data on a 0-to-1 scale (1 = worst score, 0 = best score)3 Data on a 1-to-5 scale (1 = worst score, 5 = best score)4 Bracketed numbers show the range between the uncertainties, estimated
to contain the true maternal mortality ratio with a 95% probability
ECONOMIC EDUCATIONAL HEALTH AND POLITICAL OVERALL PARTICIPATION ATTAINMENT SURVIVAL EMPOWERMENT
Rank Score Rank Score Rank Score Rank Score Rank Score
0.0
0.2
0.4
0.6
0.8
1.0
2006 2007 2008 2009 2010 2011
Additional Data
Economic EmpowermentFemale adult unemployment rate (% of female labour force) .......35Male adult unemployment rate (% of male labour force) ..............22Women in non-agricultural paid labour
(% of total labour force) ....................................................................45Inheritance practices in favour of male heirs2 ..............................0.00Firms with female participation in ownership (% of firms) ............23Women’s access to land ownership2 .............................................0.00Women’s access to bank loans2 ......................................................0.00Women’s access to property other than land2 .............................0.00Women’s access to finance programmes3 .........................................1Ability of women to rise to positions of
enterprise leadership1 ....................................................................4.60
EducationFemale teachers, primary education (%) ........................................100Female teachers, secondary education (%) .....................................84Female teachers, tertiary education (%) ...........................................59Female school life expectancy, primary to secondary (years)......10Male school life expectancy, primary to secondary (years) ...........9
Marriage and ChildbearingMean age of marriage for women (years) ........................................23Early marriage (% women, aged 15–19) ..............................................9Fertility rate (births per woman) .......................................................1.70Adolescent fertility rate (births per 1,000 women, aged 15–19) ....26Antenatal care coverage, at least one visit (%) ...............................93Births attended by skilled health staff (%) ........................................98Maternal mortality ratio (per 100,000 live births)4 ...............29 [18-45]Contraceptive prevalence, married women (%) ..............................53Female HIV prevalence, aged 15–49 (%) ........................................0.10Male HIV prevalence, aged 15–49 (%) ............................................0.10Infant mortality rate (per 1,000 live births) ........................................20Overall population sex ratio (male/female) ....................................0.87
Social Institutions and Political RightsPaternal versus maternal authority2................................................0.00Female genital mutilation2 .................................................................0.00Acceptance or legality of polygamy2 ..............................................0.00Existence of legislation punishing acts
of violence against women2 ..........................................................0.75Year women received right to vote ................................................1918Quota type ................................................Legislated candidate quotasExistence of legislation prohibiting
gender-based discrimination ........................................................ Yes
Childcare EcosystemLength of maternity leave ......................................................... 140 daysMaternity leave benefits (% of wages paid) ...................................100Provider of maternity coverage ............................... Social insuranceLength of paternity leave ..................................................................... —Paternity leave benefits (% of wages paid) ..................................... —Daycare options ......................................................................Public and
private kindergartens; public daycare centres. A family benefit system is at place based on the assessment of the family vulnerability
ArmeniaGender Gap Index 2011 (out of 135 countries) 84 0.665 62 0.658 27 0.999 131 0.942 108 0.062
Gender Gap Index 2010 (out of 134 countries) 84 0.667 59 0.669 26 0.999 130 0.937 106 0.062
Gender Gap Index 2009 (out of 134 countries) 90 0.662 56 0.671 29 0.999 133 0.933 123 0.044
Gender Gap Index 2008 (out of 130 countries) 78 0.668 36 0.697 29 0.999 130 0.928 118 0.047
Gender Gap Index 2007 (out of 128 countries) 71 0.665 24 0.721 24 0.999 128 0.923 125 0.017
Gender Gap Index 2006 (out of 115 countries) — — — — — — — — — —
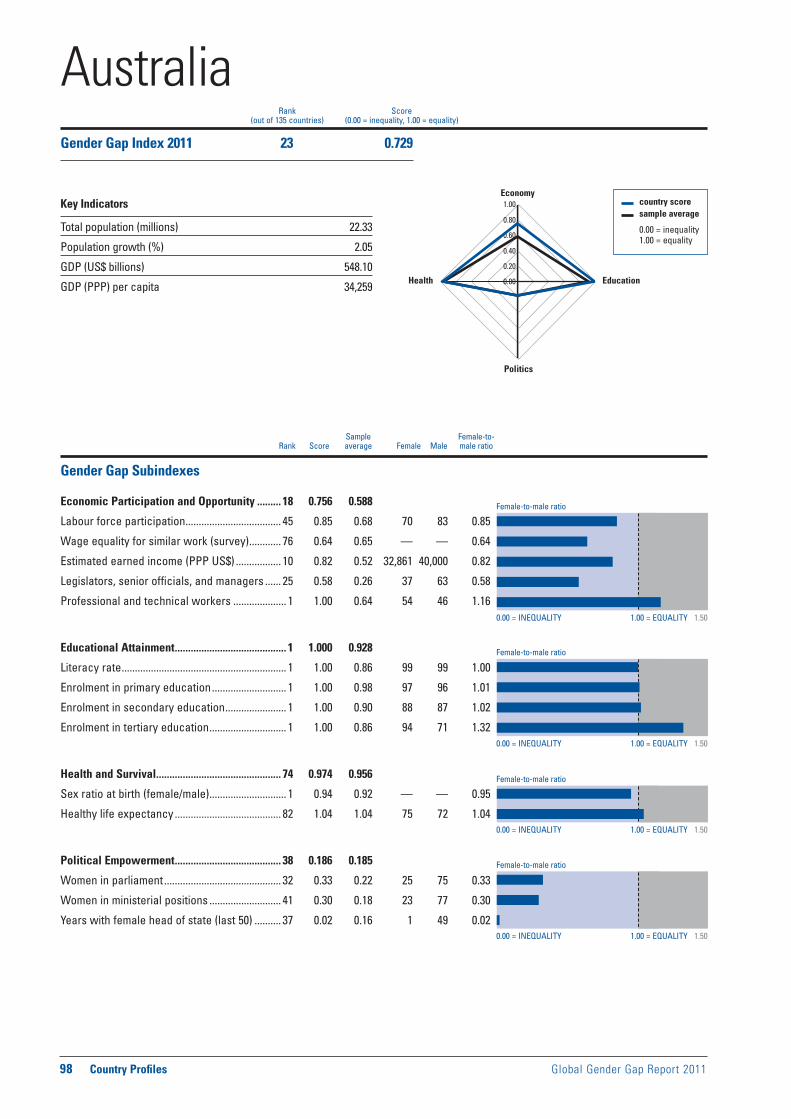
Female-to-male ratio
0.00 = INEQUALITY 1.00 = EQUALITY 1.50
0.00 = INEQUALITY 1.00 = EQUALITY 1.50
0.00 = INEQUALITY 1.00 = EQUALITY 1.50
0.00 = INEQUALITY 1.00 = EQUALITY 1.50
Female-to-male ratio
Female-to-male ratio
Female-to-male ratio
98 Country Profiles Global Gender Gap Report 2011
Sample Female-to- Rank Score average Female Male male ratio
country score sample average
0.00 = inequality 1.00 = equality
0.00
0.20
0.40
0.60
0.80
1.00Economy
Education
Politics
Health
Rank Score(out of 135 countries) (0.00 = inequality, 1.00 = equality)
Gender Gap Subindexes
Economic Participation and Opportunity ......... 18 0.756 0.588
Labour force participation .................................... 45 0.85 0.68 70 83 0.85
Wage equality for similar work (survey) ............ 76 0.64 0.65 — — 0.64
Estimated earned income (PPP US$) ................. 10 0.82 0.52 32,861 40,000 0.82
Legislators, senior officials, and managers ...... 25 0.58 0.26 37 63 0.58
Professional and technical workers .................... 1 1.00 0.64 54 46 1.16
Educational Attainment .......................................... 1 1.000 0.928
Literacy rate .............................................................. 1 1.00 0.86 99 99 1.00
Enrolment in primary education ............................ 1 1.00 0.98 97 96 1.01
Enrolment in secondary education ....................... 1 1.00 0.90 88 87 1.02
Enrolment in tertiary education ............................. 1 1.00 0.86 94 71 1.32
Health and Survival ............................................... 74 0.974 0.956
Sex ratio at birth (female/male) ............................. 1 0.94 0.92 — — 0.95
Healthy life expectancy ........................................ 82 1.04 1.04 75 72 1.04
Political Empowerment ........................................ 38 0.186 0.185
Women in parliament ............................................ 32 0.33 0.22 25 75 0.33
Women in ministerial positions ........................... 41 0.30 0.18 23 77 0.30
Years with female head of state (last 50) .......... 37 0.02 0.16 1 49 0.02
AustraliaGender Gap Index 2011 23 0.729
Key Indicators
Total population (millions) 22.33
Population growth (%) 2.05
GDP (US$ billions) 548.10
GDP (PPP) per capita 34,259
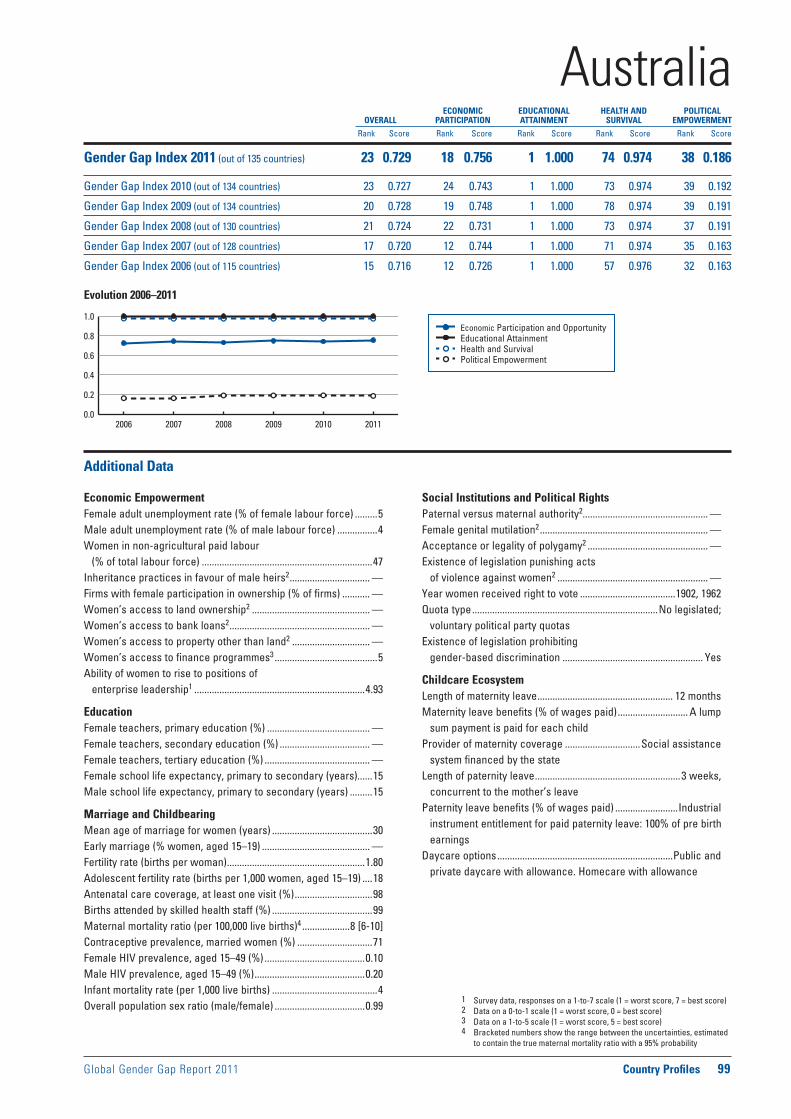
Global Gender Gap Report 2011 Country Profiles 99
Economic Participation and Opportunity Educational Attainment Health and Survival Political Empowerment
Evolution 2006–2011
1 Survey data, responses on a 1-to-7 scale (1 = worst score, 7 = best score)2 Data on a 0-to-1 scale (1 = worst score, 0 = best score)3 Data on a 1-to-5 scale (1 = worst score, 5 = best score)4 Bracketed numbers show the range between the uncertainties, estimated
to contain the true maternal mortality ratio with a 95% probability
ECONOMIC EDUCATIONAL HEALTH AND POLITICAL OVERALL PARTICIPATION ATTAINMENT SURVIVAL EMPOWERMENT
Rank Score Rank Score Rank Score Rank Score Rank Score
0.0
0.2
0.4
0.6
0.8
1.0
2006 2007 2008 2009 2010 2011
Additional Data
Economic EmpowermentFemale adult unemployment rate (% of female labour force) .........5Male adult unemployment rate (% of male labour force) ................4Women in non-agricultural paid labour
(% of total labour force) ....................................................................47Inheritance practices in favour of male heirs2 ................................ —Firms with female participation in ownership (% of firms) ........... —Women’s access to land ownership2 ............................................... —Women’s access to bank loans2 ........................................................ —Women’s access to property other than land2 ............................... —Women’s access to finance programmes3 .........................................5Ability of women to rise to positions of
enterprise leadership1 ....................................................................4.93
EducationFemale teachers, primary education (%) ......................................... —Female teachers, secondary education (%) .................................... —Female teachers, tertiary education (%) .......................................... —Female school life expectancy, primary to secondary (years)......15Male school life expectancy, primary to secondary (years) .........15
Marriage and ChildbearingMean age of marriage for women (years) ........................................30Early marriage (% women, aged 15–19) ........................................... —Fertility rate (births per woman) .......................................................1.80Adolescent fertility rate (births per 1,000 women, aged 15–19) ....18Antenatal care coverage, at least one visit (%) ...............................98Births attended by skilled health staff (%) ........................................99Maternal mortality ratio (per 100,000 live births)4 ...................8 [6-10]Contraceptive prevalence, married women (%) ..............................71Female HIV prevalence, aged 15–49 (%) ........................................0.10Male HIV prevalence, aged 15–49 (%) ............................................0.20Infant mortality rate (per 1,000 live births) ..........................................4Overall population sex ratio (male/female) ....................................0.99
Social Institutions and Political RightsPaternal versus maternal authority2.................................................. —Female genital mutilation2 ................................................................... —Acceptance or legality of polygamy2 ................................................ —Existence of legislation punishing acts
of violence against women2 ............................................................ —Year women received right to vote ......................................1902, 1962Quota type ..........................................................................No legislated;
voluntary political party quotasExistence of legislation prohibiting
gender-based discrimination ........................................................ Yes
Childcare EcosystemLength of maternity leave ...................................................... 12 monthsMaternity leave benefits (% of wages paid) ............................ A lump
sum payment is paid for each childProvider of maternity coverage ..............................Social assistance
system financed by the stateLength of paternity leave ..........................................................3 weeks,
concurrent to the mother’s leavePaternity leave benefits (% of wages paid) .........................Industrial
instrument entitlement for paid paternity leave: 100% of pre birth earnings
Daycare options ......................................................................Public and private daycare with allowance. Homecare with allowance
AustraliaGender Gap Index 2011 (out of 135 countries) 23 0.729 18 0.756 1 1.000 74 0.974 38 0.186
Gender Gap Index 2010 (out of 134 countries) 23 0.727 24 0.743 1 1.000 73 0.974 39 0.192
Gender Gap Index 2009 (out of 134 countries) 20 0.728 19 0.748 1 1.000 78 0.974 39 0.191
Gender Gap Index 2008 (out of 130 countries) 21 0.724 22 0.731 1 1.000 73 0.974 37 0.191
Gender Gap Index 2007 (out of 128 countries) 17 0.720 12 0.744 1 1.000 71 0.974 35 0.163
Gender Gap Index 2006 (out of 115 countries) 15 0.716 12 0.726 1 1.000 57 0.976 32 0.163
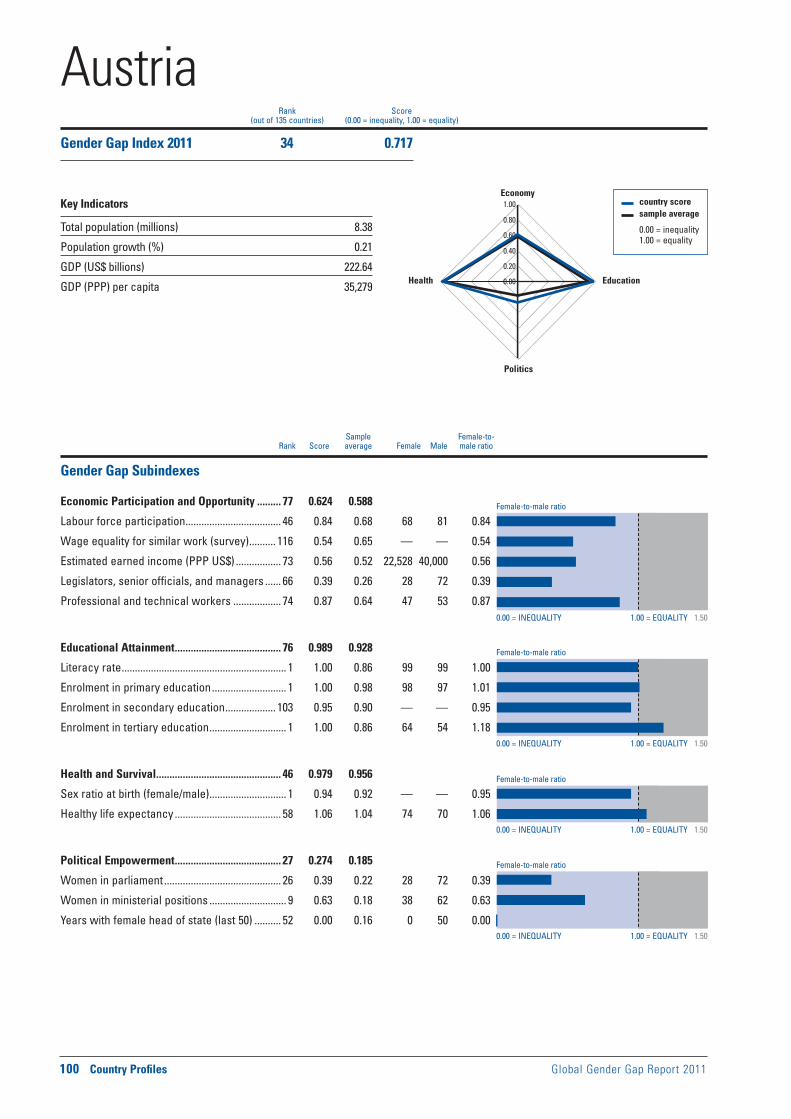
Female-to-male ratio
0.00 = INEQUALITY 1.00 = EQUALITY 1.50
0.00 = INEQUALITY 1.00 = EQUALITY 1.50
0.00 = INEQUALITY 1.00 = EQUALITY 1.50
0.00 = INEQUALITY 1.00 = EQUALITY 1.50
Female-to-male ratio
Female-to-male ratio
Female-to-male ratio
100 Country Profiles Global Gender Gap Report 2011
Sample Female-to- Rank Score average Female Male male ratio
country score sample average
0.00 = inequality 1.00 = equality
0.00
0.20
0.40
0.60
0.80
1.00Economy
Education
Politics
Health
Rank Score(out of 135 countries) (0.00 = inequality, 1.00 = equality)
Gender Gap Subindexes
Economic Participation and Opportunity ......... 77 0.624 0.588
Labour force participation .................................... 46 0.84 0.68 68 81 0.84
Wage equality for similar work (survey) .......... 116 0.54 0.65 — — 0.54
Estimated earned income (PPP US$) ................. 73 0.56 0.52 22,528 40,000 0.56
Legislators, senior officials, and managers ...... 66 0.39 0.26 28 72 0.39
Professional and technical workers .................. 74 0.87 0.64 47 53 0.87
Educational Attainment ........................................ 76 0.989 0.928
Literacy rate .............................................................. 1 1.00 0.86 99 99 1.00
Enrolment in primary education ............................ 1 1.00 0.98 98 97 1.01
Enrolment in secondary education ................... 103 0.95 0.90 — — 0.95
Enrolment in tertiary education ............................. 1 1.00 0.86 64 54 1.18
Health and Survival ............................................... 46 0.979 0.956
Sex ratio at birth (female/male) ............................. 1 0.94 0.92 — — 0.95
Healthy life expectancy ........................................ 58 1.06 1.04 74 70 1.06
Political Empowerment ........................................ 27 0.274 0.185
Women in parliament ............................................ 26 0.39 0.22 28 72 0.39
Women in ministerial positions ............................. 9 0.63 0.18 38 62 0.63
Years with female head of state (last 50) .......... 52 0.00 0.16 0 50 0.00
AustriaGender Gap Index 2011 34 0.717
Key Indicators
Total population (millions) 8.38
Population growth (%) 0.21
GDP (US$ billions) 222.64
GDP (PPP) per capita 35,279

Global Gender Gap Report 2011 Country Profiles 101
Economic Participation and Opportunity Educational Attainment Health and Survival Political Empowerment
Evolution 2006–2011
1 Survey data, responses on a 1-to-7 scale (1 = worst score, 7 = best score)2 Data on a 0-to-1 scale (1 = worst score, 0 = best score)3 Data on a 1-to-5 scale (1 = worst score, 5 = best score)4 Bracketed numbers show the range between the uncertainties, estimated
to contain the true maternal mortality ratio with a 95% probability
ECONOMIC EDUCATIONAL HEALTH AND POLITICAL OVERALL PARTICIPATION ATTAINMENT SURVIVAL EMPOWERMENT
Rank Score Rank Score Rank Score Rank Score Rank Score
0.0
0.2
0.4
0.6
0.8
1.0
2006 2007 2008 2009 2010 2011
Additional Data
Economic EmpowermentFemale adult unemployment rate (% of female labour force) .........5Male adult unemployment rate (% of male labour force) ................4Women in non-agricultural paid labour
(% of total labour force) ....................................................................47Inheritance practices in favour of male heirs2 ................................ —Firms with female participation in ownership (% of firms) ........... —Women’s access to land ownership2 ............................................... —Women’s access to bank loans2 ........................................................ —Women’s access to property other than land2 ............................... —Women’s access to finance programmes3 .........................................5Ability of women to rise to positions of
enterprise leadership1 ....................................................................4.53
EducationFemale teachers, primary education (%) ..........................................89Female teachers, secondary education (%) .....................................62Female teachers, tertiary education (%) ...........................................32Female school life expectancy, primary to secondary (years)......12Male school life expectancy, primary to secondary (years) .........12
Marriage and ChildbearingMean age of marriage for women (years) ........................................27Early marriage (% women, aged 15–19) ........................................... —Fertility rate (births per woman) .......................................................1.40Adolescent fertility rate (births per 1,000 women, aged 15–19) ....11Antenatal care coverage, at least one visit (%) .............................. —Births attended by skilled health staff (%) ......................................100Maternal mortality ratio (per 100,000 live births)4 .....................5 [5-6]Contraceptive prevalence, married women (%) ..............................51Female HIV prevalence, aged 15–49 (%) ........................................0.20Male HIV prevalence, aged 15–49 (%) ............................................0.40Infant mortality rate (per 1,000 live births) ..........................................4Overall population sex ratio (male/female) ....................................0.95
Social Institutions and Political RightsPaternal versus maternal authority2.................................................. —Female genital mutilation2 ................................................................... —Acceptance or legality of polygamy2 ................................................ —Existence of legislation punishing acts
of violence against women2 ............................................................ —Year women received right to vote ................................................1918Quota type ..........................................................................No legislated;
voluntary political party quotasExistence of legislation prohibiting
gender-based discrimination ........................................................ Yes
Childcare EcosystemLength of maternity leave ........................................................16 weeksMaternity leave benefits (% of wages paid) ...................................100Provider of maternity coverage .................................Statutory health
insurance, family burden equalization fund, or employerLength of paternity leave .....................................................................NoPaternity leave benefits (% of wages paid) ..................................... — Daycare options ......................................................................Public and
private daycare with allowance; homecare assistance with flat-rate allowances
AustriaGender Gap Index 2011 (out of 135 countries) 34 0.717 77 0.624 76 0.989 46 0.979 27 0.274
Gender Gap Index 2010 (out of 134 countries) 37 0.709 92 0.595 75 0.989 44 0.979 26 0.274
Gender Gap Index 2009 (out of 134 countries) 42 0.703 102 0.570 78 0.989 1 0.980 23 0.274
Gender Gap Index 2008 (out of 130 countries) 29 0.715 84 0.587 76 0.989 1 0.980 14 0.306
Gender Gap Index 2007 (out of 128 countries) 27 0.706 89 0.582 77 0.980 1 0.980 15 0.282
Gender Gap Index 2006 (out of 115 countries) 27 0.699 81 0.553 68 0.980 1 0.980 14 0.282

Female-to-male ratio
0.00 = INEQUALITY 1.00 = EQUALITY 1.50
0.00 = INEQUALITY 1.00 = EQUALITY 1.50
0.00 = INEQUALITY 1.00 = EQUALITY 1.50
0.00 = INEQUALITY 1.00 = EQUALITY 1.50
Female-to-male ratio
Female-to-male ratio
Female-to-male ratio
102 Country Profiles Global Gender Gap Report 2011
Sample Female-to- Rank Score average Female Male male ratio
country score sample average
0.00 = inequality 1.00 = equality
0.00
0.20
0.40
0.60
0.80
1.00Economy
Education
Politics
Health
Rank Score(out of 135 countries) (0.00 = inequality, 1.00 = equality)
Gender Gap Subindexes
Economic Participation and Opportunity ......... 70 0.642 0.588
Labour force participation .................................... 16 0.91 0.68 65 71 0.91
Wage equality for similar work (survey) ............ 54 0.68 0.65 — — 0.68
Estimated earned income (PPP US$) ................. 85 0.53 0.52 6,691 12,721 0.53
Legislators, senior officials, and managers .... 117 0.08 0.26 7 93 0.08
Professional and technical workers .................... 1 1.00 0.64 54 46 1.17
Educational Attainment ........................................ 73 0.989 0.928
Literacy rate ............................................................ 60 0.99 0.86 99 100 0.99
Enrolment in primary education ........................ 101 0.98 0.98 84 86 0.98
Enrolment in secondary education ....................... 1 1.00 0.90 94 91 1.03
Enrolment in tertiary education ........................... 89 0.99 0.86 19 19 0.99
Health and Survival ............................................. 132 0.933 0.956
Sex ratio at birth (female/male) ......................... 130 0.90 0.92 — — 0.90
Healthy life expectancy ...................................... 112 1.02 1.04 60 59 1.02
Political Empowerment ...................................... 103 0.066 0.185
Women in parliament ............................................ 74 0.19 0.22 16 84 0.19
Women in ministerial positions ......................... 128 0.03 0.18 3 97 0.03
Years with female head of state (last 50) .......... 52 0.00 0.16 0 50 0.00
AzerbaijanGender Gap Index 2011 91 0.658
Key Indicators
Total population (millions) 8.88
Population growth (%) 1.16
GDP (US$ billions) 21.23
GDP (PPP) per capita 9,084
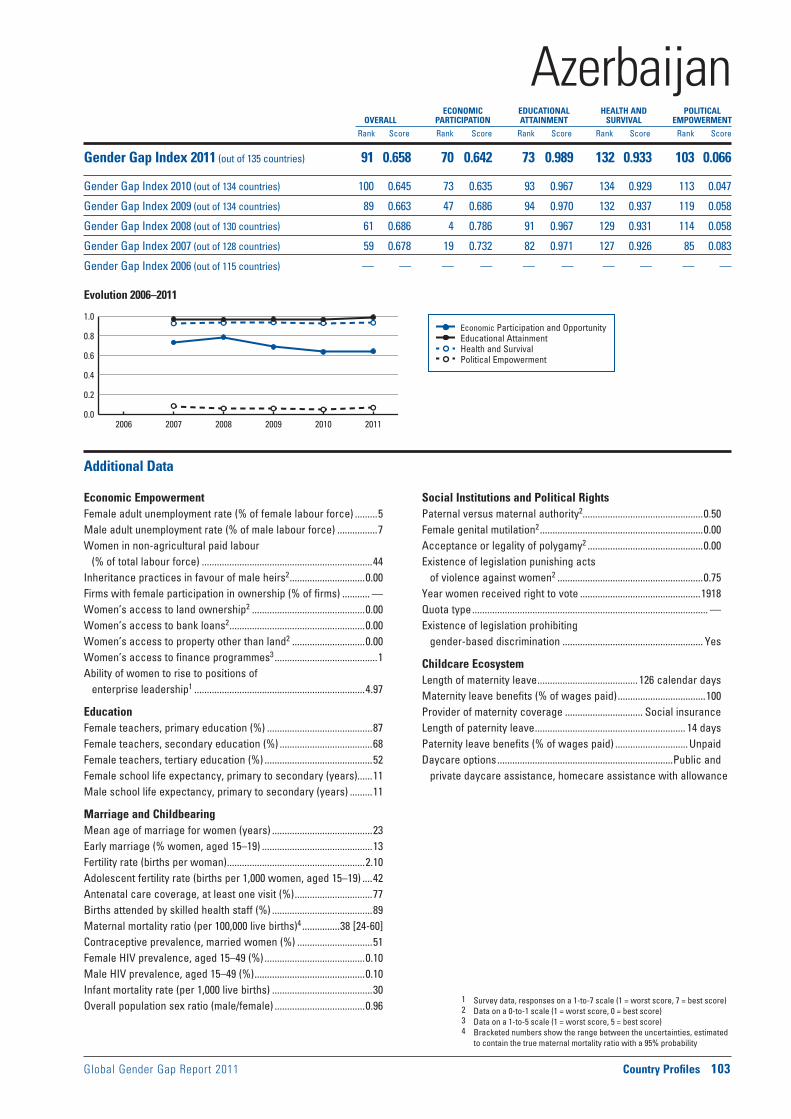
Global Gender Gap Report 2011 Country Profiles 103
Economic Participation and Opportunity Educational Attainment Health and Survival Political Empowerment
Evolution 2006–2011
1 Survey data, responses on a 1-to-7 scale (1 = worst score, 7 = best score)2 Data on a 0-to-1 scale (1 = worst score, 0 = best score)3 Data on a 1-to-5 scale (1 = worst score, 5 = best score)4 Bracketed numbers show the range between the uncertainties, estimated
to contain the true maternal mortality ratio with a 95% probability
ECONOMIC EDUCATIONAL HEALTH AND POLITICAL OVERALL PARTICIPATION ATTAINMENT SURVIVAL EMPOWERMENT
Rank Score Rank Score Rank Score Rank Score Rank Score
0.0
0.2
0.4
0.6
0.8
1.0
2006 2007 2008 2009 2010 2011
Additional Data
Economic EmpowermentFemale adult unemployment rate (% of female labour force) .........5Male adult unemployment rate (% of male labour force) ................7Women in non-agricultural paid labour
(% of total labour force) ....................................................................44Inheritance practices in favour of male heirs2 ..............................0.00Firms with female participation in ownership (% of firms) ........... —Women’s access to land ownership2 .............................................0.00Women’s access to bank loans2 ......................................................0.00Women’s access to property other than land2 .............................0.00Women’s access to finance programmes3 .........................................1Ability of women to rise to positions of
enterprise leadership1 ....................................................................4.97
EducationFemale teachers, primary education (%) ..........................................87Female teachers, secondary education (%) .....................................68Female teachers, tertiary education (%) ...........................................52Female school life expectancy, primary to secondary (years)......11Male school life expectancy, primary to secondary (years) .........11
Marriage and ChildbearingMean age of marriage for women (years) ........................................23Early marriage (% women, aged 15–19) ............................................13Fertility rate (births per woman) .......................................................2.10Adolescent fertility rate (births per 1,000 women, aged 15–19) ....42Antenatal care coverage, at least one visit (%) ...............................77Births attended by skilled health staff (%) ........................................89Maternal mortality ratio (per 100,000 live births)4 ...............38 [24-60]Contraceptive prevalence, married women (%) ..............................51Female HIV prevalence, aged 15–49 (%) ........................................0.10Male HIV prevalence, aged 15–49 (%) ............................................0.10Infant mortality rate (per 1,000 live births) ........................................30Overall population sex ratio (male/female) ....................................0.96
Social Institutions and Political RightsPaternal versus maternal authority2................................................0.50Female genital mutilation2 .................................................................0.00Acceptance or legality of polygamy2 ..............................................0.00Existence of legislation punishing acts
of violence against women2 ..........................................................0.75Year women received right to vote ................................................1918Quota type .............................................................................................. —Existence of legislation prohibiting
gender-based discrimination ........................................................ Yes
Childcare EcosystemLength of maternity leave ........................................ 126 calendar daysMaternity leave benefits (% of wages paid) ...................................100Provider of maternity coverage ............................... Social insurance Length of paternity leave ............................................................ 14 daysPaternity leave benefits (% of wages paid) .............................UnpaidDaycare options ......................................................................Public and
private daycare assistance, homecare assistance with allowance
AzerbaijanGender Gap Index 2011 (out of 135 countries) 91 0.658 70 0.642 73 0.989 132 0.933 103 0.066
Gender Gap Index 2010 (out of 134 countries) 100 0.645 73 0.635 93 0.967 134 0.929 113 0.047
Gender Gap Index 2009 (out of 134 countries) 89 0.663 47 0.686 94 0.970 132 0.937 119 0.058
Gender Gap Index 2008 (out of 130 countries) 61 0.686 4 0.786 91 0.967 129 0.931 114 0.058
Gender Gap Index 2007 (out of 128 countries) 59 0.678 19 0.732 82 0.971 127 0.926 85 0.083
Gender Gap Index 2006 (out of 115 countries) — — — — — — — — — —
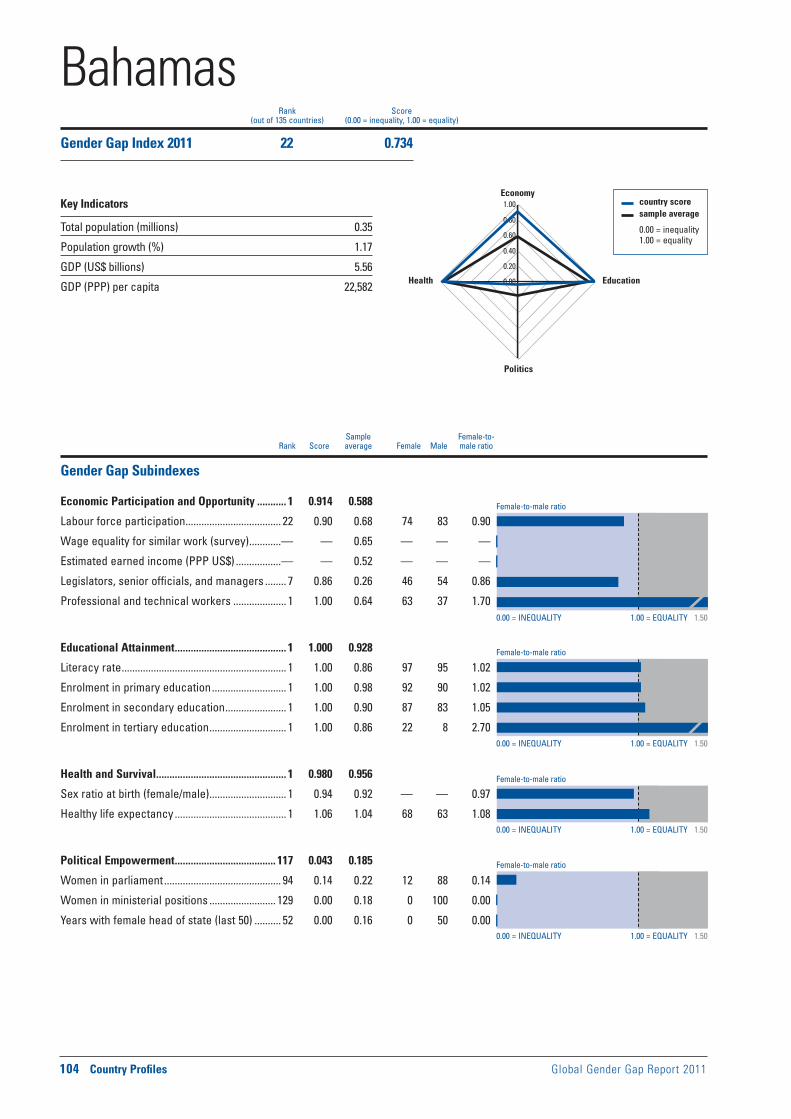
Female-to-male ratio
0.00 = INEQUALITY 1.00 = EQUALITY 1.50
0.00 = INEQUALITY 1.00 = EQUALITY 1.50
0.00 = INEQUALITY 1.00 = EQUALITY 1.50
0.00 = INEQUALITY 1.00 = EQUALITY 1.50
Female-to-male ratio
Female-to-male ratio
Female-to-male ratio
104 Country Profiles Global Gender Gap Report 2011
Sample Female-to- Rank Score average Female Male male ratio
country score sample average
0.00 = inequality 1.00 = equality
0.00
0.20
0.40
0.60
0.80
1.00Economy
Education
Politics
Health
Rank Score(out of 135 countries) (0.00 = inequality, 1.00 = equality)
Gender Gap Subindexes
Economic Participation and Opportunity ........... 1 0.914 0.588
Labour force participation .................................... 22 0.90 0.68 74 83 0.90
Wage equality for similar work (survey) ............— — 0.65 — — —
Estimated earned income (PPP US$) .................— — 0.52 — — —
Legislators, senior officials, and managers ........ 7 0.86 0.26 46 54 0.86
Professional and technical workers .................... 1 1.00 0.64 63 37 1.70
Educational Attainment .......................................... 1 1.000 0.928
Literacy rate .............................................................. 1 1.00 0.86 97 95 1.02
Enrolment in primary education ............................ 1 1.00 0.98 92 90 1.02
Enrolment in secondary education ....................... 1 1.00 0.90 87 83 1.05
Enrolment in tertiary education ............................. 1 1.00 0.86 22 8 2.70
Health and Survival ................................................. 1 0.980 0.956
Sex ratio at birth (female/male) ............................. 1 0.94 0.92 — — 0.97
Healthy life expectancy .......................................... 1 1.06 1.04 68 63 1.08
Political Empowerment ...................................... 117 0.043 0.185
Women in parliament ............................................ 94 0.14 0.22 12 88 0.14
Women in ministerial positions ......................... 129 0.00 0.18 0 100 0.00
Years with female head of state (last 50) .......... 52 0.00 0.16 0 50 0.00
BahamasGender Gap Index 2011 22 0.734
Key Indicators
Total population (millions) 0.35
Population growth (%) 1.17
GDP (US$ billions) 5.56
GDP (PPP) per capita 22,582
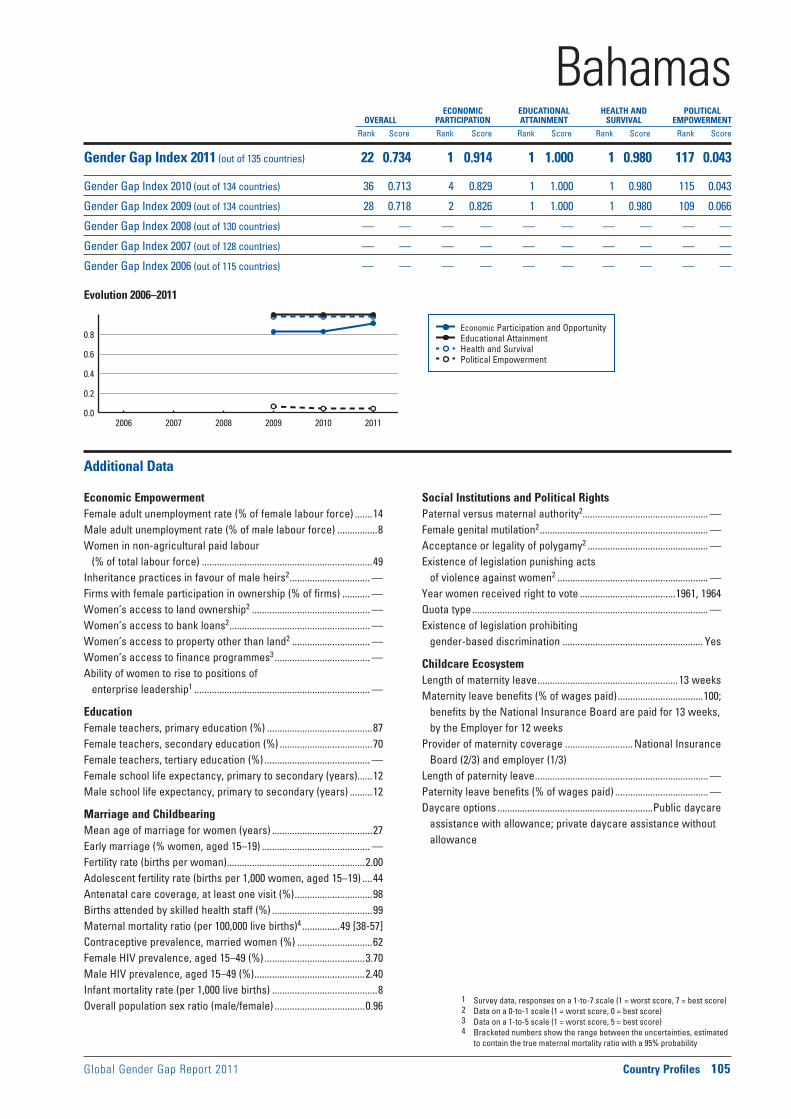
Global Gender Gap Report 2011 Country Profiles 105
Economic Participation and Opportunity Educational Attainment Health and Survival Political Empowerment
Evolution 2006–2011
1 Survey data, responses on a 1-to-7 scale (1 = worst score, 7 = best score)2 Data on a 0-to-1 scale (1 = worst score, 0 = best score)3 Data on a 1-to-5 scale (1 = worst score, 5 = best score)4 Bracketed numbers show the range between the uncertainties, estimated
to contain the true maternal mortality ratio with a 95% probability
ECONOMIC EDUCATIONAL HEALTH AND POLITICAL OVERALL PARTICIPATION ATTAINMENT SURVIVAL EMPOWERMENT
Rank Score Rank Score Rank Score Rank Score Rank Score
0.0
0.2
0.4
0.6
0.8
2006 2007 2008 2009 2010 2011
Additional Data
Economic EmpowermentFemale adult unemployment rate (% of female labour force) .......14Male adult unemployment rate (% of male labour force) ................8Women in non-agricultural paid labour
(% of total labour force) ....................................................................49Inheritance practices in favour of male heirs2 ................................ —Firms with female participation in ownership (% of firms) ........... —Women’s access to land ownership2 ............................................... —Women’s access to bank loans2 ........................................................ —Women’s access to property other than land2 ............................... —Women’s access to finance programmes3 ...................................... —Ability of women to rise to positions of
enterprise leadership1 ...................................................................... —
EducationFemale teachers, primary education (%) ..........................................87Female teachers, secondary education (%) .....................................70Female teachers, tertiary education (%) .......................................... —Female school life expectancy, primary to secondary (years)......12Male school life expectancy, primary to secondary (years) .........12
Marriage and ChildbearingMean age of marriage for women (years) ........................................27Early marriage (% women, aged 15–19) ........................................... —Fertility rate (births per woman) .......................................................2.00Adolescent fertility rate (births per 1,000 women, aged 15–19) ....44Antenatal care coverage, at least one visit (%) ...............................98Births attended by skilled health staff (%) ........................................99Maternal mortality ratio (per 100,000 live births)4 ...............49 [38-57]Contraceptive prevalence, married women (%) ..............................62Female HIV prevalence, aged 15–49 (%) ........................................3.70Male HIV prevalence, aged 15–49 (%) ............................................2.40Infant mortality rate (per 1,000 live births) ..........................................8Overall population sex ratio (male/female) ....................................0.96
Social Institutions and Political RightsPaternal versus maternal authority2.................................................. —Female genital mutilation2 ................................................................... —Acceptance or legality of polygamy2 ................................................ —Existence of legislation punishing acts
of violence against women2 ............................................................ —Year women received right to vote ......................................1961, 1964Quota type .............................................................................................. —Existence of legislation prohibiting
gender-based discrimination ........................................................ Yes
Childcare EcosystemLength of maternity leave ........................................................13 weeksMaternity leave benefits (% of wages paid) ..................................100;
benefits by the National Insurance Board are paid for 13 weeks, by the Employer for 12 weeks
Provider of maternity coverage ........................... National Insurance Board (2/3) and employer (1/3)
Length of paternity leave ..................................................................... —Paternity leave benefits (% of wages paid) ..................................... —Daycare options ..............................................................Public daycare
assistance with allowance; private daycare assistance without allowance
BahamasGender Gap Index 2011 (out of 135 countries) 22 0.734 1 0.914 1 1.000 1 0.980 117 0.043
Gender Gap Index 2010 (out of 134 countries) 36 0.713 4 0.829 1 1.000 1 0.980 115 0.043
Gender Gap Index 2009 (out of 134 countries) 28 0.718 2 0.826 1 1.000 1 0.980 109 0.066
Gender Gap Index 2008 (out of 130 countries) — — — — — — — — — —
Gender Gap Index 2007 (out of 128 countries) — — — — — — — — — —
Gender Gap Index 2006 (out of 115 countries) — — — — — — — — — —
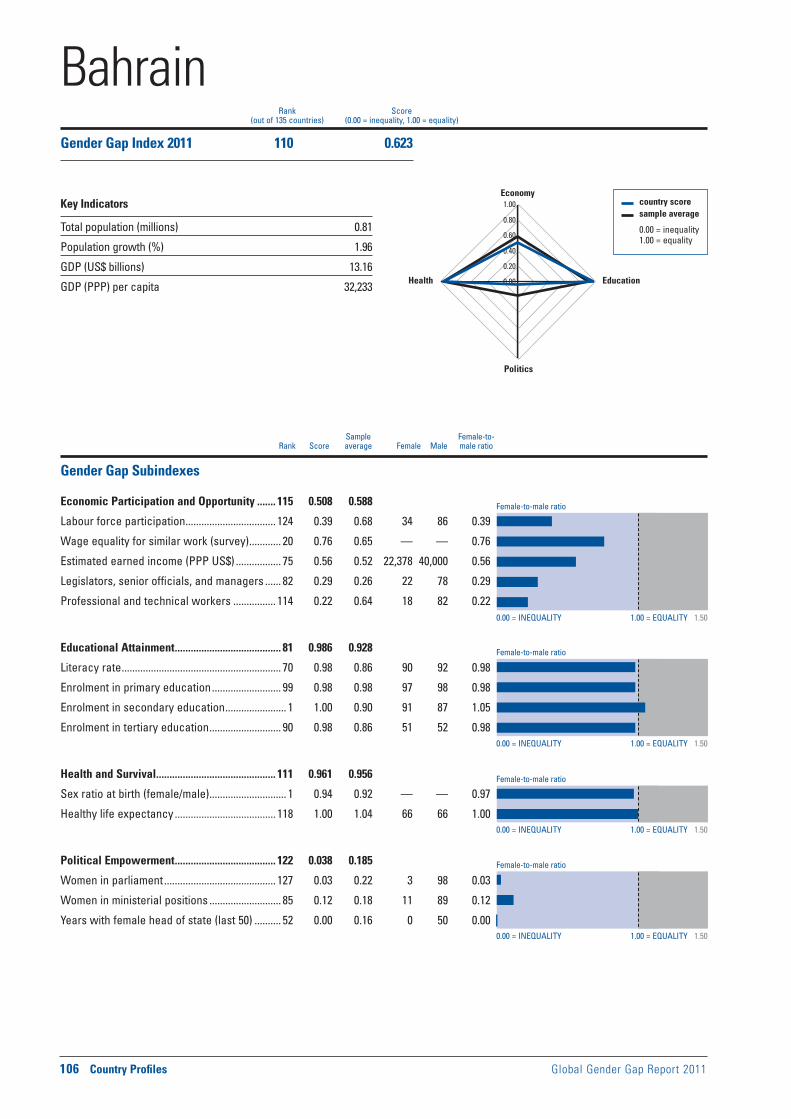
Female-to-male ratio
0.00 = INEQUALITY 1.00 = EQUALITY 1.50
0.00 = INEQUALITY 1.00 = EQUALITY 1.50
0.00 = INEQUALITY 1.00 = EQUALITY 1.50
0.00 = INEQUALITY 1.00 = EQUALITY 1.50
Female-to-male ratio
Female-to-male ratio
Female-to-male ratio
106 Country Profiles Global Gender Gap Report 2011
Sample Female-to- Rank Score average Female Male male ratio
country score sample average
0.00 = inequality 1.00 = equality
0.00
0.20
0.40
0.60
0.80
1.00Economy
Education
Politics
Health
Rank Score(out of 135 countries) (0.00 = inequality, 1.00 = equality)
Gender Gap Subindexes
Economic Participation and Opportunity ....... 115 0.508 0.588
Labour force participation .................................. 124 0.39 0.68 34 86 0.39
Wage equality for similar work (survey) ............ 20 0.76 0.65 — — 0.76
Estimated earned income (PPP US$) ................. 75 0.56 0.52 22,378 40,000 0.56
Legislators, senior officials, and managers ...... 82 0.29 0.26 22 78 0.29
Professional and technical workers ................ 114 0.22 0.64 18 82 0.22
Educational Attainment ........................................ 81 0.986 0.928
Literacy rate ............................................................ 70 0.98 0.86 90 92 0.98
Enrolment in primary education .......................... 99 0.98 0.98 97 98 0.98
Enrolment in secondary education ....................... 1 1.00 0.90 91 87 1.05
Enrolment in tertiary education ........................... 90 0.98 0.86 51 52 0.98
Health and Survival ............................................. 111 0.961 0.956
Sex ratio at birth (female/male) ............................. 1 0.94 0.92 — — 0.97
Healthy life expectancy ...................................... 118 1.00 1.04 66 66 1.00
Political Empowerment ...................................... 122 0.038 0.185
Women in parliament .......................................... 127 0.03 0.22 3 98 0.03
Women in ministerial positions ........................... 85 0.12 0.18 11 89 0.12
Years with female head of state (last 50) .......... 52 0.00 0.16 0 50 0.00
BahrainGender Gap Index 2011 110 0.623
Key Indicators
Total population (millions) 0.81
Population growth (%) 1.96
GDP (US$ billions) 13.16
GDP (PPP) per capita 32,233

Global Gender Gap Report 2011 Country Profiles 107
Economic Participation and Opportunity Educational Attainment Health and Survival Political Empowerment
Evolution 2006–2011
1 Survey data, responses on a 1-to-7 scale (1 = worst score, 7 = best score)2 Data on a 0-to-1 scale (1 = worst score, 0 = best score)3 Data on a 1-to-5 scale (1 = worst score, 5 = best score)4 Bracketed numbers show the range between the uncertainties, estimated
to contain the true maternal mortality ratio with a 95% probability
ECONOMIC EDUCATIONAL HEALTH AND POLITICAL OVERALL PARTICIPATION ATTAINMENT SURVIVAL EMPOWERMENT
Rank Score Rank Score Rank Score Rank Score Rank Score
0.0
0.2
0.4
0.6
0.8
1.0
2006 2007 2008 2009 2010 2011
Additional Data
Economic EmpowermentFemale adult unemployment rate (% of female labour force) .......10Male adult unemployment rate (% of male labour force) ................4Women in non-agricultural paid labour
(% of total labour force) ....................................................................10Inheritance practices in favour of male heirs2 ..............................0.50Firms with female participation in ownership (% of firms) ............30Women’s access to land ownership2 .............................................0.50Women’s access to bank loans2 ......................................................0.00Women’s access to property other than land2 .............................0.50Women’s access to finance programmes3 .........................................3Ability of women to rise to positions of
enterprise leadership1 ....................................................................5.23
EducationFemale teachers, primary education (%) ..........................................76Female teachers, secondary education (%) .....................................54Female teachers, tertiary education (%) ...........................................33Female school life expectancy, primary to secondary (years)......12Male school life expectancy, primary to secondary (years) .........12
Marriage and ChildbearingMean age of marriage for women (years) ........................................26Early marriage (% women, aged 15–19) ..............................................7Fertility rate (births per woman) .......................................................2.30Adolescent fertility rate (births per 1,000 women, aged 15–19) ....14Antenatal care coverage, at least one visit (%) .............................100Births attended by skilled health staff (%) ........................................97Maternal mortality ratio (per 100,000 live births)4 ...............19 [11-30]Contraceptive prevalence, married women (%) ..............................62Female HIV prevalence, aged 15–49 (%) .......................................... —Male HIV prevalence, aged 15–49 (%) .............................................. —Infant mortality rate (per 1,000 live births) ..........................................9Overall population sex ratio (male/female) ....................................1.34
Social Institutions and Political RightsPaternal versus maternal authority2................................................1.00Female genital mutilation2 .................................................................0.00Acceptance or legality of polygamy2 ..............................................0.00Existence of legislation punishing acts
of violence against women2 ..........................................................0.75Year women received right to vote ......................................1973, 2002Quota type .............................................................................................. —Existence of legislation prohibiting
gender-based discrimination .......................................................... —
Childcare EcosystemLength of maternity leave ........................................................... 45 daysMaternity leave benefits (% of wages paid) ...................................100Provider of maternity coverage .............................................EmployerLength of paternity leave ..................................................................... —Paternity leave benefits (% of wages paid) ..................................... —Daycare options .................................................................................... —
BahrainGender Gap Index 2011 (out of 135 countries) 110 0.623 115 0.508 81 0.986 111 0.961 122 0.038
Gender Gap Index 2010 (out of 134 countries) 110 0.622 115 0.497 60 0.991 110 0.961 120 0.038
Gender Gap Index 2009 (out of 134 countries) 116 0.614 118 0.483 69 0.991 116 0.961 131 0.019
Gender Gap Index 2008 (out of 130 countries) 121 0.593 126 0.399 66 0.992 112 0.961 127 0.019
Gender Gap Index 2007 (out of 128 countries) 115 0.593 124 0.390 59 0.989 110 0.961 121 0.031
Gender Gap Index 2006 (out of 115 countries) 102 0.589 111 0.383 54 0.989 104 0.962 110 0.024

Female-to-male ratio
0.00 = INEQUALITY 1.00 = EQUALITY 1.50
0.00 = INEQUALITY 1.00 = EQUALITY 1.50
0.00 = INEQUALITY 1.00 = EQUALITY 1.50
0.00 = INEQUALITY 1.00 = EQUALITY 1.50
Female-to-male ratio
Female-to-male ratio
Female-to-male ratio
108 Country Profiles Global Gender Gap Report 2011
Sample Female-to- Rank Score average Female Male male ratio
country score sample average
0.00 = inequality 1.00 = equality
0.00
0.20
0.40
0.60
0.80
1.00Economy
Education
Politics
Health
Rank Score(out of 135 countries) (0.00 = inequality, 1.00 = equality)
Gender Gap Subindexes
Economic Participation and Opportunity ....... 118 0.493 0.588
Labour force participation .................................... 83 0.73 0.68 62 85 0.73
Wage equality for similar work (survey) .......... 105 0.57 0.65 — — 0.57
Estimated earned income (PPP US$) ................. 80 0.55 0.52 1,000 1,823 0.55
Legislators, senior officials, and managers .... 109 0.11 0.26 10 90 0.11
Professional and technical workers ................ 108 0.28 0.64 22 78 0.28
Educational Attainment ...................................... 108 0.917 0.928
Literacy rate .......................................................... 108 0.84 0.86 51 61 0.84
Enrolment in primary education ............................ 1 1.00 0.98 90 83 1.08
Enrolment in secondary education ....................... 1 1.00 0.90 43 40 1.05
Enrolment in tertiary education ......................... 116 0.56 0.86 6 10 0.56
Health and Survival ............................................. 123 0.956 0.956
Sex ratio at birth (female/male) ............................. 1 0.94 0.92 — — 0.96
Healthy life expectancy ...................................... 131 0.98 1.04 55 56 0.98
Political Empowerment ........................................ 11 0.359 0.185
Women in parliament ............................................ 66 0.23 0.22 19 81 0.23
Women in ministerial positions ........................... 65 0.19 0.18 16 84 0.19
Years with female head of state (last 50) ............ 5 0.54 0.16 18 32 0.54
BangladeshGender Gap Index 2011 69 0.681
Key Indicators
Total population (millions) 164.43
Population growth (%) 1.35
GDP (US$ billions) 82.80
GDP (PPP) per capita 1,343
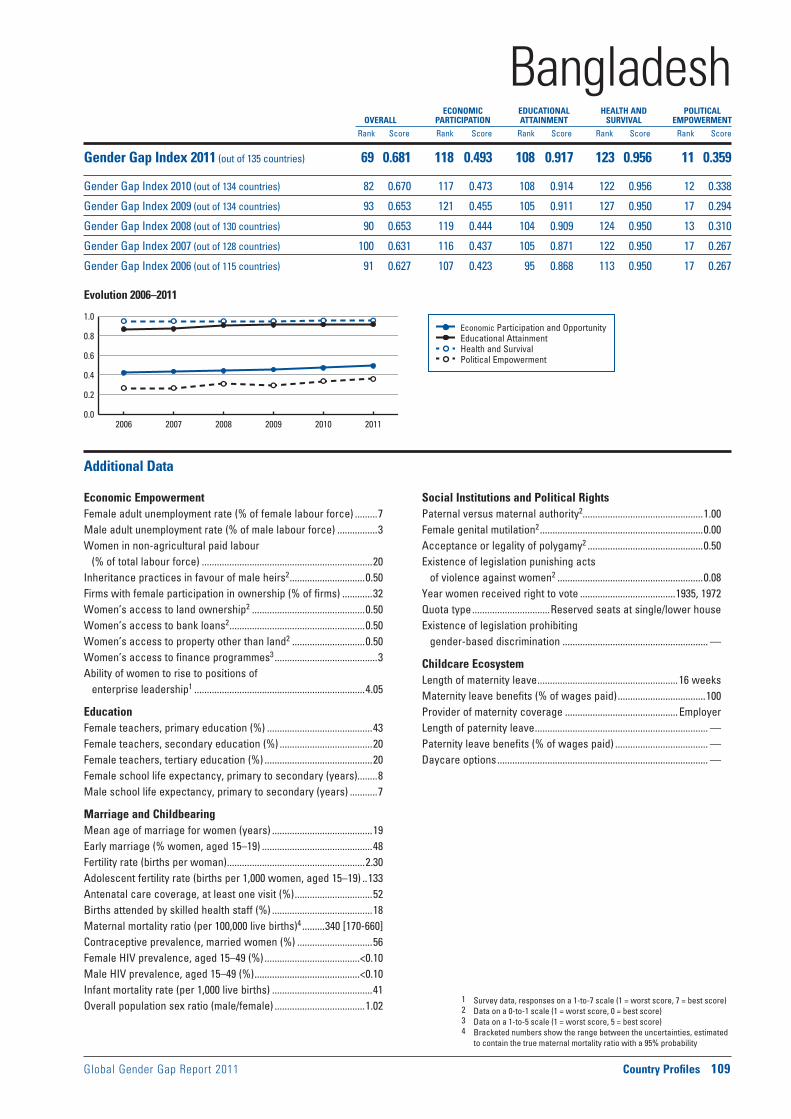
Global Gender Gap Report 2011 Country Profiles 109
Economic Participation and Opportunity Educational Attainment Health and Survival Political Empowerment
Evolution 2006–2011
1 Survey data, responses on a 1-to-7 scale (1 = worst score, 7 = best score)2 Data on a 0-to-1 scale (1 = worst score, 0 = best score)3 Data on a 1-to-5 scale (1 = worst score, 5 = best score)4 Bracketed numbers show the range between the uncertainties, estimated
to contain the true maternal mortality ratio with a 95% probability
ECONOMIC EDUCATIONAL HEALTH AND POLITICAL OVERALL PARTICIPATION ATTAINMENT SURVIVAL EMPOWERMENT
Rank Score Rank Score Rank Score Rank Score Rank Score
0.0
0.2
0.4
0.6
0.8
1.0
2006 2007 2008 2009 2010 2011
Additional Data
Economic EmpowermentFemale adult unemployment rate (% of female labour force) .........7Male adult unemployment rate (% of male labour force) ................3Women in non-agricultural paid labour
(% of total labour force) ....................................................................20Inheritance practices in favour of male heirs2 ..............................0.50Firms with female participation in ownership (% of firms) ............32Women’s access to land ownership2 .............................................0.50Women’s access to bank loans2 ......................................................0.50Women’s access to property other than land2 .............................0.50Women’s access to finance programmes3 .........................................3Ability of women to rise to positions of
enterprise leadership1 ....................................................................4.05
EducationFemale teachers, primary education (%) ..........................................43Female teachers, secondary education (%) .....................................20Female teachers, tertiary education (%) ...........................................20Female school life expectancy, primary to secondary (years)........8Male school life expectancy, primary to secondary (years) ...........7
Marriage and ChildbearingMean age of marriage for women (years) ........................................19Early marriage (% women, aged 15–19) ............................................48Fertility rate (births per woman) .......................................................2.30Adolescent fertility rate (births per 1,000 women, aged 15–19) ..133Antenatal care coverage, at least one visit (%) ...............................52Births attended by skilled health staff (%) ........................................18Maternal mortality ratio (per 100,000 live births)4 .........340 [170-660]Contraceptive prevalence, married women (%) ..............................56Female HIV prevalence, aged 15–49 (%) ......................................<0.10Male HIV prevalence, aged 15–49 (%) ..........................................<0.10Infant mortality rate (per 1,000 live births) ........................................41Overall population sex ratio (male/female) ....................................1.02
Social Institutions and Political RightsPaternal versus maternal authority2................................................1.00Female genital mutilation2 .................................................................0.00Acceptance or legality of polygamy2 ..............................................0.50Existence of legislation punishing acts
of violence against women2 ..........................................................0.08Year women received right to vote ......................................1935, 1972Quota type ...............................Reserved seats at single/lower houseExistence of legislation prohibiting
gender-based discrimination .......................................................... —
Childcare EcosystemLength of maternity leave ........................................................16 weeksMaternity leave benefits (% of wages paid) ...................................100Provider of maternity coverage .............................................EmployerLength of paternity leave ..................................................................... —Paternity leave benefits (% of wages paid) ..................................... —Daycare options .................................................................................... —
BangladeshGender Gap Index 2011 (out of 135 countries) 69 0.681 118 0.493 108 0.917 123 0.956 11 0.359
Gender Gap Index 2010 (out of 134 countries) 82 0.670 117 0.473 108 0.914 122 0.956 12 0.338
Gender Gap Index 2009 (out of 134 countries) 93 0.653 121 0.455 105 0.911 127 0.950 17 0.294
Gender Gap Index 2008 (out of 130 countries) 90 0.653 119 0.444 104 0.909 124 0.950 13 0.310
Gender Gap Index 2007 (out of 128 countries) 100 0.631 116 0.437 105 0.871 122 0.950 17 0.267
Gender Gap Index 2006 (out of 115 countries) 91 0.627 107 0.423 95 0.868 113 0.950 17 0.267
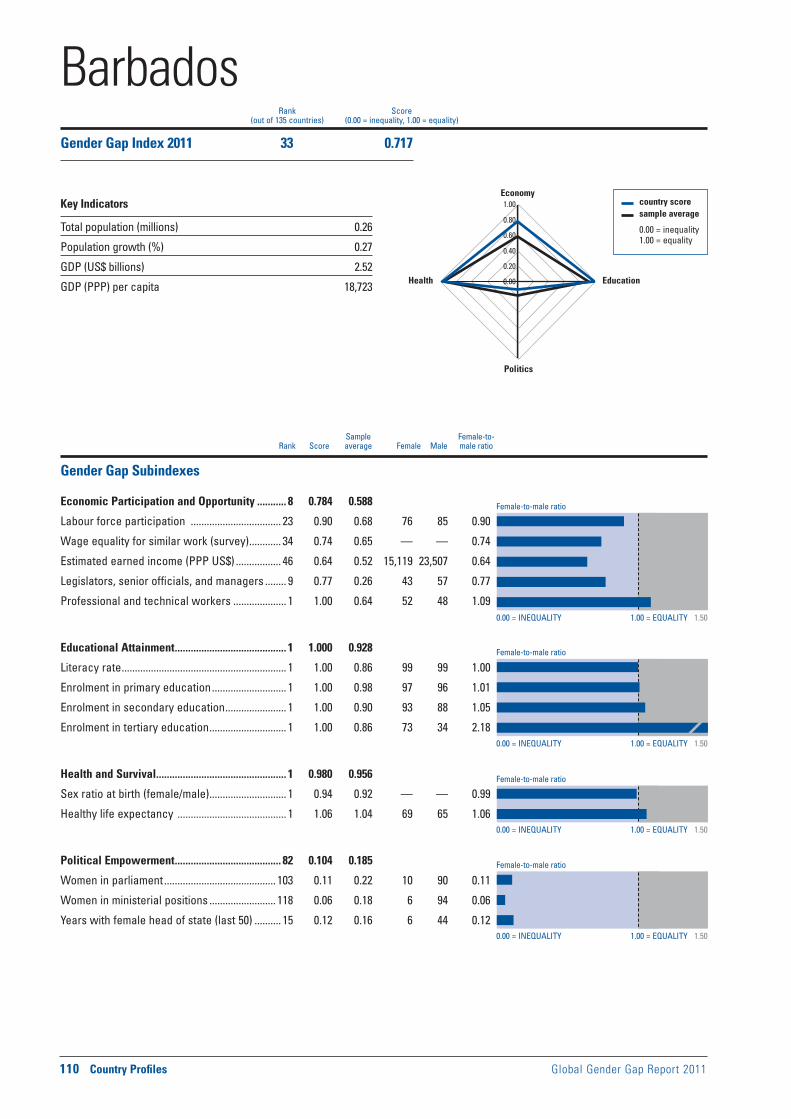
Female-to-male ratio
0.00 = INEQUALITY 1.00 = EQUALITY 1.50
0.00 = INEQUALITY 1.00 = EQUALITY 1.50
0.00 = INEQUALITY 1.00 = EQUALITY 1.50
0.00 = INEQUALITY 1.00 = EQUALITY 1.50
Female-to-male ratio
Female-to-male ratio
Female-to-male ratio
110 Country Profiles Global Gender Gap Report 2011
Sample Female-to- Rank Score average Female Male male ratio
country score sample average
0.00 = inequality 1.00 = equality
0.00
0.20
0.40
0.60
0.80
1.00Economy
Education
Politics
Health
Rank Score(out of 135 countries) (0.00 = inequality, 1.00 = equality)
Gender Gap Subindexes
Economic Participation and Opportunity ........... 8 0.784 0.588
Labour force participation .................................. 23 0.90 0.68 76 85 0.90
Wage equality for similar work (survey) ............ 34 0.74 0.65 — — 0.74
Estimated earned income (PPP US$) ................. 46 0.64 0.52 15,119 23,507 0.64
Legislators, senior officials, and managers ........ 9 0.77 0.26 43 57 0.77
Professional and technical workers .................... 1 1.00 0.64 52 48 1.09
Educational Attainment .......................................... 1 1.000 0.928
Literacy rate .............................................................. 1 1.00 0.86 99 99 1.00
Enrolment in primary education ............................ 1 1.00 0.98 97 96 1.01
Enrolment in secondary education ....................... 1 1.00 0.90 93 88 1.05
Enrolment in tertiary education ............................. 1 1.00 0.86 73 34 2.18
Health and Survival ................................................. 1 0.980 0.956
Sex ratio at birth (female/male) ............................. 1 0.94 0.92 — — 0.99
Healthy life expectancy ......................................... 1 1.06 1.04 69 65 1.06
Political Empowerment ........................................ 82 0.104 0.185
Women in parliament .......................................... 103 0.11 0.22 10 90 0.11
Women in ministerial positions ......................... 118 0.06 0.18 6 94 0.06
Years with female head of state (last 50) .......... 15 0.12 0.16 6 44 0.12
BarbadosGender Gap Index 2011 33 0.717
Key Indicators
Total population (millions) 0.26
Population growth (%) 0.27
GDP (US$ billions) 2.52
GDP (PPP) per capita 18,723

Global Gender Gap Report 2011 Country Profiles 111
Economic Participation and Opportunity Educational Attainment Health and Survival Political Empowerment
Evolution 2006–2011
1 Survey data, responses on a 1-to-7 scale (1 = worst score, 7 = best score)2 Data on a 0-to-1 scale (1 = worst score, 0 = best score)3 Data on a 1-to-5 scale (1 = worst score, 5 = best score)4 Bracketed numbers show the range between the uncertainties, estimated
to contain the true maternal mortality ratio with a 95% probability
ECONOMIC EDUCATIONAL HEALTH AND POLITICAL OVERALL PARTICIPATION ATTAINMENT SURVIVAL EMPOWERMENT
Rank Score Rank Score Rank Score Rank Score Rank Score
0.0
0.2
0.4
0.6
0.8
1.0
2006 2007 2008 2009 2010 2011
Additional Data
Economic EmpowermentFemale adult unemployment rate (% of female labour force) .........9Male adult unemployment rate (% of male labour force) ................7Women in non-agricultural paid labour
(% of total labour force) ....................................................................51Inheritance practices in favour of male heirs2 ................................ —Firms with female participation in ownership (% of firms) ........... —Women’s access to land ownership2 ............................................... —Women’s access to bank loans2 ........................................................ —Women’s access to property other than land2 ............................... —Women’s access to finance programmes3 ...................................... —Ability of women to rise to positions of
enterprise leadership1 ....................................................................5.44
EducationFemale teachers, primary education (%) ..........................................78Female teachers, secondary education (%) .....................................59Female teachers, tertiary education (%) ...........................................49Female school life expectancy, primary to secondary (years)..... —Male school life expectancy, primary to secondary (years) ........ —
Marriage and ChildbearingMean age of marriage for women (years) ........................................32Early marriage (% women, aged 15–19) ........................................... —Fertility rate (births per woman) .......................................................1.50Adolescent fertility rate (births per 1,000 women, aged 15–19) ....53Antenatal care coverage, at least one visit (%) .............................100Births attended by skilled health staff (%) ......................................100Maternal mortality ratio (per 100,000 live births)4 ...............64 [55-72]Contraceptive prevalence, married women (%) ..............................55Female HIV prevalence, aged 15–49 (%) ........................................1.10Male HIV prevalence, aged 15–49 (%) ............................................1.70Infant mortality rate (per 1,000 live births) ........................................10Overall population sex ratio (male/female) ....................................0.94
Social Institutions and Political RightsPaternal versus maternal authority2.................................................. —Female genital mutilation2 ................................................................... —Acceptance or legality of polygamy2 ................................................ —Existence of legislation punishing acts
of violence against women2 ............................................................ —Year women received right to vote ................................................1950Quota type .............................................................................................. —Existence of legislation prohibiting
gender-based discrimination ........................................................ Yes
Childcare EcosystemLength of maternity leave ........................................................12 weeksMaternity leave benefits (% of wages paid) ...................................100Provider of maternity coverage ..............National insurance systemLength of paternity leave .....................................................................NoPaternity leave benefits (% of wages paid) ..................................... —Daycare options .................................................................................... —
BarbadosGender Gap Index 2011 (out of 135 countries) 33 0.717 8 0.784 1 1.000 1 0.980 82 0.104
Gender Gap Index 2010 (out of 134 countries) 31 0.718 7 0.787 1 1.000 1 0.980 80 0.104
Gender Gap Index 2009 (out of 134 countries) 21 0.724 5 0.785 1 1.000 1 0.980 67 0.129
Gender Gap Index 2008 (out of 130 countries) 26 0.719 9 0.771 44 0.996 1 0.980 62 0.129
Gender Gap Index 2007 (out of 128 countries) — — — — — — — — — —
Gender Gap Index 2006 (out of 115 countries) — — — — — — — — — —

Female-to-male ratio
0.00 = INEQUALITY 1.00 = EQUALITY 1.50
0.00 = INEQUALITY 1.00 = EQUALITY 1.50
0.00 = INEQUALITY 1.00 = EQUALITY 1.50
0.00 = INEQUALITY 1.00 = EQUALITY 1.50
Female-to-male ratio
Female-to-male ratio
Female-to-male ratio
112 Country Profiles Global Gender Gap Report 2011
Sample Female-to- Rank Score average Female Male male ratio
country score sample average
0.00 = inequality 1.00 = equality
0.00
0.20
0.40
0.60
0.80
1.00Economy
Education
Politics
Health
Rank Score(out of 135 countries) (0.00 = inequality, 1.00 = equality)
Gender Gap Subindexes
Economic Participation and Opportunity ......... 36 0.719 0.588
Labour force participation .................................... 53 0.83 0.68 61 73 0.83
Wage equality for similar work (survey) ............ 44 0.70 0.65 — — 0.70
Estimated earned income (PPP US$) ................. 32 0.67 0.52 26,943 40,000 0.67
Legislators, senior officials, and managers ...... 41 0.49 0.26 33 67 0.49
Professional and technical workers .................. 65 0.96 0.64 49 51 0.96
Educational Attainment ........................................ 63 0.991 0.928
Literacy rate .............................................................. 1 1.00 0.86 99 99 1.00
Enrolment in primary education ............................ 1 1.00 0.98 99 99 1.00
Enrolment in secondary education ..................... 99 0.96 0.90 85 89 0.96
Enrolment in tertiary education ............................. 1 1.00 0.86 74 59 1.25
Health and Survival ............................................... 46 0.979 0.956
Sex ratio at birth (female/male) ............................. 1 0.94 0.92 — — 0.96
Healthy life expectancy ........................................ 58 1.06 1.04 74 70 1.06
Political Empowerment ........................................ 17 0.324 0.185
Women in parliament .............................................. 7 0.65 0.22 39 61 0.65
Women in ministerial positions ........................... 15 0.50 0.18 33 67 0.50
Years with female head of state (last 50) .......... 52 0.00 0.16 0 50 0.00
BelgiumGender Gap Index 2011 13 0.753
Key Indicators
Total population (millions) 10.87
Population growth (%) 0.72
GDP (US$ billions) 266.51
GDP (PPP) per capita 32,863
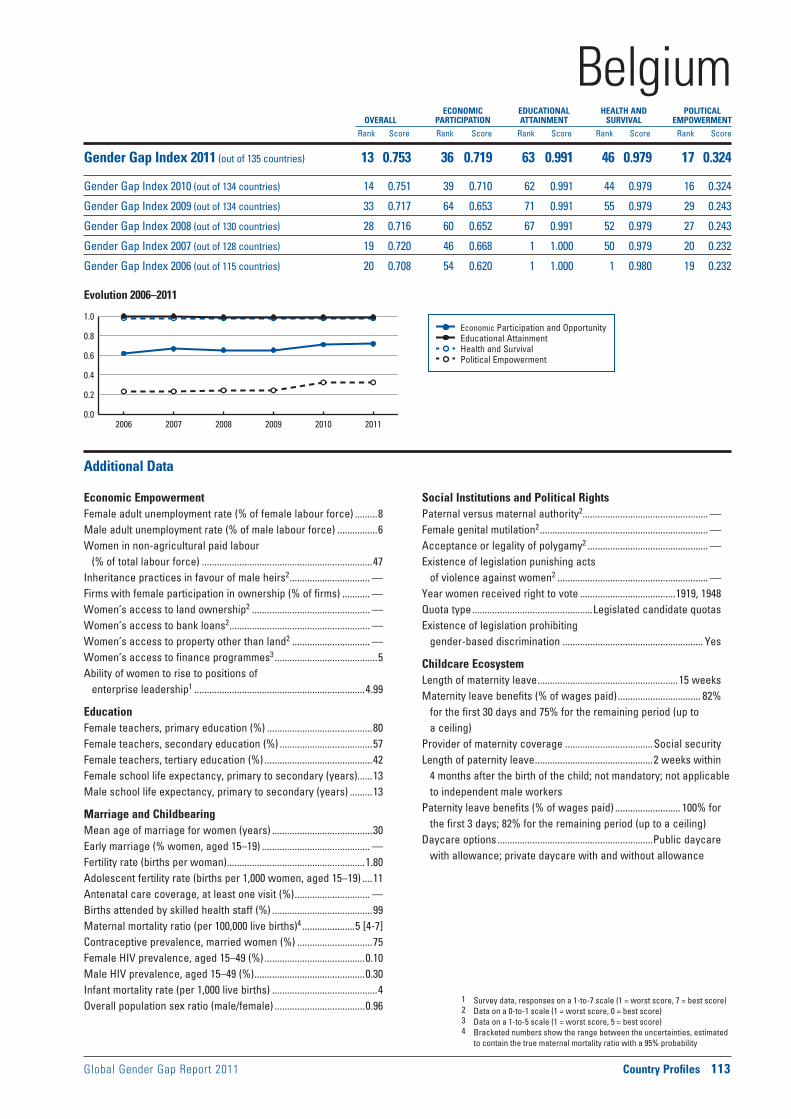
Global Gender Gap Report 2011 Country Profiles 113
Economic Participation and Opportunity Educational Attainment Health and Survival Political Empowerment
Evolution 2006–2011
1 Survey data, responses on a 1-to-7 scale (1 = worst score, 7 = best score)2 Data on a 0-to-1 scale (1 = worst score, 0 = best score)3 Data on a 1-to-5 scale (1 = worst score, 5 = best score)4 Bracketed numbers show the range between the uncertainties, estimated
to contain the true maternal mortality ratio with a 95% probability
ECONOMIC EDUCATIONAL HEALTH AND POLITICAL OVERALL PARTICIPATION ATTAINMENT SURVIVAL EMPOWERMENT
Rank Score Rank Score Rank Score Rank Score Rank Score
0.0
0.2
0.4
0.6
0.8
1.0
2006 2007 2008 2009 2010 2011
Additional Data
Economic EmpowermentFemale adult unemployment rate (% of female labour force) .........8Male adult unemployment rate (% of male labour force) ................6Women in non-agricultural paid labour
(% of total labour force) ....................................................................47Inheritance practices in favour of male heirs2 ................................ —Firms with female participation in ownership (% of firms) ........... —Women’s access to land ownership2 ............................................... —Women’s access to bank loans2 ........................................................ —Women’s access to property other than land2 ............................... —Women’s access to finance programmes3 .........................................5Ability of women to rise to positions of
enterprise leadership1 ....................................................................4.99
EducationFemale teachers, primary education (%) ..........................................80Female teachers, secondary education (%) .....................................57Female teachers, tertiary education (%) ...........................................42Female school life expectancy, primary to secondary (years)......13Male school life expectancy, primary to secondary (years) .........13
Marriage and ChildbearingMean age of marriage for women (years) ........................................30Early marriage (% women, aged 15–19) ........................................... —Fertility rate (births per woman) .......................................................1.80Adolescent fertility rate (births per 1,000 women, aged 15–19) ....11Antenatal care coverage, at least one visit (%) .............................. —Births attended by skilled health staff (%) ........................................99Maternal mortality ratio (per 100,000 live births)4 .....................5 [4-7]Contraceptive prevalence, married women (%) ..............................75Female HIV prevalence, aged 15–49 (%) ........................................0.10Male HIV prevalence, aged 15–49 (%) ............................................0.30Infant mortality rate (per 1,000 live births) ..........................................4Overall population sex ratio (male/female) ....................................0.96
Social Institutions and Political RightsPaternal versus maternal authority2.................................................. —Female genital mutilation2 ................................................................... —Acceptance or legality of polygamy2 ................................................ —Existence of legislation punishing acts
of violence against women2 ............................................................ —Year women received right to vote ......................................1919, 1948Quota type ................................................Legislated candidate quotasExistence of legislation prohibiting
gender-based discrimination ........................................................ Yes
Childcare EcosystemLength of maternity leave ........................................................15 weeksMaternity leave benefits (% of wages paid) ................................. 82%
for the first 30 days and 75% for the remaining period (up to a ceiling)
Provider of maternity coverage ...................................Social securityLength of paternity leave ...............................................2 weeks within
4 months after the birth of the child; not mandatory; not applicable to independent male workers
Paternity leave benefits (% of wages paid) .......................... 100% for the first 3 days; 82% for the remaining period (up to a ceiling)
Daycare options ..............................................................Public daycare with allowance; private daycare with and without allowance
BelgiumGender Gap Index 2011 (out of 135 countries) 13 0.753 36 0.719 63 0.991 46 0.979 17 0.324
Gender Gap Index 2010 (out of 134 countries) 14 0.751 39 0.710 62 0.991 44 0.979 16 0.324
Gender Gap Index 2009 (out of 134 countries) 33 0.717 64 0.653 71 0.991 55 0.979 29 0.243
Gender Gap Index 2008 (out of 130 countries) 28 0.716 60 0.652 67 0.991 52 0.979 27 0.243
Gender Gap Index 2007 (out of 128 countries) 19 0.720 46 0.668 1 1.000 50 0.979 20 0.232
Gender Gap Index 2006 (out of 115 countries) 20 0.708 54 0.620 1 1.000 1 0.980 19 0.232
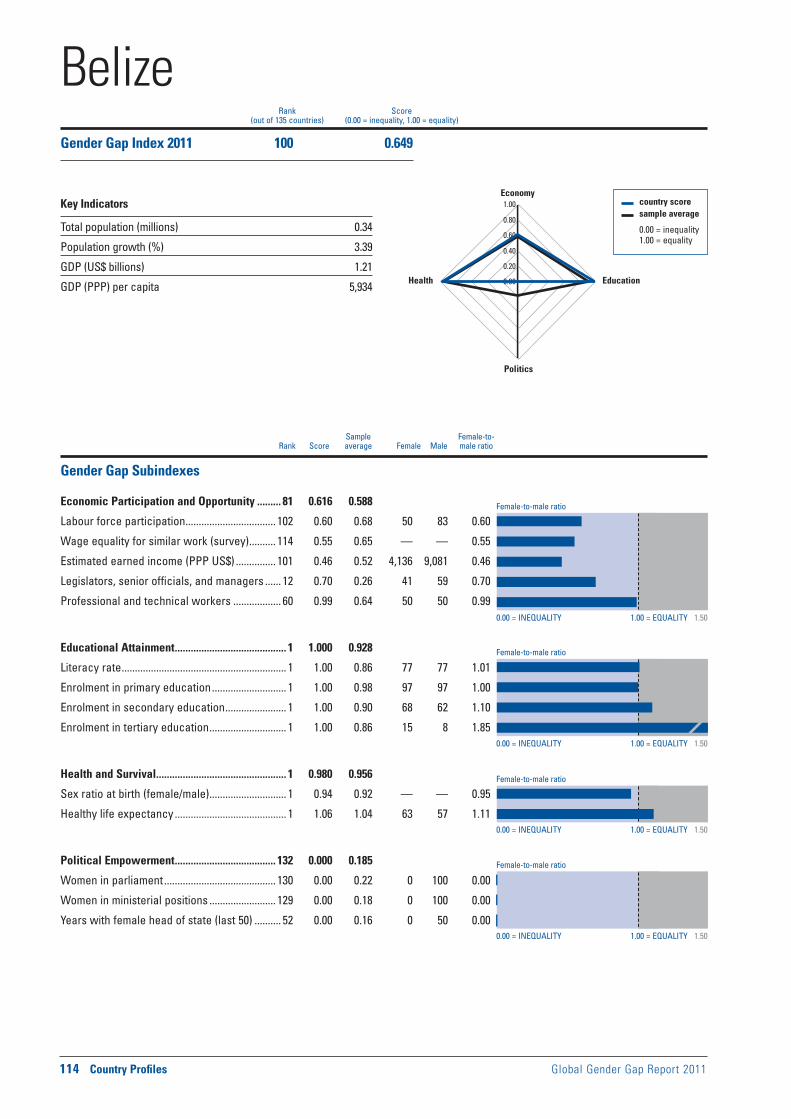
Female-to-male ratio
0.00 = INEQUALITY 1.00 = EQUALITY 1.50
0.00 = INEQUALITY 1.00 = EQUALITY 1.50
0.00 = INEQUALITY 1.00 = EQUALITY 1.50
0.00 = INEQUALITY 1.00 = EQUALITY 1.50
Female-to-male ratio
Female-to-male ratio
Female-to-male ratio
114 Country Profiles Global Gender Gap Report 2011
Sample Female-to- Rank Score average Female Male male ratio
country score sample average
0.00 = inequality 1.00 = equality
0.00
0.20
0.40
0.60
0.80
1.00Economy
Education
Politics
Health
Rank Score(out of 135 countries) (0.00 = inequality, 1.00 = equality)
Gender Gap Subindexes
Economic Participation and Opportunity ......... 81 0.616 0.588
Labour force participation .................................. 102 0.60 0.68 50 83 0.60
Wage equality for similar work (survey) .......... 114 0.55 0.65 — — 0.55
Estimated earned income (PPP US$) ............... 101 0.46 0.52 4,136 9,081 0.46
Legislators, senior officials, and managers ...... 12 0.70 0.26 41 59 0.70
Professional and technical workers .................. 60 0.99 0.64 50 50 0.99
Educational Attainment .......................................... 1 1.000 0.928
Literacy rate .............................................................. 1 1.00 0.86 77 77 1.01
Enrolment in primary education ............................ 1 1.00 0.98 97 97 1.00
Enrolment in secondary education ....................... 1 1.00 0.90 68 62 1.10
Enrolment in tertiary education ............................. 1 1.00 0.86 15 8 1.85
Health and Survival ................................................. 1 0.980 0.956
Sex ratio at birth (female/male) ............................. 1 0.94 0.92 — — 0.95
Healthy life expectancy .......................................... 1 1.06 1.04 63 57 1.11
Political Empowerment ...................................... 132 0.000 0.185
Women in parliament .......................................... 130 0.00 0.22 0 100 0.00
Women in ministerial positions ......................... 129 0.00 0.18 0 100 0.00
Years with female head of state (last 50) .......... 52 0.00 0.16 0 50 0.00
BelizeGender Gap Index 2011 100 0.649
Key Indicators
Total population (millions) 0.34
Population growth (%) 3.39
GDP (US$ billions) 1.21
GDP (PPP) per capita 5,934

Global Gender Gap Report 2011 Country Profiles 115
Economic Participation and Opportunity Educational Attainment Health and Survival Political Empowerment
Evolution 2006–2011
1 Survey data, responses on a 1-to-7 scale (1 = worst score, 7 = best score)2 Data on a 0-to-1 scale (1 = worst score, 0 = best score)3 Data on a 1-to-5 scale (1 = worst score, 5 = best score)4 Bracketed numbers show the range between the uncertainties, estimated
to contain the true maternal mortality ratio with a 95% probability
ECONOMIC EDUCATIONAL HEALTH AND POLITICAL OVERALL PARTICIPATION ATTAINMENT SURVIVAL EMPOWERMENT
Rank Score Rank Score Rank Score Rank Score Rank Score
0.0
0.2
0.4
0.6
0.8
1.0
2006 2007 2008 2009 2010 2011
Additional Data
Economic EmpowermentFemale adult unemployment rate (% of female labour force) .......13Male adult unemployment rate (% of male labour force) ................6Women in non-agricultural paid labour
(% of total labour force) ....................................................................38Inheritance practices in favour of male heirs2 ................................ —Firms with female participation in ownership (% of firms) ........... —Women’s access to land ownership2 ............................................... —Women’s access to bank loans2 ........................................................ —Women’s access to property other than land2 ............................... —Women’s access to finance programmes3 ...................................... —Ability of women to rise to positions of
enterprise leadership1 ....................................................................4.30
EducationFemale teachers, primary education (%) ..........................................72Female teachers, secondary education (%) .....................................60Female teachers, tertiary education (%) ...........................................49Female school life expectancy, primary to secondary (years)......12Male school life expectancy, primary to secondary (years) .........12
Marriage and ChildbearingMean age of marriage for women (years) ........................................21Early marriage (% women, aged 15–19) ........................................... —Fertility rate (births per woman) .......................................................2.90Adolescent fertility rate (births per 1,000 women, aged 15–19) ....96Antenatal care coverage, at least one visit (%) ...............................94Births attended by skilled health staff (%) ........................................95Maternal mortality ratio (per 100,000 live births)4 .............94 [56-140]Contraceptive prevalence, married women (%) ..............................34Female HIV prevalence, aged 15–49 (%) ........................................2.80Male HIV prevalence, aged 15–49 (%) ............................................1.90Infant mortality rate (per 1,000 live births) ........................................16Overall population sex ratio (male/female) ....................................1.02
Social Institutions and Political RightsPaternal versus maternal authority2.................................................. —Female genital mutilation2 ................................................................... —Acceptance or legality of polygamy2 ................................................ —Existence of legislation punishing acts
of violence against women2 ............................................................ —Year women received right to vote ................................................1954Quota type .............................................................................................. —Existence of legislation prohibiting
gender-based discrimination .......................................................... —
Childcare EcosystemLength of maternity leave ........................................................14 weeksMaternity leave benefits (% of wages paid) ...................................100Provider of maternity coverage ...................................Social security
or employer (for women who are not entitled to receive benefits from social security)
Length of paternity leave ..................................................................... —Paternity leave benefits (% of wages paid) ..................................... —Daycare options .................................................................................... —
BelizeGender Gap Index 2011 (out of 135 countries) 100 0.649 81 0.616 1 1.000 1 0.980 132 0.000
Gender Gap Index 2010 (out of 134 countries) 93 0.654 72 0.636 32 0.999 1 0.980 131 0.000
Gender Gap Index 2009 (out of 134 countries) 87 0.664 79 0.622 35 0.998 1 0.980 121 0.055
Gender Gap Index 2008 (out of 130 countries) 86 0.661 79 0.609 1 1.000 1 0.980 116 0.055
Gender Gap Index 2007 (out of 128 countries) 94 0.643 96 0.552 1 1.000 1 0.980 114 0.039
Gender Gap Index 2006 (out of 115 countries) — — — — — — — — — —

Female-to-male ratio
0.00 = INEQUALITY 1.00 = EQUALITY 1.50
0.00 = INEQUALITY 1.00 = EQUALITY 1.50
0.00 = INEQUALITY 1.00 = EQUALITY 1.50
0.00 = INEQUALITY 1.00 = EQUALITY 1.50
Female-to-male ratio
Female-to-male ratio
Female-to-male ratio
116 Country Profiles Global Gender Gap Report 2011
Sample Female-to- Rank Score average Female Male male ratio
country score sample average
0.00 = inequality 1.00 = equality
0.00
0.20
0.40
0.60
0.80
1.00Economy
Education
Politics
Health
Rank Score(out of 135 countries) (0.00 = inequality, 1.00 = equality)
Gender Gap Subindexes
Economic Participation and Opportunity ......... 67 0.649 0.588
Labour force participation .................................... 31 0.88 0.68 69 78 0.88
Wage equality for similar work (survey) ............ 19 0.77 0.65 — — 0.77
Estimated earned income (PPP US$) ................. 37 0.66 0.52 1,202 1,808 0.66
Legislators, senior officials, and managers .... 119 0.08 0.26 7 93 0.08
Professional and technical workers ..................— — 0.64 — — —
Educational Attainment ...................................... 133 0.656 0.928
Literacy rate .......................................................... 132 0.54 0.86 29 54 0.54
Enrolment in primary education ........................ 126 0.89 0.98 86 97 0.89
Enrolment in secondary education ................... 130 0.49 0.90 13 26 0.49
Enrolment in tertiary education ......................... 132 0.25 0.86 2 7 0.25
Health and Survival ............................................. 111 0.961 0.956
Sex ratio at birth (female/male) ............................. 1 0.94 0.92 — — 0.95
Healthy life expectancy ...................................... 118 1.00 1.04 50 50 1.00
Political Empowerment ...................................... 104 0.066 0.185
Women in parliament .......................................... 113 0.09 0.22 8 92 0.09
Women in ministerial positions ........................... 72 0.15 0.18 13 87 0.15
Years with female head of state (last 50) .......... 52 0.00 0.16 0 50 0.00
BeninGender Gap Index 2011 128 0.583
Key Indicators
Total population (millions) 9.21
Population growth (%) 3.05
GDP (US$ billions) 3.34
GDP (PPP) per capita 1,368
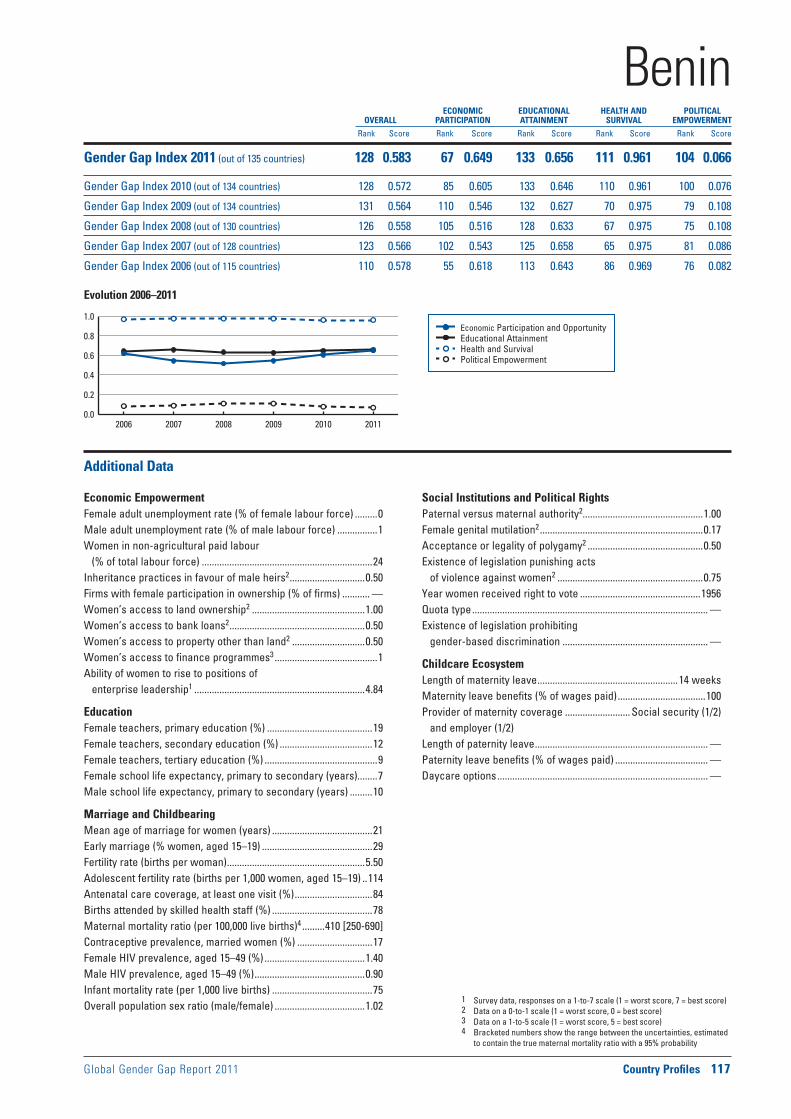
Global Gender Gap Report 2011 Country Profiles 117
Economic Participation and Opportunity Educational Attainment Health and Survival Political Empowerment
Evolution 2006–2011
1 Survey data, responses on a 1-to-7 scale (1 = worst score, 7 = best score)2 Data on a 0-to-1 scale (1 = worst score, 0 = best score)3 Data on a 1-to-5 scale (1 = worst score, 5 = best score)4 Bracketed numbers show the range between the uncertainties, estimated
to contain the true maternal mortality ratio with a 95% probability
ECONOMIC EDUCATIONAL HEALTH AND POLITICAL OVERALL PARTICIPATION ATTAINMENT SURVIVAL EMPOWERMENT
Rank Score Rank Score Rank Score Rank Score Rank Score
0.0
0.2
0.4
0.6
0.8
1.0
2006 2007 2008 2009 2010 2011
Additional Data
Economic EmpowermentFemale adult unemployment rate (% of female labour force) .........0Male adult unemployment rate (% of male labour force) ................1Women in non-agricultural paid labour
(% of total labour force) ....................................................................24Inheritance practices in favour of male heirs2 ..............................0.50Firms with female participation in ownership (% of firms) ........... —Women’s access to land ownership2 .............................................1.00Women’s access to bank loans2 ......................................................0.50Women’s access to property other than land2 .............................0.50Women’s access to finance programmes3 .........................................1Ability of women to rise to positions of
enterprise leadership1 ....................................................................4.84
EducationFemale teachers, primary education (%) ..........................................19Female teachers, secondary education (%) .....................................12Female teachers, tertiary education (%) .............................................9Female school life expectancy, primary to secondary (years)........7Male school life expectancy, primary to secondary (years) .........10
Marriage and ChildbearingMean age of marriage for women (years) ........................................21Early marriage (% women, aged 15–19) ............................................29Fertility rate (births per woman) .......................................................5.50Adolescent fertility rate (births per 1,000 women, aged 15–19) ..114Antenatal care coverage, at least one visit (%) ...............................84Births attended by skilled health staff (%) ........................................78Maternal mortality ratio (per 100,000 live births)4 .........410 [250-690]Contraceptive prevalence, married women (%) ..............................17Female HIV prevalence, aged 15–49 (%) ........................................1.40Male HIV prevalence, aged 15–49 (%) ............................................0.90Infant mortality rate (per 1,000 live births) ........................................75Overall population sex ratio (male/female) ....................................1.02
Social Institutions and Political RightsPaternal versus maternal authority2................................................1.00Female genital mutilation2 .................................................................0.17Acceptance or legality of polygamy2 ..............................................0.50Existence of legislation punishing acts
of violence against women2 ..........................................................0.75Year women received right to vote ................................................1956Quota type .............................................................................................. —Existence of legislation prohibiting
gender-based discrimination .......................................................... —
Childcare EcosystemLength of maternity leave ........................................................14 weeksMaternity leave benefits (% of wages paid) ...................................100Provider of maternity coverage .......................... Social security (1/2)
and employer (1/2)Length of paternity leave ..................................................................... —Paternity leave benefits (% of wages paid) ..................................... —Daycare options .................................................................................... —
BeninGender Gap Index 2011 (out of 135 countries) 128 0.583 67 0.649 133 0.656 111 0.961 104 0.066
Gender Gap Index 2010 (out of 134 countries) 128 0.572 85 0.605 133 0.646 110 0.961 100 0.076
Gender Gap Index 2009 (out of 134 countries) 131 0.564 110 0.546 132 0.627 70 0.975 79 0.108
Gender Gap Index 2008 (out of 130 countries) 126 0.558 105 0.516 128 0.633 67 0.975 75 0.108
Gender Gap Index 2007 (out of 128 countries) 123 0.566 102 0.543 125 0.658 65 0.975 81 0.086
Gender Gap Index 2006 (out of 115 countries) 110 0.578 55 0.618 113 0.643 86 0.969 76 0.082

Female-to-male ratio
0.00 = INEQUALITY 1.00 = EQUALITY 1.50
0.00 = INEQUALITY 1.00 = EQUALITY 1.50
0.00 = INEQUALITY 1.00 = EQUALITY 1.50
0.00 = INEQUALITY 1.00 = EQUALITY 1.50
Female-to-male ratio
Female-to-male ratio
Female-to-male ratio
118 Country Profiles Global Gender Gap Report 2011
Sample Female-to- Rank Score average Female Male male ratio
country score sample average
0.00 = inequality 1.00 = equality
0.00
0.20
0.40
0.60
0.80
1.00Economy
Education
Politics
Health
Rank Score(out of 135 countries) (0.00 = inequality, 1.00 = equality)
Gender Gap Subindexes
Economic Participation and Opportunity ......... 72 0.635 0.588
Labour force participation .................................... 69 0.77 0.68 64 83 0.77
Wage equality for similar work (survey) .......... 115 0.54 0.65 — — 0.54
Estimated earned income (PPP US$) ................. 14 0.77 0.52 3,856 4,986 0.77
Legislators, senior officials, and managers ...... 63 0.41 0.26 29 71 0.41
Professional and technical workers .................. 88 0.68 0.64 40 60 0.68
Educational Attainment ........................................ 95 0.965 0.928
Literacy rate ............................................................ 98 0.91 0.86 87 95 0.91
Enrolment in primary education ............................ 1 1.00 0.98 94 93 1.01
Enrolment in secondary education ....................... 1 1.00 0.90 69 69 1.00
Enrolment in tertiary education ......................... 100 0.84 0.86 35 42 0.84
Health and Survival ............................................... 84 0.972 0.956
Sex ratio at birth (female/male) ............................. 1 0.94 0.92 — — 0.95
Healthy life expectancy ........................................ 90 1.04 1.04 59 57 1.04
Political Empowerment ........................................ 45 0.173 0.185
Women in parliament ............................................ 31 0.34 0.22 25 75 0.34
Women in ministerial positions ........................... 54 0.25 0.18 20 80 0.25
Years with female head of state (last 50) .......... 42 0.01 0.16 1 49 0.01
BoliviaGender Gap Index 2011 62 0.686
Key Indicators
Total population (millions) 10.03
Population growth (%) 1.69
GDP (US$ billions) 12.25
GDP (PPP) per capita 4,309
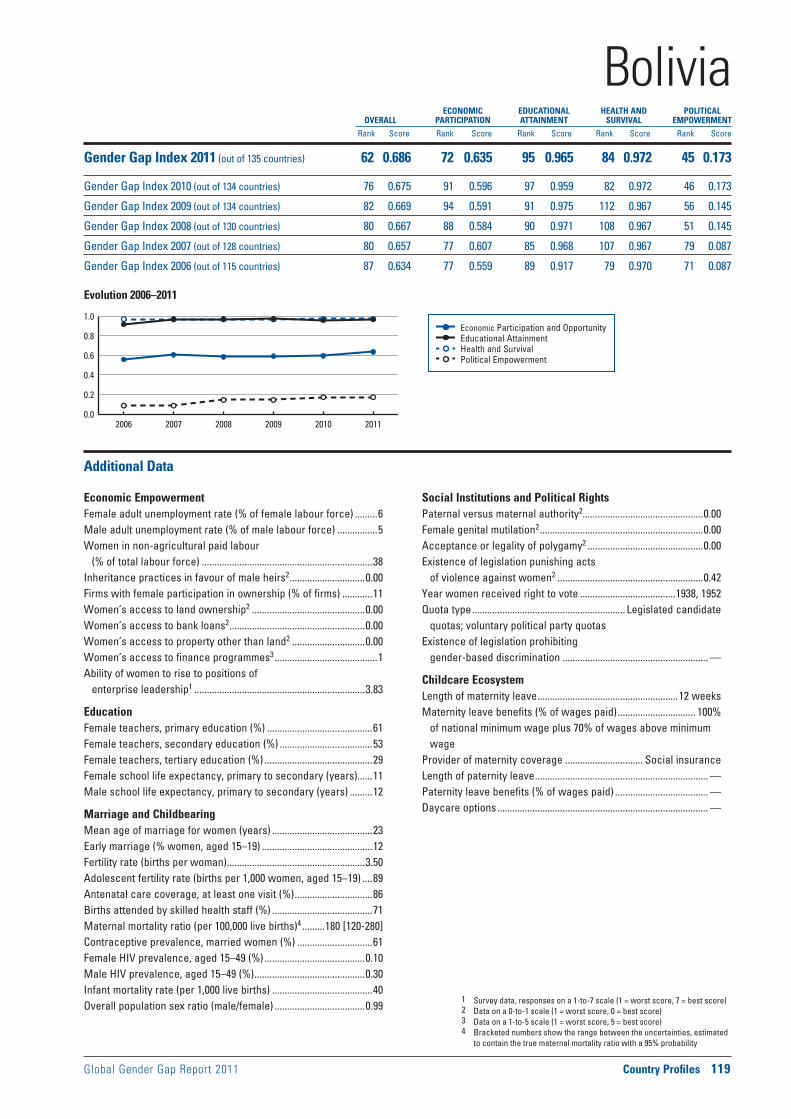
Global Gender Gap Report 2011 Country Profiles 119
Economic Participation and Opportunity Educational Attainment Health and Survival Political Empowerment
Evolution 2006–2011
1 Survey data, responses on a 1-to-7 scale (1 = worst score, 7 = best score)2 Data on a 0-to-1 scale (1 = worst score, 0 = best score)3 Data on a 1-to-5 scale (1 = worst score, 5 = best score)4 Bracketed numbers show the range between the uncertainties, estimated
to contain the true maternal mortality ratio with a 95% probability
ECONOMIC EDUCATIONAL HEALTH AND POLITICAL OVERALL PARTICIPATION ATTAINMENT SURVIVAL EMPOWERMENT
Rank Score Rank Score Rank Score Rank Score Rank Score
0.0
0.2
0.4
0.6
0.8
1.0
2006 2007 2008 2009 2010 2011
Additional Data
Economic EmpowermentFemale adult unemployment rate (% of female labour force) .........6Male adult unemployment rate (% of male labour force) ................5Women in non-agricultural paid labour
(% of total labour force) ....................................................................38Inheritance practices in favour of male heirs2 ..............................0.00Firms with female participation in ownership (% of firms) ............11Women’s access to land ownership2 .............................................0.00Women’s access to bank loans2 ......................................................0.00Women’s access to property other than land2 .............................0.00Women’s access to finance programmes3 .........................................1Ability of women to rise to positions of
enterprise leadership1 ....................................................................3.83
EducationFemale teachers, primary education (%) ..........................................61Female teachers, secondary education (%) .....................................53Female teachers, tertiary education (%) ...........................................29Female school life expectancy, primary to secondary (years)......11Male school life expectancy, primary to secondary (years) .........12
Marriage and ChildbearingMean age of marriage for women (years) ........................................23Early marriage (% women, aged 15–19) ............................................12Fertility rate (births per woman) .......................................................3.50Adolescent fertility rate (births per 1,000 women, aged 15–19) ....89Antenatal care coverage, at least one visit (%) ...............................86Births attended by skilled health staff (%) ........................................71Maternal mortality ratio (per 100,000 live births)4 .........180 [120-280]Contraceptive prevalence, married women (%) ..............................61Female HIV prevalence, aged 15–49 (%) ........................................0.10Male HIV prevalence, aged 15–49 (%) ............................................0.30Infant mortality rate (per 1,000 live births) ........................................40Overall population sex ratio (male/female) ....................................0.99
Social Institutions and Political RightsPaternal versus maternal authority2................................................0.00Female genital mutilation2 .................................................................0.00Acceptance or legality of polygamy2 ..............................................0.00Existence of legislation punishing acts
of violence against women2 ..........................................................0.42Year women received right to vote ......................................1938, 1952Quota type ............................................................. Legislated candidate
quotas; voluntary political party quotasExistence of legislation prohibiting
gender-based discrimination .......................................................... —
Childcare EcosystemLength of maternity leave ........................................................12 weeksMaternity leave benefits (% of wages paid) ............................... 100%
of national minimum wage plus 70% of wages above minimum wage
Provider of maternity coverage ............................... Social insuranceLength of paternity leave ..................................................................... —Paternity leave benefits (% of wages paid) ..................................... —Daycare options .................................................................................... —
BoliviaGender Gap Index 2011 (out of 135 countries) 62 0.686 72 0.635 95 0.965 84 0.972 45 0.173
Gender Gap Index 2010 (out of 134 countries) 76 0.675 91 0.596 97 0.959 82 0.972 46 0.173
Gender Gap Index 2009 (out of 134 countries) 82 0.669 94 0.591 91 0.975 112 0.967 56 0.145
Gender Gap Index 2008 (out of 130 countries) 80 0.667 88 0.584 90 0.971 108 0.967 51 0.145
Gender Gap Index 2007 (out of 128 countries) 80 0.657 77 0.607 85 0.968 107 0.967 79 0.087
Gender Gap Index 2006 (out of 115 countries) 87 0.634 77 0.559 89 0.917 79 0.970 71 0.087

Female-to-male ratio
0.00 = INEQUALITY 1.00 = EQUALITY 1.50
0.00 = INEQUALITY 1.00 = EQUALITY 1.50
0.00 = INEQUALITY 1.00 = EQUALITY 1.50
0.00 = INEQUALITY 1.00 = EQUALITY 1.50
Female-to-male ratio
Female-to-male ratio
Female-to-male ratio
120 Country Profiles Global Gender Gap Report 2011
Sample Female-to- Rank Score average Female Male male ratio
country score sample average
0.00 = inequality 1.00 = equality
0.00
0.20
0.40
0.60
0.80
1.00Economy
Education
Politics
Health
Rank Score(out of 135 countries) (0.00 = inequality, 1.00 = equality)
Gender Gap Subindexes
Economic Participation and Opportunity ......... 37 0.719 0.588
Labour force participation .................................... 12 0.92 0.68 76 82 0.92
Wage equality for similar work (survey) ............ 11 0.78 0.65 — — 0.78
Estimated earned income (PPP US$) ................. 93 0.49 0.52 8,823 17,952 0.49
Legislators, senior officials, and managers ...... 55 0.44 0.26 30 70 0.44
Professional and technical workers .................... 1 1.00 0.64 55 45 1.24
Educational Attainment .......................................... 1 1.000 0.928
Literacy rate .............................................................. 1 1.00 0.86 84 84 1.01
Enrolment in primary education ............................ 1 1.00 0.98 88 86 1.02
Enrolment in secondary education ....................... 1 1.00 0.90 64 56 1.15
Enrolment in tertiary education ............................. 1 1.00 0.86 8 7 1.15
Health and Survival ............................................. 126 0.955 0.956
Sex ratio at birth (female/male) ............................. 1 0.94 0.92 — — 0.97
Healthy life expectancy ...................................... 133 0.98 1.04 48 49 0.98
Political Empowerment ...................................... 111 0.060 0.185
Women in parliament .......................................... 116 0.09 0.22 8 92 0.09
Women in ministerial positions ........................... 79 0.13 0.18 12 88 0.13
Years with female head of state (last 50) .......... 52 0.00 0.16 0 50 0.00
BotswanaGender Gap Index 2011 66 0.683
Key Indicators
Total population (millions) 1.98
Population growth (%) 1.42
GDP (US$ billions) 8.41
GDP (PPP) per capita 12,644
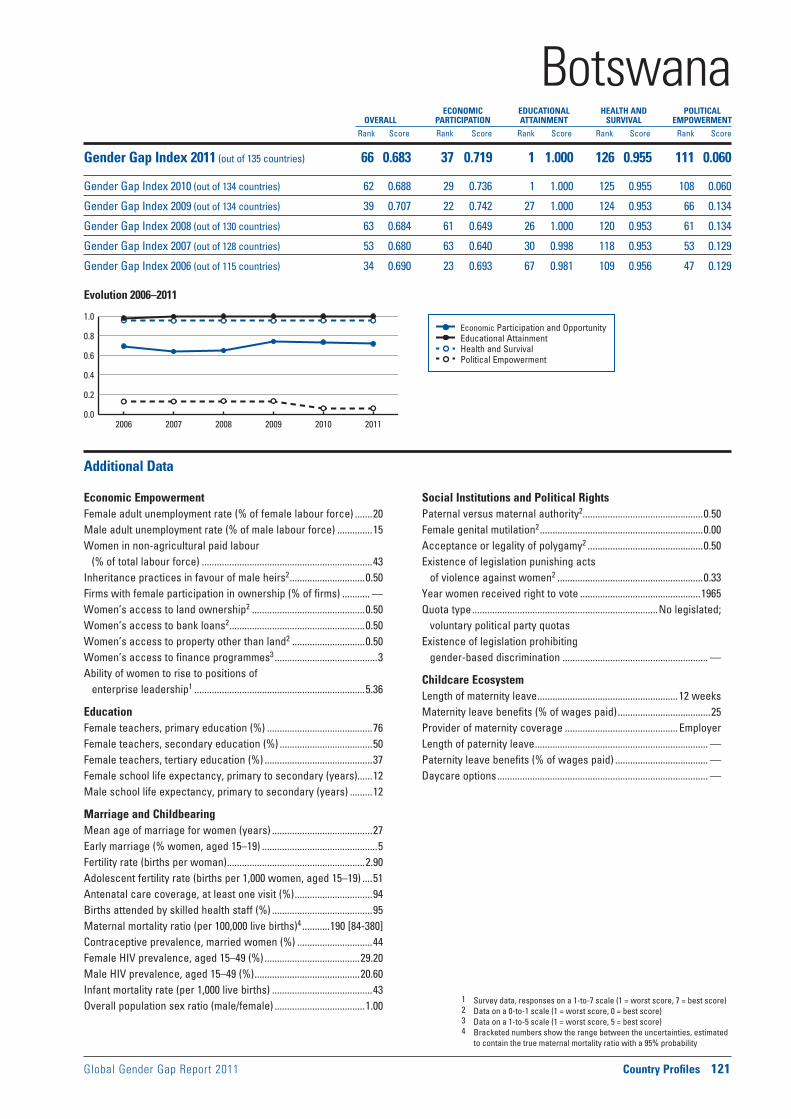
Global Gender Gap Report 2011 Country Profiles 121
Economic Participation and Opportunity Educational Attainment Health and Survival Political Empowerment
Evolution 2006–2011
1 Survey data, responses on a 1-to-7 scale (1 = worst score, 7 = best score)2 Data on a 0-to-1 scale (1 = worst score, 0 = best score)3 Data on a 1-to-5 scale (1 = worst score, 5 = best score)4 Bracketed numbers show the range between the uncertainties, estimated
to contain the true maternal mortality ratio with a 95% probability
ECONOMIC EDUCATIONAL HEALTH AND POLITICAL OVERALL PARTICIPATION ATTAINMENT SURVIVAL EMPOWERMENT
Rank Score Rank Score Rank Score Rank Score Rank Score
0.0
0.2
0.4
0.6
0.8
1.0
2006 2007 2008 2009 2010 2011
Additional Data
Economic EmpowermentFemale adult unemployment rate (% of female labour force) .......20Male adult unemployment rate (% of male labour force) ..............15Women in non-agricultural paid labour
(% of total labour force) ....................................................................43Inheritance practices in favour of male heirs2 ..............................0.50Firms with female participation in ownership (% of firms) ........... —Women’s access to land ownership2 .............................................0.50Women’s access to bank loans2 ......................................................0.50Women’s access to property other than land2 .............................0.50Women’s access to finance programmes3 .........................................3Ability of women to rise to positions of
enterprise leadership1 ....................................................................5.36
EducationFemale teachers, primary education (%) ..........................................76Female teachers, secondary education (%) .....................................50Female teachers, tertiary education (%) ...........................................37Female school life expectancy, primary to secondary (years)......12Male school life expectancy, primary to secondary (years) .........12
Marriage and ChildbearingMean age of marriage for women (years) ........................................27Early marriage (% women, aged 15–19) ..............................................5Fertility rate (births per woman) .......................................................2.90Adolescent fertility rate (births per 1,000 women, aged 15–19) ....51Antenatal care coverage, at least one visit (%) ...............................94Births attended by skilled health staff (%) ........................................95Maternal mortality ratio (per 100,000 live births)4 ...........190 [84-380]Contraceptive prevalence, married women (%) ..............................44Female HIV prevalence, aged 15–49 (%) ......................................29.20Male HIV prevalence, aged 15–49 (%) ..........................................20.60Infant mortality rate (per 1,000 live births) ........................................43Overall population sex ratio (male/female) ....................................1.00
Social Institutions and Political RightsPaternal versus maternal authority2................................................0.50Female genital mutilation2 .................................................................0.00Acceptance or legality of polygamy2 ..............................................0.50Existence of legislation punishing acts
of violence against women2 ..........................................................0.33Year women received right to vote ................................................1965Quota type ..........................................................................No legislated;
voluntary political party quotasExistence of legislation prohibiting
gender-based discrimination .......................................................... —
Childcare EcosystemLength of maternity leave ........................................................12 weeksMaternity leave benefits (% of wages paid) .....................................25Provider of maternity coverage .............................................EmployerLength of paternity leave ..................................................................... —Paternity leave benefits (% of wages paid) ..................................... —Daycare options .................................................................................... —
BotswanaGender Gap Index 2011 (out of 135 countries) 66 0.683 37 0.719 1 1.000 126 0.955 111 0.060
Gender Gap Index 2010 (out of 134 countries) 62 0.688 29 0.736 1 1.000 125 0.955 108 0.060
Gender Gap Index 2009 (out of 134 countries) 39 0.707 22 0.742 27 1.000 124 0.953 66 0.134
Gender Gap Index 2008 (out of 130 countries) 63 0.684 61 0.649 26 1.000 120 0.953 61 0.134
Gender Gap Index 2007 (out of 128 countries) 53 0.680 63 0.640 30 0.998 118 0.953 53 0.129
Gender Gap Index 2006 (out of 115 countries) 34 0.690 23 0.693 67 0.981 109 0.956 47 0.129

Female-to-male ratio
0.00 = INEQUALITY 1.00 = EQUALITY 1.50
0.00 = INEQUALITY 1.00 = EQUALITY 1.50
0.00 = INEQUALITY 1.00 = EQUALITY 1.50
0.00 = INEQUALITY 1.00 = EQUALITY 1.50
Female-to-male ratio
Female-to-male ratio
Female-to-male ratio
122 Country Profiles Global Gender Gap Report 2011
Sample Female-to- Rank Score average Female Male male ratio
country score sample average
0.00 = inequality 1.00 = equality
0.00
0.20
0.40
0.60
0.80
1.00Economy
Education
Politics
Health
Rank Score(out of 135 countries) (0.00 = inequality, 1.00 = equality)
Gender Gap Subindexes
Economic Participation and Opportunity ......... 68 0.649 0.588
Labour force participation .................................... 74 0.75 0.68 64 85 0.75
Wage equality for similar work (survey) .......... 124 0.51 0.65 — — 0.51
Estimated earned income (PPP US$) ................. 58 0.61 0.52 7,865 12,946 0.61
Legislators, senior officials, and managers ...... 29 0.56 0.26 36 64 0.56
Professional and technical workers .................... 1 1.00 0.64 52 48 1.09
Educational Attainment ........................................ 66 0.990 0.928
Literacy rate .............................................................. 1 1.00 0.86 90 90 1.00
Enrolment in primary education ........................ 105 0.98 0.98 93 95 0.98
Enrolment in secondary education ....................... 1 1.00 0.90 85 78 1.10
Enrolment in tertiary education ............................. 1 1.00 0.86 39 30 1.29
Health and Survival ................................................. 1 0.980 0.956
Sex ratio at birth (female/male) ............................. 1 0.94 0.92 — — 0.95
Healthy life expectancy .......................................... 1 1.06 1.04 66 62 1.06
Political Empowerment ...................................... 114 0.053 0.185
Women in parliament .......................................... 111 0.09 0.22 9 91 0.09
Women in ministerial positions ......................... 103 0.08 0.18 7 93 0.08
Years with female head of state (last 50) .......... 43 0.01 0.16 1 50 0.01
BrazilGender Gap Index 2011 82 0.668
Key Indicators
Total population (millions) 194.95
Population growth (%) 0.88
GDP (US$ billions) 916.13
GDP (PPP) per capita 10,056

Global Gender Gap Report 2011 Country Profiles 123
Economic Participation and Opportunity Educational Attainment Health and Survival Political Empowerment
Evolution 2006–2011
1 Survey data, responses on a 1-to-7 scale (1 = worst score, 7 = best score)2 Data on a 0-to-1 scale (1 = worst score, 0 = best score)3 Data on a 1-to-5 scale (1 = worst score, 5 = best score)4 Bracketed numbers show the range between the uncertainties, estimated
to contain the true maternal mortality ratio with a 95% probability
ECONOMIC EDUCATIONAL HEALTH AND POLITICAL OVERALL PARTICIPATION ATTAINMENT SURVIVAL EMPOWERMENT
Rank Score Rank Score Rank Score Rank Score Rank Score
0.0
0.2
0.4
0.6
0.8
1.0
2006 2007 2008 2009 2010 2011
Additional Data
Economic EmpowermentFemale adult unemployment rate (% of female labour force) .......11Male adult unemployment rate (% of male labour force) ................5Women in non-agricultural paid labour
(% of total labour force) ....................................................................42Inheritance practices in favour of male heirs2 ..............................0.00Firms with female participation in ownership (% of firms) ............16Women’s access to land ownership2 .............................................0.00Women’s access to bank loans2 ......................................................0.00Women’s access to property other than land2 .............................0.00Women’s access to finance programmes3 .........................................2Ability of women to rise to positions of
enterprise leadership1 ....................................................................4.06
EducationFemale teachers, primary education (%) ..........................................91Female teachers, secondary education (%) .....................................68Female teachers, tertiary education (%) ...........................................44Female school life expectancy, primary to secondary (years)......12Male school life expectancy, primary to secondary (years) .........12
Marriage and ChildbearingMean age of marriage for women (years) ........................................23Early marriage (% women, aged 15–19) ............................................17Fertility rate (births per woman) .......................................................1.90Adolescent fertility rate (births per 1,000 women, aged 15–19) ....56Antenatal care coverage, at least one visit (%) ...............................97Births attended by skilled health staff (%) ........................................98Maternal mortality ratio (per 100,000 live births)4 ...............58 [38-87]Contraceptive prevalence, married women (%) ..............................77Female HIV prevalence, aged 15–49 (%) .......................................... —Male HIV prevalence, aged 15–49 (%) .............................................. —Infant mortality rate (per 1,000 live births) ........................................17Overall population sex ratio (male/female) ....................................0.97
Social Institutions and Political RightsPaternal versus maternal authority2................................................0.00Female genital mutilation2 .................................................................0.00Acceptance or legality of polygamy2 ..............................................0.00Existence of legislation punishing acts
of violence against women2 ..........................................................0.58Year women received right to vote ................................................1932Quota type ............................................................. Legislated candidate
quotas; voluntary political party quotasExistence of legislation prohibiting
gender-based discrimination .......................................................... —
Childcare EcosystemLength of maternity leave ......................................................... 120 daysMaternity leave benefits (% of wages paid) ...................................100Provider of maternity coverage ............................... Social insuranceLength of paternity leave ..................................................................... —Paternity leave benefits (% of wages paid) ..................................... —Daycare options .................................................................................... —
BrazilGender Gap Index 2011 (out of 135 countries) 82 0.668 68 0.649 66 0.990 1 0.980 114 0.053
Gender Gap Index 2010 (out of 134 countries) 85 0.665 66 0.643 63 0.990 1 0.980 112 0.049
Gender Gap Index 2009 (out of 134 countries) 81 0.670 75 0.637 32 0.999 1 0.980 114 0.063
Gender Gap Index 2008 (out of 130 countries) 73 0.674 59 0.653 1 1.000 1 0.980 110 0.063
Gender Gap Index 2007 (out of 128 countries) 74 0.664 62 0.645 84 0.969 1 0.980 96 0.062
Gender Gap Index 2006 (out of 115 countries) 67 0.654 63 0.604 74 0.972 1 0.980 86 0.061
Female-to-male ratio
0.00 = INEQUALITY 1.00 = EQUALITY 1.50
0.00 = INEQUALITY 1.00 = EQUALITY 1.50
0.00 = INEQUALITY 1.00 = EQUALITY 1.50
0.00 = INEQUALITY 1.00 = EQUALITY 1.50
Female-to-male ratio
Female-to-male ratio
Female-to-male ratio
124 Country Profiles Global Gender Gap Report 2011
Sample Female-to- Rank Score average Female Male male ratio
country score sample average
0.00 = inequality 1.00 = equality
0.00
0.20
0.40
0.60
0.80
1.00Economy
Education
Politics
Health
Rank Score(out of 135 countries) (0.00 = inequality, 1.00 = equality)
Gender Gap Subindexes
Economic Participation and Opportunity ......... 20 0.755 0.588
Labour force participation .................................... 63 0.80 0.68 62 78 0.80
Wage equality for similar work (survey) ............ 27 0.75 0.65 — — 0.75
Estimated earned income (PPP US$) ................... 3 0.97 0.52 38,656 40,000 0.97
Legislators, senior officials, and managers ...... 34 0.54 0.26 35 65 0.54
Professional and technical workers .................. 91 0.58 0.64 37 63 0.58
Educational Attainment ........................................ 52 0.994 0.928
Literacy rate ............................................................ 78 0.97 0.86 94 97 0.97
Enrolment in primary education ............................ 1 1.00 0.98 93 92 1.01
Enrolment in secondary education ....................... 1 1.00 0.90 91 88 1.03
Enrolment in tertiary education ............................. 1 1.00 0.86 22 13 1.76
Health and Survival ............................................. 108 0.966 0.956
Sex ratio at birth (female/male) ............................. 1 0.94 0.92 — — 0.96
Healthy life expectancy ...................................... 116 1.02 1.04 67 66 1.02
Political Empowerment ...................................... 132 0.000 0.185
Women in parliament ............................................— — 0.22 — — —
Women in ministerial positions ......................... 129 0.00 0.18 0 100 0.00
Years with female head of state (last 50) .......... 52 0.00 0.16 0 50 0.00
Brunei DarussalamGender Gap Index 2011 76 0.679
Key Indicators
Total population (millions) 0.41
Population growth (%) 1.82
GDP (US$ billions) 6.70
GDP (PPP) per capita 44,269

Global Gender Gap Report 2011 Country Profiles 125
Economic Participation and Opportunity Educational Attainment Health and Survival Political Empowerment
Evolution 2006–2011
1 Survey data, responses on a 1-to-7 scale (1 = worst score, 7 = best score)2 Data on a 0-to-1 scale (1 = worst score, 0 = best score)3 Data on a 1-to-5 scale (1 = worst score, 5 = best score)4 Bracketed numbers show the range between the uncertainties, estimated
to contain the true maternal mortality ratio with a 95% probability
ECONOMIC EDUCATIONAL HEALTH AND POLITICAL OVERALL PARTICIPATION ATTAINMENT SURVIVAL EMPOWERMENT
Rank Score Rank Score Rank Score Rank Score Rank Score
0.0
0.2
0.4
0.6
0.8
1.0
2006 2007 2008 2009 2010 2011
Additional Data
Economic EmpowermentFemale adult unemployment rate (% of female labour force) ...... —Male adult unemployment rate (% of male labour force) ............. —Women in non-agricultural paid labour
(% of total labour force) ....................................................................30Inheritance practices in favour of male heirs2 ................................ —Firms with female participation in ownership (% of firms) ........... —Women’s access to land ownership2 ............................................... —Women’s access to bank loans2 ........................................................ —Women’s access to property other than land2 ............................... —Women’s access to finance programmes3 ...................................... —Ability of women to rise to positions of
enterprise leadership1 ....................................................................5.38
EducationFemale teachers, primary education (%) ..........................................76Female teachers, secondary education (%) .....................................63Female teachers, tertiary education (%) ...........................................42Female school life expectancy, primary to secondary (years)......13Male school life expectancy, primary to secondary (years) .........13
Marriage and ChildbearingMean age of marriage for women (years) ........................................25Early marriage (% women, aged 15–19) ........................................... —Fertility rate (births per woman) .......................................................2.10Adolescent fertility rate (births per 1,000 women, aged 15–19) ....31Antenatal care coverage, at least one visit (%) ...............................99Births attended by skilled health staff (%) ......................................100Maternal mortality ratio (per 100,000 live births)4 ...............21 [13-34]Contraceptive prevalence, married women (%) ............................. —Female HIV prevalence, aged 15–49 (%) .......................................... —Male HIV prevalence, aged 15–49 (%) .............................................. —Infant mortality rate (per 1,000 live births) ..........................................5Overall population sex ratio (male/female) ....................................1.06
Social Institutions and Political RightsPaternal versus maternal authority2.................................................. —Female genital mutilation2 ................................................................... —Acceptance or legality of polygamy2 ................................................ —Existence of legislation punishing acts
of violence against women2 ............................................................ —Year women received right to vote ................................................... —Quota type .............................................................................................. —Existence of legislation prohibiting
gender-based discrimination .......................................................... —
Childcare EcosystemLength of maternity leave .................................................................... —Maternity leave benefits (% of wages paid) .................................... —Provider of maternity coverage ......................................................... —Length of paternity leave ..................................................................... —Paternity leave benefits (% of wages paid) ..................................... —Daycare options .................................................................................... —
Brunei DarussalamGender Gap Index 2011 (out of 135 countries) 76 0.679 20 0.755 52 0.994 108 0.966 132 0.000
Gender Gap Index 2010 (out of 134 countries) 77 0.675 26 0.740 56 0.993 107 0.966 131 0.000
Gender Gap Index 2009 (out of 134 countries) 94 0.652 78 0.624 65 0.992 113 0.966 127 0.028
Gender Gap Index 2008 (out of 130 countries) 99 0.639 91 0.570 62 0.993 109 0.966 122 0.028
Gender Gap Index 2007 (out of 128 countries) — — — — — — — — — —
Gender Gap Index 2006 (out of 115 countries) — — — — — — — — — —
Female-to-male ratio
0.00 = INEQUALITY 1.00 = EQUALITY 1.50
0.00 = INEQUALITY 1.00 = EQUALITY 1.50
0.00 = INEQUALITY 1.00 = EQUALITY 1.50
0.00 = INEQUALITY 1.00 = EQUALITY 1.50
Female-to-male ratio
Female-to-male ratio
Female-to-male ratio
126 Country Profiles Global Gender Gap Report 2011
Sample Female-to- Rank Score average Female Male male ratio
country score sample average
0.00 = inequality 1.00 = equality
0.00
0.20
0.40
0.60
0.80
1.00Economy
Education
Politics
Health
Rank Score(out of 135 countries) (0.00 = inequality, 1.00 = equality)
Gender Gap Subindexes
Economic Participation and Opportunity ......... 48 0.687 0.588
Labour force participation .................................... 42 0.85 0.68 62 73 0.85
Wage equality for similar work (survey) .......... 104 0.58 0.65 — — 0.58
Estimated earned income (PPP US$) ................. 39 0.66 0.52 11,105 16,823 0.66
Legislators, senior officials, and managers ...... 42 0.48 0.26 32 68 0.48
Professional and technical workers .................... 1 1.00 0.64 61 39 1.55
Educational Attainment ........................................ 58 0.992 0.928
Literacy rate ............................................................ 61 0.99 0.86 98 99 0.99
Enrolment in primary education ............................ 1 1.00 0.98 97 96 1.01
Enrolment in secondary education ..................... 94 0.97 0.90 81 84 0.97
Enrolment in tertiary education ............................. 1 1.00 0.86 61 46 1.32
Health and Survival ............................................... 41 0.979 0.956
Sex ratio at birth (female/male) ......................... 106 0.94 0.92 — — 0.94
Healthy life expectancy .......................................... 1 1.06 1.04 69 63 1.10
Political Empowerment ........................................ 67 0.137 0.185
Women in parliament ............................................ 51 0.26 0.22 21 79 0.26
Women in ministerial positions ........................... 58 0.21 0.18 18 82 0.21
Years with female head of state (last 50) .......... 47 0.01 0.16 0 50 0.01
BulgariaGender Gap Index 2011 51 0.699
Key Indicators
Total population (millions) 7.56
Population growth (%) –0.31
GDP (US$ billions) 19.21
GDP (PPP) per capita 11,447

Global Gender Gap Report 2011 Country Profiles 127
Economic Participation and Opportunity Educational Attainment Health and Survival Political Empowerment
Evolution 2006–2011
1 Survey data, responses on a 1-to-7 scale (1 = worst score, 7 = best score)2 Data on a 0-to-1 scale (1 = worst score, 0 = best score)3 Data on a 1-to-5 scale (1 = worst score, 5 = best score)4 Bracketed numbers show the range between the uncertainties, estimated
to contain the true maternal mortality ratio with a 95% probability
ECONOMIC EDUCATIONAL HEALTH AND POLITICAL OVERALL PARTICIPATION ATTAINMENT SURVIVAL EMPOWERMENT
Rank Score Rank Score Rank Score Rank Score Rank Score
0.0
0.2
0.4
0.6
0.8
1.0
2006 2007 2008 2009 2010 2011
Additional Data
Economic EmpowermentFemale adult unemployment rate (% of female labour force) .........7Male adult unemployment rate (% of male labour force) ................5Women in non-agricultural paid labour
(% of total labour force) ....................................................................51Inheritance practices in favour of male heirs2 ................................ —Firms with female participation in ownership (% of firms) ........... —Women’s access to land ownership2 ............................................... —Women’s access to bank loans2 ........................................................ —Women’s access to property other than land2 ............................... —Women’s access to finance programmes3 .........................................4Ability of women to rise to positions of
enterprise leadership1 ....................................................................4.68
EducationFemale teachers, primary education (%) ..........................................93Female teachers, secondary education (%) .....................................79Female teachers, tertiary education (%) ...........................................47Female school life expectancy, primary to secondary (years)......11Male school life expectancy, primary to secondary (years) .........11
Marriage and ChildbearingMean age of marriage for women (years) ........................................24Early marriage (% women, aged 15–19) ........................................... —Fertility rate (births per woman) .......................................................1.40Adolescent fertility rate (births per 1,000 women, aged 15–19) ....42Antenatal care coverage, at least one visit (%) .............................. —Births attended by skilled health staff (%) ......................................100Maternal mortality ratio (per 100,000 live births)4 ...............13 [11-15]Contraceptive prevalence, married women (%) ..............................63Female HIV prevalence, aged 15–49 (%) ......................................<0.10Male HIV prevalence, aged 15–49 (%) ............................................0.10Infant mortality rate (per 1,000 live births) ........................................10Overall population sex ratio (male/female) ....................................0.93
Social Institutions and Political RightsPaternal versus maternal authority2.................................................. —Female genital mutilation2 ................................................................... —Acceptance or legality of polygamy2 ................................................ —Existence of legislation punishing acts
of violence against women2 ............................................................ —Year women received right to vote ......................................1937, 1945Quota type .............................................................................................. —Existence of legislation prohibiting
gender-based discrimination ........................................................ Yes
Childcare EcosystemLength of maternity leave ......................................................... 135 daysMaternity leave benefits (% of wages paid) .....................................90Provider of maternity coverage .......................................Public social
insurance (the General Sickness and Maternity Fund)Length of paternity leave ............................................................ 15 daysPaternity leave benefits (% of wages paid) ......................................90Daycare options ......................................................................Public and
private daycare with and without allowance; homecare assistance with and without allowance
BulgariaGender Gap Index 2011 (out of 135 countries) 51 0.699 48 0.687 58 0.992 41 0.979 67 0.137
Gender Gap Index 2010 (out of 134 countries) 50 0.698 50 0.684 58 0.993 40 0.979 64 0.137
Gender Gap Index 2009 (out of 134 countries) 38 0.707 40 0.693 66 0.992 41 0.979 42 0.164
Gender Gap Index 2008 (out of 130 countries) 36 0.708 35 0.698 73 0.990 38 0.979 43 0.164
Gender Gap Index 2007 (out of 128 countries) 25 0.708 30 0.699 62 0.989 37 0.979 32 0.167
Gender Gap Index 2006 (out of 115 countries) 37 0.687 58 0.613 56 0.989 36 0.979 30 0.167

Female-to-male ratio
0.00 = INEQUALITY 1.00 = EQUALITY 1.50
0.00 = INEQUALITY 1.00 = EQUALITY 1.50
0.00 = INEQUALITY 1.00 = EQUALITY 1.50
0.00 = INEQUALITY 1.00 = EQUALITY 1.50
Female-to-male ratio
Female-to-male ratio
Female-to-male ratio
128 Country Profiles Global Gender Gap Report 2011
Sample Female-to- Rank Score average Female Male male ratio
country score sample average
0.00 = inequality 1.00 = equality
0.00
0.20
0.40
0.60
0.80
1.00Economy
Education
Politics
Health
Rank Score(out of 135 countries) (0.00 = inequality, 1.00 = equality)
Gender Gap Subindexes
Economic Participation and Opportunity ......... 76 0.627 0.588
Labour force participation .................................... 33 0.88 0.68 80 91 0.88
Wage equality for similar work (survey) ............ 16 0.77 0.65 — — 0.77
Estimated earned income (PPP US$) ................. 36 0.67 0.52 950 1,424 0.67
Legislators, senior officials, and managers ...... 98 0.16 0.26 14 86 0.16
Professional and technical workers ................ 105 0.35 0.64 26 74 0.35
Educational Attainment ...................................... 129 0.756 0.928
Literacy rate .......................................................... 129 0.59 0.86 22 37 0.59
Enrolment in primary education ........................ 127 0.89 0.98 59 67 0.89
Enrolment in secondary education ................... 123 0.78 0.90 14 18 0.78
Enrolment in tertiary education ......................... 122 0.49 0.86 2 5 0.49
Health and Survival ............................................... 98 0.968 0.956
Sex ratio at birth (female/male) ............................. 1 0.94 0.92 — — 0.97
Healthy life expectancy ...................................... 104 1.02 1.04 43 42 1.02
Political Empowerment ........................................ 77 0.110 0.185
Women in parliament ............................................ 76 0.18 0.22 15 85 0.18
Women in ministerial positions ........................... 57 0.22 0.18 18 82 0.22
Years with female head of state (last 50) .......... 52 0.00 0.16 0 50 0.00
Burkina FasoGender Gap Index 2011 115 0.615
Key Indicators
Total population (millions) 16.29
Population growth (%) 3.31
GDP (US$ billions) 4.55
GDP (PPP) per capita 1,139
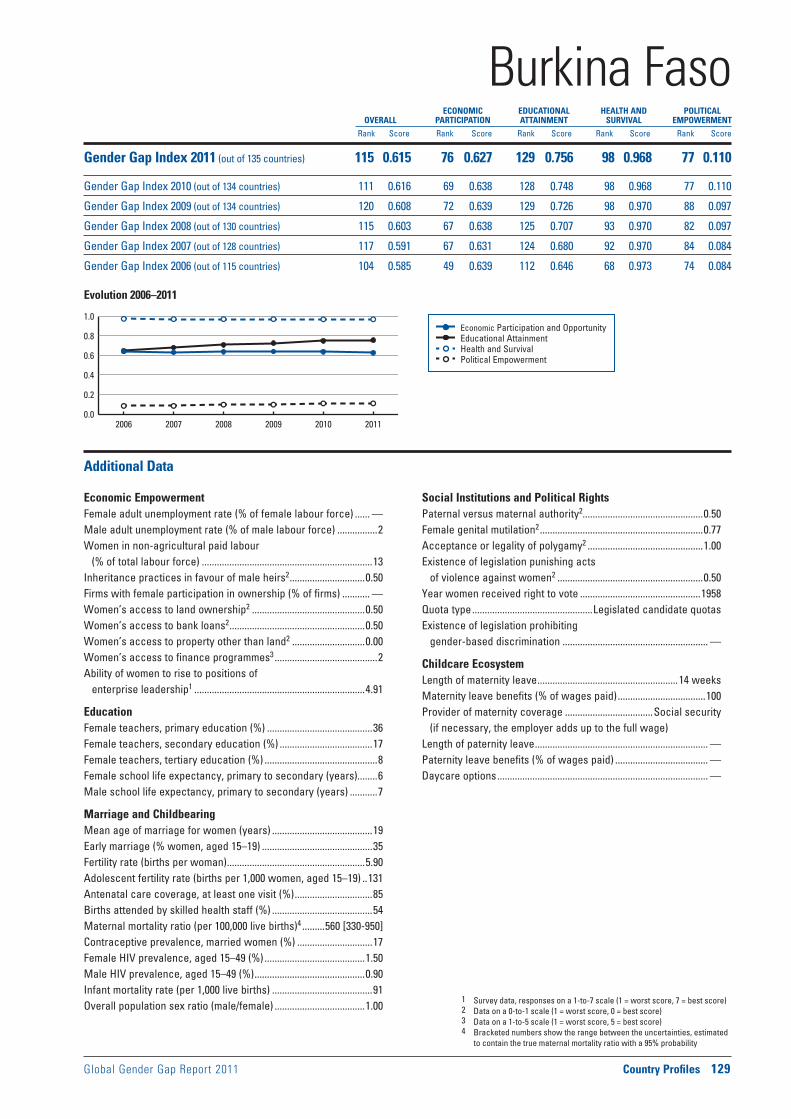
Global Gender Gap Report 2011 Country Profiles 129
Economic Participation and Opportunity Educational Attainment Health and Survival Political Empowerment
Evolution 2006–2011
1 Survey data, responses on a 1-to-7 scale (1 = worst score, 7 = best score)2 Data on a 0-to-1 scale (1 = worst score, 0 = best score)3 Data on a 1-to-5 scale (1 = worst score, 5 = best score)4 Bracketed numbers show the range between the uncertainties, estimated
to contain the true maternal mortality ratio with a 95% probability
ECONOMIC EDUCATIONAL HEALTH AND POLITICAL OVERALL PARTICIPATION ATTAINMENT SURVIVAL EMPOWERMENT
Rank Score Rank Score Rank Score Rank Score Rank Score
0.0
0.2
0.4
0.6
0.8
1.0
2006 2007 2008 2009 2010 2011
Additional Data
Economic EmpowermentFemale adult unemployment rate (% of female labour force) ...... —Male adult unemployment rate (% of male labour force) ................2Women in non-agricultural paid labour
(% of total labour force) ....................................................................13Inheritance practices in favour of male heirs2 ..............................0.50Firms with female participation in ownership (% of firms) ........... —Women’s access to land ownership2 .............................................0.50Women’s access to bank loans2 ......................................................0.50Women’s access to property other than land2 .............................0.00Women’s access to finance programmes3 .........................................2Ability of women to rise to positions of
enterprise leadership1 ....................................................................4.91
EducationFemale teachers, primary education (%) ..........................................36Female teachers, secondary education (%) .....................................17Female teachers, tertiary education (%) .............................................8Female school life expectancy, primary to secondary (years)........6Male school life expectancy, primary to secondary (years) ...........7
Marriage and ChildbearingMean age of marriage for women (years) ........................................19Early marriage (% women, aged 15–19) ............................................35Fertility rate (births per woman) .......................................................5.90Adolescent fertility rate (births per 1,000 women, aged 15–19) ..131Antenatal care coverage, at least one visit (%) ...............................85Births attended by skilled health staff (%) ........................................54Maternal mortality ratio (per 100,000 live births)4 .........560 [330-950]Contraceptive prevalence, married women (%) ..............................17Female HIV prevalence, aged 15–49 (%) ........................................1.50Male HIV prevalence, aged 15–49 (%) ............................................0.90Infant mortality rate (per 1,000 live births) ........................................91Overall population sex ratio (male/female) ....................................1.00
Social Institutions and Political RightsPaternal versus maternal authority2................................................0.50Female genital mutilation2 .................................................................0.77Acceptance or legality of polygamy2 ..............................................1.00Existence of legislation punishing acts
of violence against women2 ..........................................................0.50Year women received right to vote ................................................1958Quota type ................................................Legislated candidate quotasExistence of legislation prohibiting
gender-based discrimination .......................................................... —
Childcare EcosystemLength of maternity leave ........................................................14 weeksMaternity leave benefits (% of wages paid) ...................................100Provider of maternity coverage ...................................Social security
(if necessary, the employer adds up to the full wage)Length of paternity leave ..................................................................... —Paternity leave benefits (% of wages paid) ..................................... —Daycare options .................................................................................... —
Burkina FasoGender Gap Index 2011 (out of 135 countries) 115 0.615 76 0.627 129 0.756 98 0.968 77 0.110
Gender Gap Index 2010 (out of 134 countries) 111 0.616 69 0.638 128 0.748 98 0.968 77 0.110
Gender Gap Index 2009 (out of 134 countries) 120 0.608 72 0.639 129 0.726 98 0.970 88 0.097
Gender Gap Index 2008 (out of 130 countries) 115 0.603 67 0.638 125 0.707 93 0.970 82 0.097
Gender Gap Index 2007 (out of 128 countries) 117 0.591 67 0.631 124 0.680 92 0.970 84 0.084
Gender Gap Index 2006 (out of 115 countries) 104 0.585 49 0.639 112 0.646 68 0.973 74 0.084

Female-to-male ratio
0.00 = INEQUALITY 1.00 = EQUALITY 1.50
0.00 = INEQUALITY 1.00 = EQUALITY 1.50
0.00 = INEQUALITY 1.00 = EQUALITY 1.50
0.00 = INEQUALITY 1.00 = EQUALITY 1.50
Female-to-male ratio
Female-to-male ratio
Female-to-male ratio
130 Country Profiles Global Gender Gap Report 2011
Sample Female-to- Rank Score average Female Male male ratio
country score sample average
0.00 = inequality 1.00 = equality
0.00
0.20
0.40
0.60
0.80
1.00Economy
Education
Politics
Health
Rank Score(out of 135 countries) (0.00 = inequality, 1.00 = equality)
Gender Gap Subindexes
Economic Participation and Opportunity ........... 4 0.836 0.588
Labour force participation ...................................... 1 1.00 0.68 92 88 1.04
Wage equality for similar work (survey) ............ 24 0.76 0.65 — — 0.76
Estimated earned income (PPP US$) ................. 13 0.80 0.52 349 437 0.80
Legislators, senior officials, and managers ......— — 0.26 — — —
Professional and technical workers ..................— — 0.64 — — —
Educational Attainment ...................................... 119 0.857 0.928
Literacy rate .......................................................... 109 0.84 0.86 61 73 0.84
Enrolment in primary education ............................ 1 1.00 0.98 100 98 1.01
Enrolment in secondary education ................... 119 0.81 0.90 8 10 0.81
Enrolment in tertiary education ......................... 125 0.43 0.86 1 3 0.43
Health and Survival ............................................... 98 0.968 0.956
Sex ratio at birth (female/male) ............................. 1 0.94 0.92 — — 0.97
Healthy life expectancy ...................................... 104 1.02 1.04 43 42 1.02
Political Empowerment ........................................ 32 0.248 0.185
Women in parliament ............................................ 21 0.47 0.22 32 68 0.47
Women in ministerial positions ........................... 26 0.40 0.18 29 71 0.40
Years with female head of state (last 50) .......... 47 0.01 0.16 0 50 0.01
BurundiGender Gap Index 2011 24 0.727
Key Indicators
Total population (millions) 8.52
Population growth (%) 2.56
GDP (US$ billions) 0.97
GDP (PPP) per capita 361

Global Gender Gap Report 2011 Country Profiles 131
1 Survey data, responses on a 1-to-7 scale (1 = worst score, 7 = best score)2 Data on a 0-to-1 scale (1 = worst score, 0 = best score)3 Data on a 1-to-5 scale (1 = worst score, 5 = best score)4 Bracketed numbers show the range between the uncertainties, estimated
to contain the true maternal mortality ratio with a 95% probability
ECONOMIC EDUCATIONAL HEALTH AND POLITICAL OVERALL PARTICIPATION ATTAINMENT SURVIVAL EMPOWERMENT
Rank Score Rank Score Rank Score Rank Score Rank Score
Additional Data
Economic EmpowermentFemale adult unemployment rate (% of female labour force) ...... —Male adult unemployment rate (% of male labour force) ............. —Women in non-agricultural paid labour
(% of total labour force) ....................................................................14Inheritance practices in favour of male heirs2 ..............................0.50Firms with female participation in ownership (% of firms) ............53Women’s access to land ownership2 .............................................0.50Women’s access to bank loans2 ......................................................0.50Women’s access to property other than land2 .............................0.50Women’s access to finance programmes3 ...................................... —Ability of women to rise to positions of
enterprise leadership1 ....................................................................4.91
EducationFemale teachers, primary education (%) ..........................................53Female teachers, secondary education (%) .....................................19Female teachers, tertiary education (%) ...........................................10Female school life expectancy, primary to secondary (years)......10Male school life expectancy, primary to secondary (years) .........11
Marriage and ChildbearingMean age of marriage for women (years) ........................................24Early marriage (% women, aged 15–19) ..............................................7Fertility rate (births per woman) .......................................................4.60Adolescent fertility rate (births per 1,000 women, aged 15–19) ....27Antenatal care coverage, at least one visit (%) ...............................93Births attended by skilled health staff (%) ........................................34Maternal mortality ratio (per 100,000 live births)4 ......970 [410-2,300]Contraceptive prevalence, married women (%) ..............................20Female HIV prevalence, aged 15–49 (%) ........................................4.00Male HIV prevalence, aged 15–49 (%) ............................................2.60Infant mortality rate (per 1,000 live births) ......................................101Overall population sex ratio (male/female) ....................................0.96
Social Institutions and Political RightsPaternal versus maternal authority2................................................0.00Female genital mutilation2 .................................................................0.00Acceptance or legality of polygamy2 ..............................................1.00Existence of legislation punishing acts
of violence against women2 ..........................................................0.75Year women received right to vote ................................................1961Quota type ...............................Reserved seats at single/lower houseExistence of legislation prohibiting
gender-based discrimination .......................................................... —
Childcare EcosystemLength of maternity leave ........................................................12 weeksMaternity leave benefits (% of wages paid) .....................................50Provider of maternity coverage .............................................EmployerLength of paternity leave ..................................................................... —Paternity leave benefits (% of wages paid) ..................................... —Daycare options .................................................................................... —
BurundiGender Gap Index 2011 (out of 135 countries) 24 0.727 4 0.836 119 0.857 98 0.968 32 0.248
Gender Gap Index 2010 (out of 134 countries) — — — — — — — — — —
Gender Gap Index 2009 (out of 134 countries) — — — — — — — — — —
Gender Gap Index 2008 (out of 130 countries) — — — — — — — — — —
Gender Gap Index 2007 (out of 128 countries) — — — — — — — — — —
Gender Gap Index 2006 (out of 115 countries) — — — — — — — — — —
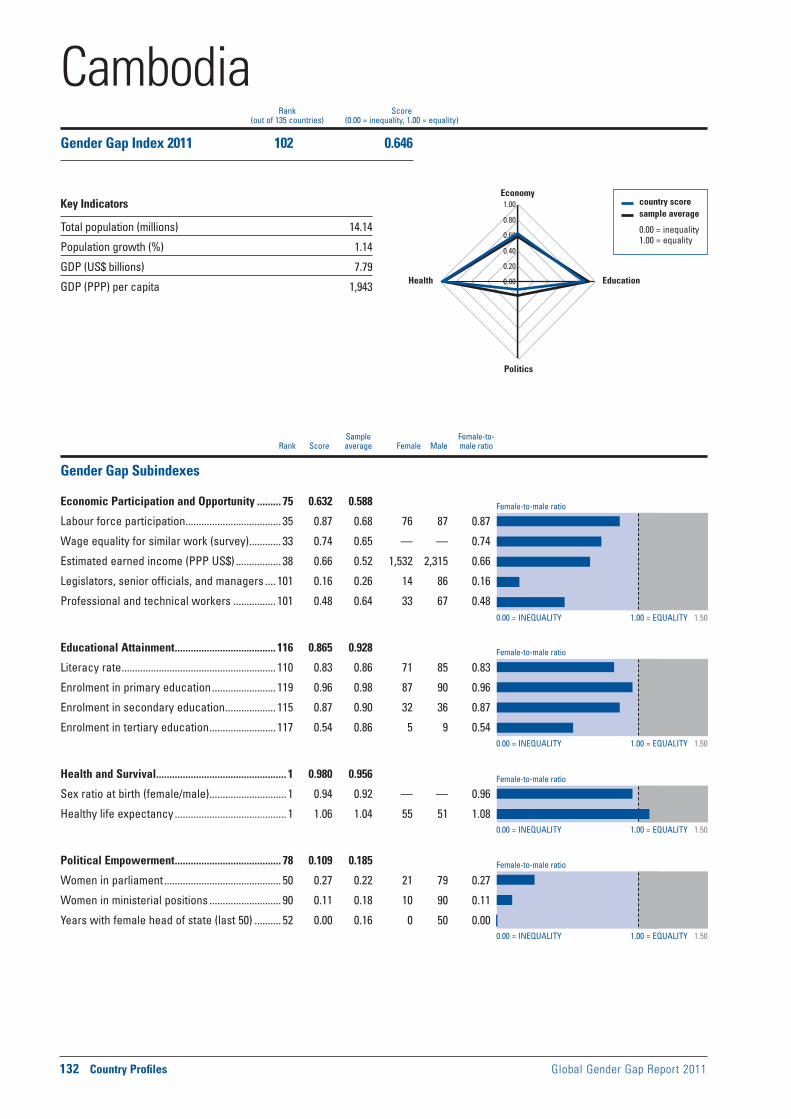
Female-to-male ratio
0.00 = INEQUALITY 1.00 = EQUALITY 1.50
0.00 = INEQUALITY 1.00 = EQUALITY 1.50
0.00 = INEQUALITY 1.00 = EQUALITY 1.50
0.00 = INEQUALITY 1.00 = EQUALITY 1.50
Female-to-male ratio
Female-to-male ratio
Female-to-male ratio
132 Country Profiles Global Gender Gap Report 2011
Sample Female-to- Rank Score average Female Male male ratio
country score sample average
0.00 = inequality 1.00 = equality
0.00
0.20
0.40
0.60
0.80
1.00Economy
Education
Politics
Health
Rank Score(out of 135 countries) (0.00 = inequality, 1.00 = equality)
Gender Gap Subindexes
Economic Participation and Opportunity ......... 75 0.632 0.588
Labour force participation .................................... 35 0.87 0.68 76 87 0.87
Wage equality for similar work (survey) ............ 33 0.74 0.65 — — 0.74
Estimated earned income (PPP US$) ................. 38 0.66 0.52 1,532 2,315 0.66
Legislators, senior officials, and managers .... 101 0.16 0.26 14 86 0.16
Professional and technical workers ................ 101 0.48 0.64 33 67 0.48
Educational Attainment ...................................... 116 0.865 0.928
Literacy rate .......................................................... 110 0.83 0.86 71 85 0.83
Enrolment in primary education ........................ 119 0.96 0.98 87 90 0.96
Enrolment in secondary education ................... 115 0.87 0.90 32 36 0.87
Enrolment in tertiary education ......................... 117 0.54 0.86 5 9 0.54
Health and Survival ................................................. 1 0.980 0.956
Sex ratio at birth (female/male) ............................. 1 0.94 0.92 — — 0.96
Healthy life expectancy .......................................... 1 1.06 1.04 55 51 1.08
Political Empowerment ........................................ 78 0.109 0.185
Women in parliament ............................................ 50 0.27 0.22 21 79 0.27
Women in ministerial positions ........................... 90 0.11 0.18 10 90 0.11
Years with female head of state (last 50) .......... 52 0.00 0.16 0 50 0.00
CambodiaGender Gap Index 2011 102 0.646
Key Indicators
Total population (millions) 14.14
Population growth (%) 1.14
GDP (US$ billions) 7.79
GDP (PPP) per capita 1,943
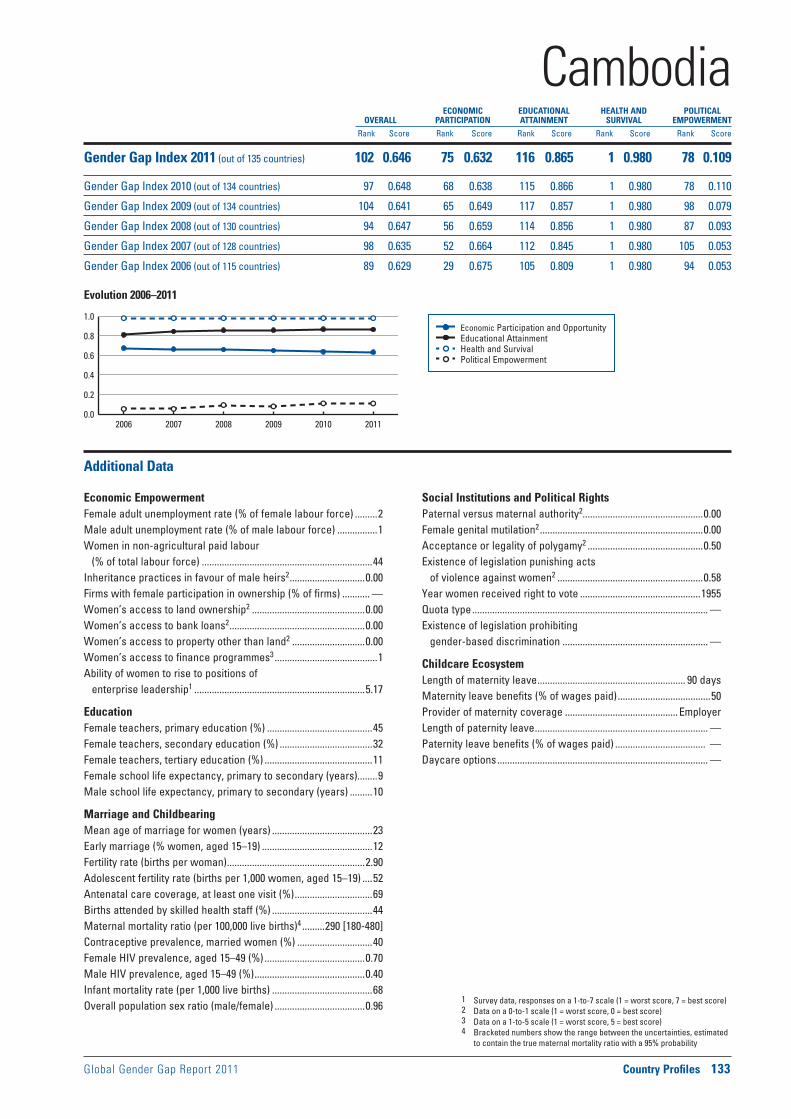
Global Gender Gap Report 2011 Country Profiles 133
Economic Participation and Opportunity Educational Attainment Health and Survival Political Empowerment
Evolution 2006–2011
1 Survey data, responses on a 1-to-7 scale (1 = worst score, 7 = best score)2 Data on a 0-to-1 scale (1 = worst score, 0 = best score)3 Data on a 1-to-5 scale (1 = worst score, 5 = best score)4 Bracketed numbers show the range between the uncertainties, estimated
to contain the true maternal mortality ratio with a 95% probability
ECONOMIC EDUCATIONAL HEALTH AND POLITICAL OVERALL PARTICIPATION ATTAINMENT SURVIVAL EMPOWERMENT
Rank Score Rank Score Rank Score Rank Score Rank Score
0.0
0.2
0.4
0.6
0.8
1.0
2006 2007 2008 2009 2010 2011
Additional Data
Economic EmpowermentFemale adult unemployment rate (% of female labour force) .........2Male adult unemployment rate (% of male labour force) ................1Women in non-agricultural paid labour
(% of total labour force) ....................................................................44Inheritance practices in favour of male heirs2 ..............................0.00Firms with female participation in ownership (% of firms) ........... —Women’s access to land ownership2 .............................................0.00Women’s access to bank loans2 ......................................................0.00Women’s access to property other than land2 .............................0.00Women’s access to finance programmes3 .........................................1Ability of women to rise to positions of
enterprise leadership1 ....................................................................5.17
EducationFemale teachers, primary education (%) ..........................................45Female teachers, secondary education (%) .....................................32Female teachers, tertiary education (%) ...........................................11Female school life expectancy, primary to secondary (years)........9Male school life expectancy, primary to secondary (years) .........10
Marriage and ChildbearingMean age of marriage for women (years) ........................................23Early marriage (% women, aged 15–19) ............................................12Fertility rate (births per woman) .......................................................2.90Adolescent fertility rate (births per 1,000 women, aged 15–19) ....52Antenatal care coverage, at least one visit (%) ...............................69Births attended by skilled health staff (%) ........................................44Maternal mortality ratio (per 100,000 live births)4 .........290 [180-480]Contraceptive prevalence, married women (%) ..............................40Female HIV prevalence, aged 15–49 (%) ........................................0.70Male HIV prevalence, aged 15–49 (%) ............................................0.40Infant mortality rate (per 1,000 live births) ........................................68Overall population sex ratio (male/female) ....................................0.96
Social Institutions and Political RightsPaternal versus maternal authority2................................................0.00Female genital mutilation2 .................................................................0.00Acceptance or legality of polygamy2 ..............................................0.50Existence of legislation punishing acts
of violence against women2 ..........................................................0.58Year women received right to vote ................................................1955Quota type .............................................................................................. —Existence of legislation prohibiting
gender-based discrimination .......................................................... —
Childcare EcosystemLength of maternity leave ........................................................... 90 daysMaternity leave benefits (% of wages paid) .....................................50Provider of maternity coverage .............................................EmployerLength of paternity leave ..................................................................... —Paternity leave benefits (% of wages paid) .................................... — Daycare options .................................................................................... —
CambodiaGender Gap Index 2011 (out of 135 countries) 102 0.646 75 0.632 116 0.865 1 0.980 78 0.109
Gender Gap Index 2010 (out of 134 countries) 97 0.648 68 0.638 115 0.866 1 0.980 78 0.110
Gender Gap Index 2009 (out of 134 countries) 104 0.641 65 0.649 117 0.857 1 0.980 98 0.079
Gender Gap Index 2008 (out of 130 countries) 94 0.647 56 0.659 114 0.856 1 0.980 87 0.093
Gender Gap Index 2007 (out of 128 countries) 98 0.635 52 0.664 112 0.845 1 0.980 105 0.053
Gender Gap Index 2006 (out of 115 countries) 89 0.629 29 0.675 105 0.809 1 0.980 94 0.053

Female-to-male ratio
0.00 = INEQUALITY 1.00 = EQUALITY 1.50
0.00 = INEQUALITY 1.00 = EQUALITY 1.50
0.00 = INEQUALITY 1.00 = EQUALITY 1.50
0.00 = INEQUALITY 1.00 = EQUALITY 1.50
Female-to-male ratio
Female-to-male ratio
Female-to-male ratio
134 Country Profiles Global Gender Gap Report 2011
Sample Female-to- Rank Score average Female Male male ratio
country score sample average
0.00 = inequality 1.00 = equality
0.00
0.20
0.40
0.60
0.80
1.00Economy
Education
Politics
Health
Rank Score(out of 135 countries) (0.00 = inequality, 1.00 = equality)
Gender Gap Subindexes
Economic Participation and Opportunity ....... 112 0.525 0.588
Labour force participation .................................... 91 0.66 0.68 54 82 0.66
Wage equality for similar work (survey) ............ 36 0.73 0.65 — — 0.73
Estimated earned income (PPP US$) ................. 88 0.51 0.52 1,484 2,926 0.51
Legislators, senior officials, and managers .... 107 0.11 0.26 10 90 0.11
Professional and technical workers ................ 106 0.32 0.64 24 76 0.32
Educational Attainment ...................................... 118 0.860 0.928
Literacy rate .......................................................... 114 0.80 0.86 63 79 0.80
Enrolment in primary education ........................ 128 0.88 0.98 86 97 0.88
Enrolment in secondary education ................... 109 0.91 0.90 — — 0.91
Enrolment in tertiary education ......................... 102 0.79 0.86 8 10 0.79
Health and Survival ............................................. 111 0.961 0.956
Sex ratio at birth (female/male) ............................. 1 0.94 0.92 — — 0.97
Healthy life expectancy ...................................... 118 1.00 1.04 45 45 1.00
Political Empowerment ........................................ 96 0.083 0.185
Women in parliament ............................................ 86 0.16 0.22 14 86 0.16
Women in ministerial positions ........................... 79 0.13 0.18 12 88 0.13
Years with female head of state (last 50) .......... 52 0.00 0.16 0 50 0.00
CameroonGender Gap Index 2011 119 0.607
Key Indicators
Total population (millions) 19.96
Population growth (%) 2.21
GDP (US$ billions) 13.91
GDP (PPP) per capita 2,009
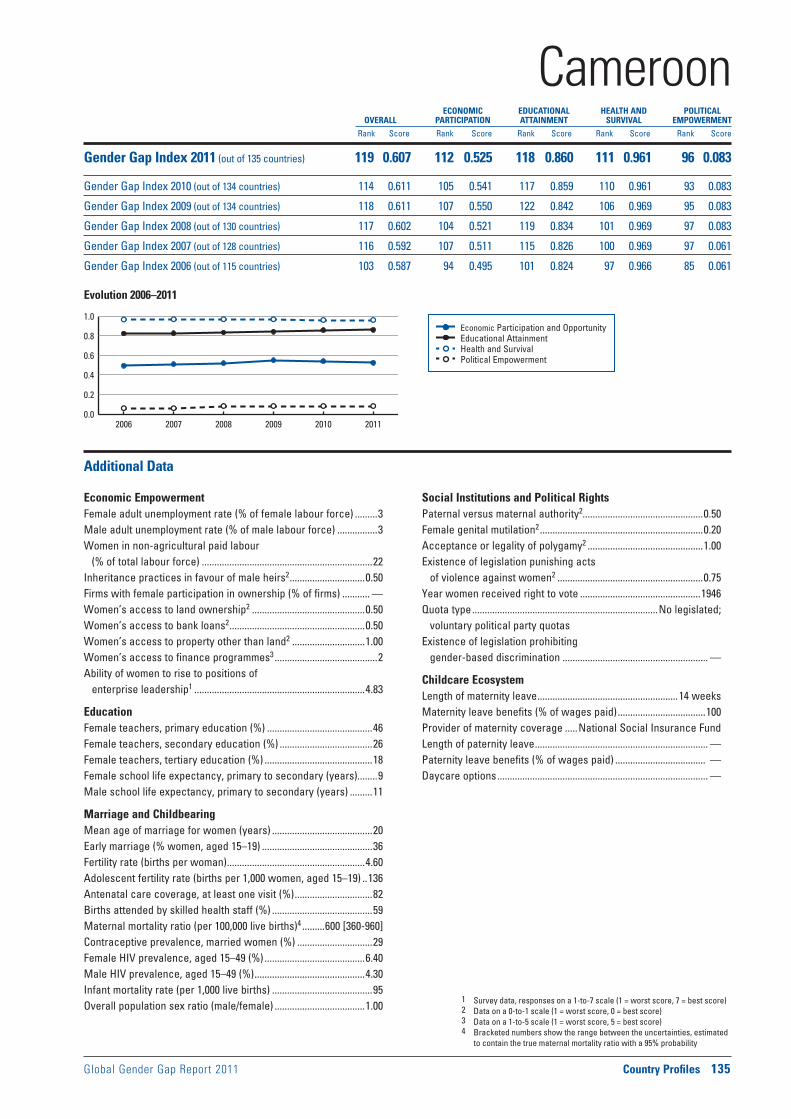
Global Gender Gap Report 2011 Country Profiles 135
Economic Participation and Opportunity Educational Attainment Health and Survival Political Empowerment
Evolution 2006–2011
1 Survey data, responses on a 1-to-7 scale (1 = worst score, 7 = best score)2 Data on a 0-to-1 scale (1 = worst score, 0 = best score)3 Data on a 1-to-5 scale (1 = worst score, 5 = best score)4 Bracketed numbers show the range between the uncertainties, estimated
to contain the true maternal mortality ratio with a 95% probability
ECONOMIC EDUCATIONAL HEALTH AND POLITICAL OVERALL PARTICIPATION ATTAINMENT SURVIVAL EMPOWERMENT
Rank Score Rank Score Rank Score Rank Score Rank Score
0.0
0.2
0.4
0.6
0.8
1.0
2006 2007 2008 2009 2010 2011
Additional Data
Economic EmpowermentFemale adult unemployment rate (% of female labour force) .........3Male adult unemployment rate (% of male labour force) ................3Women in non-agricultural paid labour
(% of total labour force) ....................................................................22Inheritance practices in favour of male heirs2 ..............................0.50Firms with female participation in ownership (% of firms) ........... —Women’s access to land ownership2 .............................................0.50Women’s access to bank loans2 ......................................................0.50Women’s access to property other than land2 .............................1.00Women’s access to finance programmes3 .........................................2Ability of women to rise to positions of
enterprise leadership1 ....................................................................4.83
EducationFemale teachers, primary education (%) ..........................................46Female teachers, secondary education (%) .....................................26Female teachers, tertiary education (%) ...........................................18Female school life expectancy, primary to secondary (years)........9Male school life expectancy, primary to secondary (years) .........11
Marriage and ChildbearingMean age of marriage for women (years) ........................................20Early marriage (% women, aged 15–19) ............................................36Fertility rate (births per woman) .......................................................4.60Adolescent fertility rate (births per 1,000 women, aged 15–19) ..136Antenatal care coverage, at least one visit (%) ...............................82Births attended by skilled health staff (%) ........................................59Maternal mortality ratio (per 100,000 live births)4 .........600 [360-960]Contraceptive prevalence, married women (%) ..............................29Female HIV prevalence, aged 15–49 (%) ........................................6.40Male HIV prevalence, aged 15–49 (%) ............................................4.30Infant mortality rate (per 1,000 live births) ........................................95Overall population sex ratio (male/female) ....................................1.00
Social Institutions and Political RightsPaternal versus maternal authority2................................................0.50Female genital mutilation2 .................................................................0.20Acceptance or legality of polygamy2 ..............................................1.00Existence of legislation punishing acts
of violence against women2 ..........................................................0.75Year women received right to vote ................................................1946Quota type ..........................................................................No legislated;
voluntary political party quotasExistence of legislation prohibiting
gender-based discrimination .......................................................... —
Childcare EcosystemLength of maternity leave ........................................................14 weeksMaternity leave benefits (% of wages paid) ...................................100Provider of maternity coverage .....National Social Insurance FundLength of paternity leave ..................................................................... —Paternity leave benefits (% of wages paid) .................................... — Daycare options .................................................................................... —
CameroonGender Gap Index 2011 (out of 135 countries) 119 0.607 112 0.525 118 0.860 111 0.961 96 0.083
Gender Gap Index 2010 (out of 134 countries) 114 0.611 105 0.541 117 0.859 110 0.961 93 0.083
Gender Gap Index 2009 (out of 134 countries) 118 0.611 107 0.550 122 0.842 106 0.969 95 0.083
Gender Gap Index 2008 (out of 130 countries) 117 0.602 104 0.521 119 0.834 101 0.969 97 0.083
Gender Gap Index 2007 (out of 128 countries) 116 0.592 107 0.511 115 0.826 100 0.969 97 0.061
Gender Gap Index 2006 (out of 115 countries) 103 0.587 94 0.495 101 0.824 97 0.966 85 0.061
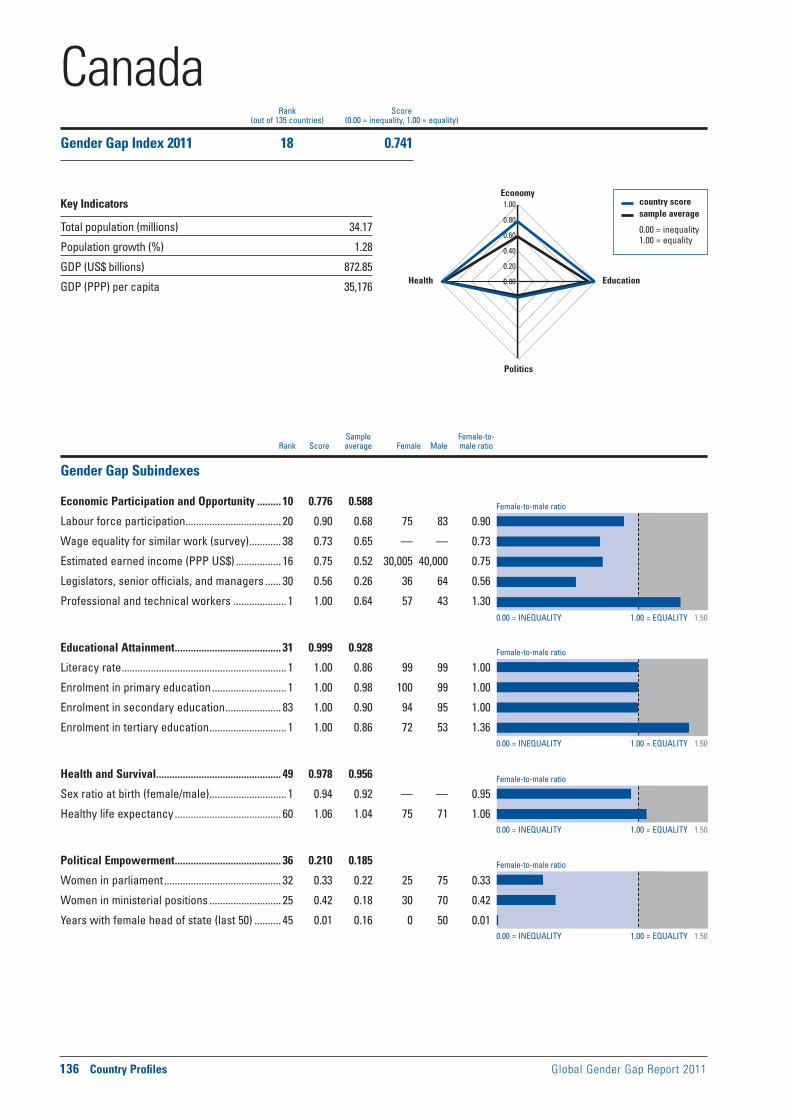
Female-to-male ratio
0.00 = INEQUALITY 1.00 = EQUALITY 1.50
0.00 = INEQUALITY 1.00 = EQUALITY 1.50
0.00 = INEQUALITY 1.00 = EQUALITY 1.50
0.00 = INEQUALITY 1.00 = EQUALITY 1.50
Female-to-male ratio
Female-to-male ratio
Female-to-male ratio
136 Country Profiles Global Gender Gap Report 2011
Sample Female-to- Rank Score average Female Male male ratio
country score sample average
0.00 = inequality 1.00 = equality
0.00
0.20
0.40
0.60
0.80
1.00Economy
Education
Politics
Health
Rank Score(out of 135 countries) (0.00 = inequality, 1.00 = equality)
Gender Gap Subindexes
Economic Participation and Opportunity ......... 10 0.776 0.588
Labour force participation .................................... 20 0.90 0.68 75 83 0.90
Wage equality for similar work (survey) ............ 38 0.73 0.65 — — 0.73
Estimated earned income (PPP US$) ................. 16 0.75 0.52 30,005 40,000 0.75
Legislators, senior officials, and managers ...... 30 0.56 0.26 36 64 0.56
Professional and technical workers .................... 1 1.00 0.64 57 43 1.30
Educational Attainment ........................................ 31 0.999 0.928
Literacy rate .............................................................. 1 1.00 0.86 99 99 1.00
Enrolment in primary education ............................ 1 1.00 0.98 100 99 1.00
Enrolment in secondary education ..................... 83 1.00 0.90 94 95 1.00
Enrolment in tertiary education ............................. 1 1.00 0.86 72 53 1.36
Health and Survival ............................................... 49 0.978 0.956
Sex ratio at birth (female/male) ............................. 1 0.94 0.92 — — 0.95
Healthy life expectancy ........................................ 60 1.06 1.04 75 71 1.06
Political Empowerment ........................................ 36 0.210 0.185
Women in parliament ............................................ 32 0.33 0.22 25 75 0.33
Women in ministerial positions ........................... 25 0.42 0.18 30 70 0.42
Years with female head of state (last 50) .......... 45 0.01 0.16 0 50 0.01
CanadaGender Gap Index 2011 18 0.741
Key Indicators
Total population (millions) 34.17
Population growth (%) 1.28
GDP (US$ billions) 872.85
GDP (PPP) per capita 35,176

Global Gender Gap Report 2011 Country Profiles 137
Economic Participation and Opportunity Educational Attainment Health and Survival Political Empowerment
Evolution 2006–2011
1 Survey data, responses on a 1-to-7 scale (1 = worst score, 7 = best score)2 Data on a 0-to-1 scale (1 = worst score, 0 = best score)3 Data on a 1-to-5 scale (1 = worst score, 5 = best score)4 Bracketed numbers show the range between the uncertainties, estimated
to contain the true maternal mortality ratio with a 95% probability
ECONOMIC EDUCATIONAL HEALTH AND POLITICAL OVERALL PARTICIPATION ATTAINMENT SURVIVAL EMPOWERMENT
Rank Score Rank Score Rank Score Rank Score Rank Score
0.0
0.2
0.4
0.6
0.8
1.0
2006 2007 2008 2009 2010 2011
Additional Data Canada
Economic EmpowermentFemale adult unemployment rate (% of female labour force) .........7Male adult unemployment rate (% of male labour force) ................7Women in non-agricultural paid labour
(% of total labour force) ....................................................................50Inheritance practices in favour of male heirs2 ................................ —Firms with female participation in ownership (% of firms) ........... —Women’s access to land ownership2 ............................................... —Women’s access to bank loans2 ........................................................ —Women’s access to property other than land2 ............................... —Women’s access to finance programmes3 .........................................5Ability of women to rise to positions of
enterprise leadership1 ....................................................................5.38
EducationFemale teachers, primary education (%) ..........................................68Female teachers, secondary education (%) .....................................68Female teachers, tertiary education (%) ...........................................41Female school life expectancy, primary to secondary (years)......12Male school life expectancy, primary to secondary (years) .........12
Marriage and ChildbearingMean age of marriage for women (years) ........................................27Early marriage (% women, aged 15–19) ........................................... —Fertility rate (births per woman) .......................................................1.60Adolescent fertility rate (births per 1,000 women, aged 15–19) ....14Antenatal care coverage, at least one visit (%) .............................100Births attended by skilled health staff (%) ......................................100Maternal mortality ratio (per 100,000 live births)4 .................12 [7-20]Contraceptive prevalence, married women (%) ..............................74Female HIV prevalence, aged 15–49 (%) ........................................0.10Male HIV prevalence, aged 15–49 (%) ............................................0.50Infant mortality rate (per 1,000 live births) ..........................................5Overall population sex ratio (male/female) ....................................0.98
Social Institutions and Political RightsPaternal versus maternal authority2.................................................. —Female genital mutilation2 ................................................................... —Acceptance or legality of polygamy2 ................................................ —Existence of legislation punishing acts
of violence against women2 ............................................................ —Year women received right to vote ......................................1917, 1960Quota type ..........................................................................No legislated;
voluntary political party quotasExistence of legislation prohibiting
gender-based discrimination ........................................................ Yes
Childcare EcosystemLength of maternity leave ........................................................17 weeksMaternity leave benefits (% of wages paid) ........ 55, up to a ceiling;
benefits paid vary by province and jurisdictionProvider of maternity coverage ........................................ Federal and
state employment insuranceLength of paternity leave ...........................................................5 weeks
for biological fathers (Quebec only) Paternity leave benefits (% of wages paid) .................................... — Daycare options ......................................................................Public and
private daycare with allowance; homecare with allowance
CanadaGender Gap Index 2011 (out of 135 countries) 18 0.741 10 0.776 31 0.999 49 0.978 36 0.210
Gender Gap Index 2010 (out of 134 countries) 20 0.737 8 0.777 35 0.998 47 0.978 36 0.196
Gender Gap Index 2009 (out of 134 countries) 25 0.720 10 0.764 38 0.998 60 0.978 62 0.138
Gender Gap Index 2008 (out of 130 countries) 31 0.714 15 0.744 37 0.998 57 0.978 60 0.134
Gender Gap Index 2007 (out of 128 countries) 18 0.720 13 0.743 26 0.999 51 0.979 36 0.159
Gender Gap Index 2006 (out of 115 countries) 14 0.716 10 0.730 21 0.999 51 0.978 33 0.159

Female-to-male ratio
0.00 = INEQUALITY 1.00 = EQUALITY 1.50
0.00 = INEQUALITY 1.00 = EQUALITY 1.50
0.00 = INEQUALITY 1.00 = EQUALITY 1.50
0.00 = INEQUALITY 1.00 = EQUALITY 1.50
Female-to-male ratio
Female-to-male ratio
Female-to-male ratio
138 Country Profiles Global Gender Gap Report 2011
Sample Female-to- Rank Score average Female Male male ratio
country score sample average
0.00 = inequality 1.00 = equality
0.00
0.20
0.40
0.60
0.80
1.00Economy
Education
Politics
Health
Rank Score(out of 135 countries) (0.00 = inequality, 1.00 = equality)
Gender Gap Subindexes
Economic Participation and Opportunity ......... 98 0.593 0.588
Labour force participation .................................... 54 0.82 0.68 63 78 0.82
Wage equality for similar work (survey) ............ 73 0.65 0.65 — — 0.65
Estimated earned income (PPP US$) ................. 57 0.61 0.52 988 1,616 0.61
Legislators, senior officials, and managers .... 103 0.15 0.26 13 87 0.15
Professional and technical workers ..................— — 0.64 — — —
Educational Attainment ...................................... 135 0.516 0.928
Literacy rate .......................................................... 134 0.52 0.86 23 44 0.52
Enrolment in primary education ........................ 135 0.70 0.98 50 72 0.70
Enrolment in secondary education ................... 132 0.33 0.90 5 16 0.33
Enrolment in tertiary education ......................... 134 0.17 0.86 1 3 0.17
Health and Survival ............................................. 111 0.961 0.956
Sex ratio at birth (female/male) ............................. 1 0.94 0.92 — — 0.96
Healthy life expectancy ...................................... 118 1.00 1.04 40 40 1.00
Political Empowerment ...................................... 107 0.064 0.185
Women in parliament ............................................ 89 0.15 0.22 13 87 0.15
Women in ministerial positions ......................... 105 0.07 0.18 7 93 0.07
Years with female head of state (last 50) .......... 52 0.00 0.16 0 50 0.00
ChadGender Gap Index 2011 134 0.533
Key Indicators
Total population (millions) 11.51
Population growth (%) 2.64
GDP (US$ billions) 3.10
GDP (PPP) per capita 1,199

Global Gender Gap Report 2011 Country Profiles 139
Economic Participation and Opportunity Educational Attainment Health and Survival Political Empowerment
Evolution 2006–2011
1 Survey data, responses on a 1-to-7 scale (1 = worst score, 7 = best score)2 Data on a 0-to-1 scale (1 = worst score, 0 = best score)3 Data on a 1-to-5 scale (1 = worst score, 5 = best score)4 Bracketed numbers show the range between the uncertainties, estimated
to contain the true maternal mortality ratio with a 95% probability
ECONOMIC EDUCATIONAL HEALTH AND POLITICAL OVERALL PARTICIPATION ATTAINMENT SURVIVAL EMPOWERMENT
Rank Score Rank Score Rank Score Rank Score Rank Score
0.0
0.2
0.4
0.6
0.8
1.0
2006 2007 2008 2009 2010 2011
Additional Data
Economic EmpowermentFemale adult unemployment rate (% of female labour force) ...... —Male adult unemployment rate (% of male labour force) ............. —Women in non-agricultural paid labour
(% of total labour force) ......................................................................6Inheritance practices in favour of male heirs2 ..............................1.00Firms with female participation in ownership (% of firms) ........... —Women’s access to land ownership2 .............................................1.00Women’s access to bank loans2 ......................................................1.00Women’s access to property other than land2 .............................0.50Women’s access to finance programmes3 .........................................1Ability of women to rise to positions of
enterprise leadership1 ....................................................................4.36
EducationFemale teachers, primary education (%) ..........................................14Female teachers, secondary education (%) .......................................5Female teachers, tertiary education (%) .............................................4Female school life expectancy, primary to secondary (years)........5Male school life expectancy, primary to secondary (years) ...........9
Marriage and ChildbearingMean age of marriage for women (years) ........................................18Early marriage (% women, aged 15–19) ............................................49Fertility rate (births per woman) .......................................................6.20Adolescent fertility rate (births per 1,000 women, aged 15–19) ..146Antenatal care coverage, at least one visit (%) ...............................39Births attended by skilled health staff (%) ........................................21Maternal mortality ratio (per 100,000 live births)4 ....1200 [670-2,100]Contraceptive prevalence, married women (%) ................................3Female HIV prevalence, aged 15–49 (%) ........................................4.00Male HIV prevalence, aged 15–49 (%) ............................................2.70Infant mortality rate (per 1,000 live births) ......................................124Overall population sex ratio (male/female) ....................................0.99
Social Institutions and Political RightsPaternal versus maternal authority2................................................1.00Female genital mutilation2 .................................................................0.36Acceptance or legality of polygamy2 ..............................................1.00Existence of legislation punishing acts
of violence against women2 ..........................................................0.50Year women received right to vote ................................................1958Quota type .............................................................................................. —Existence of legislation prohibiting
gender-based discrimination .......................................................... —
Childcare EcosystemLength of maternity leave ........................................................14 weeksMaternity leave benefits (% of wages paid) .....................................50Provider of maternity coverage ...................................Social securityLength of paternity leave ..................................................................... —Paternity leave benefits (% of wages paid) ..................................... —Daycare options .................................................................................... —
ChadGender Gap Index 2011 (out of 135 countries) 134 0.533 98 0.593 135 0.516 111 0.961 107 0.064
Gender Gap Index 2010 (out of 134 countries) 133 0.533 77 0.627 134 0.509 110 0.961 122 0.035
Gender Gap Index 2009 (out of 134 countries) 133 0.542 66 0.647 134 0.474 65 0.976 106 0.068
Gender Gap Index 2008 (out of 130 countries) 129 0.529 81 0.603 130 0.468 62 0.976 105 0.068
Gender Gap Index 2007 (out of 128 countries) 127 0.538 58 0.652 128 0.470 60 0.976 102 0.054
Gender Gap Index 2006 (out of 115 countries) 113 0.525 65 0.601 115 0.468 56 0.976 91 0.054

Female-to-male ratio
0.00 = INEQUALITY 1.00 = EQUALITY 1.50
0.00 = INEQUALITY 1.00 = EQUALITY 1.50
0.00 = INEQUALITY 1.00 = EQUALITY 1.50
0.00 = INEQUALITY 1.00 = EQUALITY 1.50
Female-to-male ratio
Female-to-male ratio
Female-to-male ratio
140 Country Profiles Global Gender Gap Report 2011
Sample Female-to- Rank Score average Female Male male ratio
country score sample average
0.00 = inequality 1.00 = equality
0.00
0.20
0.40
0.60
0.80
1.00Economy
Education
Politics
Health
Rank Score(out of 135 countries) (0.00 = inequality, 1.00 = equality)
Gender Gap Subindexes
Economic Participation and Opportunity ....... 106 0.541 0.588
Labour force participation .................................. 103 0.60 0.68 47 78 0.60
Wage equality for similar work (survey) .......... 128 0.50 0.65 — — 0.50
Estimated earned income (PPP US$) ............... 104 0.44 0.52 8,845 19,897 0.44
Legislators, senior officials, and managers ...... 74 0.32 0.26 24 76 0.32
Professional and technical workers .................... 1 1.00 0.64 50 50 1.02
Educational Attainment ........................................ 40 0.996 0.928
Literacy rate ............................................................ 46 1.00 0.86 98 99 1.00
Enrolment in primary education .......................... 88 0.99 0.98 94 95 0.99
Enrolment in secondary education ....................... 1 1.00 0.90 86 83 1.03
Enrolment in tertiary education ............................. 1 1.00 0.86 56 54 1.03
Health and Survival ................................................. 1 0.980 0.956
Sex ratio at birth (female/male) ............................. 1 0.94 0.92 — — 0.95
Healthy life expectancy .......................................... 1 1.06 1.04 72 67 1.07
Political Empowerment ........................................ 22 0.296 0.185
Women in parliament ............................................ 82 0.17 0.22 14 86 0.17
Women in ministerial positions ............................. 4 0.83 0.18 45 55 0.83
Years with female head of state (last 50) .......... 21 0.09 0.16 4 46 0.09
ChileGender Gap Index 2011 46 0.703
Key Indicators
Total population (millions) 17.13
Population growth (%) 0.96
GDP (US$ billions) 108.40
GDP (PPP) per capita 13,579

Global Gender Gap Report 2011 Country Profiles 141
Economic Participation and Opportunity Educational Attainment Health and Survival Political Empowerment
Evolution 2006–2011
1 Survey data, responses on a 1-to-7 scale (1 = worst score, 7 = best score)2 Data on a 0-to-1 scale (1 = worst score, 0 = best score)3 Data on a 1-to-5 scale (1 = worst score, 5 = best score)4 Bracketed numbers show the range between the uncertainties, estimated
to contain the true maternal mortality ratio with a 95% probability
ECONOMIC EDUCATIONAL HEALTH AND POLITICAL OVERALL PARTICIPATION ATTAINMENT SURVIVAL EMPOWERMENT
Rank Score Rank Score Rank Score Rank Score Rank Score
0.0
0.2
0.4
0.6
0.8
1.0
2006 2007 2008 2009 2010 2011
Additional Data
Economic EmpowermentFemale adult unemployment rate (% of female labour force) .......11Male adult unemployment rate (% of male labour force) ................7Women in non-agricultural paid labour
(% of total labour force) ....................................................................36Inheritance practices in favour of male heirs2 ................................ —Firms with female participation in ownership (% of firms) ........... —Women’s access to land ownership2 ............................................... —Women’s access to bank loans2 ........................................................ —Women’s access to property other than land2 ............................... —Women’s access to finance programmes3 .........................................3Ability of women to rise to positions of
enterprise leadership1 ....................................................................3.73
EducationFemale teachers, primary education (%) ..........................................78Female teachers, secondary education (%) .....................................63Female teachers, tertiary education (%) ...........................................39Female school life expectancy, primary to secondary (years)......12Male school life expectancy, primary to secondary (years) .........12
Marriage and ChildbearingMean age of marriage for women (years) ........................................25Early marriage (% women, aged 15–19) ........................................... —Fertility rate (births per woman) .......................................................1.90Adolescent fertility rate (births per 1,000 women, aged 15–19) ....51Antenatal care coverage, at least one visit (%) .............................. —Births attended by skilled health staff (%) ......................................100Maternal mortality ratio (per 100,000 live births)4 ...............26 [15-43]Contraceptive prevalence, married women (%) ..............................64Female HIV prevalence, aged 15–49 (%) ........................................0.20Male HIV prevalence, aged 15–49 (%) ............................................0.50Infant mortality rate (per 1,000 live births) ..........................................7Overall population sex ratio (male/female) ....................................0.98
Social Institutions and Political RightsPaternal versus maternal authority2.................................................. —Female genital mutilation2 ................................................................... —Acceptance or legality of polygamy2 ................................................ —Existence of legislation punishing acts
of violence against women2 ............................................................ —Year women received right to vote ................................................1949Quota type ..........................................................................No legislated;
voluntary political party quotasExistence of legislation prohibiting
gender-based discrimination ........................................................ Yes
Childcare EcosystemLength of maternity leave ........................................................18 weeksMaternity leave benefits (% of wages paid) ...................................100Provider of maternity coverage ...................................Social securityLength of paternity leave ...............................................5 working daysPaternity leave benefits (% of wages paid) ....................................100Daycare options .................................................................................... —
ChileGender Gap Index 2011 (out of 135 countries) 46 0.703 106 0.541 40 0.996 1 0.980 22 0.296
Gender Gap Index 2010 (out of 134 countries) 48 0.701 108 0.534 42 0.996 1 0.980 21 0.296
Gender Gap Index 2009 (out of 134 countries) 64 0.688 112 0.521 44 0.996 1 0.980 26 0.257
Gender Gap Index 2008 (out of 130 countries) 65 0.682 106 0.515 81 0.986 1 0.980 26 0.247
Gender Gap Index 2007 (out of 128 countries) 86 0.648 105 0.517 78 0.980 1 0.980 58 0.116
Gender Gap Index 2006 (out of 115 countries) 78 0.645 90 0.514 69 0.980 1 0.980 56 0.109

Female-to-male ratio
0.00 = INEQUALITY 1.00 = EQUALITY 1.50
0.00 = INEQUALITY 1.00 = EQUALITY 1.50
0.00 = INEQUALITY 1.00 = EQUALITY 1.50
0.00 = INEQUALITY 1.00 = EQUALITY 1.50
Female-to-male ratio
Female-to-male ratio
Female-to-male ratio
142 Country Profiles Global Gender Gap Report 2011
Sample Female-to- Rank Score average Female Male male ratio
country score sample average
0.00 = inequality 1.00 = equality
0.00
0.20
0.40
0.60
0.80
1.00Economy
Education
Politics
Health
Rank Score(out of 135 countries) (0.00 = inequality, 1.00 = equality)
Gender Gap Subindexes
Economic Participation and Opportunity ......... 50 0.683 0.588
Labour force participation .................................... 34 0.88 0.68 74 85 0.88
Wage equality for similar work (survey) ............ 50 0.69 0.65 — — 0.69
Estimated earned income (PPP US$) ................. 43 0.65 0.52 5,331 8,215 0.65
Legislators, senior officials, and managers ...... 90 0.20 0.26 17 83 0.20
Professional and technical workers .................... 1 1.00 0.64 52 48 1.08
Educational Attainment ........................................ 85 0.981 0.928
Literacy rate ............................................................ 91 0.94 0.86 91 97 0.94
Enrolment in primary education ............................ 1 1.00 0.98 97 97 1.00
Enrolment in secondary education ..................... 95 0.97 0.90 — — 0.97
Enrolment in tertiary education ............................. 1 1.00 0.86 25 24 1.07
Health and Survival ............................................. 133 0.933 0.956
Sex ratio at birth (female/male) ......................... 135 0.88 0.92 — — 0.88
Healthy life expectancy ........................................ 74 1.05 1.04 68 65 1.05
Political Empowerment ........................................ 57 0.150 0.185
Women in parliament ............................................ 48 0.27 0.22 21 79 0.27
Women in ministerial positions ........................... 82 0.13 0.18 12 88 0.13
Years with female head of state (last 50) .......... 22 0.08 0.16 4 46 0.08
ChinaGender Gap Index 2011 61 0.687
Key Indicators
Total population (millions) 1,338.30
Population growth (%) 0.51
GDP (US$ billions) 3,243.07
GDP (PPP) per capita 6,810

Global Gender Gap Report 2011 Country Profiles 143
Economic Participation and Opportunity Educational Attainment Health and Survival Political Empowerment
Evolution 2006–2011
1 Survey data, responses on a 1-to-7 scale (1 = worst score, 7 = best score)2 Data on a 0-to-1 scale (1 = worst score, 0 = best score)3 Data on a 1-to-5 scale (1 = worst score, 5 = best score)4 Bracketed numbers show the range between the uncertainties, estimated
to contain the true maternal mortality ratio with a 95% probability
ECONOMIC EDUCATIONAL HEALTH AND POLITICAL OVERALL PARTICIPATION ATTAINMENT SURVIVAL EMPOWERMENT
Rank Score Rank Score Rank Score Rank Score Rank Score
0.0
0.2
0.4
0.6
0.8
1.0
2006 2007 2008 2009 2010 2011
Additional Data
Economic EmpowermentFemale adult unemployment rate (% of female labour force) ...... —Male adult unemployment rate (% of male labour force) ............. —Women in non-agricultural paid labour
(% of total labour force) ....................................................................39Inheritance practices in favour of male heirs2 ..............................0.00Firms with female participation in ownership (% of firms) ............31Women’s access to land ownership2 .............................................0.00Women’s access to bank loans2 ......................................................0.00Women’s access to property other than land2 .............................0.00Women’s access to finance programmes3 .........................................3Ability of women to rise to positions of
enterprise leadership1 ....................................................................4.62
EducationFemale teachers, primary education (%) ..........................................57Female teachers, secondary education (%) .....................................47Female teachers, tertiary education (%) ...........................................44Female school life expectancy, primary to secondary (years)......11Male school life expectancy, primary to secondary (years) .........10
Marriage and ChildbearingMean age of marriage for women (years) ........................................23Early marriage (% women, aged 15–19) ..............................................1Fertility rate (births per woman) .......................................................1.80Adolescent fertility rate (births per 1,000 women, aged 15–19) ......5Antenatal care coverage, at least one visit (%) ...............................92Births attended by skilled health staff (%) ........................................96Maternal mortality ratio (per 100,000 live births)4 ...............38 [23-60]Contraceptive prevalence, married women (%) ..............................87Female HIV prevalence, aged 15–49 (%) ......................................<0.10Male HIV prevalence, aged 15–49 (%) ............................................0.10Infant mortality rate (per 1,000 live births) ........................................17Overall population sex ratio (male/female) ....................................1.08
Social Institutions and Political RightsPaternal versus maternal authority2................................................0.00Female genital mutilation2 .................................................................0.00Acceptance or legality of polygamy2 ..............................................0.00Existence of legislation punishing acts
of violence against women2 ..........................................................0.58Year women received right to vote ................................................1949Quota type .......................................................................Reserved seats
at single/lower houseExistence of legislation prohibiting
gender-based discrimination .......................................................... —
Childcare EcosystemLength of maternity leave ........................................................... 90 daysMaternity leave benefits (% of wages paid) ..................................100.
The social insurance program applies to urban areas and the maternity insurance program covers all employees in urban enterprises, including all state-owned enterprises, regardless of their location
Provider of maternity coverage ............................... Social insurance Length of paternity leave ..................................................................... —Paternity leave benefits (% of wages paid) ..................................... —Daycare options .................................................................................... —
ChinaGender Gap Index 2011 (out of 135 countries) 61 0.687 50 0.683 85 0.981 133 0.933 57 0.150
Gender Gap Index 2010 (out of 134 countries) 61 0.688 46 0.693 88 0.981 133 0.929 56 0.150
Gender Gap Index 2009 (out of 134 countries) 60 0.691 38 0.696 87 0.980 130 0.947 60 0.141
Gender Gap Index 2008 (out of 130 countries) 57 0.688 43 0.692 87 0.978 126 0.941 54 0.141
Gender Gap Index 2007 (out of 128 countries) 73 0.664 60 0.648 91 0.957 124 0.941 59 0.111
Gender Gap Index 2006 (out of 115 countries) 63 0.656 53 0.621 78 0.957 114 0.936 52 0.111

Female-to-male ratio
0.00 = INEQUALITY 1.00 = EQUALITY 1.50
0.00 = INEQUALITY 1.00 = EQUALITY 1.50
0.00 = INEQUALITY 1.00 = EQUALITY 1.50
0.00 = INEQUALITY 1.00 = EQUALITY 1.50
Female-to-male ratio
Female-to-male ratio
Female-to-male ratio
144 Country Profiles Global Gender Gap Report 2011
Sample Female-to- Rank Score average Female Male male ratio
country score sample average
0.00 = inequality 1.00 = equality
0.00
0.20
0.40
0.60
0.80
1.00Economy
Education
Politics
Health
Rank Score(out of 135 countries) (0.00 = inequality, 1.00 = equality)
Gender Gap Subindexes
Economic Participation and Opportunity ......... 89 0.598 0.588
Labour force participation .................................. 114 0.55 0.68 43 80 0.55
Wage equality for similar work (survey) ............ 94 0.60 0.65 — — 0.60
Estimated earned income (PPP US$) ................. 99 0.46 0.52 5,718 12,302 0.46
Legislators, senior officials, and managers ...... 18 0.66 0.26 40 60 0.66
Professional and technical workers .................. 75 0.86 0.64 46 54 0.86
Educational Attainment ........................................ 42 0.996 0.928
Literacy rate .............................................................. 1 1.00 0.86 93 93 1.00
Enrolment in primary education .......................... 90 0.99 0.98 89 90 0.99
Enrolment in secondary education ....................... 1 1.00 0.90 77 71 1.08
Enrolment in tertiary education ............................. 1 1.00 0.86 38 36 1.05
Health and Survival ............................................... 41 0.979 0.956
Sex ratio at birth (female/male) ......................... 106 0.94 0.92 — — 0.94
Healthy life expectancy .......................................... 1 1.06 1.04 69 64 1.08
Political Empowerment ........................................ 74 0.112 0.185
Women in parliament ............................................ 90 0.15 0.22 13 87 0.15
Women in ministerial positions ........................... 49 0.27 0.18 21 79 0.27
Years with female head of state (last 50) .......... 52 0.00 0.16 0 50 0.00
ColombiaGender Gap Index 2011 80 0.671
Key Indicators
Total population (millions) 46.30
Population growth (%) 1.39
GDP (US$ billions) 149.84
GDP (PPP) per capita 8,487

Global Gender Gap Report 2011 Country Profiles 145
Economic Participation and Opportunity Educational Attainment Health and Survival Political Empowerment
Evolution 2006–2011
1 Survey data, responses on a 1-to-7 scale (1 = worst score, 7 = best score)2 Data on a 0-to-1 scale (1 = worst score, 0 = best score)3 Data on a 1-to-5 scale (1 = worst score, 5 = best score)4 Bracketed numbers show the range between the uncertainties, estimated
to contain the true maternal mortality ratio with a 95% probability
ECONOMIC EDUCATIONAL HEALTH AND POLITICAL OVERALL PARTICIPATION ATTAINMENT SURVIVAL EMPOWERMENT
Rank Score Rank Score Rank Score Rank Score Rank Score
0.0
0.2
0.4
0.6
0.8
1.0
2006 2007 2008 2009 2010 2011
Additional Data
Economic EmpowermentFemale adult unemployment rate (% of female labour force) .......16Male adult unemployment rate (% of male labour force) ................9Women in non-agricultural paid labour
(% of total labour force) ....................................................................48Inheritance practices in favour of male heirs2 ..............................0.00Firms with female participation in ownership (% of firms) ............41Women’s access to land ownership2 .............................................0.50Women’s access to bank loans2 ......................................................0.00Women’s access to property other than land2 .............................0.00Women’s access to finance programmes3 .........................................3Ability of women to rise to positions of
enterprise leadership1 ....................................................................4.40
EducationFemale teachers, primary education (%) ..........................................78Female teachers, secondary education (%) .....................................50Female teachers, tertiary education (%) ...........................................66Female school life expectancy, primary to secondary (years)......12Male school life expectancy, primary to secondary (years) .........12
Marriage and ChildbearingMean age of marriage for women (years) ........................................23Early marriage (% women, aged 15–19) ............................................18Fertility rate (births per woman) .......................................................2.40Adolescent fertility rate (births per 1,000 women, aged 15–19) ....96Antenatal care coverage, at least one visit (%) ...............................94Births attended by skilled health staff (%) ........................................96Maternal mortality ratio (per 100,000 live births)4 ...............85 [74-94]Contraceptive prevalence, married women (%) ..............................78Female HIV prevalence, aged 15–49 (%) ........................................0.30Male HIV prevalence, aged 15–49 (%) ............................................0.70Infant mortality rate (per 1,000 live births) ........................................16Overall population sex ratio (male/female) ....................................0.97
Social Institutions and Political RightsPaternal versus maternal authority2................................................0.00Female genital mutilation2 .................................................................0.00Acceptance or legality of polygamy2 ..............................................0.00Existence of legislation punishing acts
of violence against women2 ..........................................................0.33Year women received right to vote ................................................1954Quota type .............................................................................................. —Existence of legislation prohibiting
gender-based discrimination ........................................................ Yes
Childcare EcosystemLength of maternity leave ........................................................12 weeksMaternity leave benefits (% of wages paid) ...................................100Provider of maternity coverage ...................................Social securityLength of paternity leave .............................................................. 8 daysPaternity leave benefits (% of wages paid) ....................................100Daycare options .................................Public daycare with allowance
ColombiaGender Gap Index 2011 (out of 135 countries) 80 0.671 89 0.598 42 0.996 41 0.979 74 0.112
Gender Gap Index 2010 (out of 134 countries) 55 0.693 45 0.694 44 0.996 40 0.979 83 0.102
Gender Gap Index 2009 (out of 134 countries) 56 0.694 39 0.694 28 1.000 1 0.980 84 0.103
Gender Gap Index 2008 (out of 130 countries) 50 0.694 37 0.697 32 0.999 1 0.980 79 0.103
Gender Gap Index 2007 (out of 128 countries) 24 0.709 35 0.691 16 1.000 1 0.980 33 0.166
Gender Gap Index 2006 (out of 115 countries) 22 0.705 39 0.661 14 1.000 1 0.980 27 0.180
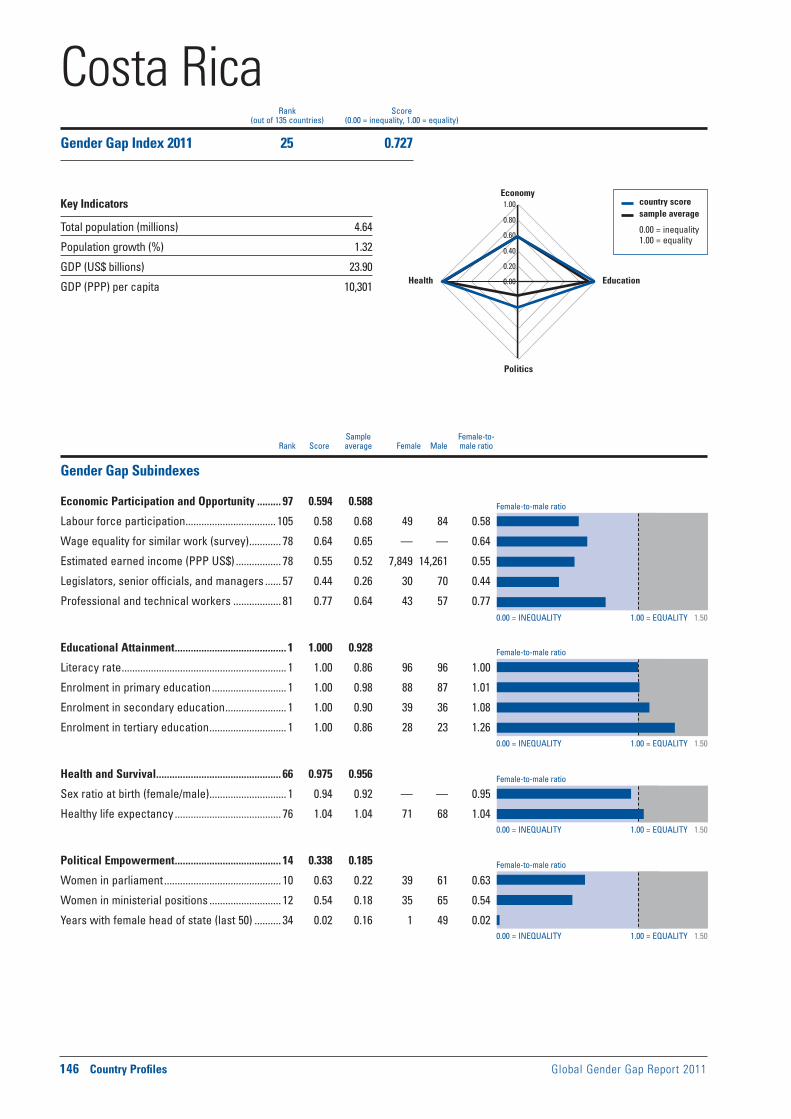
Female-to-male ratio
0.00 = INEQUALITY 1.00 = EQUALITY 1.50
0.00 = INEQUALITY 1.00 = EQUALITY 1.50
0.00 = INEQUALITY 1.00 = EQUALITY 1.50
0.00 = INEQUALITY 1.00 = EQUALITY 1.50
Female-to-male ratio
Female-to-male ratio
Female-to-male ratio
146 Country Profiles Global Gender Gap Report 2011
Sample Female-to- Rank Score average Female Male male ratio
country score sample average
0.00 = inequality 1.00 = equality
0.00
0.20
0.40
0.60
0.80
1.00Economy
Education
Politics
Health
Rank Score(out of 135 countries) (0.00 = inequality, 1.00 = equality)
Gender Gap Subindexes
Economic Participation and Opportunity ......... 97 0.594 0.588
Labour force participation .................................. 105 0.58 0.68 49 84 0.58
Wage equality for similar work (survey) ............ 78 0.64 0.65 — — 0.64
Estimated earned income (PPP US$) ................. 78 0.55 0.52 7,849 14,261 0.55
Legislators, senior officials, and managers ...... 57 0.44 0.26 30 70 0.44
Professional and technical workers .................. 81 0.77 0.64 43 57 0.77
Educational Attainment .......................................... 1 1.000 0.928
Literacy rate .............................................................. 1 1.00 0.86 96 96 1.00
Enrolment in primary education ............................ 1 1.00 0.98 88 87 1.01
Enrolment in secondary education ....................... 1 1.00 0.90 39 36 1.08
Enrolment in tertiary education ............................. 1 1.00 0.86 28 23 1.26
Health and Survival ............................................... 66 0.975 0.956
Sex ratio at birth (female/male) ............................. 1 0.94 0.92 — — 0.95
Healthy life expectancy ........................................ 76 1.04 1.04 71 68 1.04
Political Empowerment ........................................ 14 0.338 0.185
Women in parliament ............................................ 10 0.63 0.22 39 61 0.63
Women in ministerial positions ........................... 12 0.54 0.18 35 65 0.54
Years with female head of state (last 50) .......... 34 0.02 0.16 1 49 0.02
Costa RicaGender Gap Index 2011 25 0.727
Key Indicators
Total population (millions) 4.64
Population growth (%) 1.32
GDP (US$ billions) 23.90
GDP (PPP) per capita 10,301
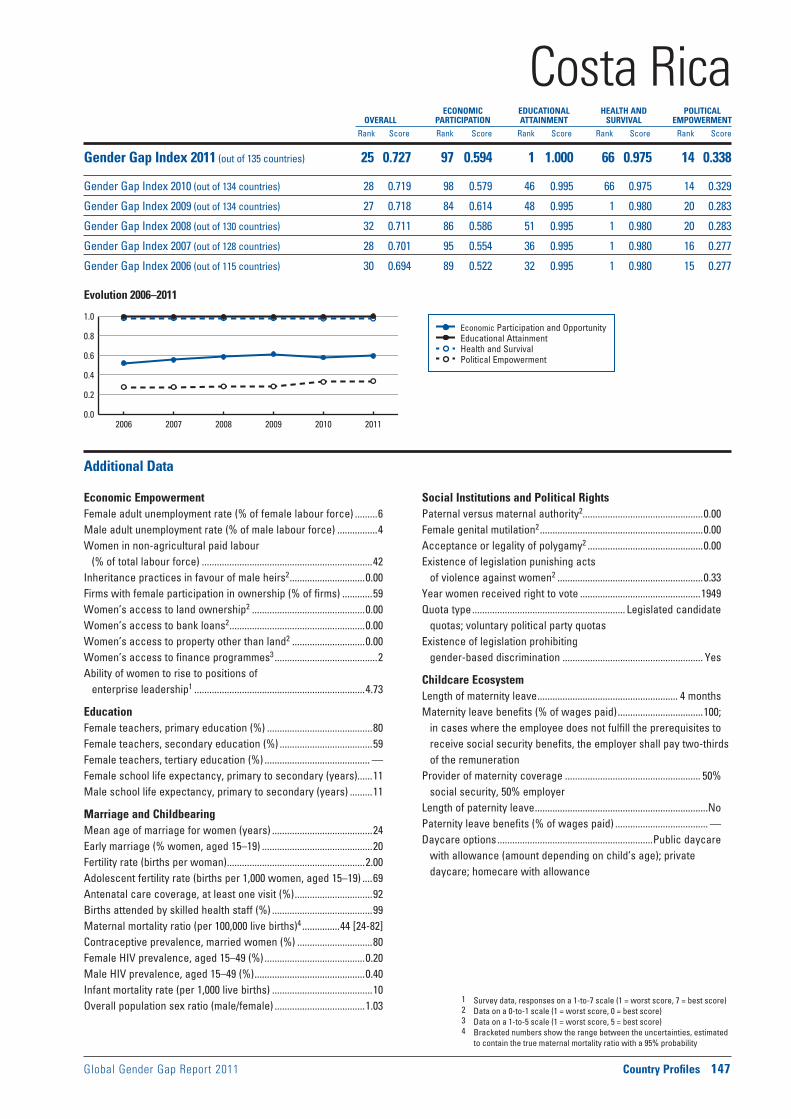
Global Gender Gap Report 2011 Country Profiles 147
Economic Participation and Opportunity Educational Attainment Health and Survival Political Empowerment
Evolution 2006–2011
1 Survey data, responses on a 1-to-7 scale (1 = worst score, 7 = best score)2 Data on a 0-to-1 scale (1 = worst score, 0 = best score)3 Data on a 1-to-5 scale (1 = worst score, 5 = best score)4 Bracketed numbers show the range between the uncertainties, estimated
to contain the true maternal mortality ratio with a 95% probability
ECONOMIC EDUCATIONAL HEALTH AND POLITICAL OVERALL PARTICIPATION ATTAINMENT SURVIVAL EMPOWERMENT
Rank Score Rank Score Rank Score Rank Score Rank Score
0.0
0.2
0.4
0.6
0.8
1.0
2006 2007 2008 2009 2010 2011
Additional Data
Economic EmpowermentFemale adult unemployment rate (% of female labour force) .........6Male adult unemployment rate (% of male labour force) ................4Women in non-agricultural paid labour
(% of total labour force) ....................................................................42Inheritance practices in favour of male heirs2 ..............................0.00Firms with female participation in ownership (% of firms) ............59Women’s access to land ownership2 .............................................0.00Women’s access to bank loans2 ......................................................0.00Women’s access to property other than land2 .............................0.00Women’s access to finance programmes3 .........................................2Ability of women to rise to positions of
enterprise leadership1 ....................................................................4.73
EducationFemale teachers, primary education (%) ..........................................80Female teachers, secondary education (%) .....................................59Female teachers, tertiary education (%) .......................................... —Female school life expectancy, primary to secondary (years)......11Male school life expectancy, primary to secondary (years) .........11
Marriage and ChildbearingMean age of marriage for women (years) ........................................24Early marriage (% women, aged 15–19) ............................................20Fertility rate (births per woman) .......................................................2.00Adolescent fertility rate (births per 1,000 women, aged 15–19) ....69Antenatal care coverage, at least one visit (%) ...............................92Births attended by skilled health staff (%) ........................................99Maternal mortality ratio (per 100,000 live births)4 ...............44 [24-82]Contraceptive prevalence, married women (%) ..............................80Female HIV prevalence, aged 15–49 (%) ........................................0.20Male HIV prevalence, aged 15–49 (%) ............................................0.40Infant mortality rate (per 1,000 live births) ........................................10Overall population sex ratio (male/female) ....................................1.03
Social Institutions and Political RightsPaternal versus maternal authority2................................................0.00Female genital mutilation2 .................................................................0.00Acceptance or legality of polygamy2 ..............................................0.00Existence of legislation punishing acts
of violence against women2 ..........................................................0.33Year women received right to vote ................................................1949Quota type ............................................................. Legislated candidate
quotas; voluntary political party quotasExistence of legislation prohibiting
gender-based discrimination ........................................................ Yes
Childcare EcosystemLength of maternity leave ........................................................ 4 monthsMaternity leave benefits (% of wages paid) ..................................100;
in cases where the employee does not fulfill the prerequisites to receive social security benefits, the employer shall pay two-thirds of the remuneration
Provider of maternity coverage ...................................................... 50% social security, 50% employer
Length of paternity leave .....................................................................NoPaternity leave benefits (% of wages paid) ..................................... —Daycare options ..............................................................Public daycare
with allowance (amount depending on child’s age); private daycare; homecare with allowance
Costa RicaGender Gap Index 2011 (out of 135 countries) 25 0.727 97 0.594 1 1.000 66 0.975 14 0.338
Gender Gap Index 2010 (out of 134 countries) 28 0.719 98 0.579 46 0.995 66 0.975 14 0.329
Gender Gap Index 2009 (out of 134 countries) 27 0.718 84 0.614 48 0.995 1 0.980 20 0.283
Gender Gap Index 2008 (out of 130 countries) 32 0.711 86 0.586 51 0.995 1 0.980 20 0.283
Gender Gap Index 2007 (out of 128 countries) 28 0.701 95 0.554 36 0.995 1 0.980 16 0.277
Gender Gap Index 2006 (out of 115 countries) 30 0.694 89 0.522 32 0.995 1 0.980 15 0.277

Female-to-male ratio
0.00 = INEQUALITY 1.00 = EQUALITY 1.50
0.00 = INEQUALITY 1.00 = EQUALITY 1.50
0.00 = INEQUALITY 1.00 = EQUALITY 1.50
0.00 = INEQUALITY 1.00 = EQUALITY 1.50
Female-to-male ratio
Female-to-male ratio
Female-to-male ratio
148 Country Profiles Global Gender Gap Report 2011
Sample Female-to- Rank Score average Female Male male ratio
country score sample average
0.00 = inequality 1.00 = equality
0.00
0.20
0.40
0.60
0.80
1.00Economy
Education
Politics
Health
Rank Score(out of 135 countries) (0.00 = inequality, 1.00 = equality)
Gender Gap Subindexes
Economic Participation and Opportunity ....... 103 0.557 0.588
Labour force participation .................................... 96 0.62 0.68 51 83 0.62
Wage equality for similar work (survey) .......... 101 0.58 0.65 — — 0.58
Estimated earned income (PPP US$) ............... 100 0.46 0.52 1,067 2,312 0.46
Legislators, senior officials, and managers ......— — 0.26 — — —
Professional and technical workers ..................— — 0.64 — — —
Educational Attainment ...................................... 130 0.707 0.928
Literacy rate .......................................................... 120 0.70 0.86 45 65 0.70
Enrolment in primary education ........................ 132 0.83 0.98 52 62 0.83
Enrolment in secondary education ................... 129 0.57 0.90 15 27 0.57
Enrolment in tertiary education ......................... 119 0.50 0.86 6 11 0.50
Health and Survival ................................................. 1 0.980 0.956
Sex ratio at birth (female/male) ............................. 1 0.94 0.92 — — 0.97
Healthy life expectancy .......................................... 1 1.06 1.04 48 45 1.07
Political Empowerment ...................................... 105 0.066 0.185
Women in parliament .......................................... 109 0.10 0.22 9 91 0.10
Women in ministerial positions ........................... 75 0.14 0.18 13 88 0.14
Years with female head of state (last 50) .......... 52 0.00 0.16 0 50 0.00
Côte d’IvoireGender Gap Index 2011 130 0.577
Key Indicators
Total population (millions) 21.57
Population growth (%) 2.33
GDP (US$ billions) 11.67
GDP (PPP) per capita 1,559
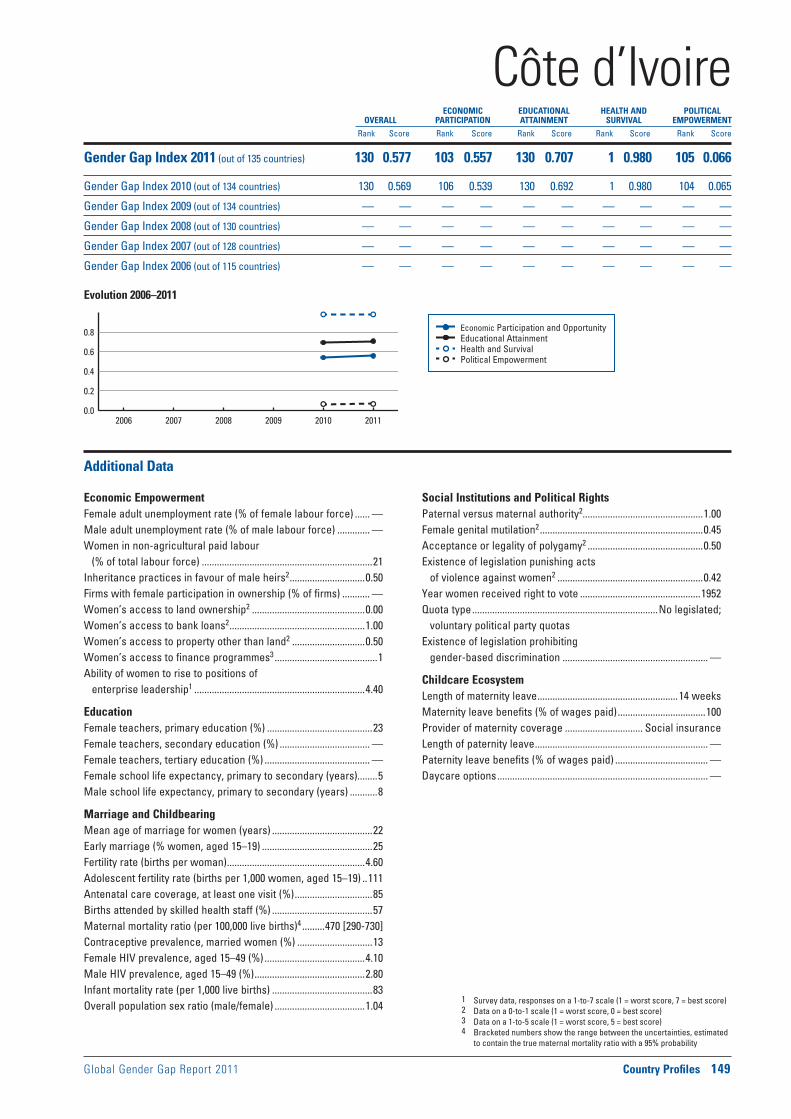
Global Gender Gap Report 2011 Country Profiles 149
Economic Participation and Opportunity Educational Attainment Health and Survival Political Empowerment
Evolution 2006–2011
1 Survey data, responses on a 1-to-7 scale (1 = worst score, 7 = best score)2 Data on a 0-to-1 scale (1 = worst score, 0 = best score)3 Data on a 1-to-5 scale (1 = worst score, 5 = best score)4 Bracketed numbers show the range between the uncertainties, estimated
to contain the true maternal mortality ratio with a 95% probability
ECONOMIC EDUCATIONAL HEALTH AND POLITICAL OVERALL PARTICIPATION ATTAINMENT SURVIVAL EMPOWERMENT
Rank Score Rank Score Rank Score Rank Score Rank Score
0.0
0.2
0.4
0.6
0.8
2006 2007 2008 2009 2010 2011
Additional Data
Economic EmpowermentFemale adult unemployment rate (% of female labour force) ...... —Male adult unemployment rate (% of male labour force) ............. —Women in non-agricultural paid labour
(% of total labour force) ....................................................................21Inheritance practices in favour of male heirs2 ..............................0.50Firms with female participation in ownership (% of firms) ........... —Women’s access to land ownership2 .............................................0.00Women’s access to bank loans2 ......................................................1.00Women’s access to property other than land2 .............................0.50Women’s access to finance programmes3 .........................................1Ability of women to rise to positions of
enterprise leadership1 ....................................................................4.40
EducationFemale teachers, primary education (%) ..........................................23Female teachers, secondary education (%) .................................... —Female teachers, tertiary education (%) .......................................... —Female school life expectancy, primary to secondary (years)........5Male school life expectancy, primary to secondary (years) ...........8
Marriage and ChildbearingMean age of marriage for women (years) ........................................22Early marriage (% women, aged 15–19) ............................................25Fertility rate (births per woman) .......................................................4.60Adolescent fertility rate (births per 1,000 women, aged 15–19) ..111Antenatal care coverage, at least one visit (%) ...............................85Births attended by skilled health staff (%) ........................................57Maternal mortality ratio (per 100,000 live births)4 .........470 [290-730]Contraceptive prevalence, married women (%) ..............................13Female HIV prevalence, aged 15–49 (%) ........................................4.10Male HIV prevalence, aged 15–49 (%) ............................................2.80Infant mortality rate (per 1,000 live births) ........................................83Overall population sex ratio (male/female) ....................................1.04
Social Institutions and Political RightsPaternal versus maternal authority2................................................1.00Female genital mutilation2 .................................................................0.45Acceptance or legality of polygamy2 ..............................................0.50Existence of legislation punishing acts
of violence against women2 ..........................................................0.42Year women received right to vote ................................................1952Quota type ..........................................................................No legislated;
voluntary political party quotasExistence of legislation prohibiting
gender-based discrimination .......................................................... —
Childcare EcosystemLength of maternity leave ........................................................14 weeksMaternity leave benefits (% of wages paid) ...................................100Provider of maternity coverage ............................... Social insuranceLength of paternity leave ..................................................................... —Paternity leave benefits (% of wages paid) ..................................... —Daycare options .................................................................................... —
Côte d’IvoireGender Gap Index 2011 (out of 135 countries) 130 0.577 103 0.557 130 0.707 1 0.980 105 0.066
Gender Gap Index 2010 (out of 134 countries) 130 0.569 106 0.539 130 0.692 1 0.980 104 0.065
Gender Gap Index 2009 (out of 134 countries) — — — — — — — — — —
Gender Gap Index 2008 (out of 130 countries) — — — — — — — — — —
Gender Gap Index 2007 (out of 128 countries) — — — — — — — — — —
Gender Gap Index 2006 (out of 115 countries) — — — — — — — — — —

Female-to-male ratio
0.00 = INEQUALITY 1.00 = EQUALITY 1.50
0.00 = INEQUALITY 1.00 = EQUALITY 1.50
0.00 = INEQUALITY 1.00 = EQUALITY 1.50
0.00 = INEQUALITY 1.00 = EQUALITY 1.50
Female-to-male ratio
Female-to-male ratio
Female-to-male ratio
150 Country Profiles Global Gender Gap Report 2011
Sample Female-to- Rank Score average Female Male male ratio
country score sample average
0.00 = inequality 1.00 = equality
0.00
0.20
0.40
0.60
0.80
1.00Economy
Education
Politics
Health
Rank Score(out of 135 countries) (0.00 = inequality, 1.00 = equality)
Gender Gap Subindexes
Economic Participation and Opportunity ......... 56 0.668 0.588
Labour force participation .................................... 51 0.83 0.68 59 71 0.83
Wage equality for similar work (survey) .......... 113 0.55 0.65 — — 0.55
Estimated earned income (PPP US$) ................. 24 0.70 0.52 16,600 23,629 0.70
Legislators, senior officials, and managers ...... 71 0.36 0.26 27 73 0.36
Professional and technical workers .................... 1 1.00 0.64 51 49 1.04
Educational Attainment ........................................ 44 0.995 0.928
Literacy rate ............................................................ 67 0.99 0.86 98 99 0.99
Enrolment in primary education .......................... 75 1.00 0.98 89 89 1.00
Enrolment in secondary education ....................... 1 1.00 0.90 94 91 1.03
Enrolment in tertiary education ............................. 1 1.00 0.86 55 43 1.27
Health and Survival ................................................. 1 0.980 0.956
Sex ratio at birth (female/male) ............................. 1 0.94 0.92 — — 0.95
Healthy life expectancy .......................................... 1 1.06 1.04 70 66 1.06
Political Empowerment ........................................ 53 0.160 0.185
Women in parliament ............................................ 37 0.31 0.22 24 77 0.31
Women in ministerial positions ........................... 66 0.19 0.18 16 84 0.19
Years with female head of state (last 50) .......... 29 0.04 0.16 2 48 0.04
CroatiaGender Gap Index 2011 50 0.701
Key Indicators
Total population (millions) 4.43
Population growth (%) –0.05
GDP (US$ billions) 27.97
GDP (PPP) per capita 16,085
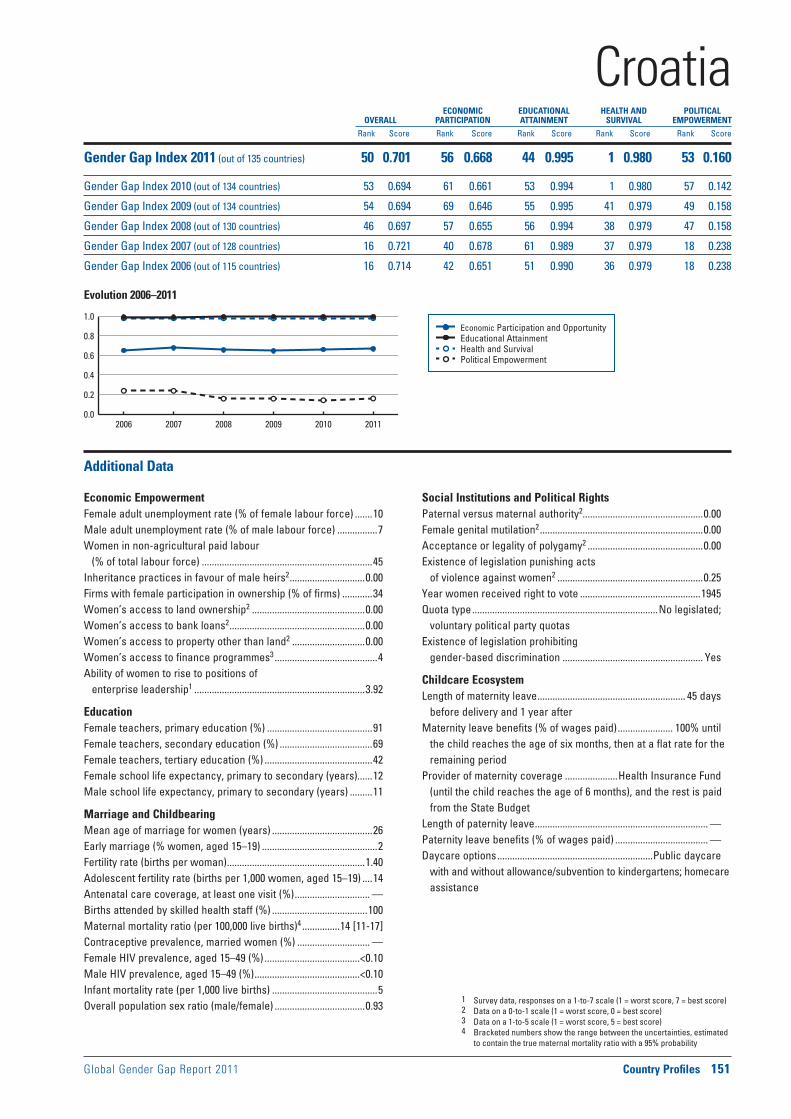
Global Gender Gap Report 2011 Country Profiles 151
Economic Participation and Opportunity Educational Attainment Health and Survival Political Empowerment
Evolution 2006–2011
1 Survey data, responses on a 1-to-7 scale (1 = worst score, 7 = best score)2 Data on a 0-to-1 scale (1 = worst score, 0 = best score)3 Data on a 1-to-5 scale (1 = worst score, 5 = best score)4 Bracketed numbers show the range between the uncertainties, estimated
to contain the true maternal mortality ratio with a 95% probability
ECONOMIC EDUCATIONAL HEALTH AND POLITICAL OVERALL PARTICIPATION ATTAINMENT SURVIVAL EMPOWERMENT
Rank Score Rank Score Rank Score Rank Score Rank Score
0.0
0.2
0.4
0.6
0.8
1.0
2006 2007 2008 2009 2010 2011
Additional Data
Economic EmpowermentFemale adult unemployment rate (% of female labour force) .......10Male adult unemployment rate (% of male labour force) ................7Women in non-agricultural paid labour
(% of total labour force) ....................................................................45Inheritance practices in favour of male heirs2 ..............................0.00Firms with female participation in ownership (% of firms) ............34Women’s access to land ownership2 .............................................0.00Women’s access to bank loans2 ......................................................0.00Women’s access to property other than land2 .............................0.00Women’s access to finance programmes3 .........................................4Ability of women to rise to positions of
enterprise leadership1 ....................................................................3.92
EducationFemale teachers, primary education (%) ..........................................91Female teachers, secondary education (%) .....................................69Female teachers, tertiary education (%) ...........................................42Female school life expectancy, primary to secondary (years)......12Male school life expectancy, primary to secondary (years) .........11
Marriage and ChildbearingMean age of marriage for women (years) ........................................26Early marriage (% women, aged 15–19) ..............................................2Fertility rate (births per woman) .......................................................1.40Adolescent fertility rate (births per 1,000 women, aged 15–19) ....14Antenatal care coverage, at least one visit (%) .............................. —Births attended by skilled health staff (%) ......................................100Maternal mortality ratio (per 100,000 live births)4 ...............14 [11-17]Contraceptive prevalence, married women (%) ............................. —Female HIV prevalence, aged 15–49 (%) ......................................<0.10Male HIV prevalence, aged 15–49 (%) ..........................................<0.10Infant mortality rate (per 1,000 live births) ..........................................5Overall population sex ratio (male/female) ....................................0.93
Social Institutions and Political RightsPaternal versus maternal authority2................................................0.00Female genital mutilation2 .................................................................0.00Acceptance or legality of polygamy2 ..............................................0.00Existence of legislation punishing acts
of violence against women2 ..........................................................0.25Year women received right to vote ................................................1945Quota type ..........................................................................No legislated;
voluntary political party quotasExistence of legislation prohibiting
gender-based discrimination ........................................................ Yes
Childcare EcosystemLength of maternity leave ........................................................... 45 days
before delivery and 1 year afterMaternity leave benefits (% of wages paid) ...................... 100% until
the child reaches the age of six months, then at a flat rate for the remaining period
Provider of maternity coverage .....................Health Insurance Fund (until the child reaches the age of 6 months), and the rest is paid from the State Budget
Length of paternity leave ..................................................................... —Paternity leave benefits (% of wages paid) ..................................... —Daycare options ..............................................................Public daycare
with and without allowance/subvention to kindergartens; homecare assistance
CroatiaGender Gap Index 2011 (out of 135 countries) 50 0.701 56 0.668 44 0.995 1 0.980 53 0.160
Gender Gap Index 2010 (out of 134 countries) 53 0.694 61 0.661 53 0.994 1 0.980 57 0.142
Gender Gap Index 2009 (out of 134 countries) 54 0.694 69 0.646 55 0.995 41 0.979 49 0.158
Gender Gap Index 2008 (out of 130 countries) 46 0.697 57 0.655 56 0.994 38 0.979 47 0.158
Gender Gap Index 2007 (out of 128 countries) 16 0.721 40 0.678 61 0.989 37 0.979 18 0.238
Gender Gap Index 2006 (out of 115 countries) 16 0.714 42 0.651 51 0.990 36 0.979 18 0.238
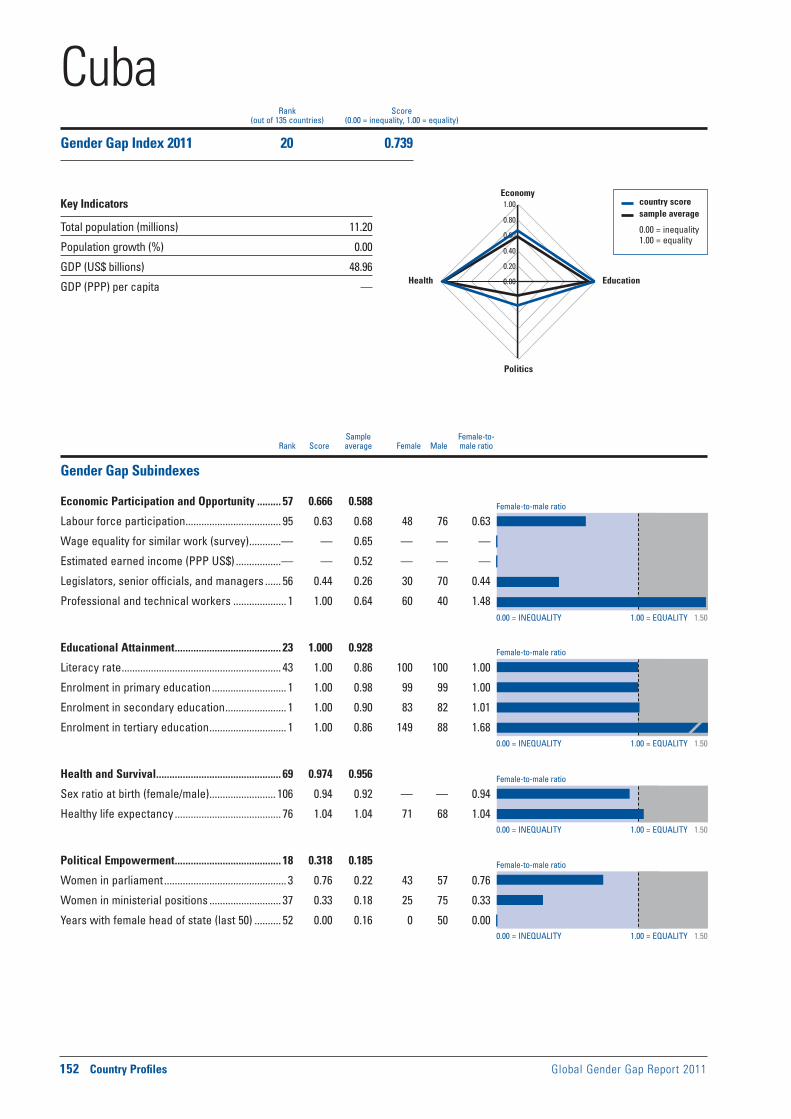
Female-to-male ratio
0.00 = INEQUALITY 1.00 = EQUALITY 1.50
0.00 = INEQUALITY 1.00 = EQUALITY 1.50
0.00 = INEQUALITY 1.00 = EQUALITY 1.50
0.00 = INEQUALITY 1.00 = EQUALITY 1.50
Female-to-male ratio
Female-to-male ratio
Female-to-male ratio
152 Country Profiles Global Gender Gap Report 2011
Sample Female-to- Rank Score average Female Male male ratio
country score sample average
0.00 = inequality 1.00 = equality
0.00
0.20
0.40
0.60
0.80
1.00Economy
Education
Politics
Health
Rank Score(out of 135 countries) (0.00 = inequality, 1.00 = equality)
Gender Gap Subindexes
Economic Participation and Opportunity ......... 57 0.666 0.588
Labour force participation .................................... 95 0.63 0.68 48 76 0.63
Wage equality for similar work (survey) ............— — 0.65 — — —
Estimated earned income (PPP US$) .................— — 0.52 — — —
Legislators, senior officials, and managers ...... 56 0.44 0.26 30 70 0.44
Professional and technical workers .................... 1 1.00 0.64 60 40 1.48
Educational Attainment ........................................ 23 1.000 0.928
Literacy rate ............................................................ 43 1.00 0.86 100 100 1.00
Enrolment in primary education ............................ 1 1.00 0.98 99 99 1.00
Enrolment in secondary education ....................... 1 1.00 0.90 83 82 1.01
Enrolment in tertiary education ............................. 1 1.00 0.86 149 88 1.68
Health and Survival ............................................... 69 0.974 0.956
Sex ratio at birth (female/male) ......................... 106 0.94 0.92 — — 0.94
Healthy life expectancy ........................................ 76 1.04 1.04 71 68 1.04
Political Empowerment ........................................ 18 0.318 0.185
Women in parliament .............................................. 3 0.76 0.22 43 57 0.76
Women in ministerial positions ........................... 37 0.33 0.18 25 75 0.33
Years with female head of state (last 50) .......... 52 0.00 0.16 0 50 0.00
CubaGender Gap Index 2011 20 0.739
Key Indicators
Total population (millions) 11.20
Population growth (%) 0.00
GDP (US$ billions) 48.96
GDP (PPP) per capita —

Global Gender Gap Report 2011 Country Profiles 153
Economic Participation and Opportunity Educational Attainment Health and Survival Political Empowerment
Evolution 2006–2011
1 Survey data, responses on a 1-to-7 scale (1 = worst score, 7 = best score)2 Data on a 0-to-1 scale (1 = worst score, 0 = best score)3 Data on a 1-to-5 scale (1 = worst score, 5 = best score)4 Bracketed numbers show the range between the uncertainties, estimated
to contain the true maternal mortality ratio with a 95% probability
ECONOMIC EDUCATIONAL HEALTH AND POLITICAL OVERALL PARTICIPATION ATTAINMENT SURVIVAL EMPOWERMENT
Rank Score Rank Score Rank Score Rank Score Rank Score
0.0
0.2
0.4
0.6
0.8
1.0
2006 2007 2008 2009 2010 2011
Additional Data
Economic EmpowermentFemale adult unemployment rate (% of female labour force) .........2Male adult unemployment rate (% of male labour force) ................1Women in non-agricultural paid labour
(% of total labour force) ....................................................................43Inheritance practices in favour of male heirs2 ..............................0.00Firms with female participation in ownership (% of firms) ............19Women’s access to land ownership2 .............................................0.00Women’s access to bank loans2 ......................................................0.00Women’s access to property other than land2 .............................0.00Women’s access to finance programmes3 ...................................... —Ability of women to rise to positions of
enterprise leadership1 ...................................................................... —
EducationFemale teachers, primary education (%) ..........................................78Female teachers, secondary education (%) .....................................55Female teachers, tertiary education (%) ...........................................59Female school life expectancy, primary to secondary (years)......12Male school life expectancy, primary to secondary (years) .........12
Marriage and ChildbearingMean age of marriage for women (years) ........................................21Early marriage (% women, aged 15–19) ............................................29Fertility rate (births per woman) .......................................................1.50Adolescent fertility rate (births per 1,000 women, aged 15–19) ....44Antenatal care coverage, at least one visit (%) .............................. —Births attended by skilled health staff (%) ......................................100Maternal mortality ratio (per 100,000 live births)4 ...............53 [36-76]Contraceptive prevalence, married women (%) ..............................73Female HIV prevalence, aged 15–49 (%) ........................................0.10Male HIV prevalence, aged 15–49 (%) ............................................0.10Infant mortality rate (per 1,000 live births) ..........................................5Overall population sex ratio (male/female) ....................................1.00
Social Institutions and Political RightsPaternal versus maternal authority2................................................0.00Female genital mutilation2 .................................................................0.00Acceptance or legality of polygamy2 ..............................................0.00Existence of legislation punishing acts
of violence against women2 ..........................................................0.50Year women received right to vote ................................................1934Quota type .............................................................................................. —Existence of legislation prohibiting
gender-based discrimination .......................................................... —
Childcare EcosystemLength of maternity leave ........................................................18 weeksMaternity leave benefits (% of wages paid) ...................................100Provider of maternity coverage ...................................Social securityLength of paternity leave ..................................................................... —Paternity leave benefits (% of wages paid) ..................................... —Daycare options .................................................................................... —
CubaGender Gap Index 2011 (out of 135 countries) 20 0.739 57 0.666 23 1.000 69 0.974 18 0.318
Gender Gap Index 2010 (out of 134 countries) 24 0.725 84 0.609 1 1.000 69 0.974 18 0.318
Gender Gap Index 2009 (out of 134 countries) 29 0.718 88 0.603 1 1.000 74 0.974 18 0.293
Gender Gap Index 2008 (out of 130 countries) 25 0.720 77 0.611 25 1.000 71 0.974 19 0.293
Gender Gap Index 2007 (out of 128 countries) 22 0.717 39 0.681 55 0.990 69 0.974 23 0.222
Gender Gap Index 2006 (out of 115 countries) — — — — — — — — — —
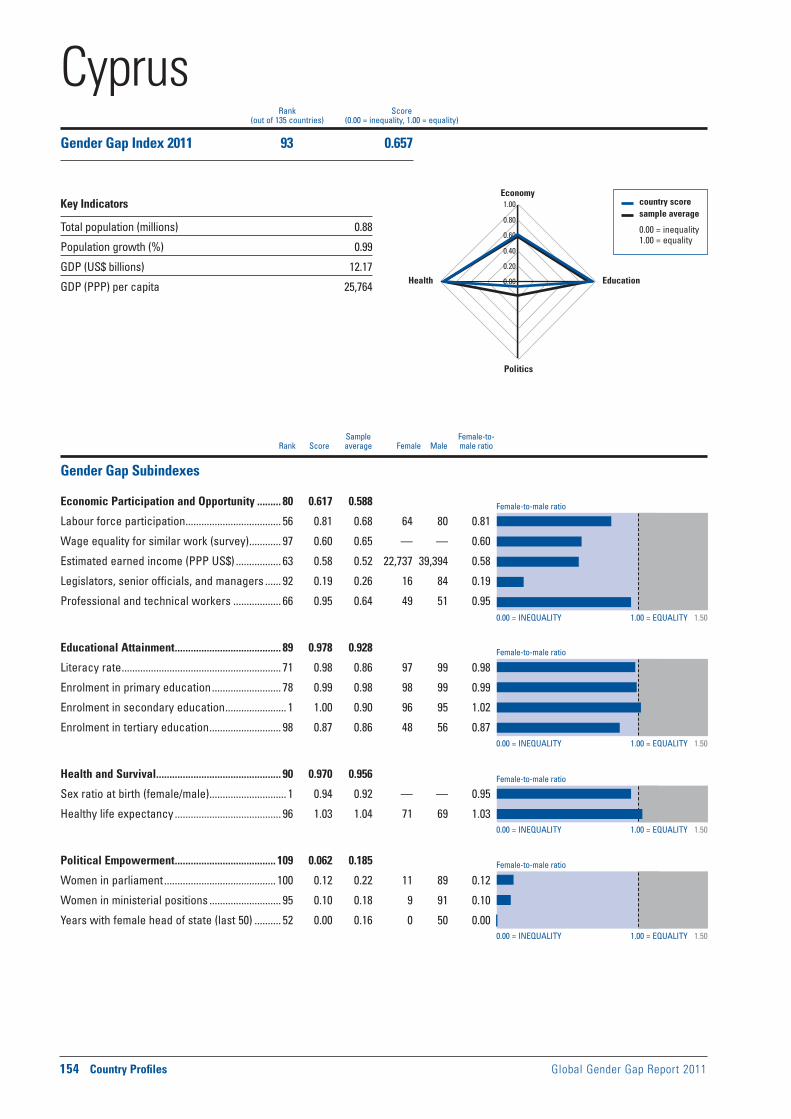
Female-to-male ratio
0.00 = INEQUALITY 1.00 = EQUALITY 1.50
0.00 = INEQUALITY 1.00 = EQUALITY 1.50
0.00 = INEQUALITY 1.00 = EQUALITY 1.50
0.00 = INEQUALITY 1.00 = EQUALITY 1.50
Female-to-male ratio
Female-to-male ratio
Female-to-male ratio
154 Country Profiles Global Gender Gap Report 2011
Sample Female-to- Rank Score average Female Male male ratio
country score sample average
0.00 = inequality 1.00 = equality
0.00
0.20
0.40
0.60
0.80
1.00Economy
Education
Politics
Health
Rank Score(out of 135 countries) (0.00 = inequality, 1.00 = equality)
Gender Gap Subindexes
Economic Participation and Opportunity ......... 80 0.617 0.588
Labour force participation .................................... 56 0.81 0.68 64 80 0.81
Wage equality for similar work (survey) ............ 97 0.60 0.65 — — 0.60
Estimated earned income (PPP US$) ................. 63 0.58 0.52 22,737 39,394 0.58
Legislators, senior officials, and managers ...... 92 0.19 0.26 16 84 0.19
Professional and technical workers .................. 66 0.95 0.64 49 51 0.95
Educational Attainment ........................................ 89 0.978 0.928
Literacy rate ............................................................ 71 0.98 0.86 97 99 0.98
Enrolment in primary education .......................... 78 0.99 0.98 98 99 0.99
Enrolment in secondary education ....................... 1 1.00 0.90 96 95 1.02
Enrolment in tertiary education ........................... 98 0.87 0.86 48 56 0.87
Health and Survival ............................................... 90 0.970 0.956
Sex ratio at birth (female/male) ............................. 1 0.94 0.92 — — 0.95
Healthy life expectancy ........................................ 96 1.03 1.04 71 69 1.03
Political Empowerment ...................................... 109 0.062 0.185
Women in parliament .......................................... 100 0.12 0.22 11 89 0.12
Women in ministerial positions ........................... 95 0.10 0.18 9 91 0.10
Years with female head of state (last 50) .......... 52 0.00 0.16 0 50 0.00
CyprusGender Gap Index 2011 93 0.657
Key Indicators
Total population (millions) 0.88
Population growth (%) 0.99
GDP (US$ billions) 12.17
GDP (PPP) per capita 25,764

Global Gender Gap Report 2011 Country Profiles 155
Economic Participation and Opportunity Educational Attainment Health and Survival Political Empowerment
Evolution 2006–2011
1 Survey data, responses on a 1-to-7 scale (1 = worst score, 7 = best score)2 Data on a 0-to-1 scale (1 = worst score, 0 = best score)3 Data on a 1-to-5 scale (1 = worst score, 5 = best score)4 Bracketed numbers show the range between the uncertainties, estimated
to contain the true maternal mortality ratio with a 95% probability
ECONOMIC EDUCATIONAL HEALTH AND POLITICAL OVERALL PARTICIPATION ATTAINMENT SURVIVAL EMPOWERMENT
Rank Score Rank Score Rank Score Rank Score Rank Score
0.0
0.2
0.4
0.6
0.8
1.0
2006 2007 2008 2009 2010 2011
Additional Data
Economic EmpowermentFemale adult unemployment rate (% of female labour force) .........6Male adult unemployment rate (% of male labour force) ................3Women in non-agricultural paid labour
(% of total labour force) ....................................................................49Inheritance practices in favour of male heirs2 ................................ —Firms with female participation in ownership (% of firms) ........... —Women’s access to land ownership2 ............................................... —Women’s access to bank loans2 ........................................................ —Women’s access to property other than land2 ............................... —Women’s access to finance programmes3 ...................................... —Ability of women to rise to positions of
enterprise leadership1 ....................................................................4.20
EducationFemale teachers, primary education (%) ..........................................82Female teachers, secondary education (%) .....................................63Female teachers, tertiary education (%) ...........................................40Female school life expectancy, primary to secondary (years)......12Male school life expectancy, primary to secondary (years) .........12
Marriage and ChildbearingMean age of marriage for women (years) ........................................25Early marriage (% women, aged 15–19) ........................................... —Fertility rate (births per woman) .......................................................1.50Adolescent fertility rate (births per 1,000 women, aged 15–19) ......5Antenatal care coverage, at least one visit (%) .............................. —Births attended by skilled health staff (%) ......................................100Maternal mortality ratio (per 100,000 live births)4 .................10 [4-23]Contraceptive prevalence, married women (%) ............................. —Female HIV prevalence, aged 15–49 (%) .......................................... —Male HIV prevalence, aged 15–49 (%) .............................................. —Infant mortality rate (per 1,000 live births) ..........................................3Overall population sex ratio (male/female) ....................................0.95
Social Institutions and Political RightsPaternal versus maternal authority2.................................................. —Female genital mutilation2 ................................................................... —Acceptance or legality of polygamy2 ................................................ —Existence of legislation punishing acts
of violence against women2 ............................................................ —Year women received right to vote ................................................1960Quota type ..........................................................................No legislated;
voluntary political party quotasExistence of legislation prohibiting
gender-based discrimination ........................................................ Yes
Childcare EcosystemLength of maternity leave ........................................................18 weeksMaternity leave benefits (% of wages paid) ....................................75;
the rate is increased to 80% if claimant has one dependant, to 90% if she has two dependants and to 100% if she has three dependants
Provider of maternity coverage ...................................Social securityLength of paternity leave ..................................................................... —Paternity leave benefits (% of wages paid) .................................... — Daycare options ......................................................................Public and
private daycare with allowance; homecare with and without allowance
CyprusGender Gap Index 2011 (out of 135 countries) 93 0.657 80 0.617 89 0.978 90 0.970 109 0.062
Gender Gap Index 2010 (out of 134 countries) 86 0.664 75 0.630 77 0.988 88 0.970 102 0.069
Gender Gap Index 2009 (out of 134 countries) 79 0.671 82 0.617 61 0.993 114 0.966 80 0.107
Gender Gap Index 2008 (out of 130 countries) 76 0.669 78 0.610 50 0.995 110 0.966 76 0.107
Gender Gap Index 2007 (out of 128 countries) 82 0.652 81 0.602 60 0.989 108 0.966 107 0.052
Gender Gap Index 2006 (out of 115 countries) 83 0.643 75 0.562 55 0.989 84 0.969 95 0.052

Female-to-male ratio
0.00 = INEQUALITY 1.00 = EQUALITY 1.50
0.00 = INEQUALITY 1.00 = EQUALITY 1.50
0.00 = INEQUALITY 1.00 = EQUALITY 1.50
0.00 = INEQUALITY 1.00 = EQUALITY 1.50
Female-to-male ratio
Female-to-male ratio
Female-to-male ratio
156 Country Profiles Global Gender Gap Report 2011
Sample Female-to- Rank Score average Female Male male ratio
country score sample average
0.00 = inequality 1.00 = equality
0.00
0.20
0.40
0.60
0.80
1.00Economy
Education
Politics
Health
Rank Score(out of 135 countries) (0.00 = inequality, 1.00 = equality)
Gender Gap Subindexes
Economic Participation and Opportunity ......... 94 0.596 0.588
Labour force participation .................................... 67 0.78 0.68 61 78 0.78
Wage equality for similar work (survey) .......... 127 0.50 0.65 — — 0.50
Estimated earned income (PPP US$) ................. 96 0.48 0.52 16,651 34,848 0.48
Legislators, senior officials, and managers ...... 67 0.39 0.26 28 72 0.39
Professional and technical workers .................... 1 1.00 0.64 53 47 1.12
Educational Attainment .......................................... 1 1.000 0.928
Literacy rate .............................................................. 1 1.00 0.86 99 99 1.00
Enrolment in primary education ............................ 1 1.00 0.98 91 88 1.03
Enrolment in secondary education ....................... 1 1.00 0.90 83 79 1.04
Enrolment in tertiary education ............................. 1 1.00 0.86 71 51 1.38
Health and Survival ............................................... 39 0.979 0.956
Sex ratio at birth (female/male) ............................. 1 0.94 0.92 — — 0.94
Healthy life expectancy ........................................ 54 1.06 1.04 72 68 1.06
Political Empowerment ........................................ 60 0.140 0.185
Women in parliament ............................................ 45 0.28 0.22 22 78 0.28
Women in ministerial positions ........................... 58 0.21 0.18 18 82 0.21
Years with female head of state (last 50) .......... 52 0.00 0.16 0 50 0.00
Czech RepublicGender Gap Index 2011 75 0.679
Key Indicators
Total population (millions) 10.53
Population growth (%) 0.43
GDP (US$ billions) 77.63
GDP (PPP) per capita 22,536
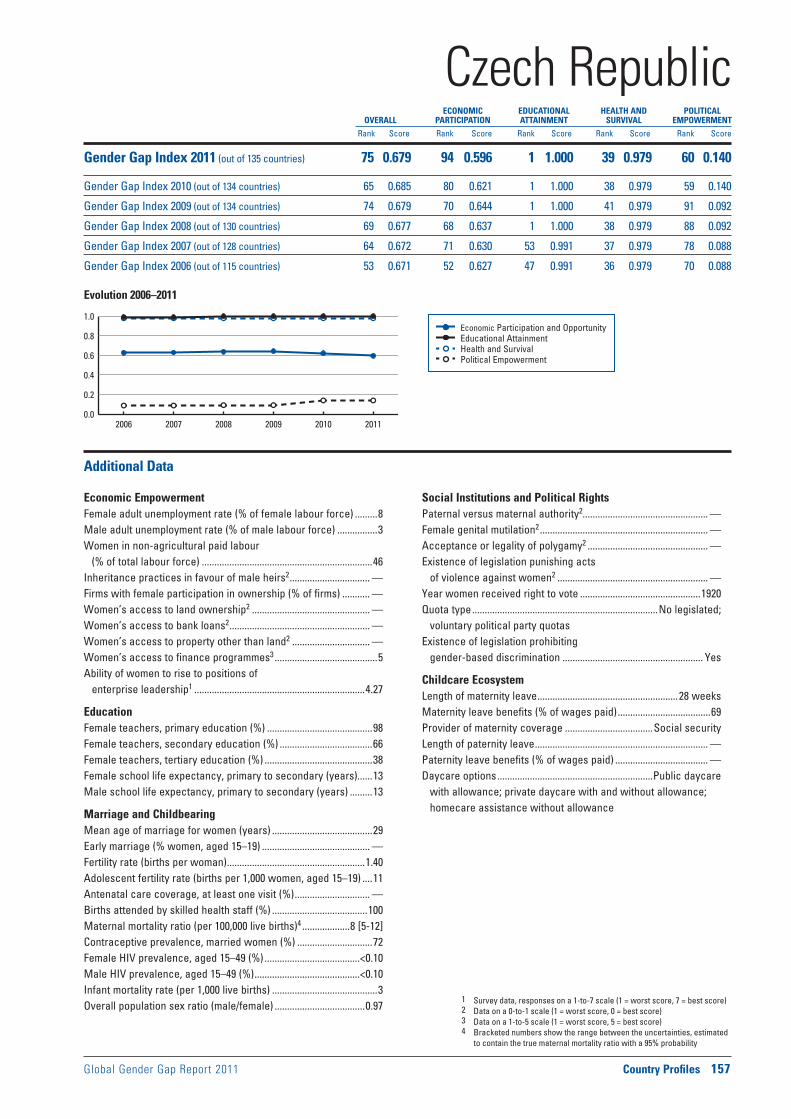
Global Gender Gap Report 2011 Country Profiles 157
Economic Participation and Opportunity Educational Attainment Health and Survival Political Empowerment
Evolution 2006–2011
1 Survey data, responses on a 1-to-7 scale (1 = worst score, 7 = best score)2 Data on a 0-to-1 scale (1 = worst score, 0 = best score)3 Data on a 1-to-5 scale (1 = worst score, 5 = best score)4 Bracketed numbers show the range between the uncertainties, estimated
to contain the true maternal mortality ratio with a 95% probability
ECONOMIC EDUCATIONAL HEALTH AND POLITICAL OVERALL PARTICIPATION ATTAINMENT SURVIVAL EMPOWERMENT
Rank Score Rank Score Rank Score Rank Score Rank Score
0.0
0.2
0.4
0.6
0.8
1.0
2006 2007 2008 2009 2010 2011
Additional Data
Economic EmpowermentFemale adult unemployment rate (% of female labour force) .........8Male adult unemployment rate (% of male labour force) ................3Women in non-agricultural paid labour
(% of total labour force) ....................................................................46Inheritance practices in favour of male heirs2 ................................ —Firms with female participation in ownership (% of firms) ........... —Women’s access to land ownership2 ............................................... —Women’s access to bank loans2 ........................................................ —Women’s access to property other than land2 ............................... —Women’s access to finance programmes3 .........................................5Ability of women to rise to positions of
enterprise leadership1 ....................................................................4.27
EducationFemale teachers, primary education (%) ..........................................98Female teachers, secondary education (%) .....................................66Female teachers, tertiary education (%) ...........................................38Female school life expectancy, primary to secondary (years)......13Male school life expectancy, primary to secondary (years) .........13
Marriage and ChildbearingMean age of marriage for women (years) ........................................29Early marriage (% women, aged 15–19) ........................................... —Fertility rate (births per woman) .......................................................1.40Adolescent fertility rate (births per 1,000 women, aged 15–19) ....11Antenatal care coverage, at least one visit (%) .............................. —Births attended by skilled health staff (%) ......................................100Maternal mortality ratio (per 100,000 live births)4 ...................8 [5-12]Contraceptive prevalence, married women (%) ..............................72Female HIV prevalence, aged 15–49 (%) ......................................<0.10Male HIV prevalence, aged 15–49 (%) ..........................................<0.10Infant mortality rate (per 1,000 live births) ..........................................3Overall population sex ratio (male/female) ....................................0.97
Social Institutions and Political RightsPaternal versus maternal authority2.................................................. —Female genital mutilation2 ................................................................... —Acceptance or legality of polygamy2 ................................................ —Existence of legislation punishing acts
of violence against women2 ............................................................ —Year women received right to vote ................................................1920Quota type ..........................................................................No legislated;
voluntary political party quotasExistence of legislation prohibiting
gender-based discrimination ........................................................ Yes
Childcare EcosystemLength of maternity leave ........................................................28 weeksMaternity leave benefits (% of wages paid) .....................................69Provider of maternity coverage ...................................Social securityLength of paternity leave ..................................................................... —Paternity leave benefits (% of wages paid) ..................................... —Daycare options ..............................................................Public daycare
with allowance; private daycare with and without allowance; homecare assistance without allowance
Czech RepublicGender Gap Index 2011 (out of 135 countries) 75 0.679 94 0.596 1 1.000 39 0.979 60 0.140
Gender Gap Index 2010 (out of 134 countries) 65 0.685 80 0.621 1 1.000 38 0.979 59 0.140
Gender Gap Index 2009 (out of 134 countries) 74 0.679 70 0.644 1 1.000 41 0.979 91 0.092
Gender Gap Index 2008 (out of 130 countries) 69 0.677 68 0.637 1 1.000 38 0.979 88 0.092
Gender Gap Index 2007 (out of 128 countries) 64 0.672 71 0.630 53 0.991 37 0.979 78 0.088
Gender Gap Index 2006 (out of 115 countries) 53 0.671 52 0.627 47 0.991 36 0.979 70 0.088

Female-to-male ratio
0.00 = INEQUALITY 1.00 = EQUALITY 1.50
0.00 = INEQUALITY 1.00 = EQUALITY 1.50
0.00 = INEQUALITY 1.00 = EQUALITY 1.50
0.00 = INEQUALITY 1.00 = EQUALITY 1.50
Female-to-male ratio
Female-to-male ratio
Female-to-male ratio
158 Country Profiles Global Gender Gap Report 2011
Sample Female-to- Rank Score average Female Male male ratio
country score sample average
0.00 = inequality 1.00 = equality
0.00
0.20
0.40
0.60
0.80
1.00Economy
Education
Politics
Health
Rank Score(out of 135 countries) (0.00 = inequality, 1.00 = equality)
Gender Gap Subindexes
Economic Participation and Opportunity ......... 13 0.767 0.588
Labour force participation .................................... 14 0.92 0.68 76 83 0.92
Wage equality for similar work (survey) ............ 12 0.77 0.65 — — 0.77
Estimated earned income (PPP US$) ................. 11 0.81 0.52 32,206 40,000 0.81
Legislators, senior officials, and managers ...... 78 0.31 0.26 24 76 0.31
Professional and technical workers .................... 1 1.00 0.64 52 48 1.09
Educational Attainment .......................................... 1 1.000 0.928
Literacy rate .............................................................. 1 1.00 0.86 99 99 1.00
Enrolment in primary education ............................ 1 1.00 0.98 96 94 1.03
Enrolment in secondary education ....................... 1 1.00 0.90 92 89 1.04
Enrolment in tertiary education ............................. 1 1.00 0.86 92 63 1.47
Health and Survival ............................................... 68 0.974 0.956
Sex ratio at birth (female/male) ............................. 1 0.94 0.92 — — 0.95
Healthy life expectancy ........................................ 78 1.04 1.04 73 70 1.04
Political Empowerment ........................................ 10 0.370 0.185
Women in parliament ............................................ 13 0.61 0.22 38 62 0.61
Women in ministerial positions ............................. 8 0.73 0.18 42 58 0.73
Years with female head of state (last 50) .......... 52 0.00 0.16 0 50 0.00
DenmarkGender Gap Index 2011 7 0.778
Key Indicators
Total population (millions) 5.57
Population growth (%) 0.64
GDP (US$ billions) 171.23
GDP (PPP) per capita 32,486

Global Gender Gap Report 2011 Country Profiles 159
Economic Participation and Opportunity Educational Attainment Health and Survival Political Empowerment
Evolution 2006–2011
1 Survey data, responses on a 1-to-7 scale (1 = worst score, 7 = best score)2 Data on a 0-to-1 scale (1 = worst score, 0 = best score)3 Data on a 1-to-5 scale (1 = worst score, 5 = best score)4 Bracketed numbers show the range between the uncertainties, estimated
to contain the true maternal mortality ratio with a 95% probability
ECONOMIC EDUCATIONAL HEALTH AND POLITICAL OVERALL PARTICIPATION ATTAINMENT SURVIVAL EMPOWERMENT
Rank Score Rank Score Rank Score Rank Score Rank Score
0.0
0.2
0.4
0.6
0.8
1.0
2006 2007 2008 2009 2010 2011
Additional Data
Economic EmpowermentFemale adult unemployment rate (% of female labour force) .........5Male adult unemployment rate (% of male labour force) ................3Women in non-agricultural paid labour
(% of total labour force) ....................................................................49Inheritance practices in favour of male heirs2 ................................ —Firms with female participation in ownership (% of firms) ........... —Women’s access to land ownership2 ............................................... —Women’s access to bank loans2 ........................................................ —Women’s access to property other than land2 ............................... —Women’s access to finance programmes3 .........................................5Ability of women to rise to positions of
enterprise leadership1 ....................................................................5.55
EducationFemale teachers, primary education (%) ..........................................64Female teachers, secondary education (%) .....................................48Female teachers, tertiary education (%) .......................................... —Female school life expectancy, primary to secondary (years)......13Male school life expectancy, primary to secondary (years) .........13
Marriage and ChildbearingMean age of marriage for women (years) ........................................31Early marriage (% women, aged 15–19) ........................................... —Fertility rate (births per woman) .......................................................1.80Adolescent fertility rate (births per 1,000 women, aged 15–19) ......6Antenatal care coverage, at least one visit (%) .............................. —Births attended by skilled health staff (%) ....................................... —Maternal mortality ratio (per 100,000 live births)4 .....................5 [5-6]Contraceptive prevalence, married women (%) ..............................78Female HIV prevalence, aged 15–49 (%) ........................................0.10Male HIV prevalence, aged 15–49 (%) ............................................0.30Infant mortality rate (per 1,000 live births) ..........................................3Overall population sex ratio (male/female) ....................................0.98
Social Institutions and Political RightsPaternal versus maternal authority2.................................................. —Female genital mutilation2 ................................................................... —Acceptance or legality of polygamy2 ................................................ —Existence of legislation punishing acts
of violence against women2 ............................................................ —Year women received right to vote ................................................1915Quota type .............................................................................................. —Existence of legislation prohibiting
gender-based discrimination ........................................................ Yes
Childcare EcosystemLength of maternity leave 100; or paternity leave benefit equivalent
to the unemployment benefit rateMaternity leave benefits (% of wages paid) ....... 100, up to a ceilingProvider of maternity coverage ..............Municipality and employerLength of paternity leave ...........................................................2 weeks
within the first 14 weeks after birthPaternity leave benefits (% of wages paid) ....................................100
(or paternity leave benefit equivalent to the unemployment benefit rate)
Daycare options ......................................................................Public and private daycare with allowance; homecare with allowance
DenmarkGender Gap Index 2011 (out of 135 countries) 7 0.778 13 0.767 1 1.000 68 0.974 10 0.370
Gender Gap Index 2010 (out of 134 countries) 7 0.772 23 0.744 1 1.000 68 0.974 10 0.370
Gender Gap Index 2009 (out of 134 countries) 7 0.763 20 0.748 1 1.000 102 0.970 11 0.334
Gender Gap Index 2008 (out of 130 countries) 7 0.754 28 0.712 1 1.000 97 0.970 10 0.334
Gender Gap Index 2007 (out of 128 countries) 8 0.752 18 0.734 1 1.000 96 0.970 13 0.305
Gender Gap Index 2006 (out of 115 countries) 8 0.746 19 0.708 1 1.000 76 0.972 13 0.305

Female-to-male ratio
0.00 = INEQUALITY 1.00 = EQUALITY 1.50
0.00 = INEQUALITY 1.00 = EQUALITY 1.50
0.00 = INEQUALITY 1.00 = EQUALITY 1.50
0.00 = INEQUALITY 1.00 = EQUALITY 1.50
Female-to-male ratio
Female-to-male ratio
Female-to-male ratio
160 Country Profiles Global Gender Gap Report 2011
Sample Female-to- Rank Score average Female Male male ratio
country score sample average
0.00 = inequality 1.00 = equality
0.00
0.20
0.40
0.60
0.80
1.00Economy
Education
Politics
Health
Rank Score(out of 135 countries) (0.00 = inequality, 1.00 = equality)
Gender Gap Subindexes
Economic Participation and Opportunity ......... 92 0.597 0.588
Labour force participation .................................... 93 0.65 0.68 55 84 0.65
Wage equality for similar work (survey) .......... 112 0.56 0.65 — — 0.56
Estimated earned income (PPP US$) ................. 94 0.49 0.52 5,533 11,306 0.49
Legislators, senior officials, and managers ...... 54 0.44 0.26 31 69 0.44
Professional and technical workers .................... 1 1.00 0.64 51 49 1.04
Educational Attainment .......................................... 1 1.000 0.928
Literacy rate .............................................................. 1 1.00 0.86 88 88 1.00
Enrolment in primary education ............................ 1 1.00 0.98 80 80 1.01
Enrolment in secondary education ....................... 1 1.00 0.90 63 52 1.22
Enrolment in tertiary education ............................. 1 1.00 0.86 41 26 1.59
Health and Survival ............................................... 88 0.971 0.956
Sex ratio at birth (female/male) ............................. 1 0.94 0.92 — — 0.96
Healthy life expectancy ........................................ 93 1.03 1.04 64 62 1.03
Political Empowerment ........................................ 80 0.105 0.185
Women in parliament ............................................ 51 0.26 0.22 21 79 0.26
Women in ministerial positions ........................... 97 0.10 0.18 9 91 0.10
Years with female head of state (last 50) .......... 52 0.00 0.16 0 50 0.00
Dominican RepublicGender Gap Index 2011 81 0.668
Key Indicators
Total population (millions) 10.23
Population growth (%) 1.33
GDP (US$ billions) 40.20
GDP (PPP) per capita 8,142
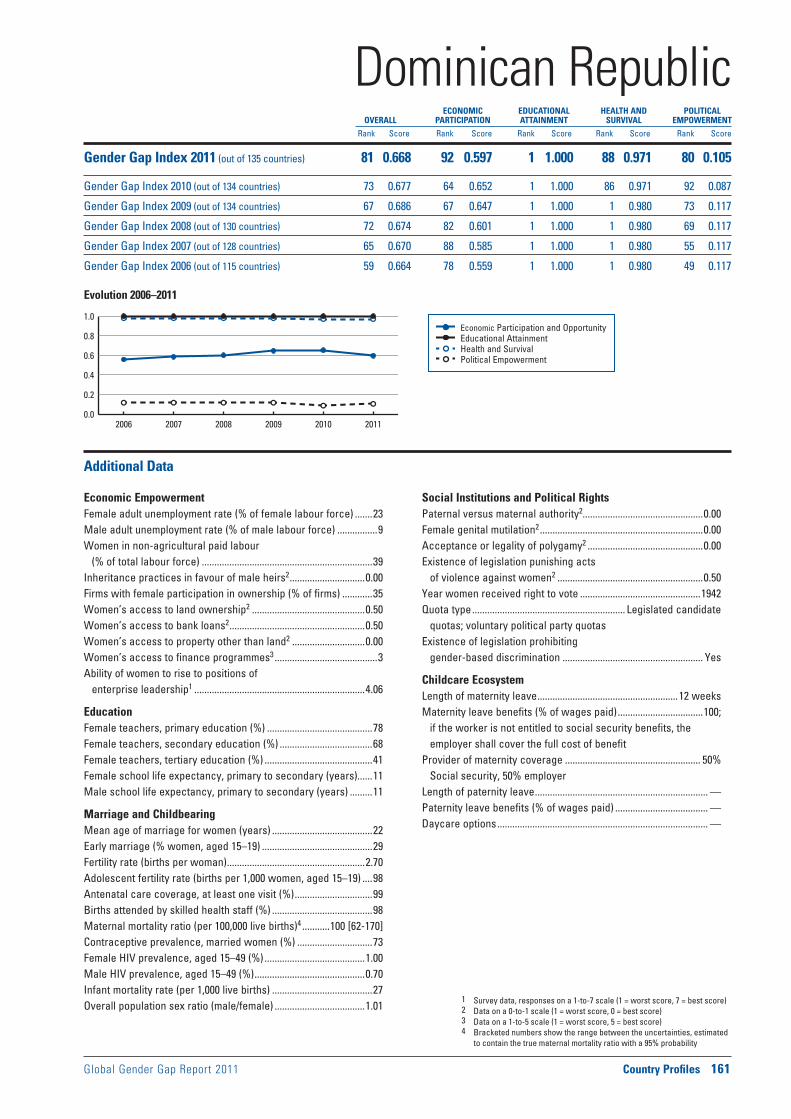
Global Gender Gap Report 2011 Country Profiles 161
Economic Participation and Opportunity Educational Attainment Health and Survival Political Empowerment
Evolution 2006–2011
1 Survey data, responses on a 1-to-7 scale (1 = worst score, 7 = best score)2 Data on a 0-to-1 scale (1 = worst score, 0 = best score)3 Data on a 1-to-5 scale (1 = worst score, 5 = best score)4 Bracketed numbers show the range between the uncertainties, estimated
to contain the true maternal mortality ratio with a 95% probability
ECONOMIC EDUCATIONAL HEALTH AND POLITICAL OVERALL PARTICIPATION ATTAINMENT SURVIVAL EMPOWERMENT
Rank Score Rank Score Rank Score Rank Score Rank Score
0.0
0.2
0.4
0.6
0.8
1.0
2006 2007 2008 2009 2010 2011
Additional Data
Economic EmpowermentFemale adult unemployment rate (% of female labour force) .......23Male adult unemployment rate (% of male labour force) ................9Women in non-agricultural paid labour
(% of total labour force) ....................................................................39Inheritance practices in favour of male heirs2 ..............................0.00Firms with female participation in ownership (% of firms) ............35Women’s access to land ownership2 .............................................0.50Women’s access to bank loans2 ......................................................0.50Women’s access to property other than land2 .............................0.00Women’s access to finance programmes3 .........................................3Ability of women to rise to positions of
enterprise leadership1 ....................................................................4.06
EducationFemale teachers, primary education (%) ..........................................78Female teachers, secondary education (%) .....................................68Female teachers, tertiary education (%) ...........................................41Female school life expectancy, primary to secondary (years)......11Male school life expectancy, primary to secondary (years) .........11
Marriage and ChildbearingMean age of marriage for women (years) ........................................22Early marriage (% women, aged 15–19) ............................................29Fertility rate (births per woman) .......................................................2.70Adolescent fertility rate (births per 1,000 women, aged 15–19) ....98Antenatal care coverage, at least one visit (%) ...............................99Births attended by skilled health staff (%) ........................................98Maternal mortality ratio (per 100,000 live births)4 ...........100 [62-170]Contraceptive prevalence, married women (%) ..............................73Female HIV prevalence, aged 15–49 (%) ........................................1.00Male HIV prevalence, aged 15–49 (%) ............................................0.70Infant mortality rate (per 1,000 live births) ........................................27Overall population sex ratio (male/female) ....................................1.01
Social Institutions and Political RightsPaternal versus maternal authority2................................................0.00Female genital mutilation2 .................................................................0.00Acceptance or legality of polygamy2 ..............................................0.00Existence of legislation punishing acts
of violence against women2 ..........................................................0.50Year women received right to vote ................................................1942Quota type ............................................................. Legislated candidate
quotas; voluntary political party quotasExistence of legislation prohibiting
gender-based discrimination ........................................................ Yes
Childcare EcosystemLength of maternity leave ........................................................12 weeksMaternity leave benefits (% of wages paid) ..................................100;
if the worker is not entitled to social security benefits, the employer shall cover the full cost of benefit
Provider of maternity coverage ...................................................... 50% Social security, 50% employer
Length of paternity leave ..................................................................... —Paternity leave benefits (% of wages paid) ..................................... —Daycare options .................................................................................... —
Dominican RepublicGender Gap Index 2011 (out of 135 countries) 81 0.668 92 0.597 1 1.000 88 0.971 80 0.105
Gender Gap Index 2010 (out of 134 countries) 73 0.677 64 0.652 1 1.000 86 0.971 92 0.087
Gender Gap Index 2009 (out of 134 countries) 67 0.686 67 0.647 1 1.000 1 0.980 73 0.117
Gender Gap Index 2008 (out of 130 countries) 72 0.674 82 0.601 1 1.000 1 0.980 69 0.117
Gender Gap Index 2007 (out of 128 countries) 65 0.670 88 0.585 1 1.000 1 0.980 55 0.117
Gender Gap Index 2006 (out of 115 countries) 59 0.664 78 0.559 1 1.000 1 0.980 49 0.117
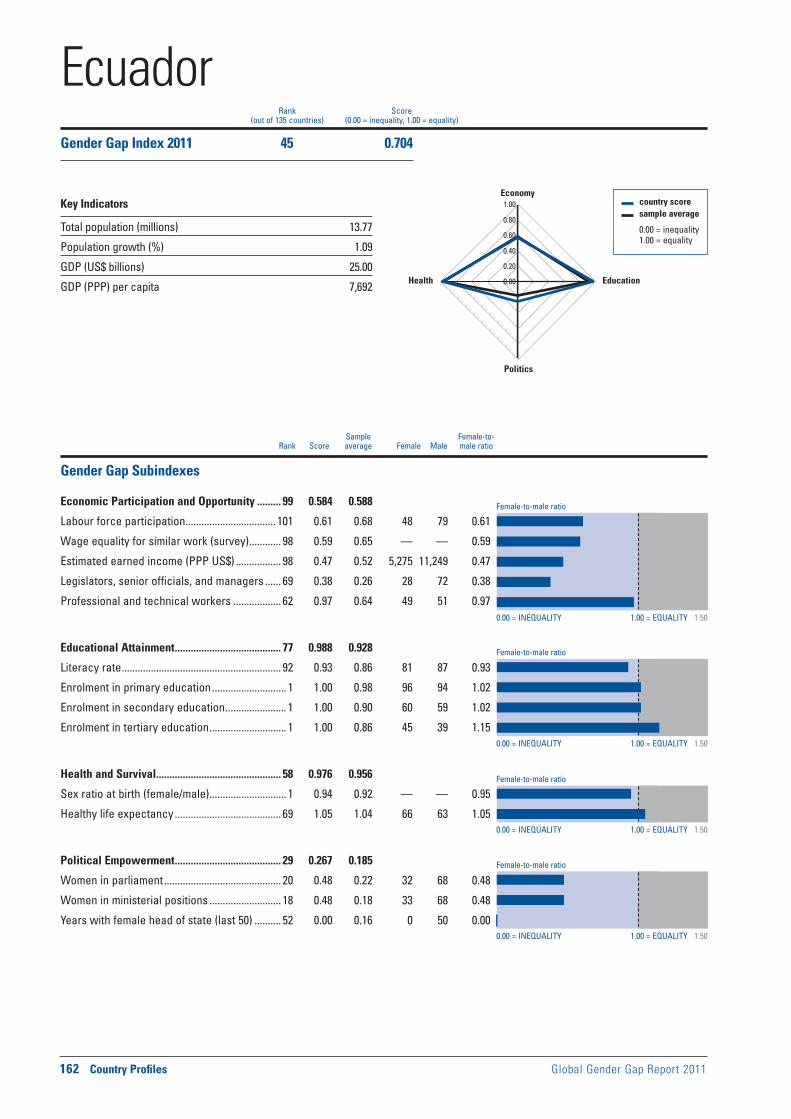
Female-to-male ratio
0.00 = INEQUALITY 1.00 = EQUALITY 1.50
0.00 = INEQUALITY 1.00 = EQUALITY 1.50
0.00 = INEQUALITY 1.00 = EQUALITY 1.50
0.00 = INEQUALITY 1.00 = EQUALITY 1.50
Female-to-male ratio
Female-to-male ratio
Female-to-male ratio
162 Country Profiles Global Gender Gap Report 2011
Sample Female-to- Rank Score average Female Male male ratio
country score sample average
0.00 = inequality 1.00 = equality
0.00
0.20
0.40
0.60
0.80
1.00Economy
Education
Politics
Health
Rank Score(out of 135 countries) (0.00 = inequality, 1.00 = equality)
Gender Gap Subindexes
Economic Participation and Opportunity ......... 99 0.584 0.588
Labour force participation .................................. 101 0.61 0.68 48 79 0.61
Wage equality for similar work (survey) ............ 98 0.59 0.65 — — 0.59
Estimated earned income (PPP US$) ................. 98 0.47 0.52 5,275 11,249 0.47
Legislators, senior officials, and managers ...... 69 0.38 0.26 28 72 0.38
Professional and technical workers .................. 62 0.97 0.64 49 51 0.97
Educational Attainment ........................................ 77 0.988 0.928
Literacy rate ............................................................ 92 0.93 0.86 81 87 0.93
Enrolment in primary education ............................ 1 1.00 0.98 96 94 1.02
Enrolment in secondary education ....................... 1 1.00 0.90 60 59 1.02
Enrolment in tertiary education ............................. 1 1.00 0.86 45 39 1.15
Health and Survival ............................................... 58 0.976 0.956
Sex ratio at birth (female/male) ............................. 1 0.94 0.92 — — 0.95
Healthy life expectancy ........................................ 69 1.05 1.04 66 63 1.05
Political Empowerment ........................................ 29 0.267 0.185
Women in parliament ............................................ 20 0.48 0.22 32 68 0.48
Women in ministerial positions ........................... 18 0.48 0.18 33 68 0.48
Years with female head of state (last 50) .......... 52 0.00 0.16 0 50 0.00
EcuadorGender Gap Index 2011 45 0.704
Key Indicators
Total population (millions) 13.77
Population growth (%) 1.09
GDP (US$ billions) 25.00
GDP (PPP) per capita 7,692

Global Gender Gap Report 2011 Country Profiles 163
Economic Participation and Opportunity Educational Attainment Health and Survival Political Empowerment
Evolution 2006–2011
1 Survey data, responses on a 1-to-7 scale (1 = worst score, 7 = best score)2 Data on a 0-to-1 scale (1 = worst score, 0 = best score)3 Data on a 1-to-5 scale (1 = worst score, 5 = best score)4 Bracketed numbers show the range between the uncertainties, estimated
to contain the true maternal mortality ratio with a 95% probability
ECONOMIC EDUCATIONAL HEALTH AND POLITICAL OVERALL PARTICIPATION ATTAINMENT SURVIVAL EMPOWERMENT
Rank Score Rank Score Rank Score Rank Score Rank Score
0.0
0.2
0.4
0.6
0.8
1.0
2006 2007 2008 2009 2010 2011
Additional Data
Economic EmpowermentFemale adult unemployment rate (% of female labour force) .........8Male adult unemployment rate (% of male labour force) ................6Women in non-agricultural paid labour
(% of total labour force) ....................................................................39Inheritance practices in favour of male heirs2 ..............................0.00Firms with female participation in ownership (% of firms) ........... —Women’s access to land ownership2 .............................................0.00Women’s access to bank loans2 ......................................................0.50Women’s access to property other than land2 .............................0.00Women’s access to finance programmes3 .........................................2Ability of women to rise to positions of
enterprise leadership1 ....................................................................4.22
EducationFemale teachers, primary education (%) ..........................................63Female teachers, secondary education (%) .....................................63Female teachers, tertiary education (%) ...........................................31Female school life expectancy, primary to secondary (years)......12Male school life expectancy, primary to secondary (years) .........11
Marriage and ChildbearingMean age of marriage for women (years) ........................................22Early marriage (% women, aged 15–19) ............................................22Fertility rate (births per woman) .......................................................2.60Adolescent fertility rate (births per 1,000 women, aged 15–19) ....92Antenatal care coverage, at least one visit (%) ...............................84Births attended by skilled health staff (%) ........................................80Maternal mortality ratio (per 100,000 live births)4 ...........140 [81-230]Contraceptive prevalence, married women (%) ..............................73Female HIV prevalence, aged 15–49 (%) ........................................0.30Male HIV prevalence, aged 15–49 (%) ............................................0.60Infant mortality rate (per 1,000 live births) ........................................20Overall population sex ratio (male/female) ....................................1.00
Social Institutions and Political RightsPaternal versus maternal authority2................................................0.00Female genital mutilation2 .................................................................0.00Acceptance or legality of polygamy2 ..............................................0.00Existence of legislation punishing acts
of violence against women2 ..........................................................0.17Year women received right to vote ................................................1929Quota type ............................................................. Legislated candidate
quotas; voluntary political party quotasExistence of legislation prohibiting
gender-based discrimination .......................................................... —
Childcare EcosystemLength of maternity leave ........................................................12 weeksMaternity leave benefits (% of wages paid) ...................................100Provider of maternity coverage ...................................................... 75%
Social security, 25% employerLength of paternity leave ..................................................................... —Paternity leave benefits (% of wages paid) ..................................... —Daycare options .................................................................................... —
EcuadorGender Gap Index 2011 (out of 135 countries) 45 0.704 99 0.584 77 0.988 58 0.976 29 0.267
Gender Gap Index 2010 (out of 134 countries) 40 0.707 90 0.599 78 0.988 57 0.976 28 0.267
Gender Gap Index 2009 (out of 134 countries) 23 0.722 77 0.630 45 0.996 1 0.980 21 0.283
Gender Gap Index 2008 (out of 130 countries) 35 0.709 74 0.623 52 0.995 1 0.980 28 0.238
Gender Gap Index 2007 (out of 128 countries) 44 0.688 65 0.634 42 0.994 1 0.980 44 0.145
Gender Gap Index 2006 (out of 115 countries) 82 0.643 92 0.499 39 0.994 1 0.980 64 0.100

Female-to-male ratio
0.00 = INEQUALITY 1.00 = EQUALITY 1.50
0.00 = INEQUALITY 1.00 = EQUALITY 1.50
0.00 = INEQUALITY 1.00 = EQUALITY 1.50
0.00 = INEQUALITY 1.00 = EQUALITY 1.50
Female-to-male ratio
Female-to-male ratio
Female-to-male ratio
164 Country Profiles Global Gender Gap Report 2011
Sample Female-to- Rank Score average Female Male male ratio
country score sample average
0.00 = inequality 1.00 = equality
0.00
0.20
0.40
0.60
0.80
1.00Economy
Education
Politics
Health
Rank Score(out of 135 countries) (0.00 = inequality, 1.00 = equality)
Gender Gap Subindexes
Economic Participation and Opportunity ....... 122 0.457 0.588
Labour force participation .................................. 131 0.30 0.68 24 79 0.30
Wage equality for similar work (survey) .............. 1 0.85 0.65 — — 0.85
Estimated earned income (PPP US$) ............... 127 0.24 0.52 2,167 9,138 0.24
Legislators, senior officials, and managers .... 105 0.12 0.26 11 89 0.12
Professional and technical workers .................. 97 0.51 0.64 34 66 0.51
Educational Attainment ...................................... 110 0.908 0.928
Literacy rate .......................................................... 117 0.77 0.86 58 75 0.77
Enrolment in primary education ........................ 113 0.97 0.98 92 95 0.97
Enrolment in secondary education ..................... 96 0.97 0.90 64 66 0.97
Enrolment in tertiary education ......................... 105 0.77 0.86 24 31 0.77
Health and Survival ............................................... 52 0.977 0.956
Sex ratio at birth (female/male) ............................. 1 0.94 0.92 — — 0.95
Healthy life expectancy ........................................ 64 1.05 1.04 62 59 1.05
Political Empowerment ...................................... 126 0.031 0.185
Women in parliament .......................................... 128 0.02 0.22 2 98 0.02
Women in ministerial positions ........................... 93 0.10 0.18 9 91 0.10
Years with female head of state (last 50) .......... 52 0.00 0.16 0 50 0.00
EgyptGender Gap Index 2011 123 0.593
Key Indicators
Total population (millions) 84.47
Population growth (%) 1.76
GDP (US$ billions) 164.09
GDP (PPP) per capita 5,451

Global Gender Gap Report 2011 Country Profiles 165
Economic Participation and Opportunity Educational Attainment Health and Survival Political Empowerment
Evolution 2006–2011
1 Survey data, responses on a 1-to-7 scale (1 = worst score, 7 = best score)2 Data on a 0-to-1 scale (1 = worst score, 0 = best score)3 Data on a 1-to-5 scale (1 = worst score, 5 = best score)4 Bracketed numbers show the range between the uncertainties, estimated
to contain the true maternal mortality ratio with a 95% probability
ECONOMIC EDUCATIONAL HEALTH AND POLITICAL OVERALL PARTICIPATION ATTAINMENT SURVIVAL EMPOWERMENT
Rank Score Rank Score Rank Score Rank Score Rank Score
0.0
0.2
0.4
0.6
0.8
1.0
2006 2007 2008 2009 2010 2011
Additional Data
Economic EmpowermentFemale adult unemployment rate (% of female labour force) .......23Male adult unemployment rate (% of male labour force) ................6Women in non-agricultural paid labour
(% of total labour force) ....................................................................19Inheritance practices in favour of male heirs2 ..............................0.50Firms with female participation in ownership (% of firms) ............16Women’s access to land ownership2 .............................................0.00Women’s access to bank loans2 ......................................................0.00Women’s access to property other than land2 .............................0.00Women’s access to finance programmes3 .........................................4Ability of women to rise to positions of
enterprise leadership1 ....................................................................5.25
EducationFemale teachers, primary education (%) ..........................................56Female teachers, secondary education (%) .....................................42Female teachers, tertiary education (%) .......................................... —Female school life expectancy, primary to secondary (years)......10Male school life expectancy, primary to secondary (years) .........10
Marriage and ChildbearingMean age of marriage for women (years) ........................................23Early marriage (% women, aged 15–19) ............................................15Fertility rate (births per woman) .......................................................2.90Adolescent fertility rate (births per 1,000 women, aged 15–19) ....50Antenatal care coverage, at least one visit (%) ...............................74Births attended by skilled health staff (%) ........................................79Maternal mortality ratio (per 100,000 live births)4 .............82 [51-130]Contraceptive prevalence, married women (%) ..............................60Female HIV prevalence, aged 15–49 (%) ......................................<0.10Male HIV prevalence, aged 15–49 (%) ..........................................<0.10Infant mortality rate (per 1,000 live births) ........................................18Overall population sex ratio (male/female) ....................................1.01
Social Institutions and Political RightsPaternal versus maternal authority2................................................0.50Female genital mutilation2 .................................................................0.90Acceptance or legality of polygamy2 ..............................................0.00Existence of legislation punishing acts
of violence against women2 ..........................................................0.75Year women received right to vote ................................................1956Quota type ...............................Reserved seats at single/lower houseExistence of legislation prohibiting
gender-based discrimination .......................................................... —
Childcare EcosystemLength of maternity leave ........................................................... 90 daysMaternity leave benefits (% of wages paid) ...................................100Provider of maternity coverage Social security (75%) and employer
(25%)Length of paternity leave ..................................................................... —Paternity leave benefits (% of wages paid) ..................................... —Daycare options .................................................................................... —
EgyptGender Gap Index 2011 (out of 135 countries) 123 0.593 122 0.457 110 0.908 52 0.977 126 0.031
Gender Gap Index 2010 (out of 134 countries) 125 0.590 121 0.453 110 0.899 52 0.977 125 0.031
Gender Gap Index 2009 (out of 134 countries) 126 0.586 124 0.450 107 0.900 89 0.972 129 0.023
Gender Gap Index 2008 (out of 130 countries) 124 0.583 120 0.437 105 0.902 84 0.972 124 0.023
Gender Gap Index 2007 (out of 128 countries) 120 0.581 120 0.421 101 0.909 83 0.972 123 0.022
Gender Gap Index 2006 (out of 115 countries) 109 0.579 108 0.416 90 0.903 66 0.974 111 0.022
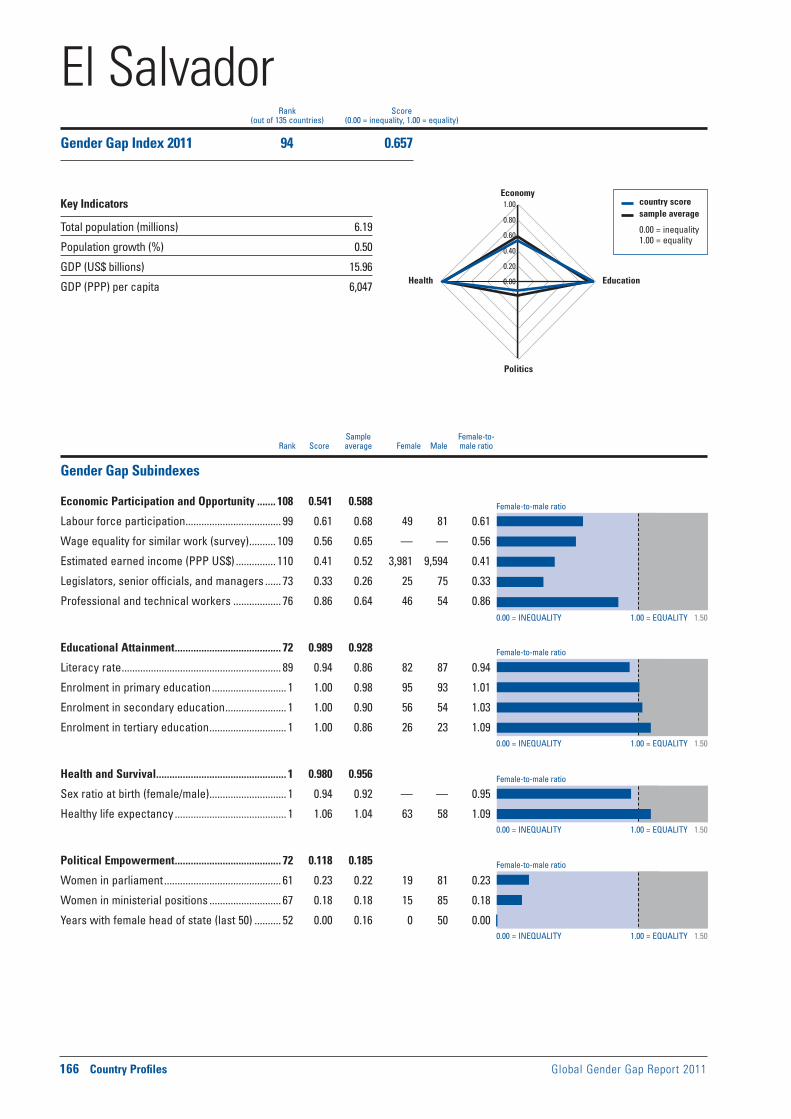
Female-to-male ratio
0.00 = INEQUALITY 1.00 = EQUALITY 1.50
0.00 = INEQUALITY 1.00 = EQUALITY 1.50
0.00 = INEQUALITY 1.00 = EQUALITY 1.50
0.00 = INEQUALITY 1.00 = EQUALITY 1.50
Female-to-male ratio
Female-to-male ratio
Female-to-male ratio
166 Country Profiles Global Gender Gap Report 2011
Sample Female-to- Rank Score average Female Male male ratio
country score sample average
0.00 = inequality 1.00 = equality
0.00
0.20
0.40
0.60
0.80
1.00Economy
Education
Politics
Health
Rank Score(out of 135 countries) (0.00 = inequality, 1.00 = equality)
Gender Gap Subindexes
Economic Participation and Opportunity ....... 108 0.541 0.588
Labour force participation .................................... 99 0.61 0.68 49 81 0.61
Wage equality for similar work (survey) .......... 109 0.56 0.65 — — 0.56
Estimated earned income (PPP US$) ............... 110 0.41 0.52 3,981 9,594 0.41
Legislators, senior officials, and managers ...... 73 0.33 0.26 25 75 0.33
Professional and technical workers .................. 76 0.86 0.64 46 54 0.86
Educational Attainment ........................................ 72 0.989 0.928
Literacy rate ............................................................ 89 0.94 0.86 82 87 0.94
Enrolment in primary education ............................ 1 1.00 0.98 95 93 1.01
Enrolment in secondary education ....................... 1 1.00 0.90 56 54 1.03
Enrolment in tertiary education ............................. 1 1.00 0.86 26 23 1.09
Health and Survival ................................................. 1 0.980 0.956
Sex ratio at birth (female/male) ............................. 1 0.94 0.92 — — 0.95
Healthy life expectancy .......................................... 1 1.06 1.04 63 58 1.09
Political Empowerment ........................................ 72 0.118 0.185
Women in parliament ............................................ 61 0.23 0.22 19 81 0.23
Women in ministerial positions ........................... 67 0.18 0.18 15 85 0.18
Years with female head of state (last 50) .......... 52 0.00 0.16 0 50 0.00
El SalvadorGender Gap Index 2011 94 0.657
Key Indicators
Total population (millions) 6.19
Population growth (%) 0.50
GDP (US$ billions) 15.96
GDP (PPP) per capita 6,047

Global Gender Gap Report 2011 Country Profiles 167
Economic Participation and Opportunity Educational Attainment Health and Survival Political Empowerment
Evolution 2006–2011
1 Survey data, responses on a 1-to-7 scale (1 = worst score, 7 = best score)2 Data on a 0-to-1 scale (1 = worst score, 0 = best score)3 Data on a 1-to-5 scale (1 = worst score, 5 = best score)4 Bracketed numbers show the range between the uncertainties, estimated
to contain the true maternal mortality ratio with a 95% probability
ECONOMIC EDUCATIONAL HEALTH AND POLITICAL OVERALL PARTICIPATION ATTAINMENT SURVIVAL EMPOWERMENT
Rank Score Rank Score Rank Score Rank Score Rank Score
0.0
0.2
0.4
0.6
0.8
1.0
2006 2007 2008 2009 2010 2011
Additional Data
Economic EmpowermentFemale adult unemployment rate (% of female labour force) .........4Male adult unemployment rate (% of male labour force) ................7Women in non-agricultural paid labour
(% of total labour force) ....................................................................48Inheritance practices in favour of male heirs2 ..............................0.00Firms with female participation in ownership (% of firms) ........... —Women’s access to land ownership2 .............................................0.50Women’s access to bank loans2 ......................................................0.00Women’s access to property other than land2 .............................0.00Women’s access to finance programmes3 .........................................1Ability of women to rise to positions of
enterprise leadership1 ....................................................................4.14
EducationFemale teachers, primary education (%) ..........................................73Female teachers, secondary education (%) .....................................52Female teachers, tertiary education (%) ...........................................34Female school life expectancy, primary to secondary (years)......11Male school life expectancy, primary to secondary (years) .........11
Marriage and ChildbearingMean age of marriage for women (years) ........................................23Early marriage (% women, aged 15–19) ............................................16Fertility rate (births per woman) .......................................................2.30Adolescent fertility rate (births per 1,000 women, aged 15–19) ....68Antenatal care coverage, at least one visit (%) ...............................94Births attended by skilled health staff (%) ........................................84Maternal mortality ratio (per 100,000 live births)4 ...........110 [71-170]Contraceptive prevalence, married women (%) ..............................73Female HIV prevalence, aged 15–49 (%) ........................................0.50Male HIV prevalence, aged 15–49 (%) ............................................1.20Infant mortality rate (per 1,000 live births) ........................................15Overall population sex ratio (male/female) ....................................0.89
Social Institutions and Political RightsPaternal versus maternal authority2................................................0.00Female genital mutilation2 .................................................................0.00Acceptance or legality of polygamy2 ..............................................0.00Existence of legislation punishing acts
of violence against women2 ..........................................................0.17Year women received right to vote ................................................1939Quota type ..........................................................................No legislated;
voluntary political party quotasExistence of legislation prohibiting
gender-based discrimination .......................................................... —
Childcare EcosystemLength of maternity leave ........................................................12 weeksMaternity leave benefits (% of wages paid) .....................................75Provider of maternity coverage Social security for insured workers,
otherwise employer must payLength of paternity leave ..................................................................... —Paternity leave benefits (% of wages paid) ..................................... —Daycare options .................................................................................... —
El SalvadorGender Gap Index 2011 (out of 135 countries) 94 0.657 108 0.541 72 0.989 1 0.980 72 0.118
Gender Gap Index 2010 (out of 134 countries) 90 0.660 102 0.553 79 0.988 1 0.980 73 0.118
Gender Gap Index 2009 (out of 134 countries) 55 0.694 98 0.579 81 0.988 1 0.980 32 0.230
Gender Gap Index 2008 (out of 130 countries) 58 0.688 97 0.563 78 0.988 1 0.980 32 0.219
Gender Gap Index 2007 (out of 128 countries) 48 0.685 91 0.576 66 0.988 1 0.980 26 0.197
Gender Gap Index 2006 (out of 115 countries) 39 0.684 73 0.570 59 0.988 1 0.980 24 0.197

Female-to-male ratio
0.00 = INEQUALITY 1.00 = EQUALITY 1.50
0.00 = INEQUALITY 1.00 = EQUALITY 1.50
0.00 = INEQUALITY 1.00 = EQUALITY 1.50
0.00 = INEQUALITY 1.00 = EQUALITY 1.50
Female-to-male ratio
Female-to-male ratio
Female-to-male ratio
168 Country Profiles Global Gender Gap Report 2011
Sample Female-to- Rank Score average Female Male male ratio
country score sample average
0.00 = inequality 1.00 = equality
0.00
0.20
0.40
0.60
0.80
1.00Economy
Education
Politics
Health
Rank Score(out of 135 countries) (0.00 = inequality, 1.00 = equality)
Gender Gap Subindexes
Economic Participation and Opportunity ......... 35 0.720 0.588
Labour force participation .................................... 24 0.89 0.68 69 78 0.89
Wage equality for similar work (survey) ............ 74 0.65 0.65 — — 0.65
Estimated earned income (PPP US$) ................. 52 0.62 0.52 15,318 24,808 0.62
Legislators, senior officials, and managers ...... 27 0.57 0.26 36 64 0.57
Professional and technical workers .................... 1 1.00 0.64 68 32 2.15
Educational Attainment ........................................ 38 0.997 0.928
Literacy rate .............................................................. 1 1.00 0.86 100 100 1.00
Enrolment in primary education .......................... 83 0.99 0.98 94 95 0.99
Enrolment in secondary education ....................... 1 1.00 0.90 91 88 1.03
Enrolment in tertiary education ............................. 1 1.00 0.86 80 48 1.69
Health and Survival ............................................... 51 0.977 0.956
Sex ratio at birth (female/male) ......................... 116 0.94 0.92 — — 0.94
Healthy life expectancy .......................................... 1 1.06 1.04 71 61 1.16
Political Empowerment ........................................ 87 0.099 0.185
Women in parliament ............................................ 58 0.25 0.22 20 80 0.25
Women in ministerial positions ........................... 98 0.09 0.18 8 92 0.09
Years with female head of state (last 50) .......... 52 0.00 0.16 0 50 0.00
EstoniaGender Gap Index 2011 52 0.698
Key Indicators
Total population (millions) 1.34
Population growth (%) –0.01
GDP (US$ billions) 8.25
GDP (PPP) per capita 16,346

Global Gender Gap Report 2011 Country Profiles 169
Economic Participation and Opportunity Educational Attainment Health and Survival Political Empowerment
Evolution 2006–2011
1 Survey data, responses on a 1-to-7 scale (1 = worst score, 7 = best score)2 Data on a 0-to-1 scale (1 = worst score, 0 = best score)3 Data on a 1-to-5 scale (1 = worst score, 5 = best score)4 Bracketed numbers show the range between the uncertainties, estimated
to contain the true maternal mortality ratio with a 95% probability
ECONOMIC EDUCATIONAL HEALTH AND POLITICAL OVERALL PARTICIPATION ATTAINMENT SURVIVAL EMPOWERMENT
Rank Score Rank Score Rank Score Rank Score Rank Score
0.0
0.2
0.4
0.6
0.8
1.0
2006 2007 2008 2009 2010 2011
Additional Data
Economic EmpowermentFemale adult unemployment rate (% of female labour force) .......11Male adult unemployment rate (% of male labour force) ................6Women in non-agricultural paid labour
(% of total labour force) ....................................................................52Inheritance practices in favour of male heirs2 ................................ —Firms with female participation in ownership (% of firms) ........... —Women’s access to land ownership2 ............................................... —Women’s access to bank loans2 ........................................................ —Women’s access to property other than land2 ............................... —Women’s access to finance programmes3 .........................................5Ability of women to rise to positions of
enterprise leadership1 ....................................................................5.11
EducationFemale teachers, primary education (%) ..........................................94Female teachers, secondary education (%) .....................................78Female teachers, tertiary education (%) ...........................................48Female school life expectancy, primary to secondary (years)......12Male school life expectancy, primary to secondary (years) .........12
Marriage and ChildbearingMean age of marriage for women (years) ........................................24Early marriage (% women, aged 15–19) ........................................... —Fertility rate (births per woman) .......................................................1.70Adolescent fertility rate (births per 1,000 women, aged 15–19) ....25Antenatal care coverage, at least one visit (%) .............................. —Births attended by skilled health staff (%) ......................................100Maternal mortality ratio (per 100,000 live births)4 .................12 [9-14]Contraceptive prevalence, married women (%) ..............................70Female HIV prevalence, aged 15–49 (%) ........................................0.80Male HIV prevalence, aged 15–49 (%) ............................................1.70Infant mortality rate (per 1,000 live births) ..........................................4Overall population sex ratio (male/female) ....................................0.86
Social Institutions and Political RightsPaternal versus maternal authority2.................................................. —Female genital mutilation2 ................................................................... —Acceptance or legality of polygamy2 ................................................ —Existence of legislation punishing acts
of violence against women2 ............................................................ —Year women received right to vote ................................................1918Quota type .............................................................................................. —Existence of legislation prohibiting
gender-based discrimination ........................................................ Yes
Childcare EcosystemLength of maternity leave ........................................ 140 calendar daysMaternity leave benefits (% of wages paid) ...................................100Provider of maternity coverage .....................Health Insurance FundLength of paternity leave .................................................. 2 weeks; can
be used during the 2 months before birth or during the 2 months after birth
Paternity leave benefits (% of wages paid) ............................ Paid on the basis of the father’s average wages, up to a ceiling
Daycare options ..............................................................Public daycare with allowance; private daycare with and without allowance; homecare without allowance
EstoniaGender Gap Index 2011 (out of 135 countries) 52 0.698 35 0.720 38 0.997 51 0.977 87 0.099
Gender Gap Index 2010 (out of 134 countries) 47 0.702 35 0.719 38 0.997 50 0.977 74 0.114
Gender Gap Index 2009 (out of 134 countries) 37 0.709 36 0.705 37 0.998 41 0.979 50 0.156
Gender Gap Index 2008 (out of 130 countries) 37 0.708 33 0.700 48 0.995 38 0.979 48 0.156
Gender Gap Index 2007 (out of 128 countries) 30 0.701 34 0.694 20 0.999 37 0.979 51 0.131
Gender Gap Index 2006 (out of 115 countries) 29 0.694 27 0.682 16 0.999 36 0.979 51 0.117
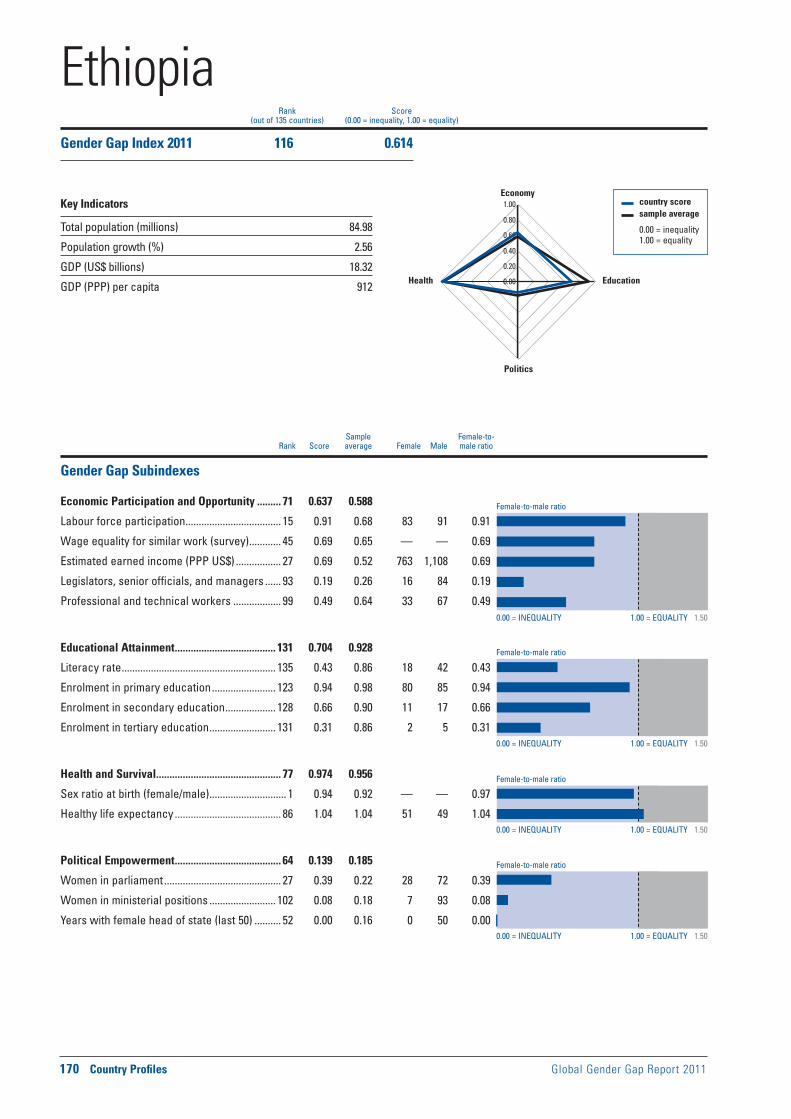
Female-to-male ratio
0.00 = INEQUALITY 1.00 = EQUALITY 1.50
0.00 = INEQUALITY 1.00 = EQUALITY 1.50
0.00 = INEQUALITY 1.00 = EQUALITY 1.50
0.00 = INEQUALITY 1.00 = EQUALITY 1.50
Female-to-male ratio
Female-to-male ratio
Female-to-male ratio
170 Country Profiles Global Gender Gap Report 2011
Sample Female-to- Rank Score average Female Male male ratio
country score sample average
0.00 = inequality 1.00 = equality
0.00
0.20
0.40
0.60
0.80
1.00Economy
Education
Politics
Health
Rank Score(out of 135 countries) (0.00 = inequality, 1.00 = equality)
Gender Gap Subindexes
Economic Participation and Opportunity ......... 71 0.637 0.588
Labour force participation .................................... 15 0.91 0.68 83 91 0.91
Wage equality for similar work (survey) ............ 45 0.69 0.65 — — 0.69
Estimated earned income (PPP US$) ................. 27 0.69 0.52 763 1,108 0.69
Legislators, senior officials, and managers ...... 93 0.19 0.26 16 84 0.19
Professional and technical workers .................. 99 0.49 0.64 33 67 0.49
Educational Attainment ...................................... 131 0.704 0.928
Literacy rate .......................................................... 135 0.43 0.86 18 42 0.43
Enrolment in primary education ........................ 123 0.94 0.98 80 85 0.94
Enrolment in secondary education ................... 128 0.66 0.90 11 17 0.66
Enrolment in tertiary education ......................... 131 0.31 0.86 2 5 0.31
Health and Survival ............................................... 77 0.974 0.956
Sex ratio at birth (female/male) ............................. 1 0.94 0.92 — — 0.97
Healthy life expectancy ........................................ 86 1.04 1.04 51 49 1.04
Political Empowerment ........................................ 64 0.139 0.185
Women in parliament ............................................ 27 0.39 0.22 28 72 0.39
Women in ministerial positions ......................... 102 0.08 0.18 7 93 0.08
Years with female head of state (last 50) .......... 52 0.00 0.16 0 50 0.00
EthiopiaGender Gap Index 2011 116 0.614
Key Indicators
Total population (millions) 84.98
Population growth (%) 2.56
GDP (US$ billions) 18.32
GDP (PPP) per capita 912

Global Gender Gap Report 2011 Country Profiles 171
Economic Participation and Opportunity Educational Attainment Health and Survival Political Empowerment
Evolution 2006–2011
1 Survey data, responses on a 1-to-7 scale (1 = worst score, 7 = best score)2 Data on a 0-to-1 scale (1 = worst score, 0 = best score)3 Data on a 1-to-5 scale (1 = worst score, 5 = best score)4 Bracketed numbers show the range between the uncertainties, estimated
to contain the true maternal mortality ratio with a 95% probability
ECONOMIC EDUCATIONAL HEALTH AND POLITICAL OVERALL PARTICIPATION ATTAINMENT SURVIVAL EMPOWERMENT
Rank Score Rank Score Rank Score Rank Score Rank Score
0.0
0.2
0.4
0.6
0.8
1.0
2006 2007 2008 2009 2010 2011
Additional Data
Economic EmpowermentFemale adult unemployment rate (% of female labour force) .......30Male adult unemployment rate (% of male labour force) ..............12Women in non-agricultural paid labour
(% of total labour force) ....................................................................47Inheritance practices in favour of male heirs2 ..............................0.50Firms with female participation in ownership (% of firms) ........... —Women’s access to land ownership2 .............................................0.50Women’s access to bank loans2 ......................................................1.00Women’s access to property other than land2 .............................0.50Women’s access to finance programmes3 .........................................2Ability of women to rise to positions of
enterprise leadership1 ....................................................................4.78
EducationFemale teachers, primary education (%) ..........................................38Female teachers, secondary education (%) .....................................19Female teachers, tertiary education (%) .............................................8Female school life expectancy, primary to secondary (years)........8Male school life expectancy, primary to secondary (years) ...........9
Marriage and ChildbearingMean age of marriage for women (years) ........................................21Early marriage (% women, aged 15–19) ............................................30Fertility rate (births per woman) .......................................................5.30Adolescent fertility rate (births per 1,000 women, aged 15–19) ..109Antenatal care coverage, at least one visit (%) ...............................28Births attended by skilled health staff (%) ..........................................6Maternal mortality ratio (per 100,000 live births)4 .........470 [270-790]Contraceptive prevalence, married women (%) ..............................15Female HIV prevalence, aged 15–49 (%) .......................................... —Male HIV prevalence, aged 15–49 (%) .............................................. —Infant mortality rate (per 1,000 live births) ........................................67Overall population sex ratio (male/female) ....................................0.99
Social Institutions and Political RightsPaternal versus maternal authority2................................................0.50Female genital mutilation2 .................................................................0.80Acceptance or legality of polygamy2 ..............................................0.00Existence of legislation punishing acts
of violence against women2 ..........................................................0.75Year women received right to vote ................................................1955Quota type .............................................................................................. —Existence of legislation prohibiting
gender-based discrimination ........................................................ Yes
Childcare EcosystemLength of maternity leave ........................................................... 90 daysMaternity leave benefits (% of wages paid) ...................................100Provider of maternity coverage ............Employer (for up to 45 days)Length of paternity leave ........................................... 5 days after birthPaternity leave benefits (% of wages paid) .............................Unpaid Daycare options .................................................................................... —
EthiopiaGender Gap Index 2011 (out of 135 countries) 116 0.614 71 0.637 131 0.704 77 0.974 64 0.139
Gender Gap Index 2010 (out of 134 countries) 121 0.602 74 0.632 129 0.700 75 0.974 82 0.102
Gender Gap Index 2009 (out of 134 countries) 122 0.595 91 0.598 130 0.700 106 0.969 74 0.113
Gender Gap Index 2008 (out of 130 countries) 122 0.587 96 0.565 126 0.700 101 0.969 70 0.113
Gender Gap Index 2007 (out of 128 countries) 113 0.599 86 0.585 121 0.740 100 0.969 68 0.102
Gender Gap Index 2006 (out of 115 countries) 100 0.595 74 0.568 108 0.739 87 0.969 61 0.102
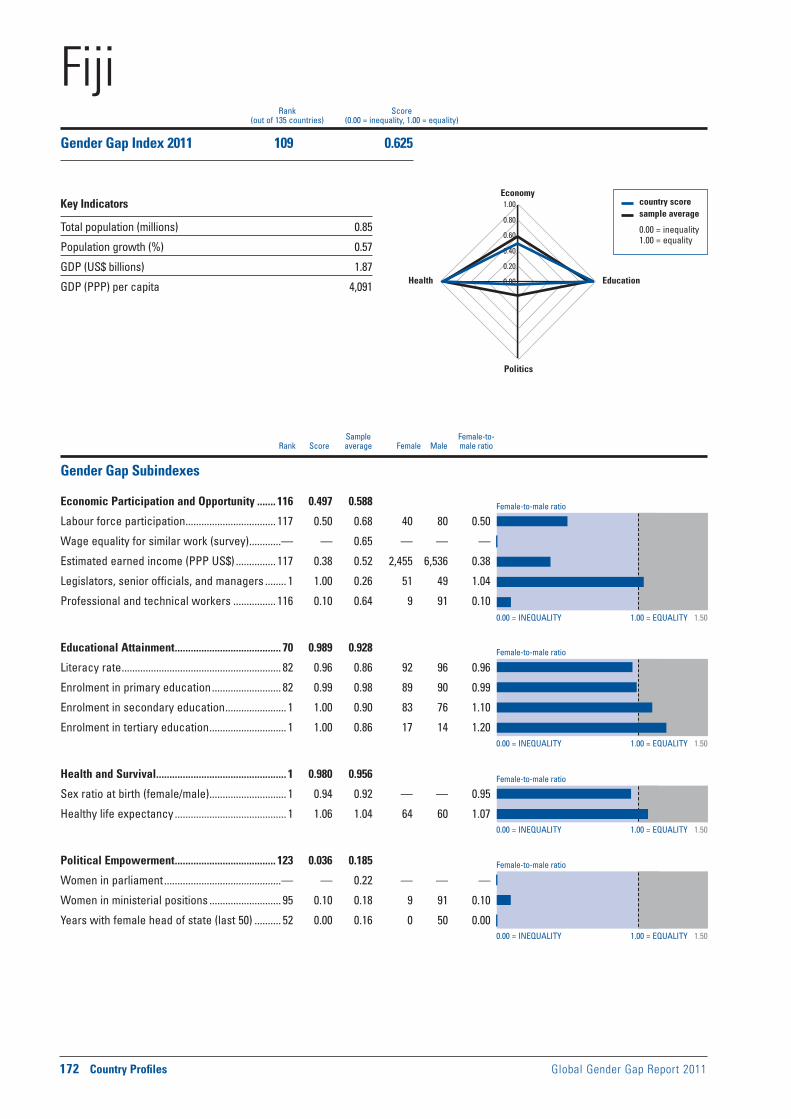
Female-to-male ratio
0.00 = INEQUALITY 1.00 = EQUALITY 1.50
0.00 = INEQUALITY 1.00 = EQUALITY 1.50
0.00 = INEQUALITY 1.00 = EQUALITY 1.50
0.00 = INEQUALITY 1.00 = EQUALITY 1.50
Female-to-male ratio
Female-to-male ratio
Female-to-male ratio
172 Country Profiles Global Gender Gap Report 2011
Sample Female-to- Rank Score average Female Male male ratio
country score sample average
0.00 = inequality 1.00 = equality
0.00
0.20
0.40
0.60
0.80
1.00Economy
Education
Politics
Health
Rank Score(out of 135 countries) (0.00 = inequality, 1.00 = equality)
Gender Gap Subindexes
Economic Participation and Opportunity ....... 116 0.497 0.588
Labour force participation .................................. 117 0.50 0.68 40 80 0.50
Wage equality for similar work (survey) ............— — 0.65 — — —
Estimated earned income (PPP US$) ............... 117 0.38 0.52 2,455 6,536 0.38
Legislators, senior officials, and managers ........ 1 1.00 0.26 51 49 1.04
Professional and technical workers ................ 116 0.10 0.64 9 91 0.10
Educational Attainment ........................................ 70 0.989 0.928
Literacy rate ............................................................ 82 0.96 0.86 92 96 0.96
Enrolment in primary education .......................... 82 0.99 0.98 89 90 0.99
Enrolment in secondary education ....................... 1 1.00 0.90 83 76 1.10
Enrolment in tertiary education ............................. 1 1.00 0.86 17 14 1.20
Health and Survival ................................................. 1 0.980 0.956
Sex ratio at birth (female/male) ............................. 1 0.94 0.92 — — 0.95
Healthy life expectancy .......................................... 1 1.06 1.04 64 60 1.07
Political Empowerment ...................................... 123 0.036 0.185
Women in parliament ............................................— — 0.22 — — —
Women in ministerial positions ........................... 95 0.10 0.18 9 91 0.10
Years with female head of state (last 50) .......... 52 0.00 0.16 0 50 0.00
FijiGender Gap Index 2011 109 0.625
Key Indicators
Total population (millions) 0.85
Population growth (%) 0.57
GDP (US$ billions) 1.87
GDP (PPP) per capita 4,091
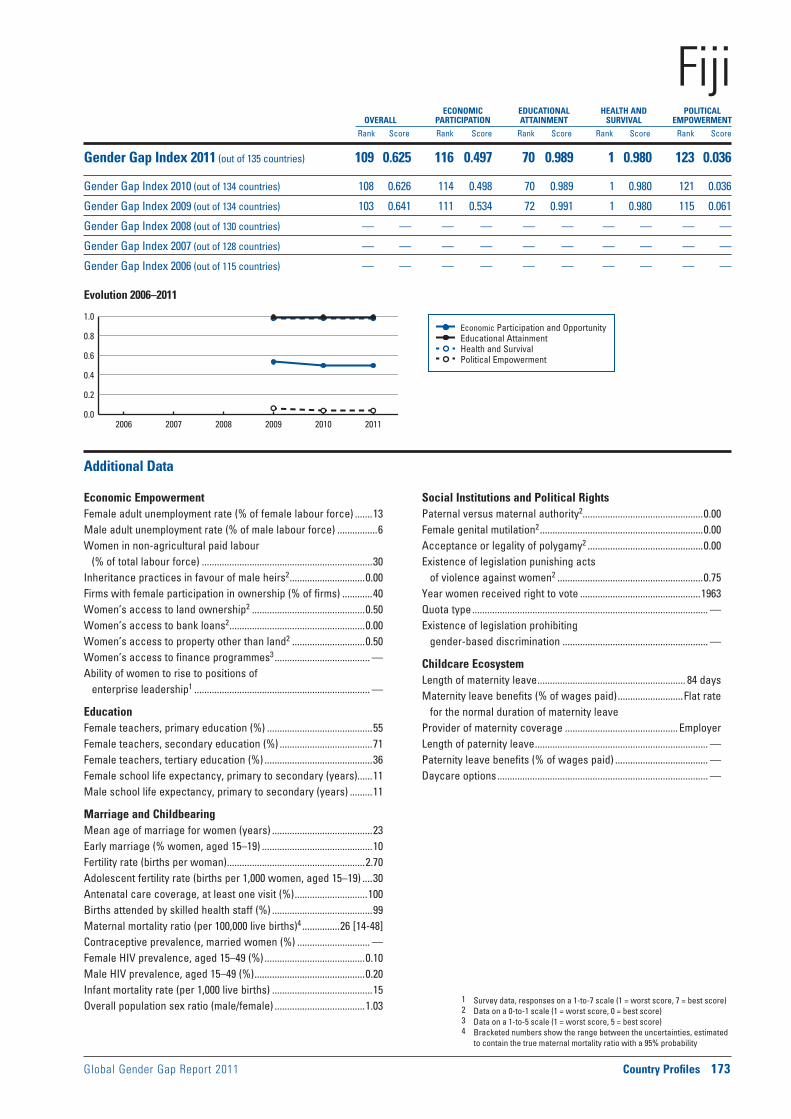
Global Gender Gap Report 2011 Country Profiles 173
Economic Participation and Opportunity Educational Attainment Health and Survival Political Empowerment
Evolution 2006–2011
1 Survey data, responses on a 1-to-7 scale (1 = worst score, 7 = best score)2 Data on a 0-to-1 scale (1 = worst score, 0 = best score)3 Data on a 1-to-5 scale (1 = worst score, 5 = best score)4 Bracketed numbers show the range between the uncertainties, estimated
to contain the true maternal mortality ratio with a 95% probability
ECONOMIC EDUCATIONAL HEALTH AND POLITICAL OVERALL PARTICIPATION ATTAINMENT SURVIVAL EMPOWERMENT
Rank Score Rank Score Rank Score Rank Score Rank Score
0.0
0.2
0.4
0.6
0.8
1.0
2006 2007 2008 2009 2010 2011
Additional Data
Economic EmpowermentFemale adult unemployment rate (% of female labour force) .......13Male adult unemployment rate (% of male labour force) ................6Women in non-agricultural paid labour
(% of total labour force) ....................................................................30Inheritance practices in favour of male heirs2 ..............................0.00Firms with female participation in ownership (% of firms) ............40Women’s access to land ownership2 .............................................0.50Women’s access to bank loans2 ......................................................0.00Women’s access to property other than land2 .............................0.50Women’s access to finance programmes3 ...................................... —Ability of women to rise to positions of
enterprise leadership1 ...................................................................... —
EducationFemale teachers, primary education (%) ..........................................55Female teachers, secondary education (%) .....................................71Female teachers, tertiary education (%) ...........................................36Female school life expectancy, primary to secondary (years)......11Male school life expectancy, primary to secondary (years) .........11
Marriage and ChildbearingMean age of marriage for women (years) ........................................23Early marriage (% women, aged 15–19) ............................................10Fertility rate (births per woman) .......................................................2.70Adolescent fertility rate (births per 1,000 women, aged 15–19) ....30Antenatal care coverage, at least one visit (%) .............................100Births attended by skilled health staff (%) ........................................99Maternal mortality ratio (per 100,000 live births)4 ...............26 [14-48]Contraceptive prevalence, married women (%) ............................. —Female HIV prevalence, aged 15–49 (%) ........................................0.10Male HIV prevalence, aged 15–49 (%) ............................................0.20Infant mortality rate (per 1,000 live births) ........................................15Overall population sex ratio (male/female) ....................................1.03
Social Institutions and Political RightsPaternal versus maternal authority2................................................0.00Female genital mutilation2 .................................................................0.00Acceptance or legality of polygamy2 ..............................................0.00Existence of legislation punishing acts
of violence against women2 ..........................................................0.75Year women received right to vote ................................................1963Quota type .............................................................................................. —Existence of legislation prohibiting
gender-based discrimination .......................................................... —
Childcare EcosystemLength of maternity leave ........................................................... 84 daysMaternity leave benefits (% of wages paid) ..........................Flat rate
for the normal duration of maternity leaveProvider of maternity coverage .............................................EmployerLength of paternity leave ..................................................................... —Paternity leave benefits (% of wages paid) ..................................... —Daycare options .................................................................................... —
FijiGender Gap Index 2011 (out of 135 countries) 109 0.625 116 0.497 70 0.989 1 0.980 123 0.036
Gender Gap Index 2010 (out of 134 countries) 108 0.626 114 0.498 70 0.989 1 0.980 121 0.036
Gender Gap Index 2009 (out of 134 countries) 103 0.641 111 0.534 72 0.991 1 0.980 115 0.061
Gender Gap Index 2008 (out of 130 countries) — — — — — — — — — —
Gender Gap Index 2007 (out of 128 countries) — — — — — — — — — —
Gender Gap Index 2006 (out of 115 countries) — — — — — — — — — —
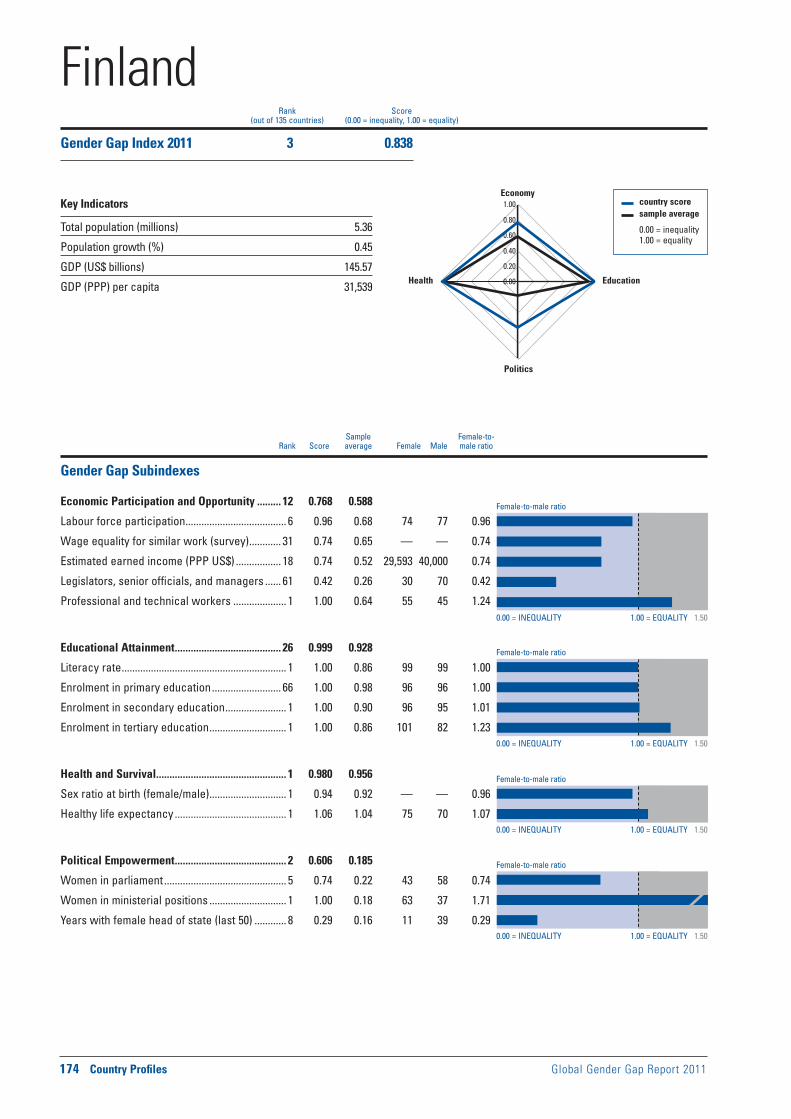
Gender Gap Subindexes
Economic Participation and Opportunity ......... 12 0.768 0.588
Labour force participation ...................................... 6 0.96 0.68 74 77 0.96
Wage equality for similar work (survey) ............ 31 0.74 0.65 — — 0.74
Estimated earned income (PPP US$) ................. 18 0.74 0.52 29,593 40,000 0.74
Legislators, senior officials, and managers ...... 61 0.42 0.26 30 70 0.42
Professional and technical workers .................... 1 1.00 0.64 55 45 1.24
Educational Attainment ........................................ 26 0.999 0.928
Literacy rate .............................................................. 1 1.00 0.86 99 99 1.00
Enrolment in primary education .......................... 66 1.00 0.98 96 96 1.00
Enrolment in secondary education ....................... 1 1.00 0.90 96 95 1.01
Enrolment in tertiary education ............................. 1 1.00 0.86 101 82 1.23
Health and Survival ................................................. 1 0.980 0.956
Sex ratio at birth (female/male) ............................. 1 0.94 0.92 — — 0.96
Healthy life expectancy .......................................... 1 1.06 1.04 75 70 1.07
Political Empowerment .......................................... 2 0.606 0.185
Women in parliament .............................................. 5 0.74 0.22 43 58 0.74
Women in ministerial positions ............................. 1 1.00 0.18 63 37 1.71
Years with female head of state (last 50) ............ 8 0.29 0.16 11 39 0.29
Female-to-male ratio
0.00 = INEQUALITY 1.00 = EQUALITY 1.50
0.00 = INEQUALITY 1.00 = EQUALITY 1.50
0.00 = INEQUALITY 1.00 = EQUALITY 1.50
0.00 = INEQUALITY 1.00 = EQUALITY 1.50
Female-to-male ratio
Female-to-male ratio
Female-to-male ratio
174 Country Profiles Global Gender Gap Report 2011
FinlandGender Gap Index 2011 3 0.838
Key Indicators
Total population (millions) 5.36
Population growth (%) 0.45
GDP (US$ billions) 145.57
GDP (PPP) per capita 31,539
Sample Female-to- Rank Score average Female Male male ratio
country score sample average
0.00 = inequality 1.00 = equality
0.00
0.20
0.40
0.60
0.80
1.00Economy
Education
Politics
Health
Rank Score(out of 135 countries) (0.00 = inequality, 1.00 = equality)

Global Gender Gap Report 2011 Country Profiles 175
Economic Participation and Opportunity Educational Attainment Health and Survival Political Empowerment
Evolution 2006–2011
1 Survey data, responses on a 1 - to 7 scale (1 = worst score, 7 = best score)2 Data on a 0-to-1 scale (1 = worst score, 0 = best score)3 Data on a 1-to-5 scale (1 = worst score, 5 = best score)4 Bracketed numbers show the range between the uncertainties, estimated
to contain the true maternal mortality ratio with a 95% probability
ECONOMIC EDUCATIONAL HEALTH AND POLITICAL OVERALL PARTICIPATION ATTAINMENT SURVIVAL EMPOWERMENT
Rank Score Rank Score Rank Score Rank Score Rank Score
0.0
0.2
0.4
0.6
0.8
1.0
2006 2007 2008 2009 2010 2011
Additional Data
Economic EmpowermentFemale adult unemployment rate (% of female labour force) .........8Male adult unemployment rate (% of male labour force) ................6Women in non-agricultural paid labour
(% of total labour force) ....................................................................51Inheritance practices in favour of male heirs2 ................................ —Firms with female participation in ownership (% of firms) ........... —Women’s access to land ownership2 ............................................... —Women’s access to bank loans2 ........................................................ —Women’s access to property other than land2 ............................... —Women’s access to finance programmes3 .........................................5Ability of women to rise to positions of
enterprise leadership1 ....................................................................5.66
EducationFemale teachers, primary education (%) ..........................................78Female teachers, secondary education (%) .....................................64Female teachers, tertiary education (%) ...........................................51Female school life expectancy, primary to secondary (years)......13Male school life expectancy, primary to secondary (years) .........12
Marriage and ChildbearingMean age of marriage for women (years) ........................................30Early marriage (% women, aged 15–19) ........................................... —Fertility rate (births per woman) .......................................................1.80Adolescent fertility rate (births per 1,000 women, aged 15–19) ......9Antenatal care coverage, at least one visit (%) .............................100Births attended by skilled health staff (%) ......................................100Maternal mortality ratio (per 100,000 live births)4 .....................8 [7-8]Contraceptive prevalence, married women (%) ..............................77Female HIV prevalence, aged 15–49 (%) ........................................0.10Male HIV prevalence, aged 15–49 (%) ............................................0.10Infant mortality rate (per 1,000 live births) ..........................................3Overall population sex ratio (male/female) ....................................0.96
Social Institutions and Political RightsPaternal versus maternal authority2.................................................. —Female genital mutilation2 ................................................................... —Acceptance or legality of polygamy2 ................................................ —Existence of legislation punishing acts
of violence against women2 ............................................................ —Year women received right to vote ................................................1906Quota type .............................................................................................. —Existence of legislation prohibiting
gender-based discrimination .......................................................... —
Childcare EcosystemLength of maternity leave ..........................................105 working daysMaternity leave benefits (% of wages paid) ....................................70;
the amount of benefit varies based on income and employment conditions, but there is a minimum flat rate
Provider of maternity coverage ..................Social insurance systemLength of paternity leave ................................................. Up to 18 days
after birth; can be taken in up to 4 separate periods. Fathers can also take a full month of paternity leave (‘daddy month´), between 13 and 36 working days; mothers not eligible for Maternity or Parental Allowance during the daddy month
Paternity leave benefits (% of wages paid) ...... Approximately 79%; minimum allowance
Daycare options ................................................................Public/private daycare, homecare, with and without allowance
FinlandGender Gap Index 2011 (out of 135 countries) 3 0.838 12 0.768 26 0.999 1 0.980 2 0.606
Gender Gap Index 2010 (out of 134 countries) 3 0.826 16 0.757 28 0.999 1 0.980 2 0.569
Gender Gap Index 2009 (out of 134 countries) 2 0.825 15 0.750 1 1.000 1 0.980 2 0.571
Gender Gap Index 2008 (out of 130 countries) 2 0.820 19 0.741 1 1.000 1 0.980 1 0.558
Gender Gap Index 2007 (out of 128 countries) 3 0.804 22 0.723 21 0.999 1 0.980 2 0.517
Gender Gap Index 2006 (out of 115 countries) 3 0.796 8 0.734 18 0.999 1 0.980 3 0.470

Female-to-male ratio
0.00 = INEQUALITY 1.00 = EQUALITY 1.50
0.00 = INEQUALITY 1.00 = EQUALITY 1.50
0.00 = INEQUALITY 1.00 = EQUALITY 1.50
0.00 = INEQUALITY 1.00 = EQUALITY 1.50
Female-to-male ratio
Female-to-male ratio
Female-to-male ratio
176 Country Profiles Global Gender Gap Report 2011
Sample Female-to- Rank Score average Female Male male ratio
country score sample average
0.00 = inequality 1.00 = equality
0.00
0.20
0.40
0.60
0.80
1.00Economy
Education
Politics
Health
Rank Score(out of 135 countries) (0.00 = inequality, 1.00 = equality)
Gender Gap Subindexes
Economic Participation and Opportunity ......... 61 0.659 0.588
Labour force participation .................................... 37 0.87 0.68 65 75 0.87
Wage equality for similar work (survey) .......... 131 0.43 0.65 — — 0.43
Estimated earned income (PPP US$) ................. 45 0.65 0.52 25,870 40,000 0.65
Legislators, senior officials, and managers ...... 20 0.63 0.26 39 61 0.63
Professional and technical workers .................. 63 0.97 0.64 49 51 0.97
Educational Attainment .......................................... 1 1.000 0.928
Literacy rate .............................................................. 1 1.00 0.86 99 99 1.00
Enrolment in primary education ............................ 1 1.00 0.98 99 98 1.00
Enrolment in secondary education ....................... 1 1.00 0.90 100 98 1.02
Enrolment in tertiary education ............................. 1 1.00 0.86 62 49 1.28
Health and Survival ................................................. 1 0.980 0.956
Sex ratio at birth (female/male) ............................. 1 0.94 0.92 — — 0.95
Healthy life expectancy .......................................... 1 1.06 1.04 76 71 1.07
Political Empowerment ........................................ 46 0.169 0.185
Women in parliament ............................................ 63 0.23 0.22 19 81 0.23
Women in ministerial positions ........................... 34 0.36 0.18 26 74 0.36
Years with female head of state (last 50) .......... 39 0.02 0.16 1 49 0.02
FranceGender Gap Index 2011 48 0.702
Key Indicators
Total population (millions) 64.88
Population growth (%) 0.52
GDP (US$ billions) 1,484.69
GDP (PPP) per capita 29,648

Global Gender Gap Report 2011 Country Profiles 177
Economic Participation and Opportunity Educational Attainment Health and Survival Political Empowerment
Evolution 2006–2011
1 Survey data, responses on a 1-to-7 scale (1 = worst score, 7 = best score)2 Data on a 0-to-1 scale (1 = worst score, 0 = best score)3 Data on a 1-to-5 scale (1 = worst score, 5 = best score)4 Bracketed numbers show the range between the uncertainties, estimated
to contain the true maternal mortality ratio with a 95% probability
ECONOMIC EDUCATIONAL HEALTH AND POLITICAL OVERALL PARTICIPATION ATTAINMENT SURVIVAL EMPOWERMENT
Rank Score Rank Score Rank Score Rank Score Rank Score
0.0
0.2
0.4
0.6
0.8
1.0
2006 2007 2008 2009 2010 2011
Additional Data
Economic EmpowermentFemale adult unemployment rate (% of female labour force) .........9Male adult unemployment rate (% of male labour force) ................7Women in non-agricultural paid labour
(% of total labour force) ....................................................................49Inheritance practices in favour of male heirs2 ................................ —Firms with female participation in ownership (% of firms) ........... —Women’s access to land ownership2 ............................................... —Women’s access to bank loans2 ........................................................ —Women’s access to property other than land2 ............................... —Women’s access to finance programmes3 .........................................5Ability of women to rise to positions of
enterprise leadership1 ....................................................................3.48
EducationFemale teachers, primary education (%) ..........................................82Female teachers, secondary education (%) .....................................59Female teachers, tertiary education (%) ...........................................39Female school life expectancy, primary to secondary (years)......13Male school life expectancy, primary to secondary (years) .........13
Marriage and ChildbearingMean age of marriage for women (years) ........................................32Early marriage (% women, aged 15–19) ........................................... —Fertility rate (births per woman) .......................................................1.90Adolescent fertility rate (births per 1,000 women, aged 15–19) ....11Antenatal care coverage, at least one visit (%) .............................100Births attended by skilled health staff (%) ........................................99Maternal mortality ratio (per 100,000 live births)4 ...................8 [5-14]Contraceptive prevalence, married women (%) ..............................82Female HIV prevalence, aged 15–49 (%) ........................................0.30Male HIV prevalence, aged 15–49 (%) ............................................0.50Infant mortality rate (per 1,000 live births) ..........................................3Overall population sex ratio (male/female) ....................................0.95
Social Institutions and Political RightsPaternal versus maternal authority2.................................................. —Female genital mutilation2 ................................................................... —Acceptance or legality of polygamy2 ................................................ —Existence of legislation punishing acts
of violence against women2 ............................................................ —Year women received right to vote ................................................1944Quota type ............................................................. Legislated candidate
quotas; voluntary political party quotasExistence of legislation prohibiting
gender-based discrimination .......................................................... —
Childcare EcosystemLength of maternity leave ........................................................16 weeksMaternity leave benefits (% of wages paid) ....... 100, up to a ceilingProvider of maternity coverage ...................................Social securityLength of paternity leave ..................................................................... —Paternity leave benefits (% of wages paid) ..................................... —Daycare options .................................................................................... —
FranceGender Gap Index 2011 (out of 135 countries) 48 0.702 61 0.659 1 1.000 1 0.980 46 0.169
Gender Gap Index 2010 (out of 134 countries) 46 0.703 60 0.661 1 1.000 1 0.980 47 0.169
Gender Gap Index 2009 (out of 134 countries) 18 0.733 61 0.659 1 1.000 1 0.980 16 0.294
Gender Gap Index 2008 (out of 130 countries) 15 0.734 53 0.663 1 1.000 1 0.980 18 0.294
Gender Gap Index 2007 (out of 128 countries) 51 0.682 61 0.646 1 1.000 1 0.980 67 0.104
Gender Gap Index 2006 (out of 115 countries) 70 0.652 88 0.525 1 1.000 1 0.980 60 0.104

Female-to-male ratio
0.00 = INEQUALITY 1.00 = EQUALITY 1.50
0.00 = INEQUALITY 1.00 = EQUALITY 1.50
0.00 = INEQUALITY 1.00 = EQUALITY 1.50
0.00 = INEQUALITY 1.00 = EQUALITY 1.50
Female-to-male ratio
Female-to-male ratio
Female-to-male ratio
178 Country Profiles Global Gender Gap Report 2011
Sample Female-to- Rank Score average Female Male male ratio
country score sample average
0.00 = inequality 1.00 = equality
0.00
0.20
0.40
0.60
0.80
1.00Economy
Education
Politics
Health
Rank Score(out of 135 countries) (0.00 = inequality, 1.00 = equality)
Gender Gap Subindexes
Economic Participation and Opportunity ......... 19 0.756 0.588
Labour force participation .................................... 49 0.84 0.68 71 85 0.84
Wage equality for similar work (survey) .............. 9 0.79 0.65 — — 0.79
Estimated earned income (PPP US$) ................. 50 0.64 0.52 1,102 1,733 0.64
Legislators, senior officials, and managers ......— — 0.26 — — —
Professional and technical workers ..................— — 0.64 — — —
Educational Attainment ...................................... 122 0.832 0.928
Literacy rate .......................................................... 127 0.62 0.86 36 58 0.62
Enrolment in primary education ............................ 1 1.00 0.98 68 66 1.03
Enrolment in secondary education ..................... 89 0.98 0.90 41 42 0.98
Enrolment in tertiary education ......................... 133 0.23 0.86 0 2 0.23
Health and Survival ................................................. 1 0.980 0.956
Sex ratio at birth (female/male) ............................. 1 0.94 0.92 — — 0.97
Healthy life expectancy .......................................... 1 1.06 1.04 53 50 1.06
Political Empowerment ........................................ 66 0.137 0.185
Women in parliament .......................................... 119 0.08 0.22 8 93 0.08
Women in ministerial positions ........................... 21 0.45 0.18 31 69 0.45
Years with female head of state (last 50) .......... 52 0.00 0.16 0 50 0.00
Gambia, TheGender Gap Index 2011 77 0.676
Key Indicators
Total population (millions) 1.75
Population growth (%) 2.63
GDP (US$ billions) 0.61
GDP (PPP) per capita 1,249

Global Gender Gap Report 2011 Country Profiles 179
Economic Participation and Opportunity Educational Attainment Health and Survival Political Empowerment
Evolution 2006–2011
1 Survey data, responses on a 1-to-7 scale (1 = worst score, 7 = best score)2 Data on a 0-to-1 scale (1 = worst score, 0 = best score)3 Data on a 1-to-5 scale (1 = worst score, 5 = best score)4 Bracketed numbers show the range between the uncertainties, estimated
to contain the true maternal mortality ratio with a 95% probability
ECONOMIC EDUCATIONAL HEALTH AND POLITICAL OVERALL PARTICIPATION ATTAINMENT SURVIVAL EMPOWERMENT
Rank Score Rank Score Rank Score Rank Score Rank Score
0.0
0.2
0.4
0.6
0.8
1.0
2006 2007 2008 2009 2010 2011
Additional Data
Economic EmpowermentFemale adult unemployment rate (% of female labour force) ...... —Male adult unemployment rate (% of male labour force) ............. —Women in non-agricultural paid labour
(% of total labour force) ....................................................................21Inheritance practices in favour of male heirs2 ..............................0.50Firms with female participation in ownership (% of firms) ............28Women’s access to land ownership2 .............................................0.50Women’s access to bank loans2 ......................................................0.00Women’s access to property other than land2 .............................0.50Women’s access to finance programmes3 ...................................... —Ability of women to rise to positions of
enterprise leadership1 ....................................................................5.67
EducationFemale teachers, primary education (%) ..........................................33Female teachers, secondary education (%) .....................................17Female teachers, tertiary education (%) .............................................6Female school life expectancy, primary to secondary (years)........8Male school life expectancy, primary to secondary (years) ...........9
Marriage and ChildbearingMean age of marriage for women (years) ........................................20Early marriage (% women, aged 15–19) ............................................39Fertility rate (births per woman) .......................................................5.10Adolescent fertility rate (births per 1,000 women, aged 15–19) ..104Antenatal care coverage, at least one visit (%) ...............................98Births attended by skilled health staff (%) ........................................57Maternal mortality ratio (per 100,000 live births)4 .........400 [190-910]Contraceptive prevalence, married women (%) ..............................18Female HIV prevalence, aged 15–49 (%) ........................................2.40Male HIV prevalence, aged 15–49 (%) ............................................1.70Infant mortality rate (per 1,000 live births) ........................................78Overall population sex ratio (male/female) ....................................0.98
Social Institutions and Political RightsPaternal versus maternal authority2................................................1.00Female genital mutilation2 .................................................................0.70Acceptance or legality of polygamy2 ..............................................1.00Existence of legislation punishing acts
of violence against women2 ..........................................................0.50Year women received right to vote ................................................1960Quota type .............................................................................................. —Existence of legislation prohibiting
gender-based discrimination .......................................................... —
Childcare EcosystemLength of maternity leave ........................................................12 weeksMaternity leave benefits (% of wages paid) ...................................100Provider of maternity coverage .............................................EmployerLength of paternity leave ..................................................................... —Paternity leave benefits (% of wages paid) ..................................... —Daycare options .................................................................................... —
Gambia, TheGender Gap Index 2011 (out of 135 countries) 77 0.676 19 0.756 122 0.832 1 0.980 66 0.137
Gender Gap Index 2010 (out of 134 countries) 75 0.676 14 0.759 121 0.829 1 0.980 62 0.138
Gender Gap Index 2009 (out of 134 countries) 75 0.675 23 0.741 119 0.853 1 0.980 68 0.127
Gender Gap Index 2008 (out of 130 countries) 85 0.662 32 0.706 118 0.836 1 0.980 63 0.127
Gender Gap Index 2007 (out of 128 countries) 95 0.642 37 0.687 117 0.808 1 0.980 73 0.094
Gender Gap Index 2006 (out of 115 countries) 79 0.645 25 0.688 106 0.809 64 0.974 55 0.109

Female-to-male ratio
0.00 = INEQUALITY 1.00 = EQUALITY 1.50
0.00 = INEQUALITY 1.00 = EQUALITY 1.50
0.00 = INEQUALITY 1.00 = EQUALITY 1.50
0.00 = INEQUALITY 1.00 = EQUALITY 1.50
Female-to-male ratio
Female-to-male ratio
Female-to-male ratio
180 Country Profiles Global Gender Gap Report 2011
Sample Female-to- Rank Score average Female Male male ratio
country score sample average
0.00 = inequality 1.00 = equality
0.00
0.20
0.40
0.60
0.80
1.00Economy
Education
Politics
Health
Rank Score(out of 135 countries) (0.00 = inequality, 1.00 = equality)
Gender Gap Subindexes
Economic Participation and Opportunity ......... 54 0.672 0.588
Labour force participation .................................... 71 0.76 0.68 59 78 0.76
Wage equality for similar work (survey) ............ 22 0.76 0.65 — — 0.76
Estimated earned income (PPP US$) ............... 115 0.39 0.52 2,771 7,030 0.39
Legislators, senior officials, and managers ...... 37 0.51 0.26 34 66 0.51
Professional and technical workers .................... 1 1.00 0.64 62 38 1.62
Educational Attainment ........................................ 67 0.990 0.928
Literacy rate ............................................................ 47 1.00 0.86 100 100 1.00
Enrolment in primary education ........................ 106 0.98 0.98 98 100 0.98
Enrolment in secondary education ....................... 1 1.00 0.90 77 77 1.01
Enrolment in tertiary education ............................. 1 1.00 0.86 28 23 1.23
Health and Survival ............................................. 128 0.948 0.956
Sex ratio at birth (female/male) ......................... 129 0.90 0.92 — — 0.90
Healthy life expectancy .......................................... 1 1.06 1.04 67 62 1.08
Political Empowerment ...................................... 120 0.039 0.185
Women in parliament .......................................... 120 0.07 0.22 7 94 0.07
Women in ministerial positions ......................... 118 0.06 0.18 6 94 0.06
Years with female head of state (last 50) .......... 46 0.01 0.16 0 50 0.01
GeorgiaGender Gap Index 2011 86 0.662
Key Indicators
Total population (millions) 4.45
Population growth (%) 0.95
GDP (US$ billions) 5.60
GDP (PPP) per capita 4,550
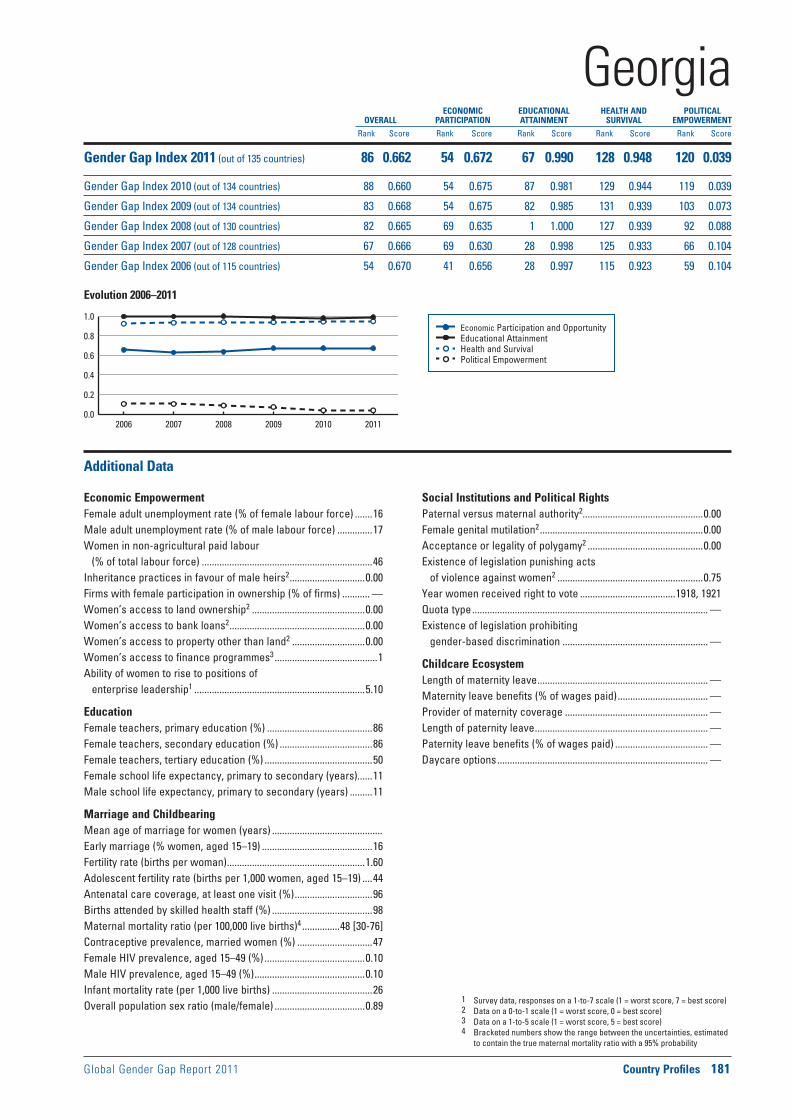
Global Gender Gap Report 2011 Country Profiles 181
Economic Participation and Opportunity Educational Attainment Health and Survival Political Empowerment
Evolution 2006–2011
1 Survey data, responses on a 1-to-7 scale (1 = worst score, 7 = best score)2 Data on a 0-to-1 scale (1 = worst score, 0 = best score)3 Data on a 1-to-5 scale (1 = worst score, 5 = best score)4 Bracketed numbers show the range between the uncertainties, estimated
to contain the true maternal mortality ratio with a 95% probability
ECONOMIC EDUCATIONAL HEALTH AND POLITICAL OVERALL PARTICIPATION ATTAINMENT SURVIVAL EMPOWERMENT
Rank Score Rank Score Rank Score Rank Score Rank Score
0.0
0.2
0.4
0.6
0.8
1.0
2006 2007 2008 2009 2010 2011
Additional Data
Economic EmpowermentFemale adult unemployment rate (% of female labour force) .......16Male adult unemployment rate (% of male labour force) ..............17Women in non-agricultural paid labour
(% of total labour force) ....................................................................46Inheritance practices in favour of male heirs2 ..............................0.00Firms with female participation in ownership (% of firms) ........... —Women’s access to land ownership2 .............................................0.00Women’s access to bank loans2 ......................................................0.00Women’s access to property other than land2 .............................0.00Women’s access to finance programmes3 .........................................1Ability of women to rise to positions of
enterprise leadership1 ....................................................................5.10
EducationFemale teachers, primary education (%) ..........................................86Female teachers, secondary education (%) .....................................86Female teachers, tertiary education (%) ...........................................50Female school life expectancy, primary to secondary (years)......11Male school life expectancy, primary to secondary (years) .........11
Marriage and ChildbearingMean age of marriage for women (years) ............................................Early marriage (% women, aged 15–19) ............................................16Fertility rate (births per woman) .......................................................1.60Adolescent fertility rate (births per 1,000 women, aged 15–19) ....44Antenatal care coverage, at least one visit (%) ...............................96Births attended by skilled health staff (%) ........................................98Maternal mortality ratio (per 100,000 live births)4 ...............48 [30-76]Contraceptive prevalence, married women (%) ..............................47Female HIV prevalence, aged 15–49 (%) ........................................0.10Male HIV prevalence, aged 15–49 (%) ............................................0.10Infant mortality rate (per 1,000 live births) ........................................26Overall population sex ratio (male/female) ....................................0.89
Social Institutions and Political RightsPaternal versus maternal authority2................................................0.00Female genital mutilation2 .................................................................0.00Acceptance or legality of polygamy2 ..............................................0.00Existence of legislation punishing acts
of violence against women2 ..........................................................0.75Year women received right to vote ......................................1918, 1921Quota type .............................................................................................. —Existence of legislation prohibiting
gender-based discrimination .......................................................... —
Childcare EcosystemLength of maternity leave .................................................................... —Maternity leave benefits (% of wages paid) .................................... —Provider of maternity coverage ......................................................... —Length of paternity leave ..................................................................... —Paternity leave benefits (% of wages paid) ..................................... —Daycare options .................................................................................... —
GeorgiaGender Gap Index 2011 (out of 135 countries) 86 0.662 54 0.672 67 0.990 128 0.948 120 0.039
Gender Gap Index 2010 (out of 134 countries) 88 0.660 54 0.675 87 0.981 129 0.944 119 0.039
Gender Gap Index 2009 (out of 134 countries) 83 0.668 54 0.675 82 0.985 131 0.939 103 0.073
Gender Gap Index 2008 (out of 130 countries) 82 0.665 69 0.635 1 1.000 127 0.939 92 0.088
Gender Gap Index 2007 (out of 128 countries) 67 0.666 69 0.630 28 0.998 125 0.933 66 0.104
Gender Gap Index 2006 (out of 115 countries) 54 0.670 41 0.656 28 0.997 115 0.923 59 0.104
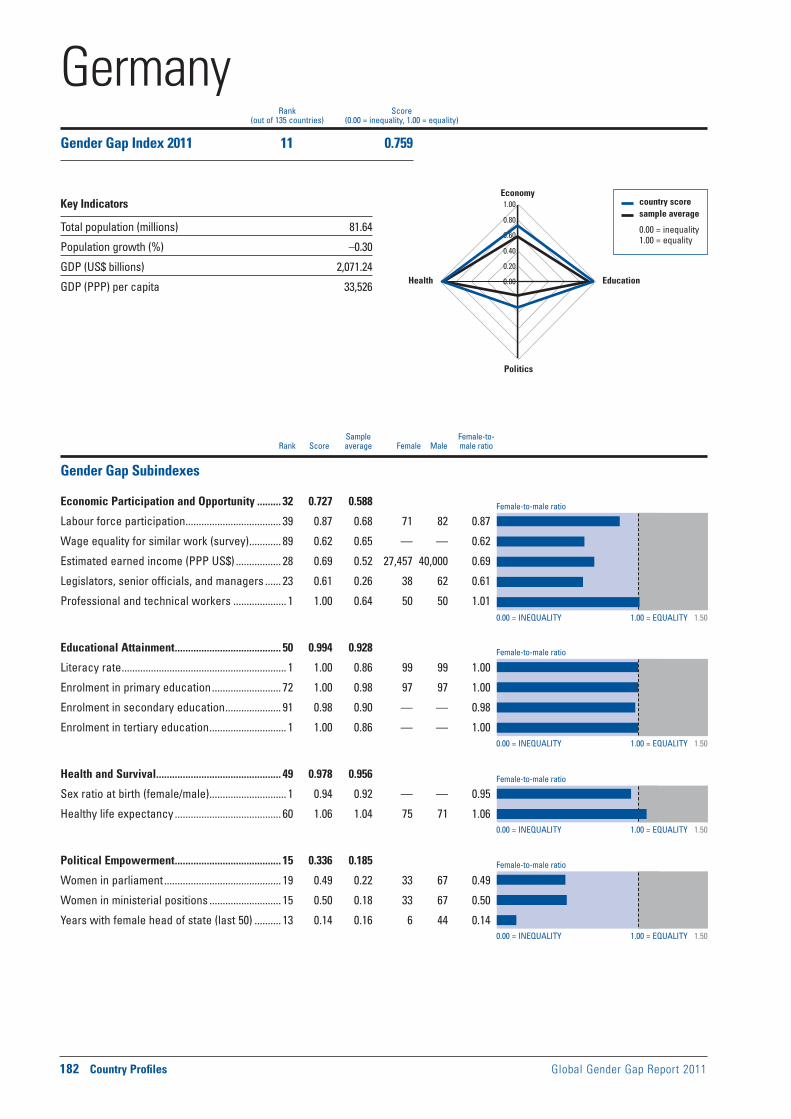
Female-to-male ratio
0.00 = INEQUALITY 1.00 = EQUALITY 1.50
0.00 = INEQUALITY 1.00 = EQUALITY 1.50
0.00 = INEQUALITY 1.00 = EQUALITY 1.50
0.00 = INEQUALITY 1.00 = EQUALITY 1.50
Female-to-male ratio
Female-to-male ratio
Female-to-male ratio
182 Country Profiles Global Gender Gap Report 2011
Sample Female-to- Rank Score average Female Male male ratio
country score sample average
0.00 = inequality 1.00 = equality
0.00
0.20
0.40
0.60
0.80
1.00Economy
Education
Politics
Health
Rank Score(out of 135 countries) (0.00 = inequality, 1.00 = equality)
Gender Gap Subindexes
Economic Participation and Opportunity ......... 32 0.727 0.588
Labour force participation .................................... 39 0.87 0.68 71 82 0.87
Wage equality for similar work (survey) ............ 89 0.62 0.65 — — 0.62
Estimated earned income (PPP US$) ................. 28 0.69 0.52 27,457 40,000 0.69
Legislators, senior officials, and managers ...... 23 0.61 0.26 38 62 0.61
Professional and technical workers .................... 1 1.00 0.64 50 50 1.01
Educational Attainment ........................................ 50 0.994 0.928
Literacy rate .............................................................. 1 1.00 0.86 99 99 1.00
Enrolment in primary education .......................... 72 1.00 0.98 97 97 1.00
Enrolment in secondary education ..................... 91 0.98 0.90 — — 0.98
Enrolment in tertiary education ............................. 1 1.00 0.86 — — 1.00
Health and Survival ............................................... 49 0.978 0.956
Sex ratio at birth (female/male) ............................. 1 0.94 0.92 — — 0.95
Healthy life expectancy ........................................ 60 1.06 1.04 75 71 1.06
Political Empowerment ........................................ 15 0.336 0.185
Women in parliament ............................................ 19 0.49 0.22 33 67 0.49
Women in ministerial positions ........................... 15 0.50 0.18 33 67 0.50
Years with female head of state (last 50) .......... 13 0.14 0.16 6 44 0.14
GermanyGender Gap Index 2011 11 0.759
Key Indicators
Total population (millions) 81.64
Population growth (%) –0.30
GDP (US$ billions) 2,071.24
GDP (PPP) per capita 33,526

Global Gender Gap Report 2011 Country Profiles 183
Economic Participation and Opportunity Educational Attainment Health and Survival Political Empowerment
Evolution 2006–2011
1 Survey data, responses on a 1-to-7 scale (1 = worst score, 7 = best score)2 Data on a 0-to-1 scale (1 = worst score, 0 = best score)3 Data on a 1-to-5 scale (1 = worst score, 5 = best score)4 Bracketed numbers show the range between the uncertainties, estimated
to contain the true maternal mortality ratio with a 95% probability
ECONOMIC EDUCATIONAL HEALTH AND POLITICAL OVERALL PARTICIPATION ATTAINMENT SURVIVAL EMPOWERMENT
Rank Score Rank Score Rank Score Rank Score Rank Score
0.0
0.2
0.4
0.6
0.8
1.0
2006 2007 2008 2009 2010 2011
Additional Data
Economic EmpowermentFemale adult unemployment rate (% of female labour force) .........7Male adult unemployment rate (% of male labour force) ................7Women in non-agricultural paid labour
(% of total labour force) ....................................................................47Inheritance practices in favour of male heirs2 ................................ —Firms with female participation in ownership (% of firms) ........... —Women’s access to land ownership2 ............................................... —Women’s access to bank loans2 ........................................................ —Women’s access to property other than land2 ............................... —Women’s access to finance programmes3 .........................................5Ability of women to rise to positions of
enterprise leadership1 ....................................................................4.47
EducationFemale teachers, primary education (%) ..........................................85Female teachers, secondary education (%) .....................................58Female teachers, tertiary education (%) ...........................................37Female school life expectancy, primary to secondary (years)......13Male school life expectancy, primary to secondary (years) .........13
Marriage and ChildbearingMean age of marriage for women (years) ........................................31Early marriage (% women, aged 15–19) ........................................... —Fertility rate (births per woman) .......................................................1.30Adolescent fertility rate (births per 1,000 women, aged 15–19) ....10Antenatal care coverage, at least one visit (%) .............................100Births attended by skilled health staff (%) ......................................100Maternal mortality ratio (per 100,000 live births)4 .....................7 [6-8]Contraceptive prevalence, married women (%) ..............................70Female HIV prevalence, aged 15–49 (%) ........................................0.10Male HIV prevalence, aged 15–49 (%) ............................................0.20Infant mortality rate (per 1,000 live births) ..........................................3Overall population sex ratio (male/female) ....................................0.96
Social Institutions and Political RightsPaternal versus maternal authority2.................................................. —Female genital mutilation2 ................................................................... —Acceptance or legality of polygamy2 ................................................ —Existence of legislation punishing acts
of violence against women2 ............................................................ —Year women received right to vote ................................................1918Quota type ..........................................................................No legislated;
voluntary political party quotasExistence of legislation prohibiting
gender-based discrimination ........................................................ Yes
Childcare EcosystemLength of maternity leave ........................................................14 weeksMaternity leave benefits (% of wages paid) ..................................100,
up to a ceilingProvider of maternity coverage .................................Statutory health
insurance scheme, state, employerLength of paternity leave ..................................................................... —Paternity leave benefits (% of wages paid) ..................................... —Daycare options ........................................................ Public and private
daycare with allowance
GermanyGender Gap Index 2011 (out of 135 countries) 11 0.759 32 0.727 50 0.994 49 0.978 15 0.336
Gender Gap Index 2010 (out of 134 countries) 13 0.753 37 0.714 51 0.995 47 0.978 15 0.325
Gender Gap Index 2009 (out of 134 countries) 12 0.745 37 0.696 49 0.995 60 0.978 13 0.311
Gender Gap Index 2008 (out of 130 countries) 11 0.739 45 0.688 49 0.995 57 0.978 16 0.296
Gender Gap Index 2007 (out of 128 countries) 7 0.762 29 0.700 35 0.995 56 0.978 6 0.374
Gender Gap Index 2006 (out of 115 countries) 5 0.752 32 0.669 31 0.995 36 0.979 6 0.366

Female-to-male ratio
0.00 = INEQUALITY 1.00 = EQUALITY 1.50
0.00 = INEQUALITY 1.00 = EQUALITY 1.50
0.00 = INEQUALITY 1.00 = EQUALITY 1.50
0.00 = INEQUALITY 1.00 = EQUALITY 1.50
Female-to-male ratio
Female-to-male ratio
Female-to-male ratio
184 Country Profiles Global Gender Gap Report 2011
Sample Female-to- Rank Score average Female Male male ratio
country score sample average
0.00 = inequality 1.00 = equality
0.00
0.20
0.40
0.60
0.80
1.00Economy
Education
Politics
Health
Rank Score(out of 135 countries) (0.00 = inequality, 1.00 = equality)
Gender Gap Subindexes
Economic Participation and Opportunity ......... 17 0.758 0.588
Labour force participation ...................................... 2 0.99 0.68 75 76 0.99
Wage equality for similar work (survey) ............ 26 0.75 0.65 — — 0.75
Estimated earned income (PPP US$) ................. 17 0.75 0.52 1,324 1,774 0.75
Legislators, senior officials, and managers ...... 45 0.47 0.26 32 68 0.47
Professional and technical workers ..................— — 0.64 — — —
Educational Attainment ...................................... 111 0.903 0.928
Literacy rate .......................................................... 112 0.83 0.86 60 73 0.83
Enrolment in primary education ............................ 1 1.00 0.98 76 76 1.01
Enrolment in secondary education ................... 108 0.92 0.90 44 48 0.92
Enrolment in tertiary education ......................... 114 0.62 0.86 7 11 0.62
Health and Survival ............................................. 104 0.967 0.956
Sex ratio at birth (female/male) ............................. 1 0.94 0.92 — — 0.97
Healthy life expectancy ...................................... 109 1.02 1.04 50 49 1.02
Political Empowerment ........................................ 91 0.096 0.185
Women in parliament .......................................... 114 0.09 0.22 8 92 0.09
Women in ministerial positions ........................... 48 0.28 0.18 22 78 0.28
Years with female head of state (last 50) .......... 52 0.00 0.16 0 50 0.00
GhanaGender Gap Index 2011 70 0.681
Key Indicators
Total population (millions) 24.33
Population growth (%) 2.06
GDP (US$ billions) 8.72
GDP (PPP) per capita 1,472

Global Gender Gap Report 2011 Country Profiles 185
Economic Participation and Opportunity Educational Attainment Health and Survival Political Empowerment
Evolution 2006–2011
1 Survey data, responses on a 1-to-7 scale (1 = worst score, 7 = best score)2 Data on a 0-to-1 scale (1 = worst score, 0 = best score)3 Data on a 1-to-5 scale (1 = worst score, 5 = best score)4 Bracketed numbers show the range between the uncertainties, estimated
to contain the true maternal mortality ratio with a 95% probability
ECONOMIC EDUCATIONAL HEALTH AND POLITICAL OVERALL PARTICIPATION ATTAINMENT SURVIVAL EMPOWERMENT
Rank Score Rank Score Rank Score Rank Score Rank Score
0.0
0.2
0.4
0.6
0.8
1.0
2006 2007 2008 2009 2010 2011
Additional Data
Economic EmpowermentFemale adult unemployment rate (% of female labour force) .......11Male adult unemployment rate (% of male labour force) ..............10Women in non-agricultural paid labour
(% of total labour force) ....................................................................32Inheritance practices in favour of male heirs2 ..............................0.50Firms with female participation in ownership (% of firms) ............43Women’s access to land ownership2 .............................................0.50Women’s access to bank loans2 ......................................................0.50Women’s access to property other than land2 .............................0.50Women’s access to finance programmes3 .........................................2Ability of women to rise to positions of
enterprise leadership1 ....................................................................4.98
EducationFemale teachers, primary education (%) ..........................................34Female teachers, secondary education (%) .....................................22Female teachers, tertiary education (%) ...........................................17Female school life expectancy, primary to secondary (years)......10Male school life expectancy, primary to secondary (years) .........10
Marriage and ChildbearingMean age of marriage for women (years) ........................................22Early marriage (% women, aged 15–19) ............................................16Fertility rate (births per woman) .......................................................4.30Adolescent fertility rate (births per 1,000 women, aged 15–19) ....70Antenatal care coverage, at least one visit (%) ...............................90Births attended by skilled health staff (%) ........................................59Maternal mortality ratio (per 100,000 live births)4 .........350 [210-600]Contraceptive prevalence, married women (%) ..............................24Female HIV prevalence, aged 15–49 (%) ........................................2.20Male HIV prevalence, aged 15–49 (%) ............................................1.40Infant mortality rate (per 1,000 live births) ........................................47Overall population sex ratio (male/female) ....................................1.03
Social Institutions and Political RightsPaternal versus maternal authority2................................................0.50Female genital mutilation2 .................................................................0.20Acceptance or legality of polygamy2 ..............................................0.50Existence of legislation punishing acts
of violence against women2 ..........................................................0.58Year women received right to vote ................................................1954Quota type .............................................................................................. —Existence of legislation prohibiting
gender-based discrimination .......................................................... —
Childcare EcosystemLength of maternity leave ........................................................12 weeksMaternity leave benefits (% of wages paid) ...................................100Provider of maternity coverage .............................................EmployerLength of paternity leave ..................................................................... —Paternity leave benefits (% of wages paid) ..................................... —Daycare options .................................................................................... —
GhanaGender Gap Index 2011 (out of 135 countries) 70 0.681 17 0.758 111 0.903 104 0.967 91 0.096
Gender Gap Index 2010 (out of 134 countries) 70 0.678 15 0.758 111 0.891 103 0.967 88 0.096
Gender Gap Index 2009 (out of 134 countries) 80 0.670 13 0.755 112 0.886 111 0.967 101 0.073
Gender Gap Index 2008 (out of 130 countries) 77 0.668 14 0.745 110 0.875 106 0.967 94 0.085
Gender Gap Index 2007 (out of 128 countries) 63 0.673 3 0.781 106 0.871 105 0.967 91 0.071
Gender Gap Index 2006 (out of 115 countries) 58 0.665 5 0.753 94 0.868 89 0.969 80 0.071

Female-to-male ratio
0.00 = INEQUALITY 1.00 = EQUALITY 1.50
0.00 = INEQUALITY 1.00 = EQUALITY 1.50
0.00 = INEQUALITY 1.00 = EQUALITY 1.50
0.00 = INEQUALITY 1.00 = EQUALITY 1.50
Female-to-male ratio
Female-to-male ratio
Female-to-male ratio
186 Country Profiles Global Gender Gap Report 2011
Sample Female-to- Rank Score average Female Male male ratio
country score sample average
0.00 = inequality 1.00 = equality
0.00
0.20
0.40
0.60
0.80
1.00Economy
Education
Politics
Health
Rank Score(out of 135 countries) (0.00 = inequality, 1.00 = equality)
Gender Gap Subindexes
Economic Participation and Opportunity ......... 78 0.624 0.588
Labour force participation .................................... 87 0.70 0.68 55 79 0.70
Wage equality for similar work (survey) ............ 79 0.64 0.65 — — 0.64
Estimated earned income (PPP US$) ................. 90 0.50 0.52 19,842 39,561 0.50
Legislators, senior officials, and managers ...... 65 0.40 0.26 28 72 0.40
Professional and technical workers .................. 64 0.96 0.64 49 51 0.96
Educational Attainment ........................................ 53 0.994 0.928
Literacy rate ............................................................ 72 0.98 0.86 96 98 0.98
Enrolment in primary education ............................ 1 1.00 0.98 100 99 1.00
Enrolment in secondary education ..................... 86 0.99 0.90 91 91 0.99
Enrolment in tertiary education ............................. 1 1.00 0.86 95 87 1.10
Health and Survival ............................................... 86 0.971 0.956
Sex ratio at birth (female/male) ......................... 117 0.94 0.92 — — 0.94
Healthy life expectancy ........................................ 79 1.04 1.04 74 71 1.04
Political Empowerment ........................................ 42 0.177 0.185
Women in parliament ............................................ 70 0.21 0.22 17 83 0.21
Women in ministerial positions ........................... 21 0.45 0.18 31 69 0.45
Years with female head of state (last 50) .......... 52 0.00 0.16 0 50 0.00
GreeceGender Gap Index 2011 56 0.692
Key Indicators
Total population (millions) 11.33
Population growth (%) 0.41
GDP (US$ billions) 158.67
GDP (PPP) per capita 24,968

Global Gender Gap Report 2011 Country Profiles 187
Economic Participation and Opportunity Educational Attainment Health and Survival Political Empowerment
Evolution 2006–2011
1 Survey data, responses on a 1-to-7 scale (1 = worst score, 7 = best score)2 Data on a 0-to-1 scale (1 = worst score, 0 = best score)3 Data on a 1-to-5 scale (1 = worst score, 5 = best score)4 Bracketed numbers show the range between the uncertainties, estimated
to contain the true maternal mortality ratio with a 95% probability
ECONOMIC EDUCATIONAL HEALTH AND POLITICAL OVERALL PARTICIPATION ATTAINMENT SURVIVAL EMPOWERMENT
Rank Score Rank Score Rank Score Rank Score Rank Score
0.0
0.2
0.4
0.6
0.8
1.0
2006 2007 2008 2009 2010 2011
Additional Data
Economic EmpowermentFemale adult unemployment rate (% of female labour force) .......13Male adult unemployment rate (% of male labour force) ................5Women in non-agricultural paid labour
(% of total labour force) ....................................................................42Inheritance practices in favour of male heirs2 ................................ —Firms with female participation in ownership (% of firms) ........... —Women’s access to land ownership2 ............................................... —Women’s access to bank loans2 ........................................................ —Women’s access to property other than land2 ............................... —Women’s access to finance programmes3 .........................................5Ability of women to rise to positions of
enterprise leadership1 ....................................................................4.29
EducationFemale teachers, primary education (%) ..........................................65Female teachers, secondary education (%) .....................................58Female teachers, tertiary education (%) ...........................................35Female school life expectancy, primary to secondary (years)......12Male school life expectancy, primary to secondary (years) .........12
Marriage and ChildbearingMean age of marriage for women (years) ........................................27Early marriage (% women, aged 15–19) ........................................... —Fertility rate (births per woman) .......................................................1.40Adolescent fertility rate (births per 1,000 women, aged 15–19) ....11Antenatal care coverage, at least one visit (%) .............................. —Births attended by skilled health staff (%) ....................................... —Maternal mortality ratio (per 100,000 live births)4 .....................2 [2-3]Contraceptive prevalence, married women (%) ..............................76Female HIV prevalence, aged 15–49 (%) ........................................0.10Male HIV prevalence, aged 15–49 (%) ............................................0.20Infant mortality rate (per 1,000 live births) ..........................................3Overall population sex ratio (male/female) ....................................0.98
Social Institutions and Political RightsPaternal versus maternal authority2.................................................. —Female genital mutilation2 ................................................................... —Acceptance or legality of polygamy2 ................................................ —Existence of legislation punishing acts
of violence against women2 ............................................................ —Year women received right to vote ................................................1952Quota type ..........................................................................No legislated;
voluntary political party quotasExistence of legislation prohibiting
gender-based discrimination ........................................................ Yes
Childcare EcosystemLength of maternity leave ......................................................... 119 daysMaternity leave benefits (% of wages paid) .....................................50
plus a dependent’s supplement (10% for each dependent, up to a maximum of 40%); in addition, a birth grant is paid in lump sum
Provider of maternity coverage .................Social security/employerLength of paternity leave ...................................................If the mother
does not use maternity leave, the father is entitled to itPaternity leave benefits (% of wages paid) .............................. Varies
based on incomeDaycare options ......................................................................Public and
private daycare with allowance (civil servants)
GreeceGender Gap Index 2011 (out of 135 countries) 56 0.692 78 0.624 53 0.994 86 0.971 42 0.177
Gender Gap Index 2010 (out of 134 countries) 58 0.691 79 0.621 54 0.994 84 0.971 42 0.177
Gender Gap Index 2009 (out of 134 countries) 85 0.666 86 0.607 60 0.993 57 0.979 94 0.086
Gender Gap Index 2008 (out of 130 countries) 75 0.673 72 0.631 55 0.994 54 0.979 93 0.086
Gender Gap Index 2007 (out of 128 countries) 72 0.665 70 0.630 57 0.989 53 0.979 98 0.061
Gender Gap Index 2006 (out of 115 countries) 69 0.654 70 0.585 46 0.992 53 0.978 87 0.061
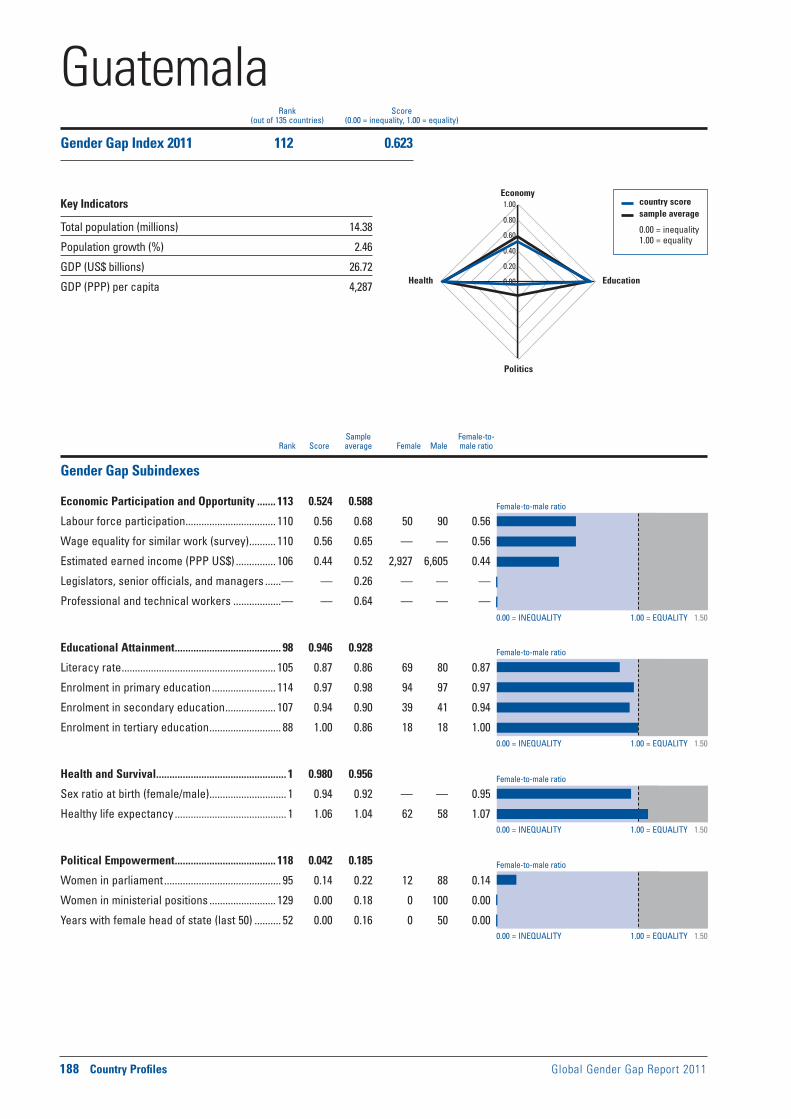
Female-to-male ratio
0.00 = INEQUALITY 1.00 = EQUALITY 1.50
0.00 = INEQUALITY 1.00 = EQUALITY 1.50
0.00 = INEQUALITY 1.00 = EQUALITY 1.50
0.00 = INEQUALITY 1.00 = EQUALITY 1.50
Female-to-male ratio
Female-to-male ratio
Female-to-male ratio
188 Country Profiles Global Gender Gap Report 2011
Sample Female-to- Rank Score average Female Male male ratio
country score sample average
0.00 = inequality 1.00 = equality
0.00
0.20
0.40
0.60
0.80
1.00Economy
Education
Politics
Health
Rank Score(out of 135 countries) (0.00 = inequality, 1.00 = equality)
Gender Gap Subindexes
Economic Participation and Opportunity ....... 113 0.524 0.588
Labour force participation .................................. 110 0.56 0.68 50 90 0.56
Wage equality for similar work (survey) .......... 110 0.56 0.65 — — 0.56
Estimated earned income (PPP US$) ............... 106 0.44 0.52 2,927 6,605 0.44
Legislators, senior officials, and managers ......— — 0.26 — — —
Professional and technical workers ..................— — 0.64 — — —
Educational Attainment ........................................ 98 0.946 0.928
Literacy rate .......................................................... 105 0.87 0.86 69 80 0.87
Enrolment in primary education ........................ 114 0.97 0.98 94 97 0.97
Enrolment in secondary education ................... 107 0.94 0.90 39 41 0.94
Enrolment in tertiary education ........................... 88 1.00 0.86 18 18 1.00
Health and Survival ................................................. 1 0.980 0.956
Sex ratio at birth (female/male) ............................. 1 0.94 0.92 — — 0.95
Healthy life expectancy .......................................... 1 1.06 1.04 62 58 1.07
Political Empowerment ...................................... 118 0.042 0.185
Women in parliament ............................................ 95 0.14 0.22 12 88 0.14
Women in ministerial positions ......................... 129 0.00 0.18 0 100 0.00
Years with female head of state (last 50) .......... 52 0.00 0.16 0 50 0.00
GuatemalaGender Gap Index 2011 112 0.623
Key Indicators
Total population (millions) 14.38
Population growth (%) 2.46
GDP (US$ billions) 26.72
GDP (PPP) per capita 4,287

Global Gender Gap Report 2011 Country Profiles 189
Economic Participation and Opportunity Educational Attainment Health and Survival Political Empowerment
Evolution 2006–2011
1 Survey data, responses on a 1-to-7 scale (1 = worst score, 7 = best score)2 Data on a 0-to-1 scale (1 = worst score, 0 = best score)3 Data on a 1-to-5 scale (1 = worst score, 5 = best score)4 Bracketed numbers show the range between the uncertainties, estimated
to contain the true maternal mortality ratio with a 95% probability
ECONOMIC EDUCATIONAL HEALTH AND POLITICAL OVERALL PARTICIPATION ATTAINMENT SURVIVAL EMPOWERMENT
Rank Score Rank Score Rank Score Rank Score Rank Score
0.0
0.2
0.4
0.6
0.8
1.0
2006 2007 2008 2009 2010 2011
Additional Data
Economic EmpowermentFemale adult unemployment rate (% of female labour force) .........2Male adult unemployment rate (% of male labour force) ................1Women in non-agricultural paid labour
(% of total labour force) ....................................................................43Inheritance practices in favour of male heirs2 ..............................0.00Firms with female participation in ownership (% of firms) ........... —Women’s access to land ownership2 .............................................0.50Women’s access to bank loans2 ......................................................0.00Women’s access to property other than land2 .............................0.00Women’s access to finance programmes3 ...................................... —Ability of women to rise to positions of
enterprise leadership1 ....................................................................4.07
EducationFemale teachers, primary education (%) ..........................................65Female teachers, secondary education (%) .....................................44Female teachers, tertiary education (%) .......................................... —Female school life expectancy, primary to secondary (years)........9Male school life expectancy, primary to secondary (years) .........10
Marriage and ChildbearingMean age of marriage for women (years) ........................................20Early marriage (% women, aged 15–19) ............................................26Fertility rate (births per woman) .......................................................4.10Adolescent fertility rate (births per 1,000 women, aged 15–19) ....92Antenatal care coverage, at least one visit (%) ...............................93Births attended by skilled health staff (%) ........................................51Maternal mortality ratio (per 100,000 live births)4 ...........110 [56-190]Contraceptive prevalence, married women (%) ..............................43Female HIV prevalence, aged 15–49 (%) ........................................0.50Male HIV prevalence, aged 15–49 (%) ............................................1.10Infant mortality rate (per 1,000 live births) ........................................33Overall population sex ratio (male/female) ....................................0.95
Social Institutions and Political RightsPaternal versus maternal authority2................................................0.00Female genital mutilation2 .................................................................0.00Acceptance or legality of polygamy2 ..............................................0.00Existence of legislation punishing acts
of violence against women2 ..........................................................0.67Year women received right to vote ................................................1946Quota type ..........................................................................No legislated;
voluntary political party quotasExistence of legislation prohibiting
gender-based discrimination .......................................................... —
Childcare EcosystemLength of maternity leave ........................................................... 84 daysMaternity leave benefits (% of wages paid) ..................................100;
if the worker is not entitled to social security benefits, the employer shall cover the full cost of benefit
Provider of maternity coverage ......................... Social security (2/3), employer (1/3)
Length of paternity leave ..................................................................... —Paternity leave benefits (% of wages paid) ..................................... —Daycare options .................................................................................... —
GuatemalaGender Gap Index 2011 (out of 135 countries) 112 0.623 113 0.524 98 0.946 1 0.980 118 0.042
Gender Gap Index 2010 (out of 134 countries) 109 0.624 109 0.528 101 0.945 1 0.980 116 0.042
Gender Gap Index 2009 (out of 134 countries) 111 0.621 115 0.506 101 0.938 1 0.980 118 0.060
Gender Gap Index 2008 (out of 130 countries) 112 0.607 114 0.475 103 0.915 1 0.980 113 0.060
Gender Gap Index 2007 (out of 128 countries) 106 0.614 112 0.471 102 0.897 1 0.980 61 0.110
Gender Gap Index 2006 (out of 115 countries) 95 0.607 104 0.443 91 0.895 1 0.980 54 0.110
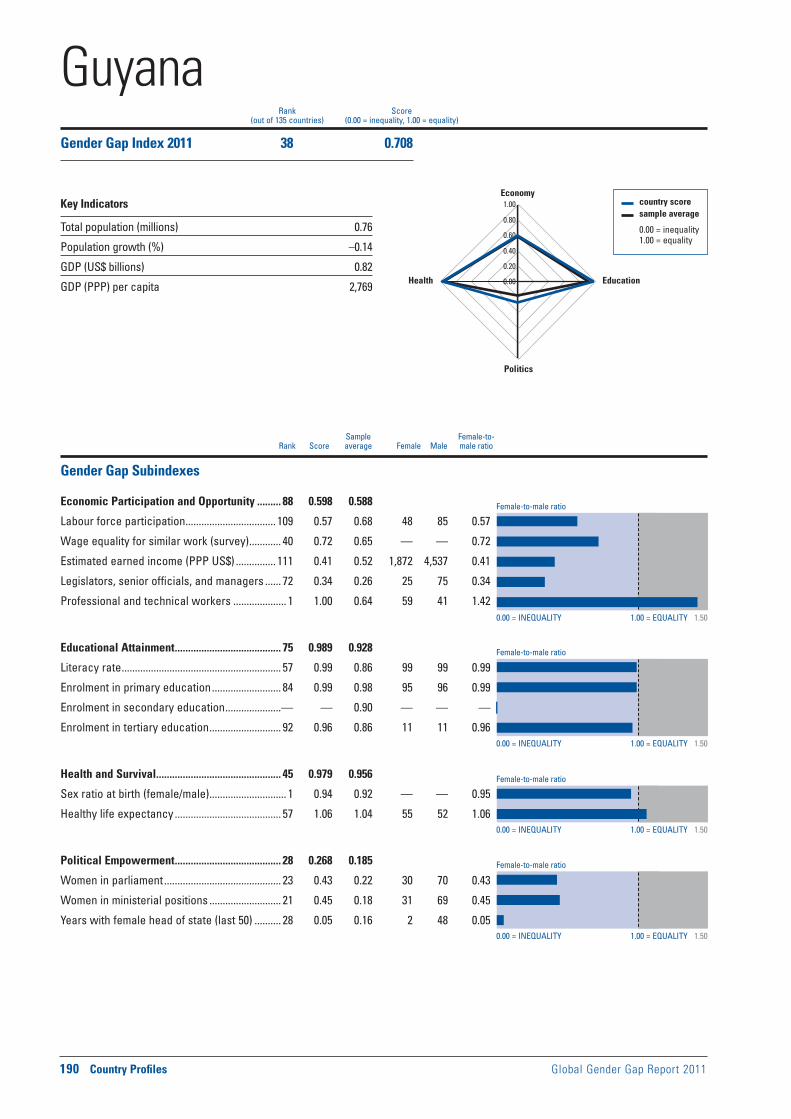
Female-to-male ratio
0.00 = INEQUALITY 1.00 = EQUALITY 1.50
0.00 = INEQUALITY 1.00 = EQUALITY 1.50
0.00 = INEQUALITY 1.00 = EQUALITY 1.50
0.00 = INEQUALITY 1.00 = EQUALITY 1.50
Female-to-male ratio
Female-to-male ratio
Female-to-male ratio
190 Country Profiles Global Gender Gap Report 2011
Sample Female-to- Rank Score average Female Male male ratio
country score sample average
0.00 = inequality 1.00 = equality
0.00
0.20
0.40
0.60
0.80
1.00Economy
Education
Politics
Health
Rank Score(out of 135 countries) (0.00 = inequality, 1.00 = equality)
Gender Gap Subindexes
Economic Participation and Opportunity ......... 88 0.598 0.588
Labour force participation .................................. 109 0.57 0.68 48 85 0.57
Wage equality for similar work (survey) ............ 40 0.72 0.65 — — 0.72
Estimated earned income (PPP US$) ............... 111 0.41 0.52 1,872 4,537 0.41
Legislators, senior officials, and managers ...... 72 0.34 0.26 25 75 0.34
Professional and technical workers .................... 1 1.00 0.64 59 41 1.42
Educational Attainment ........................................ 75 0.989 0.928
Literacy rate ............................................................ 57 0.99 0.86 99 99 0.99
Enrolment in primary education .......................... 84 0.99 0.98 95 96 0.99
Enrolment in secondary education .....................— — 0.90 — — —
Enrolment in tertiary education ........................... 92 0.96 0.86 11 11 0.96
Health and Survival ............................................... 45 0.979 0.956
Sex ratio at birth (female/male) ............................. 1 0.94 0.92 — — 0.95
Healthy life expectancy ........................................ 57 1.06 1.04 55 52 1.06
Political Empowerment ........................................ 28 0.268 0.185
Women in parliament ............................................ 23 0.43 0.22 30 70 0.43
Women in ministerial positions ........................... 21 0.45 0.18 31 69 0.45
Years with female head of state (last 50) .......... 28 0.05 0.16 2 48 0.05
GuyanaGender Gap Index 2011 38 0.708
Key Indicators
Total population (millions) 0.76
Population growth (%) –0.14
GDP (US$ billions) 0.82
GDP (PPP) per capita 2,769

Global Gender Gap Report 2011 Country Profiles 191
Economic Participation and Opportunity Educational Attainment Health and Survival Political Empowerment
Evolution 2006–2011
1 Survey data, responses on a 1-to-7 scale (1 = worst score, 7 = best score)2 Data on a 0-to-1 scale (1 = worst score, 0 = best score)3 Data on a 1-to-5 scale (1 = worst score, 5 = best score)4 Bracketed numbers show the range between the uncertainties, estimated
to contain the true maternal mortality ratio with a 95% probability
ECONOMIC EDUCATIONAL HEALTH AND POLITICAL OVERALL PARTICIPATION ATTAINMENT SURVIVAL EMPOWERMENT
Rank Score Rank Score Rank Score Rank Score Rank Score
0.0
0.2
0.4
0.6
0.8
1.0
2006 2007 2008 2009 2010 2011
Additional Data
Economic EmpowermentFemale adult unemployment rate (% of female labour force) .......15Male adult unemployment rate (% of male labour force) ..............10Women in non-agricultural paid labour
(% of total labour force) ....................................................................35Inheritance practices in favour of male heirs2 ................................ —Firms with female participation in ownership (% of firms) ........... —Women’s access to land ownership2 ............................................... —Women’s access to bank loans2 ........................................................ —Women’s access to property other than land2 ............................... —Women’s access to finance programmes3 ...................................... —Ability of women to rise to positions of
enterprise leadership1 ....................................................................5.32
EducationFemale teachers, primary education (%) ..........................................88Female teachers, secondary education (%) .....................................69Female teachers, tertiary education (%) ...........................................44Female school life expectancy, primary to secondary (years)......11Male school life expectancy, primary to secondary (years) .........11
Marriage and ChildbearingMean age of marriage for women (years) ........................................20Early marriage (% women, aged 15–19) ........................................... —Fertility rate (births per woman) .......................................................2.30Adolescent fertility rate (births per 1,000 women, aged 15–19) ....90Antenatal care coverage, at least one visit (%) ...............................92Births attended by skilled health staff (%) ........................................83Maternal mortality ratio (per 100,000 live births)4 .........270 [180-410]Contraceptive prevalence, married women (%) ..............................34Female HIV prevalence, aged 15–49 (%) ........................................1.20Male HIV prevalence, aged 15–49 (%) ............................................1.30Infant mortality rate (per 1,000 live births) ........................................29Overall population sex ratio (male/female) ....................................1.06
Social Institutions and Political RightsPaternal versus maternal authority2.................................................. —Female genital mutilation2 ................................................................... —Acceptance or legality of polygamy2 ................................................ —Existence of legislation punishing acts
of violence against women2 ............................................................ —Year women received right to vote ................................................1953Quota type ................................................Legislated candidate quotasExistence of legislation prohibiting
gender-based discrimination .......................................................... —
Childcare EcosystemLength of maternity leave ........................................................13 weeksMaternity leave benefits (% of wages paid) ....................................70.
In addition, a maternity grant is paid in lump sumProvider of maternity coverage ...................................Social securityLength of paternity leave ..................................................................... —Paternity leave benefits (% of wages paid) ..................................... —Daycare options .................................................................................... —
GuyanaGender Gap Index 2011 (out of 135 countries) 38 0.708 88 0.598 75 0.989 45 0.979 28 0.268
Gender Gap Index 2010 (out of 134 countries) 38 0.709 93 0.592 33 0.998 43 0.979 27 0.267
Gender Gap Index 2009 (out of 134 countries) 35 0.711 85 0.613 41 0.997 1 0.980 28 0.254
Gender Gap Index 2008 (out of 130 countries) — — — — — — — — — —
Gender Gap Index 2007 (out of 128 countries) — — — — — — — — — —
Gender Gap Index 2006 (out of 115 countries) — — — — — — — — — —
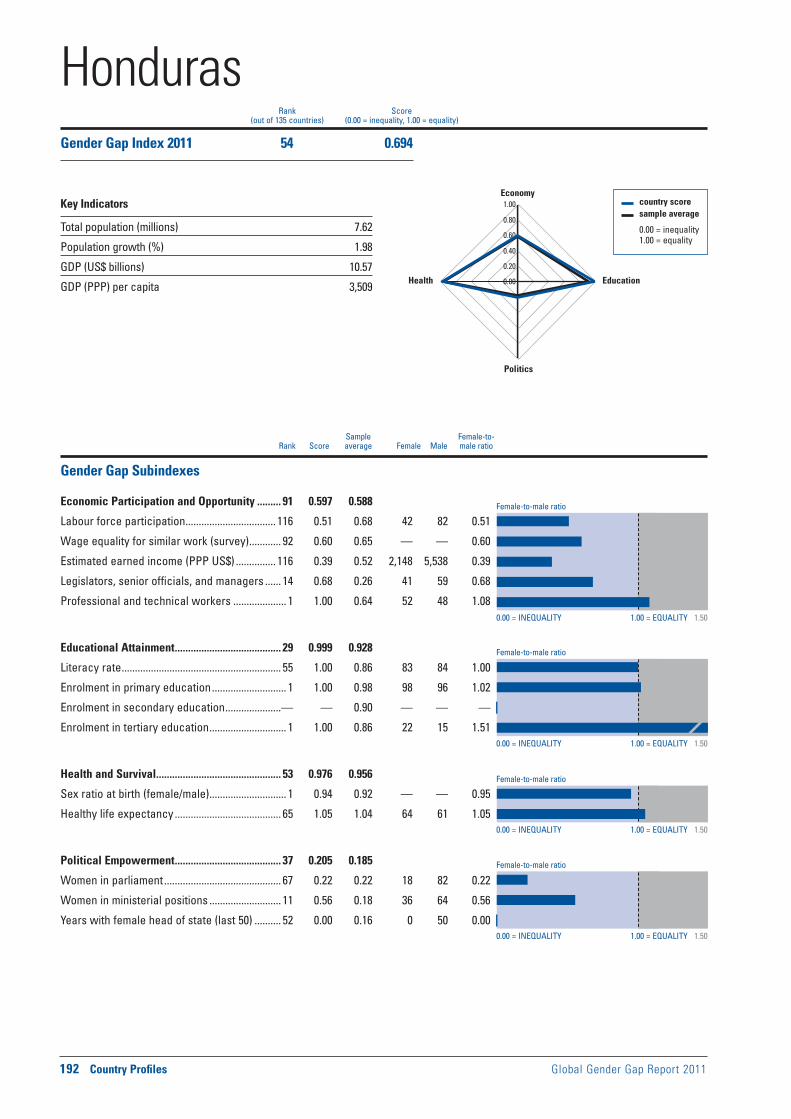
Female-to-male ratio
0.00 = INEQUALITY 1.00 = EQUALITY 1.50
0.00 = INEQUALITY 1.00 = EQUALITY 1.50
0.00 = INEQUALITY 1.00 = EQUALITY 1.50
0.00 = INEQUALITY 1.00 = EQUALITY 1.50
Female-to-male ratio
Female-to-male ratio
Female-to-male ratio
192 Country Profiles Global Gender Gap Report 2011
Sample Female-to- Rank Score average Female Male male ratio
country score sample average
0.00 = inequality 1.00 = equality
0.00
0.20
0.40
0.60
0.80
1.00Economy
Education
Politics
Health
Rank Score(out of 135 countries) (0.00 = inequality, 1.00 = equality)
Gender Gap Subindexes
Economic Participation and Opportunity ......... 91 0.597 0.588
Labour force participation .................................. 116 0.51 0.68 42 82 0.51
Wage equality for similar work (survey) ............ 92 0.60 0.65 — — 0.60
Estimated earned income (PPP US$) ............... 116 0.39 0.52 2,148 5,538 0.39
Legislators, senior officials, and managers ...... 14 0.68 0.26 41 59 0.68
Professional and technical workers .................... 1 1.00 0.64 52 48 1.08
Educational Attainment ........................................ 29 0.999 0.928
Literacy rate ............................................................ 55 1.00 0.86 83 84 1.00
Enrolment in primary education ............................ 1 1.00 0.98 98 96 1.02
Enrolment in secondary education .....................— — 0.90 — — —
Enrolment in tertiary education ............................. 1 1.00 0.86 22 15 1.51
Health and Survival ............................................... 53 0.976 0.956
Sex ratio at birth (female/male) ............................. 1 0.94 0.92 — — 0.95
Healthy life expectancy ........................................ 65 1.05 1.04 64 61 1.05
Political Empowerment ........................................ 37 0.205 0.185
Women in parliament ............................................ 67 0.22 0.22 18 82 0.22
Women in ministerial positions ........................... 11 0.56 0.18 36 64 0.56
Years with female head of state (last 50) .......... 52 0.00 0.16 0 50 0.00
HondurasGender Gap Index 2011 54 0.694
Key Indicators
Total population (millions) 7.62
Population growth (%) 1.98
GDP (US$ billions) 10.57
GDP (PPP) per capita 3,509

Global Gender Gap Report 2011 Country Profiles 193
Economic Participation and Opportunity Educational Attainment Health and Survival Political Empowerment
Evolution 2006–2011
1 Survey data, responses on a 1-to-7 scale (1 = worst score, 7 = best score)2 Data on a 0-to-1 scale (1 = worst score, 0 = best score)3 Data on a 1-to-5 scale (1 = worst score, 5 = best score)4 Bracketed numbers show the range between the uncertainties, estimated
to contain the true maternal mortality ratio with a 95% probability
ECONOMIC EDUCATIONAL HEALTH AND POLITICAL OVERALL PARTICIPATION ATTAINMENT SURVIVAL EMPOWERMENT
Rank Score Rank Score Rank Score Rank Score Rank Score
0.0
0.2
0.4
0.6
0.8
1.0
2006 2007 2008 2009 2010 2011
Additional Data
Economic EmpowermentFemale adult unemployment rate (% of female labour force) .........3Male adult unemployment rate (% of male labour force) ................3Women in non-agricultural paid labour
(% of total labour force) ....................................................................34Inheritance practices in favour of male heirs2 ..............................0.00Firms with female participation in ownership (% of firms) ............62Women’s access to land ownership2 .............................................0.00Women’s access to bank loans2 ......................................................0.00Women’s access to property other than land2 .............................0.00Women’s access to finance programmes3 .........................................1Ability of women to rise to positions of
enterprise leadership1 ....................................................................4.50
EducationFemale teachers, primary education (%) ..........................................75Female teachers, secondary education (%) .....................................55Female teachers, tertiary education (%) ...........................................52Female school life expectancy, primary to secondary (years)......11Male school life expectancy, primary to secondary (years) .........10
Marriage and ChildbearingMean age of marriage for women (years) ........................................21Early marriage (% women, aged 15–19) ............................................31Fertility rate (births per woman) .......................................................3.30Adolescent fertility rate (births per 1,000 women, aged 15–19) ..108Antenatal care coverage, at least one visit (%) ...............................92Births attended by skilled health staff (%) ........................................67Maternal mortality ratio (per 100,000 live births)4 ...........110 [71-180]Contraceptive prevalence, married women (%) ..............................65Female HIV prevalence, aged 15–49 (%) ........................................0.50Male HIV prevalence, aged 15–49 (%) ............................................1.00Infant mortality rate (per 1,000 live births) ........................................25Overall population sex ratio (male/female) ....................................1.00
Social Institutions and Political RightsPaternal versus maternal authority2................................................0.50Female genital mutilation2 .................................................................0.00Acceptance or legality of polygamy2 ..............................................0.00Existence of legislation punishing acts
of violence against women2 ..........................................................0.67Year women received right to vote ................................................1955Quota type ................................................Legislated candidate quotasExistence of legislation prohibiting
gender-based discrimination .......................................................... —
Childcare EcosystemLength of maternity leave ........................................................12 weeksMaternity leave benefits (% of wages paid) ..................................100.
If the worker is not entitled to social security benefits, the employer shall cover the full cost of benefit
Provider of maternity coverage ......................... Social security (2/3), employer (1/3)
Length of paternity leave ..................................................................... —Paternity leave benefits (% of wages paid) ..................................... —Daycare options .................................................................................... —
HondurasGender Gap Index 2011 (out of 135 countries) 54 0.694 91 0.597 29 0.999 53 0.976 37 0.205
Gender Gap Index 2010 (out of 134 countries) 54 0.693 96 0.590 30 0.999 53 0.976 35 0.205
Gender Gap Index 2009 (out of 134 countries) 62 0.689 87 0.605 1 1.000 1 0.980 41 0.173
Gender Gap Index 2008 (out of 130 countries) 47 0.696 70 0.634 1 1.000 1 0.980 41 0.171
Gender Gap Index 2007 (out of 128 countries) 68 0.666 98 0.549 1 1.000 1 0.980 48 0.136
Gender Gap Index 2006 (out of 115 countries) 74 0.648 99 0.478 1 1.000 1 0.980 42 0.136

Female-to-male ratio
0.00 = INEQUALITY 1.00 = EQUALITY 1.50
0.00 = INEQUALITY 1.00 = EQUALITY 1.50
0.00 = INEQUALITY 1.00 = EQUALITY 1.50
0.00 = INEQUALITY 1.00 = EQUALITY 1.50
Female-to-male ratio
Female-to-male ratio
Female-to-male ratio
194 Country Profiles Global Gender Gap Report 2011
Sample Female-to- Rank Score average Female Male male ratio
country score sample average
0.00 = inequality 1.00 = equality
0.00
0.20
0.40
0.60
0.80
1.00Economy
Education
Politics
Health
Rank Score(out of 135 countries) (0.00 = inequality, 1.00 = equality)
Gender Gap Subindexes
Economic Participation and Opportunity ......... 64 0.654 0.588
Labour force participation .................................... 62 0.80 0.68 55 68 0.80
Wage equality for similar work (survey) .......... 129 0.47 0.65 — — 0.47
Estimated earned income (PPP US$) ................. 48 0.64 0.52 16,007 25,075 0.64
Legislators, senior officials, and managers ...... 26 0.57 0.26 36 64 0.57
Professional and technical workers .................... 1 1.00 0.64 60 40 1.52
Educational Attainment ........................................ 56 0.993 0.928
Literacy rate ............................................................ 45 1.00 0.86 99 99 1.00
Enrolment in primary education .......................... 93 0.99 0.98 90 91 0.99
Enrolment in secondary education ..................... 85 0.99 0.90 91 92 0.99
Enrolment in tertiary education ............................. 1 1.00 0.86 72 53 1.37
Health and Survival ................................................. 1 0.980 0.956
Sex ratio at birth (female/male) ............................. 1 0.94 0.92 — — 0.95
Healthy life expectancy .......................................... 1 1.06 1.04 69 62 1.11
Political Empowerment ...................................... 127 0.031 0.185
Women in parliament .......................................... 108 0.10 0.22 9 91 0.10
Women in ministerial positions ......................... 129 0.00 0.18 0 100 0.00
Years with female head of state (last 50) .......... 52 0.00 0.16 0 50 0.00
HungaryGender Gap Index 2011 85 0.664
Key Indicators
Total population (millions) 10.00
Population growth (%) –0.17
GDP (US$ billions) 57.07
GDP (PPP) per capita 16,520

Global Gender Gap Report 2011 Country Profiles 195
Economic Participation and Opportunity Educational Attainment Health and Survival Political Empowerment
Evolution 2006–2011
1 Survey data, responses on a 1-to-7 scale (1 = worst score, 7 = best score)2 Data on a 0-to-1 scale (1 = worst score, 0 = best score)3 Data on a 1-to-5 scale (1 = worst score, 5 = best score)4 Bracketed numbers show the range between the uncertainties, estimated
to contain the true maternal mortality ratio with a 95% probability
ECONOMIC EDUCATIONAL HEALTH AND POLITICAL OVERALL PARTICIPATION ATTAINMENT SURVIVAL EMPOWERMENT
Rank Score Rank Score Rank Score Rank Score Rank Score
0.0
0.2
0.4
0.6
0.8
1.0
2006 2007 2008 2009 2010 2011
Additional Data
Economic EmpowermentFemale adult unemployment rate (% of female labour force) .......10Male adult unemployment rate (% of male labour force) ................8Women in non-agricultural paid labour
(% of total labour force) ....................................................................48Inheritance practices in favour of male heirs2 ................................ —Firms with female participation in ownership (% of firms) ........... —Women’s access to land ownership2 ............................................... —Women’s access to bank loans2 ........................................................ —Women’s access to property other than land2 ............................... —Women’s access to finance programmes3 .........................................5Ability of women to rise to positions of
enterprise leadership1 ....................................................................3.60
EducationFemale teachers, primary education (%) ..........................................96Female teachers, secondary education (%) .....................................71Female teachers, tertiary education (%) ...........................................38Female school life expectancy, primary to secondary (years)......12Male school life expectancy, primary to secondary (years) .........12
Marriage and ChildbearingMean age of marriage for women (years) ........................................30Early marriage (% women, aged 15–19) ........................................... —Fertility rate (births per woman) .......................................................1.40Adolescent fertility rate (births per 1,000 women, aged 15–19) ....19Antenatal care coverage, at least one visit (%) .............................. —Births attended by skilled health staff (%) ......................................100Maternal mortality ratio (per 100,000 live births)4 ...............13 [10-17]Contraceptive prevalence, married women (%) ..............................81Female HIV prevalence, aged 15–49 (%) ......................................<0.10Male HIV prevalence, aged 15–49 (%) ............................................0.10Infant mortality rate (per 1,000 live births) ..........................................5Overall population sex ratio (male/female) ....................................0.90
Social Institutions and Political RightsPaternal versus maternal authority2.................................................. —Female genital mutilation2 ................................................................... —Acceptance or legality of polygamy2 ................................................ —Existence of legislation punishing acts
of violence against women2 ............................................................ —Year women received right to vote ......................................1918, 1945Quota type ..........................................................................No legislated;
voluntary political party quotasExistence of legislation prohibiting
gender-based discrimination .......................................................... —
Childcare EcosystemLength of maternity leave ........................................................24 weeksMaternity leave benefits (% of wages paid) .....................................70Provider of maternity coverage ............................... Social insuranceLength of paternity leave ..................................................................... —Paternity leave benefits (% of wages paid) ..................................... —Daycare options .................................................................................... —
HungaryGender Gap Index 2011 (out of 135 countries) 85 0.664 64 0.654 56 0.993 1 0.980 127 0.031
Gender Gap Index 2010 (out of 134 countries) 79 0.672 48 0.689 64 0.990 49 0.978 126 0.031
Gender Gap Index 2009 (out of 134 countries) 65 0.688 55 0.674 64 0.992 41 0.979 81 0.106
Gender Gap Index 2008 (out of 130 countries) 60 0.687 50 0.669 64 0.993 38 0.979 77 0.106
Gender Gap Index 2007 (out of 128 countries) 61 0.673 56 0.653 50 0.991 37 0.979 93 0.069
Gender Gap Index 2006 (out of 115 countries) 55 0.670 48 0.640 49 0.991 36 0.979 82 0.069

Female-to-male ratio
0.00 = INEQUALITY 1.00 = EQUALITY 1.50
0.00 = INEQUALITY 1.00 = EQUALITY 1.50
0.00 = INEQUALITY 1.00 = EQUALITY 1.50
0.00 = INEQUALITY 1.00 = EQUALITY 1.50
Female-to-male ratio
Female-to-male ratio
Female-to-male ratio
196 Country Profiles Global Gender Gap Report 2011
Sample Female-to- Rank Score average Female Male male ratio
country score sample average
0.00 = inequality 1.00 = equality
0.00
0.20
0.40
0.60
0.80
1.00Economy
Education
Politics
Health
Rank Score(out of 135 countries) (0.00 = inequality, 1.00 = equality)
Gender Gap Subindexes
Economic Participation and Opportunity ......... 24 0.745 0.588
Labour force participation .................................... 21 0.90 0.68 81 90 0.90
Wage equality for similar work (survey) ............ 43 0.70 0.65 — — 0.70
Estimated earned income (PPP US$) ................. 26 0.69 0.52 27,675 40,000 0.69
Legislators, senior officials, and managers ...... 40 0.50 0.26 33 67 0.50
Professional and technical workers .................... 1 1.00 0.64 56 44 1.28
Educational Attainment .......................................... 1 1.000 0.928
Literacy rate .............................................................. 1 1.00 0.86 99 99 1.00
Enrolment in primary education ............................ 1 1.00 0.98 98 98 1.00
Enrolment in secondary education ....................... 1 1.00 0.90 89 88 1.02
Enrolment in tertiary education ............................. 1 1.00 0.86 99 51 1.92
Health and Survival ............................................... 96 0.970 0.956
Sex ratio at birth (female/male) ............................. 1 0.94 0.92 — — 0.96
Healthy life expectancy ...................................... 102 1.03 1.04 75 73 1.03
Political Empowerment .......................................... 1 0.697 0.185
Women in parliament .............................................. 4 0.75 0.22 43 57 0.75
Women in ministerial positions ............................. 4 0.83 0.18 45 55 0.83
Years with female head of state (last 50) ............ 3 0.58 0.16 18 32 0.58
IcelandGender Gap Index 2011 1 0.853
Key Indicators
Total population (millions) 0.32
Population growth (%) –0.19
GDP (US$ billions) 10.83
GDP (PPP) per capita 32,853

Global Gender Gap Report 2011 Country Profiles 197
Economic Participation and Opportunity Educational Attainment Health and Survival Political Empowerment
Evolution 2006–2011
1 Survey data, responses on a 1-to-7 scale (1 = worst score, 7 = best score)2 Data on a 0-to-1 scale (1 = worst score, 0 = best score)3 Data on a 1-to-5 scale (1 = worst score, 5 = best score)4 Bracketed numbers show the range between the uncertainties, estimated
to contain the true maternal mortality ratio with a 95% probability
ECONOMIC EDUCATIONAL HEALTH AND POLITICAL OVERALL PARTICIPATION ATTAINMENT SURVIVAL EMPOWERMENT
Rank Score Rank Score Rank Score Rank Score Rank Score
0.0
0.2
0.4
0.6
0.8
1.0
2006 2007 2008 2009 2010 2011
Additional Data
Economic EmpowermentFemale adult unemployment rate (% of female labour force) .........6Male adult unemployment rate (% of male labour force) ................3Women in non-agricultural paid labour
(% of total labour force) ....................................................................49Inheritance practices in favour of male heirs2 ................................ —Firms with female participation in ownership (% of firms) ........... —Women’s access to land ownership2 ............................................... —Women’s access to bank loans2 ........................................................ —Women’s access to property other than land2 ............................... —Women’s access to finance programmes3 .........................................5Ability of women to rise to positions of
enterprise leadership1 ....................................................................5.33
EducationFemale teachers, primary education (%) ......................................... —Female teachers, secondary education (%) .................................... —Female teachers, tertiary education (%) ...........................................49Female school life expectancy, primary to secondary (years)......15Male school life expectancy, primary to secondary (years) .........14
Marriage and ChildbearingMean age of marriage for women (years) ........................................28Early marriage (% women, aged 15–19) ........................................... —Fertility rate (births per woman) .......................................................2.10Adolescent fertility rate (births per 1,000 women, aged 15–19) ....15Antenatal care coverage, at least one visit (%) .............................. —Births attended by skilled health staff (%) ....................................... —Maternal mortality ratio (per 100,000 live births)4 .....................5 [5-6]Contraceptive prevalence, married women (%) ............................. —Female HIV prevalence, aged 15–49 (%) ........................................0.20Male HIV prevalence, aged 15–49 (%) ............................................0.40Infant mortality rate (per 1,000 live births) ..........................................2Overall population sex ratio (male/female) ....................................1.06
Social Institutions and Political RightsPaternal versus maternal authority2.................................................. —Female genital mutilation2 ................................................................... —Acceptance or legality of polygamy2 ................................................ —Existence of legislation punishing acts
of violence against women2 ............................................................ —Year women received right to vote ......................................1915, 1920Quota type ..........................................................................No legislated;
voluntary political party quotasExistence of legislation prohibiting
gender-based discrimination ........................................................ Yes
Childcare EcosystemLength of maternity leave ........................................................ 3 monthsMaternity leave benefits (% of wages paid) .....................................80Provider of maternity coverage ...................................Social securityLength of paternity leave .........................................................13 weeksPaternity leave benefits (% of wages paid) ................Approximately
80%; up to a ceilingDaycare options ......................................................................Public and
private daycare with allowance; homecare with allowance
IcelandGender Gap Index 2011 (out of 135 countries) 1 0.853 24 0.745 1 1.000 96 0.970 1 0.697
Gender Gap Index 2010 (out of 134 countries) 1 0.850 18 0.754 1 1.000 96 0.970 1 0.675
Gender Gap Index 2009 (out of 134 countries) 1 0.828 16 0.750 1 1.000 101 0.970 1 0.591
Gender Gap Index 2008 (out of 130 countries) 4 0.800 20 0.732 61 0.993 96 0.970 3 0.504
Gender Gap Index 2007 (out of 128 countries) 4 0.784 23 0.721 67 0.987 95 0.970 4 0.456
Gender Gap Index 2006 (out of 115 countries) 4 0.781 17 0.711 50 0.991 92 0.968 4 0.456

Female-to-male ratio
0.00 = INEQUALITY 1.00 = EQUALITY 1.50
0.00 = INEQUALITY 1.00 = EQUALITY 1.50
0.00 = INEQUALITY 1.00 = EQUALITY 1.50
0.00 = INEQUALITY 1.00 = EQUALITY 1.50
Female-to-male ratio
Female-to-male ratio
Female-to-male ratio
198 Country Profiles Global Gender Gap Report 2011
Sample Female-to- Rank Score average Female Male male ratio
country score sample average
0.00 = inequality 1.00 = equality
0.00
0.20
0.40
0.60
0.80
1.00Economy
Education
Politics
Health
Rank Score(out of 135 countries) (0.00 = inequality, 1.00 = equality)
Gender Gap Subindexes
Economic Participation and Opportunity ....... 131 0.396 0.588
Labour force participation .................................. 123 0.42 0.68 35 85 0.42
Wage equality for similar work (survey) ............ 86 0.62 0.65 — — 0.62
Estimated earned income (PPP US$) ............... 121 0.31 0.52 1,518 4,960 0.31
Legislators, senior officials, and managers .... 123 0.03 0.26 3 97 0.03
Professional and technical workers ..................— — 0.64 — — —
Educational Attainment ...................................... 121 0.837 0.928
Literacy rate .......................................................... 123 0.68 0.86 51 75 0.68
Enrolment in primary education ........................ 117 0.96 0.98 88 91 0.96
Enrolment in secondary education ................... 120 0.79 0.90 — — 0.79
Enrolment in tertiary education ......................... 109 0.70 0.86 11 16 0.70
Health and Survival ............................................. 134 0.931 0.956
Sex ratio at birth (female/male) ......................... 133 0.89 0.92 — — 0.89
Healthy life expectancy ...................................... 111 1.02 1.04 57 56 1.02
Political Empowerment ........................................ 19 0.312 0.185
Women in parliament ............................................ 98 0.12 0.22 11 89 0.12
Women in ministerial positions ........................... 87 0.11 0.18 10 90 0.11
Years with female head of state (last 50) ............ 4 0.56 0.16 18 32 0.56
IndiaGender Gap Index 2011 113 0.619
Key Indicators
Total population (millions) 1,170.94
Population growth (%) 1.34
GDP (US$ billions) 971.49
GDP (PPP) per capita 3,240

Global Gender Gap Report 2011 Country Profiles 199
Economic Participation and Opportunity Educational Attainment Health and Survival Political Empowerment
Evolution 2006–2011
1 Survey data, responses on a 1-to-7 scale (1 = worst score, 7 = best score)2 Data on a 0-to-1 scale (1 = worst score, 0 = best score)3 Data on a 1-to-5 scale (1 = worst score, 5 = best score)4 Bracketed numbers show the range between the uncertainties, estimated
to contain the true maternal mortality ratio with a 95% probability
ECONOMIC EDUCATIONAL HEALTH AND POLITICAL OVERALL PARTICIPATION ATTAINMENT SURVIVAL EMPOWERMENT
Rank Score Rank Score Rank Score Rank Score Rank Score
0.0
0.2
0.4
0.6
0.8
1.0
2006 2007 2008 2009 2010 2011
Additional Data
Economic EmpowermentFemale adult unemployment rate (% of female labour force) .........5Male adult unemployment rate (% of male labour force) ................4Women in non-agricultural paid labour
(% of total labour force) ....................................................................18Inheritance practices in favour of male heirs2 ..............................0.50Firms with female participation in ownership (% of firms) ........... —Women’s access to land ownership2 .............................................0.50Women’s access to bank loans2 ......................................................0.50Women’s access to property other than land2 .............................0.50Women’s access to finance programmes3 .........................................2Ability of women to rise to positions of
enterprise leadership1 ....................................................................4.45
EducationFemale teachers, primary education (%) ..........................................44Female teachers, secondary education (%) .....................................34Female teachers, tertiary education (%) ...........................................40Female school life expectancy, primary to secondary (years)........9Male school life expectancy, primary to secondary (years) .........10
Marriage and ChildbearingMean age of marriage for women (years) ........................................20Early marriage (% women, aged 15–19) ............................................30Fertility rate (births per woman) .......................................................2.70Adolescent fertility rate (births per 1,000 women, aged 15–19) ....45Antenatal care coverage, at least one visit (%) ...............................75Births attended by skilled health staff (%) ........................................47Maternal mortality ratio (per 100,000 live births)4 .........230 [150-350]Contraceptive prevalence, married women (%) ..............................56Female HIV prevalence, aged 15–49 (%) ........................................0.30Male HIV prevalence, aged 15–49 (%) ............................................0.40Infant mortality rate (per 1,000 live births) ........................................50Overall population sex ratio (male/female) ....................................1.07
Social Institutions and Political RightsPaternal versus maternal authority2................................................1.00Female genital mutilation2 .................................................................0.00Acceptance or legality of polygamy2 ..............................................1.00Existence of legislation punishing acts
of violence against women2 ..........................................................0.33Year women received right to vote ......................................1935, 1950Quota type .............................................................................................. —Existence of legislation prohibiting
gender-based discrimination .......................................................... —
Childcare EcosystemLength of maternity leave ........................................................12 weeksMaternity leave benefits (% of wages paid) ...................................100Provider of maternity coverage ............................... Social insurance
or employer (for non-covered women)Length of paternity leave ..................................................................... —Paternity leave benefits (% of wages paid) ..................................... —Daycare options .................................................................................... —
IndiaGender Gap Index 2011 (out of 135 countries) 113 0.619 131 0.396 121 0.837 134 0.931 19 0.312
Gender Gap Index 2010 (out of 134 countries) 112 0.615 128 0.403 120 0.837 132 0.931 23 0.291
Gender Gap Index 2009 (out of 134 countries) 114 0.615 127 0.412 121 0.843 134 0.931 24 0.273
Gender Gap Index 2008 (out of 130 countries) 113 0.606 125 0.399 116 0.845 128 0.931 25 0.248
Gender Gap Index 2007 (out of 128 countries) 114 0.594 122 0.398 116 0.819 126 0.931 21 0.227
Gender Gap Index 2006 (out of 115 countries) 98 0.601 110 0.397 102 0.819 103 0.962 20 0.227

Female-to-male ratio
0.00 = INEQUALITY 1.00 = EQUALITY 1.50
0.00 = INEQUALITY 1.00 = EQUALITY 1.50
0.00 = INEQUALITY 1.00 = EQUALITY 1.50
0.00 = INEQUALITY 1.00 = EQUALITY 1.50
Female-to-male ratio
Female-to-male ratio
Female-to-male ratio
200 Country Profiles Global Gender Gap Report 2011
Sample Female-to- Rank Score average Female Male male ratio
country score sample average
0.00 = inequality 1.00 = equality
0.00
0.20
0.40
0.60
0.80
1.00Economy
Education
Politics
Health
Rank Score(out of 135 countries) (0.00 = inequality, 1.00 = equality)
Gender Gap Subindexes
Economic Participation and Opportunity ....... 101 0.564 0.588
Labour force participation .................................. 100 0.61 0.68 53 87 0.61
Wage equality for similar work (survey) ............ 58 0.67 0.65 — — 0.67
Estimated earned income (PPP US$) ............... 109 0.42 0.52 2,487 5,915 0.42
Legislators, senior officials, and managers ...... 85 0.28 0.26 22 78 0.28
Professional and technical workers .................. 80 0.81 0.64 45 55 0.81
Educational Attainment ........................................ 93 0.967 0.928
Literacy rate ............................................................ 93 0.93 0.86 89 95 0.93
Enrolment in primary education ........................ 111 0.97 0.98 94 97 0.97
Enrolment in secondary education ..................... 88 0.98 0.90 68 69 0.98
Enrolment in tertiary education ........................... 93 0.96 0.86 23 24 0.96
Health and Survival ............................................. 106 0.966 0.956
Sex ratio at birth (female/male) ............................. 1 0.94 0.92 — — 0.95
Healthy life expectancy ...................................... 113 1.02 1.04 61 60 1.02
Political Empowerment ........................................ 61 0.140 0.185
Women in parliament ............................................ 67 0.22 0.22 18 82 0.22
Women in ministerial positions ........................... 69 0.17 0.18 14 86 0.17
Years with female head of state (last 50) .......... 24 0.07 0.16 3 47 0.07
IndonesiaGender Gap Index 2011 90 0.659
Key Indicators
Total population (millions) 232.52
Population growth (%) 1.10
GDP (US$ billions) 274.37
GDP (PPP) per capita 4,003

Global Gender Gap Report 2011 Country Profiles 201
Economic Participation and Opportunity Educational Attainment Health and Survival Political Empowerment
Evolution 2006–2011
1 Survey data, responses on a 1-to-7 scale (1 = worst score, 7 = best score)2 Data on a 0-to-1 scale (1 = worst score, 0 = best score)3 Data on a 1-to-5 scale (1 = worst score, 5 = best score)4 Bracketed numbers show the range between the uncertainties, estimated
to contain the true maternal mortality ratio with a 95% probability
ECONOMIC EDUCATIONAL HEALTH AND POLITICAL OVERALL PARTICIPATION ATTAINMENT SURVIVAL EMPOWERMENT
Rank Score Rank Score Rank Score Rank Score Rank Score
0.0
0.2
0.4
0.6
0.8
1.0
2006 2007 2008 2009 2010 2011
Additional Data
Economic EmpowermentFemale adult unemployment rate (% of female labour force) .........8Male adult unemployment rate (% of male labour force) ................8Women in non-agricultural paid labour
(% of total labour force) ....................................................................32Inheritance practices in favour of male heirs2 ..............................0.50Firms with female participation in ownership (% of firms) ........... —Women’s access to land ownership2 .............................................0.00Women’s access to bank loans2 ......................................................0.00Women’s access to property other than land2 .............................0.00Women’s access to finance programmes3 .........................................2Ability of women to rise to positions of
enterprise leadership1 ....................................................................4.86
EducationFemale teachers, primary education (%) ..........................................60Female teachers, secondary education (%) .....................................48Female teachers, tertiary education (%) ...........................................40Female school life expectancy, primary to secondary (years)......12Male school life expectancy, primary to secondary (years) .........12
Marriage and ChildbearingMean age of marriage for women (years) ........................................23Early marriage (% women, aged 15–19) ............................................13Fertility rate (births per woman) .......................................................2.20Adolescent fertility rate (births per 1,000 women, aged 15–19) ....52Antenatal care coverage, at least one visit (%) ...............................93Births attended by skilled health staff (%) ........................................73Maternal mortality ratio (per 100,000 live births)4 .........240 [140-380]Contraceptive prevalence, married women (%) ..............................61Female HIV prevalence, aged 15–49 (%) ........................................0.10Male HIV prevalence, aged 15–49 (%) ............................................0.30Infant mortality rate (per 1,000 live births) ........................................30Overall population sex ratio (male/female) ....................................1.00
Social Institutions and Political RightsPaternal versus maternal authority2................................................0.50Female genital mutilation2 .................................................................0.10Acceptance or legality of polygamy2 ..............................................0.50Existence of legislation punishing acts
of violence against women2 ..........................................................0.67Year women received right to vote ......................................1945, 2003Quota type ................................................Legislated candidate quotasExistence of legislation prohibiting
gender-based discrimination .......................................................... —
Childcare EcosystemLength of maternity leave ........................................................ 3 monthsMaternity leave benefits (% of wages paid) ...................................100Provider of maternity coverage .............................................EmployerLength of paternity leave ..................................................................... —Paternity leave benefits (% of wages paid) ..................................... —Daycare options .................................................................................... —
IndonesiaGender Gap Index 2011 (out of 135 countries) 90 0.659 101 0.564 93 0.967 106 0.966 61 0.140
Gender Gap Index 2010 (out of 134 countries) 87 0.661 100 0.575 95 0.964 105 0.966 58 0.141
Gender Gap Index 2009 (out of 134 countries) 92 0.658 100 0.572 95 0.966 87 0.972 70 0.122
Gender Gap Index 2008 (out of 130 countries) 93 0.647 90 0.571 97 0.945 82 0.972 80 0.101
Gender Gap Index 2007 (out of 128 countries) 81 0.655 82 0.599 93 0.949 81 0.972 70 0.101
Gender Gap Index 2006 (out of 115 countries) 68 0.654 67 0.598 81 0.949 88 0.969 63 0.101

Female-to-male ratio
0.00 = INEQUALITY 1.00 = EQUALITY 1.50
0.00 = INEQUALITY 1.00 = EQUALITY 1.50
0.00 = INEQUALITY 1.00 = EQUALITY 1.50
0.00 = INEQUALITY 1.00 = EQUALITY 1.50
Female-to-male ratio
Female-to-male ratio
Female-to-male ratio
202 Country Profiles Global Gender Gap Report 2011
Sample Female-to- Rank Score average Female Male male ratio
country score sample average
0.00 = inequality 1.00 = equality
0.00
0.20
0.40
0.60
0.80
1.00Economy
Education
Politics
Health
Rank Score(out of 135 countries) (0.00 = inequality, 1.00 = equality)
Gender Gap Subindexes
Economic Participation and Opportunity ....... 125 0.444 0.588
Labour force participation .................................. 122 0.44 0.68 33 76 0.44
Wage equality for similar work (survey) ............ 96 0.60 0.65 — — 0.60
Estimated earned income (PPP US$) ............... 114 0.40 0.52 6,564 16,386 0.40
Legislators, senior officials, and managers .... 102 0.15 0.26 13 87 0.15
Professional and technical workers .................. 98 0.50 0.64 33 67 0.50
Educational Attainment ...................................... 105 0.925 0.928
Literacy rate .......................................................... 100 0.90 0.86 81 89 0.90
Enrolment in primary education ............................ 1 1.00 0.98 100 99 1.01
Enrolment in secondary education ................... 126 0.75 0.90 40 53 0.75
Enrolment in tertiary education ............................. 1 1.00 0.86 38 35 1.07
Health and Survival ............................................... 85 0.971 0.956
Sex ratio at birth (female/male) ............................. 1 0.94 0.92 — — 0.95
Healthy life expectancy ........................................ 91 1.03 1.04 62 60 1.03
Political Empowerment ...................................... 130 0.017 0.185
Women in parliament .......................................... 126 0.03 0.22 3 97 0.03
Women in ministerial positions ......................... 127 0.03 0.18 3 97 0.03
Years with female head of state (last 50) .......... 52 0.00 0.16 0 50 0.00
Iran, Islamic Rep.Gender Gap Index 2011 125 0.589
Key Indicators
Total population (millions) 73.86
Population growth (%) 1.31
GDP (US$ billions) 158.09
GDP (PPP) per capita 10,496

Global Gender Gap Report 2011 Country Profiles 203
Economic Participation and Opportunity Educational Attainment Health and Survival Political Empowerment
Evolution 2006–2011
1 Survey data, responses on a 1-to-7 scale (1 = worst score, 7 = best score)2 Data on a 0-to-1 scale (1 = worst score, 0 = best score)3 Data on a 1-to-5 scale (1 = worst score, 5 = best score)4 Bracketed numbers show the range between the uncertainties, estimated
to contain the true maternal mortality ratio with a 95% probability
ECONOMIC EDUCATIONAL HEALTH AND POLITICAL OVERALL PARTICIPATION ATTAINMENT SURVIVAL EMPOWERMENT
Rank Score Rank Score Rank Score Rank Score Rank Score
0.0
0.2
0.4
0.6
0.8
1.0
2006 2007 2008 2009 2010 2011
Additional Data
Economic EmpowermentFemale adult unemployment rate (% of female labour force) .......17Male adult unemployment rate (% of male labour force) ................9Women in non-agricultural paid labour
(% of total labour force) ....................................................................16Inheritance practices in favour of male heirs2 ..............................0.50Firms with female participation in ownership (% of firms) ............25Women’s access to land ownership2 .............................................0.50Women’s access to bank loans2 ......................................................0.50Women’s access to property other than land2 .............................0.50Women’s access to finance programmes3 .........................................2Ability of women to rise to positions of
enterprise leadership1 ....................................................................3.75
EducationFemale teachers, primary education (%) ..........................................57Female teachers, secondary education (%) .................................... —Female teachers, tertiary education (%) ...........................................19Female school life expectancy, primary to secondary (years)......11Male school life expectancy, primary to secondary (years) .........11
Marriage and ChildbearingMean age of marriage for women (years) ........................................24Early marriage (% women, aged 15–19) ............................................18Fertility rate (births per woman) .......................................................1.80Adolescent fertility rate (births per 1,000 women, aged 15–19) ....35Antenatal care coverage, at least one visit (%) ...............................99Births attended by skilled health staff (%) ........................................97Maternal mortality ratio (per 100,000 live births)4 ...............30 [18-50]Contraceptive prevalence, married women (%) ..............................73Female HIV prevalence, aged 15–49 (%) ........................................0.10Male HIV prevalence, aged 15–49 (%) ............................................0.20Infant mortality rate (per 1,000 live births) ........................................26Overall population sex ratio (male/female) ....................................1.03
Social Institutions and Political RightsPaternal versus maternal authority2................................................1.00Female genital mutilation2 .................................................................0.00Acceptance or legality of polygamy2 ..............................................1.00Existence of legislation punishing acts
of violence against women2 ..........................................................1.00Year women received right to vote ................................................1963Quota type .............................................................................................. —Existence of legislation prohibiting
gender-based discrimination .......................................................... —
Childcare EcosystemLength of maternity leave ........................................................... 90 daysMaternity leave benefits (% of wages paid) .....................................67Provider of maternity coverage ...................................Social securityLength of paternity leave ..................................................................... —Paternity leave benefits (% of wages paid) ..................................... —Daycare options .................................................................................... —
Iran, Islamic Rep.Gender Gap Index 2011 (out of 135 countries) 125 0.589 125 0.444 105 0.925 85 0.971 130 0.017
Gender Gap Index 2010 (out of 134 countries) 123 0.593 125 0.426 96 0.959 83 0.971 129 0.017
Gender Gap Index 2009 (out of 134 countries) 128 0.584 131 0.377 96 0.964 63 0.978 132 0.017
Gender Gap Index 2008 (out of 130 countries) 116 0.602 118 0.449 92 0.965 60 0.978 128 0.017
Gender Gap Index 2007 (out of 128 countries) 118 0.590 123 0.395 90 0.958 58 0.978 122 0.031
Gender Gap Index 2006 (out of 115 countries) 108 0.580 113 0.359 80 0.954 52 0.978 109 0.031
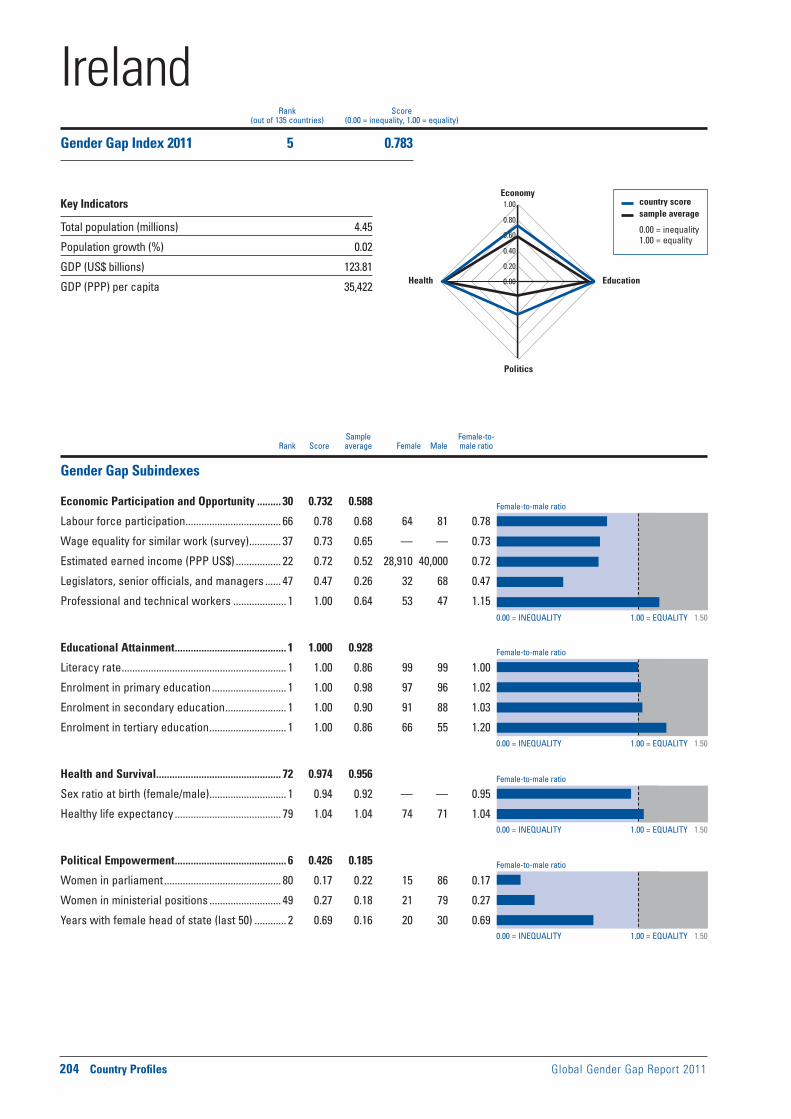
Female-to-male ratio
0.00 = INEQUALITY 1.00 = EQUALITY 1.50
0.00 = INEQUALITY 1.00 = EQUALITY 1.50
0.00 = INEQUALITY 1.00 = EQUALITY 1.50
0.00 = INEQUALITY 1.00 = EQUALITY 1.50
Female-to-male ratio
Female-to-male ratio
Female-to-male ratio
204 Country Profiles Global Gender Gap Report 2011
Sample Female-to- Rank Score average Female Male male ratio
country score sample average
0.00 = inequality 1.00 = equality
0.00
0.20
0.40
0.60
0.80
1.00Economy
Education
Politics
Health
Rank Score(out of 135 countries) (0.00 = inequality, 1.00 = equality)
Gender Gap Subindexes
Economic Participation and Opportunity ......... 30 0.732 0.588
Labour force participation .................................... 66 0.78 0.68 64 81 0.78
Wage equality for similar work (survey) ............ 37 0.73 0.65 — — 0.73
Estimated earned income (PPP US$) ................. 22 0.72 0.52 28,910 40,000 0.72
Legislators, senior officials, and managers ...... 47 0.47 0.26 32 68 0.47
Professional and technical workers .................... 1 1.00 0.64 53 47 1.15
Educational Attainment .......................................... 1 1.000 0.928
Literacy rate .............................................................. 1 1.00 0.86 99 99 1.00
Enrolment in primary education ............................ 1 1.00 0.98 97 96 1.02
Enrolment in secondary education ....................... 1 1.00 0.90 91 88 1.03
Enrolment in tertiary education ............................. 1 1.00 0.86 66 55 1.20
Health and Survival ............................................... 72 0.974 0.956
Sex ratio at birth (female/male) ............................. 1 0.94 0.92 — — 0.95
Healthy life expectancy ........................................ 79 1.04 1.04 74 71 1.04
Political Empowerment .......................................... 6 0.426 0.185
Women in parliament ............................................ 80 0.17 0.22 15 86 0.17
Women in ministerial positions ........................... 49 0.27 0.18 21 79 0.27
Years with female head of state (last 50) ............ 2 0.69 0.16 20 30 0.69
IrelandGender Gap Index 2011 5 0.783
Key Indicators
Total population (millions) 4.45
Population growth (%) 0.02
GDP (US$ billions) 123.81
GDP (PPP) per capita 35,422

Global Gender Gap Report 2011 Country Profiles 205
Economic Participation and Opportunity Educational Attainment Health and Survival Political Empowerment
Evolution 2006–2011
1 Survey data, responses on a 1-to-7 scale (1 = worst score, 7 = best score)2 Data on a 0-to-1 scale (1 = worst score, 0 = best score)3 Data on a 1-to-5 scale (1 = worst score, 5 = best score)4 Bracketed numbers show the range between the uncertainties, estimated
to contain the true maternal mortality ratio with a 95% probability
ECONOMIC EDUCATIONAL HEALTH AND POLITICAL OVERALL PARTICIPATION ATTAINMENT SURVIVAL EMPOWERMENT
Rank Score Rank Score Rank Score Rank Score Rank Score
0.0
0.2
0.4
0.6
0.8
1.0
2006 2007 2008 2009 2010 2011
Additional Data
Economic EmpowermentFemale adult unemployment rate (% of female labour force) .........8Male adult unemployment rate (% of male labour force) ................7Women in non-agricultural paid labour
(% of total labour force) ....................................................................49Inheritance practices in favour of male heirs2 ................................ —Firms with female participation in ownership (% of firms) ........... —Women’s access to land ownership2 ............................................... —Women’s access to bank loans2 ........................................................ —Women’s access to property other than land2 ............................... —Women’s access to finance programmes3 .........................................5Ability of women to rise to positions of
enterprise leadership1 ....................................................................5.10
EducationFemale teachers, primary education (%) ..........................................84Female teachers, secondary education (%) .....................................62Female teachers, tertiary education (%) ...........................................38Female school life expectancy, primary to secondary (years)......14Male school life expectancy, primary to secondary (years) .........14
Marriage and ChildbearingMean age of marriage for women (years) ........................................31Early marriage (% women, aged 15–19) ........................................... —Fertility rate (births per woman) .......................................................2.00Adolescent fertility rate (births per 1,000 women, aged 15–19) ....17Antenatal care coverage, at least one visit (%) .............................100Births attended by skilled health staff (%) ......................................100Maternal mortality ratio (per 100,000 live births)4 .....................3 [2-3]Contraceptive prevalence, married women (%) ..............................75Female HIV prevalence, aged 15–49 (%) ........................................0.10Male HIV prevalence, aged 15–49 (%) ............................................0.30Infant mortality rate (per 1,000 live births) ..........................................3Overall population sex ratio (male/female) ....................................1.00
Social Institutions and Political RightsPaternal versus maternal authority2.................................................. —Female genital mutilation2 ................................................................... —Acceptance or legality of polygamy2 ................................................ —Existence of legislation punishing acts
of violence against women2 ............................................................ —Year women received right to vote ......................................1918, 1928Quota type .............................................................................................. —Existence of legislation prohibiting
gender-based discrimination ........................................................ Yes
Childcare EcosystemLength of maternity leave ........................................................26 weeksMaternity leave benefits (% of wages paid) ....................................80.
Subject to a minimum and maximum amount.Provider of maternity coverage ............................... Social insuranceLength of paternity leave ..................................................................... —Paternity leave benefits (% of wages paid) ..................................... —Daycare options ............................... Private daycare with allowance
IrelandGender Gap Index 2011 (out of 135 countries) 5 0.783 30 0.732 1 1.000 72 0.974 6 0.426
Gender Gap Index 2010 (out of 134 countries) 6 0.777 25 0.741 1 1.000 89 0.970 7 0.398
Gender Gap Index 2009 (out of 134 countries) 8 0.760 43 0.692 1 1.000 86 0.973 8 0.374
Gender Gap Index 2008 (out of 130 countries) 8 0.752 48 0.681 1 1.000 81 0.973 8 0.354
Gender Gap Index 2007 (out of 128 countries) 9 0.746 48 0.667 1 1.000 80 0.973 8 0.343
Gender Gap Index 2006 (out of 115 countries) 10 0.733 47 0.640 1 1.000 81 0.970 9 0.323

Female-to-male ratio
0.00 = INEQUALITY 1.00 = EQUALITY 1.50
0.00 = INEQUALITY 1.00 = EQUALITY 1.50
0.00 = INEQUALITY 1.00 = EQUALITY 1.50
0.00 = INEQUALITY 1.00 = EQUALITY 1.50
Female-to-male ratio
Female-to-male ratio
Female-to-male ratio
206 Country Profiles Global Gender Gap Report 2011
Sample Female-to- Rank Score average Female Male male ratio
country score sample average
0.00 = inequality 1.00 = equality
0.00
0.20
0.40
0.60
0.80
1.00Economy
Education
Politics
Health
Rank Score(out of 135 countries) (0.00 = inequality, 1.00 = equality)
Gender Gap Subindexes
Economic Participation and Opportunity ......... 55 0.672 0.588
Labour force participation .................................... 29 0.88 0.68 61 69 0.88
Wage equality for similar work (survey) .......... 120 0.53 0.65 — — 0.53
Estimated earned income (PPP US$) ................. 47 0.64 0.52 21,684 33,726 0.64
Legislators, senior officials, and managers ...... 46 0.47 0.26 32 68 0.47
Professional and technical workers .................... 1 1.00 0.64 52 48 1.09
Educational Attainment ........................................ 78 0.987 0.928
Literacy rate ............................................................ 94 0.93 0.86 89 95 0.93
Enrolment in primary education ............................ 1 1.00 0.98 97 96 1.01
Enrolment in secondary education ....................... 1 1.00 0.90 87 85 1.02
Enrolment in tertiary education ............................. 1 1.00 0.86 71 54 1.31
Health and Survival ............................................... 92 0.970 0.956
Sex ratio at birth (female/male) ............................. 1 0.94 0.92 — — 0.95
Healthy life expectancy ........................................ 98 1.03 1.04 74 72 1.03
Political Empowerment ........................................ 59 0.141 0.185
Women in parliament ............................................ 59 0.24 0.22 19 81 0.24
Women in ministerial positions ......................... 108 0.07 0.18 7 93 0.07
Years with female head of state (last 50) .......... 17 0.11 0.16 5 45 0.11
IsraelGender Gap Index 2011 55 0.693
Key Indicators
Total population (millions) 7.58
Population growth (%) 1.80
GDP (US$ billions) 169.83
GDP (PPP) per capita 26,184

Global Gender Gap Report 2011 Country Profiles 207
Economic Participation and Opportunity Educational Attainment Health and Survival Political Empowerment
Evolution 2006–2011
1 Survey data, responses on a 1-to-7 scale (1 = worst score, 7 = best score)2 Data on a 0-to-1 scale (1 = worst score, 0 = best score)3 Data on a 1-to-5 scale (1 = worst score, 5 = best score)4 Bracketed numbers show the range between the uncertainties, estimated
to contain the true maternal mortality ratio with a 95% probability
ECONOMIC EDUCATIONAL HEALTH AND POLITICAL OVERALL PARTICIPATION ATTAINMENT SURVIVAL EMPOWERMENT
Rank Score Rank Score Rank Score Rank Score Rank Score
0.0
0.2
0.4
0.6
0.8
1.0
2006 2007 2008 2009 2010 2011
Additional Data
Economic EmpowermentFemale adult unemployment rate (% of female labour force) .........8Male adult unemployment rate (% of male labour force) ................6Women in non-agricultural paid labour
(% of total labour force) ....................................................................49Inheritance practices in favour of male heirs2 ................................ —Firms with female participation in ownership (% of firms) ........... —Women’s access to land ownership2 ............................................... —Women’s access to bank loans2 ........................................................ —Women’s access to property other than land2 ............................... —Women’s access to finance programmes3 .........................................4Ability of women to rise to positions of
enterprise leadership1 ....................................................................4.45
EducationFemale teachers, primary education (%) ..........................................84Female teachers, secondary education (%) .....................................71Female teachers, tertiary education (%) .......................................... —Female school life expectancy, primary to secondary (years)......12Male school life expectancy, primary to secondary (years) .........12
Marriage and ChildbearingMean age of marriage for women (years) ........................................26Early marriage (% women, aged 15–19) ........................................... —Fertility rate (births per woman) .......................................................2.80Adolescent fertility rate (births per 1,000 women, aged 15–19) ....15Antenatal care coverage, at least one visit (%) .............................. —Births attended by skilled health staff (%) ....................................... —Maternal mortality ratio (per 100,000 live births)4 .....................7 [6-7]Contraceptive prevalence, married women (%) ..............................68Female HIV prevalence, aged 15–49 (%) ........................................0.10Male HIV prevalence, aged 15–49 (%) ............................................0.20Infant mortality rate (per 1,000 live births) ..........................................4Overall population sex ratio (male/female) ....................................0.98
Social Institutions and Political RightsPaternal versus maternal authority2.................................................. —Female genital mutilation2 ................................................................... —Acceptance or legality of polygamy2 ................................................ —Existence of legislation punishing acts
of violence against women2 ............................................................ —Year women received right to vote ................................................1948Quota type ..........................................................................No legislated;
voluntary political party quotasExistence of legislation prohibiting
gender-based discrimination ........................................................ Yes
Childcare EcosystemLength of maternity leave ........................................................14 weeksMaternity leave benefits (% of wages paid) ....... 100, up to a ceilingProvider of maternity coverage ...................................Social securityLength of paternity leave ..........................The father can take part of
the leave instead of the mother, starting from 6 weeks (up to 14 weeks) after birth. If the mother of the baby has decided to split her maternity leave during an extended period of hospitalization, the father may take unpaid leave during that time
Paternity leave benefits (% of wages paid) ....................................100Daycare options .................................................................................... —
IsraelGender Gap Index 2011 (out of 135 countries) 55 0.693 55 0.672 78 0.987 92 0.970 59 0.141
Gender Gap Index 2010 (out of 134 countries) 52 0.696 49 0.688 80 0.987 91 0.970 63 0.138
Gender Gap Index 2009 (out of 134 countries) 45 0.702 41 0.693 50 0.995 98 0.970 53 0.150
Gender Gap Index 2008 (out of 130 countries) 56 0.690 55 0.659 42 0.996 93 0.970 59 0.135
Gender Gap Index 2007 (out of 128 countries) 36 0.696 45 0.671 38 0.995 92 0.970 41 0.150
Gender Gap Index 2006 (out of 115 countries) 35 0.689 46 0.641 36 0.995 83 0.969 36 0.150

Female-to-male ratio
0.00 = INEQUALITY 1.00 = EQUALITY 1.50
0.00 = INEQUALITY 1.00 = EQUALITY 1.50
0.00 = INEQUALITY 1.00 = EQUALITY 1.50
0.00 = INEQUALITY 1.00 = EQUALITY 1.50
Female-to-male ratio
Female-to-male ratio
Female-to-male ratio
208 Country Profiles Global Gender Gap Report 2011
Sample Female-to- Rank Score average Female Male male ratio
country score sample average
0.00 = inequality 1.00 = equality
0.00
0.20
0.40
0.60
0.80
1.00Economy
Education
Politics
Health
Rank Score(out of 135 countries) (0.00 = inequality, 1.00 = equality)
Gender Gap Subindexes
Economic Participation and Opportunity ......... 90 0.598 0.588
Labour force participation .................................... 88 0.70 0.68 52 74 0.70
Wage equality for similar work (survey) .......... 125 0.51 0.65 — — 0.51
Estimated earned income (PPP US$) ................. 83 0.54 0.52 21,438 40,000 0.54
Legislators, senior officials, and managers ...... 39 0.50 0.26 33 67 0.50
Professional and technical workers .................. 72 0.89 0.64 47 53 0.89
Educational Attainment ........................................ 48 0.995 0.928
Literacy rate ............................................................ 59 0.99 0.86 99 99 0.99
Enrolment in primary education .......................... 89 0.99 0.98 98 99 0.99
Enrolment in secondary education ....................... 1 1.00 0.90 95 94 1.01
Enrolment in tertiary education ............................. 1 1.00 0.86 79 56 1.42
Health and Survival ............................................... 75 0.974 0.956
Sex ratio at birth (female/male) ............................. 1 0.94 0.92 — — 0.94
Healthy life expectancy ........................................ 84 1.04 1.04 76 73 1.04
Political Empowerment ........................................ 55 0.152 0.185
Women in parliament ............................................ 48 0.27 0.22 21 79 0.27
Women in ministerial positions ........................... 46 0.28 0.18 22 78 0.28
Years with female head of state (last 50) .......... 52 0.00 0.16 0 50 0.00
ItalyGender Gap Index 2011 74 0.680
Key Indicators
Total population (millions) 60.57
Population growth (%) 0.58
GDP (US$ billions) 1,125.08
GDP (PPP) per capita 26,713

Global Gender Gap Report 2011 Country Profiles 209
Economic Participation and Opportunity Educational Attainment Health and Survival Political Empowerment
Evolution 2006–2011
1 Survey data, responses on a 1-to-7 scale (1 = worst score, 7 = best score)2 Data on a 0-to-1 scale (1 = worst score, 0 = best score)3 Data on a 1-to-5 scale (1 = worst score, 5 = best score)4 Bracketed numbers show the range between the uncertainties, estimated
to contain the true maternal mortality ratio with a 95% probability
ECONOMIC EDUCATIONAL HEALTH AND POLITICAL OVERALL PARTICIPATION ATTAINMENT SURVIVAL EMPOWERMENT
Rank Score Rank Score Rank Score Rank Score Rank Score
0.0
0.2
0.4
0.6
0.8
1.0
2006 2007 2008 2009 2010 2011
Additional Data
Economic EmpowermentFemale adult unemployment rate (% of female labour force) .........9Male adult unemployment rate (% of male labour force) ................6Women in non-agricultural paid labour
(% of total labour force) ....................................................................44Inheritance practices in favour of male heirs2 ................................ —Firms with female participation in ownership (% of firms) ........... —Women’s access to land ownership2 ............................................... —Women’s access to bank loans2 ........................................................ —Women’s access to property other than land2 ............................... —Women’s access to finance programmes3 .........................................5Ability of women to rise to positions of
enterprise leadership1 ....................................................................3.43
EducationFemale teachers, primary education (%) ..........................................95Female teachers, secondary education (%) .....................................67Female teachers, tertiary education (%) ...........................................35Female school life expectancy, primary to secondary (years)......13Male school life expectancy, primary to secondary (years) .........13
Marriage and ChildbearingMean age of marriage for women (years) ........................................30Early marriage (% women, aged 15–19) ........................................... —Fertility rate (births per woman) .......................................................1.40Adolescent fertility rate (births per 1,000 women, aged 15–19) ......7Antenatal care coverage, at least one visit (%) .............................100Births attended by skilled health staff (%) ........................................99Maternal mortality ratio (per 100,000 live births)4 .....................5 [4-6]Contraceptive prevalence, married women (%) ..............................63Female HIV prevalence, aged 15–49 (%) ........................................0.20Male HIV prevalence, aged 15–49 (%) ............................................0.30Infant mortality rate (per 1,000 live births) ..........................................3Overall population sex ratio (male/female) ....................................0.95
Social Institutions and Political RightsPaternal versus maternal authority2.................................................. —Female genital mutilation2 ................................................................... —Acceptance or legality of polygamy2 ................................................ —Existence of legislation punishing acts
of violence against women2 ............................................................ —Year women received right to vote ................................................1945Quota type ..........................................................................No legislated;
voluntary political party quotasExistence of legislation prohibiting
gender-based discrimination .......................................................... —
Childcare EcosystemLength of maternity leave ........................................................ 5 monthsMaternity leave benefits (% of wages paid) .....................................80Provider of maternity coverage ............................... Social insuranceLength of paternity leave ..................................................................... —Paternity leave benefits (% of wages paid) ..................................... —Daycare options .................................................................................... —
ItalyGender Gap Index 2011 (out of 135 countries) 74 0.680 90 0.598 48 0.995 75 0.974 55 0.152
Gender Gap Index 2010 (out of 134 countries) 74 0.677 97 0.589 49 0.995 95 0.970 54 0.152
Gender Gap Index 2009 (out of 134 countries) 72 0.680 95 0.590 46 0.996 88 0.972 45 0.162
Gender Gap Index 2008 (out of 130 countries) 67 0.679 85 0.587 43 0.996 83 0.972 46 0.160
Gender Gap Index 2007 (out of 128 countries) 84 0.650 101 0.543 32 0.997 82 0.972 80 0.087
Gender Gap Index 2006 (out of 115 countries) 77 0.646 87 0.527 27 0.997 77 0.972 72 0.087

Female-to-male ratio
0.00 = INEQUALITY 1.00 = EQUALITY 1.50
0.00 = INEQUALITY 1.00 = EQUALITY 1.50
0.00 = INEQUALITY 1.00 = EQUALITY 1.50
0.00 = INEQUALITY 1.00 = EQUALITY 1.50
Female-to-male ratio
Female-to-male ratio
Female-to-male ratio
210 Country Profiles Global Gender Gap Report 2011
Sample Female-to- Rank Score average Female Male male ratio
country score sample average
0.00 = inequality 1.00 = equality
0.00
0.20
0.40
0.60
0.80
1.00Economy
Education
Politics
Health
Rank Score(out of 135 countries) (0.00 = inequality, 1.00 = equality)
Gender Gap Subindexes
Economic Participation and Opportunity ......... 21 0.751 0.588
Labour force participation .................................... 65 0.79 0.68 61 78 0.79
Wage equality for similar work (survey) ............ 82 0.63 0.65 — — 0.63
Estimated earned income (PPP US$) ................. 62 0.58 0.52 5,665 9,685 0.58
Legislators, senior officials, and managers ........ 1 1.00 0.26 59 41 1.44
Professional and technical workers .................... 1 1.00 0.64 60 40 1.50
Educational Attainment ........................................ 83 0.985 0.928
Literacy rate .............................................................. 1 1.00 0.86 91 81 1.12
Enrolment in primary education ........................ 115 0.97 0.98 79 82 0.97
Enrolment in secondary education ....................... 1 1.00 0.90 79 75 1.05
Enrolment in tertiary education ............................. 1 1.00 0.86 33 15 2.22
Health and Survival ................................................. 1 0.980 0.956
Sex ratio at birth (female/male) ............................. 1 0.94 0.92 — — 0.95
Healthy life expectancy .......................................... 1 1.06 1.04 66 62 1.06
Political Empowerment ........................................ 92 0.096 0.185
Women in parliament ............................................ 87 0.15 0.22 13 87 0.15
Women in ministerial positions ........................... 75 0.14 0.18 13 88 0.14
Years with female head of state (last 50) .......... 31 0.03 0.16 1 49 0.03
JamaicaGender Gap Index 2011 47 0.703
Key Indicators
Total population (millions) 2.71
Population growth (%) 0.46
GDP (US$ billions) 10.19
GDP (PPP) per capita 7,059
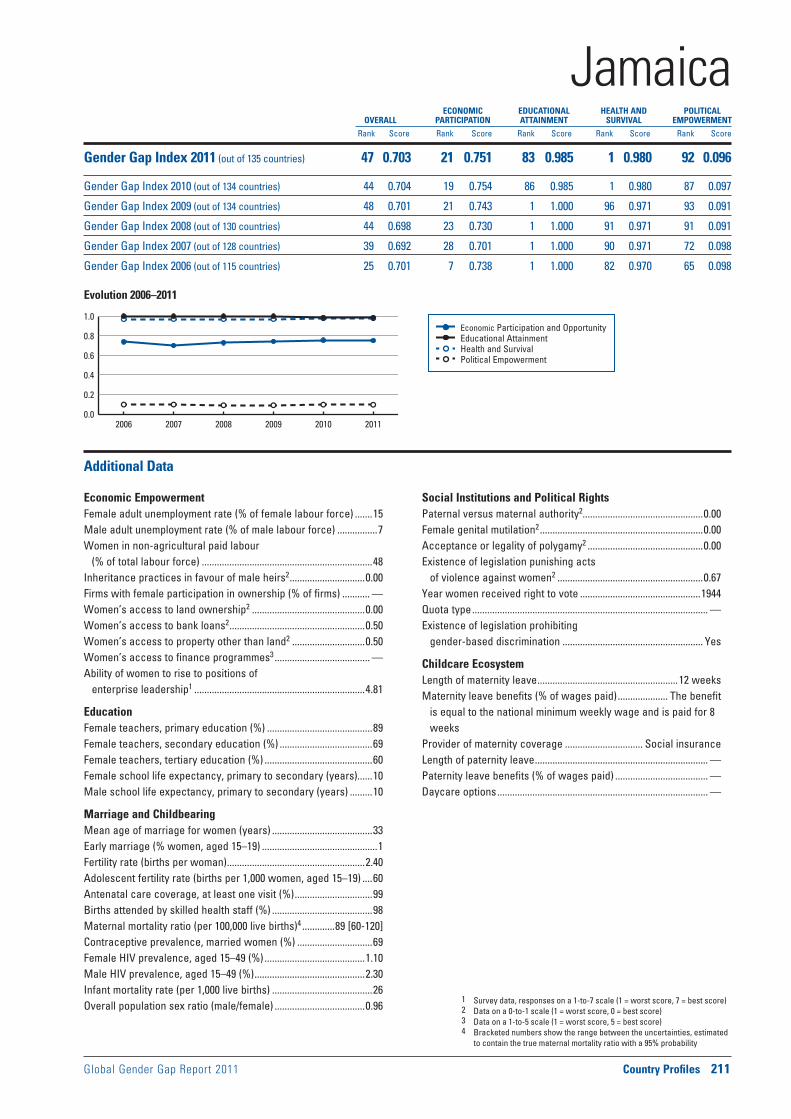
Global Gender Gap Report 2011 Country Profiles 211
Economic Participation and Opportunity Educational Attainment Health and Survival Political Empowerment
Evolution 2006–2011
1 Survey data, responses on a 1-to-7 scale (1 = worst score, 7 = best score)2 Data on a 0-to-1 scale (1 = worst score, 0 = best score)3 Data on a 1-to-5 scale (1 = worst score, 5 = best score)4 Bracketed numbers show the range between the uncertainties, estimated
to contain the true maternal mortality ratio with a 95% probability
ECONOMIC EDUCATIONAL HEALTH AND POLITICAL OVERALL PARTICIPATION ATTAINMENT SURVIVAL EMPOWERMENT
Rank Score Rank Score Rank Score Rank Score Rank Score
0.0
0.2
0.4
0.6
0.8
1.0
2006 2007 2008 2009 2010 2011
Additional Data
Economic EmpowermentFemale adult unemployment rate (% of female labour force) .......15Male adult unemployment rate (% of male labour force) ................7Women in non-agricultural paid labour
(% of total labour force) ....................................................................48Inheritance practices in favour of male heirs2 ..............................0.00Firms with female participation in ownership (% of firms) ........... —Women’s access to land ownership2 .............................................0.00Women’s access to bank loans2 ......................................................0.50Women’s access to property other than land2 .............................0.50Women’s access to finance programmes3 ...................................... —Ability of women to rise to positions of
enterprise leadership1 ....................................................................4.81
EducationFemale teachers, primary education (%) ..........................................89Female teachers, secondary education (%) .....................................69Female teachers, tertiary education (%) ...........................................60Female school life expectancy, primary to secondary (years)......10Male school life expectancy, primary to secondary (years) .........10
Marriage and ChildbearingMean age of marriage for women (years) ........................................33Early marriage (% women, aged 15–19) ..............................................1Fertility rate (births per woman) .......................................................2.40Adolescent fertility rate (births per 1,000 women, aged 15–19) ....60Antenatal care coverage, at least one visit (%) ...............................99Births attended by skilled health staff (%) ........................................98Maternal mortality ratio (per 100,000 live births)4 .............89 [60-120]Contraceptive prevalence, married women (%) ..............................69Female HIV prevalence, aged 15–49 (%) ........................................1.10Male HIV prevalence, aged 15–49 (%) ............................................2.30Infant mortality rate (per 1,000 live births) ........................................26Overall population sex ratio (male/female) ....................................0.96
Social Institutions and Political RightsPaternal versus maternal authority2................................................0.00Female genital mutilation2 .................................................................0.00Acceptance or legality of polygamy2 ..............................................0.00Existence of legislation punishing acts
of violence against women2 ..........................................................0.67Year women received right to vote ................................................1944Quota type .............................................................................................. —Existence of legislation prohibiting
gender-based discrimination ........................................................ Yes
Childcare EcosystemLength of maternity leave ........................................................12 weeksMaternity leave benefits (% of wages paid) .................... The benefit
is equal to the national minimum weekly wage and is paid for 8 weeks
Provider of maternity coverage ............................... Social insuranceLength of paternity leave ..................................................................... —Paternity leave benefits (% of wages paid) ..................................... —Daycare options .................................................................................... —
JamaicaGender Gap Index 2011 (out of 135 countries) 47 0.703 21 0.751 83 0.985 1 0.980 92 0.096
Gender Gap Index 2010 (out of 134 countries) 44 0.704 19 0.754 86 0.985 1 0.980 87 0.097
Gender Gap Index 2009 (out of 134 countries) 48 0.701 21 0.743 1 1.000 96 0.971 93 0.091
Gender Gap Index 2008 (out of 130 countries) 44 0.698 23 0.730 1 1.000 91 0.971 91 0.091
Gender Gap Index 2007 (out of 128 countries) 39 0.692 28 0.701 1 1.000 90 0.971 72 0.098
Gender Gap Index 2006 (out of 115 countries) 25 0.701 7 0.738 1 1.000 82 0.970 65 0.098

Female-to-male ratio
0.00 = INEQUALITY 1.00 = EQUALITY 1.50
0.00 = INEQUALITY 1.00 = EQUALITY 1.50
0.00 = INEQUALITY 1.00 = EQUALITY 1.50
0.00 = INEQUALITY 1.00 = EQUALITY 1.50
Female-to-male ratio
Female-to-male ratio
Female-to-male ratio
212 Country Profiles Global Gender Gap Report 2011
Sample Female-to- Rank Score average Female Male male ratio
country score sample average
0.00 = inequality 1.00 = equality
0.00
0.20
0.40
0.60
0.80
1.00Economy
Education
Politics
Health
Rank Score(out of 135 countries) (0.00 = inequality, 1.00 = equality)
Gender Gap Subindexes
Economic Participation and Opportunity ....... 100 0.567 0.588
Labour force participation .................................... 80 0.73 0.68 62 84 0.73
Wage equality for similar work (survey) ............ 93 0.60 0.65 — — 0.60
Estimated earned income (PPP US$) ................. 87 0.51 0.52 20,572 40,000 0.51
Legislators, senior officials, and managers .... 112 0.10 0.26 9 91 0.10
Professional and technical workers .................. 73 0.87 0.64 47 53 0.87
Educational Attainment ........................................ 80 0.986 0.928
Literacy rate .............................................................. 1 1.00 0.86 99 99 1.00
Enrolment in primary education ............................ 1 1.00 0.98 99 99 1.00
Enrolment in secondary education ....................... 1 1.00 0.90 99 98 1.00
Enrolment in tertiary education ........................... 96 0.89 0.86 55 62 0.89
Health and Survival ................................................. 1 0.980 0.956
Sex ratio at birth (female/male) ............................. 1 0.94 0.92 — — 0.95
Healthy life expectancy .......................................... 1 1.06 1.04 78 73 1.07
Political Empowerment ...................................... 101 0.072 0.185
Women in parliament ............................................ 97 0.13 0.22 11 89 0.13
Women in ministerial positions ........................... 79 0.13 0.18 12 88 0.13
Years with female head of state (last 50) .......... 52 0.00 0.16 0 50 0.00
JapanGender Gap Index 2011 98 0.651
Key Indicators
Total population (millions) 127.38
Population growth (%) –0.14
GDP (US$ billions) 5,064.04
GDP (PPP) per capita 30,920

Global Gender Gap Report 2011 Country Profiles 213
Economic Participation and Opportunity Educational Attainment Health and Survival Political Empowerment
Evolution 2006–2011
1 Survey data, responses on a 1-to-7 scale (1 = worst score, 7 = best score)2 Data on a 0-to-1 scale (1 = worst score, 0 = best score)3 Data on a 1-to-5 scale (1 = worst score, 5 = best score)4 Bracketed numbers show the range between the uncertainties, estimated
to contain the true maternal mortality ratio with a 95% probability
ECONOMIC EDUCATIONAL HEALTH AND POLITICAL OVERALL PARTICIPATION ATTAINMENT SURVIVAL EMPOWERMENT
Rank Score Rank Score Rank Score Rank Score Rank Score
0.0
0.2
0.4
0.6
0.8
1.0
2006 2007 2008 2009 2010 2011
Additional Data
Economic EmpowermentFemale adult unemployment rate (% of female labour force) .........5Male adult unemployment rate (% of male labour force) ................4Women in non-agricultural paid labour
(% of total labour force) ....................................................................42Inheritance practices in favour of male heirs2 ................................ —Firms with female participation in ownership (% of firms) ........... —Women’s access to land ownership2 ............................................... —Women’s access to bank loans2 ........................................................ —Women’s access to property other than land2 ............................... —Women’s access to finance programmes3 .........................................5Ability of women to rise to positions of
enterprise leadership1 ....................................................................3.97
EducationFemale teachers, primary education (%) ..........................................65Female teachers, secondary education (%) .....................................31Female teachers, tertiary education (%) ...........................................18Female school life expectancy, primary to secondary (years)......12Male school life expectancy, primary to secondary (years) .........12
Marriage and ChildbearingMean age of marriage for women (years) ........................................29Early marriage (% women, aged 15–19) ........................................... —Fertility rate (births per woman) .......................................................1.30Adolescent fertility rate (births per 1,000 women, aged 15–19) ......5Antenatal care coverage, at least one visit (%) .............................. —Births attended by skilled health staff (%) ......................................100Maternal mortality ratio (per 100,000 live births)4 .....................6 [5-8]Contraceptive prevalence, married women (%) ..............................54Female HIV prevalence, aged 15–49 (%) ......................................<0.10Male HIV prevalence, aged 15–49 (%) ..........................................<0.10Infant mortality rate (per 1,000 live births) ..........................................2Overall population sex ratio (male/female) ....................................0.95
Social Institutions and Political RightsPaternal versus maternal authority2.................................................. —Female genital mutilation2 ................................................................... —Acceptance or legality of polygamy2 ................................................ —Existence of legislation punishing acts
of violence against women2 ............................................................ —Year women received right to vote ......................................1945, 1947Quota type .............................................................................................. —Existence of legislation prohibiting
gender-based discrimination ..........................................................No
Childcare EcosystemLength of maternity leave ........................................................14 weeksMaternity leave benefits (% of wages paid) ....................................67;
in addition, the employees’ health insurance scheme provides a lump-sum grant
Provider of maternity coverage ..........Employees’ health insurance scheme or national health insurance scheme (for all those not covered under the employees’ health insurance scheme)
Length of paternity leave ................................................. No. However, spousal maternity leave available at corporate level
Paternity leave benefits (% of wages paid) ......................... Min. 50%Daycare options ......................................................................Public and
private daycare, with and without allowance
JapanGender Gap Index 2011 (out of 135 countries) 98 0.651 100 0.567 80 0.986 1 0.980 101 0.072
Gender Gap Index 2010 (out of 134 countries) 94 0.652 101 0.572 82 0.986 1 0.980 101 0.072
Gender Gap Index 2009 (out of 134 countries) 101 0.645 108 0.550 84 0.985 41 0.979 110 0.065
Gender Gap Index 2008 (out of 130 countries) 98 0.643 102 0.544 82 0.985 38 0.979 107 0.065
Gender Gap Index 2007 (out of 128 countries) 91 0.645 97 0.549 69 0.986 37 0.979 94 0.067
Gender Gap Index 2006 (out of 115 countries) 80 0.645 83 0.545 60 0.986 1 0.980 83 0.067
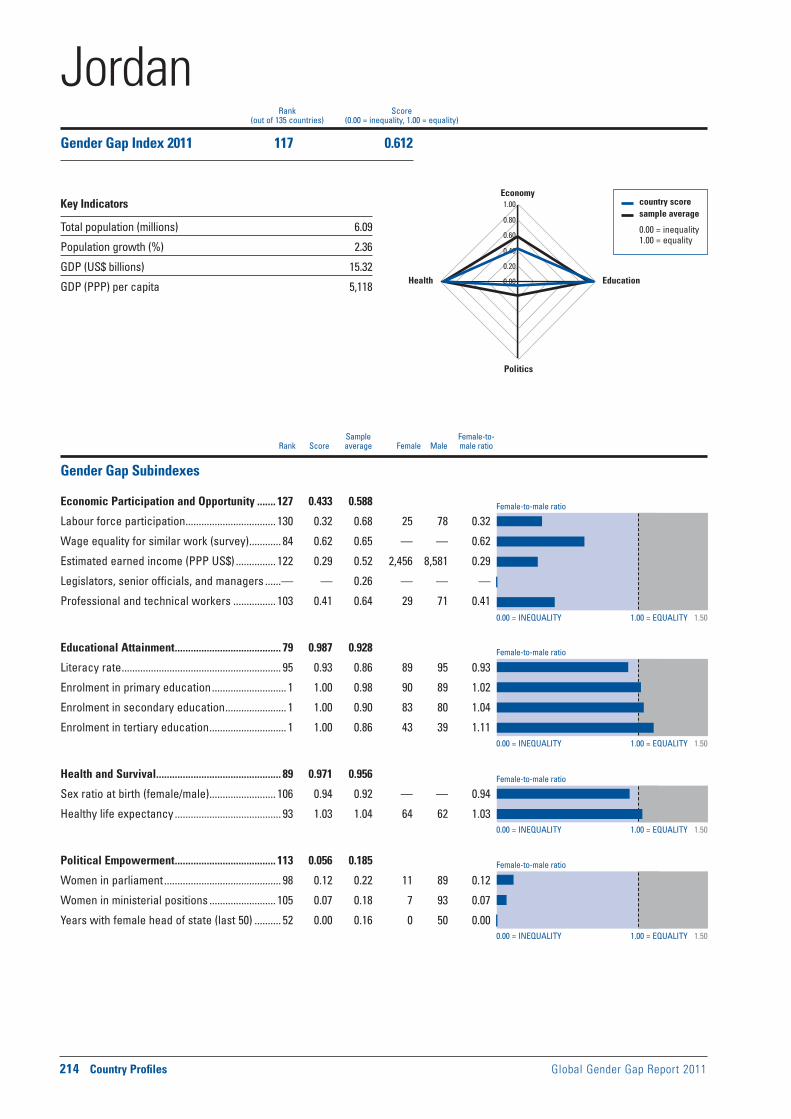
Female-to-male ratio
0.00 = INEQUALITY 1.00 = EQUALITY 1.50
0.00 = INEQUALITY 1.00 = EQUALITY 1.50
0.00 = INEQUALITY 1.00 = EQUALITY 1.50
0.00 = INEQUALITY 1.00 = EQUALITY 1.50
Female-to-male ratio
Female-to-male ratio
Female-to-male ratio
214 Country Profiles Global Gender Gap Report 2011
Sample Female-to- Rank Score average Female Male male ratio
country score sample average
0.00 = inequality 1.00 = equality
0.00
0.20
0.40
0.60
0.80
1.00Economy
Education
Politics
Health
Rank Score(out of 135 countries) (0.00 = inequality, 1.00 = equality)
Gender Gap Subindexes
Economic Participation and Opportunity ....... 127 0.433 0.588
Labour force participation .................................. 130 0.32 0.68 25 78 0.32
Wage equality for similar work (survey) ............ 84 0.62 0.65 — — 0.62
Estimated earned income (PPP US$) ............... 122 0.29 0.52 2,456 8,581 0.29
Legislators, senior officials, and managers ......— — 0.26 — — —
Professional and technical workers ................ 103 0.41 0.64 29 71 0.41
Educational Attainment ........................................ 79 0.987 0.928
Literacy rate ............................................................ 95 0.93 0.86 89 95 0.93
Enrolment in primary education ............................ 1 1.00 0.98 90 89 1.02
Enrolment in secondary education ....................... 1 1.00 0.90 83 80 1.04
Enrolment in tertiary education ............................. 1 1.00 0.86 43 39 1.11
Health and Survival ............................................... 89 0.971 0.956
Sex ratio at birth (female/male) ......................... 106 0.94 0.92 — — 0.94
Healthy life expectancy ........................................ 93 1.03 1.04 64 62 1.03
Political Empowerment ...................................... 113 0.056 0.185
Women in parliament ............................................ 98 0.12 0.22 11 89 0.12
Women in ministerial positions ......................... 105 0.07 0.18 7 93 0.07
Years with female head of state (last 50) .......... 52 0.00 0.16 0 50 0.00
JordanGender Gap Index 2011 117 0.612
Key Indicators
Total population (millions) 6.09
Population growth (%) 2.36
GDP (US$ billions) 15.32
GDP (PPP) per capita 5,118
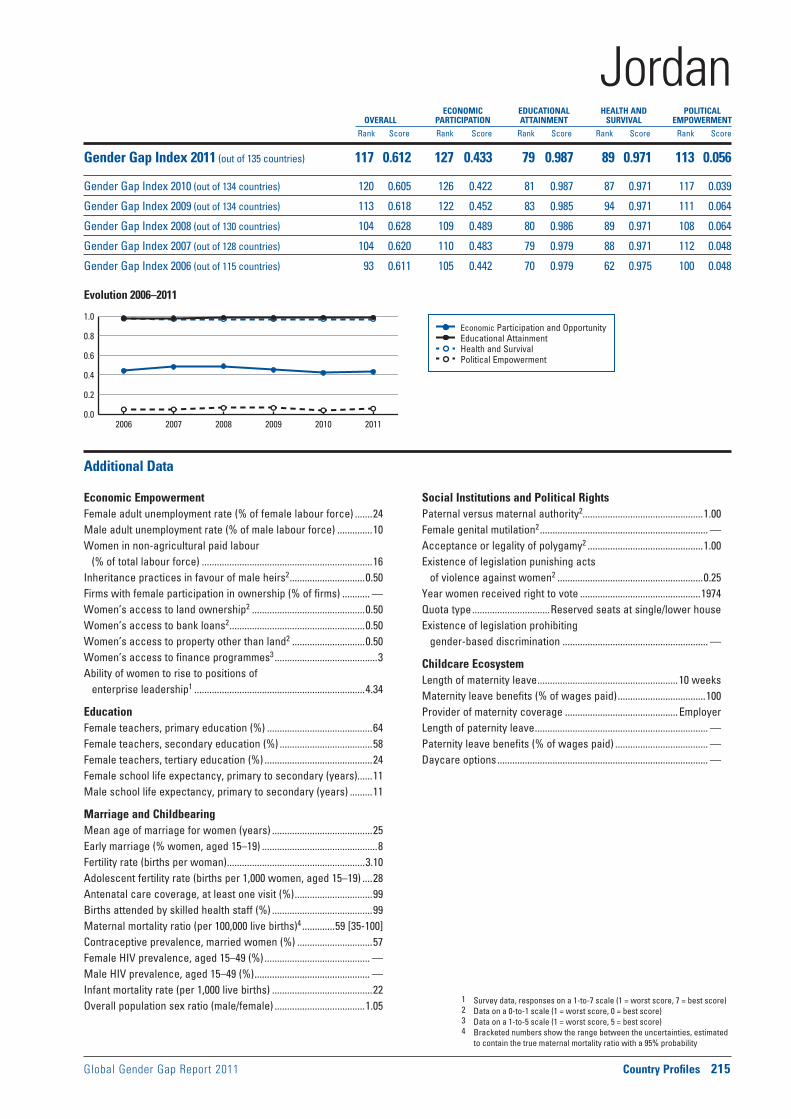
Global Gender Gap Report 2011 Country Profiles 215
Economic Participation and Opportunity Educational Attainment Health and Survival Political Empowerment
Evolution 2006–2011
1 Survey data, responses on a 1-to-7 scale (1 = worst score, 7 = best score)2 Data on a 0-to-1 scale (1 = worst score, 0 = best score)3 Data on a 1-to-5 scale (1 = worst score, 5 = best score)4 Bracketed numbers show the range between the uncertainties, estimated
to contain the true maternal mortality ratio with a 95% probability
ECONOMIC EDUCATIONAL HEALTH AND POLITICAL OVERALL PARTICIPATION ATTAINMENT SURVIVAL EMPOWERMENT
Rank Score Rank Score Rank Score Rank Score Rank Score
0.0
0.2
0.4
0.6
0.8
1.0
2006 2007 2008 2009 2010 2011
Additional Data
Economic EmpowermentFemale adult unemployment rate (% of female labour force) .......24Male adult unemployment rate (% of male labour force) ..............10Women in non-agricultural paid labour
(% of total labour force) ....................................................................16Inheritance practices in favour of male heirs2 ..............................0.50Firms with female participation in ownership (% of firms) ........... —Women’s access to land ownership2 .............................................0.50Women’s access to bank loans2 ......................................................0.50Women’s access to property other than land2 .............................0.50Women’s access to finance programmes3 .........................................3Ability of women to rise to positions of
enterprise leadership1 ....................................................................4.34
EducationFemale teachers, primary education (%) ..........................................64Female teachers, secondary education (%) .....................................58Female teachers, tertiary education (%) ...........................................24Female school life expectancy, primary to secondary (years)......11Male school life expectancy, primary to secondary (years) .........11
Marriage and ChildbearingMean age of marriage for women (years) ........................................25Early marriage (% women, aged 15–19) ..............................................8Fertility rate (births per woman) .......................................................3.10Adolescent fertility rate (births per 1,000 women, aged 15–19) ....28Antenatal care coverage, at least one visit (%) ...............................99Births attended by skilled health staff (%) ........................................99Maternal mortality ratio (per 100,000 live births)4 .............59 [35-100]Contraceptive prevalence, married women (%) ..............................57Female HIV prevalence, aged 15–49 (%) .......................................... —Male HIV prevalence, aged 15–49 (%) .............................................. —Infant mortality rate (per 1,000 live births) ........................................22Overall population sex ratio (male/female) ....................................1.05
Social Institutions and Political RightsPaternal versus maternal authority2................................................1.00Female genital mutilation2 ................................................................... —Acceptance or legality of polygamy2 ..............................................1.00Existence of legislation punishing acts
of violence against women2 ..........................................................0.25Year women received right to vote ................................................1974Quota type ...............................Reserved seats at single/lower houseExistence of legislation prohibiting
gender-based discrimination .......................................................... —
Childcare EcosystemLength of maternity leave ........................................................10 weeksMaternity leave benefits (% of wages paid) ...................................100Provider of maternity coverage .............................................EmployerLength of paternity leave ..................................................................... —Paternity leave benefits (% of wages paid) ..................................... —Daycare options .................................................................................... —
JordanGender Gap Index 2011 (out of 135 countries) 117 0.612 127 0.433 79 0.987 89 0.971 113 0.056
Gender Gap Index 2010 (out of 134 countries) 120 0.605 126 0.422 81 0.987 87 0.971 117 0.039
Gender Gap Index 2009 (out of 134 countries) 113 0.618 122 0.452 83 0.985 94 0.971 111 0.064
Gender Gap Index 2008 (out of 130 countries) 104 0.628 109 0.489 80 0.986 89 0.971 108 0.064
Gender Gap Index 2007 (out of 128 countries) 104 0.620 110 0.483 79 0.979 88 0.971 112 0.048
Gender Gap Index 2006 (out of 115 countries) 93 0.611 105 0.442 70 0.979 62 0.975 100 0.048

Female-to-male ratio
0.00 = INEQUALITY 1.00 = EQUALITY 1.50
0.00 = INEQUALITY 1.00 = EQUALITY 1.50
0.00 = INEQUALITY 1.00 = EQUALITY 1.50
0.00 = INEQUALITY 1.00 = EQUALITY 1.50
Female-to-male ratio
Female-to-male ratio
Female-to-male ratio
216 Country Profiles Global Gender Gap Report 2011
Sample Female-to- Rank Score average Female Male male ratio
country score sample average
0.00 = inequality 1.00 = equality
0.00
0.20
0.40
0.60
0.80
1.00Economy
Education
Politics
Health
Rank Score(out of 135 countries) (0.00 = inequality, 1.00 = equality)
Gender Gap Subindexes
Economic Participation and Opportunity ......... 23 0.749 0.588
Labour force participation .................................... 18 0.91 0.68 73 81 0.91
Wage equality for similar work (survey) ............ 42 0.71 0.65 — — 0.71
Estimated earned income (PPP US$) ................. 56 0.61 0.52 8,833 14,454 0.61
Legislators, senior officials, and managers ...... 21 0.62 0.26 38 62 0.62
Professional and technical workers .................... 1 1.00 0.64 67 33 2.02
Educational Attainment ........................................ 43 0.995 0.928
Literacy rate ............................................................ 50 1.00 0.86 100 100 1.00
Enrolment in primary education .......................... 79 0.99 0.98 89 90 0.99
Enrolment in secondary education ..................... 84 0.99 0.90 89 90 0.99
Enrolment in tertiary education ............................. 1 1.00 0.86 47 32 1.45
Health and Survival ................................................. 1 0.980 0.956
Sex ratio at birth (female/male) ............................. 1 0.94 0.92 — — 0.95
Healthy life expectancy .......................................... 1 1.06 1.04 60 53 1.13
Political Empowerment ........................................ 98 0.080 0.185
Women in parliament ............................................ 69 0.22 0.22 18 82 0.22
Women in ministerial positions ......................... 121 0.05 0.18 5 95 0.05
Years with female head of state (last 50) .......... 52 0.00 0.16 0 50 0.00
KazakhstanGender Gap Index 2011 49 0.701
Key Indicators
Total population (millions) 16.32
Population growth (%) 2.43
GDP (US$ billions) 40.40
GDP (PPP) per capita 10,890
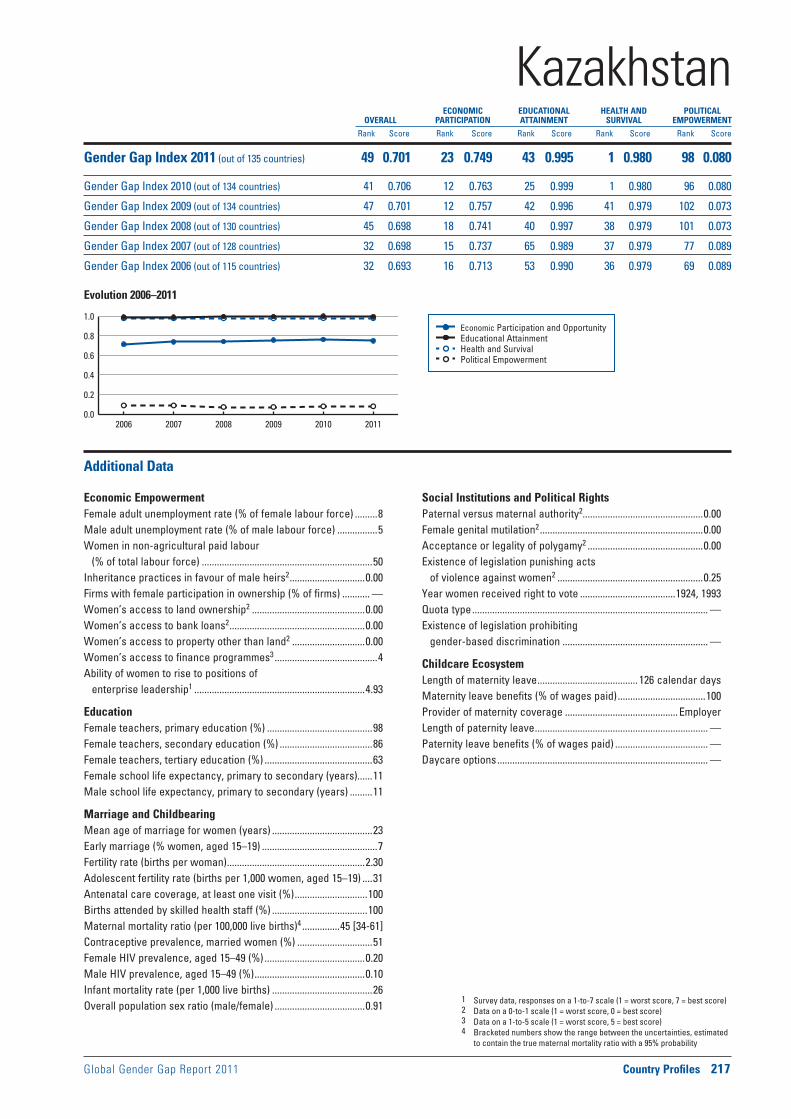
Global Gender Gap Report 2011 Country Profiles 217
Economic Participation and Opportunity Educational Attainment Health and Survival Political Empowerment
Evolution 2006–2011
1 Survey data, responses on a 1-to-7 scale (1 = worst score, 7 = best score)2 Data on a 0-to-1 scale (1 = worst score, 0 = best score)3 Data on a 1-to-5 scale (1 = worst score, 5 = best score)4 Bracketed numbers show the range between the uncertainties, estimated
to contain the true maternal mortality ratio with a 95% probability
ECONOMIC EDUCATIONAL HEALTH AND POLITICAL OVERALL PARTICIPATION ATTAINMENT SURVIVAL EMPOWERMENT
Rank Score Rank Score Rank Score Rank Score Rank Score
0.0
0.2
0.4
0.6
0.8
1.0
2006 2007 2008 2009 2010 2011
Additional Data
Economic EmpowermentFemale adult unemployment rate (% of female labour force) .........8Male adult unemployment rate (% of male labour force) ................5Women in non-agricultural paid labour
(% of total labour force) ....................................................................50Inheritance practices in favour of male heirs2 ..............................0.00Firms with female participation in ownership (% of firms) ........... —Women’s access to land ownership2 .............................................0.00Women’s access to bank loans2 ......................................................0.00Women’s access to property other than land2 .............................0.00Women’s access to finance programmes3 .........................................4Ability of women to rise to positions of
enterprise leadership1 ....................................................................4.93
EducationFemale teachers, primary education (%) ..........................................98Female teachers, secondary education (%) .....................................86Female teachers, tertiary education (%) ...........................................63Female school life expectancy, primary to secondary (years)......11Male school life expectancy, primary to secondary (years) .........11
Marriage and ChildbearingMean age of marriage for women (years) ........................................23Early marriage (% women, aged 15–19) ..............................................7Fertility rate (births per woman) .......................................................2.30Adolescent fertility rate (births per 1,000 women, aged 15–19) ....31Antenatal care coverage, at least one visit (%) .............................100Births attended by skilled health staff (%) ......................................100Maternal mortality ratio (per 100,000 live births)4 ...............45 [34-61]Contraceptive prevalence, married women (%) ..............................51Female HIV prevalence, aged 15–49 (%) ........................................0.20Male HIV prevalence, aged 15–49 (%) ............................................0.10Infant mortality rate (per 1,000 live births) ........................................26Overall population sex ratio (male/female) ....................................0.91
Social Institutions and Political RightsPaternal versus maternal authority2................................................0.00Female genital mutilation2 .................................................................0.00Acceptance or legality of polygamy2 ..............................................0.00Existence of legislation punishing acts
of violence against women2 ..........................................................0.25Year women received right to vote ......................................1924, 1993Quota type .............................................................................................. —Existence of legislation prohibiting
gender-based discrimination .......................................................... —
Childcare EcosystemLength of maternity leave ........................................ 126 calendar daysMaternity leave benefits (% of wages paid) ...................................100Provider of maternity coverage .............................................EmployerLength of paternity leave ..................................................................... —Paternity leave benefits (% of wages paid) ..................................... —Daycare options .................................................................................... —
KazakhstanGender Gap Index 2011 (out of 135 countries) 49 0.701 23 0.749 43 0.995 1 0.980 98 0.080
Gender Gap Index 2010 (out of 134 countries) 41 0.706 12 0.763 25 0.999 1 0.980 96 0.080
Gender Gap Index 2009 (out of 134 countries) 47 0.701 12 0.757 42 0.996 41 0.979 102 0.073
Gender Gap Index 2008 (out of 130 countries) 45 0.698 18 0.741 40 0.997 38 0.979 101 0.073
Gender Gap Index 2007 (out of 128 countries) 32 0.698 15 0.737 65 0.989 37 0.979 77 0.089
Gender Gap Index 2006 (out of 115 countries) 32 0.693 16 0.713 53 0.990 36 0.979 69 0.089
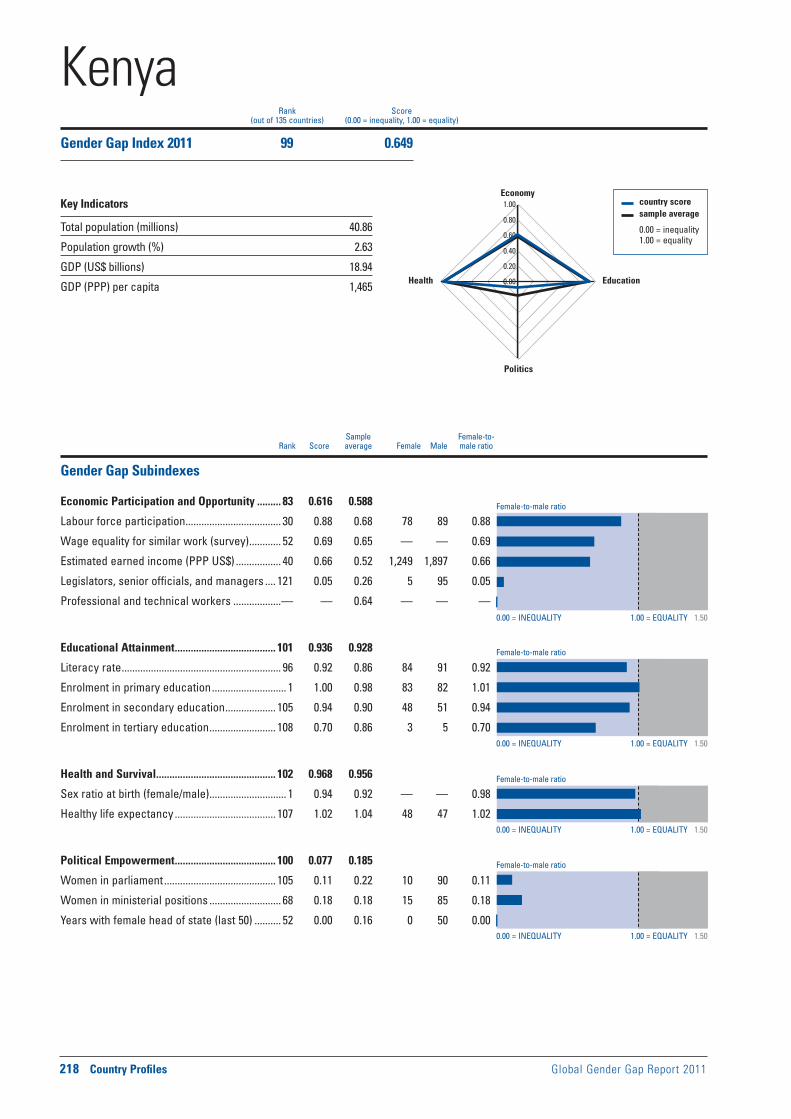
Female-to-male ratio
0.00 = INEQUALITY 1.00 = EQUALITY 1.50
0.00 = INEQUALITY 1.00 = EQUALITY 1.50
0.00 = INEQUALITY 1.00 = EQUALITY 1.50
0.00 = INEQUALITY 1.00 = EQUALITY 1.50
Female-to-male ratio
Female-to-male ratio
Female-to-male ratio
218 Country Profiles Global Gender Gap Report 2011
Sample Female-to- Rank Score average Female Male male ratio
country score sample average
0.00 = inequality 1.00 = equality
0.00
0.20
0.40
0.60
0.80
1.00Economy
Education
Politics
Health
Rank Score(out of 135 countries) (0.00 = inequality, 1.00 = equality)
Gender Gap Subindexes
Economic Participation and Opportunity ......... 83 0.616 0.588
Labour force participation .................................... 30 0.88 0.68 78 89 0.88
Wage equality for similar work (survey) ............ 52 0.69 0.65 — — 0.69
Estimated earned income (PPP US$) ................. 40 0.66 0.52 1,249 1,897 0.66
Legislators, senior officials, and managers .... 121 0.05 0.26 5 95 0.05
Professional and technical workers ..................— — 0.64 — — —
Educational Attainment ...................................... 101 0.936 0.928
Literacy rate ............................................................ 96 0.92 0.86 84 91 0.92
Enrolment in primary education ............................ 1 1.00 0.98 83 82 1.01
Enrolment in secondary education ................... 105 0.94 0.90 48 51 0.94
Enrolment in tertiary education ......................... 108 0.70 0.86 3 5 0.70
Health and Survival ............................................. 102 0.968 0.956
Sex ratio at birth (female/male) ............................. 1 0.94 0.92 — — 0.98
Healthy life expectancy ...................................... 107 1.02 1.04 48 47 1.02
Political Empowerment ...................................... 100 0.077 0.185
Women in parliament .......................................... 105 0.11 0.22 10 90 0.11
Women in ministerial positions ........................... 68 0.18 0.18 15 85 0.18
Years with female head of state (last 50) .......... 52 0.00 0.16 0 50 0.00
KenyaGender Gap Index 2011 99 0.649
Key Indicators
Total population (millions) 40.86
Population growth (%) 2.63
GDP (US$ billions) 18.94
GDP (PPP) per capita 1,465

Global Gender Gap Report 2011 Country Profiles 219
Economic Participation and Opportunity Educational Attainment Health and Survival Political Empowerment
Evolution 2006–2011
1 Survey data, responses on a 1-to-7 scale (1 = worst score, 7 = best score)2 Data on a 0-to-1 scale (1 = worst score, 0 = best score)3 Data on a 1-to-5 scale (1 = worst score, 5 = best score)4 Bracketed numbers show the range between the uncertainties, estimated
to contain the true maternal mortality ratio with a 95% probability
ECONOMIC EDUCATIONAL HEALTH AND POLITICAL OVERALL PARTICIPATION ATTAINMENT SURVIVAL EMPOWERMENT
Rank Score Rank Score Rank Score Rank Score Rank Score
0.0
0.2
0.4
0.6
0.8
1.0
2006 2007 2008 2009 2010 2011
Additional Data
Economic EmpowermentFemale adult unemployment rate (% of female labour force) ...... —Male adult unemployment rate (% of male labour force) ............. —Women in non-agricultural paid labour
(% of total labour force) ....................................................................32Inheritance practices in favour of male heirs2 ..............................0.50Firms with female participation in ownership (% of firms) ............33Women’s access to land ownership2 .............................................1.00Women’s access to bank loans2 ......................................................0.50Women’s access to property other than land2 .............................0.50Women’s access to finance programmes3 .........................................3Ability of women to rise to positions of
enterprise leadership1 ....................................................................4.71
EducationFemale teachers, primary education (%) ..........................................44Female teachers, secondary education (%) .....................................41Female teachers, tertiary education (%) .......................................... —Female school life expectancy, primary to secondary (years)......10Male school life expectancy, primary to secondary (years) .........11
Marriage and ChildbearingMean age of marriage for women (years) ........................................21Early marriage (% women, aged 15–19) ............................................17Fertility rate (births per woman) .......................................................4.90Adolescent fertility rate (births per 1,000 women, aged 15–19) ..103Antenatal care coverage, at least one visit (%) ...............................92Births attended by skilled health staff (%) ........................................44Maternal mortality ratio (per 100,000 live births)4 .........530 [320-850]Contraceptive prevalence, married women (%) ..............................39Female HIV prevalence, aged 15–49 (%) ........................................7.50Male HIV prevalence, aged 15–49 (%) ............................................5.00Infant mortality rate (per 1,000 live births) ........................................55Overall population sex ratio (male/female) ....................................1.00
Social Institutions and Political RightsPaternal versus maternal authority2................................................0.50Female genital mutilation2 .................................................................0.40Acceptance or legality of polygamy2 ..............................................0.50Existence of legislation punishing acts
of violence against women2 ..........................................................0.17Year women received right to vote ......................................1919, 1963Quota type .......................................................................Reserved seats
at single/lower house; voluntary political party quotasExistence of legislation prohibiting
gender-based discrimination .......................................................... —
Childcare EcosystemLength of maternity leave ........................................................ 3 monthsMaternity leave benefits (% of wages paid) ...................................100Provider of maternity coverage .............................................EmployerLength of paternity leave ..................................................................... —Paternity leave benefits (% of wages paid) ..................................... —Daycare options .................................................................................... —
KenyaGender Gap Index 2011 (out of 135 countries) 99 0.649 83 0.616 101 0.936 102 0.968 100 0.077
Gender Gap Index 2010 (out of 134 countries) 96 0.650 82 0.615 102 0.940 101 0.968 98 0.077
Gender Gap Index 2009 (out of 134 countries) 97 0.651 50 0.683 106 0.909 110 0.968 122 0.045
Gender Gap Index 2008 (out of 130 countries) 88 0.655 41 0.693 102 0.926 105 0.968 121 0.032
Gender Gap Index 2007 (out of 128 countries) 83 0.651 59 0.649 97 0.934 104 0.968 104 0.053
Gender Gap Index 2006 (out of 115 countries) 73 0.649 40 0.657 88 0.918 96 0.966 93 0.053

Female-to-male ratio
0.00 = INEQUALITY 1.00 = EQUALITY 1.50
0.00 = INEQUALITY 1.00 = EQUALITY 1.50
0.00 = INEQUALITY 1.00 = EQUALITY 1.50
0.00 = INEQUALITY 1.00 = EQUALITY 1.50
Female-to-male ratio
Female-to-male ratio
Female-to-male ratio
220 Country Profiles Global Gender Gap Report 2011
Sample Female-to- Rank Score average Female Male male ratio
country score sample average
0.00 = inequality 1.00 = equality
0.00
0.20
0.40
0.60
0.80
1.00Economy
Education
Politics
Health
Rank Score(out of 135 countries) (0.00 = inequality, 1.00 = equality)
Gender Gap Subindexes
Economic Participation and Opportunity ....... 117 0.493 0.588
Labour force participation .................................... 84 0.73 0.68 55 76 0.73
Wage equality for similar work (survey) .......... 126 0.51 0.65 — — 0.51
Estimated earned income (PPP US$) ............... 113 0.41 0.52 15,830 38,590 0.41
Legislators, senior officials, and managers .... 111 0.11 0.26 10 90 0.11
Professional and technical workers .................. 87 0.69 0.64 41 59 0.69
Educational Attainment ........................................ 97 0.948 0.928
Literacy rate .............................................................. 1 1.00 0.86 99 99 1.00
Enrolment in primary education .......................... 96 0.99 0.98 98 100 0.99
Enrolment in secondary education ..................... 97 0.96 0.90 94 98 0.96
Enrolment in tertiary education ......................... 110 0.70 0.86 82 117 0.70
Health and Survival ............................................... 78 0.974 0.956
Sex ratio at birth (female/male) ......................... 124 0.94 0.92 — — 0.94
Healthy life expectancy .......................................... 1 1.06 1.04 74 68 1.09
Political Empowerment ........................................ 90 0.097 0.185
Women in parliament ............................................ 79 0.17 0.22 15 85 0.17
Women in ministerial positions ........................... 75 0.14 0.18 13 88 0.14
Years with female head of state (last 50) .......... 40 0.02 0.16 1 49 0.02
Korea, Rep.Gender Gap Index 2011 107 0.628
Key Indicators
Total population (millions) 48.88
Population growth (%) 0.26
GDP (US$ billions) 800.21
GDP (PPP) per capita 27,027
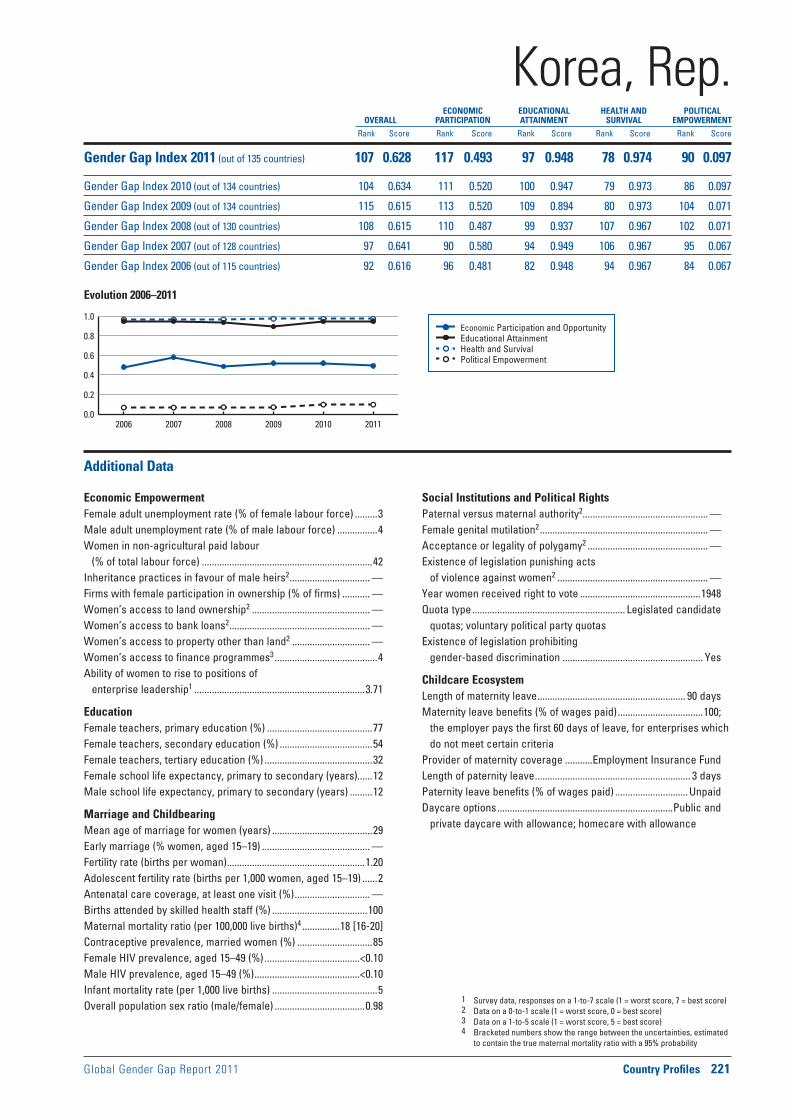
Global Gender Gap Report 2011 Country Profiles 221
Economic Participation and Opportunity Educational Attainment Health and Survival Political Empowerment
Evolution 2006–2011
1 Survey data, responses on a 1-to-7 scale (1 = worst score, 7 = best score)2 Data on a 0-to-1 scale (1 = worst score, 0 = best score)3 Data on a 1-to-5 scale (1 = worst score, 5 = best score)4 Bracketed numbers show the range between the uncertainties, estimated
to contain the true maternal mortality ratio with a 95% probability
ECONOMIC EDUCATIONAL HEALTH AND POLITICAL OVERALL PARTICIPATION ATTAINMENT SURVIVAL EMPOWERMENT
Rank Score Rank Score Rank Score Rank Score Rank Score
0.0
0.2
0.4
0.6
0.8
1.0
2006 2007 2008 2009 2010 2011
Additional Data
Economic EmpowermentFemale adult unemployment rate (% of female labour force) .........3Male adult unemployment rate (% of male labour force) ................4Women in non-agricultural paid labour
(% of total labour force) ....................................................................42Inheritance practices in favour of male heirs2 ................................ —Firms with female participation in ownership (% of firms) ........... —Women’s access to land ownership2 ............................................... —Women’s access to bank loans2 ........................................................ —Women’s access to property other than land2 ............................... —Women’s access to finance programmes3 .........................................4Ability of women to rise to positions of
enterprise leadership1 ....................................................................3.71
EducationFemale teachers, primary education (%) ..........................................77Female teachers, secondary education (%) .....................................54Female teachers, tertiary education (%) ...........................................32Female school life expectancy, primary to secondary (years)......12Male school life expectancy, primary to secondary (years) .........12
Marriage and ChildbearingMean age of marriage for women (years) ........................................29Early marriage (% women, aged 15–19) ........................................... —Fertility rate (births per woman) .......................................................1.20Adolescent fertility rate (births per 1,000 women, aged 15–19) ......2Antenatal care coverage, at least one visit (%) .............................. —Births attended by skilled health staff (%) ......................................100Maternal mortality ratio (per 100,000 live births)4 ...............18 [16-20]Contraceptive prevalence, married women (%) ..............................85Female HIV prevalence, aged 15–49 (%) ......................................<0.10Male HIV prevalence, aged 15–49 (%) ..........................................<0.10Infant mortality rate (per 1,000 live births) ..........................................5Overall population sex ratio (male/female) ....................................0.98
Social Institutions and Political RightsPaternal versus maternal authority2.................................................. —Female genital mutilation2 ................................................................... —Acceptance or legality of polygamy2 ................................................ —Existence of legislation punishing acts
of violence against women2 ............................................................ —Year women received right to vote ................................................1948Quota type ............................................................. Legislated candidate
quotas; voluntary political party quotasExistence of legislation prohibiting
gender-based discrimination ........................................................ Yes
Childcare EcosystemLength of maternity leave ........................................................... 90 daysMaternity leave benefits (% of wages paid) ..................................100;
the employer pays the first 60 days of leave, for enterprises which do not meet certain criteria
Provider of maternity coverage ...........Employment Insurance FundLength of paternity leave .............................................................. 3 daysPaternity leave benefits (% of wages paid) .............................Unpaid Daycare options ......................................................................Public and
private daycare with allowance; homecare with allowance
Korea, Rep.Gender Gap Index 2011 (out of 135 countries) 107 0.628 117 0.493 97 0.948 78 0.974 90 0.097
Gender Gap Index 2010 (out of 134 countries) 104 0.634 111 0.520 100 0.947 79 0.973 86 0.097
Gender Gap Index 2009 (out of 134 countries) 115 0.615 113 0.520 109 0.894 80 0.973 104 0.071
Gender Gap Index 2008 (out of 130 countries) 108 0.615 110 0.487 99 0.937 107 0.967 102 0.071
Gender Gap Index 2007 (out of 128 countries) 97 0.641 90 0.580 94 0.949 106 0.967 95 0.067
Gender Gap Index 2006 (out of 115 countries) 92 0.616 96 0.481 82 0.948 94 0.967 84 0.067

Female-to-male ratio
0.00 = INEQUALITY 1.00 = EQUALITY 1.50
0.00 = INEQUALITY 1.00 = EQUALITY 1.50
0.00 = INEQUALITY 1.00 = EQUALITY 1.50
0.00 = INEQUALITY 1.00 = EQUALITY 1.50
Female-to-male ratio
Female-to-male ratio
Female-to-male ratio
222 Country Profiles Global Gender Gap Report 2011
Sample Female-to- Rank Score average Female Male male ratio
country score sample average
0.00 = inequality 1.00 = equality
0.00
0.20
0.40
0.60
0.80
1.00Economy
Education
Politics
Health
Rank Score(out of 135 countries) (0.00 = inequality, 1.00 = equality)
Gender Gap Subindexes
Economic Participation and Opportunity ....... 107 0.541 0.588
Labour force participation .................................. 111 0.55 0.68 47 84 0.55
Wage equality for similar work (survey) ............ 60 0.67 0.65 — — 0.67
Estimated earned income (PPP US$) ................. 54 0.61 0.52 24,531 40,000 0.61
Legislators, senior officials, and managers ...... 99 0.16 0.26 14 86 0.16
Professional and technical workers .................. 96 0.52 0.64 34 66 0.52
Educational Attainment ........................................ 84 0.983 0.928
Literacy rate ............................................................ 79 0.97 0.86 92 95 0.97
Enrolment in primary education ........................ 108 0.98 0.98 87 89 0.98
Enrolment in secondary education ....................... 1 1.00 0.90 80 77 1.04
Enrolment in tertiary education ............................. 1 1.00 0.86 27 12 2.14
Health and Survival ............................................. 111 0.961 0.956
Sex ratio at birth (female/male) ............................. 1 0.94 0.92 — — 0.96
Healthy life expectancy ...................................... 118 1.00 1.04 69 69 1.00
Political Empowerment ...................................... 116 0.043 0.185
Women in parliament .......................................... 117 0.08 0.22 8 92 0.08
Women in ministerial positions ......................... 108 0.07 0.18 7 93 0.07
Years with female head of state (last 50) .......... 52 0.00 0.16 0 50 0.00
KuwaitGender Gap Index 2011 105 0.632
Key Indicators
Total population (millions) 2.86
Population growth (%) 2.41
GDP (US$ billions) 61.44
GDP (PPP) per capita 45,539

Global Gender Gap Report 2011 Country Profiles 223
Economic Participation and Opportunity Educational Attainment Health and Survival Political Empowerment
Evolution 2006–2011
1 Survey data, responses on a 1-to-7 scale (1 = worst score, 7 = best score)2 Data on a 0-to-1 scale (1 = worst score, 0 = best score)3 Data on a 1-to-5 scale (1 = worst score, 5 = best score)4 Bracketed numbers show the range between the uncertainties, estimated
to contain the true maternal mortality ratio with a 95% probability
ECONOMIC EDUCATIONAL HEALTH AND POLITICAL OVERALL PARTICIPATION ATTAINMENT SURVIVAL EMPOWERMENT
Rank Score Rank Score Rank Score Rank Score Rank Score
0.0
0.2
0.4
0.6
0.8
1.0
2006 2007 2008 2009 2010 2011
Additional Data
Economic EmpowermentFemale adult unemployment rate (% of female labour force) .........2Male adult unemployment rate (% of male labour force) ................2Women in non-agricultural paid labour
(% of total labour force) ....................................................................23Inheritance practices in favour of male heirs2 ..............................0.50Firms with female participation in ownership (% of firms) ............40Women’s access to land ownership2 .............................................0.00Women’s access to bank loans2 ......................................................0.00Women’s access to property other than land2 .............................0.00Women’s access to finance programmes3 .........................................3Ability of women to rise to positions of
enterprise leadership1 ....................................................................4.52
EducationFemale teachers, primary education (%) ..........................................90Female teachers, secondary education (%) .....................................54Female teachers, tertiary education (%) ...........................................27Female school life expectancy, primary to secondary (years)......11Male school life expectancy, primary to secondary (years) .........11
Marriage and ChildbearingMean age of marriage for women (years) ........................................27Early marriage (% women, aged 15–19) ..............................................5Fertility rate (births per woman) .......................................................2.20Adolescent fertility rate (births per 1,000 women, aged 15–19) ....13Antenatal care coverage, at least one visit (%) .............................100Births attended by skilled health staff (%) ......................................100Maternal mortality ratio (per 100,000 live births)4 ...................9 [8-10]Contraceptive prevalence, married women (%) ..............................52Female HIV prevalence, aged 15–49 (%) .......................................... —Male HIV prevalence, aged 15–49 (%) .............................................. —Infant mortality rate (per 1,000 live births) ........................................11Overall population sex ratio (male/female) ....................................1.46
Social Institutions and Political RightsPaternal versus maternal authority2................................................1.00Female genital mutilation2 .................................................................0.00Acceptance or legality of polygamy2 ..............................................1.00Existence of legislation punishing acts
of violence against women2 ..........................................................0.50Year women received right to vote ................................................2005Quota type .............................................................................................. —Existence of legislation prohibiting
gender-based discrimination ........................................................ Yes
Childcare EcosystemLength of maternity leave ........................................................... 70 daysMaternity leave benefits (% of wages paid) ...................................100Provider of maternity coverage .............................................EmployerLength of paternity leave ..................................................................... —Paternity leave benefits (% of wages paid) ..................................... —Daycare options ............................................................ Private daycare
KuwaitGender Gap Index 2011 (out of 135 countries) 105 0.632 107 0.541 84 0.983 111 0.961 116 0.043
Gender Gap Index 2010 (out of 134 countries) 105 0.632 107 0.537 83 0.986 110 0.961 114 0.043
Gender Gap Index 2009 (out of 134 countries) 105 0.636 106 0.557 86 0.981 116 0.961 124 0.043
Gender Gap Index 2008 (out of 130 countries) 101 0.636 92 0.570 74 0.990 112 0.961 125 0.022
Gender Gap Index 2007 (out of 128 countries) 96 0.641 80 0.604 63 0.989 110 0.961 126 0.010
Gender Gap Index 2006 (out of 115 countries) 86 0.634 72 0.577 41 0.993 105 0.961 114 0.005
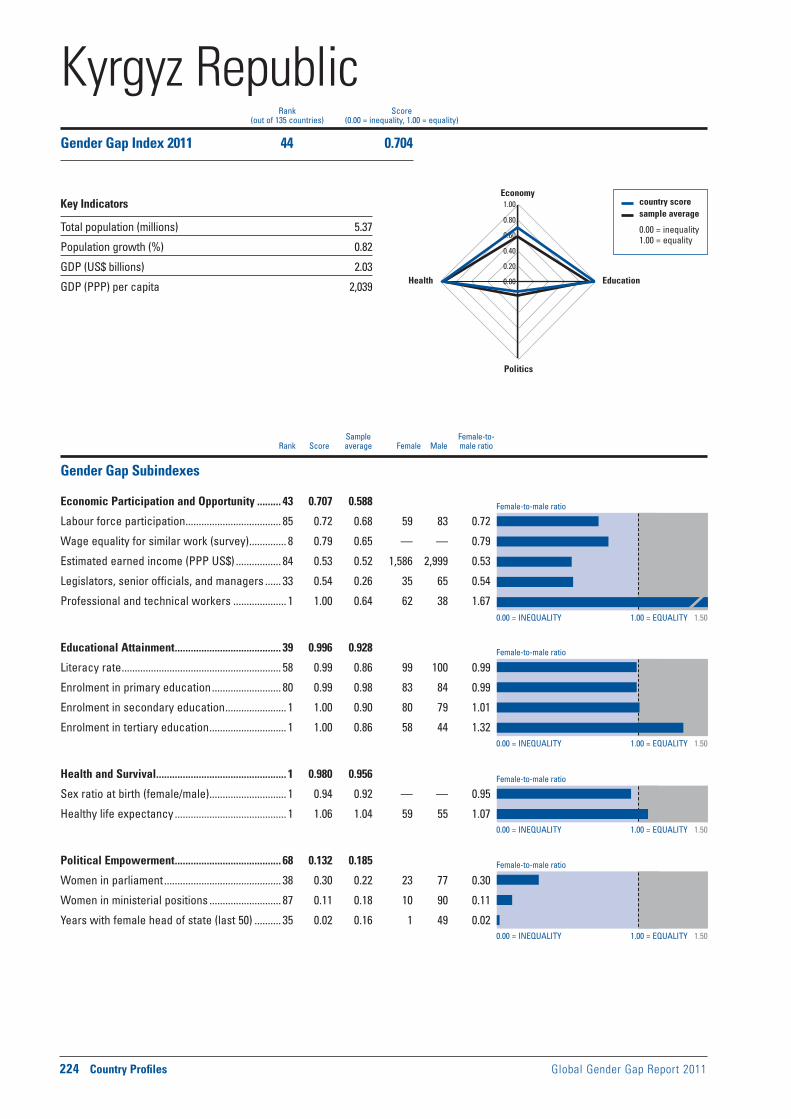
Female-to-male ratio
0.00 = INEQUALITY 1.00 = EQUALITY 1.50
0.00 = INEQUALITY 1.00 = EQUALITY 1.50
0.00 = INEQUALITY 1.00 = EQUALITY 1.50
0.00 = INEQUALITY 1.00 = EQUALITY 1.50
Female-to-male ratio
Female-to-male ratio
Female-to-male ratio
224 Country Profiles Global Gender Gap Report 2011
Sample Female-to- Rank Score average Female Male male ratio
country score sample average
0.00 = inequality 1.00 = equality
0.00
0.20
0.40
0.60
0.80
1.00Economy
Education
Politics
Health
Rank Score(out of 135 countries) (0.00 = inequality, 1.00 = equality)
Gender Gap Subindexes
Economic Participation and Opportunity ......... 43 0.707 0.588
Labour force participation .................................... 85 0.72 0.68 59 83 0.72
Wage equality for similar work (survey) .............. 8 0.79 0.65 — — 0.79
Estimated earned income (PPP US$) ................. 84 0.53 0.52 1,586 2,999 0.53
Legislators, senior officials, and managers ...... 33 0.54 0.26 35 65 0.54
Professional and technical workers .................... 1 1.00 0.64 62 38 1.67
Educational Attainment ........................................ 39 0.996 0.928
Literacy rate ............................................................ 58 0.99 0.86 99 100 0.99
Enrolment in primary education .......................... 80 0.99 0.98 83 84 0.99
Enrolment in secondary education ....................... 1 1.00 0.90 80 79 1.01
Enrolment in tertiary education ............................. 1 1.00 0.86 58 44 1.32
Health and Survival ................................................. 1 0.980 0.956
Sex ratio at birth (female/male) ............................. 1 0.94 0.92 — — 0.95
Healthy life expectancy .......................................... 1 1.06 1.04 59 55 1.07
Political Empowerment ........................................ 68 0.132 0.185
Women in parliament ............................................ 38 0.30 0.22 23 77 0.30
Women in ministerial positions ........................... 87 0.11 0.18 10 90 0.11
Years with female head of state (last 50) .......... 35 0.02 0.16 1 49 0.02
Kyrgyz RepublicGender Gap Index 2011 44 0.704
Key Indicators
Total population (millions) 5.37
Population growth (%) 0.82
GDP (US$ billions) 2.03
GDP (PPP) per capita 2,039

Global Gender Gap Report 2011 Country Profiles 225
Economic Participation and Opportunity Educational Attainment Health and Survival Political Empowerment
Evolution 2006–2011
1 Survey data, responses on a 1-to-7 scale (1 = worst score, 7 = best score)2 Data on a 0-to-1 scale (1 = worst score, 0 = best score)3 Data on a 1-to-5 scale (1 = worst score, 5 = best score)4 Bracketed numbers show the range between the uncertainties, estimated
to contain the true maternal mortality ratio with a 95% probability
ECONOMIC EDUCATIONAL HEALTH AND POLITICAL OVERALL PARTICIPATION ATTAINMENT SURVIVAL EMPOWERMENT
Rank Score Rank Score Rank Score Rank Score Rank Score
0.0
0.2
0.4
0.6
0.8
1.0
2006 2007 2008 2009 2010 2011
Additional Data
Economic EmpowermentFemale adult unemployment rate (% of female labour force) .........9Male adult unemployment rate (% of male labour force) ................7Women in non-agricultural paid labour
(% of total labour force) ....................................................................51Inheritance practices in favour of male heirs2 ..............................0.50Firms with female participation in ownership (% of firms) ........... —Women’s access to land ownership2 .............................................0.00Women’s access to bank loans2 ......................................................0.00Women’s access to property other than land2 .............................0.50Women’s access to finance programmes3 .........................................1Ability of women to rise to positions of
enterprise leadership1 ....................................................................5.29
EducationFemale teachers, primary education (%) ..........................................97Female teachers, secondary education (%) .....................................74Female teachers, tertiary education (%) ...........................................59Female school life expectancy, primary to secondary (years)......10Male school life expectancy, primary to secondary (years) .........10
Marriage and ChildbearingMean age of marriage for women (years) ........................................22Early marriage (% women, aged 15–19) ............................................11Fertility rate (births per woman) .......................................................2.50Adolescent fertility rate (births per 1,000 women, aged 15–19) ....29Antenatal care coverage, at least one visit (%) ...............................97Births attended by skilled health staff (%) ........................................98Maternal mortality ratio (per 100,000 live births)4 .............81 [50-130]Contraceptive prevalence, married women (%) ..............................48Female HIV prevalence, aged 15–49 (%) ........................................0.20Male HIV prevalence, aged 15–49 (%) ............................................0.40Infant mortality rate (per 1,000 live births) ........................................32Overall population sex ratio (male/female) ....................................0.97
Social Institutions and Political RightsPaternal versus maternal authority2................................................0.00Female genital mutilation2 .................................................................0.00Acceptance or legality of polygamy2 ..............................................0.00Existence of legislation punishing acts
of violence against women2 ..........................................................0.58Year women received right to vote ................................................1918Quota type ...............................Reserved seats at single/lower houseExistence of legislation prohibiting
gender-based discrimination .......................................................... —
Childcare EcosystemLength of maternity leave ........................................ 126 calendar daysMaternity leave benefits (% of wages paid) ...................................100
for the first 10 working days covered by employer; the rest of the maternity leave, 10 times the benchmark amount is paid from social security fund; benefits are adjusted periodically according to changes in the cost of living
Provider of maternity coverage ...................................Social security (employer covers the first 10 working days)
Length of paternity leave ..................................................................... —Paternity leave benefits (% of wages paid) ..................................... —Daycare options .................................................................................... —
Kyrgyz RepublicGender Gap Index 2011 (out of 135 countries) 44 0.704 43 0.707 39 0.996 1 0.980 68 0.132
Gender Gap Index 2010 (out of 134 countries) 51 0.697 52 0.680 48 0.995 1 0.980 65 0.135
Gender Gap Index 2009 (out of 134 countries) 41 0.706 46 0.687 59 0.994 1 0.980 43 0.164
Gender Gap Index 2008 (out of 130 countries) 41 0.705 47 0.682 63 0.993 1 0.980 44 0.164
Gender Gap Index 2007 (out of 128 countries) 70 0.665 57 0.653 43 0.994 1 0.980 118 0.035
Gender Gap Index 2006 (out of 115 countries) 52 0.674 26 0.687 33 0.995 1 0.980 107 0.035
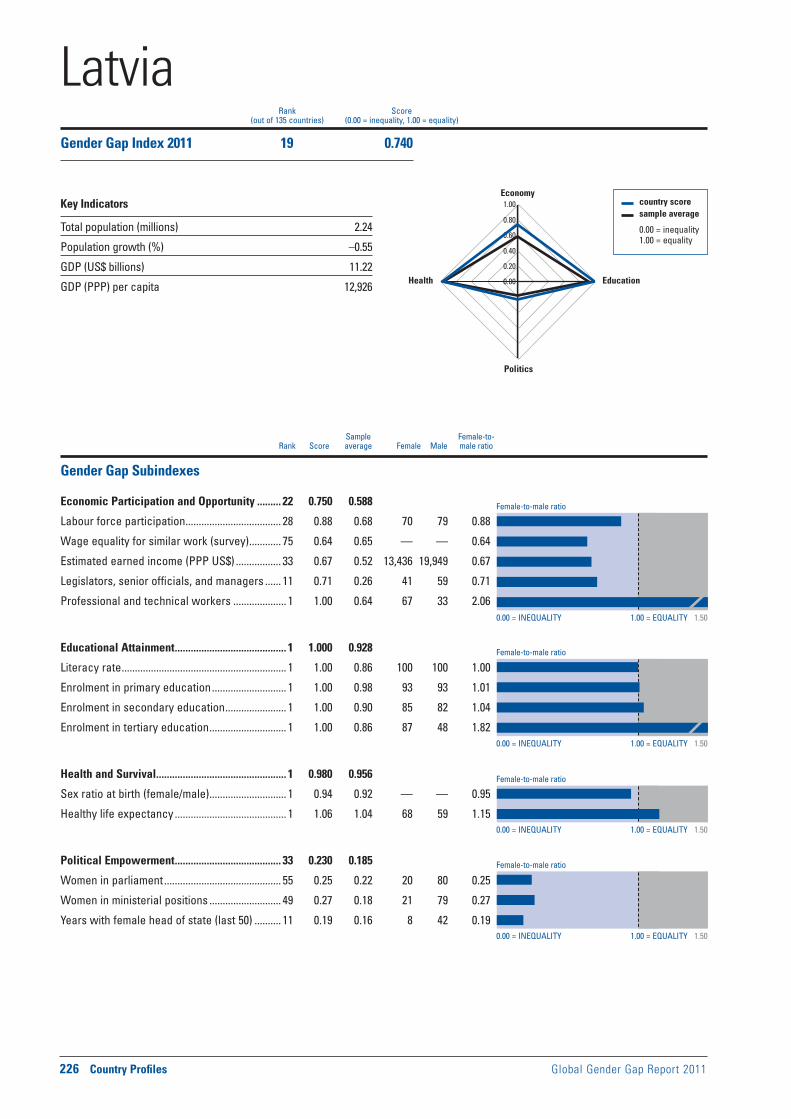
Female-to-male ratio
0.00 = INEQUALITY 1.00 = EQUALITY 1.50
0.00 = INEQUALITY 1.00 = EQUALITY 1.50
0.00 = INEQUALITY 1.00 = EQUALITY 1.50
0.00 = INEQUALITY 1.00 = EQUALITY 1.50
Female-to-male ratio
Female-to-male ratio
Female-to-male ratio
226 Country Profiles Global Gender Gap Report 2011
Sample Female-to- Rank Score average Female Male male ratio
country score sample average
0.00 = inequality 1.00 = equality
0.00
0.20
0.40
0.60
0.80
1.00Economy
Education
Politics
Health
Rank Score(out of 135 countries) (0.00 = inequality, 1.00 = equality)
Gender Gap Subindexes
Economic Participation and Opportunity ......... 22 0.750 0.588
Labour force participation .................................... 28 0.88 0.68 70 79 0.88
Wage equality for similar work (survey) ............ 75 0.64 0.65 — — 0.64
Estimated earned income (PPP US$) ................. 33 0.67 0.52 13,436 19,949 0.67
Legislators, senior officials, and managers ...... 11 0.71 0.26 41 59 0.71
Professional and technical workers .................... 1 1.00 0.64 67 33 2.06
Educational Attainment .......................................... 1 1.000 0.928
Literacy rate .............................................................. 1 1.00 0.86 100 100 1.00
Enrolment in primary education ............................ 1 1.00 0.98 93 93 1.01
Enrolment in secondary education ....................... 1 1.00 0.90 85 82 1.04
Enrolment in tertiary education ............................. 1 1.00 0.86 87 48 1.82
Health and Survival ................................................. 1 0.980 0.956
Sex ratio at birth (female/male) ............................. 1 0.94 0.92 — — 0.95
Healthy life expectancy .......................................... 1 1.06 1.04 68 59 1.15
Political Empowerment ........................................ 33 0.230 0.185
Women in parliament ............................................ 55 0.25 0.22 20 80 0.25
Women in ministerial positions ........................... 49 0.27 0.18 21 79 0.27
Years with female head of state (last 50) .......... 11 0.19 0.16 8 42 0.19
LatviaGender Gap Index 2011 19 0.740
Key Indicators
Total population (millions) 2.24
Population growth (%) –0.55
GDP (US$ billions) 11.22
GDP (PPP) per capita 12,926

Global Gender Gap Report 2011 Country Profiles 227
Economic Participation and Opportunity Educational Attainment Health and Survival Political Empowerment
Evolution 2006–2011
1 Survey data, responses on a 1-to-7 scale (1 = worst score, 7 = best score)2 Data on a 0-to-1 scale (1 = worst score, 0 = best score)3 Data on a 1-to-5 scale (1 = worst score, 5 = best score)4 Bracketed numbers show the range between the uncertainties, estimated
to contain the true maternal mortality ratio with a 95% probability
ECONOMIC EDUCATIONAL HEALTH AND POLITICAL OVERALL PARTICIPATION ATTAINMENT SURVIVAL EMPOWERMENT
Rank Score Rank Score Rank Score Rank Score Rank Score
0.0
0.2
0.4
0.6
0.8
1.0
2006 2007 2008 2009 2010 2011
Additional Data
Economic EmpowermentFemale adult unemployment rate (% of female labour force) .......14Male adult unemployment rate (% of male labour force) ................8Women in non-agricultural paid labour
(% of total labour force) ....................................................................53Inheritance practices in favour of male heirs2 ................................ —Firms with female participation in ownership (% of firms) ........... —Women’s access to land ownership2 ............................................... —Women’s access to bank loans2 ........................................................ —Women’s access to property other than land2 ............................... —Women’s access to finance programmes3 .........................................4Ability of women to rise to positions of
enterprise leadership1 ....................................................................4.86
EducationFemale teachers, primary education (%) ..........................................93Female teachers, secondary education (%) .....................................81Female teachers, tertiary education (%) ...........................................57Female school life expectancy, primary to secondary (years)......11Male school life expectancy, primary to secondary (years) .........11
Marriage and ChildbearingMean age of marriage for women (years) ........................................29Early marriage (% women, aged 15–19) ........................................... —Fertility rate (births per woman) .......................................................1.40Adolescent fertility rate (births per 1,000 women, aged 15–19) ....18Antenatal care coverage, at least one visit (%) ...............................92Births attended by skilled health staff (%) ......................................100Maternal mortality ratio (per 100,000 live births)4 ...............20 [18-23]Contraceptive prevalence, married women (%) ..............................68Female HIV prevalence, aged 15–49 (%) ........................................0.40Male HIV prevalence, aged 15–49 (%) ............................................0.90Infant mortality rate (per 1,000 live births) ..........................................7Overall population sex ratio (male/female) ....................................0.86
Social Institutions and Political RightsPaternal versus maternal authority2.................................................. —Female genital mutilation2 ................................................................... —Acceptance or legality of polygamy2 ................................................ —Existence of legislation punishing acts
of violence against women2 ............................................................ —Year women received right to vote ................................................1918Quota type .............................................................................................. —Existence of legislation prohibiting
gender-based discrimination ........................................................ Yes
Childcare EcosystemLength of maternity leave ........................................ 112 calendar daysMaternity leave benefits (% of wages paid) ...................................100Provider of maternity coverage ......State Social Insurance AgencyLength of paternity leave ........................................... 10 calendar daysPaternity leave benefits (% of wages paid) .......... 80, up to a ceiling Daycare options ..............................................................Public daycare
with allowance; private daycare without allowance; homecare with and without allowance
LatviaGender Gap Index 2011 (out of 135 countries) 19 0.740 22 0.750 1 1.000 1 0.980 33 0.230
Gender Gap Index 2010 (out of 134 countries) 18 0.743 21 0.752 1 1.000 1 0.980 31 0.240
Gender Gap Index 2009 (out of 134 countries) 14 0.742 14 0.754 1 1.000 1 0.980 31 0.233
Gender Gap Index 2008 (out of 130 countries) 10 0.740 13 0.746 1 1.000 1 0.980 31 0.233
Gender Gap Index 2007 (out of 128 countries) 13 0.733 17 0.734 70 0.986 1 0.980 19 0.233
Gender Gap Index 2006 (out of 115 countries) 19 0.709 20 0.705 85 0.931 1 0.980 21 0.221

Female-to-male ratio
0.00 = INEQUALITY 1.00 = EQUALITY 1.50
0.00 = INEQUALITY 1.00 = EQUALITY 1.50
0.00 = INEQUALITY 1.00 = EQUALITY 1.50
0.00 = INEQUALITY 1.00 = EQUALITY 1.50
Female-to-male ratio
Female-to-male ratio
Female-to-male ratio
228 Country Profiles Global Gender Gap Report 2011
Sample Female-to- Rank Score average Female Male male ratio
country score sample average
0.00 = inequality 1.00 = equality
0.00
0.20
0.40
0.60
0.80
1.00Economy
Education
Politics
Health
Rank Score(out of 135 countries) (0.00 = inequality, 1.00 = equality)
Gender Gap Subindexes
Economic Participation and Opportunity ....... 123 0.448 0.588
Labour force participation .................................. 129 0.33 0.68 25 75 0.33
Wage equality for similar work (survey) ............ 70 0.65 0.65 — — 0.65
Estimated earned income (PPP US$) ............... 126 0.24 0.52 5,186 21,288 0.24
Legislators, senior officials, and managers .... 115 0.09 0.26 8 92 0.09
Professional and technical workers .................. 68 0.93 0.64 48 52 0.93
Educational Attainment ........................................ 90 0.977 0.928
Literacy rate ............................................................ 97 0.92 0.86 86 93 0.92
Enrolment in primary education ........................ 100 0.98 0.98 89 91 0.98
Enrolment in secondary education ....................... 1 1.00 0.90 79 71 1.11
Enrolment in tertiary education ............................. 1 1.00 0.86 57 48 1.19
Health and Survival ................................................. 1 0.980 0.956
Sex ratio at birth (female/male) ............................. 1 0.94 0.92 — — 0.95
Healthy life expectancy .......................................... 1 1.06 1.04 64 60 1.07
Political Empowerment ...................................... 128 0.028 0.185
Women in parliament .......................................... 125 0.03 0.22 3 97 0.03
Women in ministerial positions ......................... 105 0.07 0.18 7 93 0.07
Years with female head of state (last 50) .......... 52 0.00 0.16 0 50 0.00
LebanonGender Gap Index 2011 118 0.608
Key Indicators
Total population (millions) 4.25
Population growth (%) 0.73
GDP (US$ billions) 28.52
GDP (PPP) per capita 12,525
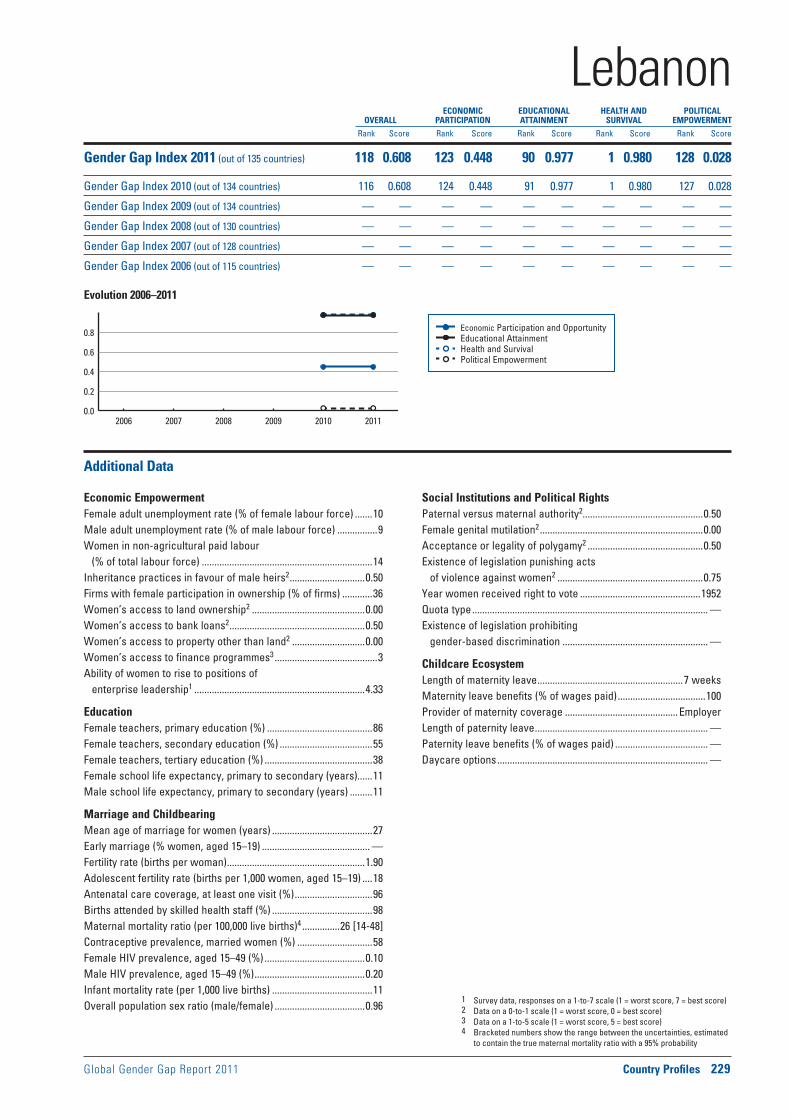
Global Gender Gap Report 2011 Country Profiles 229
Economic Participation and Opportunity Educational Attainment Health and Survival Political Empowerment
Evolution 2006–2011
1 Survey data, responses on a 1-to-7 scale (1 = worst score, 7 = best score)2 Data on a 0-to-1 scale (1 = worst score, 0 = best score)3 Data on a 1-to-5 scale (1 = worst score, 5 = best score)4 Bracketed numbers show the range between the uncertainties, estimated
to contain the true maternal mortality ratio with a 95% probability
ECONOMIC EDUCATIONAL HEALTH AND POLITICAL OVERALL PARTICIPATION ATTAINMENT SURVIVAL EMPOWERMENT
Rank Score Rank Score Rank Score Rank Score Rank Score
0.0
0.2
0.4
0.6
0.8
2006 2007 2008 2009 2010 2011
Additional Data
Economic EmpowermentFemale adult unemployment rate (% of female labour force) .......10Male adult unemployment rate (% of male labour force) ................9Women in non-agricultural paid labour
(% of total labour force) ....................................................................14Inheritance practices in favour of male heirs2 ..............................0.50Firms with female participation in ownership (% of firms) ............36Women’s access to land ownership2 .............................................0.00Women’s access to bank loans2 ......................................................0.50Women’s access to property other than land2 .............................0.00Women’s access to finance programmes3 .........................................3Ability of women to rise to positions of
enterprise leadership1 ....................................................................4.33
EducationFemale teachers, primary education (%) ..........................................86Female teachers, secondary education (%) .....................................55Female teachers, tertiary education (%) ...........................................38Female school life expectancy, primary to secondary (years)......11Male school life expectancy, primary to secondary (years) .........11
Marriage and ChildbearingMean age of marriage for women (years) ........................................27Early marriage (% women, aged 15–19) ........................................... —Fertility rate (births per woman) .......................................................1.90Adolescent fertility rate (births per 1,000 women, aged 15–19) ....18Antenatal care coverage, at least one visit (%) ...............................96Births attended by skilled health staff (%) ........................................98Maternal mortality ratio (per 100,000 live births)4 ...............26 [14-48]Contraceptive prevalence, married women (%) ..............................58Female HIV prevalence, aged 15–49 (%) ........................................0.10Male HIV prevalence, aged 15–49 (%) ............................................0.20Infant mortality rate (per 1,000 live births) ........................................11Overall population sex ratio (male/female) ....................................0.96
Social Institutions and Political RightsPaternal versus maternal authority2................................................0.50Female genital mutilation2 .................................................................0.00Acceptance or legality of polygamy2 ..............................................0.50Existence of legislation punishing acts
of violence against women2 ..........................................................0.75Year women received right to vote ................................................1952Quota type .............................................................................................. —Existence of legislation prohibiting
gender-based discrimination .......................................................... —
Childcare EcosystemLength of maternity leave ..........................................................7 weeksMaternity leave benefits (% of wages paid) ...................................100Provider of maternity coverage .............................................EmployerLength of paternity leave ..................................................................... —Paternity leave benefits (% of wages paid) ..................................... —Daycare options .................................................................................... —
LebanonGender Gap Index 2011 (out of 135 countries) 118 0.608 123 0.448 90 0.977 1 0.980 128 0.028
Gender Gap Index 2010 (out of 134 countries) 116 0.608 124 0.448 91 0.977 1 0.980 127 0.028
Gender Gap Index 2009 (out of 134 countries) — — — — — — — — — —
Gender Gap Index 2008 (out of 130 countries) — — — — — — — — — —
Gender Gap Index 2007 (out of 128 countries) — — — — — — — — — —
Gender Gap Index 2006 (out of 115 countries) — — — — — — — — — —

Female-to-male ratio
0.00 = INEQUALITY 1.00 = EQUALITY 1.50
0.00 = INEQUALITY 1.00 = EQUALITY 1.50
0.00 = INEQUALITY 1.00 = EQUALITY 1.50
0.00 = INEQUALITY 1.00 = EQUALITY 1.50
Female-to-male ratio
Female-to-male ratio
Female-to-male ratio
230 Country Profiles Global Gender Gap Report 2011
Sample Female-to- Rank Score average Female Male male ratio
country score sample average
0.00 = inequality 1.00 = equality
0.00
0.20
0.40
0.60
0.80
1.00Economy
Education
Politics
Health
Rank Score(out of 135 countries) (0.00 = inequality, 1.00 = equality)
Gender Gap Subindexes
Economic Participation and Opportunity ........... 2 0.874 0.588
Labour force participation .................................... 11 0.92 0.68 72 79 0.92
Wage equality for similar work (survey) .............. 2 0.83 0.65 — — 0.83
Estimated earned income (PPP US$) ................. 19 0.74 0.52 1,257 1,703 0.74
Legislators, senior officials, and managers ........ 1 1.00 0.26 52 48 1.08
Professional and technical workers .................... 1 1.00 0.64 58 42 1.38
Educational Attainment .......................................... 1 1.000 0.928
Literacy rate .............................................................. 1 1.00 0.86 95 83 1.15
Enrolment in primary education ............................ 1 1.00 0.98 75 71 1.05
Enrolment in secondary education ....................... 1 1.00 0.90 36 22 1.63
Enrolment in tertiary education ............................. 1 1.00 0.86 4 3 1.19
Health and Survival ................................................. 1 0.980 0.956
Sex ratio at birth (female/male) ............................. 1 0.94 0.92 — — 0.97
Healthy life expectancy .......................................... 1 1.06 1.04 41 38 1.08
Political Empowerment ........................................ 35 0.213 0.185
Women in parliament ............................................ 36 0.32 0.22 24 76 0.32
Women in ministerial positions ........................... 20 0.46 0.18 32 68 0.46
Years with female head of state (last 50) .......... 52 0.00 0.16 0 50 0.00
LesothoGender Gap Index 2011 9 0.767
Key Indicators
Total population (millions) 2.08
Population growth (%) 0.83
GDP (US$ billions) 1.05
GDP (PPP) per capita 1,444
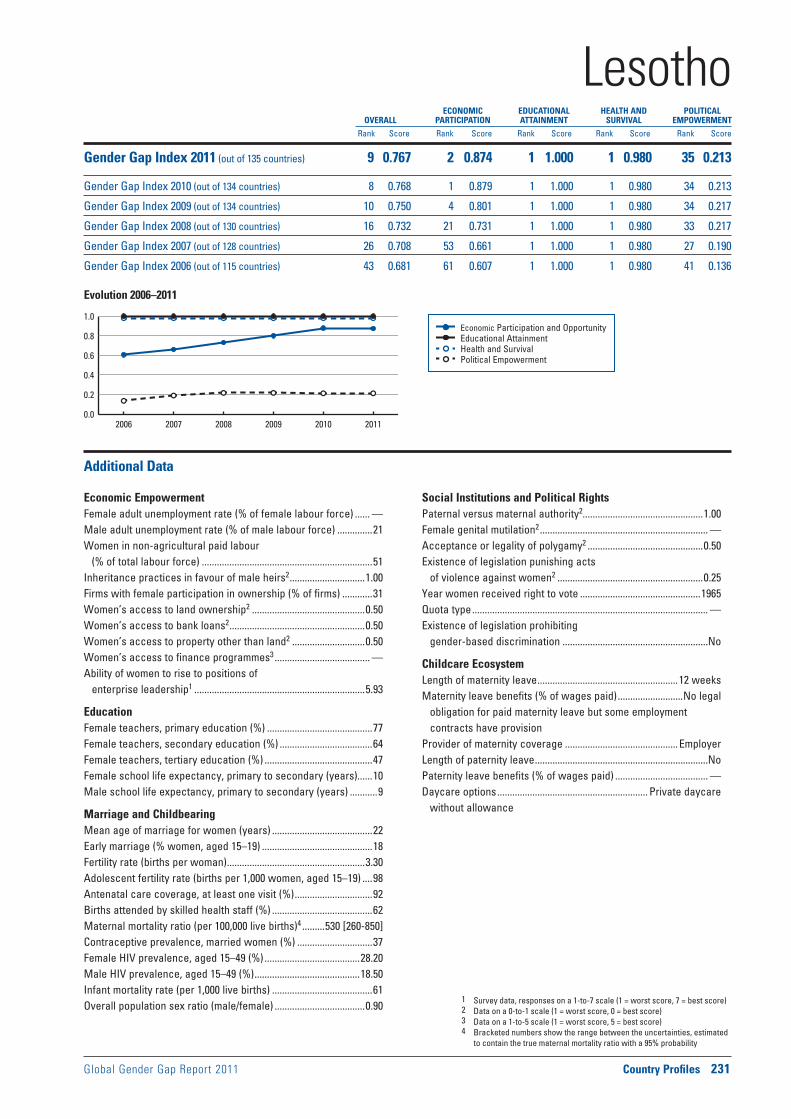
Global Gender Gap Report 2011 Country Profiles 231
Economic Participation and Opportunity Educational Attainment Health and Survival Political Empowerment
Evolution 2006–2011
1 Survey data, responses on a 1-to-7 scale (1 = worst score, 7 = best score)2 Data on a 0-to-1 scale (1 = worst score, 0 = best score)3 Data on a 1-to-5 scale (1 = worst score, 5 = best score)4 Bracketed numbers show the range between the uncertainties, estimated
to contain the true maternal mortality ratio with a 95% probability
ECONOMIC EDUCATIONAL HEALTH AND POLITICAL OVERALL PARTICIPATION ATTAINMENT SURVIVAL EMPOWERMENT
Rank Score Rank Score Rank Score Rank Score Rank Score
0.0
0.2
0.4
0.6
0.8
1.0
2006 2007 2008 2009 2010 2011
Additional Data
Economic EmpowermentFemale adult unemployment rate (% of female labour force) ...... —Male adult unemployment rate (% of male labour force) ..............21Women in non-agricultural paid labour
(% of total labour force) ....................................................................51Inheritance practices in favour of male heirs2 ..............................1.00Firms with female participation in ownership (% of firms) ............31Women’s access to land ownership2 .............................................0.50Women’s access to bank loans2 ......................................................0.50Women’s access to property other than land2 .............................0.50Women’s access to finance programmes3 ...................................... —Ability of women to rise to positions of
enterprise leadership1 ....................................................................5.93
EducationFemale teachers, primary education (%) ..........................................77Female teachers, secondary education (%) .....................................64Female teachers, tertiary education (%) ...........................................47Female school life expectancy, primary to secondary (years)......10Male school life expectancy, primary to secondary (years) ...........9
Marriage and ChildbearingMean age of marriage for women (years) ........................................22Early marriage (% women, aged 15–19) ............................................18Fertility rate (births per woman) .......................................................3.30Adolescent fertility rate (births per 1,000 women, aged 15–19) ....98Antenatal care coverage, at least one visit (%) ...............................92Births attended by skilled health staff (%) ........................................62Maternal mortality ratio (per 100,000 live births)4 .........530 [260-850]Contraceptive prevalence, married women (%) ..............................37Female HIV prevalence, aged 15–49 (%) ......................................28.20Male HIV prevalence, aged 15–49 (%) ..........................................18.50Infant mortality rate (per 1,000 live births) ........................................61Overall population sex ratio (male/female) ....................................0.90
Social Institutions and Political RightsPaternal versus maternal authority2................................................1.00Female genital mutilation2 ................................................................... —Acceptance or legality of polygamy2 ..............................................0.50Existence of legislation punishing acts
of violence against women2 ..........................................................0.25Year women received right to vote ................................................1965Quota type .............................................................................................. —Existence of legislation prohibiting
gender-based discrimination ..........................................................No
Childcare EcosystemLength of maternity leave ........................................................12 weeksMaternity leave benefits (% of wages paid) ..........................No legal
obligation for paid maternity leave but some employment contracts have provision
Provider of maternity coverage .............................................EmployerLength of paternity leave .....................................................................NoPaternity leave benefits (% of wages paid) ..................................... —Daycare options ............................................................ Private daycare
without allowance
LesothoGender Gap Index 2011 (out of 135 countries) 9 0.767 2 0.874 1 1.000 1 0.980 35 0.213
Gender Gap Index 2010 (out of 134 countries) 8 0.768 1 0.879 1 1.000 1 0.980 34 0.213
Gender Gap Index 2009 (out of 134 countries) 10 0.750 4 0.801 1 1.000 1 0.980 34 0.217
Gender Gap Index 2008 (out of 130 countries) 16 0.732 21 0.731 1 1.000 1 0.980 33 0.217
Gender Gap Index 2007 (out of 128 countries) 26 0.708 53 0.661 1 1.000 1 0.980 27 0.190
Gender Gap Index 2006 (out of 115 countries) 43 0.681 61 0.607 1 1.000 1 0.980 41 0.136

Female-to-male ratio
0.00 = INEQUALITY 1.00 = EQUALITY 1.50
0.00 = INEQUALITY 1.00 = EQUALITY 1.50
0.00 = INEQUALITY 1.00 = EQUALITY 1.50
0.00 = INEQUALITY 1.00 = EQUALITY 1.50
Female-to-male ratio
Female-to-male ratio
Female-to-male ratio
232 Country Profiles Global Gender Gap Report 2011
Sample Female-to- Rank Score average Female Male male ratio
country score sample average
0.00 = inequality 1.00 = equality
0.00
0.20
0.40
0.60
0.80
1.00Economy
Education
Politics
Health
Rank Score(out of 135 countries) (0.00 = inequality, 1.00 = equality)
Gender Gap Subindexes
Economic Participation and Opportunity ......... 26 0.744 0.588
Labour force participation .................................... 19 0.91 0.68 65 71 0.91
Wage equality for similar work (survey) ............ 85 0.62 0.65 — — 0.62
Estimated earned income (PPP US$) ................. 31 0.67 0.52 14,117 20,936 0.67
Legislators, senior officials, and managers ...... 16 0.67 0.26 40 60 0.67
Professional and technical workers .................... 1 1.00 0.64 67 33 2.06
Educational Attainment ........................................ 60 0.991 0.928
Literacy rate .............................................................. 1 1.00 0.86 100 100 1.00
Enrolment in primary education ........................ 103 0.98 0.98 93 94 0.98
Enrolment in secondary education ....................... 1 1.00 0.90 93 91 1.02
Enrolment in tertiary education ............................. 1 1.00 0.86 96 63 1.52
Health and Survival ................................................. 1 0.980 0.956
Sex ratio at birth (female/male) ............................. 1 0.94 0.92 — — 0.95
Healthy life expectancy .......................................... 1 1.06 1.04 68 58 1.17
Political Empowerment ........................................ 65 0.138 0.185
Women in parliament ............................................ 60 0.24 0.22 19 81 0.24
Women in ministerial positions ........................... 69 0.17 0.18 14 86 0.17
Years with female head of state (last 50) .......... 27 0.05 0.16 3 48 0.05
LithuaniaGender Gap Index 2011 37 0.713
Key Indicators
Total population (millions) 3.32
Population growth (%) –0.62
GDP (US$ billions) 17.53
GDP (PPP) per capita 15,384

Global Gender Gap Report 2011 Country Profiles 233
Economic Participation and Opportunity Educational Attainment Health and Survival Political Empowerment
Evolution 2006–2011
1 Survey data, responses on a 1-to-7 scale (1 = worst score, 7 = best score)2 Data on a 0-to-1 scale (1 = worst score, 0 = best score)3 Data on a 1-to-5 scale (1 = worst score, 5 = best score)4 Bracketed numbers show the range between the uncertainties, estimated
to contain the true maternal mortality ratio with a 95% probability
ECONOMIC EDUCATIONAL HEALTH AND POLITICAL OVERALL PARTICIPATION ATTAINMENT SURVIVAL EMPOWERMENT
Rank Score Rank Score Rank Score Rank Score Rank Score
0.0
0.2
0.4
0.6
0.8
1.0
2006 2007 2008 2009 2010 2011
Additional Data
Economic EmpowermentFemale adult unemployment rate (% of female labour force) .......10Male adult unemployment rate (% of male labour force) ................6Women in non-agricultural paid labour
(% of total labour force) ....................................................................53Inheritance practices in favour of male heirs2 ................................ —Firms with female participation in ownership (% of firms) ........... —Women’s access to land ownership2 ............................................... —Women’s access to bank loans2 ........................................................ —Women’s access to property other than land2 ............................... —Women’s access to finance programmes3 .........................................4Ability of women to rise to positions of
enterprise leadership1 ....................................................................4.94
EducationFemale teachers, primary education (%) ..........................................97Female teachers, secondary education (%) .....................................82Female teachers, tertiary education (%) ...........................................55Female school life expectancy, primary to secondary (years)......12Male school life expectancy, primary to secondary (years) .........12
Marriage and ChildbearingMean age of marriage for women (years) ........................................27Early marriage (% women, aged 15–19) ........................................... —Fertility rate (births per woman) .......................................................1.40Adolescent fertility rate (births per 1,000 women, aged 15–19) ....19Antenatal care coverage, at least one visit (%) .............................. —Births attended by skilled health staff (%) ......................................100Maternal mortality ratio (per 100,000 live births)4 ...............13 [11-16]Contraceptive prevalence, married women (%) ..............................51Female HIV prevalence, aged 15–49 (%) ......................................<0.10Male HIV prevalence, aged 15–49 (%) ............................................0.10Infant mortality rate (per 1,000 live births) ..........................................5Overall population sex ratio (male/female) ....................................0.88
Social Institutions and Political RightsPaternal versus maternal authority2.................................................. —Female genital mutilation2 ................................................................... —Acceptance or legality of polygamy2 ................................................ —Existence of legislation punishing acts
of violence against women2 ............................................................ —Year women received right to vote ................................................1919Quota type ..........................................................................No legislated;
voluntary political party quotasExistence of legislation prohibiting
gender-based discrimination ........................................................ Yes
Childcare EcosystemLength of maternity leave ........................................ 126 calendar daysMaternity leave benefits (% of wages paid) ...................................100Provider of maternity coverage ...........State Social Insurance FundLength of paternity leave ..........................................................4 weeks:
from birth until the child is 1 month oldPaternity leave benefits (% of wages paid) ....................................100Daycare options .................................................................................... —
LithuaniaGender Gap Index 2011 (out of 135 countries) 37 0.713 26 0.744 60 0.991 1 0.980 65 0.138
Gender Gap Index 2010 (out of 134 countries) 35 0.713 17 0.756 68 0.989 1 0.980 66 0.128
Gender Gap Index 2009 (out of 134 countries) 30 0.718 18 0.748 54 0.995 41 0.979 54 0.148
Gender Gap Index 2008 (out of 130 countries) 23 0.722 17 0.742 53 0.995 38 0.979 40 0.173
Gender Gap Index 2007 (out of 128 countries) 14 0.723 7 0.761 29 0.998 37 0.979 38 0.155
Gender Gap Index 2006 (out of 115 countries) 21 0.708 15 0.713 24 0.998 36 0.979 39 0.140

Female-to-male ratio
0.00 = INEQUALITY 1.00 = EQUALITY 1.50
0.00 = INEQUALITY 1.00 = EQUALITY 1.50
0.00 = INEQUALITY 1.00 = EQUALITY 1.50
0.00 = INEQUALITY 1.00 = EQUALITY 1.50
Female-to-male ratio
Female-to-male ratio
Female-to-male ratio
234 Country Profiles Global Gender Gap Report 2011
Sample Female-to- Rank Score average Female Male male ratio
country score sample average
0.00 = inequality 1.00 = equality
0.00
0.20
0.40
0.60
0.80
1.00Economy
Education
Politics
Health
Rank Score(out of 135 countries) (0.00 = inequality, 1.00 = equality)
Gender Gap Subindexes
Economic Participation and Opportunity ......... 25 0.745 0.588
Labour force participation .................................... 59 0.80 0.68 59 74 0.80
Wage equality for similar work (survey) ............ 62 0.67 0.65 — — 0.67
Estimated earned income (PPP US$) ................... 1 1.00 0.52 40,000 40,000 1.00
Legislators, senior officials, and managers ...... 51 0.45 0.26 31 69 0.45
Professional and technical workers ..................— — 0.64 — — —
Educational Attainment .......................................... 1 1.000 0.928
Literacy rate .............................................................. 1 1.00 0.86 99 99 1.00
Enrolment in primary education ............................ 1 1.00 0.98 97 95 1.02
Enrolment in secondary education ....................... 1 1.00 0.90 85 82 1.04
Enrolment in tertiary education ............................. 1 1.00 0.86 11 9 1.12
Health and Survival ............................................... 67 0.974 0.956
Sex ratio at birth (female/male) ......................... 120 0.94 0.92 — — 0.94
Healthy life expectancy ........................................ 60 1.06 1.04 75 71 1.06
Political Empowerment ........................................ 48 0.167 0.185
Women in parliament ............................................ 55 0.25 0.22 20 80 0.25
Women in ministerial positions ........................... 32 0.36 0.18 27 73 0.36
Years with female head of state (last 50) .......... 52 0.00 0.16 0 50 0.00
LuxembourgGender Gap Index 2011 30 0.722
Key Indicators
Total population (millions) 0.51
Population growth (%) 1.75
GDP (US$ billions) 27.39
GDP (PPP) per capita 71,048

Global Gender Gap Report 2011 Country Profiles 235
Economic Participation and Opportunity Educational Attainment Health and Survival Political Empowerment
Evolution 2006–2011
1 Survey data, responses on a 1-to-7 scale (1 = worst score, 7 = best score)2 Data on a 0-to-1 scale (1 = worst score, 0 = best score)3 Data on a 1-to-5 scale (1 = worst score, 5 = best score)4 Bracketed numbers show the range between the uncertainties, estimated
to contain the true maternal mortality ratio with a 95% probability
ECONOMIC EDUCATIONAL HEALTH AND POLITICAL OVERALL PARTICIPATION ATTAINMENT SURVIVAL EMPOWERMENT
Rank Score Rank Score Rank Score Rank Score Rank Score
0.0
0.2
0.4
0.6
0.8
1.0
2006 2007 2008 2009 2010 2011
Additional Data
Economic EmpowermentFemale adult unemployment rate (% of female labour force) .........6Male adult unemployment rate (% of male labour force) ................4Women in non-agricultural paid labour
(% of total labour force) ....................................................................43Inheritance practices in favour of male heirs2 ................................ —Firms with female participation in ownership (% of firms) ........... —Women’s access to land ownership2 ............................................... —Women’s access to bank loans2 ........................................................ —Women’s access to property other than land2 ............................... —Women’s access to finance programmes3 .........................................5Ability of women to rise to positions of
enterprise leadership1 ....................................................................4.71
EducationFemale teachers, primary education (%) ..........................................72Female teachers, secondary education (%) .....................................48Female teachers, tertiary education (%) .......................................... —Female school life expectancy, primary to secondary (years)......13Male school life expectancy, primary to secondary (years) .........13
Marriage and ChildbearingMean age of marriage for women (years) ........................................28Early marriage (% women, aged 15–19) ........................................... —Fertility rate (births per woman) .......................................................1.70Adolescent fertility rate (births per 1,000 women, aged 15–19) ....10Antenatal care coverage, at least one visit (%) .............................. —Births attended by skilled health staff (%) ......................................100Maternal mortality ratio (per 100,000 live births)4 ...............17 [15-19]Contraceptive prevalence, married women (%) ............................. —Female HIV prevalence, aged 15–49 (%) ........................................0.20Male HIV prevalence, aged 15–49 (%) ............................................0.40Infant mortality rate (per 1,000 live births) ..........................................1Overall population sex ratio (male/female) ....................................0.99
Social Institutions and Political RightsPaternal versus maternal authority2.................................................. —Female genital mutilation2 ................................................................... —Acceptance or legality of polygamy2 ................................................ —Existence of legislation punishing acts
of violence against women2 ............................................................ —Year women received right to vote ................................................1919Quota type ..........................................................................No legislated;
voluntary political party quotasExistence of legislation prohibiting
gender-based discrimination ........................................................ Yes
Childcare EcosystemLength of maternity leave ........................................................16 weeksMaternity leave benefits (% of wages paid) ...................................100Provider of maternity coverage ............................... Social insuranceLength of paternity leave .............................................................. 2 daysPaternity leave benefits (% of wages paid) ....................................100Daycare options ......................................................................Public and
private daycare with allowance; homecare with and without allowance
LuxembourgGender Gap Index 2011 (out of 135 countries) 30 0.722 25 0.745 1 1.000 67 0.974 48 0.167
Gender Gap Index 2010 (out of 134 countries) 26 0.723 22 0.751 1 1.000 67 0.974 49 0.167
Gender Gap Index 2009 (out of 134 countries) 63 0.689 73 0.638 1 1.000 80 0.973 57 0.144
Gender Gap Index 2008 (out of 130 countries) 66 0.680 75 0.613 1 1.000 76 0.973 58 0.135
Gender Gap Index 2007 (out of 128 countries) 58 0.679 78 0.606 1 1.000 74 0.973 50 0.135
Gender Gap Index 2006 (out of 115 countries) 56 0.667 76 0.560 1 1.000 71 0.973 44 0.135
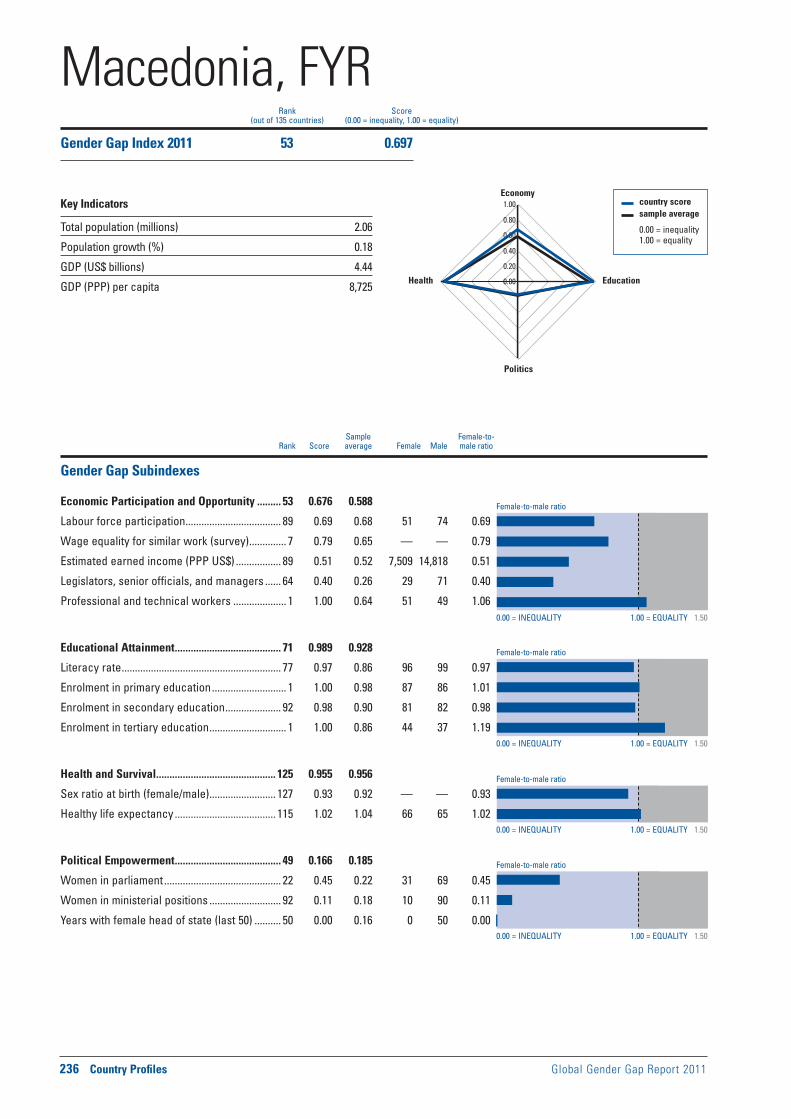
Female-to-male ratio
0.00 = INEQUALITY 1.00 = EQUALITY 1.50
0.00 = INEQUALITY 1.00 = EQUALITY 1.50
0.00 = INEQUALITY 1.00 = EQUALITY 1.50
0.00 = INEQUALITY 1.00 = EQUALITY 1.50
Female-to-male ratio
Female-to-male ratio
Female-to-male ratio
236 Country Profiles Global Gender Gap Report 2011
Sample Female-to- Rank Score average Female Male male ratio
country score sample average
0.00 = inequality 1.00 = equality
0.00
0.20
0.40
0.60
0.80
1.00Economy
Education
Politics
Health
Rank Score(out of 135 countries) (0.00 = inequality, 1.00 = equality)
Gender Gap Subindexes
Economic Participation and Opportunity ......... 53 0.676 0.588
Labour force participation .................................... 89 0.69 0.68 51 74 0.69
Wage equality for similar work (survey) .............. 7 0.79 0.65 — — 0.79
Estimated earned income (PPP US$) ................. 89 0.51 0.52 7,509 14,818 0.51
Legislators, senior officials, and managers ...... 64 0.40 0.26 29 71 0.40
Professional and technical workers .................... 1 1.00 0.64 51 49 1.06
Educational Attainment ........................................ 71 0.989 0.928
Literacy rate ............................................................ 77 0.97 0.86 96 99 0.97
Enrolment in primary education ............................ 1 1.00 0.98 87 86 1.01
Enrolment in secondary education ..................... 92 0.98 0.90 81 82 0.98
Enrolment in tertiary education ............................. 1 1.00 0.86 44 37 1.19
Health and Survival ............................................. 125 0.955 0.956
Sex ratio at birth (female/male) ......................... 127 0.93 0.92 — — 0.93
Healthy life expectancy ...................................... 115 1.02 1.04 66 65 1.02
Political Empowerment ........................................ 49 0.166 0.185
Women in parliament ............................................ 22 0.45 0.22 31 69 0.45
Women in ministerial positions ........................... 92 0.11 0.18 10 90 0.11
Years with female head of state (last 50) .......... 50 0.00 0.16 0 50 0.00
Macedonia, FYRGender Gap Index 2011 53 0.697
Key Indicators
Total population (millions) 2.06
Population growth (%) 0.18
GDP (US$ billions) 4.44
GDP (PPP) per capita 8,725
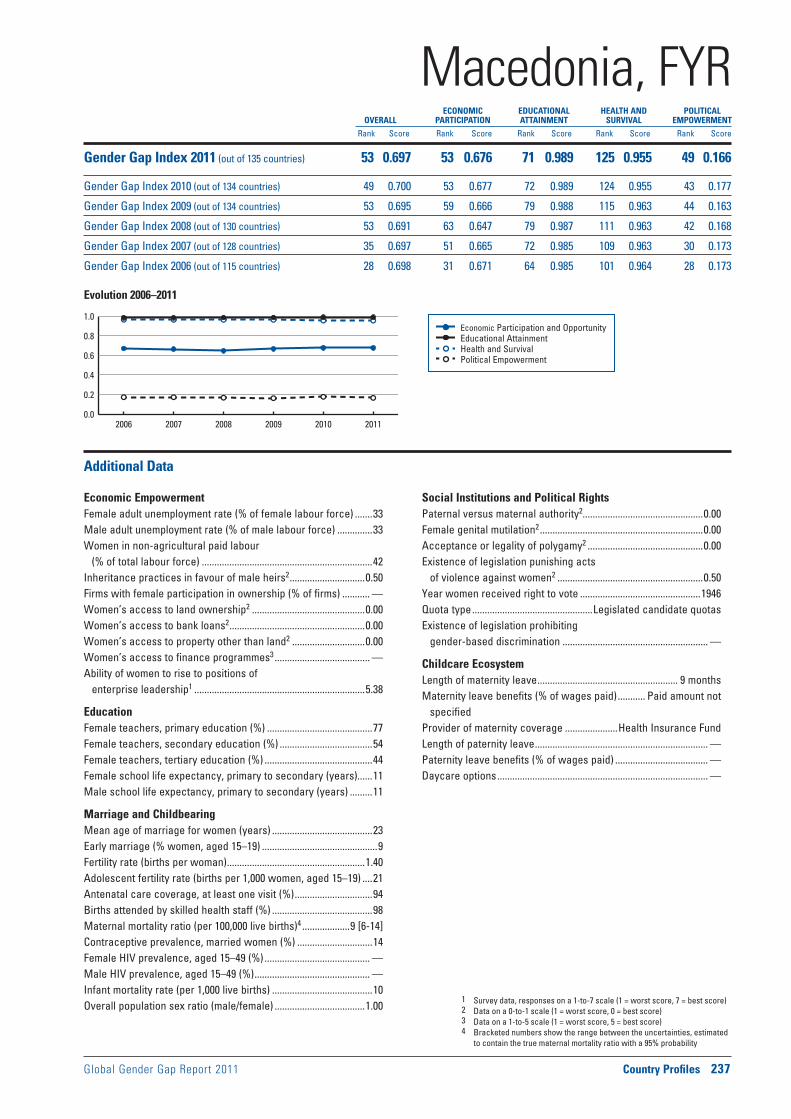
Global Gender Gap Report 2011 Country Profiles 237
Economic Participation and Opportunity Educational Attainment Health and Survival Political Empowerment
Evolution 2006–2011
1 Survey data, responses on a 1-to-7 scale (1 = worst score, 7 = best score)2 Data on a 0-to-1 scale (1 = worst score, 0 = best score)3 Data on a 1-to-5 scale (1 = worst score, 5 = best score)4 Bracketed numbers show the range between the uncertainties, estimated
to contain the true maternal mortality ratio with a 95% probability
ECONOMIC EDUCATIONAL HEALTH AND POLITICAL OVERALL PARTICIPATION ATTAINMENT SURVIVAL EMPOWERMENT
Rank Score Rank Score Rank Score Rank Score Rank Score
0.0
0.2
0.4
0.6
0.8
1.0
2006 2007 2008 2009 2010 2011
Additional Data
Economic EmpowermentFemale adult unemployment rate (% of female labour force) .......33Male adult unemployment rate (% of male labour force) ..............33Women in non-agricultural paid labour
(% of total labour force) ....................................................................42Inheritance practices in favour of male heirs2 ..............................0.50Firms with female participation in ownership (% of firms) ........... —Women’s access to land ownership2 .............................................0.00Women’s access to bank loans2 ......................................................0.00Women’s access to property other than land2 .............................0.00Women’s access to finance programmes3 ...................................... —Ability of women to rise to positions of
enterprise leadership1 ....................................................................5.38
EducationFemale teachers, primary education (%) ..........................................77Female teachers, secondary education (%) .....................................54Female teachers, tertiary education (%) ...........................................44Female school life expectancy, primary to secondary (years)......11Male school life expectancy, primary to secondary (years) .........11
Marriage and ChildbearingMean age of marriage for women (years) ........................................23Early marriage (% women, aged 15–19) ..............................................9Fertility rate (births per woman) .......................................................1.40Adolescent fertility rate (births per 1,000 women, aged 15–19) ....21Antenatal care coverage, at least one visit (%) ...............................94Births attended by skilled health staff (%) ........................................98Maternal mortality ratio (per 100,000 live births)4 ...................9 [6-14]Contraceptive prevalence, married women (%) ..............................14Female HIV prevalence, aged 15–49 (%) .......................................... —Male HIV prevalence, aged 15–49 (%) .............................................. —Infant mortality rate (per 1,000 live births) ........................................10Overall population sex ratio (male/female) ....................................1.00
Social Institutions and Political RightsPaternal versus maternal authority2................................................0.00Female genital mutilation2 .................................................................0.00Acceptance or legality of polygamy2 ..............................................0.00Existence of legislation punishing acts
of violence against women2 ..........................................................0.50Year women received right to vote ................................................1946Quota type ................................................Legislated candidate quotasExistence of legislation prohibiting
gender-based discrimination .......................................................... —
Childcare EcosystemLength of maternity leave ........................................................ 9 months Maternity leave benefits (% of wages paid) ........... Paid amount not
specifiedProvider of maternity coverage .....................Health Insurance FundLength of paternity leave ..................................................................... —Paternity leave benefits (% of wages paid) ..................................... —Daycare options .................................................................................... —
Macedonia, FYRGender Gap Index 2011 (out of 135 countries) 53 0.697 53 0.676 71 0.989 125 0.955 49 0.166
Gender Gap Index 2010 (out of 134 countries) 49 0.700 53 0.677 72 0.989 124 0.955 43 0.177
Gender Gap Index 2009 (out of 134 countries) 53 0.695 59 0.666 79 0.988 115 0.963 44 0.163
Gender Gap Index 2008 (out of 130 countries) 53 0.691 63 0.647 79 0.987 111 0.963 42 0.168
Gender Gap Index 2007 (out of 128 countries) 35 0.697 51 0.665 72 0.985 109 0.963 30 0.173
Gender Gap Index 2006 (out of 115 countries) 28 0.698 31 0.671 64 0.985 101 0.964 28 0.173

Female-to-male ratio
0.00 = INEQUALITY 1.00 = EQUALITY 1.50
0.00 = INEQUALITY 1.00 = EQUALITY 1.50
0.00 = INEQUALITY 1.00 = EQUALITY 1.50
0.00 = INEQUALITY 1.00 = EQUALITY 1.50
Female-to-male ratio
Female-to-male ratio
Female-to-male ratio
238 Country Profiles Global Gender Gap Report 2011
Sample Female-to- Rank Score average Female Male male ratio
country score sample average
0.00 = inequality 1.00 = equality
0.00
0.20
0.40
0.60
0.80
1.00Economy
Education
Politics
Health
Rank Score(out of 135 countries) (0.00 = inequality, 1.00 = equality)
Gender Gap Subindexes
Economic Participation and Opportunity ......... 52 0.678 0.588
Labour force participation ...................................... 5 0.96 0.68 86 89 0.96
Wage equality for similar work (survey) ............ 87 0.62 0.65 — — 0.62
Estimated earned income (PPP US$) ................. 21 0.73 0.52 845 1,164 0.73
Legislators, senior officials, and managers ...... 84 0.28 0.26 22 78 0.28
Professional and technical workers .................. 82 0.76 0.64 43 57 0.76
Educational Attainment ........................................ 91 0.972 0.928
Literacy rate ............................................................ 99 0.91 0.86 62 67 0.91
Enrolment in primary education ............................ 1 1.00 0.98 99 98 1.01
Enrolment in secondary education ....................... 1 1.00 0.90 24 23 1.05
Enrolment in tertiary education ........................... 95 0.90 0.86 3 4 0.90
Health and Survival ............................................... 81 0.973 0.956
Sex ratio at birth (female/male) ............................. 1 0.94 0.92 — — 0.97
Healthy life expectancy ........................................ 88 1.04 1.04 53 51 1.04
Political Empowerment ........................................ 93 0.096 0.185
Women in parliament ............................................ 91 0.14 0.22 13 88 0.14
Women in ministerial positions ........................... 60 0.21 0.18 17 83 0.21
Years with female head of state (last 50) .......... 52 0.00 0.16 0 50 0.00
MadagascarGender Gap Index 2011 71 0.680
Key Indicators
Total population (millions) 20.15
Population growth (%) 2.62
GDP (US$ billions) 5.03
GDP (PPP) per capita 893
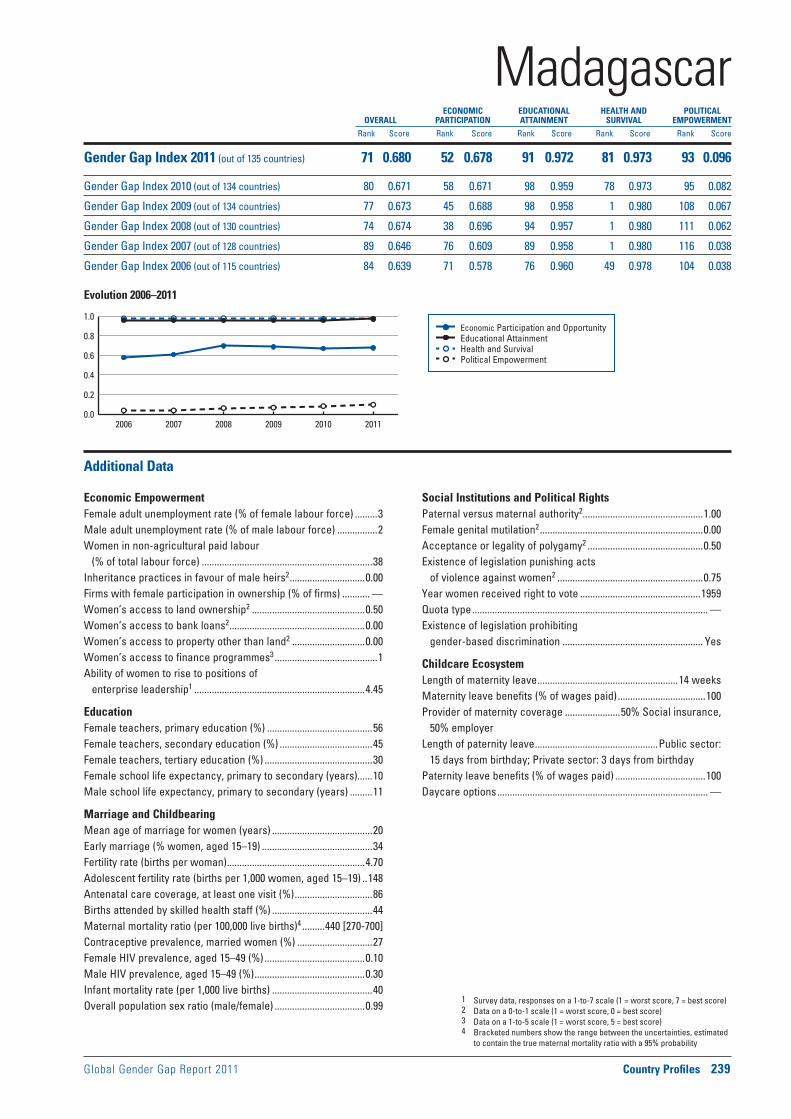
Global Gender Gap Report 2011 Country Profiles 239
Economic Participation and Opportunity Educational Attainment Health and Survival Political Empowerment
Evolution 2006–2011
1 Survey data, responses on a 1-to-7 scale (1 = worst score, 7 = best score)2 Data on a 0-to-1 scale (1 = worst score, 0 = best score)3 Data on a 1-to-5 scale (1 = worst score, 5 = best score)4 Bracketed numbers show the range between the uncertainties, estimated
to contain the true maternal mortality ratio with a 95% probability
ECONOMIC EDUCATIONAL HEALTH AND POLITICAL OVERALL PARTICIPATION ATTAINMENT SURVIVAL EMPOWERMENT
Rank Score Rank Score Rank Score Rank Score Rank Score
0.0
0.2
0.4
0.6
0.8
1.0
2006 2007 2008 2009 2010 2011
Additional Data
Economic EmpowermentFemale adult unemployment rate (% of female labour force) .........3Male adult unemployment rate (% of male labour force) ................2Women in non-agricultural paid labour
(% of total labour force) ....................................................................38Inheritance practices in favour of male heirs2 ..............................0.00Firms with female participation in ownership (% of firms) ........... —Women’s access to land ownership2 .............................................0.50Women’s access to bank loans2 ......................................................0.00Women’s access to property other than land2 .............................0.00Women’s access to finance programmes3 .........................................1Ability of women to rise to positions of
enterprise leadership1 ....................................................................4.45
EducationFemale teachers, primary education (%) ..........................................56Female teachers, secondary education (%) .....................................45Female teachers, tertiary education (%) ...........................................30Female school life expectancy, primary to secondary (years)......10Male school life expectancy, primary to secondary (years) .........11
Marriage and ChildbearingMean age of marriage for women (years) ........................................20Early marriage (% women, aged 15–19) ............................................34Fertility rate (births per woman) .......................................................4.70Adolescent fertility rate (births per 1,000 women, aged 15–19) ..148Antenatal care coverage, at least one visit (%) ...............................86Births attended by skilled health staff (%) ........................................44Maternal mortality ratio (per 100,000 live births)4 .........440 [270-700]Contraceptive prevalence, married women (%) ..............................27Female HIV prevalence, aged 15–49 (%) ........................................0.10Male HIV prevalence, aged 15–49 (%) ............................................0.30Infant mortality rate (per 1,000 live births) ........................................40Overall population sex ratio (male/female) ....................................0.99
Social Institutions and Political RightsPaternal versus maternal authority2................................................1.00Female genital mutilation2 .................................................................0.00Acceptance or legality of polygamy2 ..............................................0.50Existence of legislation punishing acts
of violence against women2 ..........................................................0.75Year women received right to vote ................................................1959Quota type .............................................................................................. —Existence of legislation prohibiting
gender-based discrimination ........................................................ Yes
Childcare EcosystemLength of maternity leave ........................................................14 weeksMaternity leave benefits (% of wages paid) ...................................100Provider of maternity coverage ......................50% Social insurance,
50% employerLength of paternity leave .................................................Public sector:
15 days from birthday; Private sector: 3 days from birthdayPaternity leave benefits (% of wages paid) ....................................100Daycare options .................................................................................... —
MadagascarGender Gap Index 2011 (out of 135 countries) 71 0.680 52 0.678 91 0.972 81 0.973 93 0.096
Gender Gap Index 2010 (out of 134 countries) 80 0.671 58 0.671 98 0.959 78 0.973 95 0.082
Gender Gap Index 2009 (out of 134 countries) 77 0.673 45 0.688 98 0.958 1 0.980 108 0.067
Gender Gap Index 2008 (out of 130 countries) 74 0.674 38 0.696 94 0.957 1 0.980 111 0.062
Gender Gap Index 2007 (out of 128 countries) 89 0.646 76 0.609 89 0.958 1 0.980 116 0.038
Gender Gap Index 2006 (out of 115 countries) 84 0.639 71 0.578 76 0.960 49 0.978 104 0.038

Female-to-male ratio
0.00 = INEQUALITY 1.00 = EQUALITY 1.50
0.00 = INEQUALITY 1.00 = EQUALITY 1.50
0.00 = INEQUALITY 1.00 = EQUALITY 1.50
0.00 = INEQUALITY 1.00 = EQUALITY 1.50
Female-to-male ratio
Female-to-male ratio
Female-to-male ratio
240 Country Profiles Global Gender Gap Report 2011
Sample Female-to- Rank Score average Female Male male ratio
country score sample average
0.00 = inequality 1.00 = equality
0.00
0.20
0.40
0.60
0.80
1.00Economy
Education
Politics
Health
Rank Score(out of 135 countries) (0.00 = inequality, 1.00 = equality)
Gender Gap Subindexes
Economic Participation and Opportunity ......... 45 0.700 0.588
Labour force participation ...................................... 7 0.96 0.68 74 78 0.96
Wage equality for similar work (survey) ............ 18 0.77 0.65 — — 0.77
Estimated earned income (PPP US$) ................. 20 0.73 0.52 671 919 0.73
Legislators, senior officials, and managers ...... 94 0.18 0.26 15 85 0.18
Professional and technical workers ..................— — 0.64 — — —
Educational Attainment ...................................... 112 0.897 0.928
Literacy rate .......................................................... 111 0.83 0.86 67 81 0.83
Enrolment in primary education ............................ 1 1.00 0.98 93 88 1.05
Enrolment in secondary education ................... 102 0.95 0.90 24 26 0.95
Enrolment in tertiary education ......................... 118 0.51 0.86 0 1 0.51
Health and Survival ............................................. 100 0.968 0.956
Sex ratio at birth (female/male) ............................. 1 0.94 0.92 — — 0.99
Healthy life expectancy ...................................... 106 1.02 1.04 44 43 1.02
Political Empowerment ........................................ 44 0.174 0.185
Women in parliament ............................................ 51 0.26 0.22 21 79 0.26
Women in ministerial positions ........................... 30 0.38 0.18 27 73 0.38
Years with female head of state (last 50) .......... 52 0.00 0.16 0 50 0.00
MalawiGender Gap Index 2011 65 0.685
Key Indicators
Total population (millions) 14.90
Population growth (%) 3.13
GDP (US$ billions) 2.74
GDP (PPP) per capita 791

Global Gender Gap Report 2011 Country Profiles 241
Economic Participation and Opportunity Educational Attainment Health and Survival Political Empowerment
Evolution 2006–2011
1 Survey data, responses on a 1-to-7 scale (1 = worst score, 7 = best score)2 Data on a 0-to-1 scale (1 = worst score, 0 = best score)3 Data on a 1-to-5 scale (1 = worst score, 5 = best score)4 Bracketed numbers show the range between the uncertainties, estimated
to contain the true maternal mortality ratio with a 95% probability
ECONOMIC EDUCATIONAL HEALTH AND POLITICAL OVERALL PARTICIPATION ATTAINMENT SURVIVAL EMPOWERMENT
Rank Score Rank Score Rank Score Rank Score Rank Score
0.0
0.2
0.4
0.6
0.8
1.0
2006 2007 2008 2009 2010 2011
Additional Data
Economic EmpowermentFemale adult unemployment rate (% of female labour force) .......10Male adult unemployment rate (% of male labour force) ................5Women in non-agricultural paid labour
(% of total labour force) ....................................................................11Inheritance practices in favour of male heirs2 ..............................0.50Firms with female participation in ownership (% of firms) ........... —Women’s access to land ownership2 .............................................0.50Women’s access to bank loans2 ......................................................0.50Women’s access to property other than land2 .............................0.50Women’s access to finance programmes3 .........................................2Ability of women to rise to positions of
enterprise leadership1 ....................................................................5.43
EducationFemale teachers, primary education (%) ......................................... —Female teachers, secondary education (%) .................................... —Female teachers, tertiary education (%) ...........................................34Female school life expectancy, primary to secondary (years)........9Male school life expectancy, primary to secondary (years) ...........9
Marriage and ChildbearingMean age of marriage for women (years) ........................................19Early marriage (% women, aged 15–19) ............................................37Fertility rate (births per woman) .......................................................5.60Adolescent fertility rate (births per 1,000 women, aged 15–19) ..178Antenatal care coverage, at least one visit (%) ...............................92Births attended by skilled health staff (%) ........................................54Maternal mortality ratio (per 100,000 live births)4 .........510 [300-760]Contraceptive prevalence, married women (%) ..............................41Female HIV prevalence, aged 15–49 (%) ......................................13.20Male HIV prevalence, aged 15–49 (%) ............................................8.90Infant mortality rate (per 1,000 live births) ........................................69Overall population sex ratio (male/female) ....................................0.99
Social Institutions and Political RightsPaternal versus maternal authority2................................................0.00Female genital mutilation2 .................................................................0.18Acceptance or legality of polygamy2 ..............................................0.50Existence of legislation punishing acts
of violence against women2 ..........................................................0.75Year women received right to vote ................................................1961Quota type .............................................................................................. —Existence of legislation prohibiting
gender-based discrimination .......................................................... —
Childcare EcosystemLength of maternity leave ........................ 8 weeks. Every three yearsMaternity leave benefits (% of wages paid) ...................................100Provider of maternity coverage .............................................EmployerLength of paternity leave ..................................................................... —Paternity leave benefits (% of wages paid) ..................................... —Daycare options .................................................................................... —
MalawiGender Gap Index 2011 (out of 135 countries) 65 0.685 45 0.700 112 0.897 100 0.968 44 0.174
Gender Gap Index 2010 (out of 134 countries) 68 0.682 44 0.698 112 0.889 99 0.968 45 0.174
Gender Gap Index 2009 (out of 134 countries) 76 0.674 42 0.693 113 0.883 116 0.961 48 0.159
Gender Gap Index 2008 (out of 130 countries) 81 0.666 46 0.687 107 0.894 112 0.961 65 0.124
Gender Gap Index 2007 (out of 128 countries) 87 0.648 43 0.675 108 0.865 110 0.961 76 0.090
Gender Gap Index 2006 (out of 115 countries) 81 0.644 36 0.665 96 0.860 106 0.960 68 0.090

Female-to-male ratio
0.00 = INEQUALITY 1.00 = EQUALITY 1.50
0.00 = INEQUALITY 1.00 = EQUALITY 1.50
0.00 = INEQUALITY 1.00 = EQUALITY 1.50
0.00 = INEQUALITY 1.00 = EQUALITY 1.50
Female-to-male ratio
Female-to-male ratio
Female-to-male ratio
242 Country Profiles Global Gender Gap Report 2011
Sample Female-to- Rank Score average Female Male male ratio
country score sample average
0.00 = inequality 1.00 = equality
0.00
0.20
0.40
0.60
0.80
1.00Economy
Education
Politics
Health
Rank Score(out of 135 countries) (0.00 = inequality, 1.00 = equality)
Gender Gap Subindexes
Economic Participation and Opportunity ......... 95 0.594 0.588
Labour force participation .................................. 106 0.57 0.68 47 82 0.57
Wage equality for similar work (survey) .............. 4 0.81 0.65 — — 0.81
Estimated earned income (PPP US$) ............... 107 0.43 0.52 8,365 19,486 0.43
Legislators, senior officials, and managers ...... 75 0.32 0.26 24 76 0.32
Professional and technical workers .................. 83 0.71 0.64 42 58 0.71
Educational Attainment ........................................ 65 0.991 0.928
Literacy rate ............................................................ 85 0.95 0.86 90 95 0.95
Enrolment in primary education .......................... 70 1.00 0.98 94 94 1.00
Enrolment in secondary education ....................... 1 1.00 0.90 71 66 1.07
Enrolment in tertiary education ............................. 1 1.00 0.86 41 32 1.30
Health and Survival ............................................... 78 0.974 0.956
Sex ratio at birth (female/male) ......................... 124 0.94 0.92 — — 0.94
Healthy life expectancy .......................................... 1 1.06 1.04 66 62 1.06
Political Empowerment ...................................... 115 0.052 0.185
Women in parliament .......................................... 104 0.11 0.22 10 90 0.11
Women in ministerial positions ......................... 108 0.07 0.18 7 93 0.07
Years with female head of state (last 50) .......... 52 0.00 0.16 0 50 0.00
MalaysiaGender Gap Index 2011 97 0.653
Key Indicators
Total population (millions) 27.91
Population growth (%) 1.61
GDP (US$ billions) 146.94
GDP (PPP) per capita 13,416

Global Gender Gap Report 2011 Country Profiles 243
Economic Participation and Opportunity Educational Attainment Health and Survival Political Empowerment
Evolution 2006–2011
1 Survey data, responses on a 1-to-7 scale (1 = worst score, 7 = best score)2 Data on a 0-to-1 scale (1 = worst score, 0 = best score)3 Data on a 1-to-5 scale (1 = worst score, 5 = best score)4 Bracketed numbers show the range between the uncertainties, estimated
to contain the true maternal mortality ratio with a 95% probability
ECONOMIC EDUCATIONAL HEALTH AND POLITICAL OVERALL PARTICIPATION ATTAINMENT SURVIVAL EMPOWERMENT
Rank Score Rank Score Rank Score Rank Score Rank Score
0.0
0.2
0.4
0.6
0.8
1.0
2006 2007 2008 2009 2010 2011
Additional Data
Economic EmpowermentFemale adult unemployment rate (% of female labour force) .........4Male adult unemployment rate (% of male labour force) ................3Women in non-agricultural paid labour
(% of total labour force) ....................................................................39Inheritance practices in favour of male heirs2 ..............................0.50Firms with female participation in ownership (% of firms) ............33Women’s access to land ownership2 .............................................0.00Women’s access to bank loans2 ......................................................0.00Women’s access to property other than land2 .............................0.00Women’s access to finance programmes3 .........................................3Ability of women to rise to positions of
enterprise leadership1 ....................................................................5.78
EducationFemale teachers, primary education (%) ..........................................68Female teachers, secondary education (%) .....................................66Female teachers, tertiary education (%) ...........................................51Female school life expectancy, primary to secondary (years)......11Male school life expectancy, primary to secondary (years) .........10
Marriage and ChildbearingMean age of marriage for women (years) ........................................25Early marriage (% women, aged 15–19) ..............................................5Fertility rate (births per woman) .......................................................2.60Adolescent fertility rate (births per 1,000 women, aged 15–19) ....12Antenatal care coverage, at least one visit (%) ...............................79Births attended by skilled health staff (%) ......................................100Maternal mortality ratio (per 100,000 live births)4 ...............31 [14-68]Contraceptive prevalence, married women (%) ..............................55Female HIV prevalence, aged 15–49 (%) ........................................0.10Male HIV prevalence, aged 15–49 (%) ............................................0.80Infant mortality rate (per 1,000 live births) ..........................................6Overall population sex ratio (male/female) ....................................1.03
Social Institutions and Political RightsPaternal versus maternal authority2................................................0.50Female genital mutilation2 ................................................................... —Acceptance or legality of polygamy2 ..............................................0.50Existence of legislation punishing acts
of violence against women2 ..........................................................0.42Year women received right to vote ................................................1957Quota type .............................................................................................. —Existence of legislation prohibiting
gender-based discrimination ........................................................ Yes
Childcare EcosystemLength of maternity leave ........................................................... 60 daysMaternity leave benefits (% of wages paid) ...................................100Provider of maternity coverage .............................................EmployerLength of paternity leave ..................................Public sector: 1 week.
Private sector: nonePaternity leave benefits (% of wages paid) ....................................100Daycare options ..............................................................Public daycare
with allowance; private daycare without allowance; homecare without allowance
MalaysiaGender Gap Index 2011 (out of 135 countries) 97 0.653 95 0.594 65 0.991 78 0.974 115 0.052
Gender Gap Index 2010 (out of 134 countries) 98 0.648 99 0.576 65 0.990 76 0.974 110 0.052
Gender Gap Index 2009 (out of 134 countries) 100 0.647 103 0.565 77 0.989 103 0.969 113 0.063
Gender Gap Index 2008 (out of 130 countries) 96 0.644 100 0.555 75 0.990 98 0.969 109 0.063
Gender Gap Index 2007 (out of 128 countries) 92 0.644 93 0.567 71 0.985 97 0.969 101 0.056
Gender Gap Index 2006 (out of 115 countries) 72 0.651 68 0.592 63 0.985 80 0.970 90 0.056

Female-to-male ratio
0.00 = INEQUALITY 1.00 = EQUALITY 1.50
0.00 = INEQUALITY 1.00 = EQUALITY 1.50
0.00 = INEQUALITY 1.00 = EQUALITY 1.50
0.00 = INEQUALITY 1.00 = EQUALITY 1.50
Female-to-male ratio
Female-to-male ratio
Female-to-male ratio
244 Country Profiles Global Gender Gap Report 2011
Sample Female-to- Rank Score average Female Male male ratio
country score sample average
0.00 = inequality 1.00 = equality
0.00
0.20
0.40
0.60
0.80
1.00Economy
Education
Politics
Health
Rank Score(out of 135 countries) (0.00 = inequality, 1.00 = equality)
Gender Gap Subindexes
Economic Participation and Opportunity ......... 86 0.602 0.588
Labour force participation .................................... 75 0.75 0.68 59 79 0.75
Wage equality for similar work (survey) ............— — 0.65 — — —
Estimated earned income (PPP US$) ................. 68 0.57 0.52 3,969 6,952 0.57
Legislators, senior officials, and managers ...... 97 0.17 0.26 14 86 0.17
Professional and technical workers .................. 67 0.95 0.64 49 51 0.95
Educational Attainment ........................................ 69 0.990 0.928
Literacy rate .............................................................. 1 1.00 0.86 98 98 1.00
Enrolment in primary education ........................ 109 0.98 0.98 95 97 0.98
Enrolment in secondary education ....................... 1 1.00 0.90 54 47 1.15
Enrolment in tertiary education ............................. 1 1.00 0.86 0 0 2.40
Health and Survival ............................................. 111 0.961 0.956
Sex ratio at birth (female/male) ............................. 1 0.94 0.92 — — 0.95
Healthy life expectancy ...................................... 118 1.00 1.04 64 64 1.00
Political Empowerment ...................................... 119 0.039 0.185
Women in parliament .......................................... 120 0.07 0.22 7 94 0.07
Women in ministerial positions ......................... 108 0.07 0.18 7 93 0.07
Years with female head of state (last 50) .......... 52 0.00 0.16 0 50 0.00
MaldivesGender Gap Index 2011 101 0.648
Key Indicators
Total population (millions) 0.31
Population growth (%) 1.44
GDP (US$ billions) 1.07
GDP (PPP) per capita 5,168

Global Gender Gap Report 2011 Country Profiles 245
Economic Participation and Opportunity Educational Attainment Health and Survival Political Empowerment
Evolution 2006–2011
1 Survey data, responses on a 1-to-7 scale (1 = worst score, 7 = best score)2 Data on a 0-to-1 scale (1 = worst score, 0 = best score)3 Data on a 1-to-5 scale (1 = worst score, 5 = best score)4 Bracketed numbers show the range between the uncertainties, estimated
to contain the true maternal mortality ratio with a 95% probability
ECONOMIC EDUCATIONAL HEALTH AND POLITICAL OVERALL PARTICIPATION ATTAINMENT SURVIVAL EMPOWERMENT
Rank Score Rank Score Rank Score Rank Score Rank Score
0.0
0.2
0.4
0.6
0.8
1.0
2006 2007 2008 2009 2010 2011
Additional Data
Economic EmpowermentFemale adult unemployment rate (% of female labour force) .......24Male adult unemployment rate (% of male labour force) ................8Women in non-agricultural paid labour
(% of total labour force) ....................................................................30Inheritance practices in favour of male heirs2 ................................ —Firms with female participation in ownership (% of firms) ........... —Women’s access to land ownership2 ............................................... —Women’s access to bank loans2 ........................................................ —Women’s access to property other than land2 ............................... —Women’s access to finance programmes3 ...................................... —Ability of women to rise to positions of
enterprise leadership1 ...................................................................... —
EducationFemale teachers, primary education (%) ..........................................74Female teachers, secondary education (%) .....................................35Female teachers, tertiary education (%) ...........................................67Female school life expectancy, primary to secondary (years)......12Male school life expectancy, primary to secondary (years) .........12
Marriage and ChildbearingMean age of marriage for women (years) ........................................23Early marriage (% women, aged 15–19) ........................................... —Fertility rate (births per woman) .......................................................2.00Adolescent fertility rate (births per 1,000 women, aged 15–19) ....14Antenatal care coverage, at least one visit (%) ...............................99Births attended by skilled health staff (%) ........................................95Maternal mortality ratio (per 100,000 live births)4 ...............37 [21-64]Contraceptive prevalence, married women (%) ..............................39Female HIV prevalence, aged 15–49 (%) ......................................<0.10Male HIV prevalence, aged 15–49 (%) ..........................................<0.10Infant mortality rate (per 1,000 live births) ........................................11Overall population sex ratio (male/female) ....................................1.02
Social Institutions and Political RightsPaternal versus maternal authority2.................................................. —Female genital mutilation2 ................................................................... —Acceptance or legality of polygamy2 ................................................ —Existence of legislation punishing acts
of violence against women2 ............................................................ —Year women received right to vote ................................................1932Quota type .............................................................................................. —Existence of legislation prohibiting
gender-based discrimination .......................................................... —
Childcare EcosystemLength of maternity leave .................................................................... —Maternity leave benefits (% of wages paid) .................................... —Provider of maternity coverage ......................................................... —Length of paternity leave ..................................................................... —Paternity leave benefits (% of wages paid) ..................................... —Daycare options .................................................................................... —
MaldivesGender Gap Index 2011 (out of 135 countries) 101 0.648 86 0.602 69 0.990 111 0.961 119 0.039
Gender Gap Index 2010 (out of 134 countries) 99 0.645 95 0.591 67 0.990 110 0.961 118 0.039
Gender Gap Index 2009 (out of 134 countries) 99 0.648 97 0.579 1 1.000 126 0.951 112 0.063
Gender Gap Index 2008 (out of 130 countries) 91 0.650 95 0.566 1 1.000 122 0.951 96 0.083
Gender Gap Index 2007 (out of 128 countries) 99 0.635 106 0.514 1 1.000 120 0.951 87 0.075
Gender Gap Index 2006 (out of 115 countries) — — — — — — — — — —

Female-to-male ratio
0.00 = INEQUALITY 1.00 = EQUALITY 1.50
0.00 = INEQUALITY 1.00 = EQUALITY 1.50
0.00 = INEQUALITY 1.00 = EQUALITY 1.50
0.00 = INEQUALITY 1.00 = EQUALITY 1.50
Female-to-male ratio
Female-to-male ratio
Female-to-male ratio
246 Country Profiles Global Gender Gap Report 2011
Sample Female-to- Rank Score average Female Male male ratio
country score sample average
0.00 = inequality 1.00 = equality
0.00
0.20
0.40
0.60
0.80
1.00Economy
Education
Politics
Health
Rank Score(out of 135 countries) (0.00 = inequality, 1.00 = equality)
Gender Gap Subindexes
Economic Participation and Opportunity ....... 111 0.527 0.588
Labour force participation .................................. 108 0.57 0.68 39 68 0.57
Wage equality for similar work (survey) ............ 47 0.69 0.65 — — 0.69
Estimated earned income (PPP US$) ............... 103 0.45 0.52 736 1,647 0.45
Legislators, senior officials, and managers ...... 86 0.25 0.26 20 80 0.25
Professional and technical workers ..................— — 0.64 — — —
Educational Attainment ...................................... 132 0.693 0.928
Literacy rate .......................................................... 133 0.52 0.86 18 35 0.52
Enrolment in primary education ........................ 130 0.85 0.98 69 81 0.85
Enrolment in secondary education ................... 127 0.67 0.90 26 39 0.67
Enrolment in tertiary education ......................... 129 0.41 0.86 3 9 0.41
Health and Survival ............................................... 55 0.976 0.956
Sex ratio at birth (female/male) ............................. 1 0.94 0.92 — — 0.97
Healthy life expectancy ........................................ 67 1.05 1.04 43 41 1.05
Political Empowerment ........................................ 81 0.105 0.185
Women in parliament .......................................... 102 0.11 0.22 10 90 0.11
Women in ministerial positions ........................... 49 0.27 0.18 21 79 0.27
Years with female head of state (last 50) .......... 49 0.01 0.16 0 50 0.01
MaliGender Gap Index 2011 132 0.575
Key Indicators
Total population (millions) 15.37
Population growth (%) 3.04
GDP (US$ billions) 4.15
GDP (PPP) per capita 955

Global Gender Gap Report 2011 Country Profiles 247
Economic Participation and Opportunity Educational Attainment Health and Survival Political Empowerment
Evolution 2006–2011
1 Survey data, responses on a 1-to-7 scale (1 = worst score, 7 = best score)2 Data on a 0-to-1 scale (1 = worst score, 0 = best score)3 Data on a 1-to-5 scale (1 = worst score, 5 = best score)4 Bracketed numbers show the range between the uncertainties, estimated
to contain the true maternal mortality ratio with a 95% probability
ECONOMIC EDUCATIONAL HEALTH AND POLITICAL OVERALL PARTICIPATION ATTAINMENT SURVIVAL EMPOWERMENT
Rank Score Rank Score Rank Score Rank Score Rank Score
0.0
0.2
0.4
0.6
0.8
1.0
2006 2007 2008 2009 2010 2011
Additional Data
Economic EmpowermentFemale adult unemployment rate (% of female labour force) .......11Male adult unemployment rate (% of male labour force) ................7Women in non-agricultural paid labour
(% of total labour force) ....................................................................35Inheritance practices in favour of male heirs2 ..............................1.00Firms with female participation in ownership (% of firms) ............21Women’s access to land ownership2 .............................................0.50Women’s access to bank loans2 ......................................................0.50Women’s access to property other than land2 .............................0.00Women’s access to finance programmes3 ...................................... —Ability of women to rise to positions of
enterprise leadership1 ....................................................................4.87
EducationFemale teachers, primary education (%) ..........................................27Female teachers, secondary education (%) .....................................10Female teachers, tertiary education (%) .......................................... —Female school life expectancy, primary to secondary (years)........7Male school life expectancy, primary to secondary (years) ...........9
Marriage and ChildbearingMean age of marriage for women (years) ........................................18Early marriage (% women, aged 15–19) ............................................50Fertility rate (births per woman) .......................................................5.50Adolescent fertility rate (births per 1,000 women, aged 15–19) ..190Antenatal care coverage, at least one visit (%) ...............................70Births attended by skilled health staff (%) ........................................49Maternal mortality ratio (per 100,000 live births)4 ......830 [520-1,400]Contraceptive prevalence, married women (%) ................................8Female HIV prevalence, aged 15–49 (%) ........................................1.20Male HIV prevalence, aged 15–49 (%) ............................................0.70Infant mortality rate (per 1,000 live births) ......................................101Overall population sex ratio (male/female) ....................................0.98
Social Institutions and Political RightsPaternal versus maternal authority2................................................1.00Female genital mutilation2 .................................................................0.94Acceptance or legality of polygamy2 ..............................................1.00Existence of legislation punishing acts
of violence against women2 ..........................................................1.00Year women received right to vote ................................................1956Quota type ..........................................................................No legislated;
voluntary political party quotasExistence of legislation prohibiting
gender-based discrimination ........................................................ Yes
Childcare EcosystemLength of maternity leave ........................................................14 weeksMaternity leave benefits (% of wages paid) ...................................100Provider of maternity coverage ............................... Social insuranceLength of paternity leave .............................................................. 3 daysPaternity leave benefits (% of wages paid) ..................................... —Daycare options .................................................................................... —
MaliGender Gap Index 2011 (out of 135 countries) 132 0.575 111 0.527 132 0.693 55 0.976 81 0.105
Gender Gap Index 2010 (out of 134 countries) 131 0.568 113 0.514 131 0.679 55 0.976 81 0.103
Gender Gap Index 2009 (out of 134 countries) 127 0.586 92 0.597 131 0.668 104 0.969 78 0.109
Gender Gap Index 2008 (out of 130 countries) 109 0.612 29 0.711 127 0.657 99 0.969 74 0.109
Gender Gap Index 2007 (out of 128 countries) 112 0.602 33 0.695 126 0.652 98 0.969 75 0.091
Gender Gap Index 2006 (out of 115 countries) 99 0.600 35 0.665 111 0.674 91 0.968 67 0.091

Female-to-male ratio
0.00 = INEQUALITY 1.00 = EQUALITY 1.50
0.00 = INEQUALITY 1.00 = EQUALITY 1.50
0.00 = INEQUALITY 1.00 = EQUALITY 1.50
0.00 = INEQUALITY 1.00 = EQUALITY 1.50
Female-to-male ratio
Female-to-male ratio
Female-to-male ratio
248 Country Profiles Global Gender Gap Report 2011
Sample Female-to- Rank Score average Female Male male ratio
country score sample average
0.00 = inequality 1.00 = equality
0.00
0.20
0.40
0.60
0.80
1.00Economy
Education
Politics
Health
Rank Score(out of 135 countries) (0.00 = inequality, 1.00 = equality)
Gender Gap Subindexes
Economic Participation and Opportunity ....... 110 0.528 0.588
Labour force participation .................................. 118 0.50 0.68 39 78 0.50
Wage equality for similar work (survey) ............ 59 0.67 0.65 — — 0.67
Estimated earned income (PPP US$) ................. 97 0.47 0.52 15,962 33,736 0.47
Legislators, senior officials, and managers ...... 89 0.21 0.26 17 83 0.21
Professional and technical workers .................. 86 0.70 0.64 41 59 0.70
Educational Attainment .......................................... 1 1.000 0.928
Literacy rate .............................................................. 1 1.00 0.86 94 91 1.03
Enrolment in primary education ............................ 1 1.00 0.98 92 90 1.02
Enrolment in secondary education ....................... 1 1.00 0.90 82 79 1.04
Enrolment in tertiary education ............................. 1 1.00 0.86 38 26 1.44
Health and Survival ............................................... 72 0.974 0.956
Sex ratio at birth (female/male) ............................. 1 0.94 0.92 — — 0.95
Healthy life expectancy ........................................ 79 1.04 1.04 74 71 1.04
Political Empowerment ........................................ 52 0.161 0.185
Women in parliament .......................................... 110 0.10 0.22 9 91 0.10
Women in ministerial positions ........................... 37 0.33 0.18 25 75 0.33
Years with female head of state (last 50) .......... 18 0.11 0.16 5 45 0.11
MaltaGender Gap Index 2011 83 0.666
Key Indicators
Total population (millions) 0.42
Population growth (%) 0.66
GDP (US$ billions) 4.44
GDP (PPP) per capita 21,992

Global Gender Gap Report 2011 Country Profiles 249
Economic Participation and Opportunity Educational Attainment Health and Survival Political Empowerment
Evolution 2006–2011
1 Survey data, responses on a 1-to-7 scale (1 = worst score, 7 = best score)2 Data on a 0-to-1 scale (1 = worst score, 0 = best score)3 Data on a 1-to-5 scale (1 = worst score, 5 = best score)4 Bracketed numbers show the range between the uncertainties, estimated
to contain the true maternal mortality ratio with a 95% probability
ECONOMIC EDUCATIONAL HEALTH AND POLITICAL OVERALL PARTICIPATION ATTAINMENT SURVIVAL EMPOWERMENT
Rank Score Rank Score Rank Score Rank Score Rank Score
0.0
0.2
0.4
0.6
0.8
1.0
2006 2007 2008 2009 2010 2011
Additional Data
Economic EmpowermentFemale adult unemployment rate (% of female labour force) .........7Male adult unemployment rate (% of male labour force) ................5Women in non-agricultural paid labour
(% of total labour force) ....................................................................35Inheritance practices in favour of male heirs2 ................................ —Firms with female participation in ownership (% of firms) ........... —Women’s access to land ownership2 ............................................... —Women’s access to bank loans2 ........................................................ —Women’s access to property other than land2 ............................... —Women’s access to finance programmes3 ...................................... —Ability of women to rise to positions of
enterprise leadership1 ....................................................................4.60
EducationFemale teachers, primary education (%) ..........................................88Female teachers, secondary education (%) .....................................61Female teachers, tertiary education (%) ...........................................30Female school life expectancy, primary to secondary (years)......13Male school life expectancy, primary to secondary (years) .........13
Marriage and ChildbearingMean age of marriage for women (years) ........................................22Early marriage (% women, aged 15–19) ........................................... —Fertility rate (births per woman) .......................................................1.30Adolescent fertility rate (births per 1,000 women, aged 15–19) ....17Antenatal care coverage, at least one visit (%) .............................100Births attended by skilled health staff (%) ......................................100Maternal mortality ratio (per 100,000 live births)4 .....................8 [7-9]Contraceptive prevalence, married women (%) ..............................86Female HIV prevalence, aged 15–49 (%) ........................................0.10Male HIV prevalence, aged 15–49 (%) ............................................0.10Infant mortality rate (per 1,000 live births) ..........................................6Overall population sex ratio (male/female) ....................................0.99
Social Institutions and Political RightsPaternal versus maternal authority2.................................................. —Female genital mutilation2 ................................................................... —Acceptance or legality of polygamy2 ................................................ —Existence of legislation punishing acts
of violence against women2 ............................................................ —Year women received right to vote ................................................1947Quota type ..........................................................................No legislated;
voluntary political party quotasExistence of legislation prohibiting
gender-based discrimination ........................................................ Yes
Childcare EcosystemLength of maternity leave ........................................................14 weeksMaternity leave benefits (% of wages paid) ................................100; an
employee on maternity leave is entitled to full wages during the first 13 weeks of leave, with the 14th week unpaid; social security pays maternity benefit at a flat rate for a maximum of 13 weeks for those not covered under the Employment and Industrial Relations Act
Provider of maternity coverage .................Employer/Social securityLength of paternity leave ............... 1–2 days (variable upon sectors)Paternity leave benefits (% of wages paid) ....................................100Daycare options ......................................................................Public and
private daycare with allowance
MaltaGender Gap Index 2011 (out of 135 countries) 83 0.666 110 0.528 1 1.000 72 0.974 52 0.161
Gender Gap Index 2010 (out of 134 countries) 83 0.670 104 0.543 1 1.000 72 0.974 51 0.161
Gender Gap Index 2009 (out of 134 countries) 88 0.664 105 0.561 47 0.995 77 0.974 69 0.124
Gender Gap Index 2008 (out of 130 countries) 83 0.663 98 0.560 47 0.995 74 0.974 64 0.124
Gender Gap Index 2007 (out of 128 countries) 76 0.661 99 0.549 31 0.998 72 0.974 54 0.126
Gender Gap Index 2006 (out of 115 countries) 71 0.652 91 0.510 26 0.998 65 0.974 48 0.126
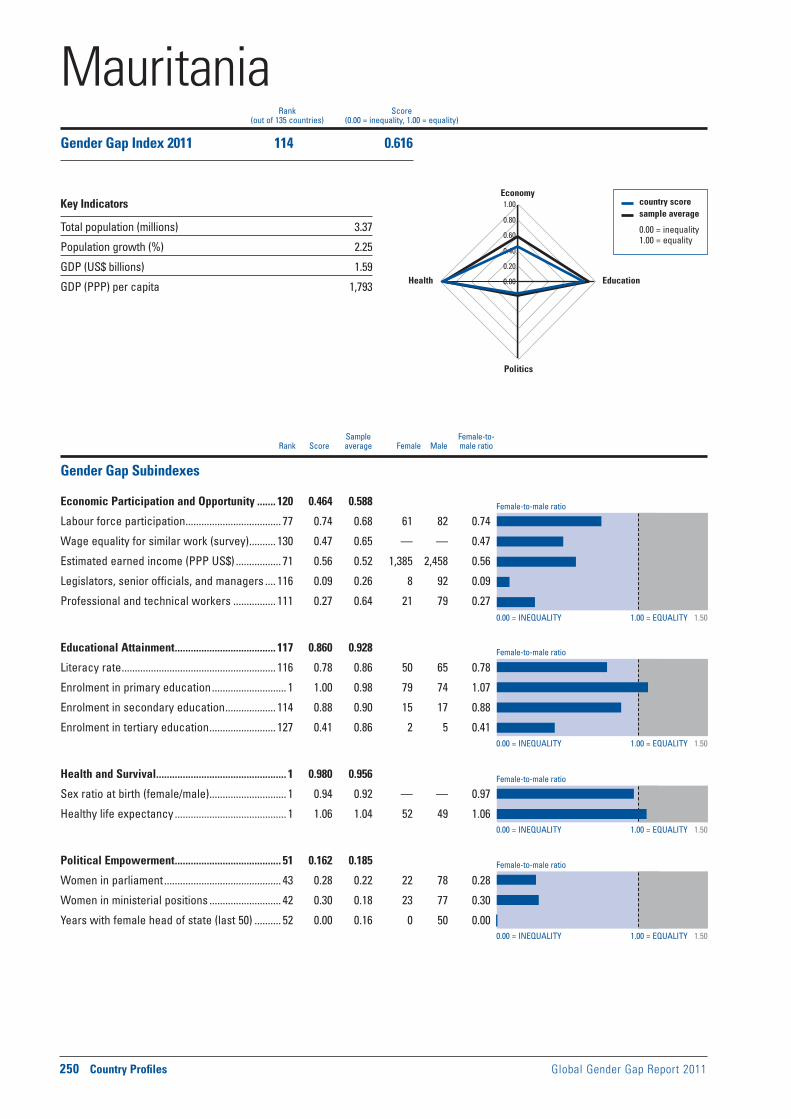
Female-to-male ratio
0.00 = INEQUALITY 1.00 = EQUALITY 1.50
0.00 = INEQUALITY 1.00 = EQUALITY 1.50
0.00 = INEQUALITY 1.00 = EQUALITY 1.50
0.00 = INEQUALITY 1.00 = EQUALITY 1.50
Female-to-male ratio
Female-to-male ratio
Female-to-male ratio
250 Country Profiles Global Gender Gap Report 2011
Sample Female-to- Rank Score average Female Male male ratio
country score sample average
0.00 = inequality 1.00 = equality
0.00
0.20
0.40
0.60
0.80
1.00Economy
Education
Politics
Health
Rank Score(out of 135 countries) (0.00 = inequality, 1.00 = equality)
Gender Gap Subindexes
Economic Participation and Opportunity ....... 120 0.464 0.588
Labour force participation .................................... 77 0.74 0.68 61 82 0.74
Wage equality for similar work (survey) .......... 130 0.47 0.65 — — 0.47
Estimated earned income (PPP US$) ................. 71 0.56 0.52 1,385 2,458 0.56
Legislators, senior officials, and managers .... 116 0.09 0.26 8 92 0.09
Professional and technical workers ................ 111 0.27 0.64 21 79 0.27
Educational Attainment ...................................... 117 0.860 0.928
Literacy rate .......................................................... 116 0.78 0.86 50 65 0.78
Enrolment in primary education ............................ 1 1.00 0.98 79 74 1.07
Enrolment in secondary education ................... 114 0.88 0.90 15 17 0.88
Enrolment in tertiary education ......................... 127 0.41 0.86 2 5 0.41
Health and Survival ................................................. 1 0.980 0.956
Sex ratio at birth (female/male) ............................. 1 0.94 0.92 — — 0.97
Healthy life expectancy .......................................... 1 1.06 1.04 52 49 1.06
Political Empowerment ........................................ 51 0.162 0.185
Women in parliament ............................................ 43 0.28 0.22 22 78 0.28
Women in ministerial positions ........................... 42 0.30 0.18 23 77 0.30
Years with female head of state (last 50) .......... 52 0.00 0.16 0 50 0.00
MauritaniaGender Gap Index 2011 114 0.616
Key Indicators
Total population (millions) 3.37
Population growth (%) 2.25
GDP (US$ billions) 1.59
GDP (PPP) per capita 1,793
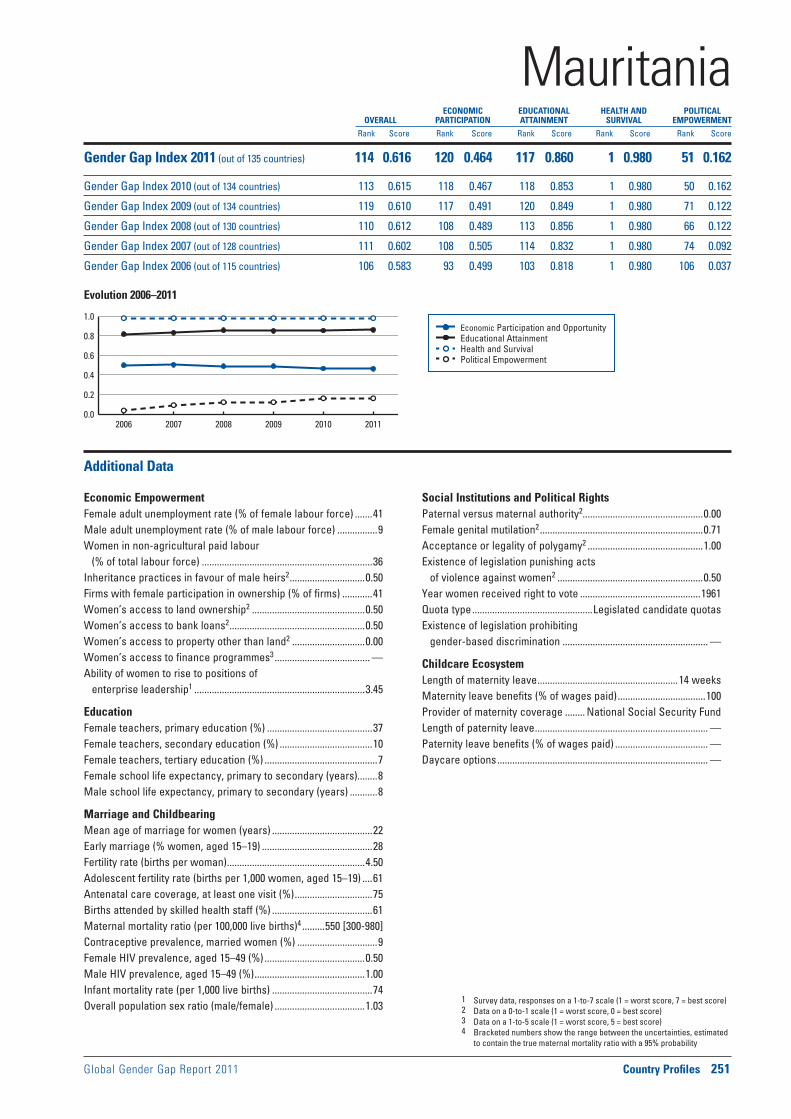
Global Gender Gap Report 2011 Country Profiles 251
Economic Participation and Opportunity Educational Attainment Health and Survival Political Empowerment
Evolution 2006–2011
1 Survey data, responses on a 1-to-7 scale (1 = worst score, 7 = best score)2 Data on a 0-to-1 scale (1 = worst score, 0 = best score)3 Data on a 1-to-5 scale (1 = worst score, 5 = best score)4 Bracketed numbers show the range between the uncertainties, estimated
to contain the true maternal mortality ratio with a 95% probability
ECONOMIC EDUCATIONAL HEALTH AND POLITICAL OVERALL PARTICIPATION ATTAINMENT SURVIVAL EMPOWERMENT
Rank Score Rank Score Rank Score Rank Score Rank Score
0.0
0.2
0.4
0.6
0.8
1.0
2006 2007 2008 2009 2010 2011
Additional Data
Economic EmpowermentFemale adult unemployment rate (% of female labour force) .......41Male adult unemployment rate (% of male labour force) ................9Women in non-agricultural paid labour
(% of total labour force) ....................................................................36Inheritance practices in favour of male heirs2 ..............................0.50Firms with female participation in ownership (% of firms) ............41Women’s access to land ownership2 .............................................0.50Women’s access to bank loans2 ......................................................0.50Women’s access to property other than land2 .............................0.00Women’s access to finance programmes3 ...................................... —Ability of women to rise to positions of
enterprise leadership1 ....................................................................3.45
EducationFemale teachers, primary education (%) ..........................................37Female teachers, secondary education (%) .....................................10Female teachers, tertiary education (%) .............................................7Female school life expectancy, primary to secondary (years)........8Male school life expectancy, primary to secondary (years) ...........8
Marriage and ChildbearingMean age of marriage for women (years) ........................................22Early marriage (% women, aged 15–19) ............................................28Fertility rate (births per woman) .......................................................4.50Adolescent fertility rate (births per 1,000 women, aged 15–19) ....61Antenatal care coverage, at least one visit (%) ...............................75Births attended by skilled health staff (%) ........................................61Maternal mortality ratio (per 100,000 live births)4 .........550 [300-980]Contraceptive prevalence, married women (%) ................................9Female HIV prevalence, aged 15–49 (%) ........................................0.50Male HIV prevalence, aged 15–49 (%) ............................................1.00Infant mortality rate (per 1,000 live births) ........................................74Overall population sex ratio (male/female) ....................................1.03
Social Institutions and Political RightsPaternal versus maternal authority2................................................0.00Female genital mutilation2 .................................................................0.71Acceptance or legality of polygamy2 ..............................................1.00Existence of legislation punishing acts
of violence against women2 ..........................................................0.50Year women received right to vote ................................................1961Quota type ................................................Legislated candidate quotasExistence of legislation prohibiting
gender-based discrimination .......................................................... —
Childcare EcosystemLength of maternity leave ........................................................14 weeksMaternity leave benefits (% of wages paid) ...................................100Provider of maternity coverage ........ National Social Security FundLength of paternity leave ..................................................................... —Paternity leave benefits (% of wages paid) ..................................... —Daycare options .................................................................................... —
MauritaniaGender Gap Index 2011 (out of 135 countries) 114 0.616 120 0.464 117 0.860 1 0.980 51 0.162
Gender Gap Index 2010 (out of 134 countries) 113 0.615 118 0.467 118 0.853 1 0.980 50 0.162
Gender Gap Index 2009 (out of 134 countries) 119 0.610 117 0.491 120 0.849 1 0.980 71 0.122
Gender Gap Index 2008 (out of 130 countries) 110 0.612 108 0.489 113 0.856 1 0.980 66 0.122
Gender Gap Index 2007 (out of 128 countries) 111 0.602 108 0.505 114 0.832 1 0.980 74 0.092
Gender Gap Index 2006 (out of 115 countries) 106 0.583 93 0.499 103 0.818 1 0.980 106 0.037
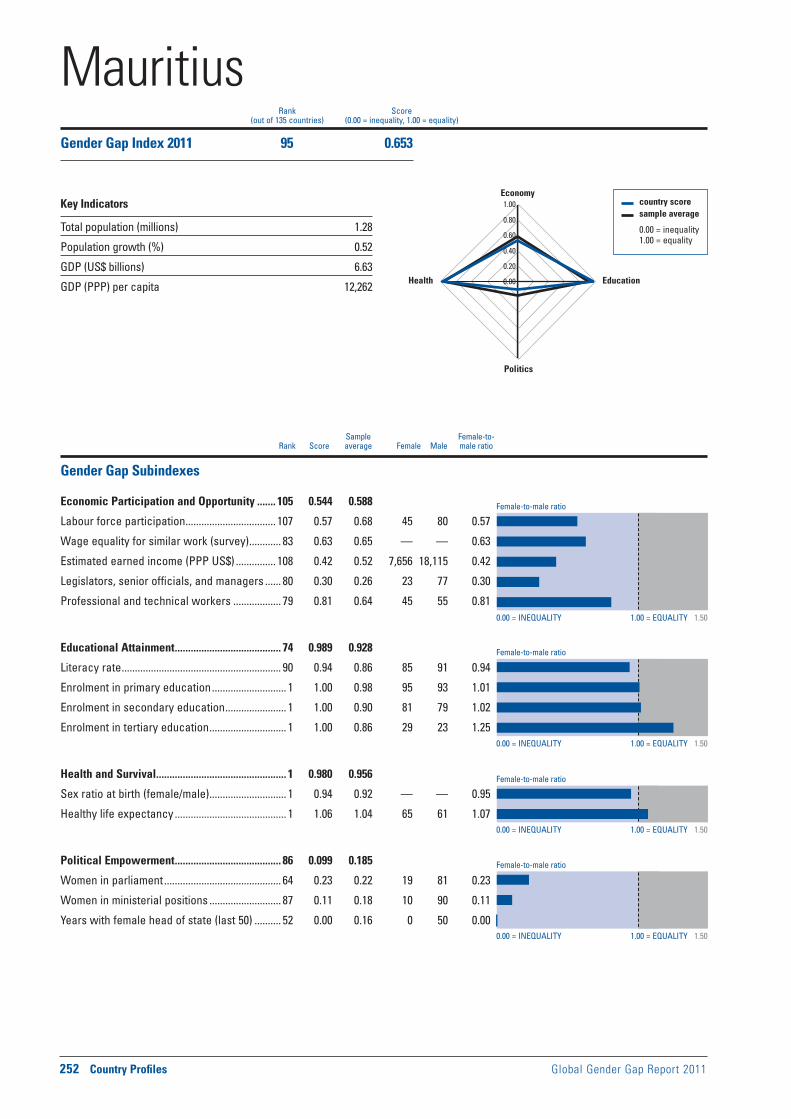
Female-to-male ratio
0.00 = INEQUALITY 1.00 = EQUALITY 1.50
0.00 = INEQUALITY 1.00 = EQUALITY 1.50
0.00 = INEQUALITY 1.00 = EQUALITY 1.50
0.00 = INEQUALITY 1.00 = EQUALITY 1.50
Female-to-male ratio
Female-to-male ratio
Female-to-male ratio
252 Country Profiles Global Gender Gap Report 2011
Sample Female-to- Rank Score average Female Male male ratio
country score sample average
0.00 = inequality 1.00 = equality
0.00
0.20
0.40
0.60
0.80
1.00Economy
Education
Politics
Health
Rank Score(out of 135 countries) (0.00 = inequality, 1.00 = equality)
Gender Gap Subindexes
Economic Participation and Opportunity ....... 105 0.544 0.588
Labour force participation .................................. 107 0.57 0.68 45 80 0.57
Wage equality for similar work (survey) ............ 83 0.63 0.65 — — 0.63
Estimated earned income (PPP US$) ............... 108 0.42 0.52 7,656 18,115 0.42
Legislators, senior officials, and managers ...... 80 0.30 0.26 23 77 0.30
Professional and technical workers .................. 79 0.81 0.64 45 55 0.81
Educational Attainment ........................................ 74 0.989 0.928
Literacy rate ............................................................ 90 0.94 0.86 85 91 0.94
Enrolment in primary education ............................ 1 1.00 0.98 95 93 1.01
Enrolment in secondary education ....................... 1 1.00 0.90 81 79 1.02
Enrolment in tertiary education ............................. 1 1.00 0.86 29 23 1.25
Health and Survival ................................................. 1 0.980 0.956
Sex ratio at birth (female/male) ............................. 1 0.94 0.92 — — 0.95
Healthy life expectancy .......................................... 1 1.06 1.04 65 61 1.07
Political Empowerment ........................................ 86 0.099 0.185
Women in parliament ............................................ 64 0.23 0.22 19 81 0.23
Women in ministerial positions ........................... 87 0.11 0.18 10 90 0.11
Years with female head of state (last 50) .......... 52 0.00 0.16 0 50 0.00
MauritiusGender Gap Index 2011 95 0.653
Key Indicators
Total population (millions) 1.28
Population growth (%) 0.52
GDP (US$ billions) 6.63
GDP (PPP) per capita 12,262

Global Gender Gap Report 2011 Country Profiles 253
Economic Participation and Opportunity Educational Attainment Health and Survival Political Empowerment
Evolution 2006–2011
1 Survey data, responses on a 1-to-7 scale (1 = worst score, 7 = best score)2 Data on a 0-to-1 scale (1 = worst score, 0 = best score)3 Data on a 1-to-5 scale (1 = worst score, 5 = best score)4 Bracketed numbers show the range between the uncertainties, estimated
to contain the true maternal mortality ratio with a 95% probability
ECONOMIC EDUCATIONAL HEALTH AND POLITICAL OVERALL PARTICIPATION ATTAINMENT SURVIVAL EMPOWERMENT
Rank Score Rank Score Rank Score Rank Score Rank Score
0.0
0.2
0.4
0.6
0.8
1.0
2006 2007 2008 2009 2010 2011
Additional Data
Economic EmpowermentFemale adult unemployment rate (% of female labour force) .......12Male adult unemployment rate (% of male labour force) ................4Women in non-agricultural paid labour
(% of total labour force) ....................................................................37Inheritance practices in favour of male heirs2 ..............................0.00Firms with female participation in ownership (% of firms) ............20Women’s access to land ownership2 .............................................0.00Women’s access to bank loans2 ......................................................0.00Women’s access to property other than land2 .............................0.00Women’s access to finance programmes3 .........................................3Ability of women to rise to positions of
enterprise leadership1 ....................................................................4.27
EducationFemale teachers, primary education (%) ..........................................68Female teachers, secondary education (%) .....................................58Female teachers, tertiary education (%) .......................................... —Female school life expectancy, primary to secondary (years)......12Male school life expectancy, primary to secondary (years) .........12
Marriage and ChildbearingMean age of marriage for women (years) ........................................23Early marriage (% women, aged 15–19) ............................................11Fertility rate (births per woman) .......................................................1.80Adolescent fertility rate (births per 1,000 women, aged 15–19) ....35Antenatal care coverage, at least one visit (%) .............................. —Births attended by skilled health staff (%) ......................................100Maternal mortality ratio (per 100,000 live births)4 ...............36 [30-41]Contraceptive prevalence, married women (%) ..............................76Female HIV prevalence, aged 15–49 (%) ........................................0.60Male HIV prevalence, aged 15–49 (%) ............................................1.40Infant mortality rate (per 1,000 live births) ........................................13Overall population sex ratio (male/female) ....................................0.98
Social Institutions and Political RightsPaternal versus maternal authority2................................................0.00Female genital mutilation2 .................................................................0.00Acceptance or legality of polygamy2 ..............................................0.00Existence of legislation punishing acts
of violence against women2 ..........................................................0.42Year women received right to vote ................................................1956Quota type .............................................................................................. —Existence of legislation prohibiting
gender-based discrimination ........................................................ Yes
Childcare EcosystemLength of maternity leave ........................................................12 weeksMaternity leave benefits (% of wages paid) ...................................100Provider of maternity coverage .............................................EmployerLength of paternity leave ............................................... Private sector:
5 continuous working days. Public sector: normal casual leave + up to 8 days leave from accumulated vacation leave
Paternity leave benefits (% of wages paid) ....................................100Daycare options ..............................................................Public daycare
without allowance; day care centres are free of charge or apply nominal fees for needy households
MauritiusGender Gap Index 2011 (out of 135 countries) 95 0.653 105 0.544 74 0.989 1 0.980 86 0.099
Gender Gap Index 2010 (out of 134 countries) 95 0.652 103 0.549 76 0.988 1 0.980 91 0.091
Gender Gap Index 2009 (out of 134 countries) 96 0.651 109 0.546 80 0.988 1 0.980 92 0.091
Gender Gap Index 2008 (out of 130 countries) 95 0.647 103 0.527 77 0.988 1 0.980 90 0.091
Gender Gap Index 2007 (out of 128 countries) 85 0.649 100 0.547 75 0.983 1 0.980 82 0.085
Gender Gap Index 2006 (out of 115 countries) 88 0.633 95 0.483 65 0.983 1 0.980 73 0.085
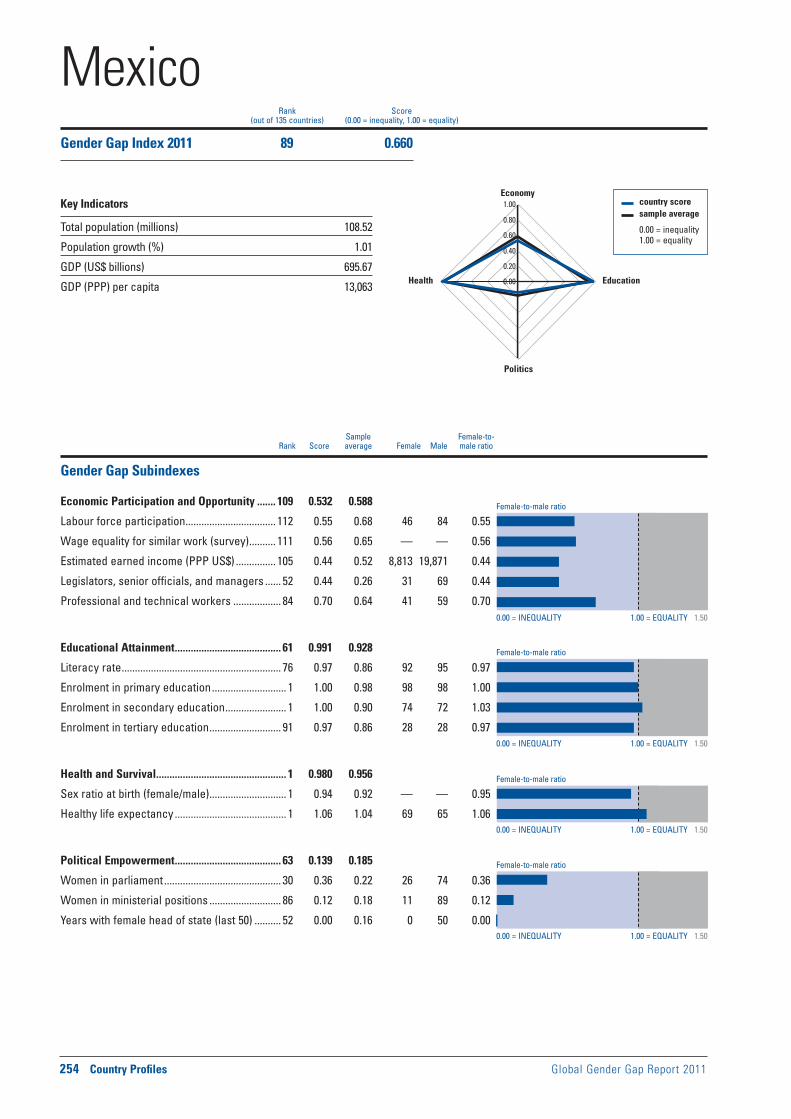
Female-to-male ratio
0.00 = INEQUALITY 1.00 = EQUALITY 1.50
0.00 = INEQUALITY 1.00 = EQUALITY 1.50
0.00 = INEQUALITY 1.00 = EQUALITY 1.50
0.00 = INEQUALITY 1.00 = EQUALITY 1.50
Female-to-male ratio
Female-to-male ratio
Female-to-male ratio
254 Country Profiles Global Gender Gap Report 2011
Sample Female-to- Rank Score average Female Male male ratio
country score sample average
0.00 = inequality 1.00 = equality
0.00
0.20
0.40
0.60
0.80
1.00Economy
Education
Politics
Health
Rank Score(out of 135 countries) (0.00 = inequality, 1.00 = equality)
Gender Gap Subindexes
Economic Participation and Opportunity ....... 109 0.532 0.588
Labour force participation .................................. 112 0.55 0.68 46 84 0.55
Wage equality for similar work (survey) .......... 111 0.56 0.65 — — 0.56
Estimated earned income (PPP US$) ............... 105 0.44 0.52 8,813 19,871 0.44
Legislators, senior officials, and managers ...... 52 0.44 0.26 31 69 0.44
Professional and technical workers .................. 84 0.70 0.64 41 59 0.70
Educational Attainment ........................................ 61 0.991 0.928
Literacy rate ............................................................ 76 0.97 0.86 92 95 0.97
Enrolment in primary education ............................ 1 1.00 0.98 98 98 1.00
Enrolment in secondary education ....................... 1 1.00 0.90 74 72 1.03
Enrolment in tertiary education ........................... 91 0.97 0.86 28 28 0.97
Health and Survival ................................................. 1 0.980 0.956
Sex ratio at birth (female/male) ............................. 1 0.94 0.92 — — 0.95
Healthy life expectancy .......................................... 1 1.06 1.04 69 65 1.06
Political Empowerment ........................................ 63 0.139 0.185
Women in parliament ............................................ 30 0.36 0.22 26 74 0.36
Women in ministerial positions ........................... 86 0.12 0.18 11 89 0.12
Years with female head of state (last 50) .......... 52 0.00 0.16 0 50 0.00
MexicoGender Gap Index 2011 89 0.660
Key Indicators
Total population (millions) 108.52
Population growth (%) 1.01
GDP (US$ billions) 695.67
GDP (PPP) per capita 13,063
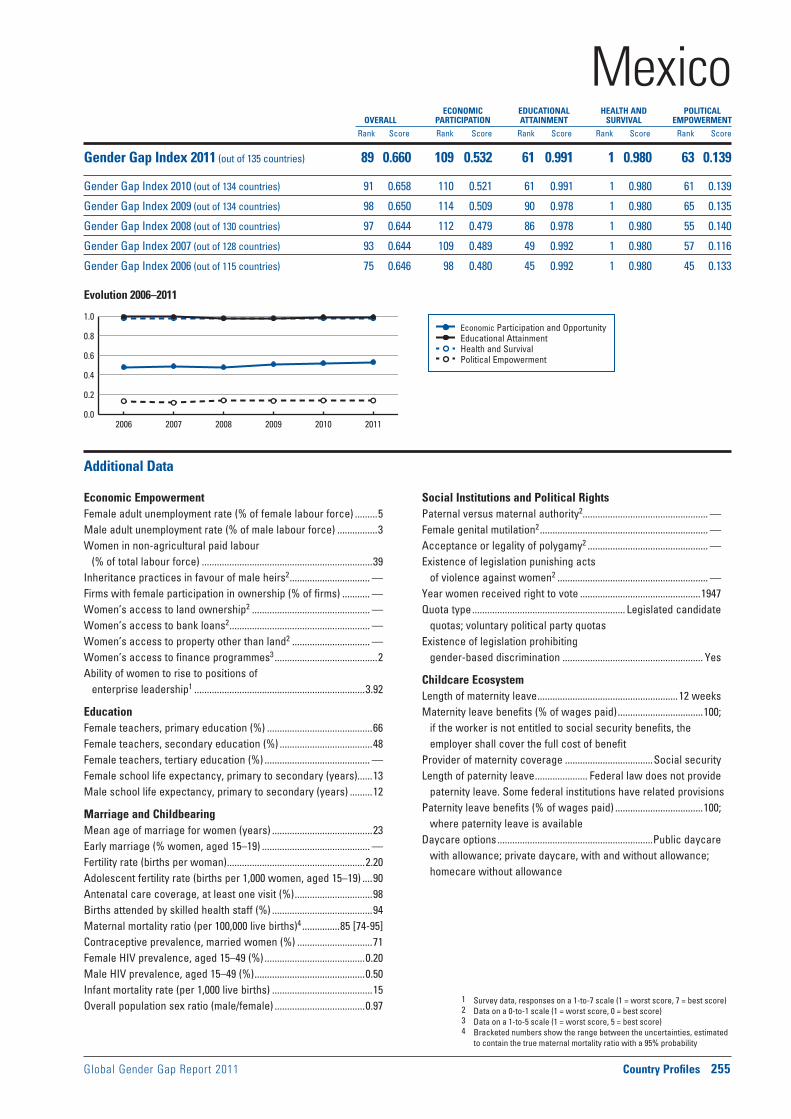
Global Gender Gap Report 2011 Country Profiles 255
Economic Participation and Opportunity Educational Attainment Health and Survival Political Empowerment
Evolution 2006–2011
1 Survey data, responses on a 1-to-7 scale (1 = worst score, 7 = best score)2 Data on a 0-to-1 scale (1 = worst score, 0 = best score)3 Data on a 1-to-5 scale (1 = worst score, 5 = best score)4 Bracketed numbers show the range between the uncertainties, estimated
to contain the true maternal mortality ratio with a 95% probability
ECONOMIC EDUCATIONAL HEALTH AND POLITICAL OVERALL PARTICIPATION ATTAINMENT SURVIVAL EMPOWERMENT
Rank Score Rank Score Rank Score Rank Score Rank Score
0.0
0.2
0.4
0.6
0.8
1.0
2006 2007 2008 2009 2010 2011
Additional Data
Economic EmpowermentFemale adult unemployment rate (% of female labour force) .........5Male adult unemployment rate (% of male labour force) ................3Women in non-agricultural paid labour
(% of total labour force) ....................................................................39Inheritance practices in favour of male heirs2 ................................ —Firms with female participation in ownership (% of firms) ........... —Women’s access to land ownership2 ............................................... —Women’s access to bank loans2 ........................................................ —Women’s access to property other than land2 ............................... —Women’s access to finance programmes3 .........................................2Ability of women to rise to positions of
enterprise leadership1 ....................................................................3.92
EducationFemale teachers, primary education (%) ..........................................66Female teachers, secondary education (%) .....................................48Female teachers, tertiary education (%) .......................................... —Female school life expectancy, primary to secondary (years)......13Male school life expectancy, primary to secondary (years) .........12
Marriage and ChildbearingMean age of marriage for women (years) ........................................23Early marriage (% women, aged 15–19) ........................................... —Fertility rate (births per woman) .......................................................2.20Adolescent fertility rate (births per 1,000 women, aged 15–19) ....90Antenatal care coverage, at least one visit (%) ...............................98Births attended by skilled health staff (%) ........................................94Maternal mortality ratio (per 100,000 live births)4 ...............85 [74-95]Contraceptive prevalence, married women (%) ..............................71Female HIV prevalence, aged 15–49 (%) ........................................0.20Male HIV prevalence, aged 15–49 (%) ............................................0.50Infant mortality rate (per 1,000 live births) ........................................15Overall population sex ratio (male/female) ....................................0.97
Social Institutions and Political RightsPaternal versus maternal authority2.................................................. —Female genital mutilation2 ................................................................... —Acceptance or legality of polygamy2 ................................................ —Existence of legislation punishing acts
of violence against women2 ............................................................ —Year women received right to vote ................................................1947Quota type ............................................................. Legislated candidate
quotas; voluntary political party quotasExistence of legislation prohibiting
gender-based discrimination ........................................................ Yes
Childcare EcosystemLength of maternity leave ........................................................12 weeksMaternity leave benefits (% of wages paid) ..................................100;
if the worker is not entitled to social security benefits, the employer shall cover the full cost of benefit
Provider of maternity coverage ...................................Social securityLength of paternity leave ..................... Federal law does not provide
paternity leave. Some federal institutions have related provisionsPaternity leave benefits (% of wages paid) ...................................100;
where paternity leave is availableDaycare options ..............................................................Public daycare
with allowance; private daycare, with and without allowance; homecare without allowance
MexicoGender Gap Index 2011 (out of 135 countries) 89 0.660 109 0.532 61 0.991 1 0.980 63 0.139
Gender Gap Index 2010 (out of 134 countries) 91 0.658 110 0.521 61 0.991 1 0.980 61 0.139
Gender Gap Index 2009 (out of 134 countries) 98 0.650 114 0.509 90 0.978 1 0.980 65 0.135
Gender Gap Index 2008 (out of 130 countries) 97 0.644 112 0.479 86 0.978 1 0.980 55 0.140
Gender Gap Index 2007 (out of 128 countries) 93 0.644 109 0.489 49 0.992 1 0.980 57 0.116
Gender Gap Index 2006 (out of 115 countries) 75 0.646 98 0.480 45 0.992 1 0.980 45 0.133
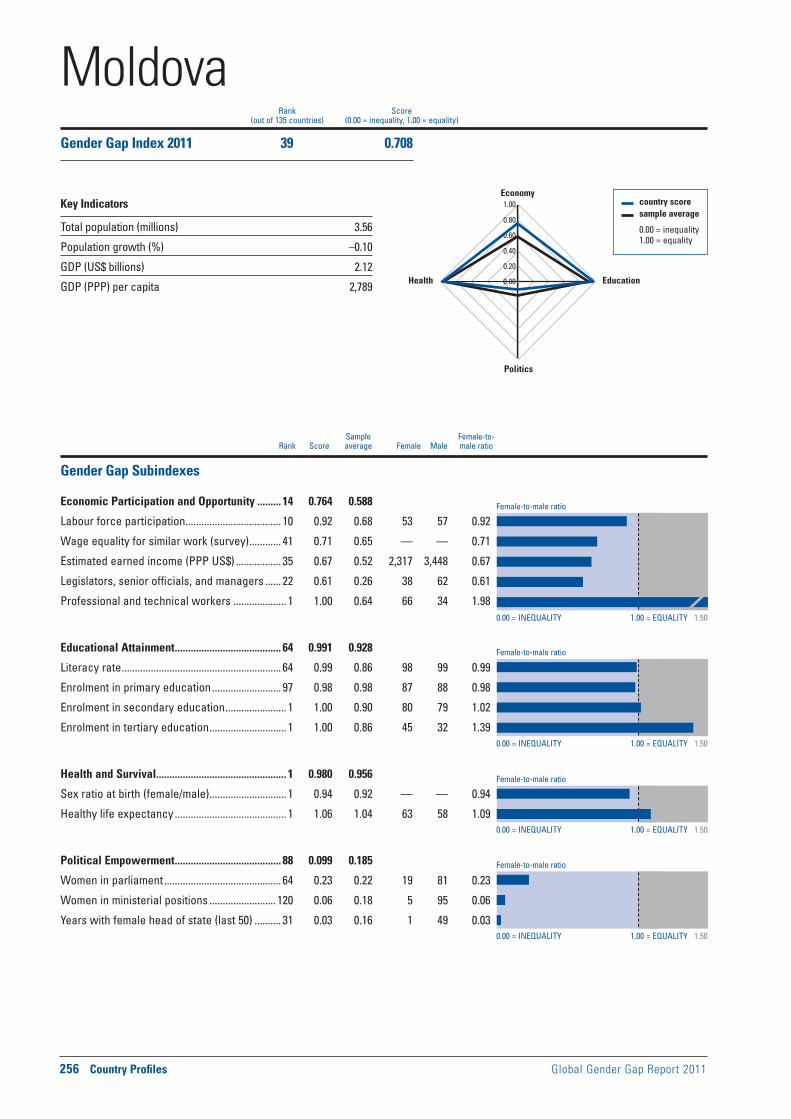
Female-to-male ratio
0.00 = INEQUALITY 1.00 = EQUALITY 1.50
0.00 = INEQUALITY 1.00 = EQUALITY 1.50
0.00 = INEQUALITY 1.00 = EQUALITY 1.50
0.00 = INEQUALITY 1.00 = EQUALITY 1.50
Female-to-male ratio
Female-to-male ratio
Female-to-male ratio
256 Country Profiles Global Gender Gap Report 2011
Sample Female-to- Rank Score average Female Male male ratio
country score sample average
0.00 = inequality 1.00 = equality
0.00
0.20
0.40
0.60
0.80
1.00Economy
Education
Politics
Health
Rank Score(out of 135 countries) (0.00 = inequality, 1.00 = equality)
Gender Gap Subindexes
Economic Participation and Opportunity ......... 14 0.764 0.588
Labour force participation .................................... 10 0.92 0.68 53 57 0.92
Wage equality for similar work (survey) ............ 41 0.71 0.65 — — 0.71
Estimated earned income (PPP US$) ................. 35 0.67 0.52 2,317 3,448 0.67
Legislators, senior officials, and managers ...... 22 0.61 0.26 38 62 0.61
Professional and technical workers .................... 1 1.00 0.64 66 34 1.98
Educational Attainment ........................................ 64 0.991 0.928
Literacy rate ............................................................ 64 0.99 0.86 98 99 0.99
Enrolment in primary education .......................... 97 0.98 0.98 87 88 0.98
Enrolment in secondary education ....................... 1 1.00 0.90 80 79 1.02
Enrolment in tertiary education ............................. 1 1.00 0.86 45 32 1.39
Health and Survival ................................................. 1 0.980 0.956
Sex ratio at birth (female/male) ............................. 1 0.94 0.92 — — 0.94
Healthy life expectancy .......................................... 1 1.06 1.04 63 58 1.09
Political Empowerment ........................................ 88 0.099 0.185
Women in parliament ............................................ 64 0.23 0.22 19 81 0.23
Women in ministerial positions ......................... 120 0.06 0.18 5 95 0.06
Years with female head of state (last 50) .......... 31 0.03 0.16 1 49 0.03
MoldovaGender Gap Index 2011 39 0.708
Key Indicators
Total population (millions) 3.56
Population growth (%) –0.10
GDP (US$ billions) 2.12
GDP (PPP) per capita 2,789

Global Gender Gap Report 2011 Country Profiles 257
Economic Participation and Opportunity Educational Attainment Health and Survival Political Empowerment
Evolution 2006–2011
1 Survey data, responses on a 1-to-7 scale (1 = worst score, 7 = best score)2 Data on a 0-to-1 scale (1 = worst score, 0 = best score)3 Data on a 1-to-5 scale (1 = worst score, 5 = best score)4 Bracketed numbers show the range between the uncertainties, estimated
to contain the true maternal mortality ratio with a 95% probability
ECONOMIC EDUCATIONAL HEALTH AND POLITICAL OVERALL PARTICIPATION ATTAINMENT SURVIVAL EMPOWERMENT
Rank Score Rank Score Rank Score Rank Score Rank Score
0.0
0.2
0.4
0.6
0.8
1.0
2006 2007 2008 2009 2010 2011
Additional Data
Economic EmpowermentFemale adult unemployment rate (% of female labour force) .........5Male adult unemployment rate (% of male labour force) ................5Women in non-agricultural paid labour
(% of total labour force) ....................................................................54Inheritance practices in favour of male heirs2 ..............................0.00Firms with female participation in ownership (% of firms) ............44Women’s access to land ownership2 .............................................0.00Women’s access to bank loans2 ......................................................0.00Women’s access to property other than land2 .............................0.00Women’s access to finance programmes3 .........................................3Ability of women to rise to positions of
enterprise leadership1 ....................................................................4.88
EducationFemale teachers, primary education (%) ..........................................98Female teachers, secondary education (%) .....................................77Female teachers, tertiary education (%) ...........................................56Female school life expectancy, primary to secondary (years)......10Male school life expectancy, primary to secondary (years) .........10
Marriage and ChildbearingMean age of marriage for women (years) ........................................22Early marriage (% women, aged 15–19) .........................................11.6Fertility rate (births per woman) .......................................................1.50Adolescent fertility rate (births per 1,000 women, aged 15–19) ....26Antenatal care coverage, at least one visit (%) ...............................98Births attended by skilled health staff (%) ......................................100Maternal mortality ratio (per 100,000 live births)4 ...............32 [28-35]Contraceptive prevalence, married women (%) ..............................68Female HIV prevalence, aged 15–49 (%) ........................................0.40Male HIV prevalence, aged 15–49 (%) ............................................0.50Infant mortality rate (per 1,000 live births) ........................................15Overall population sex ratio (male/female) ....................................0.90
Social Institutions and Political RightsPaternal versus maternal authority2................................................0.00Female genital mutilation2 .................................................................0.00Acceptance or legality of polygamy2 ..............................................0.00Existence of legislation punishing acts
of violence against women2 ..........................................................0.42Year women received right to vote ......................................1924, 1993Quota type .............................................................................................. —Existence of legislation prohibiting
gender-based discrimination ........................................................ Yes
Childcare EcosystemLength of maternity leave ........................................ 126 calendar daysMaternity leave benefits (% of wages paid) ...................................100Provider of maternity coverage ............................... Social insuranceLength of paternity leave ..................................................................... —Paternity leave benefits (% of wages paid) ..................................... —Daycare options .............................................................Public daycare,
with and without allowance; homecare with and without allowance
MoldovaGender Gap Index 2011 (out of 135 countries) 39 0.708 14 0.764 64 0.991 1 0.980 88 0.099
Gender Gap Index 2010 (out of 134 countries) 34 0.716 10 0.771 66 0.990 1 0.980 69 0.124
Gender Gap Index 2009 (out of 134 countries) 36 0.710 26 0.732 63 0.993 41 0.979 64 0.137
Gender Gap Index 2008 (out of 130 countries) 20 0.724 2 0.802 35 0.998 38 0.979 68 0.118
Gender Gap Index 2007 (out of 128 countries) 21 0.717 5 0.778 41 0.994 37 0.979 56 0.117
Gender Gap Index 2006 (out of 115 countries) 17 0.713 2 0.760 37 0.994 1 0.980 50 0.117

Female-to-male ratio
0.00 = INEQUALITY 1.00 = EQUALITY 1.50
0.00 = INEQUALITY 1.00 = EQUALITY 1.50
0.00 = INEQUALITY 1.00 = EQUALITY 1.50
0.00 = INEQUALITY 1.00 = EQUALITY 1.50
Female-to-male ratio
Female-to-male ratio
Female-to-male ratio
258 Country Profiles Global Gender Gap Report 2011
Sample Female-to- Rank Score average Female Male male ratio
country score sample average
0.00 = inequality 1.00 = equality
0.00
0.20
0.40
0.60
0.80
1.00Economy
Education
Politics
Health
Rank Score(out of 135 countries) (0.00 = inequality, 1.00 = equality)
Gender Gap Subindexes
Economic Participation and Opportunity ........... 3 0.850 0.588
Labour force participation .................................... 27 0.88 0.68 71 80 0.88
Wage equality for similar work (survey) ............ 10 0.78 0.65 — — 0.78
Estimated earned income (PPP US$) ................. 12 0.80 0.52 3,141 3,912 0.80
Legislators, senior officials, and managers ........ 6 0.90 0.26 47 53 0.90
Professional and technical workers .................... 1 1.00 0.64 55 45 1.20
Educational Attainment ........................................ 47 0.995 0.928
Literacy rate .............................................................. 1 1.00 0.86 98 97 1.01
Enrolment in primary education .......................... 91 0.99 0.98 90 91 0.99
Enrolment in secondary education ....................... 1 1.00 0.90 85 79 1.07
Enrolment in tertiary education ............................. 1 1.00 0.86 64 41 1.55
Health and Survival ................................................. 1 0.980 0.956
Sex ratio at birth (female/male) ............................. 1 0.94 0.92 — — 0.95
Healthy life expectancy .......................................... 1 1.06 1.04 62 55 1.13
Political Empowerment ...................................... 125 0.032 0.185
Women in parliament .......................................... 123 0.04 0.22 4 96 0.04
Women in ministerial positions ......................... 103 0.08 0.18 7 93 0.08
Years with female head of state (last 50) .......... 51 0.00 0.16 0 50 0.00
MongoliaGender Gap Index 2011 36 0.714
Key Indicators
Total population (millions) 2.70
Population growth (%) 1.12
GDP (US$ billions) 2.13
GDP (PPP) per capita 3,686

Global Gender Gap Report 2011 Country Profiles 259
Economic Participation and Opportunity Educational Attainment Health and Survival Political Empowerment
Evolution 2006–2011
1 Survey data, responses on a 1-to-7 scale (1 = worst score, 7 = best score)2 Data on a 0-to-1 scale (1 = worst score, 0 = best score)3 Data on a 1-to-5 scale (1 = worst score, 5 = best score)4 Bracketed numbers show the range between the uncertainties, estimated
to contain the true maternal mortality ratio with a 95% probability
ECONOMIC EDUCATIONAL HEALTH AND POLITICAL OVERALL PARTICIPATION ATTAINMENT SURVIVAL EMPOWERMENT
Rank Score Rank Score Rank Score Rank Score Rank Score
0.0
0.2
0.4
0.6
0.8
1.0
2006 2007 2008 2009 2010 2011
Additional Data
Economic EmpowermentFemale adult unemployment rate (% of female labour force) .........4Male adult unemployment rate (% of male labour force) ................3Women in non-agricultural paid labour
(% of total labour force) ....................................................................51Inheritance practices in favour of male heirs2 ..............................0.00Firms with female participation in ownership (% of firms) ........... —Women’s access to land ownership2 .............................................0.50Women’s access to bank loans2 ......................................................0.00Women’s access to property other than land2 .............................0.00Women’s access to finance programmes3 ...................................... —Ability of women to rise to positions of
enterprise leadership1 ....................................................................5.14
EducationFemale teachers, primary education (%) ..........................................95Female teachers, secondary education (%) .....................................73Female teachers, tertiary education (%) ...........................................57Female school life expectancy, primary to secondary (years)......11Male school life expectancy, primary to secondary (years) .........11
Marriage and ChildbearingMean age of marriage for women (years) ........................................24Early marriage (% women, aged 15–19) ..............................................6Fertility rate (births per woman) .......................................................2.00Adolescent fertility rate (births per 1,000 women, aged 15–19) ....19Antenatal care coverage, at least one visit (%) ...............................99Births attended by skilled health staff (%) ......................................100Maternal mortality ratio (per 100,000 live births)4 .............65 [27-150]Contraceptive prevalence, married women (%) ..............................66Female HIV prevalence, aged 15–49 (%) ......................................<0.10Male HIV prevalence, aged 15–49 (%) ..........................................<0.10Infant mortality rate (per 1,000 live births) ........................................24Overall population sex ratio (male/female) ....................................0.98
Social Institutions and Political RightsPaternal versus maternal authority2................................................0.00Female genital mutilation2 .................................................................0.00Acceptance or legality of polygamy2 ..............................................0.50Existence of legislation punishing acts
of violence against women2 ..........................................................0.58Year women received right to vote ................................................1924Quota type .............................................................................................. —Existence of legislation prohibiting
gender-based discrimination .......................................................... —
Childcare EcosystemLength of maternity leave ......................................................... 120 daysMaternity leave benefits (% of wages paid) .....................................70Provider of maternity coverage ..................... Social Insurance FundLength of paternity leave ..................................................................... —Paternity leave benefits (% of wages paid) ..................................... —Daycare options .................................................................................... —
MongoliaGender Gap Index 2011 (out of 135 countries) 36 0.714 3 0.850 47 0.995 1 0.980 125 0.032
Gender Gap Index 2010 (out of 134 countries) 27 0.719 2 0.875 59 0.992 1 0.980 124 0.032
Gender Gap Index 2009 (out of 134 countries) 22 0.722 1 0.833 1 1.000 1 0.980 100 0.075
Gender Gap Index 2008 (out of 130 countries) 40 0.705 10 0.756 1 1.000 1 0.980 95 0.084
Gender Gap Index 2007 (out of 128 countries) 62 0.673 47 0.668 23 0.999 1 0.980 113 0.046
Gender Gap Index 2006 (out of 115 countries) 42 0.682 21 0.704 20 0.999 1 0.980 101 0.046
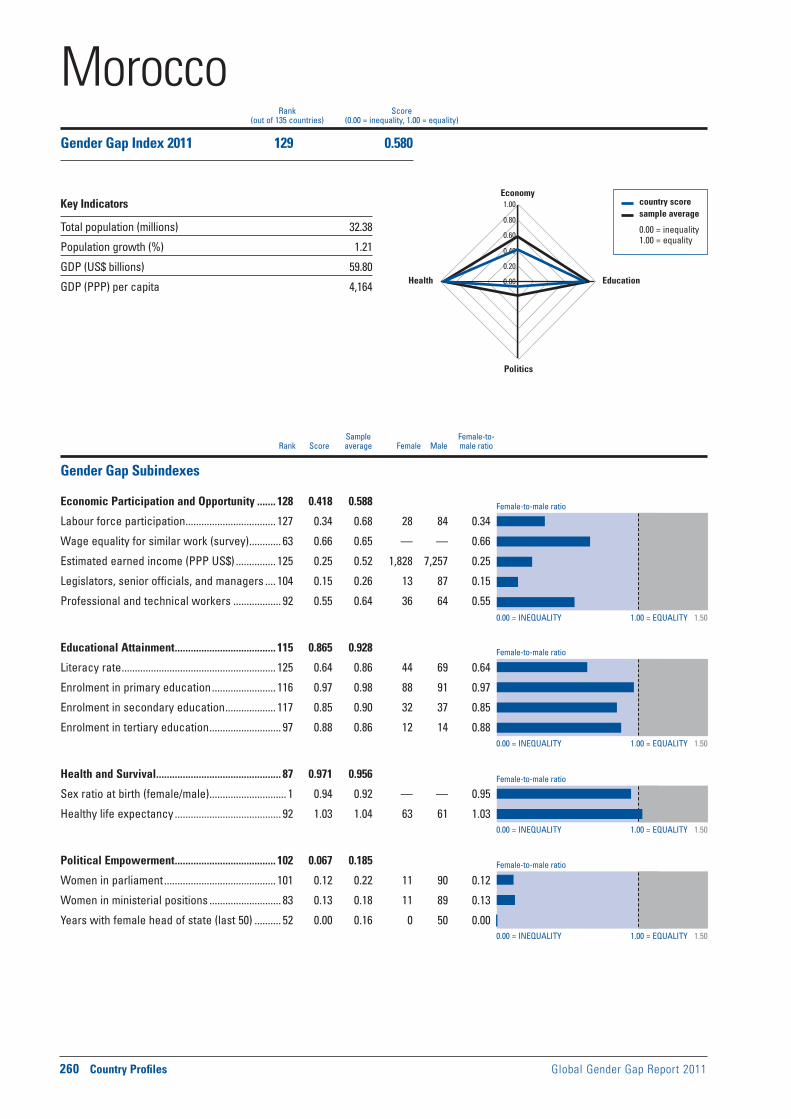
Female-to-male ratio
0.00 = INEQUALITY 1.00 = EQUALITY 1.50
0.00 = INEQUALITY 1.00 = EQUALITY 1.50
0.00 = INEQUALITY 1.00 = EQUALITY 1.50
0.00 = INEQUALITY 1.00 = EQUALITY 1.50
Female-to-male ratio
Female-to-male ratio
Female-to-male ratio
260 Country Profiles Global Gender Gap Report 2011
Sample Female-to- Rank Score average Female Male male ratio
country score sample average
0.00 = inequality 1.00 = equality
0.00
0.20
0.40
0.60
0.80
1.00Economy
Education
Politics
Health
Rank Score(out of 135 countries) (0.00 = inequality, 1.00 = equality)
Gender Gap Subindexes
Economic Participation and Opportunity ....... 128 0.418 0.588
Labour force participation .................................. 127 0.34 0.68 28 84 0.34
Wage equality for similar work (survey) ............ 63 0.66 0.65 — — 0.66
Estimated earned income (PPP US$) ............... 125 0.25 0.52 1,828 7,257 0.25
Legislators, senior officials, and managers .... 104 0.15 0.26 13 87 0.15
Professional and technical workers .................. 92 0.55 0.64 36 64 0.55
Educational Attainment ...................................... 115 0.865 0.928
Literacy rate .......................................................... 125 0.64 0.86 44 69 0.64
Enrolment in primary education ........................ 116 0.97 0.98 88 91 0.97
Enrolment in secondary education ................... 117 0.85 0.90 32 37 0.85
Enrolment in tertiary education ........................... 97 0.88 0.86 12 14 0.88
Health and Survival ............................................... 87 0.971 0.956
Sex ratio at birth (female/male) ............................. 1 0.94 0.92 — — 0.95
Healthy life expectancy ........................................ 92 1.03 1.04 63 61 1.03
Political Empowerment ...................................... 102 0.067 0.185
Women in parliament .......................................... 101 0.12 0.22 11 90 0.12
Women in ministerial positions ........................... 83 0.13 0.18 11 89 0.13
Years with female head of state (last 50) .......... 52 0.00 0.16 0 50 0.00
MoroccoGender Gap Index 2011 129 0.580
Key Indicators
Total population (millions) 32.38
Population growth (%) 1.21
GDP (US$ billions) 59.80
GDP (PPP) per capita 4,164

Global Gender Gap Report 2011 Country Profiles 261
Economic Participation and Opportunity Educational Attainment Health and Survival Political Empowerment
Evolution 2006–2011
1 Survey data, responses on a 1-to-7 scale (1 = worst score, 7 = best score)2 Data on a 0-to-1 scale (1 = worst score, 0 = best score)3 Data on a 1-to-5 scale (1 = worst score, 5 = best score)4 Bracketed numbers show the range between the uncertainties, estimated
to contain the true maternal mortality ratio with a 95% probability
ECONOMIC EDUCATIONAL HEALTH AND POLITICAL OVERALL PARTICIPATION ATTAINMENT SURVIVAL EMPOWERMENT
Rank Score Rank Score Rank Score Rank Score Rank Score
0.0
0.2
0.4
0.6
0.8
1.0
2006 2007 2008 2009 2010 2011
Additional Data
Economic EmpowermentFemale adult unemployment rate (% of female labour force) .......10Male adult unemployment rate (% of male labour force) ................9Women in non-agricultural paid labour
(% of total labour force) ....................................................................21Inheritance practices in favour of male heirs2 ..............................0.50Firms with female participation in ownership (% of firms) ............24Women’s access to land ownership2 .............................................0.50Women’s access to bank loans2 ......................................................0.50Women’s access to property other than land2 .............................0.00Women’s access to finance programmes3 .........................................3Ability of women to rise to positions of
enterprise leadership1 ....................................................................5.12
EducationFemale teachers, primary education (%) ..........................................51Female teachers, secondary education (%) .....................................33Female teachers, tertiary education (%) ...........................................17Female school life expectancy, primary to secondary (years)........9Male school life expectancy, primary to secondary (years) .........10
Marriage and ChildbearingMean age of marriage for women (years) ........................................26Early marriage (% women, aged 15–19) .........................................12.8Fertility rate (births per woman) .......................................................2.40Adolescent fertility rate (births per 1,000 women, aged 15–19) ....18Antenatal care coverage, at least one visit (%) ...............................68Births attended by skilled health staff (%) ........................................63Maternal mortality ratio (per 100,000 live births)4 ...........110 [63-190]Contraceptive prevalence, married women (%) ..............................63Female HIV prevalence, aged 15–49 (%) ........................................0.10Male HIV prevalence, aged 15–49 (%) ............................................0.20Infant mortality rate (per 1,000 live births) ........................................33Overall population sex ratio (male/female) ....................................0.96
Social Institutions and Political RightsPaternal versus maternal authority2................................................0.00Female genital mutilation2 .................................................................0.00Acceptance or legality of polygamy2 ..............................................0.50Existence of legislation punishing acts
of violence against women2 ..........................................................0.25Year women received right to vote ................................................1959Quota type .......................................................................Reserved seats
at single/lower house; voluntary political party quotasExistence of legislation prohibiting
gender-based discrimination .......................................................... —
Childcare EcosystemLength of maternity leave ........................................................14 weeksMaternity leave benefits (% of wages paid) ...................................100Provider of maternity coverage ...................................Social securityLength of paternity leave ..................................................................... —Paternity leave benefits (% of wages paid) ..................................... —Daycare options .................................................................................... —
MoroccoGender Gap Index 2011 (out of 135 countries) 129 0.580 128 0.418 115 0.865 87 0.971 102 0.067
Gender Gap Index 2010 (out of 134 countries) 127 0.577 127 0.408 116 0.861 85 0.971 103 0.067
Gender Gap Index 2009 (out of 134 countries) 124 0.593 125 0.448 118 0.856 90 0.972 90 0.095
Gender Gap Index 2008 (out of 130 countries) 125 0.576 127 0.393 117 0.844 85 0.972 86 0.095
Gender Gap Index 2007 (out of 128 countries) 122 0.568 121 0.401 113 0.845 84 0.972 103 0.053
Gender Gap Index 2006 (out of 115 countries) 107 0.583 102 0.461 99 0.848 90 0.968 92 0.053

Female-to-male ratio
0.00 = INEQUALITY 1.00 = EQUALITY 1.50
0.00 = INEQUALITY 1.00 = EQUALITY 1.50
0.00 = INEQUALITY 1.00 = EQUALITY 1.50
0.00 = INEQUALITY 1.00 = EQUALITY 1.50
Female-to-male ratio
Female-to-male ratio
Female-to-male ratio
262 Country Profiles Global Gender Gap Report 2011
Sample Female-to- Rank Score average Female Male male ratio
country score sample average
0.00 = inequality 1.00 = equality
0.00
0.20
0.40
0.60
0.80
1.00Economy
Education
Politics
Health
Rank Score(out of 135 countries) (0.00 = inequality, 1.00 = equality)
Gender Gap Subindexes
Economic Participation and Opportunity ........... 9 0.782 0.588
Labour force participation ...................................... 3 0.99 0.68 86 87 0.99
Wage equality for similar work (survey) ............ 65 0.66 0.65 — — 0.66
Estimated earned income (PPP US$) ................. 15 0.76 0.52 767 1,010 0.76
Legislators, senior officials, and managers ......— — 0.26 — — —
Professional and technical workers ..................— — 0.64 — — —
Educational Attainment ...................................... 124 0.812 0.928
Literacy rate .......................................................... 128 0.59 0.86 41 70 0.59
Enrolment in primary education ........................ 122 0.94 0.98 90 95 0.94
Enrolment in secondary education ................... 112 0.90 0.90 15 17 0.90
Enrolment in tertiary education ......................... 121 0.49 0.86 1 2 0.49
Health and Survival ............................................. 111 0.961 0.956
Sex ratio at birth (female/male) ............................. 1 0.94 0.92 — — 0.98
Healthy life expectancy ...................................... 118 1.00 1.04 42 42 1.00
Political Empowerment ........................................ 12 0.346 0.185
Women in parliament .............................................. 9 0.64 0.22 39 61 0.64
Women in ministerial positions ........................... 35 0.35 0.18 26 74 0.35
Years with female head of state (last 50) .......... 14 0.13 0.16 6 44 0.13
MozambiqueGender Gap Index 2011 26 0.725
Key Indicators
Total population (millions) 23.41
Population growth (%) 2.21
GDP (US$ billions) 9.12
GDP (PPP) per capita 844

Global Gender Gap Report 2011 Country Profiles 263
Economic Participation and Opportunity Educational Attainment Health and Survival Political Empowerment
Evolution 2006–2011
1 Survey data, responses on a 1-to-7 scale (1 = worst score, 7 = best score)2 Data on a 0-to-1 scale (1 = worst score, 0 = best score)3 Data on a 1-to-5 scale (1 = worst score, 5 = best score)4 Bracketed numbers show the range between the uncertainties, estimated
to contain the true maternal mortality ratio with a 95% probability
ECONOMIC EDUCATIONAL HEALTH AND POLITICAL OVERALL PARTICIPATION ATTAINMENT SURVIVAL EMPOWERMENT
Rank Score Rank Score Rank Score Rank Score Rank Score
0.0
0.2
0.4
0.6
0.8
1.0
2006 2007 2008 2009 2010 2011
Additional Data
Economic EmpowermentFemale adult unemployment rate (% of female labour force) ...... —Male adult unemployment rate (% of male labour force) ................3Women in non-agricultural paid labour
(% of total labour force) ....................................................................11Inheritance practices in favour of male heirs2 ..............................1.00Firms with female participation in ownership (% of firms) ........... —Women’s access to land ownership2 .............................................0.50Women’s access to bank loans2 ......................................................0.50Women’s access to property other than land2 .............................0.50Women’s access to finance programmes3 ...................................... —Ability of women to rise to positions of
enterprise leadership1 ....................................................................4.83
EducationFemale teachers, primary education (%) ..........................................39Female teachers, secondary education (%) .....................................18Female teachers, tertiary education (%) ...........................................21Female school life expectancy, primary to secondary (years)........9Male school life expectancy, primary to secondary (years) .........10
Marriage and ChildbearingMean age of marriage for women (years) ........................................19Early marriage (% women, aged 15–19) ............................................47Fertility rate (births per woman) .......................................................5.10Adolescent fertility rate (births per 1,000 women, aged 15–19) ..185Antenatal care coverage, at least one visit (%) ...............................92Births attended by skilled health staff (%) ........................................55Maternal mortality ratio (per 100,000 live births)4 .........550 [310-870]Contraceptive prevalence, married women (%) ..............................17Female HIV prevalence, aged 15–49 (%) ......................................13.60Male HIV prevalence, aged 15–49 (%) ............................................9.20Infant mortality rate (per 1,000 live births) ........................................96Overall population sex ratio (male/female) ....................................0.95
Social Institutions and Political RightsPaternal versus maternal authority2................................................0.50Female genital mutilation2 .................................................................0.00Acceptance or legality of polygamy2 ..............................................1.00Existence of legislation punishing acts
of violence against women2 ..........................................................0.75Year women received right to vote ................................................1975Quota type ..........................................................................No legislated;
voluntary political party quotasExistence of legislation prohibiting
gender-based discrimination .......................................................... —
Childcare EcosystemLength of maternity leave ........................................................... 60 daysMaternity leave benefits (% of wages paid) ...................................100Provider of maternity coverage ...................................Social securityLength of paternity leave ..................................................................... —Paternity leave benefits (% of wages paid) ..................................... —Daycare options .................................................................................... —
MozambiqueGender Gap Index 2011 (out of 135 countries) 26 0.725 9 0.782 124 0.812 111 0.961 12 0.346
Gender Gap Index 2010 (out of 134 countries) 22 0.733 5 0.811 123 0.814 110 0.961 11 0.345
Gender Gap Index 2009 (out of 134 countries) 26 0.720 3 0.813 126 0.782 62 0.978 15 0.305
Gender Gap Index 2008 (out of 130 countries) 18 0.727 1 0.835 121 0.799 59 0.978 17 0.295
Gender Gap Index 2007 (out of 128 countries) 43 0.688 1 0.797 120 0.752 57 0.978 22 0.226
Gender Gap Index 2006 (out of 115 countries) — — — — — — — — — —
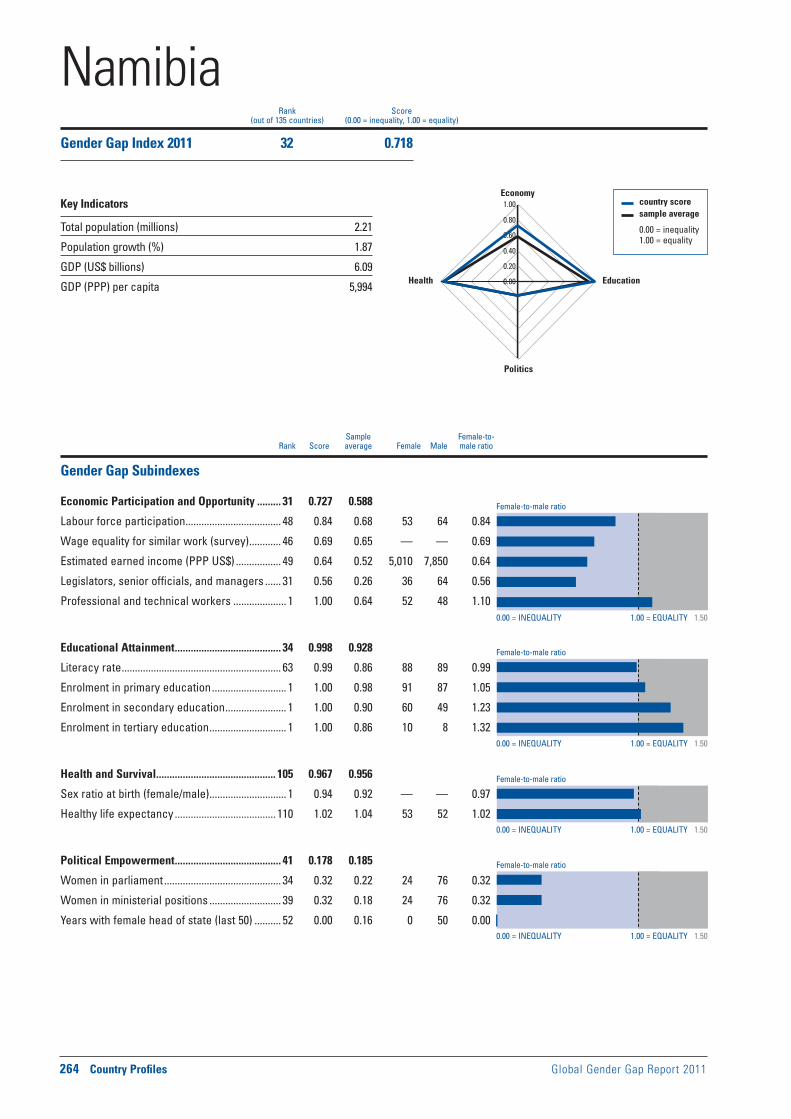
Female-to-male ratio
0.00 = INEQUALITY 1.00 = EQUALITY 1.50
0.00 = INEQUALITY 1.00 = EQUALITY 1.50
0.00 = INEQUALITY 1.00 = EQUALITY 1.50
0.00 = INEQUALITY 1.00 = EQUALITY 1.50
Female-to-male ratio
Female-to-male ratio
Female-to-male ratio
264 Country Profiles Global Gender Gap Report 2011
Sample Female-to- Rank Score average Female Male male ratio
country score sample average
0.00 = inequality 1.00 = equality
0.00
0.20
0.40
0.60
0.80
1.00Economy
Education
Politics
Health
Rank Score(out of 135 countries) (0.00 = inequality, 1.00 = equality)
Gender Gap Subindexes
Economic Participation and Opportunity ......... 31 0.727 0.588
Labour force participation .................................... 48 0.84 0.68 53 64 0.84
Wage equality for similar work (survey) ............ 46 0.69 0.65 — — 0.69
Estimated earned income (PPP US$) ................. 49 0.64 0.52 5,010 7,850 0.64
Legislators, senior officials, and managers ...... 31 0.56 0.26 36 64 0.56
Professional and technical workers .................... 1 1.00 0.64 52 48 1.10
Educational Attainment ........................................ 34 0.998 0.928
Literacy rate ............................................................ 63 0.99 0.86 88 89 0.99
Enrolment in primary education ............................ 1 1.00 0.98 91 87 1.05
Enrolment in secondary education ....................... 1 1.00 0.90 60 49 1.23
Enrolment in tertiary education ............................. 1 1.00 0.86 10 8 1.32
Health and Survival ............................................. 105 0.967 0.956
Sex ratio at birth (female/male) ............................. 1 0.94 0.92 — — 0.97
Healthy life expectancy ...................................... 110 1.02 1.04 53 52 1.02
Political Empowerment ........................................ 41 0.178 0.185
Women in parliament ............................................ 34 0.32 0.22 24 76 0.32
Women in ministerial positions ........................... 39 0.32 0.18 24 76 0.32
Years with female head of state (last 50) .......... 52 0.00 0.16 0 50 0.00
NamibiaGender Gap Index 2011 32 0.718
Key Indicators
Total population (millions) 2.21
Population growth (%) 1.87
GDP (US$ billions) 6.09
GDP (PPP) per capita 5,994

Global Gender Gap Report 2011 Country Profiles 265
Economic Participation and Opportunity Educational Attainment Health and Survival Political Empowerment
Evolution 2006–2011
1 Survey data, responses on a 1-to-7 scale (1 = worst score, 7 = best score)2 Data on a 0-to-1 scale (1 = worst score, 0 = best score)3 Data on a 1-to-5 scale (1 = worst score, 5 = best score)4 Bracketed numbers show the range between the uncertainties, estimated
to contain the true maternal mortality ratio with a 95% probability
ECONOMIC EDUCATIONAL HEALTH AND POLITICAL OVERALL PARTICIPATION ATTAINMENT SURVIVAL EMPOWERMENT
Rank Score Rank Score Rank Score Rank Score Rank Score
0.0
0.2
0.4
0.6
0.8
1.0
2006 2007 2008 2009 2010 2011
Additional Data
Economic EmpowermentFemale adult unemployment rate (% of female labour force) .......43Male adult unemployment rate (% of male labour force) ..............33Women in non-agricultural paid labour
(% of total labour force) ....................................................................41Inheritance practices in favour of male heirs2 ..............................1.00Firms with female participation in ownership (% of firms) ........... —Women’s access to land ownership2 .............................................0.50Women’s access to bank loans2 ......................................................0.00Women’s access to property other than land2 .............................0.50Women’s access to finance programmes3 .........................................3Ability of women to rise to positions of
enterprise leadership1 ....................................................................4.91
EducationFemale teachers, primary education (%) ..........................................68Female teachers, secondary education (%) .....................................50Female teachers, tertiary education (%) ...........................................41Female school life expectancy, primary to secondary (years)......11Male school life expectancy, primary to secondary (years) .........11
Marriage and ChildbearingMean age of marriage for women (years) ........................................28Early marriage (% women, aged 15–19) ..............................................8Fertility rate (births per woman) .......................................................3.40Adolescent fertility rate (births per 1,000 women, aged 15–19) ....74Antenatal care coverage, at least one visit (%) ...............................95Births attended by skilled health staff (%) ........................................81Maternal mortality ratio (per 100,000 live births)4 ...........180 [93-270]Contraceptive prevalence, married women (%) ..............................55Female HIV prevalence, aged 15–49 (%) ......................................15.70Male HIV prevalence, aged 15–49 (%) ..........................................10.50Infant mortality rate (per 1,000 live births) ........................................34Overall population sex ratio (male/female) ....................................0.97
Social Institutions and Political RightsPaternal versus maternal authority2................................................0.00Female genital mutilation2 .................................................................0.00Acceptance or legality of polygamy2 ..............................................0.50Existence of legislation punishing acts
of violence against women2 ..........................................................0.50Year women received right to vote ................................................1989Quota type .............................................................................................. —Existence of legislation prohibiting
gender-based discrimination ........................................................ Yes
Childcare EcosystemLength of maternity leave ........................................................12 weeksMaternity leave benefits (% of wages paid) ...................................100Provider of maternity coverage ...................................Social securityLength of paternity leave .....................................................................NoPaternity leave benefits (% of wages paid) ..................................... —Daycare options .................................................................................... —
NamibiaGender Gap Index 2011 (out of 135 countries) 32 0.718 31 0.727 34 0.998 105 0.967 41 0.178
Gender Gap Index 2010 (out of 134 countries) 25 0.724 27 0.739 34 0.998 104 0.967 38 0.192
Gender Gap Index 2009 (out of 134 countries) 32 0.717 32 0.720 85 0.982 108 0.968 38 0.196
Gender Gap Index 2008 (out of 130 countries) 30 0.714 30 0.709 83 0.983 104 0.968 36 0.196
Gender Gap Index 2007 (out of 128 countries) 29 0.701 44 0.672 46 0.993 103 0.968 31 0.172
Gender Gap Index 2006 (out of 115 countries) 38 0.686 57 0.614 43 0.993 93 0.967 29 0.172
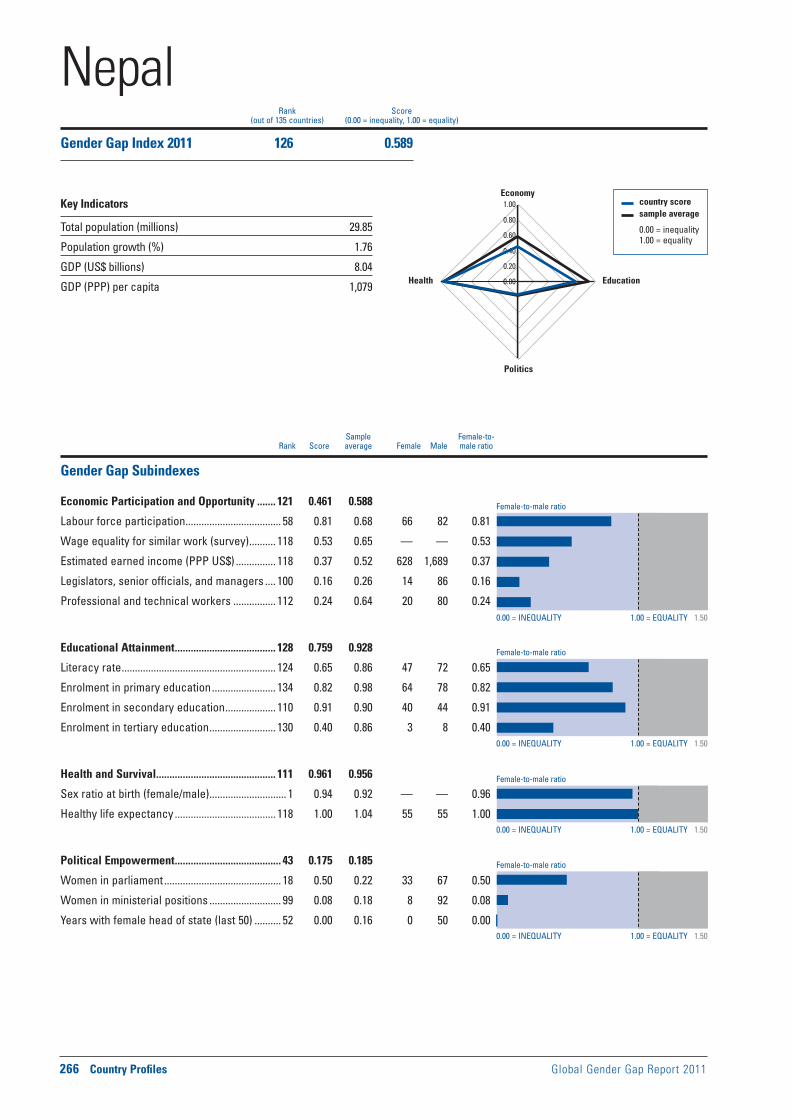
Female-to-male ratio
0.00 = INEQUALITY 1.00 = EQUALITY 1.50
0.00 = INEQUALITY 1.00 = EQUALITY 1.50
0.00 = INEQUALITY 1.00 = EQUALITY 1.50
0.00 = INEQUALITY 1.00 = EQUALITY 1.50
Female-to-male ratio
Female-to-male ratio
Female-to-male ratio
266 Country Profiles Global Gender Gap Report 2011
Sample Female-to- Rank Score average Female Male male ratio
country score sample average
0.00 = inequality 1.00 = equality
0.00
0.20
0.40
0.60
0.80
1.00Economy
Education
Politics
Health
Rank Score(out of 135 countries) (0.00 = inequality, 1.00 = equality)
Gender Gap Subindexes
Economic Participation and Opportunity ....... 121 0.461 0.588
Labour force participation .................................... 58 0.81 0.68 66 82 0.81
Wage equality for similar work (survey) .......... 118 0.53 0.65 — — 0.53
Estimated earned income (PPP US$) ............... 118 0.37 0.52 628 1,689 0.37
Legislators, senior officials, and managers .... 100 0.16 0.26 14 86 0.16
Professional and technical workers ................ 112 0.24 0.64 20 80 0.24
Educational Attainment ...................................... 128 0.759 0.928
Literacy rate .......................................................... 124 0.65 0.86 47 72 0.65
Enrolment in primary education ........................ 134 0.82 0.98 64 78 0.82
Enrolment in secondary education ................... 110 0.91 0.90 40 44 0.91
Enrolment in tertiary education ......................... 130 0.40 0.86 3 8 0.40
Health and Survival ............................................. 111 0.961 0.956
Sex ratio at birth (female/male) ............................. 1 0.94 0.92 — — 0.96
Healthy life expectancy ...................................... 118 1.00 1.04 55 55 1.00
Political Empowerment ........................................ 43 0.175 0.185
Women in parliament ............................................ 18 0.50 0.22 33 67 0.50
Women in ministerial positions ........................... 99 0.08 0.18 8 92 0.08
Years with female head of state (last 50) .......... 52 0.00 0.16 0 50 0.00
NepalGender Gap Index 2011 126 0.589
Key Indicators
Total population (millions) 29.85
Population growth (%) 1.76
GDP (US$ billions) 8.04
GDP (PPP) per capita 1,079

Global Gender Gap Report 2011 Country Profiles 267
Economic Participation and Opportunity Educational Attainment Health and Survival Political Empowerment
Evolution 2006–2011
1 Survey data, responses on a 1-to-7 scale (1 = worst score, 7 = best score)2 Data on a 0-to-1 scale (1 = worst score, 0 = best score)3 Data on a 1-to-5 scale (1 = worst score, 5 = best score)4 Bracketed numbers show the range between the uncertainties, estimated
to contain the true maternal mortality ratio with a 95% probability
ECONOMIC EDUCATIONAL HEALTH AND POLITICAL OVERALL PARTICIPATION ATTAINMENT SURVIVAL EMPOWERMENT
Rank Score Rank Score Rank Score Rank Score Rank Score
0.0
0.2
0.4
0.6
0.8
1.0
2006 2007 2008 2009 2010 2011
Additional Data
Economic EmpowermentFemale adult unemployment rate (% of female labour force) .......11Male adult unemployment rate (% of male labour force) ................7Women in non-agricultural paid labour
(% of total labour force) ....................................................................14Inheritance practices in favour of male heirs2 ..............................0.50Firms with female participation in ownership (% of firms) ............28Women’s access to land ownership2 .............................................0.50Women’s access to bank loans2 ......................................................0.50Women’s access to property other than land2 .............................0.50Women’s access to finance programmes3 ...................................... —Ability of women to rise to positions of
enterprise leadership1 ....................................................................3.72
EducationFemale teachers, primary education (%) ..........................................40Female teachers, secondary education (%) .....................................15Female teachers, tertiary education (%) .......................................... —Female school life expectancy, primary to secondary (years)........8Male school life expectancy, primary to secondary (years) ...........9
Marriage and ChildbearingMean age of marriage for women (years) ........................................19Early marriage (% women, aged 15–19) ............................................40Fertility rate (births per woman) .......................................................2.90Adolescent fertility rate (births per 1,000 women, aged 15–19) ..106Antenatal care coverage, at least one visit (%) ...............................44Births attended by skilled health staff (%) ........................................19Maternal mortality ratio (per 100,000 live births)4 .........380 [210-650]Contraceptive prevalence, married women (%) ..............................48Female HIV prevalence, aged 15–49 (%) ........................................0.30Male HIV prevalence, aged 15–49 (%) ............................................0.50Infant mortality rate (per 1,000 live births) ........................................39Overall population sex ratio (male/female) ....................................0.99
Social Institutions and Political RightsPaternal versus maternal authority2................................................0.50Female genital mutilation2 .................................................................0.00Acceptance or legality of polygamy2 ..............................................0.00Existence of legislation punishing acts
of violence against women2 ..........................................................0.58Year women received right to vote ................................................1951Quota type ................................................Legislated candidate quotasExistence of legislation prohibiting
gender-based discrimination .......................................................... —
Childcare EcosystemLength of maternity leave ........................................................... 52 daysMaternity leave benefits (% of wages paid) ...................................100Provider of maternity coverage .............................................EmployerLength of paternity leave ..................................................................... —Paternity leave benefits (% of wages paid) ..................................... —Daycare options .................................................................................... —
NepalGender Gap Index 2011 (out of 135 countries) 126 0.589 121 0.461 128 0.759 111 0.961 43 0.175
Gender Gap Index 2010 (out of 134 countries) 115 0.608 112 0.517 126 0.781 110 0.961 44 0.174
Gender Gap Index 2009 (out of 134 countries) 110 0.621 116 0.498 125 0.816 123 0.955 35 0.216
Gender Gap Index 2008 (out of 130 countries) 120 0.594 116 0.462 124 0.745 119 0.955 34 0.214
Gender Gap Index 2007 (out of 128 countries) 125 0.558 114 0.457 122 0.734 117 0.955 83 0.085
Gender Gap Index 2006 (out of 115 countries) 111 0.548 100 0.465 109 0.734 111 0.953 102 0.039

Female-to-male ratio
0.00 = INEQUALITY 1.00 = EQUALITY 1.50
0.00 = INEQUALITY 1.00 = EQUALITY 1.50
0.00 = INEQUALITY 1.00 = EQUALITY 1.50
0.00 = INEQUALITY 1.00 = EQUALITY 1.50
Female-to-male ratio
Female-to-male ratio
Female-to-male ratio
268 Country Profiles Global Gender Gap Report 2011
Sample Female-to- Rank Score average Female Male male ratio
country score sample average
0.00 = inequality 1.00 = equality
0.00
0.20
0.40
0.60
0.80
1.00Economy
Education
Politics
Health
Rank Score(out of 135 countries) (0.00 = inequality, 1.00 = equality)
Gender Gap Subindexes
Economic Participation and Opportunity ......... 27 0.743 0.588
Labour force participation .................................... 38 0.87 0.68 74 85 0.87
Wage equality for similar work (survey) ............ 56 0.68 0.65 — — 0.68
Estimated earned income (PPP US$) ................... 8 0.83 0.52 33,295 40,000 0.83
Legislators, senior officials, and managers ...... 70 0.38 0.26 27 73 0.38
Professional and technical workers .................. 59 0.99 0.64 50 50 0.99
Educational Attainment ........................................ 32 0.999 0.928
Literacy rate .............................................................. 1 1.00 0.86 99 99 1.00
Enrolment in primary education .......................... 73 1.00 0.98 99 99 1.00
Enrolment in secondary education ....................... 1 1.00 0.90 88 87 1.02
Enrolment in tertiary education ............................. 1 1.00 0.86 65 58 1.12
Health and Survival ............................................... 92 0.970 0.956
Sex ratio at birth (female/male) ............................. 1 0.94 0.92 — — 0.95
Healthy life expectancy ........................................ 98 1.03 1.04 74 72 1.03
Political Empowerment ........................................ 26 0.277 0.185
Women in parliament .............................................. 7 0.65 0.22 39 61 0.65
Women in ministerial positions ........................... 40 0.31 0.18 24 76 0.31
Years with female head of state (last 50) .......... 52 0.00 0.16 0 50 0.00
NetherlandsGender Gap Index 2011 15 0.747
Key Indicators
Total population (millions) 16.62
Population growth (%) 0.55
GDP (US$ billions) 440.12
GDP (PPP) per capita 36,892

Global Gender Gap Report 2011 Country Profiles 269
Economic Participation and Opportunity Educational Attainment Health and Survival Political Empowerment
Evolution 2006–2011
1 Survey data, responses on a 1-to-7 scale (1 = worst score, 7 = best score)2 Data on a 0-to-1 scale (1 = worst score, 0 = best score)3 Data on a 1-to-5 scale (1 = worst score, 5 = best score)4 Bracketed numbers show the range between the uncertainties, estimated
to contain the true maternal mortality ratio with a 95% probability
ECONOMIC EDUCATIONAL HEALTH AND POLITICAL OVERALL PARTICIPATION ATTAINMENT SURVIVAL EMPOWERMENT
Rank Score Rank Score Rank Score Rank Score Rank Score
0.0
0.2
0.4
0.6
0.8
1.0
2006 2007 2008 2009 2010 2011
Additional Data
Economic EmpowermentFemale adult unemployment rate (% of female labour force) .........3Male adult unemployment rate (% of male labour force) ................3Women in non-agricultural paid labour
(% of total labour force) ....................................................................48Inheritance practices in favour of male heirs2 ................................ —Firms with female participation in ownership (% of firms) ........... —Women’s access to land ownership2 ............................................... —Women’s access to bank loans2 ........................................................ —Women’s access to property other than land2 ............................... —Women’s access to finance programmes3 .........................................5Ability of women to rise to positions of
enterprise leadership1 ....................................................................4.85
EducationFemale teachers, primary education (%) ......................................... —Female teachers, secondary education (%) .....................................47Female teachers, tertiary education (%) ...........................................38Female school life expectancy, primary to secondary (years)......14Male school life expectancy, primary to secondary (years) .........14
Marriage and ChildbearingMean age of marriage for women (years) ........................................31Early marriage (% women, aged 15–19) ........................................... —Fertility rate (births per woman) .......................................................1.70Adolescent fertility rate (births per 1,000 women, aged 15–19) ......4Antenatal care coverage, at least one visit (%) .............................. —Births attended by skilled health staff (%) ......................................100Maternal mortality ratio (per 100,000 live births)4 ...................9 [7-10]Contraceptive prevalence, married women (%) ..............................67Female HIV prevalence, aged 15–49 (%) ........................................0.10Male HIV prevalence, aged 15–49 (%) ............................................0.30Infant mortality rate (per 1,000 live births) ..........................................4Overall population sex ratio (male/female) ....................................0.98
Social Institutions and Political RightsPaternal versus maternal authority2.................................................. —Female genital mutilation2 ................................................................... —Acceptance or legality of polygamy2 ................................................ —Existence of legislation punishing acts
of violence against women2 ............................................................ —Year women received right to vote ................................................1919Quota type ..........................................................................No legislated;
voluntary political party quotasExistence of legislation prohibiting
gender-based discrimination ........................................................ Yes
Childcare EcosystemLength of maternity leave ........................................................16 weeksMaternity leave benefits (% of wages paid) ....... 100; up to a ceilingProvider of maternity coverage ............................... Social insuranceLength of paternity leave .............. 2 days, within 4 weeks after birthPaternity leave benefits (% of wages paid) .............100%, no ceilingDaycare options ............................................................ Private daycare
with and without allowance; homecare without allowance to parents
NetherlandsGender Gap Index 2011 (out of 135 countries) 15 0.747 27 0.743 32 0.999 92 0.970 26 0.277
Gender Gap Index 2010 (out of 134 countries) 17 0.744 31 0.723 39 0.997 91 0.970 25 0.288
Gender Gap Index 2009 (out of 134 countries) 11 0.749 49 0.685 51 0.995 75 0.974 10 0.342
Gender Gap Index 2008 (out of 130 countries) 9 0.740 51 0.667 59 0.994 72 0.974 12 0.324
Gender Gap Index 2007 (out of 128 countries) 12 0.738 49 0.667 44 0.993 70 0.974 11 0.319
Gender Gap Index 2006 (out of 115 countries) 12 0.725 51 0.635 73 0.972 67 0.974 10 0.319
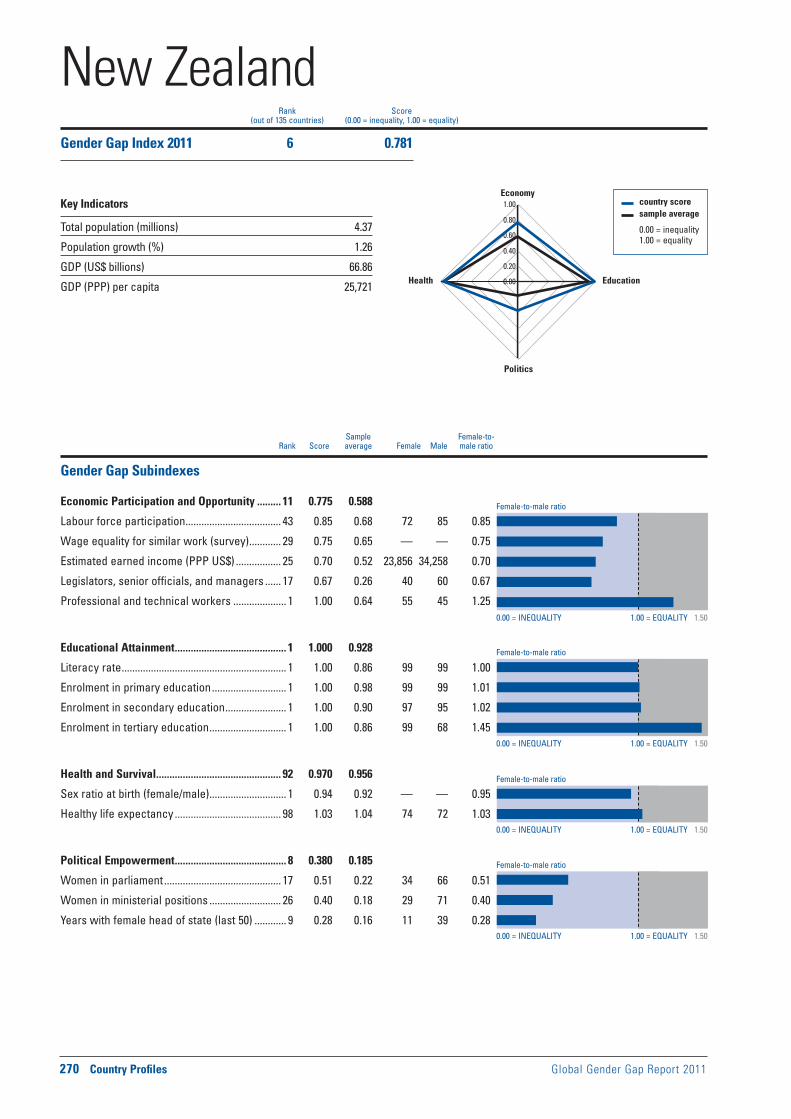
Female-to-male ratio
0.00 = INEQUALITY 1.00 = EQUALITY 1.50
0.00 = INEQUALITY 1.00 = EQUALITY 1.50
0.00 = INEQUALITY 1.00 = EQUALITY 1.50
0.00 = INEQUALITY 1.00 = EQUALITY 1.50
Female-to-male ratio
Female-to-male ratio
Female-to-male ratio
270 Country Profiles Global Gender Gap Report 2011
Sample Female-to- Rank Score average Female Male male ratio
country score sample average
0.00 = inequality 1.00 = equality
0.00
0.20
0.40
0.60
0.80
1.00Economy
Education
Politics
Health
Rank Score(out of 135 countries) (0.00 = inequality, 1.00 = equality)
Gender Gap Subindexes
Economic Participation and Opportunity ......... 11 0.775 0.588
Labour force participation .................................... 43 0.85 0.68 72 85 0.85
Wage equality for similar work (survey) ............ 29 0.75 0.65 — — 0.75
Estimated earned income (PPP US$) ................. 25 0.70 0.52 23,856 34,258 0.70
Legislators, senior officials, and managers ...... 17 0.67 0.26 40 60 0.67
Professional and technical workers .................... 1 1.00 0.64 55 45 1.25
Educational Attainment .......................................... 1 1.000 0.928
Literacy rate .............................................................. 1 1.00 0.86 99 99 1.00
Enrolment in primary education ............................ 1 1.00 0.98 99 99 1.01
Enrolment in secondary education ....................... 1 1.00 0.90 97 95 1.02
Enrolment in tertiary education ............................. 1 1.00 0.86 99 68 1.45
Health and Survival ............................................... 92 0.970 0.956
Sex ratio at birth (female/male) ............................. 1 0.94 0.92 — — 0.95
Healthy life expectancy ........................................ 98 1.03 1.04 74 72 1.03
Political Empowerment .......................................... 8 0.380 0.185
Women in parliament ............................................ 17 0.51 0.22 34 66 0.51
Women in ministerial positions ........................... 26 0.40 0.18 29 71 0.40
Years with female head of state (last 50) ............ 9 0.28 0.16 11 39 0.28
New ZealandGender Gap Index 2011 6 0.781
Key Indicators
Total population (millions) 4.37
Population growth (%) 1.26
GDP (US$ billions) 66.86
GDP (PPP) per capita 25,721

Global Gender Gap Report 2011 Country Profiles 271
Economic Participation and Opportunity Educational Attainment Health and Survival Political Empowerment
Evolution 2006–2011
1 Survey data, responses on a 1-to-7 scale (1 = worst score, 7 = best score)2 Data on a 0-to-1 scale (1 = worst score, 0 = best score)3 Data on a 1-to-5 scale (1 = worst score, 5 = best score)4 Bracketed numbers show the range between the uncertainties, estimated
to contain the true maternal mortality ratio with a 95% probability
ECONOMIC EDUCATIONAL HEALTH AND POLITICAL OVERALL PARTICIPATION ATTAINMENT SURVIVAL EMPOWERMENT
Rank Score Rank Score Rank Score Rank Score Rank Score
0.0
0.2
0.4
0.6
0.8
1.0
2006 2007 2008 2009 2010 2011
Additional Data
Economic EmpowermentFemale adult unemployment rate (% of female labour force) .........6Male adult unemployment rate (% of male labour force) ................4Women in non-agricultural paid labour
(% of total labour force) ....................................................................48Inheritance practices in favour of male heirs2 ................................ —Firms with female participation in ownership (% of firms) ........... —Women’s access to land ownership2 ............................................... —Women’s access to bank loans2 ........................................................ —Women’s access to property other than land2 ............................... —Women’s access to finance programmes3 .........................................5Ability of women to rise to positions of
enterprise leadership1 ....................................................................5.41
EducationFemale teachers, primary education (%) ..........................................84Female teachers, secondary education (%) .....................................62Female teachers, tertiary education (%) ...........................................50Female school life expectancy, primary to secondary (years)......15Male school life expectancy, primary to secondary (years) .........15
Marriage and ChildbearingMean age of marriage for women (years) ........................................26Early marriage (% women, aged 15–19) ........................................... —Fertility rate (births per woman) .......................................................2.00Adolescent fertility rate (births per 1,000 women, aged 15–19) ....32Antenatal care coverage, at least one visit (%) .............................. —Births attended by skilled health staff (%) ........................................96Maternal mortality ratio (per 100,000 live births)4 ...............14 [12-15]Contraceptive prevalence, married women (%) ..............................75Female HIV prevalence, aged 15–49 (%) ........................................0.10Male HIV prevalence, aged 15–49 (%) ............................................0.10Infant mortality rate (per 1,000 live births) ..........................................4Overall population sex ratio (male/female) ....................................0.98
Social Institutions and Political RightsPaternal versus maternal authority2.................................................. —Female genital mutilation2 ................................................................... —Acceptance or legality of polygamy2 ................................................ —Existence of legislation punishing acts
of violence against women2 ............................................................ —Year women received right to vote ................................................1893Quota type .............................................................................................. —Existence of legislation prohibiting
gender-based discrimination ........................................................ Yes
Childcare EcosystemLength of maternity leave ........................................................14 weeksMaternity leave benefits (% of wages paid) ....... 100; up to a ceilingProvider of maternity coverage ......................................... State funds
(Universal and social assistance system)Length of paternity leave ............................................2 weeks; eligible
male employees may also qualify for 14 weeks paid parental leavePaternity leave benefits (% of wages paid) .............................UnpaidDaycare options ............................................................ Private daycare
with allowance, going to both ECE service and parents
New ZealandGender Gap Index 2011 (out of 135 countries) 6 0.781 11 0.775 1 1.000 92 0.970 8 0.380
Gender Gap Index 2010 (out of 134 countries) 5 0.781 9 0.774 1 1.000 91 0.970 8 0.379
Gender Gap Index 2009 (out of 134 countries) 5 0.788 7 0.784 1 1.000 72 0.974 7 0.393
Gender Gap Index 2008 (out of 130 countries) 5 0.786 7 0.779 1 1.000 69 0.974 6 0.390
Gender Gap Index 2007 (out of 128 countries) 5 0.765 8 0.755 19 0.999 67 0.974 9 0.331
Gender Gap Index 2006 (out of 115 countries) 7 0.751 14 0.714 17 0.999 69 0.973 11 0.317

Female-to-male ratio
0.00 = INEQUALITY 1.00 = EQUALITY 1.50
0.00 = INEQUALITY 1.00 = EQUALITY 1.50
0.00 = INEQUALITY 1.00 = EQUALITY 1.50
0.00 = INEQUALITY 1.00 = EQUALITY 1.50
Female-to-male ratio
Female-to-male ratio
Female-to-male ratio
272 Country Profiles Global Gender Gap Report 2011
Sample Female-to- Rank Score average Female Male male ratio
country score sample average
0.00 = inequality 1.00 = equality
0.00
0.20
0.40
0.60
0.80
1.00Economy
Education
Politics
Health
Rank Score(out of 135 countries) (0.00 = inequality, 1.00 = equality)
Gender Gap Subindexes
Economic Participation and Opportunity ......... 79 0.619 0.588
Labour force participation .................................... 98 0.61 0.68 50 81 0.61
Wage equality for similar work (survey) .......... 117 0.53 0.65 — — 0.53
Estimated earned income (PPP US$) ................. 95 0.48 0.52 1,722 3,579 0.48
Legislators, senior officials, and managers ...... 13 0.69 0.26 41 59 0.69
Professional and technical workers .................... 1 1.00 0.64 51 49 1.05
Educational Attainment ........................................ 25 1.000 0.928
Literacy rate ............................................................ 51 1.00 0.86 78 78 1.00
Enrolment in primary education ............................ 1 1.00 0.98 92 92 1.00
Enrolment in secondary education ....................... 1 1.00 0.90 47 40 1.16
Enrolment in tertiary education ............................. 1 1.00 0.86 19 17 1.09
Health and Survival ............................................... 58 0.976 0.956
Sex ratio at birth (female/male) ............................. 1 0.94 0.92 — — 0.95
Healthy life expectancy ........................................ 69 1.05 1.04 66 63 1.05
Political Empowerment ........................................ 21 0.304 0.185
Women in parliament ............................................ 54 0.26 0.22 21 79 0.26
Women in ministerial positions ............................. 9 0.63 0.18 38 62 0.63
Years with female head of state (last 50) .......... 12 0.15 0.16 7 43 0.15
NicaraguaGender Gap Index 2011 27 0.725
Key Indicators
Total population (millions) 5.82
Population growth (%) 1.37
GDP (US$ billions) 5.25
GDP (PPP) per capita 2,485

Global Gender Gap Report 2011 Country Profiles 273
Economic Participation and Opportunity Educational Attainment Health and Survival Political Empowerment
Evolution 2006–2011
1 Survey data, responses on a 1-to-7 scale (1 = worst score, 7 = best score)2 Data on a 0-to-1 scale (1 = worst score, 0 = best score)3 Data on a 1-to-5 scale (1 = worst score, 5 = best score)4 Bracketed numbers show the range between the uncertainties, estimated
to contain the true maternal mortality ratio with a 95% probability
ECONOMIC EDUCATIONAL HEALTH AND POLITICAL OVERALL PARTICIPATION ATTAINMENT SURVIVAL EMPOWERMENT
Rank Score Rank Score Rank Score Rank Score Rank Score
0.0
0.2
0.4
0.6
0.8
1.0
2006 2007 2008 2009 2010 2011
Additional Data
Economic EmpowermentFemale adult unemployment rate (% of female labour force) .........5Male adult unemployment rate (% of male labour force) ................5Women in non-agricultural paid labour
(% of total labour force) ....................................................................38Inheritance practices in favour of male heirs2 ..............................0.00Firms with female participation in ownership (% of firms) ............25Women’s access to land ownership2 .............................................0.50Women’s access to bank loans2 ......................................................0.00Women’s access to property other than land2 .............................0.00Women’s access to finance programmes3 .........................................1Ability of women to rise to positions of
enterprise leadership1 ....................................................................3.81
EducationFemale teachers, primary education (%) ..........................................76Female teachers, secondary education (%) .....................................55Female teachers, tertiary education (%) ...........................................46Female school life expectancy, primary to secondary (years)......11Male school life expectancy, primary to secondary (years) .........10
Marriage and ChildbearingMean age of marriage for women (years) ........................................21Early marriage (% women, aged 15–19) ............................................32Fertility rate (births per woman) .......................................................2.70Adolescent fertility rate (births per 1,000 women, aged 15–19) ..109Antenatal care coverage, at least one visit (%) ...............................90Births attended by skilled health staff (%) ........................................74Maternal mortality ratio (per 100,000 live births)4 ...........100 [57-180]Contraceptive prevalence, married women (%) ..............................72Female HIV prevalence, aged 15–49 (%) ........................................0.10Male HIV prevalence, aged 15–49 (%) ............................................0.30Infant mortality rate (per 1,000 live births) ........................................22Overall population sex ratio (male/female) ....................................0.98
Social Institutions and Political RightsPaternal versus maternal authority2................................................0.00Female genital mutilation2 .................................................................0.00Acceptance or legality of polygamy2 ..............................................0.00Existence of legislation punishing acts
of violence against women2 ..........................................................0.50Year women received right to vote ................................................1950Quota type ..........................................................................No legislated;
voluntary political party quotasExistence of legislation prohibiting
gender-based discrimination .......................................................... —
Childcare EcosystemLength of maternity leave ........................................................12 weeksMaternity leave benefits (% of wages paid) ....................................60;
if the worker is not entitled to social security benefits, the employer shall cover the full cost of benefit
Provider of maternity coverage ...................................Social securityLength of paternity leave ..................................................................... —Paternity leave benefits (% of wages paid) ..................................... —Daycare options .................................................................................... —
NicaraguaGender Gap Index 2011 (out of 135 countries) 27 0.725 79 0.619 25 1.000 58 0.976 21 0.304
Gender Gap Index 2010 (out of 134 countries) 30 0.718 94 0.591 24 1.000 57 0.976 19 0.304
Gender Gap Index 2009 (out of 134 countries) 49 0.700 104 0.563 1 1.000 65 0.976 25 0.262
Gender Gap Index 2008 (out of 130 countries) 71 0.675 117 0.461 1 1.000 62 0.976 23 0.262
Gender Gap Index 2007 (out of 128 countries) 90 0.646 117 0.434 51 0.991 60 0.976 28 0.181
Gender Gap Index 2006 (out of 115 countries) 62 0.657 101 0.463 40 0.994 50 0.978 25 0.192
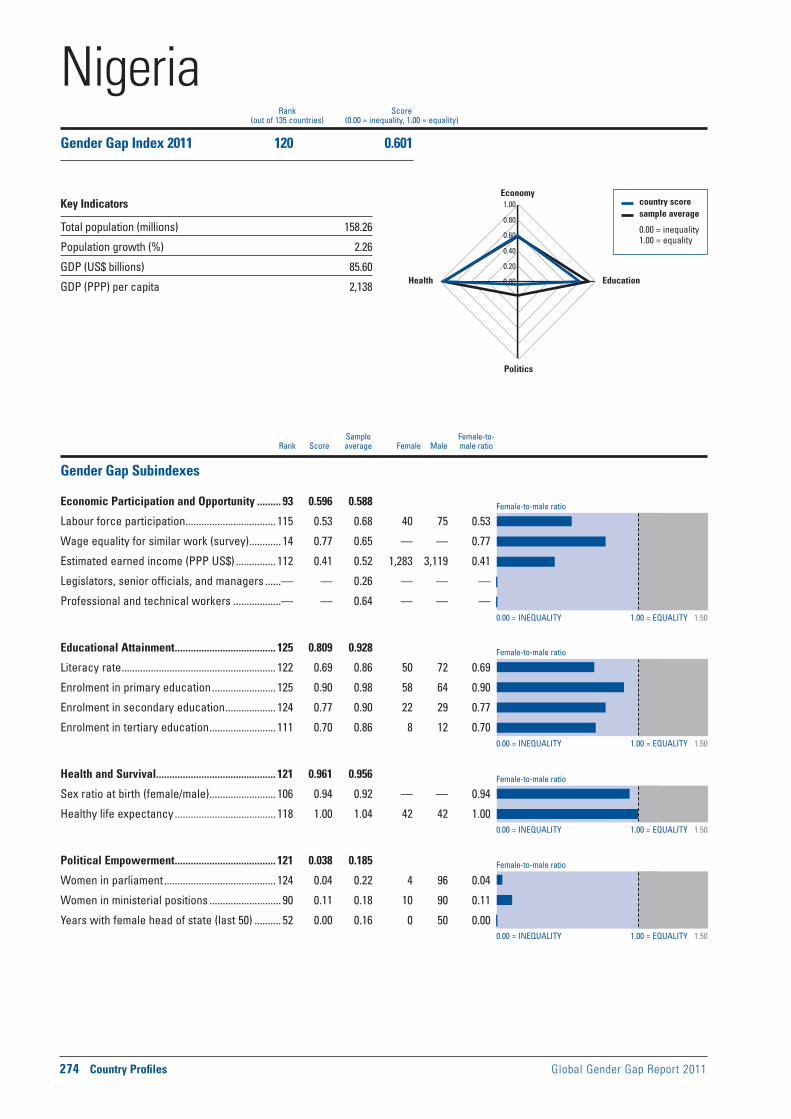
Female-to-male ratio
0.00 = INEQUALITY 1.00 = EQUALITY 1.50
0.00 = INEQUALITY 1.00 = EQUALITY 1.50
0.00 = INEQUALITY 1.00 = EQUALITY 1.50
0.00 = INEQUALITY 1.00 = EQUALITY 1.50
Female-to-male ratio
Female-to-male ratio
Female-to-male ratio
274 Country Profiles Global Gender Gap Report 2011
Sample Female-to- Rank Score average Female Male male ratio
country score sample average
0.00 = inequality 1.00 = equality
0.00
0.20
0.40
0.60
0.80
1.00Economy
Education
Politics
Health
Rank Score(out of 135 countries) (0.00 = inequality, 1.00 = equality)
Gender Gap Subindexes
Economic Participation and Opportunity ......... 93 0.596 0.588
Labour force participation .................................. 115 0.53 0.68 40 75 0.53
Wage equality for similar work (survey) ............ 14 0.77 0.65 — — 0.77
Estimated earned income (PPP US$) ............... 112 0.41 0.52 1,283 3,119 0.41
Legislators, senior officials, and managers ......— — 0.26 — — —
Professional and technical workers ..................— — 0.64 — — —
Educational Attainment ...................................... 125 0.809 0.928
Literacy rate .......................................................... 122 0.69 0.86 50 72 0.69
Enrolment in primary education ........................ 125 0.90 0.98 58 64 0.90
Enrolment in secondary education ................... 124 0.77 0.90 22 29 0.77
Enrolment in tertiary education ......................... 111 0.70 0.86 8 12 0.70
Health and Survival ............................................. 121 0.961 0.956
Sex ratio at birth (female/male) ......................... 106 0.94 0.92 — — 0.94
Healthy life expectancy ...................................... 118 1.00 1.04 42 42 1.00
Political Empowerment ...................................... 121 0.038 0.185
Women in parliament .......................................... 124 0.04 0.22 4 96 0.04
Women in ministerial positions ........................... 90 0.11 0.18 10 90 0.11
Years with female head of state (last 50) .......... 52 0.00 0.16 0 50 0.00
NigeriaGender Gap Index 2011 120 0.601
Key Indicators
Total population (millions) 158.26
Population growth (%) 2.26
GDP (US$ billions) 85.60
GDP (PPP) per capita 2,138
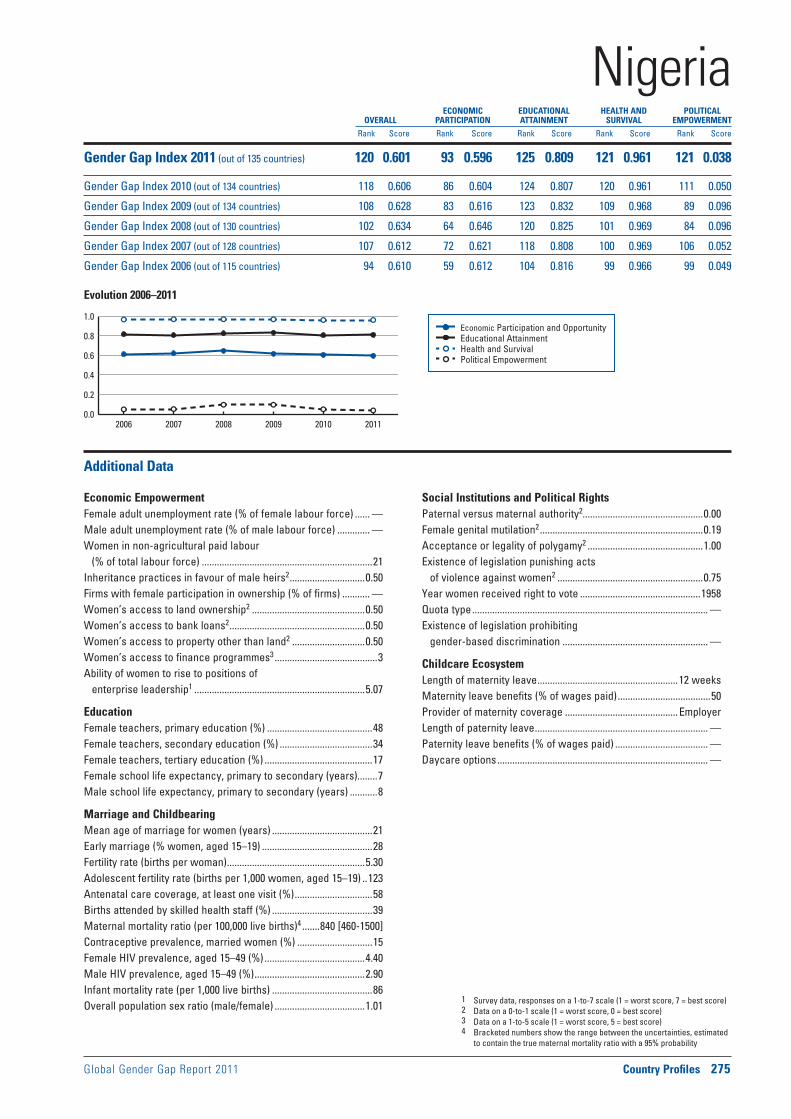
Global Gender Gap Report 2011 Country Profiles 275
Economic Participation and Opportunity Educational Attainment Health and Survival Political Empowerment
Evolution 2006–2011
1 Survey data, responses on a 1-to-7 scale (1 = worst score, 7 = best score)2 Data on a 0-to-1 scale (1 = worst score, 0 = best score)3 Data on a 1-to-5 scale (1 = worst score, 5 = best score)4 Bracketed numbers show the range between the uncertainties, estimated
to contain the true maternal mortality ratio with a 95% probability
ECONOMIC EDUCATIONAL HEALTH AND POLITICAL OVERALL PARTICIPATION ATTAINMENT SURVIVAL EMPOWERMENT
Rank Score Rank Score Rank Score Rank Score Rank Score
0.0
0.2
0.4
0.6
0.8
1.0
2006 2007 2008 2009 2010 2011
Additional Data
Economic EmpowermentFemale adult unemployment rate (% of female labour force) ...... —Male adult unemployment rate (% of male labour force) ............. —Women in non-agricultural paid labour
(% of total labour force) ....................................................................21Inheritance practices in favour of male heirs2 ..............................0.50Firms with female participation in ownership (% of firms) ........... —Women’s access to land ownership2 .............................................0.50Women’s access to bank loans2 ......................................................0.50Women’s access to property other than land2 .............................0.50Women’s access to finance programmes3 .........................................3Ability of women to rise to positions of
enterprise leadership1 ....................................................................5.07
EducationFemale teachers, primary education (%) ..........................................48Female teachers, secondary education (%) .....................................34Female teachers, tertiary education (%) ...........................................17Female school life expectancy, primary to secondary (years)........7Male school life expectancy, primary to secondary (years) ...........8
Marriage and ChildbearingMean age of marriage for women (years) ........................................21Early marriage (% women, aged 15–19) ............................................28Fertility rate (births per woman) .......................................................5.30Adolescent fertility rate (births per 1,000 women, aged 15–19) ..123Antenatal care coverage, at least one visit (%) ...............................58Births attended by skilled health staff (%) ........................................39Maternal mortality ratio (per 100,000 live births)4 .......840 [460-1500]Contraceptive prevalence, married women (%) ..............................15Female HIV prevalence, aged 15–49 (%) ........................................4.40Male HIV prevalence, aged 15–49 (%) ............................................2.90Infant mortality rate (per 1,000 live births) ........................................86Overall population sex ratio (male/female) ....................................1.01
Social Institutions and Political RightsPaternal versus maternal authority2................................................0.00Female genital mutilation2 .................................................................0.19Acceptance or legality of polygamy2 ..............................................1.00Existence of legislation punishing acts
of violence against women2 ..........................................................0.75Year women received right to vote ................................................1958Quota type .............................................................................................. —Existence of legislation prohibiting
gender-based discrimination .......................................................... —
Childcare EcosystemLength of maternity leave ........................................................12 weeksMaternity leave benefits (% of wages paid) .....................................50Provider of maternity coverage .............................................EmployerLength of paternity leave ..................................................................... —Paternity leave benefits (% of wages paid) ..................................... —Daycare options .................................................................................... —
NigeriaGender Gap Index 2011 (out of 135 countries) 120 0.601 93 0.596 125 0.809 121 0.961 121 0.038
Gender Gap Index 2010 (out of 134 countries) 118 0.606 86 0.604 124 0.807 120 0.961 111 0.050
Gender Gap Index 2009 (out of 134 countries) 108 0.628 83 0.616 123 0.832 109 0.968 89 0.096
Gender Gap Index 2008 (out of 130 countries) 102 0.634 64 0.646 120 0.825 101 0.969 84 0.096
Gender Gap Index 2007 (out of 128 countries) 107 0.612 72 0.621 118 0.808 100 0.969 106 0.052
Gender Gap Index 2006 (out of 115 countries) 94 0.610 59 0.612 104 0.816 99 0.966 99 0.049

Female-to-male ratio
0.00 = INEQUALITY 1.00 = EQUALITY 1.50
0.00 = INEQUALITY 1.00 = EQUALITY 1.50
0.00 = INEQUALITY 1.00 = EQUALITY 1.50
0.00 = INEQUALITY 1.00 = EQUALITY 1.50
Female-to-male ratio
Female-to-male ratio
Female-to-male ratio
276 Country Profiles Global Gender Gap Report 2011
Sample Female-to- Rank Score average Female Male male ratio
country score sample average
0.00 = inequality 1.00 = equality
0.00
0.20
0.40
0.60
0.80
1.00Economy
Education
Politics
Health
Rank Score(out of 135 countries) (0.00 = inequality, 1.00 = equality)
Gender Gap Subindexes
Economic Participation and Opportunity ........... 5 0.830 0.588
Labour force participation ...................................... 9 0.94 0.68 76 81 0.94
Wage equality for similar work (survey) ............ 25 0.75 0.65 — — 0.75
Estimated earned income (PPP US$) ................... 1 1.00 0.52 40,000 40,000 1.00
Legislators, senior officials, and managers ...... 49 0.46 0.26 31 69 0.46
Professional and technical workers .................... 1 1.00 0.64 51 49 1.06
Educational Attainment .......................................... 1 1.000 0.928
Literacy rate .............................................................. 1 1.00 0.86 99 99 1.00
Enrolment in primary education ............................ 1 1.00 0.98 99 99 1.00
Enrolment in secondary education ....................... 1 1.00 0.90 95 95 1.00
Enrolment in tertiary education ............................. 1 1.00 0.86 92 56 1.64
Health and Survival ............................................... 92 0.970 0.956
Sex ratio at birth (female/male) ............................. 1 0.94 0.92 — — 0.95
Healthy life expectancy ........................................ 98 1.03 1.04 74 72 1.03
Political Empowerment .......................................... 3 0.562 0.185
Women in parliament .............................................. 6 0.66 0.22 40 60 0.66
Women in ministerial positions ............................. 1 1.00 0.18 53 47 1.11
Years with female head of state (last 50) .......... 10 0.25 0.16 10 40 0.25
NorwayGender Gap Index 2011 2 0.840
Key Indicators
Total population (millions) 4.88
Population growth (%) 1.15
GDP (US$ billions) 196.84
GDP (PPP) per capita 46,948
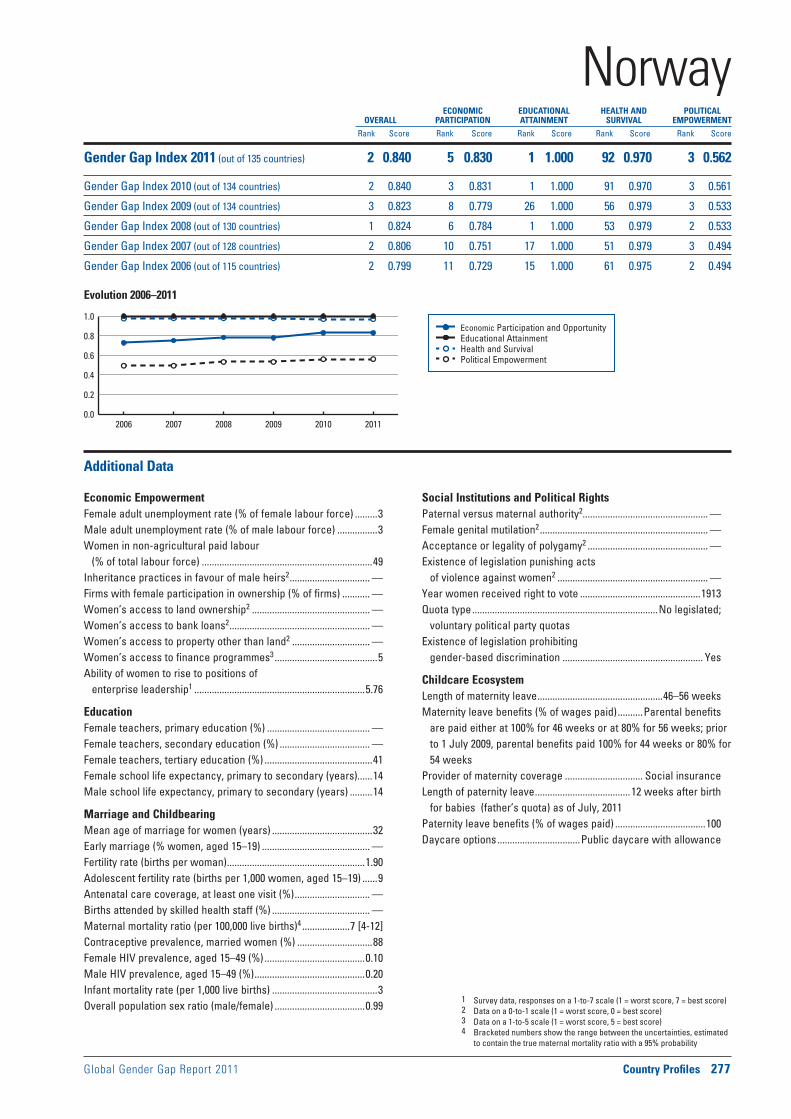
Global Gender Gap Report 2011 Country Profiles 277
Economic Participation and Opportunity Educational Attainment Health and Survival Political Empowerment
Evolution 2006–2011
1 Survey data, responses on a 1-to-7 scale (1 = worst score, 7 = best score)2 Data on a 0-to-1 scale (1 = worst score, 0 = best score)3 Data on a 1-to-5 scale (1 = worst score, 5 = best score)4 Bracketed numbers show the range between the uncertainties, estimated
to contain the true maternal mortality ratio with a 95% probability
ECONOMIC EDUCATIONAL HEALTH AND POLITICAL OVERALL PARTICIPATION ATTAINMENT SURVIVAL EMPOWERMENT
Rank Score Rank Score Rank Score Rank Score Rank Score
0.0
0.2
0.4
0.6
0.8
1.0
2006 2007 2008 2009 2010 2011
Additional Data
Economic EmpowermentFemale adult unemployment rate (% of female labour force) .........3Male adult unemployment rate (% of male labour force) ................3Women in non-agricultural paid labour
(% of total labour force) ....................................................................49Inheritance practices in favour of male heirs2 ................................ —Firms with female participation in ownership (% of firms) ........... —Women’s access to land ownership2 ............................................... —Women’s access to bank loans2 ........................................................ —Women’s access to property other than land2 ............................... —Women’s access to finance programmes3 .........................................5Ability of women to rise to positions of
enterprise leadership1 ....................................................................5.76
EducationFemale teachers, primary education (%) ......................................... —Female teachers, secondary education (%) .................................... —Female teachers, tertiary education (%) ...........................................41Female school life expectancy, primary to secondary (years)......14Male school life expectancy, primary to secondary (years) .........14
Marriage and ChildbearingMean age of marriage for women (years) ........................................32Early marriage (% women, aged 15–19) ........................................... —Fertility rate (births per woman) .......................................................1.90Adolescent fertility rate (births per 1,000 women, aged 15–19) ......9Antenatal care coverage, at least one visit (%) .............................. —Births attended by skilled health staff (%) ....................................... —Maternal mortality ratio (per 100,000 live births)4 ...................7 [4-12]Contraceptive prevalence, married women (%) ..............................88Female HIV prevalence, aged 15–49 (%) ........................................0.10Male HIV prevalence, aged 15–49 (%) ............................................0.20Infant mortality rate (per 1,000 live births) ..........................................3Overall population sex ratio (male/female) ....................................0.99
Social Institutions and Political RightsPaternal versus maternal authority2.................................................. —Female genital mutilation2 ................................................................... —Acceptance or legality of polygamy2 ................................................ —Existence of legislation punishing acts
of violence against women2 ............................................................ —Year women received right to vote ................................................1913Quota type ..........................................................................No legislated;
voluntary political party quotasExistence of legislation prohibiting
gender-based discrimination ........................................................ Yes
Childcare EcosystemLength of maternity leave ..................................................46–56 weeksMaternity leave benefits (% of wages paid) ..........Parental benefits
are paid either at 100% for 46 weeks or at 80% for 56 weeks; prior to 1 July 2009, parental benefits paid 100% for 44 weeks or 80% for 54 weeks
Provider of maternity coverage ............................... Social insuranceLength of paternity leave ......................................12 weeks after birth
for babies (father’s quota) as of July, 2011Paternity leave benefits (% of wages paid) ....................................100Daycare options .................................Public daycare with allowance
NorwayGender Gap Index 2011 (out of 135 countries) 2 0.840 5 0.830 1 1.000 92 0.970 3 0.562
Gender Gap Index 2010 (out of 134 countries) 2 0.840 3 0.831 1 1.000 91 0.970 3 0.561
Gender Gap Index 2009 (out of 134 countries) 3 0.823 8 0.779 26 1.000 56 0.979 3 0.533
Gender Gap Index 2008 (out of 130 countries) 1 0.824 6 0.784 1 1.000 53 0.979 2 0.533
Gender Gap Index 2007 (out of 128 countries) 2 0.806 10 0.751 17 1.000 51 0.979 3 0.494
Gender Gap Index 2006 (out of 115 countries) 2 0.799 11 0.729 15 1.000 61 0.975 2 0.494

Female-to-male ratio
0.00 = INEQUALITY 1.00 = EQUALITY 1.50
0.00 = INEQUALITY 1.00 = EQUALITY 1.50
0.00 = INEQUALITY 1.00 = EQUALITY 1.50
0.00 = INEQUALITY 1.00 = EQUALITY 1.50
Female-to-male ratio
Female-to-male ratio
Female-to-male ratio
278 Country Profiles Global Gender Gap Report 2011
Sample Female-to- Rank Score average Female Male male ratio
country score sample average
0.00 = inequality 1.00 = equality
0.00
0.20
0.40
0.60
0.80
1.00Economy
Education
Politics
Health
Rank Score(out of 135 countries) (0.00 = inequality, 1.00 = equality)
Gender Gap Subindexes
Economic Participation and Opportunity ....... 130 0.407 0.588
Labour force participation .................................. 128 0.34 0.68 27 79 0.34
Wage equality for similar work (survey) ............ 48 0.69 0.65 — — 0.69
Estimated earned income (PPP US$) ............... 128 0.23 0.52 8,866 38,285 0.23
Legislators, senior officials, and managers .... 113 0.10 0.26 9 91 0.10
Professional and technical workers ................ 100 0.49 0.64 33 67 0.49
Educational Attainment ........................................ 99 0.941 0.928
Literacy rate .......................................................... 102 0.90 0.86 81 90 0.90
Enrolment in primary education .......................... 98 0.98 0.98 77 78 0.98
Enrolment in secondary education ..................... 93 0.98 0.90 81 83 0.98
Enrolment in tertiary education ......................... 104 0.78 0.86 12 16 0.78
Health and Survival ............................................... 62 0.976 0.956
Sex ratio at birth (female/male) ............................. 1 0.94 0.92 — — 0.95
Healthy life expectancy ........................................ 72 1.05 1.04 67 64 1.05
Political Empowerment ...................................... 129 0.026 0.185
Women in parliament .......................................... 130 0.00 0.22 0 100 0.00
Women in ministerial positions ........................... 93 0.10 0.18 9 91 0.10
Years with female head of state (last 50) .......... 52 0.00 0.16 0 50 0.00
OmanGender Gap Index 2011 127 0.587
Key Indicators
Total population (millions) 2.91
Population growth (%) 2.08
GDP (US$ billions) 30.02
GDP (PPP) per capita 23,333

Global Gender Gap Report 2011 Country Profiles 279
Economic Participation and Opportunity Educational Attainment Health and Survival Political Empowerment
Evolution 2006–2011
1 Survey data, responses on a 1-to-7 scale (1 = worst score, 7 = best score)2 Data on a 0-to-1 scale (1 = worst score, 0 = best score)3 Data on a 1-to-5 scale (1 = worst score, 5 = best score)4 Bracketed numbers show the range between the uncertainties, estimated
to contain the true maternal mortality ratio with a 95% probability
ECONOMIC EDUCATIONAL HEALTH AND POLITICAL OVERALL PARTICIPATION ATTAINMENT SURVIVAL EMPOWERMENT
Rank Score Rank Score Rank Score Rank Score Rank Score
0.0
0.2
0.4
0.6
0.8
1.0
2006 2007 2008 2009 2010 2011
Additional Data
Economic EmpowermentFemale adult unemployment rate (% of female labour force) ...... —Male adult unemployment rate (% of male labour force) ............. —Women in non-agricultural paid labour
(% of total labour force) ....................................................................22Inheritance practices in favour of male heirs2 ..............................0.50Firms with female participation in ownership (% of firms) ............40Women’s access to land ownership2 .............................................0.50Women’s access to bank loans2 ......................................................0.00Women’s access to property other than land2 .............................0.50Women’s access to finance programmes3 .........................................3Ability of women to rise to positions of
enterprise leadership1 ....................................................................5.01
EducationFemale teachers, primary education (%) ..........................................64Female teachers, secondary education (%) .....................................58Female teachers, tertiary education (%) ...........................................30Female school life expectancy, primary to secondary (years)......10Male school life expectancy, primary to secondary (years) .........11
Marriage and ChildbearingMean age of marriage for women (years) ........................................25Early marriage (% women, aged 15–19) ............................................16Fertility rate (births per woman) .......................................................3.10Adolescent fertility rate (births per 1,000 women, aged 15–19) ......8Antenatal care coverage, at least one visit (%) .............................100Births attended by skilled health staff (%) ......................................100Maternal mortality ratio (per 100,000 live births)4 .................20 [9-45]Contraceptive prevalence, married women (%) ..............................24Female HIV prevalence, aged 15–49 (%) ......................................<0.10Male HIV prevalence, aged 15–49 (%) ............................................0.10Infant mortality rate (per 1,000 live births) ..........................................9Overall population sex ratio (male/female) ....................................1.29
Social Institutions and Political RightsPaternal versus maternal authority2................................................1.00Female genital mutilation2 ................................................................... —Acceptance or legality of polygamy2 ..............................................0.50Existence of legislation punishing acts
of violence against women2 ..........................................................0.75Year women received right to vote ......................................1994, 2003Quota type .............................................................................................. —Existence of legislation prohibiting
gender-based discrimination .......................................................... —
Childcare EcosystemLength of maternity leave .................................................................... —Maternity leave benefits (% of wages paid) .................................... —Provider of maternity coverage ......................................................... —Length of paternity leave ..................................................................... —Paternity leave benefits (% of wages paid) .................................... — Daycare options .................................................................................... —
OmanGender Gap Index 2011 (out of 135 countries) 127 0.587 130 0.407 99 0.941 62 0.976 129 0.026
Gender Gap Index 2010 (out of 134 countries) 122 0.595 129 0.400 90 0.978 61 0.976 128 0.026
Gender Gap Index 2009 (out of 134 countries) 123 0.594 128 0.406 93 0.974 95 0.971 128 0.025
Gender Gap Index 2008 (out of 130 countries) 118 0.596 122 0.415 89 0.974 90 0.971 123 0.025
Gender Gap Index 2007 (out of 128 countries) 119 0.590 125 0.384 83 0.971 89 0.971 119 0.035
Gender Gap Index 2006 (out of 115 countries) — — — — — — — — — —
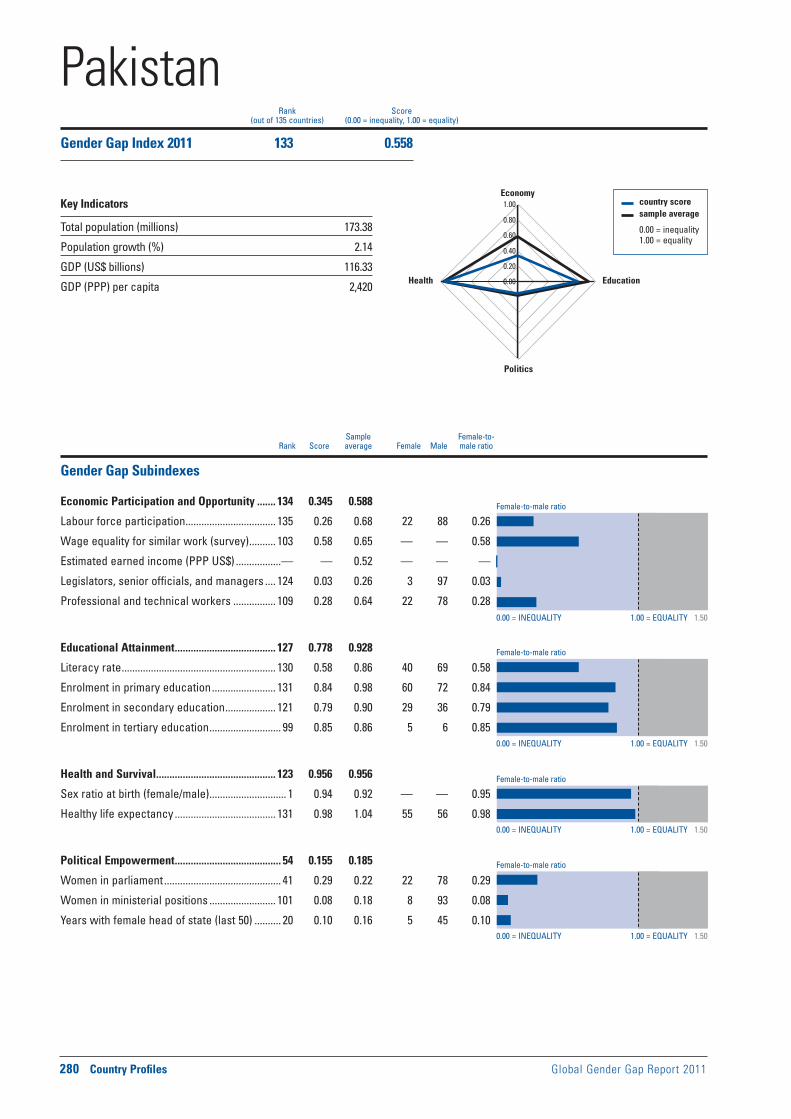
Female-to-male ratio
0.00 = INEQUALITY 1.00 = EQUALITY 1.50
0.00 = INEQUALITY 1.00 = EQUALITY 1.50
0.00 = INEQUALITY 1.00 = EQUALITY 1.50
0.00 = INEQUALITY 1.00 = EQUALITY 1.50
Female-to-male ratio
Female-to-male ratio
Female-to-male ratio
280 Country Profiles Global Gender Gap Report 2011
Sample Female-to- Rank Score average Female Male male ratio
country score sample average
0.00 = inequality 1.00 = equality
0.00
0.20
0.40
0.60
0.80
1.00Economy
Education
Politics
Health
Rank Score(out of 135 countries) (0.00 = inequality, 1.00 = equality)
Gender Gap Subindexes
Economic Participation and Opportunity ....... 134 0.345 0.588
Labour force participation .................................. 135 0.26 0.68 22 88 0.26
Wage equality for similar work (survey) .......... 103 0.58 0.65 — — 0.58
Estimated earned income (PPP US$) .................— — 0.52 — — —
Legislators, senior officials, and managers .... 124 0.03 0.26 3 97 0.03
Professional and technical workers ................ 109 0.28 0.64 22 78 0.28
Educational Attainment ...................................... 127 0.778 0.928
Literacy rate .......................................................... 130 0.58 0.86 40 69 0.58
Enrolment in primary education ........................ 131 0.84 0.98 60 72 0.84
Enrolment in secondary education ................... 121 0.79 0.90 29 36 0.79
Enrolment in tertiary education ........................... 99 0.85 0.86 5 6 0.85
Health and Survival ............................................. 123 0.956 0.956
Sex ratio at birth (female/male) ............................. 1 0.94 0.92 — — 0.95
Healthy life expectancy ...................................... 131 0.98 1.04 55 56 0.98
Political Empowerment ........................................ 54 0.155 0.185
Women in parliament ............................................ 41 0.29 0.22 22 78 0.29
Women in ministerial positions ......................... 101 0.08 0.18 8 93 0.08
Years with female head of state (last 50) .......... 20 0.10 0.16 5 45 0.10
PakistanGender Gap Index 2011 133 0.558
Key Indicators
Total population (millions) 173.38
Population growth (%) 2.14
GDP (US$ billions) 116.33
GDP (PPP) per capita 2,420

Global Gender Gap Report 2011 Country Profiles 281
Economic Participation and Opportunity Educational Attainment Health and Survival Political Empowerment
Evolution 2006–2011
1 Survey data, responses on a 1-to-7 scale (1 = worst score, 7 = best score)2 Data on a 0-to-1 scale (1 = worst score, 0 = best score)3 Data on a 1-to-5 scale (1 = worst score, 5 = best score)4 Bracketed numbers show the range between the uncertainties, estimated
to contain the true maternal mortality ratio with a 95% probability
ECONOMIC EDUCATIONAL HEALTH AND POLITICAL OVERALL PARTICIPATION ATTAINMENT SURVIVAL EMPOWERMENT
Rank Score Rank Score Rank Score Rank Score Rank Score
0.0
0.2
0.4
0.6
0.8
1.0
2006 2007 2008 2009 2010 2011
Additional Data
Economic EmpowermentFemale adult unemployment rate (% of female labour force) .........9Male adult unemployment rate (% of male labour force) ................4Women in non-agricultural paid labour
(% of total labour force) ....................................................................13Inheritance practices in favour of male heirs2 ..............................0.50Firms with female participation in ownership (% of firms) ........... —Women’s access to land ownership2 .............................................0.50Women’s access to bank loans2 ......................................................0.50Women’s access to property other than land2 .............................0.50Women’s access to finance programmes3 .........................................2Ability of women to rise to positions of
enterprise leadership1 ....................................................................4.10
EducationFemale teachers, primary education (%) ..........................................46Female teachers, secondary education (%) .....................................51Female teachers, tertiary education (%) ...........................................37Female school life expectancy, primary to secondary (years)........6Male school life expectancy, primary to secondary (years) ...........7
Marriage and ChildbearingMean age of marriage for women (years) ........................................23Early marriage (% women, aged 15–19) ............................................21Fertility rate (births per woman) .......................................................4.00Adolescent fertility rate (births per 1,000 women, aged 15–19) ....20Antenatal care coverage, at least one visit (%) ...............................61Births attended by skilled health staff (%) ........................................39Maternal mortality ratio (per 100,000 live births)4 .........260 [140-490]Contraceptive prevalence, married women (%) ..............................30Female HIV prevalence, aged 15–49 (%) ........................................0.10Male HIV prevalence, aged 15–49 (%) ............................................0.10Infant mortality rate (per 1,000 live births) ........................................70Overall population sex ratio (male/female) ....................................1.06
Social Institutions and Political RightsPaternal versus maternal authority2................................................1.00Female genital mutilation2 .................................................................0.05Acceptance or legality of polygamy2 ..............................................0.00Existence of legislation punishing acts
of violence against women2 ..........................................................0.50Year women received right to vote ................................................1956Quota type ...............................Reserved seats at single/lower houseExistence of legislation prohibiting
gender-based discrimination .......................................................... —
Childcare EcosystemLength of maternity leave ........................................................12 weeksMaternity leave benefits (% of wages paid) ..................................100;
coverage for employees of industrial, commercial, and other establishments with five or more workers; special systems for public-sector employees, members of the armed forces, police officers, local authority employees, and railway employees
Provider of maternity coverage ............................... Social insuranceLength of paternity leave ..................................................................... —Paternity leave benefits (% of wages paid) ..................................... —Daycare options .................................................................................... —
PakistanGender Gap Index 2011 (out of 135 countries) 133 0.558 134 0.345 127 0.778 123 0.956 54 0.155
Gender Gap Index 2010 (out of 134 countries) 132 0.546 133 0.306 127 0.770 122 0.956 52 0.155
Gender Gap Index 2009 (out of 134 countries) 132 0.546 132 0.340 128 0.747 128 0.950 55 0.146
Gender Gap Index 2008 (out of 130 countries) 127 0.555 128 0.372 123 0.751 123 0.950 50 0.146
Gender Gap Index 2007 (out of 128 countries) 126 0.551 126 0.372 123 0.734 121 0.950 43 0.148
Gender Gap Index 2006 (out of 115 countries) 112 0.543 112 0.369 110 0.706 112 0.951 37 0.148

Female-to-male ratio
0.00 = INEQUALITY 1.00 = EQUALITY 1.50
0.00 = INEQUALITY 1.00 = EQUALITY 1.50
0.00 = INEQUALITY 1.00 = EQUALITY 1.50
0.00 = INEQUALITY 1.00 = EQUALITY 1.50
Female-to-male ratio
Female-to-male ratio
Female-to-male ratio
282 Country Profiles Global Gender Gap Report 2011
Sample Female-to- Rank Score average Female Male male ratio
country score sample average
0.00 = inequality 1.00 = equality
0.00
0.20
0.40
0.60
0.80
1.00Economy
Education
Politics
Health
Rank Score(out of 135 countries) (0.00 = inequality, 1.00 = equality)
Gender Gap Subindexes
Economic Participation and Opportunity ......... 51 0.680 0.588
Labour force participation .................................... 97 0.62 0.68 53 85 0.62
Wage equality for similar work (survey) .......... 106 0.57 0.65 — — 0.57
Estimated earned income (PPP US$) ................. 81 0.55 0.52 9,199 16,852 0.55
Legislators, senior officials, and managers ........ 5 0.93 0.26 48 52 0.93
Professional and technical workers .................... 1 1.00 0.64 53 47 1.13
Educational Attainment ........................................ 54 0.994 0.928
Literacy rate ............................................................ 65 0.99 0.86 93 94 0.99
Enrolment in primary education .......................... 86 0.99 0.98 97 97 0.99
Enrolment in secondary education ....................... 1 1.00 0.90 69 63 1.10
Enrolment in tertiary education ............................. 1 1.00 0.86 55 36 1.54
Health and Survival ............................................... 65 0.975 0.956
Sex ratio at birth (female/male) ............................. 1 0.94 0.92 — — 0.96
Healthy life expectancy ........................................ 74 1.05 1.04 68 65 1.05
Political Empowerment ........................................ 47 0.168 0.185
Women in parliament .......................................... 112 0.09 0.22 9 92 0.09
Women in ministerial positions ........................... 32 0.36 0.18 27 73 0.36
Years with female head of state (last 50) .......... 18 0.11 0.16 5 45 0.11
PanamaGender Gap Index 2011 40 0.704
Key Indicators
Total population (millions) 3.51
Population growth (%) 1.57
GDP (US$ billions) 21.32
GDP (PPP) per capita 12,571

Global Gender Gap Report 2011 Country Profiles 283
Economic Participation and Opportunity Educational Attainment Health and Survival Political Empowerment
Evolution 2006–2011
1 Survey data, responses on a 1-to-7 scale (1 = worst score, 7 = best score)2 Data on a 0-to-1 scale (1 = worst score, 0 = best score)3 Data on a 1-to-5 scale (1 = worst score, 5 = best score)4 Bracketed numbers show the range between the uncertainties, estimated
to contain the true maternal mortality ratio with a 95% probability
ECONOMIC EDUCATIONAL HEALTH AND POLITICAL OVERALL PARTICIPATION ATTAINMENT SURVIVAL EMPOWERMENT
Rank Score Rank Score Rank Score Rank Score Rank Score
0.0
0.2
0.4
0.6
0.8
1.0
2006 2007 2008 2009 2010 2011
Additional Data
Economic EmpowermentFemale adult unemployment rate (% of female labour force) .........8Male adult unemployment rate (% of male labour force) ................5Women in non-agricultural paid labour
(% of total labour force) ....................................................................42Inheritance practices in favour of male heirs2 ................................ —Firms with female participation in ownership (% of firms) ............42Women’s access to land ownership2 .............................................0.00Women’s access to bank loans2 ......................................................0.00Women’s access to property other than land2 .............................0.00Women’s access to finance programmes3 .........................................1Ability of women to rise to positions of
enterprise leadership1 ....................................................................4.61
EducationFemale teachers, primary education (%) ..........................................76Female teachers, secondary education (%) .....................................59Female teachers, tertiary education (%) ...........................................46Female school life expectancy, primary to secondary (years)......11Male school life expectancy, primary to secondary (years) .........11
Marriage and ChildbearingMean age of marriage for women (years) ........................................22Early marriage (% women, aged 15–19) ............................................22Fertility rate (births per woman) .......................................................2.60Adolescent fertility rate (births per 1,000 women, aged 15–19) ....83Antenatal care coverage, at least one visit (%) ...............................96Births attended by skilled health staff (%) ........................................89Maternal mortality ratio (per 100,000 live births)4 ...............71 [58-84]Contraceptive prevalence, married women (%) ............................. —Female HIV prevalence, aged 15–49 (%) ........................................0.60Male HIV prevalence, aged 15–49 (%) ............................................1.10Infant mortality rate (per 1,000 live births) ........................................16Overall population sex ratio (male/female) ....................................1.02
Social Institutions and Political RightsPaternal versus maternal authority2................................................0.00Female genital mutilation2 .................................................................0.05Acceptance or legality of polygamy2 ..............................................0.00Existence of legislation punishing acts
of violence against women2 ..........................................................0.17Year women received right to vote ......................................1941, 1946Quota type ................................................Legislated candidate quotasExistence of legislation prohibiting
gender-based discrimination .......................................................... —
Childcare EcosystemLength of maternity leave ........................................................14 weeksMaternity leave benefits (% of wages paid) ..........100; if the worker
is not entitled to social security benefits, the employer shall cover the full cost of benefit
Provider of maternity coverage ..................... Social Insurance FundLength of paternity leave ..................................................................... —Paternity leave benefits (% of wages paid) ..................................... —Daycare options .................................................................................... —
PanamaGender Gap Index 2011 (out of 135 countries) 40 0.704 51 0.680 54 0.994 65 0.975 47 0.168
Gender Gap Index 2010 (out of 134 countries) 39 0.707 47 0.693 55 0.993 65 0.975 48 0.168
Gender Gap Index 2009 (out of 134 countries) 43 0.702 51 0.683 52 0.995 1 0.980 52 0.152
Gender Gap Index 2008 (out of 130 countries) 34 0.710 49 0.678 54 0.995 1 0.980 38 0.185
Gender Gap Index 2007 (out of 128 countries) 38 0.695 54 0.655 40 0.994 1 0.980 40 0.153
Gender Gap Index 2006 (out of 115 countries) 31 0.693 44 0.647 35 0.995 47 0.979 35 0.153

Female-to-male ratio
0.00 = INEQUALITY 1.00 = EQUALITY 1.50
0.00 = INEQUALITY 1.00 = EQUALITY 1.50
0.00 = INEQUALITY 1.00 = EQUALITY 1.50
0.00 = INEQUALITY 1.00 = EQUALITY 1.50
Female-to-male ratio
Female-to-male ratio
Female-to-male ratio
284 Country Profiles Global Gender Gap Report 2011
Sample Female-to- Rank Score average Female Male male ratio
country score sample average
0.00 = inequality 1.00 = equality
0.00
0.20
0.40
0.60
0.80
1.00Economy
Education
Politics
Health
Rank Score(out of 135 countries) (0.00 = inequality, 1.00 = equality)
Gender Gap Subindexes
Economic Participation and Opportunity ......... 69 0.644 0.588
Labour force participation .................................... 90 0.67 0.68 59 88 0.67
Wage equality for similar work (survey) .......... 107 0.57 0.65 — — 0.57
Estimated earned income (PPP US$) ................. 55 0.61 0.52 3,430 5,594 0.61
Legislators, senior officials, and managers ...... 36 0.52 0.26 34 66 0.52
Professional and technical workers .................... 1 1.00 0.64 50 50 1.02
Educational Attainment ........................................ 46 0.995 0.928
Literacy rate ............................................................ 74 0.98 0.86 93 96 0.98
Enrolment in primary education .......................... 68 1.00 0.98 85 85 1.00
Enrolment in secondary education ....................... 1 1.00 0.90 62 58 1.07
Enrolment in tertiary education ............................. 1 1.00 0.86 43 30 1.43
Health and Survival ............................................... 58 0.976 0.956
Sex ratio at birth (female/male) ............................. 1 0.94 0.92 — — 0.95
Healthy life expectancy ........................................ 69 1.05 1.04 66 63 1.05
Political Empowerment ........................................ 73 0.113 0.185
Women in parliament ............................................ 91 0.14 0.22 13 88 0.14
Women in ministerial positions ........................... 46 0.28 0.18 22 78 0.28
Years with female head of state (last 50) .......... 52 0.00 0.16 0 50 0.00
ParaguayGender Gap Index 2011 67 0.682
Key Indicators
Total population (millions) 6.46
Population growth (%) 1.73
GDP (US$ billions) 10.48
GDP (PPP) per capita 4,653

Global Gender Gap Report 2011 Country Profiles 285
Economic Participation and Opportunity Educational Attainment Health and Survival Political Empowerment
Evolution 2006–2011
1 Survey data, responses on a 1-to-7 scale (1 = worst score, 7 = best score)2 Data on a 0-to-1 scale (1 = worst score, 0 = best score)3 Data on a 1-to-5 scale (1 = worst score, 5 = best score)4 Bracketed numbers show the range between the uncertainties, estimated
to contain the true maternal mortality ratio with a 95% probability
ECONOMIC EDUCATIONAL HEALTH AND POLITICAL OVERALL PARTICIPATION ATTAINMENT SURVIVAL EMPOWERMENT
Rank Score Rank Score Rank Score Rank Score Rank Score
0.0
0.2
0.4
0.6
0.8
1.0
2006 2007 2008 2009 2010 2011
Additional Data
Economic EmpowermentFemale adult unemployment rate (% of female labour force) .........7Male adult unemployment rate (% of male labour force) ................4Women in non-agricultural paid labour
(% of total labour force) ....................................................................40Inheritance practices in favour of male heirs2 ..............................0.00Firms with female participation in ownership (% of firms) ..............9Women’s access to land ownership2 .............................................0.00Women’s access to bank loans2 ......................................................0.00Women’s access to property other than land2 .............................0.00Women’s access to finance programmes3 .........................................2Ability of women to rise to positions of
enterprise leadership1 ....................................................................4.15
EducationFemale teachers, primary education (%) ..........................................71Female teachers, secondary education (%) .....................................62Female teachers, tertiary education (%) .......................................... —Female school life expectancy, primary to secondary (years)......10Male school life expectancy, primary to secondary (years) .........10
Marriage and ChildbearingMean age of marriage for women (years) ........................................23Early marriage (% women, aged 15–19) ............................................17Fertility rate (births per woman) .......................................................3.10Adolescent fertility rate (births per 1,000 women, aged 15–19) ....65Antenatal care coverage, at least one visit (%) ...............................96Births attended by skilled health staff (%) ........................................97Maternal mortality ratio (per 100,000 live births)4 .............95 [57-150]Contraceptive prevalence, married women (%) ..............................79Female HIV prevalence, aged 15–49 (%) ........................................0.20Male HIV prevalence, aged 15–49 (%) ............................................0.40Infant mortality rate (per 1,000 live births) ........................................19Overall population sex ratio (male/female) ....................................1.02
Social Institutions and Political RightsPaternal versus maternal authority2................................................0.00Female genital mutilation2 .................................................................0.00Acceptance or legality of polygamy2 ..............................................0.00Existence of legislation punishing acts
of violence against women2 ..........................................................0.17Year women received right to vote ................................................1961Quota type ............................................................. Legislated candidate
quotas; voluntary political party quotasExistence of legislation prohibiting
gender-based discrimination .......................................................... —
Childcare EcosystemLength of maternity leave ........................................................12 weeksMaternity leave benefits (% of wages paid) ..50; 9 weeks coverageProvider of maternity coverage ..................Social insurance systemLength of paternity leave ..................................................................... —Paternity leave benefits (% of wages paid) .................................... — Daycare options .................................................................................... —
ParaguayGender Gap Index 2011 (out of 135 countries) 67 0.682 69 0.644 46 0.995 58 0.976 73 0.113
Gender Gap Index 2010 (out of 134 countries) 69 0.680 71 0.637 45 0.996 57 0.976 75 0.113
Gender Gap Index 2009 (out of 134 countries) 66 0.687 58 0.669 40 0.997 1 0.980 85 0.102
Gender Gap Index 2008 (out of 130 countries) 100 0.638 111 0.483 38 0.997 1 0.980 89 0.092
Gender Gap Index 2007 (out of 128 countries) 69 0.666 83 0.594 95 0.945 1 0.980 45 0.144
Gender Gap Index 2006 (out of 115 countries) 64 0.656 80 0.554 83 0.944 1 0.980 38 0.144

Female-to-male ratio
0.00 = INEQUALITY 1.00 = EQUALITY 1.50
0.00 = INEQUALITY 1.00 = EQUALITY 1.50
0.00 = INEQUALITY 1.00 = EQUALITY 1.50
0.00 = INEQUALITY 1.00 = EQUALITY 1.50
Female-to-male ratio
Female-to-male ratio
Female-to-male ratio
286 Country Profiles Global Gender Gap Report 2011
Sample Female-to- Rank Score average Female Male male ratio
country score sample average
0.00 = inequality 1.00 = equality
0.00
0.20
0.40
0.60
0.80
1.00Economy
Education
Politics
Health
Rank Score(out of 135 countries) (0.00 = inequality, 1.00 = equality)
Gender Gap Subindexes
Economic Participation and Opportunity ......... 85 0.611 0.588
Labour force participation .................................... 61 0.80 0.68 62 78 0.80
Wage equality for similar work (survey) ............ 99 0.59 0.65 — — 0.59
Estimated earned income (PPP US$) ................. 61 0.59 0.52 6,399 10,850 0.59
Legislators, senior officials, and managers ...... 87 0.24 0.26 19 81 0.24
Professional and technical workers .................. 77 0.84 0.64 46 54 0.84
Educational Attainment ........................................ 88 0.980 0.928
Literacy rate .......................................................... 103 0.89 0.86 85 95 0.89
Enrolment in primary education ............................ 1 1.00 0.98 95 94 1.00
Enrolment in secondary education ....................... 1 1.00 0.90 75 75 1.00
Enrolment in tertiary education ............................. 1 1.00 0.86 36 33 1.06
Health and Survival ............................................. 108 0.966 0.956
Sex ratio at birth (female/male) ............................. 1 0.94 0.92 — — 0.96
Healthy life expectancy ...................................... 116 1.02 1.04 67 66 1.02
Political Empowerment ........................................ 50 0.162 0.185
Women in parliament ............................................ 47 0.27 0.22 22 79 0.27
Women in ministerial positions ........................... 44 0.29 0.18 22 78 0.29
Years with female head of state (last 50) .......... 41 0.02 0.16 1 49 0.02
PeruGender Gap Index 2011 73 0.680
Key Indicators
Total population (millions) 29.50
Population growth (%) 1.13
GDP (US$ billions) 92.51
GDP (PPP) per capita 8,437

Global Gender Gap Report 2011 Country Profiles 287
Economic Participation and Opportunity Educational Attainment Health and Survival Political Empowerment
Evolution 2006–2011
1 Survey data, responses on a 1-to-7 scale (1 = worst score, 7 = best score)2 Data on a 0-to-1 scale (1 = worst score, 0 = best score)3 Data on a 1-to-5 scale (1 = worst score, 5 = best score)4 Bracketed numbers show the range between the uncertainties, estimated
to contain the true maternal mortality ratio with a 95% probability
ECONOMIC EDUCATIONAL HEALTH AND POLITICAL OVERALL PARTICIPATION ATTAINMENT SURVIVAL EMPOWERMENT
Rank Score Rank Score Rank Score Rank Score Rank Score
0.0
0.2
0.4
0.6
0.8
1.0
2006 2007 2008 2009 2010 2011
Additional Data
Economic EmpowermentFemale adult unemployment rate (% of female labour force) .........8Male adult unemployment rate (% of male labour force) ................5Women in non-agricultural paid labour
(% of total labour force) ....................................................................38Inheritance practices in favour of male heirs2 ..............................0.00Firms with female participation in ownership (% of firms) ............43Women’s access to land ownership2 .............................................0.00Women’s access to bank loans2 ......................................................0.00Women’s access to property other than land2 .............................0.00Women’s access to finance programmes3 .........................................2Ability of women to rise to positions of
enterprise leadership1 ....................................................................4.30
EducationFemale teachers, primary education (%) ..........................................65Female teachers, secondary education (%) .....................................44Female teachers, tertiary education (%) .......................................... —Female school life expectancy, primary to secondary (years)......11Male school life expectancy, primary to secondary (years) .........11
Marriage and ChildbearingMean age of marriage for women (years) ........................................25Early marriage (% women, aged 15–19) ............................................13Fertility rate (births per woman) .......................................................2.60Adolescent fertility rate (births per 1,000 women, aged 15–19) ....59Antenatal care coverage, at least one visit (%) ...............................94Births attended by skilled health staff (%) ........................................83Maternal mortality ratio (per 100,000 live births)4 .............98 [62-160]Contraceptive prevalence, married women (%) ..............................71Female HIV prevalence, aged 15–49 (%) ........................................0.20Male HIV prevalence, aged 15–49 (%) ............................................0.60Infant mortality rate (per 1,000 live births) ........................................19Overall population sex ratio (male/female) ....................................1.00
Social Institutions and Political RightsPaternal versus maternal authority2................................................0.00Female genital mutilation2 .................................................................0.05Acceptance or legality of polygamy2 ..............................................0.00Existence of legislation punishing acts
of violence against women2 ..........................................................0.42Year women received right to vote ................................................1955Quota type ................................................Legislated candidate quotasExistence of legislation prohibiting
gender-based discrimination .......................................................... —
Childcare EcosystemLength of maternity leave ........................................................... 90 daysMaternity leave benefits (% of wages paid) ....... 100; up to a ceilingProvider of maternity coverage ..................... Social security systemLength of paternity leave ..................................................................... —Paternity leave benefits (% of wages paid) ..................................... —Daycare options .................................................................................... —
PeruGender Gap Index 2011 (out of 135 countries) 73 0.680 85 0.611 88 0.980 108 0.966 50 0.162
Gender Gap Index 2010 (out of 134 countries) 60 0.690 81 0.620 89 0.980 107 0.966 37 0.193
Gender Gap Index 2009 (out of 134 countries) 44 0.702 76 0.635 89 0.978 91 0.971 33 0.225
Gender Gap Index 2008 (out of 130 countries) 48 0.696 83 0.596 84 0.981 86 0.971 29 0.235
Gender Gap Index 2007 (out of 128 countries) 75 0.662 103 0.537 80 0.976 85 0.971 34 0.165
Gender Gap Index 2006 (out of 115 countries) 60 0.662 86 0.531 71 0.976 58 0.976 31 0.165

Female-to-male ratio
0.00 = INEQUALITY 1.00 = EQUALITY 1.50
0.00 = INEQUALITY 1.00 = EQUALITY 1.50
0.00 = INEQUALITY 1.00 = EQUALITY 1.50
0.00 = INEQUALITY 1.00 = EQUALITY 1.50
Female-to-male ratio
Female-to-male ratio
Female-to-male ratio
288 Country Profiles Global Gender Gap Report 2011
Sample Female-to- Rank Score average Female Male male ratio
country score sample average
0.00 = inequality 1.00 = equality
0.00
0.20
0.40
0.60
0.80
1.00Economy
Education
Politics
Health
Rank Score(out of 135 countries) (0.00 = inequality, 1.00 = equality)
Gender Gap Subindexes
Economic Participation and Opportunity ......... 15 0.763 0.588
Labour force participation .................................... 94 0.63 0.68 51 80 0.63
Wage equality for similar work (survey) ............ 23 0.76 0.65 — — 0.76
Estimated earned income (PPP US$) ................. 60 0.60 0.52 2,642 4,429 0.60
Legislators, senior officials, and managers ........ 1 1.00 0.26 55 45 1.21
Professional and technical workers .................... 1 1.00 0.64 62 38 1.64
Educational Attainment .......................................... 1 1.000 0.928
Literacy rate .............................................................. 1 1.00 0.86 96 95 1.01
Enrolment in primary education ............................ 1 1.00 0.98 93 91 1.02
Enrolment in secondary education ....................... 1 1.00 0.90 66 55 1.19
Enrolment in tertiary education ............................. 1 1.00 0.86 32 26 1.24
Health and Survival ................................................. 1 0.980 0.956
Sex ratio at birth (female/male) ............................. 1 0.94 0.92 — — 0.95
Healthy life expectancy .......................................... 1 1.06 1.04 64 59 1.08
Political Empowerment ........................................ 16 0.331 0.185
Women in parliament ............................................ 43 0.28 0.22 22 78 0.28
Women in ministerial positions ........................... 71 0.16 0.18 14 86 0.16
Years with female head of state (last 50) ............ 6 0.46 0.16 16 34 0.46
PhilippinesGender Gap Index 2011 8 0.769
Key Indicators
Total population (millions) 93.62
Population growth (%) 1.76
GDP (US$ billions) 129.02
GDP (PPP) per capita 3,547

Global Gender Gap Report 2011 Country Profiles 289
Economic Participation and Opportunity Educational Attainment Health and Survival Political Empowerment
Evolution 2006–2011
1 Survey data, responses on a 1-to-7 scale (1 = worst score, 7 = best score)2 Data on a 0-to-1 scale (1 = worst score, 0 = best score)3 Data on a 1-to-5 scale (1 = worst score, 5 = best score)4 Bracketed numbers show the range between the uncertainties, estimated
to contain the true maternal mortality ratio with a 95% probability
ECONOMIC EDUCATIONAL HEALTH AND POLITICAL OVERALL PARTICIPATION ATTAINMENT SURVIVAL EMPOWERMENT
Rank Score Rank Score Rank Score Rank Score Rank Score
0.0
0.2
0.4
0.6
0.8
1.0
2006 2007 2008 2009 2010 2011
Additional Data
Economic EmpowermentFemale adult unemployment rate (% of female labour force) .........7Male adult unemployment rate (% of male labour force) ................7Women in non-agricultural paid labour
(% of total labour force) ....................................................................42Inheritance practices in favour of male heirs2 ..............................0.00Firms with female participation in ownership (% of firms) ........... —Women’s access to land ownership2 .............................................0.00Women’s access to bank loans2 ......................................................0.50Women’s access to property other than land2 .............................0.00Women’s access to finance programmes3 .........................................2Ability of women to rise to positions of
enterprise leadership1 ....................................................................5.64
EducationFemale teachers, primary education (%) ..........................................87Female teachers, secondary education (%) .....................................76Female teachers, tertiary education (%) ...........................................56Female school life expectancy, primary to secondary (years)......10Male school life expectancy, primary to secondary (years) .........10
Marriage and ChildbearingMean age of marriage for women (years) ........................................23Early marriage (% women, aged 15–19) ............................................10Fertility rate (births per woman) .......................................................3.10Adolescent fertility rate (births per 1,000 women, aged 15–19) ....53Antenatal care coverage, at least one visit (%) ...............................91Births attended by skilled health staff (%) ........................................62Maternal mortality ratio (per 100,000 live births)4 .............94 [61-140]Contraceptive prevalence, married women (%) ..............................51Female HIV prevalence, aged 15–49 (%) ......................................<0.10Male HIV prevalence, aged 15–49 (%) ..........................................<0.10Infant mortality rate (per 1,000 live births) ........................................26Overall population sex ratio (male/female) ....................................1.01
Social Institutions and Political RightsPaternal versus maternal authority2................................................0.00Female genital mutilation2 .................................................................0.00Acceptance or legality of polygamy2 ..............................................0.00Existence of legislation punishing acts
of violence against women2 ..........................................................0.17Year women received right to vote ................................................1937Quota type ..........................................................................No legislated;
voluntary political party quotasExistence of legislation prohibiting
gender-based discrimination ........................................................ Yes
Childcare EcosystemLength of maternity leave ........................................................... 60 daysMaternity leave benefits (% of wages paid) ...................................100Provider of maternity coverage ...................................Social securityLength of paternity leave ................................................... 1 week after
legitimate wife’s childbirthPaternity leave benefits (% of wages paid) ....................................100Daycare options ........................... Public daycare without allowance
PhilippinesGender Gap Index 2011 (out of 135 countries) 8 0.769 15 0.763 1 1.000 1 0.980 16 0.331
Gender Gap Index 2010 (out of 134 countries) 9 0.765 13 0.761 1 1.000 1 0.980 17 0.321
Gender Gap Index 2009 (out of 134 countries) 9 0.758 11 0.760 1 1.000 1 0.980 19 0.291
Gender Gap Index 2008 (out of 130 countries) 6 0.757 8 0.773 1 1.000 1 0.980 22 0.274
Gender Gap Index 2007 (out of 128 countries) 6 0.763 2 0.789 1 1.000 1 0.980 14 0.283
Gender Gap Index 2006 (out of 115 countries) 6 0.752 4 0.757 1 1.000 1 0.980 16 0.269

Female-to-male ratio
0.00 = INEQUALITY 1.00 = EQUALITY 1.50
0.00 = INEQUALITY 1.00 = EQUALITY 1.50
0.00 = INEQUALITY 1.00 = EQUALITY 1.50
0.00 = INEQUALITY 1.00 = EQUALITY 1.50
Female-to-male ratio
Female-to-male ratio
Female-to-male ratio
290 Country Profiles Global Gender Gap Report 2011
Sample Female-to- Rank Score average Female Male male ratio
country score sample average
0.00 = inequality 1.00 = equality
0.00
0.20
0.40
0.60
0.80
1.00Economy
Education
Politics
Health
Rank Score(out of 135 countries) (0.00 = inequality, 1.00 = equality)
Gender Gap Subindexes
Economic Participation and Opportunity ......... 65 0.653 0.588
Labour force participation .................................... 57 0.81 0.68 56 70 0.81
Wage equality for similar work (survey) .......... 123 0.52 0.65 — — 0.52
Estimated earned income (PPP US$) ................. 65 0.57 0.52 13,886 24,292 0.57
Legislators, senior officials, and managers ...... 28 0.57 0.26 36 64 0.57
Professional and technical workers .................... 1 1.00 0.64 60 40 1.52
Educational Attainment ........................................ 28 0.999 0.928
Literacy rate ............................................................ 54 1.00 0.86 99 100 1.00
Enrolment in primary education ............................ 1 1.00 0.98 96 95 1.00
Enrolment in secondary education ....................... 1 1.00 0.90 94 92 1.02
Enrolment in tertiary education ............................. 1 1.00 0.86 84 59 1.43
Health and Survival ............................................... 48 0.979 0.956
Sex ratio at birth (female/male) ......................... 114 0.94 0.92 — — 0.94
Healthy life expectancy .......................................... 1 1.06 1.04 70 64 1.09
Political Empowerment ........................................ 40 0.184 0.185
Women in parliament ............................................ 55 0.25 0.22 20 80 0.25
Women in ministerial positions ........................... 28 0.38 0.18 28 72 0.38
Years with female head of state (last 50) .......... 33 0.03 0.16 1 49 0.03
PolandGender Gap Index 2011 42 0.704
Key Indicators
Total population (millions) 38.18
Population growth (%) 0.07
GDP (US$ billions) 250.89
GDP (PPP) per capita 17,341
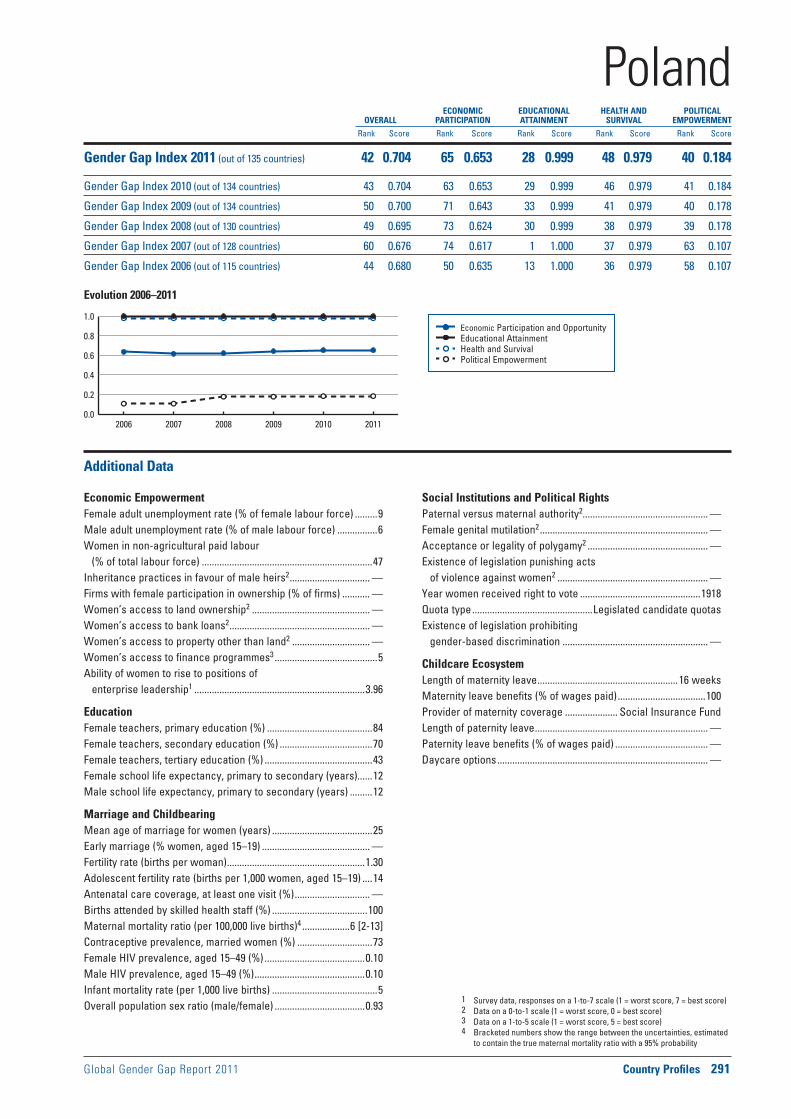
Global Gender Gap Report 2011 Country Profiles 291
Economic Participation and Opportunity Educational Attainment Health and Survival Political Empowerment
Evolution 2006–2011
1 Survey data, responses on a 1-to-7 scale (1 = worst score, 7 = best score)2 Data on a 0-to-1 scale (1 = worst score, 0 = best score)3 Data on a 1-to-5 scale (1 = worst score, 5 = best score)4 Bracketed numbers show the range between the uncertainties, estimated
to contain the true maternal mortality ratio with a 95% probability
ECONOMIC EDUCATIONAL HEALTH AND POLITICAL OVERALL PARTICIPATION ATTAINMENT SURVIVAL EMPOWERMENT
Rank Score Rank Score Rank Score Rank Score Rank Score
0.0
0.2
0.4
0.6
0.8
1.0
2006 2007 2008 2009 2010 2011
Additional Data
Economic EmpowermentFemale adult unemployment rate (% of female labour force) .........9Male adult unemployment rate (% of male labour force) ................6Women in non-agricultural paid labour
(% of total labour force) ....................................................................47Inheritance practices in favour of male heirs2 ................................ —Firms with female participation in ownership (% of firms) ........... —Women’s access to land ownership2 ............................................... —Women’s access to bank loans2 ........................................................ —Women’s access to property other than land2 ............................... —Women’s access to finance programmes3 .........................................5Ability of women to rise to positions of
enterprise leadership1 ....................................................................3.96
EducationFemale teachers, primary education (%) ..........................................84Female teachers, secondary education (%) .....................................70Female teachers, tertiary education (%) ...........................................43Female school life expectancy, primary to secondary (years)......12Male school life expectancy, primary to secondary (years) .........12
Marriage and ChildbearingMean age of marriage for women (years) ........................................25Early marriage (% women, aged 15–19) ........................................... —Fertility rate (births per woman) .......................................................1.30Adolescent fertility rate (births per 1,000 women, aged 15–19) ....14Antenatal care coverage, at least one visit (%) .............................. —Births attended by skilled health staff (%) ......................................100Maternal mortality ratio (per 100,000 live births)4 ...................6 [2-13]Contraceptive prevalence, married women (%) ..............................73Female HIV prevalence, aged 15–49 (%) ........................................0.10Male HIV prevalence, aged 15–49 (%) ............................................0.10Infant mortality rate (per 1,000 live births) ..........................................5Overall population sex ratio (male/female) ....................................0.93
Social Institutions and Political RightsPaternal versus maternal authority2.................................................. —Female genital mutilation2 ................................................................... —Acceptance or legality of polygamy2 ................................................ —Existence of legislation punishing acts
of violence against women2 ............................................................ —Year women received right to vote ................................................1918Quota type ................................................Legislated candidate quotasExistence of legislation prohibiting
gender-based discrimination .......................................................... —
Childcare EcosystemLength of maternity leave ........................................................16 weeksMaternity leave benefits (% of wages paid) ...................................100Provider of maternity coverage ..................... Social Insurance FundLength of paternity leave ..................................................................... —Paternity leave benefits (% of wages paid) ..................................... —Daycare options .................................................................................... —
PolandGender Gap Index 2011 (out of 135 countries) 42 0.704 65 0.653 28 0.999 48 0.979 40 0.184
Gender Gap Index 2010 (out of 134 countries) 43 0.704 63 0.653 29 0.999 46 0.979 41 0.184
Gender Gap Index 2009 (out of 134 countries) 50 0.700 71 0.643 33 0.999 41 0.979 40 0.178
Gender Gap Index 2008 (out of 130 countries) 49 0.695 73 0.624 30 0.999 38 0.979 39 0.178
Gender Gap Index 2007 (out of 128 countries) 60 0.676 74 0.617 1 1.000 37 0.979 63 0.107
Gender Gap Index 2006 (out of 115 countries) 44 0.680 50 0.635 13 1.000 36 0.979 58 0.107
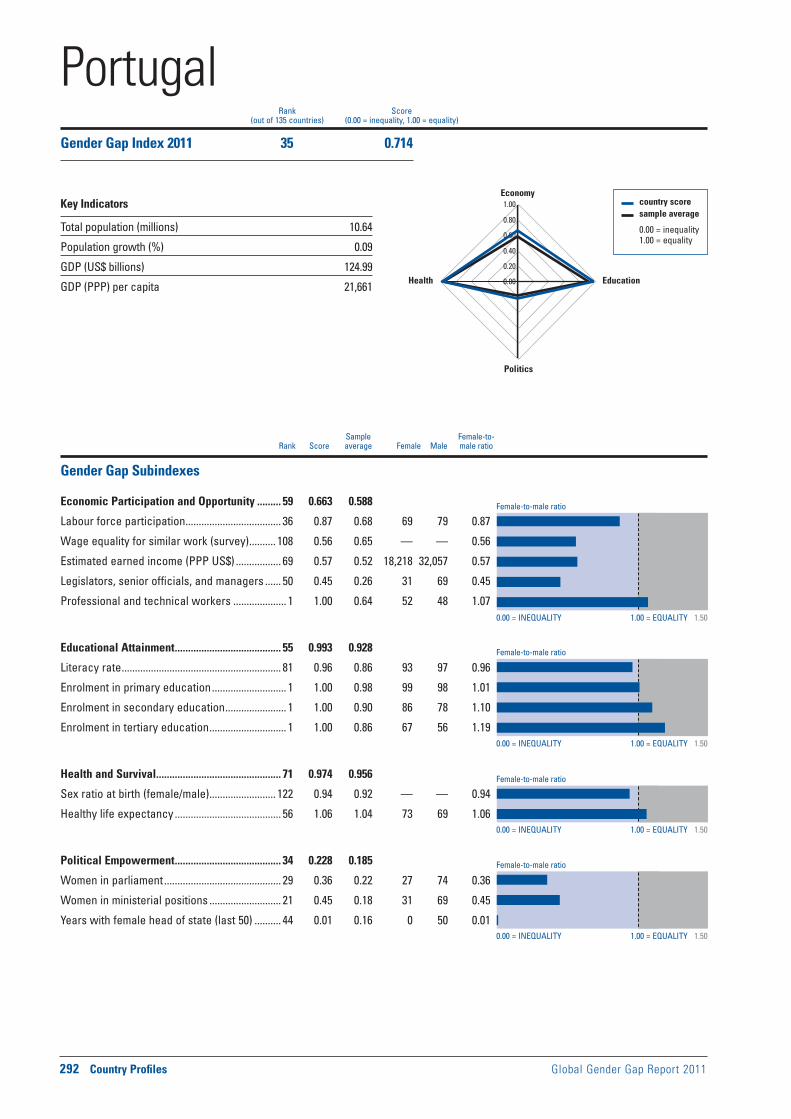
Female-to-male ratio
0.00 = INEQUALITY 1.00 = EQUALITY 1.50
0.00 = INEQUALITY 1.00 = EQUALITY 1.50
0.00 = INEQUALITY 1.00 = EQUALITY 1.50
0.00 = INEQUALITY 1.00 = EQUALITY 1.50
Female-to-male ratio
Female-to-male ratio
Female-to-male ratio
292 Country Profiles Global Gender Gap Report 2011
Sample Female-to- Rank Score average Female Male male ratio
country score sample average
0.00 = inequality 1.00 = equality
0.00
0.20
0.40
0.60
0.80
1.00Economy
Education
Politics
Health
Rank Score(out of 135 countries) (0.00 = inequality, 1.00 = equality)
Gender Gap Subindexes
Economic Participation and Opportunity ......... 59 0.663 0.588
Labour force participation .................................... 36 0.87 0.68 69 79 0.87
Wage equality for similar work (survey) .......... 108 0.56 0.65 — — 0.56
Estimated earned income (PPP US$) ................. 69 0.57 0.52 18,218 32,057 0.57
Legislators, senior officials, and managers ...... 50 0.45 0.26 31 69 0.45
Professional and technical workers .................... 1 1.00 0.64 52 48 1.07
Educational Attainment ........................................ 55 0.993 0.928
Literacy rate ............................................................ 81 0.96 0.86 93 97 0.96
Enrolment in primary education ............................ 1 1.00 0.98 99 98 1.01
Enrolment in secondary education ....................... 1 1.00 0.90 86 78 1.10
Enrolment in tertiary education ............................. 1 1.00 0.86 67 56 1.19
Health and Survival ............................................... 71 0.974 0.956
Sex ratio at birth (female/male) ......................... 122 0.94 0.92 — — 0.94
Healthy life expectancy ........................................ 56 1.06 1.04 73 69 1.06
Political Empowerment ........................................ 34 0.228 0.185
Women in parliament ............................................ 29 0.36 0.22 27 74 0.36
Women in ministerial positions ........................... 21 0.45 0.18 31 69 0.45
Years with female head of state (last 50) .......... 44 0.01 0.16 0 50 0.01
PortugalGender Gap Index 2011 35 0.714
Key Indicators
Total population (millions) 10.64
Population growth (%) 0.09
GDP (US$ billions) 124.99
GDP (PPP) per capita 21,661
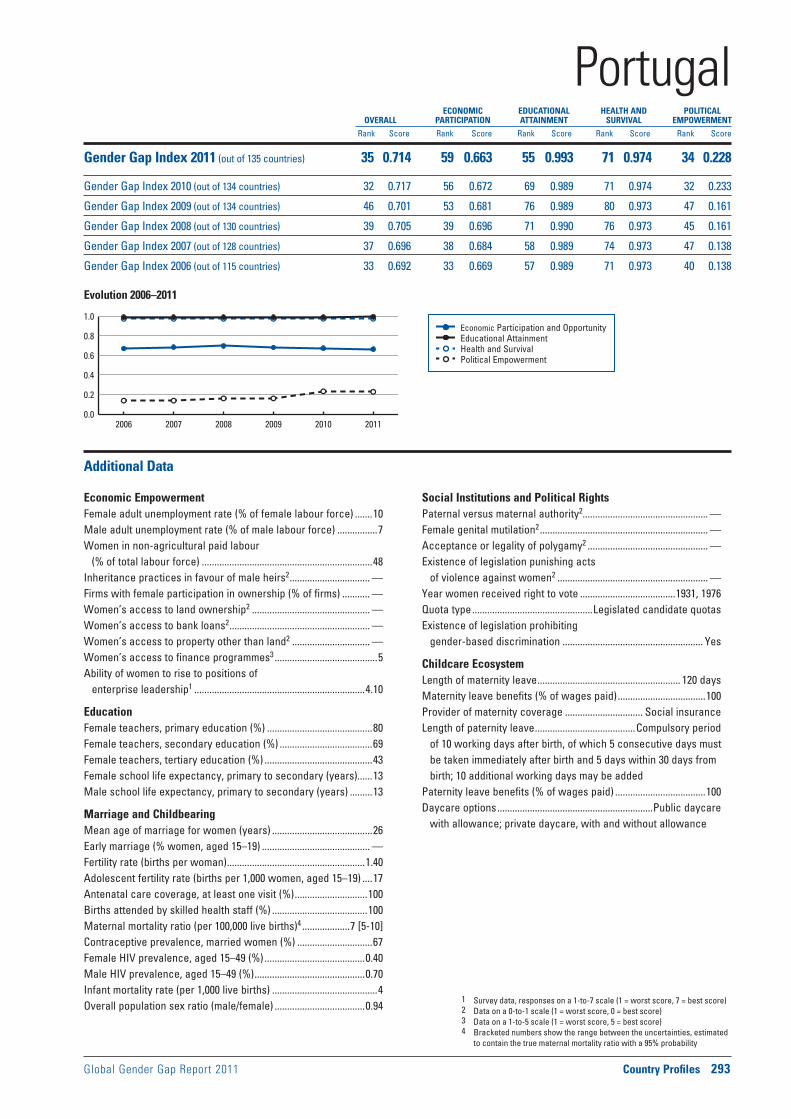
Global Gender Gap Report 2011 Country Profiles 293
Economic Participation and Opportunity Educational Attainment Health and Survival Political Empowerment
Evolution 2006–2011
1 Survey data, responses on a 1-to-7 scale (1 = worst score, 7 = best score)2 Data on a 0-to-1 scale (1 = worst score, 0 = best score)3 Data on a 1-to-5 scale (1 = worst score, 5 = best score)4 Bracketed numbers show the range between the uncertainties, estimated
to contain the true maternal mortality ratio with a 95% probability
ECONOMIC EDUCATIONAL HEALTH AND POLITICAL OVERALL PARTICIPATION ATTAINMENT SURVIVAL EMPOWERMENT
Rank Score Rank Score Rank Score Rank Score Rank Score
0.0
0.2
0.4
0.6
0.8
1.0
2006 2007 2008 2009 2010 2011
Additional Data
Economic EmpowermentFemale adult unemployment rate (% of female labour force) .......10Male adult unemployment rate (% of male labour force) ................7Women in non-agricultural paid labour
(% of total labour force) ....................................................................48Inheritance practices in favour of male heirs2 ................................ —Firms with female participation in ownership (% of firms) ........... —Women’s access to land ownership2 ............................................... —Women’s access to bank loans2 ........................................................ —Women’s access to property other than land2 ............................... —Women’s access to finance programmes3 .........................................5Ability of women to rise to positions of
enterprise leadership1 ....................................................................4.10
EducationFemale teachers, primary education (%) ..........................................80Female teachers, secondary education (%) .....................................69Female teachers, tertiary education (%) ...........................................43Female school life expectancy, primary to secondary (years)......13Male school life expectancy, primary to secondary (years) .........13
Marriage and ChildbearingMean age of marriage for women (years) ........................................26Early marriage (% women, aged 15–19) ........................................... —Fertility rate (births per woman) .......................................................1.40Adolescent fertility rate (births per 1,000 women, aged 15–19) ....17Antenatal care coverage, at least one visit (%) .............................100Births attended by skilled health staff (%) ......................................100Maternal mortality ratio (per 100,000 live births)4 ...................7 [5-10]Contraceptive prevalence, married women (%) ..............................67Female HIV prevalence, aged 15–49 (%) ........................................0.40Male HIV prevalence, aged 15–49 (%) ............................................0.70Infant mortality rate (per 1,000 live births) ..........................................4Overall population sex ratio (male/female) ....................................0.94
Social Institutions and Political RightsPaternal versus maternal authority2.................................................. —Female genital mutilation2 ................................................................... —Acceptance or legality of polygamy2 ................................................ —Existence of legislation punishing acts
of violence against women2 ............................................................ —Year women received right to vote ......................................1931, 1976Quota type ................................................Legislated candidate quotasExistence of legislation prohibiting
gender-based discrimination ........................................................ Yes
Childcare EcosystemLength of maternity leave ......................................................... 120 daysMaternity leave benefits (% of wages paid) ...................................100Provider of maternity coverage ............................... Social insuranceLength of paternity leave ........................................Compulsory period
of 10 working days after birth, of which 5 consecutive days must be taken immediately after birth and 5 days within 30 days from birth; 10 additional working days may be added
Paternity leave benefits (% of wages paid) ....................................100Daycare options ..............................................................Public daycare
with allowance; private daycare, with and without allowance
PortugalGender Gap Index 2011 (out of 135 countries) 35 0.714 59 0.663 55 0.993 71 0.974 34 0.228
Gender Gap Index 2010 (out of 134 countries) 32 0.717 56 0.672 69 0.989 71 0.974 32 0.233
Gender Gap Index 2009 (out of 134 countries) 46 0.701 53 0.681 76 0.989 80 0.973 47 0.161
Gender Gap Index 2008 (out of 130 countries) 39 0.705 39 0.696 71 0.990 76 0.973 45 0.161
Gender Gap Index 2007 (out of 128 countries) 37 0.696 38 0.684 58 0.989 74 0.973 47 0.138
Gender Gap Index 2006 (out of 115 countries) 33 0.692 33 0.669 57 0.989 71 0.973 40 0.138

Female-to-male ratio
0.00 = INEQUALITY 1.00 = EQUALITY 1.50
0.00 = INEQUALITY 1.00 = EQUALITY 1.50
0.00 = INEQUALITY 1.00 = EQUALITY 1.50
0.00 = INEQUALITY 1.00 = EQUALITY 1.50
Female-to-male ratio
Female-to-male ratio
Female-to-male ratio
294 Country Profiles Global Gender Gap Report 2011
Sample Female-to- Rank Score average Female Male male ratio
country score sample average
0.00 = inequality 1.00 = equality
0.00
0.20
0.40
0.60
0.80
1.00Economy
Education
Politics
Health
Rank Score(out of 135 countries) (0.00 = inequality, 1.00 = equality)
Gender Gap Subindexes
Economic Participation and Opportunity ....... 104 0.547 0.588
Labour force participation .................................. 113 0.55 0.68 51 93 0.55
Wage equality for similar work (survey) ............ 51 0.69 0.65 — — 0.69
Estimated earned income (PPP US$) ................... 7 0.84 0.52 33,582 40,000 0.84
Legislators, senior officials, and managers .... 120 0.07 0.26 7 93 0.07
Professional and technical workers ................ 113 0.24 0.64 20 80 0.24
Educational Attainment ........................................ 57 0.992 0.928
Literacy rate ............................................................ 73 0.98 0.86 93 95 0.98
Enrolment in primary education .......................... 81 0.99 0.98 93 94 0.99
Enrolment in secondary education ....................... 1 1.00 0.90 96 65 1.47
Enrolment in tertiary education ............................. 1 1.00 0.86 30 5 6.31
Health and Survival ............................................. 127 0.952 0.956
Sex ratio at birth (female/male) ............................. 1 0.94 0.92 — — 0.95
Healthy life expectancy ...................................... 134 0.97 1.04 66 68 0.97
Political Empowerment ...................................... 132 0.000 0.185
Women in parliament .......................................... 130 0.00 0.22 0 100 0.00
Women in ministerial positions ......................... 129 0.00 0.18 0 100 0.00
Years with female head of state (last 50) .......... 52 0.00 0.16 0 50 0.00
QatarGender Gap Index 2011 111 0.623
Key Indicators
Total population (millions) 1.51
Population growth (%) 6.78
GDP (US$ billions) 54.22
GDP (PPP) per capita 82,978

Global Gender Gap Report 2011 Country Profiles 295
Economic Participation and Opportunity Educational Attainment Health and Survival Political Empowerment
Evolution 2006–2011
1 Survey data, responses on a 1-to-7 scale (1 = worst score, 7 = best score)2 Data on a 0-to-1 scale (1 = worst score, 0 = best score)3 Data on a 1-to-5 scale (1 = worst score, 5 = best score)4 Bracketed numbers show the range between the uncertainties, estimated
to contain the true maternal mortality ratio with a 95% probability
ECONOMIC EDUCATIONAL HEALTH AND POLITICAL OVERALL PARTICIPATION ATTAINMENT SURVIVAL EMPOWERMENT
Rank Score Rank Score Rank Score Rank Score Rank Score
0.0
0.2
0.4
0.6
0.8
1.0
2006 2007 2008 2009 2010 2011
Additional Data
Economic EmpowermentFemale adult unemployment rate (% of female labour force) .........3Male adult unemployment rate (% of male labour force) ................0Women in non-agricultural paid labour
(% of total labour force) ....................................................................13Inheritance practices in favour of male heirs2 ................................ —Firms with female participation in ownership (% of firms) ........... —Women’s access to land ownership2 ............................................... —Women’s access to bank loans2 ........................................................ —Women’s access to property other than land2 ............................... —Women’s access to finance programmes3 ...................................... —Ability of women to rise to positions of
enterprise leadership1 ....................................................................4.60
EducationFemale teachers, primary education (%) ..........................................83Female teachers, secondary education (%) .....................................54Female teachers, tertiary education (%) ...........................................38Female school life expectancy, primary to secondary (years)......13Male school life expectancy, primary to secondary (years) .........11
Marriage and ChildbearingMean age of marriage for women (years) ........................................26Early marriage (% women, aged 15–19) ........................................... —Fertility rate (births per woman) .......................................................2.40Adolescent fertility rate (births per 1,000 women, aged 15–19) ....16Antenatal care coverage, at least one visit (%) .............................100Births attended by skilled health staff (%) ......................................100Maternal mortality ratio (per 100,000 live births)4 ...................8 [4-19]Contraceptive prevalence, married women (%) ..............................43Female HIV prevalence, aged 15–49 (%) ......................................<0.10Male HIV prevalence, aged 15–49 (%) ..........................................<0.10Infant mortality rate (per 1,000 live births) ..........................................7Overall population sex ratio (male/female) ....................................3.07
Social Institutions and Political RightsPaternal versus maternal authority2.................................................. —Female genital mutilation2 ................................................................... —Acceptance or legality of polygamy2 ................................................ —Existence of legislation punishing acts
of violence against women2 ............................................................ —Year women received right to vote ................................................2003Quota type .............................................................................................. —Existence of legislation prohibiting
gender-based discrimination .......................................................... —
Childcare EcosystemLength of maternity leave ........................................................... 50 daysMaternity leave benefits (% of wages paid) ...................................100Provider of maternity coverage .............................................EmployerLength of paternity leave ..................................................................... —Paternity leave benefits (% of wages paid) ..................................... —Daycare options .................................................................................... —
QatarGender Gap Index 2011 (out of 135 countries) 111 0.623 104 0.547 57 0.992 127 0.952 132 0.000
Gender Gap Index 2010 (out of 134 countries) 117 0.606 116 0.483 74 0.989 126 0.952 131 0.000
Gender Gap Index 2009 (out of 134 countries) 125 0.591 129 0.400 53 0.995 129 0.947 130 0.021
Gender Gap Index 2008 (out of 130 countries) 119 0.595 123 0.415 41 0.997 125 0.947 126 0.021
Gender Gap Index 2007 (out of 128 countries) 109 0.604 115 0.456 45 0.993 123 0.947 124 0.021
Gender Gap Index 2006 (out of 115 countries) — — — — — — — — — —

Female-to-male ratio
0.00 = INEQUALITY 1.00 = EQUALITY 1.50
0.00 = INEQUALITY 1.00 = EQUALITY 1.50
0.00 = INEQUALITY 1.00 = EQUALITY 1.50
0.00 = INEQUALITY 1.00 = EQUALITY 1.50
Female-to-male ratio
Female-to-male ratio
Female-to-male ratio
296 Country Profiles Global Gender Gap Report 2011
Sample Female-to- Rank Score average Female Male male ratio
country score sample average
0.00 = inequality 1.00 = equality
0.00
0.20
0.40
0.60
0.80
1.00Economy
Education
Politics
Health
Rank Score(out of 135 countries) (0.00 = inequality, 1.00 = equality)
Gender Gap Subindexes
Economic Participation and Opportunity ......... 46 0.694 0.588
Labour force participation .................................... 64 0.79 0.68 54 68 0.79
Wage equality for similar work (survey) ............ 72 0.65 0.65 — — 0.65
Estimated earned income (PPP US$) ................. 30 0.68 0.52 11,662 17,043 0.68
Legislators, senior officials, and managers ...... 62 0.42 0.26 29 71 0.42
Professional and technical workers .................... 1 1.00 0.64 56 44 1.29
Educational Attainment ........................................ 45 0.995 0.928
Literacy rate ............................................................ 66 0.99 0.86 97 98 0.99
Enrolment in primary education .......................... 77 0.99 0.98 90 91 0.99
Enrolment in secondary education ....................... 1 1.00 0.90 82 80 1.02
Enrolment in tertiary education ............................. 1 1.00 0.86 77 58 1.34
Health and Survival ............................................... 41 0.979 0.956
Sex ratio at birth (female/male) ......................... 106 0.94 0.92 — — 0.94
Healthy life expectancy .......................................... 1 1.06 1.04 68 63 1.08
Political Empowerment ...................................... 112 0.056 0.185
Women in parliament ............................................ 96 0.13 0.22 11 89 0.13
Women in ministerial positions ......................... 113 0.07 0.18 6 94 0.07
Years with female head of state (last 50) .......... 52 0.00 0.16 0 50 0.00
RomaniaGender Gap Index 2011 68 0.681
Key Indicators
Total population (millions) 21.45
Population growth (%) –0.15
GDP (US$ billions) 56.53
GDP (PPP) per capita 10,915
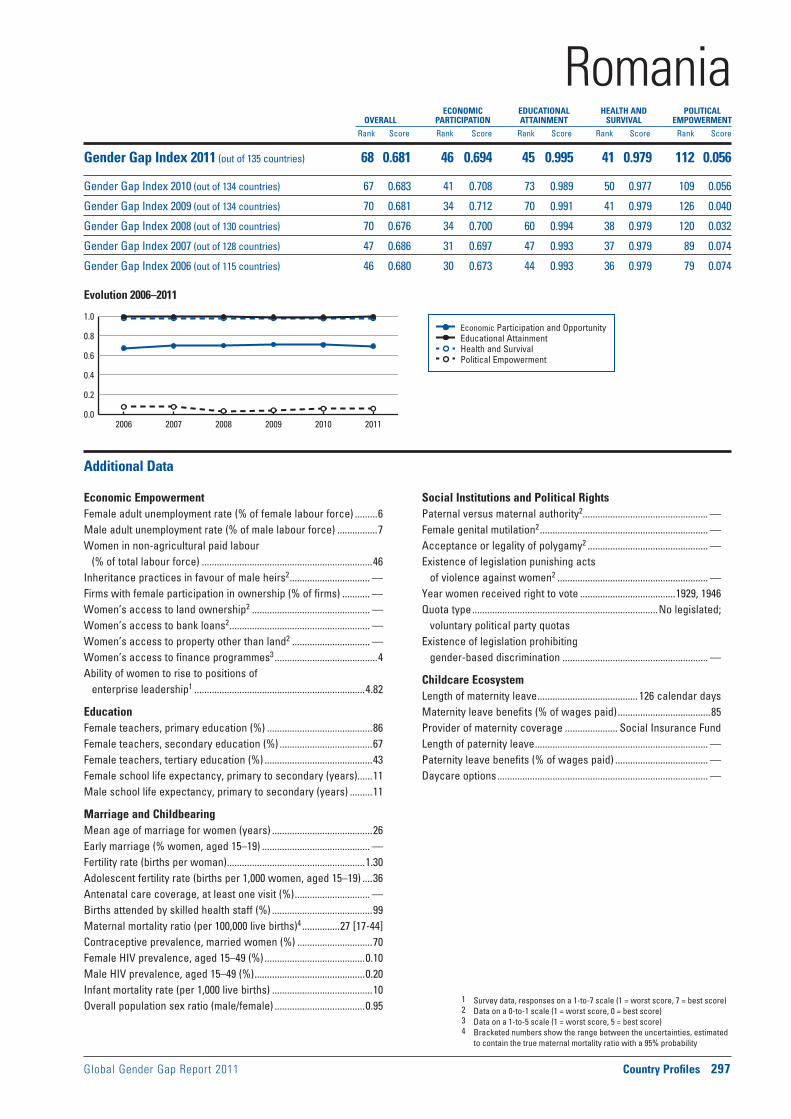
Global Gender Gap Report 2011 Country Profiles 297
Economic Participation and Opportunity Educational Attainment Health and Survival Political Empowerment
Evolution 2006–2011
1 Survey data, responses on a 1-to-7 scale (1 = worst score, 7 = best score)2 Data on a 0-to-1 scale (1 = worst score, 0 = best score)3 Data on a 1-to-5 scale (1 = worst score, 5 = best score)4 Bracketed numbers show the range between the uncertainties, estimated
to contain the true maternal mortality ratio with a 95% probability
ECONOMIC EDUCATIONAL HEALTH AND POLITICAL OVERALL PARTICIPATION ATTAINMENT SURVIVAL EMPOWERMENT
Rank Score Rank Score Rank Score Rank Score Rank Score
0.0
0.2
0.4
0.6
0.8
1.0
2006 2007 2008 2009 2010 2011
Additional Data
Economic EmpowermentFemale adult unemployment rate (% of female labour force) .........6Male adult unemployment rate (% of male labour force) ................7Women in non-agricultural paid labour
(% of total labour force) ....................................................................46Inheritance practices in favour of male heirs2 ................................ —Firms with female participation in ownership (% of firms) ........... —Women’s access to land ownership2 ............................................... —Women’s access to bank loans2 ........................................................ —Women’s access to property other than land2 ............................... —Women’s access to finance programmes3 .........................................4Ability of women to rise to positions of
enterprise leadership1 ....................................................................4.82
EducationFemale teachers, primary education (%) ..........................................86Female teachers, secondary education (%) .....................................67Female teachers, tertiary education (%) ...........................................43Female school life expectancy, primary to secondary (years)......11Male school life expectancy, primary to secondary (years) .........11
Marriage and ChildbearingMean age of marriage for women (years) ........................................26Early marriage (% women, aged 15–19) ........................................... —Fertility rate (births per woman) .......................................................1.30Adolescent fertility rate (births per 1,000 women, aged 15–19) ....36Antenatal care coverage, at least one visit (%) .............................. —Births attended by skilled health staff (%) ........................................99Maternal mortality ratio (per 100,000 live births)4 ...............27 [17-44]Contraceptive prevalence, married women (%) ..............................70Female HIV prevalence, aged 15–49 (%) ........................................0.10Male HIV prevalence, aged 15–49 (%) ............................................0.20Infant mortality rate (per 1,000 live births) ........................................10Overall population sex ratio (male/female) ....................................0.95
Social Institutions and Political RightsPaternal versus maternal authority2.................................................. —Female genital mutilation2 ................................................................... —Acceptance or legality of polygamy2 ................................................ —Existence of legislation punishing acts
of violence against women2 ............................................................ —Year women received right to vote ......................................1929, 1946Quota type ..........................................................................No legislated;
voluntary political party quotasExistence of legislation prohibiting
gender-based discrimination .......................................................... —
Childcare EcosystemLength of maternity leave ........................................ 126 calendar daysMaternity leave benefits (% of wages paid) .....................................85Provider of maternity coverage ..................... Social Insurance FundLength of paternity leave ..................................................................... —Paternity leave benefits (% of wages paid) ..................................... —Daycare options .................................................................................... —
RomaniaGender Gap Index 2011 (out of 135 countries) 68 0.681 46 0.694 45 0.995 41 0.979 112 0.056
Gender Gap Index 2010 (out of 134 countries) 67 0.683 41 0.708 73 0.989 50 0.977 109 0.056
Gender Gap Index 2009 (out of 134 countries) 70 0.681 34 0.712 70 0.991 41 0.979 126 0.040
Gender Gap Index 2008 (out of 130 countries) 70 0.676 34 0.700 60 0.994 38 0.979 120 0.032
Gender Gap Index 2007 (out of 128 countries) 47 0.686 31 0.697 47 0.993 37 0.979 89 0.074
Gender Gap Index 2006 (out of 115 countries) 46 0.680 30 0.673 44 0.993 36 0.979 79 0.074

Female-to-male ratio
0.00 = INEQUALITY 1.00 = EQUALITY 1.50
0.00 = INEQUALITY 1.00 = EQUALITY 1.50
0.00 = INEQUALITY 1.00 = EQUALITY 1.50
0.00 = INEQUALITY 1.00 = EQUALITY 1.50
Female-to-male ratio
Female-to-male ratio
Female-to-male ratio
298 Country Profiles Global Gender Gap Report 2011
Sample Female-to- Rank Score average Female Male male ratio
country score sample average
0.00 = inequality 1.00 = equality
0.00
0.20
0.40
0.60
0.80
1.00Economy
Education
Politics
Health
Rank Score(out of 135 countries) (0.00 = inequality, 1.00 = equality)
Gender Gap Subindexes
Economic Participation and Opportunity ......... 29 0.737 0.588
Labour force participation .................................... 17 0.91 0.68 69 76 0.91
Wage equality for similar work (survey) ............ 71 0.65 0.65 — — 0.65
Estimated earned income (PPP US$) ................. 42 0.65 0.52 15,193 23,284 0.65
Legislators, senior officials, and managers ...... 24 0.59 0.26 37 63 0.59
Professional and technical workers .................... 1 1.00 0.64 64 36 1.80
Educational Attainment ........................................ 33 0.998 0.928
Literacy rate ............................................................ 52 1.00 0.86 99 100 1.00
Enrolment in primary education .......................... 67 1.00 0.98 92 92 1.00
Enrolment in secondary education .....................— — 0.90 — — —
Enrolment in tertiary education ............................. 1 1.00 0.86 89 66 1.36
Health and Survival ............................................... 41 0.979 0.956
Sex ratio at birth (female/male) ......................... 106 0.94 0.92 — — 0.94
Healthy life expectancy .......................................... 1 1.06 1.04 65 55 1.18
Political Empowerment ........................................ 84 0.100 0.185
Women in parliament ............................................ 84 0.16 0.22 14 86 0.16
Women in ministerial positions ........................... 62 0.20 0.18 17 83 0.20
Years with female head of state (last 50) .......... 52 0.00 0.16 0 50 0.00
Russian FederationGender Gap Index 2011 43 0.704
Key Indicators
Total population (millions) 141.75
Population growth (%) –0.07
GDP (US$ billions) 414.36
GDP (PPP) per capita 14,183
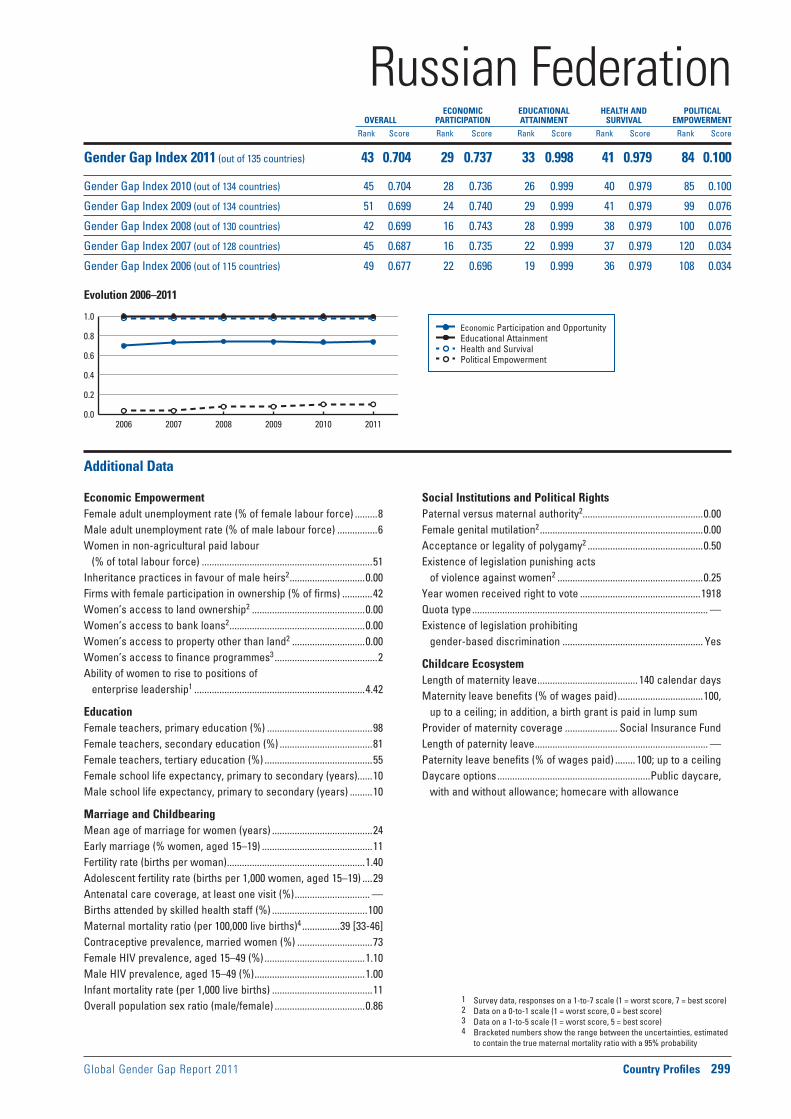
Global Gender Gap Report 2011 Country Profiles 299
Economic Participation and Opportunity Educational Attainment Health and Survival Political Empowerment
Evolution 2006–2011
1 Survey data, responses on a 1-to-7 scale (1 = worst score, 7 = best score)2 Data on a 0-to-1 scale (1 = worst score, 0 = best score)3 Data on a 1-to-5 scale (1 = worst score, 5 = best score)4 Bracketed numbers show the range between the uncertainties, estimated
to contain the true maternal mortality ratio with a 95% probability
ECONOMIC EDUCATIONAL HEALTH AND POLITICAL OVERALL PARTICIPATION ATTAINMENT SURVIVAL EMPOWERMENT
Rank Score Rank Score Rank Score Rank Score Rank Score
0.0
0.2
0.4
0.6
0.8
1.0
2006 2007 2008 2009 2010 2011
Additional Data
Economic EmpowermentFemale adult unemployment rate (% of female labour force) .........8Male adult unemployment rate (% of male labour force) ................6Women in non-agricultural paid labour
(% of total labour force) ....................................................................51Inheritance practices in favour of male heirs2 ..............................0.00Firms with female participation in ownership (% of firms) ............42Women’s access to land ownership2 .............................................0.00Women’s access to bank loans2 ......................................................0.00Women’s access to property other than land2 .............................0.00Women’s access to finance programmes3 .........................................2Ability of women to rise to positions of
enterprise leadership1 ....................................................................4.42
EducationFemale teachers, primary education (%) ..........................................98Female teachers, secondary education (%) .....................................81Female teachers, tertiary education (%) ...........................................55Female school life expectancy, primary to secondary (years)......10Male school life expectancy, primary to secondary (years) .........10
Marriage and ChildbearingMean age of marriage for women (years) ........................................24Early marriage (% women, aged 15–19) ............................................11Fertility rate (births per woman) .......................................................1.40Adolescent fertility rate (births per 1,000 women, aged 15–19) ....29Antenatal care coverage, at least one visit (%) .............................. —Births attended by skilled health staff (%) ......................................100Maternal mortality ratio (per 100,000 live births)4 ...............39 [33-46]Contraceptive prevalence, married women (%) ..............................73Female HIV prevalence, aged 15–49 (%) ........................................1.10Male HIV prevalence, aged 15–49 (%) ............................................1.00Infant mortality rate (per 1,000 live births) ........................................11Overall population sex ratio (male/female) ....................................0.86
Social Institutions and Political RightsPaternal versus maternal authority2................................................0.00Female genital mutilation2 .................................................................0.00Acceptance or legality of polygamy2 ..............................................0.50Existence of legislation punishing acts
of violence against women2 ..........................................................0.25Year women received right to vote ................................................1918Quota type .............................................................................................. —Existence of legislation prohibiting
gender-based discrimination ........................................................ Yes
Childcare EcosystemLength of maternity leave ........................................ 140 calendar daysMaternity leave benefits (% of wages paid) ..................................100,
up to a ceiling; in addition, a birth grant is paid in lump sumProvider of maternity coverage ..................... Social Insurance FundLength of paternity leave ..................................................................... —Paternity leave benefits (% of wages paid) ........ 100; up to a ceilingDaycare options .............................................................Public daycare,
with and without allowance; homecare with allowance
Russian FederationGender Gap Index 2011 (out of 135 countries) 43 0.704 29 0.737 33 0.998 41 0.979 84 0.100
Gender Gap Index 2010 (out of 134 countries) 45 0.704 28 0.736 26 0.999 40 0.979 85 0.100
Gender Gap Index 2009 (out of 134 countries) 51 0.699 24 0.740 29 0.999 41 0.979 99 0.076
Gender Gap Index 2008 (out of 130 countries) 42 0.699 16 0.743 28 0.999 38 0.979 100 0.076
Gender Gap Index 2007 (out of 128 countries) 45 0.687 16 0.735 22 0.999 37 0.979 120 0.034
Gender Gap Index 2006 (out of 115 countries) 49 0.677 22 0.696 19 0.999 36 0.979 108 0.034

Female-to-male ratio
0.00 = INEQUALITY 1.00 = EQUALITY 1.50
0.00 = INEQUALITY 1.00 = EQUALITY 1.50
0.00 = INEQUALITY 1.00 = EQUALITY 1.50
0.00 = INEQUALITY 1.00 = EQUALITY 1.50
Female-to-male ratio
Female-to-male ratio
Female-to-male ratio
300 Country Profiles Global Gender Gap Report 2011
Sample Female-to- Rank Score average Female Male male ratio
country score sample average
0.00 = inequality 1.00 = equality
0.00
0.20
0.40
0.60
0.80
1.00Economy
Education
Politics
Health
Rank Score(out of 135 countries) (0.00 = inequality, 1.00 = equality)
Gender Gap Subindexes
Economic Participation and Opportunity ....... 133 0.358 0.588
Labour force participation .................................. 133 0.27 0.68 22 82 0.27
Wage equality for similar work (survey) ............ 69 0.65 0.65 — — 0.65
Estimated earned income (PPP US$) ............... 131 0.19 0.52 7,157 36,727 0.19
Legislators, senior officials, and managers .... 118 0.08 0.26 7 93 0.08
Professional and technical workers ................ 104 0.38 0.64 28 72 0.38
Educational Attainment ........................................ 92 0.967 0.928
Literacy rate .......................................................... 101 0.90 0.86 81 90 0.90
Enrolment in primary education ........................ 112 0.97 0.98 85 88 0.97
Enrolment in secondary education ....................... 1 1.00 0.90 76 70 1.08
Enrolment in tertiary education ............................. 1 1.00 0.86 36 29 1.23
Health and Survival ............................................... 53 0.976 0.956
Sex ratio at birth (female/male) ............................. 1 0.94 0.92 — — 0.95
Healthy life expectancy ........................................ 65 1.05 1.04 64 61 1.05
Political Empowerment ...................................... 132 0.000 0.185
Women in parliament .......................................... 130 0.00 0.22 0 100 0.00
Women in ministerial positions ......................... 129 0.00 0.18 0 100 0.00
Years with female head of state (last 50) .......... 52 0.00 0.16 0 50 0.00
Saudi ArabiaGender Gap Index 2011 131 0.575
Key Indicators
Total population (millions) 25.99
Population growth (%) 2.33
GDP (US$ billions) 250.44
GDP (PPP) per capita 21,321
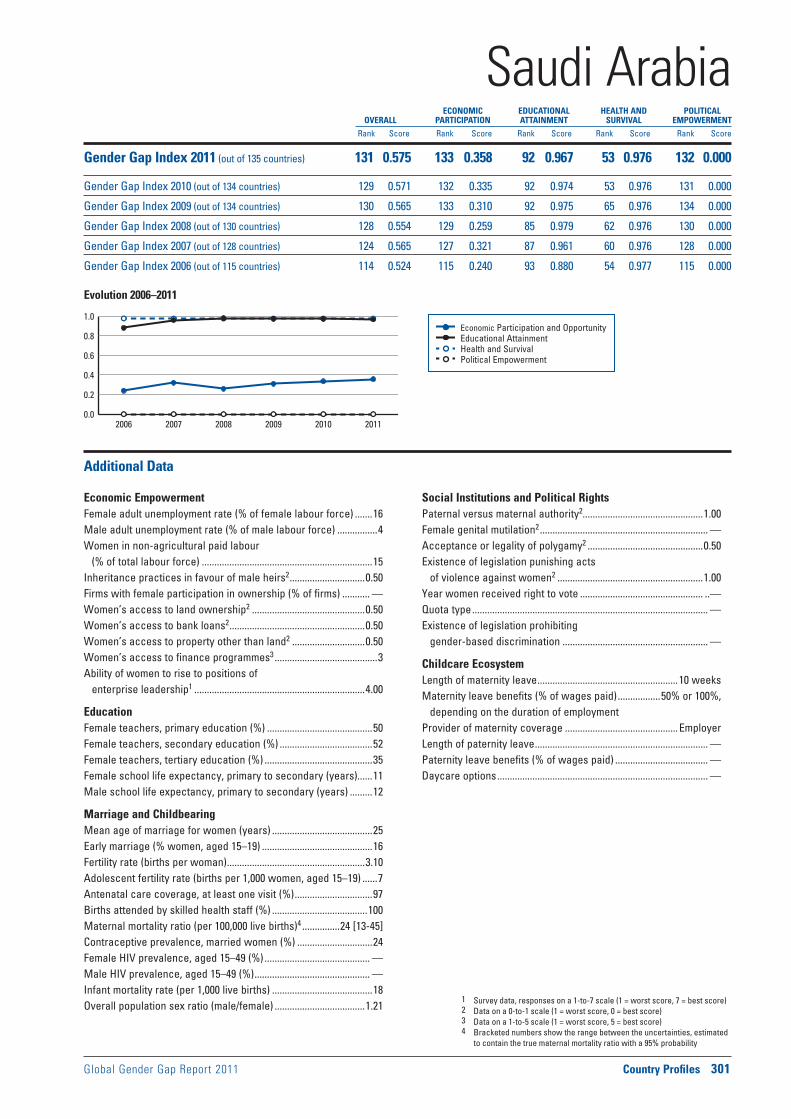
Global Gender Gap Report 2011 Country Profiles 301
Economic Participation and Opportunity Educational Attainment Health and Survival Political Empowerment
Evolution 2006–2011
1 Survey data, responses on a 1-to-7 scale (1 = worst score, 7 = best score)2 Data on a 0-to-1 scale (1 = worst score, 0 = best score)3 Data on a 1-to-5 scale (1 = worst score, 5 = best score)4 Bracketed numbers show the range between the uncertainties, estimated
to contain the true maternal mortality ratio with a 95% probability
ECONOMIC EDUCATIONAL HEALTH AND POLITICAL OVERALL PARTICIPATION ATTAINMENT SURVIVAL EMPOWERMENT
Rank Score Rank Score Rank Score Rank Score Rank Score
0.0
0.2
0.4
0.6
0.8
1.0
2006 2007 2008 2009 2010 2011
Additional Data
Economic EmpowermentFemale adult unemployment rate (% of female labour force) .......16Male adult unemployment rate (% of male labour force) ................4Women in non-agricultural paid labour
(% of total labour force) ....................................................................15Inheritance practices in favour of male heirs2 ..............................0.50Firms with female participation in ownership (% of firms) ........... —Women’s access to land ownership2 .............................................0.50Women’s access to bank loans2 ......................................................0.50Women’s access to property other than land2 .............................0.50Women’s access to finance programmes3 .........................................3Ability of women to rise to positions of
enterprise leadership1 ....................................................................4.00
EducationFemale teachers, primary education (%) ..........................................50Female teachers, secondary education (%) .....................................52Female teachers, tertiary education (%) ...........................................35Female school life expectancy, primary to secondary (years)......11Male school life expectancy, primary to secondary (years) .........12
Marriage and ChildbearingMean age of marriage for women (years) ........................................25Early marriage (% women, aged 15–19) ............................................16Fertility rate (births per woman) .......................................................3.10Adolescent fertility rate (births per 1,000 women, aged 15–19) ......7Antenatal care coverage, at least one visit (%) ...............................97Births attended by skilled health staff (%) ......................................100Maternal mortality ratio (per 100,000 live births)4 ...............24 [13-45]Contraceptive prevalence, married women (%) ..............................24Female HIV prevalence, aged 15–49 (%) .......................................... —Male HIV prevalence, aged 15–49 (%) .............................................. —Infant mortality rate (per 1,000 live births) ........................................18Overall population sex ratio (male/female) ....................................1.21
Social Institutions and Political RightsPaternal versus maternal authority2................................................1.00Female genital mutilation2 ................................................................... —Acceptance or legality of polygamy2 ..............................................0.50Existence of legislation punishing acts
of violence against women2 ..........................................................1.00Year women received right to vote ................................................. ..—Quota type .............................................................................................. —Existence of legislation prohibiting
gender-based discrimination .......................................................... —
Childcare EcosystemLength of maternity leave ........................................................10 weeksMaternity leave benefits (% of wages paid) .................50% or 100%,
depending on the duration of employmentProvider of maternity coverage .............................................EmployerLength of paternity leave ..................................................................... —Paternity leave benefits (% of wages paid) ..................................... —Daycare options .................................................................................... —
Saudi ArabiaGender Gap Index 2011 (out of 135 countries) 131 0.575 133 0.358 92 0.967 53 0.976 132 0.000
Gender Gap Index 2010 (out of 134 countries) 129 0.571 132 0.335 92 0.974 53 0.976 131 0.000
Gender Gap Index 2009 (out of 134 countries) 130 0.565 133 0.310 92 0.975 65 0.976 134 0.000
Gender Gap Index 2008 (out of 130 countries) 128 0.554 129 0.259 85 0.979 62 0.976 130 0.000
Gender Gap Index 2007 (out of 128 countries) 124 0.565 127 0.321 87 0.961 60 0.976 128 0.000
Gender Gap Index 2006 (out of 115 countries) 114 0.524 115 0.240 93 0.880 54 0.977 115 0.000
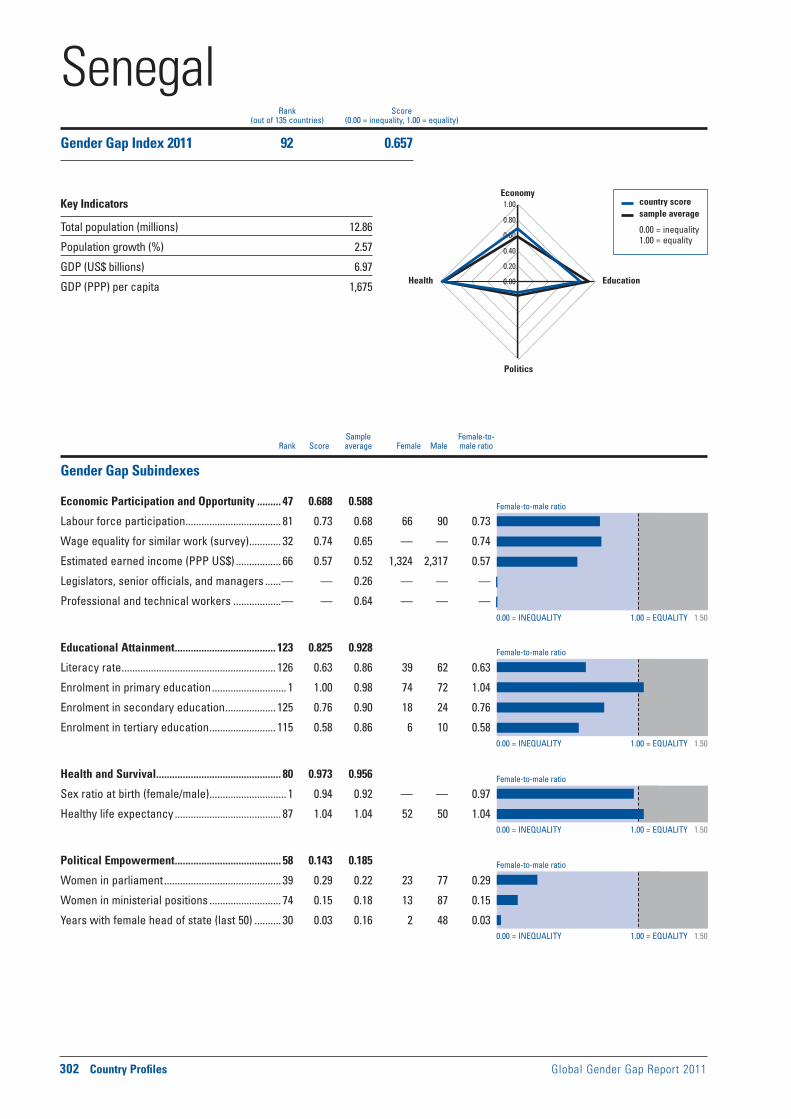
Female-to-male ratio
0.00 = INEQUALITY 1.00 = EQUALITY 1.50
0.00 = INEQUALITY 1.00 = EQUALITY 1.50
0.00 = INEQUALITY 1.00 = EQUALITY 1.50
0.00 = INEQUALITY 1.00 = EQUALITY 1.50
Female-to-male ratio
Female-to-male ratio
Female-to-male ratio
302 Country Profiles Global Gender Gap Report 2011
Sample Female-to- Rank Score average Female Male male ratio
country score sample average
0.00 = inequality 1.00 = equality
0.00
0.20
0.40
0.60
0.80
1.00Economy
Education
Politics
Health
Rank Score(out of 135 countries) (0.00 = inequality, 1.00 = equality)
Gender Gap Subindexes
Economic Participation and Opportunity ......... 47 0.688 0.588
Labour force participation .................................... 81 0.73 0.68 66 90 0.73
Wage equality for similar work (survey) ............ 32 0.74 0.65 — — 0.74
Estimated earned income (PPP US$) ................. 66 0.57 0.52 1,324 2,317 0.57
Legislators, senior officials, and managers ......— — 0.26 — — —
Professional and technical workers ..................— — 0.64 — — —
Educational Attainment ...................................... 123 0.825 0.928
Literacy rate .......................................................... 126 0.63 0.86 39 62 0.63
Enrolment in primary education ............................ 1 1.00 0.98 74 72 1.04
Enrolment in secondary education ................... 125 0.76 0.90 18 24 0.76
Enrolment in tertiary education ......................... 115 0.58 0.86 6 10 0.58
Health and Survival ............................................... 80 0.973 0.956
Sex ratio at birth (female/male) ............................. 1 0.94 0.92 — — 0.97
Healthy life expectancy ........................................ 87 1.04 1.04 52 50 1.04
Political Empowerment ........................................ 58 0.143 0.185
Women in parliament ............................................ 39 0.29 0.22 23 77 0.29
Women in ministerial positions ........................... 74 0.15 0.18 13 87 0.15
Years with female head of state (last 50) .......... 30 0.03 0.16 2 48 0.03
SenegalGender Gap Index 2011 92 0.657
Key Indicators
Total population (millions) 12.86
Population growth (%) 2.57
GDP (US$ billions) 6.97
GDP (PPP) per capita 1,675
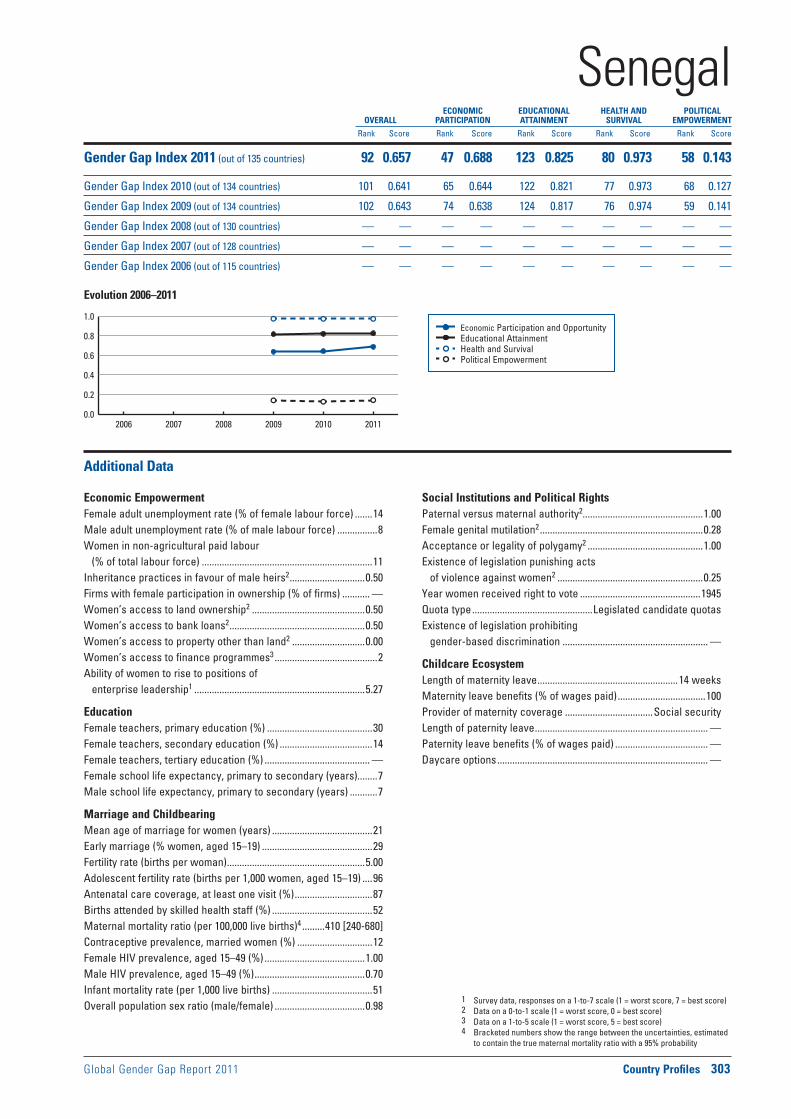
Global Gender Gap Report 2011 Country Profiles 303
Economic Participation and Opportunity Educational Attainment Health and Survival Political Empowerment
Evolution 2006–2011
1 Survey data, responses on a 1-to-7 scale (1 = worst score, 7 = best score)2 Data on a 0-to-1 scale (1 = worst score, 0 = best score)3 Data on a 1-to-5 scale (1 = worst score, 5 = best score)4 Bracketed numbers show the range between the uncertainties, estimated
to contain the true maternal mortality ratio with a 95% probability
ECONOMIC EDUCATIONAL HEALTH AND POLITICAL OVERALL PARTICIPATION ATTAINMENT SURVIVAL EMPOWERMENT
Rank Score Rank Score Rank Score Rank Score Rank Score
0.0
0.2
0.4
0.6
0.8
1.0
2006 2007 2008 2009 2010 2011
Additional Data
Economic EmpowermentFemale adult unemployment rate (% of female labour force) .......14Male adult unemployment rate (% of male labour force) ................8Women in non-agricultural paid labour
(% of total labour force) ....................................................................11Inheritance practices in favour of male heirs2 ..............................0.50Firms with female participation in ownership (% of firms) ........... —Women’s access to land ownership2 .............................................0.50Women’s access to bank loans2 ......................................................0.50Women’s access to property other than land2 .............................0.00Women’s access to finance programmes3 .........................................2Ability of women to rise to positions of
enterprise leadership1 ....................................................................5.27
EducationFemale teachers, primary education (%) ..........................................30Female teachers, secondary education (%) .....................................14Female teachers, tertiary education (%) .......................................... —Female school life expectancy, primary to secondary (years)........7Male school life expectancy, primary to secondary (years) ...........7
Marriage and ChildbearingMean age of marriage for women (years) ........................................21Early marriage (% women, aged 15–19) ............................................29Fertility rate (births per woman) .......................................................5.00Adolescent fertility rate (births per 1,000 women, aged 15–19) ....96Antenatal care coverage, at least one visit (%) ...............................87Births attended by skilled health staff (%) ........................................52Maternal mortality ratio (per 100,000 live births)4 .........410 [240-680]Contraceptive prevalence, married women (%) ..............................12Female HIV prevalence, aged 15–49 (%) ........................................1.00Male HIV prevalence, aged 15–49 (%) ............................................0.70Infant mortality rate (per 1,000 live births) ........................................51Overall population sex ratio (male/female) ....................................0.98
Social Institutions and Political RightsPaternal versus maternal authority2................................................1.00Female genital mutilation2 .................................................................0.28Acceptance or legality of polygamy2 ..............................................1.00Existence of legislation punishing acts
of violence against women2 ..........................................................0.25Year women received right to vote ................................................1945Quota type ................................................Legislated candidate quotasExistence of legislation prohibiting
gender-based discrimination .......................................................... —
Childcare EcosystemLength of maternity leave ........................................................14 weeksMaternity leave benefits (% of wages paid) ...................................100Provider of maternity coverage ...................................Social securityLength of paternity leave ..................................................................... —Paternity leave benefits (% of wages paid) ..................................... —Daycare options .................................................................................... —
SenegalGender Gap Index 2011 (out of 135 countries) 92 0.657 47 0.688 123 0.825 80 0.973 58 0.143
Gender Gap Index 2010 (out of 134 countries) 101 0.641 65 0.644 122 0.821 77 0.973 68 0.127
Gender Gap Index 2009 (out of 134 countries) 102 0.643 74 0.638 124 0.817 76 0.974 59 0.141
Gender Gap Index 2008 (out of 130 countries) — — — — — — — — — —
Gender Gap Index 2007 (out of 128 countries) — — — — — — — — — —
Gender Gap Index 2006 (out of 115 countries) — — — — — — — — — —
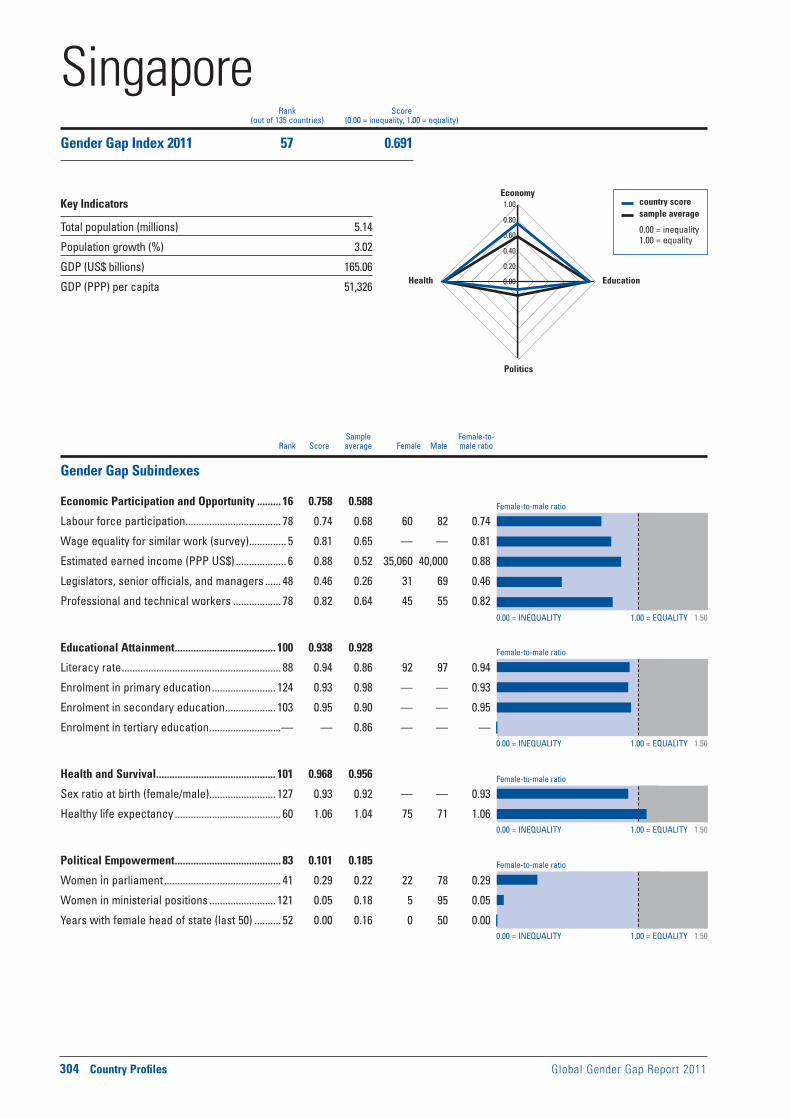
Female-to-male ratio
0.00 = INEQUALITY 1.00 = EQUALITY 1.50
0.00 = INEQUALITY 1.00 = EQUALITY 1.50
0.00 = INEQUALITY 1.00 = EQUALITY 1.50
0.00 = INEQUALITY 1.00 = EQUALITY 1.50
Female-to-male ratio
Female-to-male ratio
Female-to-male ratio
304 Country Profiles Global Gender Gap Report 2011
Sample Female-to- Rank Score average Female Male male ratio
country score sample average
0.00 = inequality 1.00 = equality
0.00
0.20
0.40
0.60
0.80
1.00Economy
Education
Politics
Health
Rank Score(out of 135 countries) (0.00 = inequality, 1.00 = equality)
Gender Gap Subindexes
Economic Participation and Opportunity ......... 16 0.758 0.588
Labour force participation .................................... 78 0.74 0.68 60 82 0.74
Wage equality for similar work (survey) .............. 5 0.81 0.65 — — 0.81
Estimated earned income (PPP US$) ................... 6 0.88 0.52 35,060 40,000 0.88
Legislators, senior officials, and managers ...... 48 0.46 0.26 31 69 0.46
Professional and technical workers .................. 78 0.82 0.64 45 55 0.82
Educational Attainment ...................................... 100 0.938 0.928
Literacy rate ............................................................ 88 0.94 0.86 92 97 0.94
Enrolment in primary education ........................ 124 0.93 0.98 — — 0.93
Enrolment in secondary education ................... 103 0.95 0.90 — — 0.95
Enrolment in tertiary education ...........................— — 0.86 — — —
Health and Survival ............................................. 101 0.968 0.956
Sex ratio at birth (female/male) ......................... 127 0.93 0.92 — — 0.93
Healthy life expectancy ........................................ 60 1.06 1.04 75 71 1.06
Political Empowerment ........................................ 83 0.101 0.185
Women in parliament ............................................ 41 0.29 0.22 22 78 0.29
Women in ministerial positions ......................... 121 0.05 0.18 5 95 0.05
Years with female head of state (last 50) .......... 52 0.00 0.16 0 50 0.00
SingaporeGender Gap Index 2011 57 0.691
Key Indicators
Total population (millions) 5.14
Population growth (%) 3.02
GDP (US$ billions) 165.06
GDP (PPP) per capita 51,326
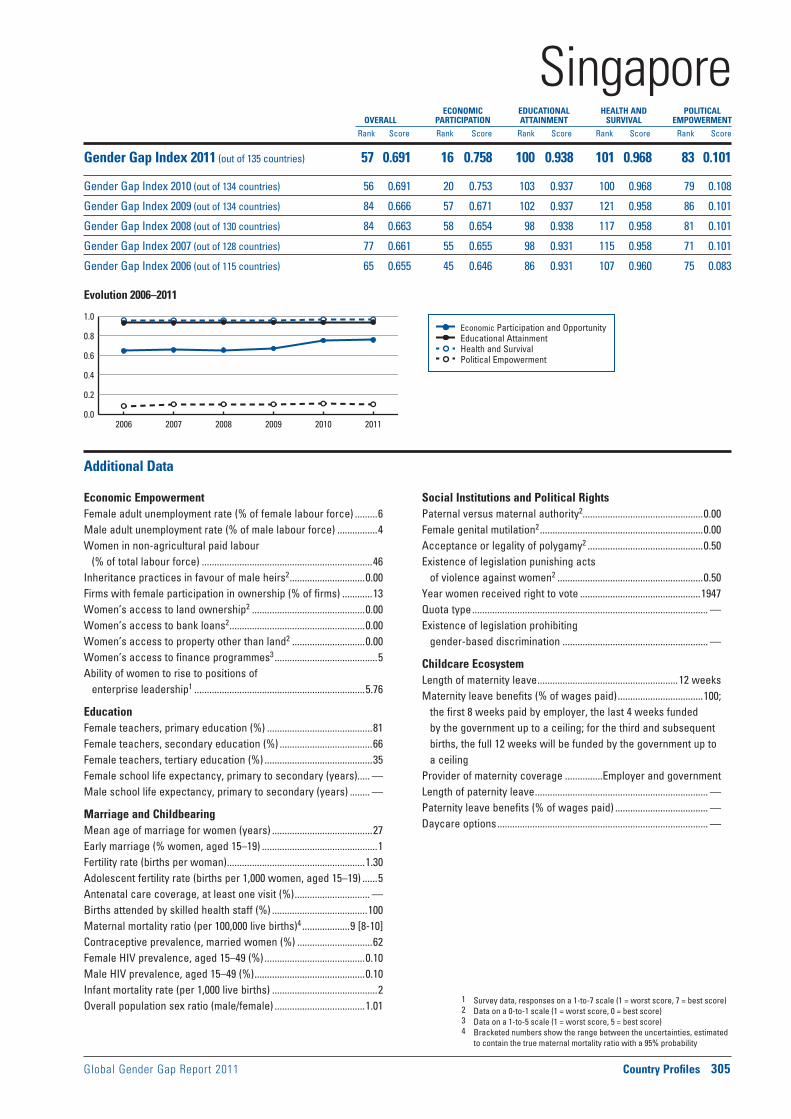
Global Gender Gap Report 2011 Country Profiles 305
Economic Participation and Opportunity Educational Attainment Health and Survival Political Empowerment
Evolution 2006–2011
1 Survey data, responses on a 1-to-7 scale (1 = worst score, 7 = best score)2 Data on a 0-to-1 scale (1 = worst score, 0 = best score)3 Data on a 1-to-5 scale (1 = worst score, 5 = best score)4 Bracketed numbers show the range between the uncertainties, estimated
to contain the true maternal mortality ratio with a 95% probability
ECONOMIC EDUCATIONAL HEALTH AND POLITICAL OVERALL PARTICIPATION ATTAINMENT SURVIVAL EMPOWERMENT
Rank Score Rank Score Rank Score Rank Score Rank Score
0.0
0.2
0.4
0.6
0.8
1.0
2006 2007 2008 2009 2010 2011
Additional Data
Economic EmpowermentFemale adult unemployment rate (% of female labour force) .........6Male adult unemployment rate (% of male labour force) ................4Women in non-agricultural paid labour
(% of total labour force) ....................................................................46Inheritance practices in favour of male heirs2 ..............................0.00Firms with female participation in ownership (% of firms) ............13Women’s access to land ownership2 .............................................0.00Women’s access to bank loans2 ......................................................0.00Women’s access to property other than land2 .............................0.00Women’s access to finance programmes3 .........................................5Ability of women to rise to positions of
enterprise leadership1 ....................................................................5.76
EducationFemale teachers, primary education (%) ..........................................81Female teachers, secondary education (%) .....................................66Female teachers, tertiary education (%) ...........................................35Female school life expectancy, primary to secondary (years)..... —Male school life expectancy, primary to secondary (years) ........ —
Marriage and ChildbearingMean age of marriage for women (years) ........................................27Early marriage (% women, aged 15–19) ..............................................1Fertility rate (births per woman) .......................................................1.30Adolescent fertility rate (births per 1,000 women, aged 15–19) ......5Antenatal care coverage, at least one visit (%) .............................. —Births attended by skilled health staff (%) ......................................100Maternal mortality ratio (per 100,000 live births)4 ...................9 [8-10]Contraceptive prevalence, married women (%) ..............................62Female HIV prevalence, aged 15–49 (%) ........................................0.10Male HIV prevalence, aged 15–49 (%) ............................................0.10Infant mortality rate (per 1,000 live births) ..........................................2Overall population sex ratio (male/female) ....................................1.01
Social Institutions and Political RightsPaternal versus maternal authority2................................................0.00Female genital mutilation2 .................................................................0.00Acceptance or legality of polygamy2 ..............................................0.50Existence of legislation punishing acts
of violence against women2 ..........................................................0.50Year women received right to vote ................................................1947Quota type .............................................................................................. —Existence of legislation prohibiting
gender-based discrimination .......................................................... —
Childcare EcosystemLength of maternity leave ........................................................12 weeksMaternity leave benefits (% of wages paid) ..................................100;
the first 8 weeks paid by employer, the last 4 weeks funded by the government up to a ceiling; for the third and subsequent births, the full 12 weeks will be funded by the government up to a ceiling
Provider of maternity coverage ...............Employer and governmentLength of paternity leave ..................................................................... —Paternity leave benefits (% of wages paid) ..................................... —Daycare options .................................................................................... —
SingaporeGender Gap Index 2011 (out of 135 countries) 57 0.691 16 0.758 100 0.938 101 0.968 83 0.101
Gender Gap Index 2010 (out of 134 countries) 56 0.691 20 0.753 103 0.937 100 0.968 79 0.108
Gender Gap Index 2009 (out of 134 countries) 84 0.666 57 0.671 102 0.937 121 0.958 86 0.101
Gender Gap Index 2008 (out of 130 countries) 84 0.663 58 0.654 98 0.938 117 0.958 81 0.101
Gender Gap Index 2007 (out of 128 countries) 77 0.661 55 0.655 98 0.931 115 0.958 71 0.101
Gender Gap Index 2006 (out of 115 countries) 65 0.655 45 0.646 86 0.931 107 0.960 75 0.083
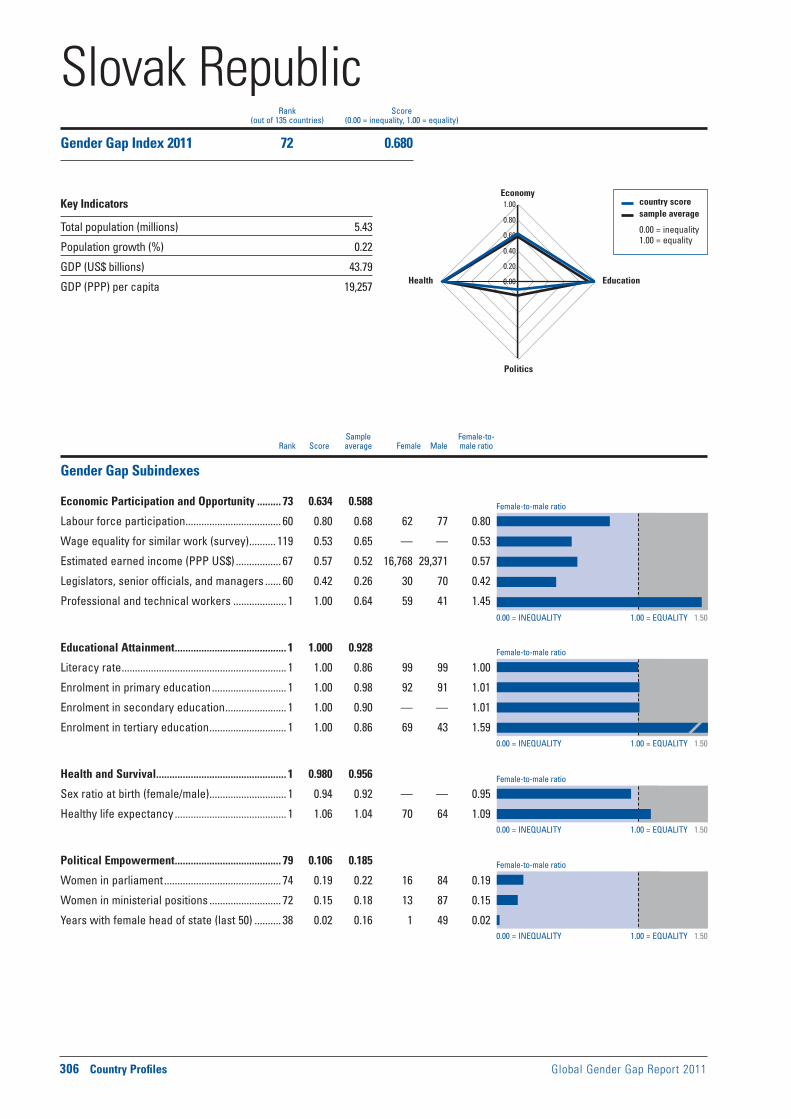
Female-to-male ratio
0.00 = INEQUALITY 1.00 = EQUALITY 1.50
0.00 = INEQUALITY 1.00 = EQUALITY 1.50
0.00 = INEQUALITY 1.00 = EQUALITY 1.50
0.00 = INEQUALITY 1.00 = EQUALITY 1.50
Female-to-male ratio
Female-to-male ratio
Female-to-male ratio
306 Country Profiles Global Gender Gap Report 2011
Sample Female-to- Rank Score average Female Male male ratio
country score sample average
0.00 = inequality 1.00 = equality
0.00
0.20
0.40
0.60
0.80
1.00Economy
Education
Politics
Health
Rank Score(out of 135 countries) (0.00 = inequality, 1.00 = equality)
Gender Gap Subindexes
Economic Participation and Opportunity ......... 73 0.634 0.588
Labour force participation .................................... 60 0.80 0.68 62 77 0.80
Wage equality for similar work (survey) .......... 119 0.53 0.65 — — 0.53
Estimated earned income (PPP US$) ................. 67 0.57 0.52 16,768 29,371 0.57
Legislators, senior officials, and managers ...... 60 0.42 0.26 30 70 0.42
Professional and technical workers .................... 1 1.00 0.64 59 41 1.45
Educational Attainment .......................................... 1 1.000 0.928
Literacy rate .............................................................. 1 1.00 0.86 99 99 1.00
Enrolment in primary education ............................ 1 1.00 0.98 92 91 1.01
Enrolment in secondary education ....................... 1 1.00 0.90 — — 1.01
Enrolment in tertiary education ............................. 1 1.00 0.86 69 43 1.59
Health and Survival ................................................. 1 0.980 0.956
Sex ratio at birth (female/male) ............................. 1 0.94 0.92 — — 0.95
Healthy life expectancy .......................................... 1 1.06 1.04 70 64 1.09
Political Empowerment ........................................ 79 0.106 0.185
Women in parliament ............................................ 74 0.19 0.22 16 84 0.19
Women in ministerial positions ........................... 72 0.15 0.18 13 87 0.15
Years with female head of state (last 50) .......... 38 0.02 0.16 1 49 0.02
Slovak RepublicGender Gap Index 2011 72 0.680
Key Indicators
Total population (millions) 5.43
Population growth (%) 0.22
GDP (US$ billions) 43.79
GDP (PPP) per capita 19,257
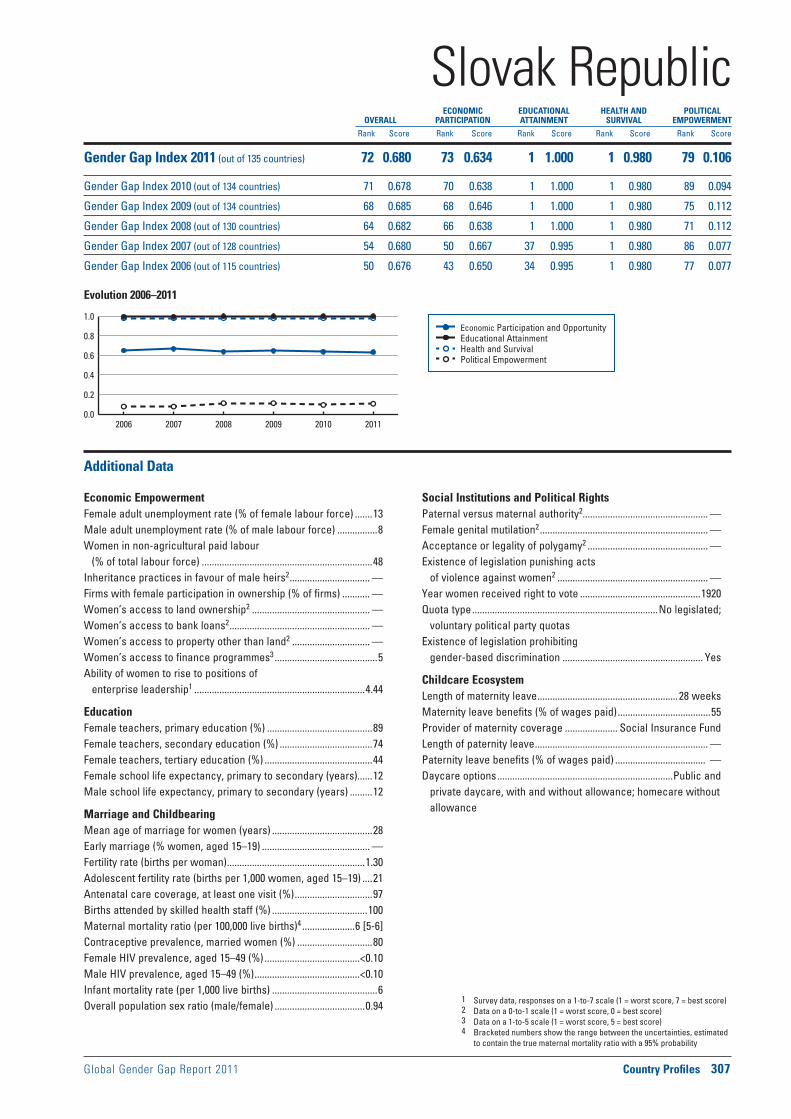
Global Gender Gap Report 2011 Country Profiles 307
Economic Participation and Opportunity Educational Attainment Health and Survival Political Empowerment
Evolution 2006–2011
1 Survey data, responses on a 1-to-7 scale (1 = worst score, 7 = best score)2 Data on a 0-to-1 scale (1 = worst score, 0 = best score)3 Data on a 1-to-5 scale (1 = worst score, 5 = best score)4 Bracketed numbers show the range between the uncertainties, estimated
to contain the true maternal mortality ratio with a 95% probability
ECONOMIC EDUCATIONAL HEALTH AND POLITICAL OVERALL PARTICIPATION ATTAINMENT SURVIVAL EMPOWERMENT
Rank Score Rank Score Rank Score Rank Score Rank Score
0.0
0.2
0.4
0.6
0.8
1.0
2006 2007 2008 2009 2010 2011
Additional Data
Economic EmpowermentFemale adult unemployment rate (% of female labour force) .......13Male adult unemployment rate (% of male labour force) ................8Women in non-agricultural paid labour
(% of total labour force) ....................................................................48Inheritance practices in favour of male heirs2 ................................ —Firms with female participation in ownership (% of firms) ........... —Women’s access to land ownership2 ............................................... —Women’s access to bank loans2 ........................................................ —Women’s access to property other than land2 ............................... —Women’s access to finance programmes3 .........................................5Ability of women to rise to positions of
enterprise leadership1 ....................................................................4.44
EducationFemale teachers, primary education (%) ..........................................89Female teachers, secondary education (%) .....................................74Female teachers, tertiary education (%) ...........................................44Female school life expectancy, primary to secondary (years)......12Male school life expectancy, primary to secondary (years) .........12
Marriage and ChildbearingMean age of marriage for women (years) ........................................28Early marriage (% women, aged 15–19) ........................................... —Fertility rate (births per woman) .......................................................1.30Adolescent fertility rate (births per 1,000 women, aged 15–19) ....21Antenatal care coverage, at least one visit (%) ...............................97Births attended by skilled health staff (%) ......................................100Maternal mortality ratio (per 100,000 live births)4 .....................6 [5-6]Contraceptive prevalence, married women (%) ..............................80Female HIV prevalence, aged 15–49 (%) ......................................<0.10Male HIV prevalence, aged 15–49 (%) ..........................................<0.10Infant mortality rate (per 1,000 live births) ..........................................6Overall population sex ratio (male/female) ....................................0.94
Social Institutions and Political RightsPaternal versus maternal authority2.................................................. —Female genital mutilation2 ................................................................... —Acceptance or legality of polygamy2 ................................................ —Existence of legislation punishing acts
of violence against women2 ............................................................ —Year women received right to vote ................................................1920Quota type ..........................................................................No legislated;
voluntary political party quotasExistence of legislation prohibiting
gender-based discrimination ........................................................ Yes
Childcare EcosystemLength of maternity leave ........................................................28 weeksMaternity leave benefits (% of wages paid) .....................................55Provider of maternity coverage ..................... Social Insurance FundLength of paternity leave ..................................................................... —Paternity leave benefits (% of wages paid) .................................... — Daycare options ......................................................................Public and
private daycare, with and without allowance; homecare without allowance
Slovak RepublicGender Gap Index 2011 (out of 135 countries) 72 0.680 73 0.634 1 1.000 1 0.980 79 0.106
Gender Gap Index 2010 (out of 134 countries) 71 0.678 70 0.638 1 1.000 1 0.980 89 0.094
Gender Gap Index 2009 (out of 134 countries) 68 0.685 68 0.646 1 1.000 1 0.980 75 0.112
Gender Gap Index 2008 (out of 130 countries) 64 0.682 66 0.638 1 1.000 1 0.980 71 0.112
Gender Gap Index 2007 (out of 128 countries) 54 0.680 50 0.667 37 0.995 1 0.980 86 0.077
Gender Gap Index 2006 (out of 115 countries) 50 0.676 43 0.650 34 0.995 1 0.980 77 0.077
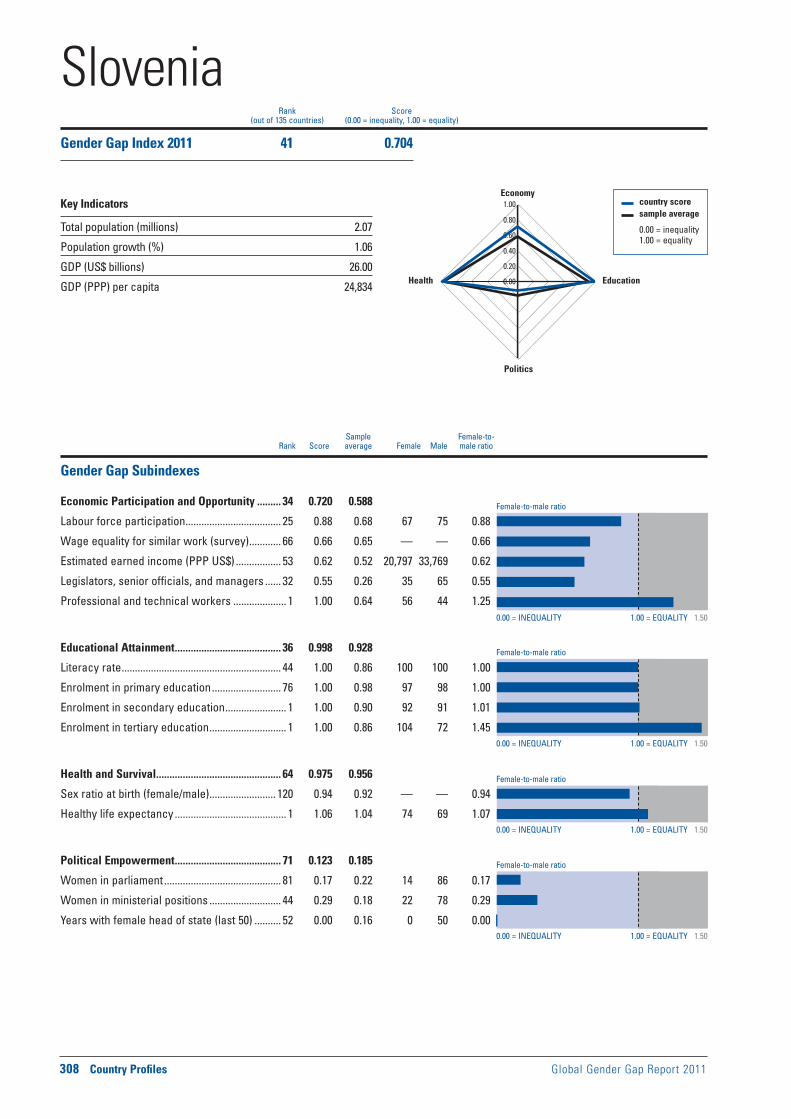
Female-to-male ratio
0.00 = INEQUALITY 1.00 = EQUALITY 1.50
0.00 = INEQUALITY 1.00 = EQUALITY 1.50
0.00 = INEQUALITY 1.00 = EQUALITY 1.50
0.00 = INEQUALITY 1.00 = EQUALITY 1.50
Female-to-male ratio
Female-to-male ratio
Female-to-male ratio
308 Country Profiles Global Gender Gap Report 2011
Sample Female-to- Rank Score average Female Male male ratio
country score sample average
0.00 = inequality 1.00 = equality
0.00
0.20
0.40
0.60
0.80
1.00Economy
Education
Politics
Health
Rank Score(out of 135 countries) (0.00 = inequality, 1.00 = equality)
Gender Gap Subindexes
Economic Participation and Opportunity ......... 34 0.720 0.588
Labour force participation .................................... 25 0.88 0.68 67 75 0.88
Wage equality for similar work (survey) ............ 66 0.66 0.65 — — 0.66
Estimated earned income (PPP US$) ................. 53 0.62 0.52 20,797 33,769 0.62
Legislators, senior officials, and managers ...... 32 0.55 0.26 35 65 0.55
Professional and technical workers .................... 1 1.00 0.64 56 44 1.25
Educational Attainment ........................................ 36 0.998 0.928
Literacy rate ............................................................ 44 1.00 0.86 100 100 1.00
Enrolment in primary education .......................... 76 1.00 0.98 97 98 1.00
Enrolment in secondary education ....................... 1 1.00 0.90 92 91 1.01
Enrolment in tertiary education ............................. 1 1.00 0.86 104 72 1.45
Health and Survival ............................................... 64 0.975 0.956
Sex ratio at birth (female/male) ......................... 120 0.94 0.92 — — 0.94
Healthy life expectancy .......................................... 1 1.06 1.04 74 69 1.07
Political Empowerment ........................................ 71 0.123 0.185
Women in parliament ............................................ 81 0.17 0.22 14 86 0.17
Women in ministerial positions ........................... 44 0.29 0.18 22 78 0.29
Years with female head of state (last 50) .......... 52 0.00 0.16 0 50 0.00
SloveniaGender Gap Index 2011 41 0.704
Key Indicators
Total population (millions) 2.07
Population growth (%) 1.06
GDP (US$ billions) 26.00
GDP (PPP) per capita 24,834
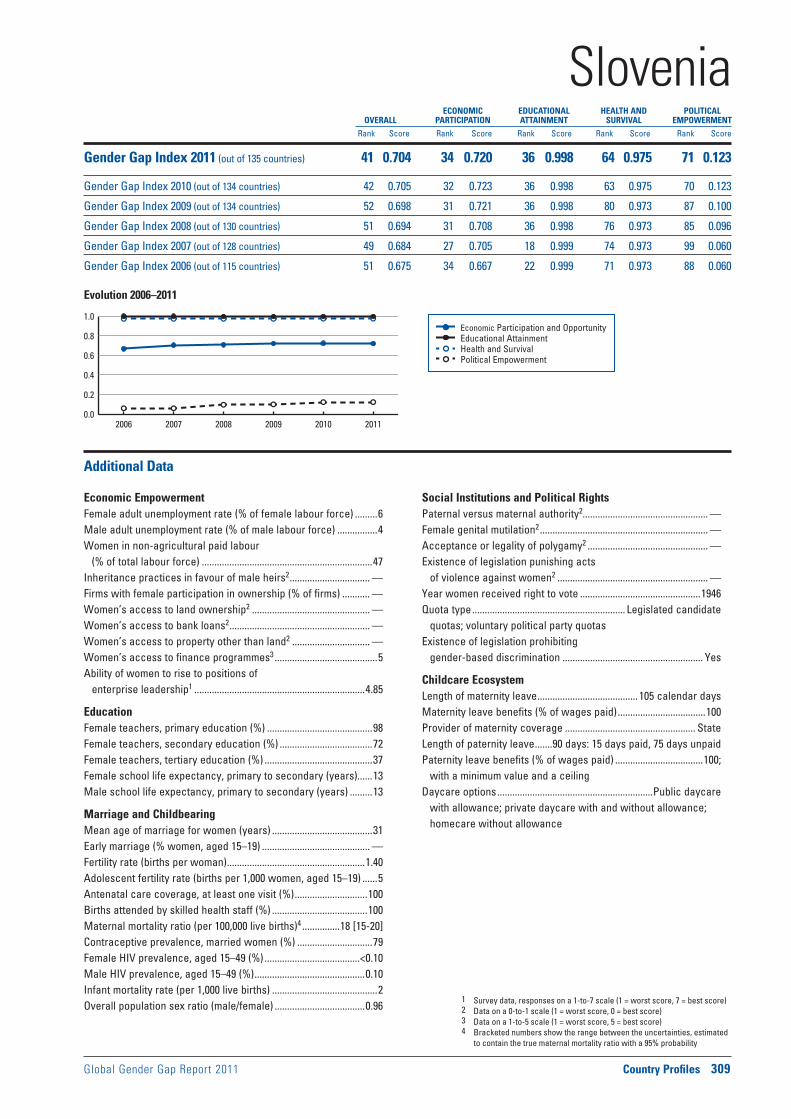
Global Gender Gap Report 2011 Country Profiles 309
Economic Participation and Opportunity Educational Attainment Health and Survival Political Empowerment
Evolution 2006–2011
1 Survey data, responses on a 1-to-7 scale (1 = worst score, 7 = best score)2 Data on a 0-to-1 scale (1 = worst score, 0 = best score)3 Data on a 1-to-5 scale (1 = worst score, 5 = best score)4 Bracketed numbers show the range between the uncertainties, estimated
to contain the true maternal mortality ratio with a 95% probability
ECONOMIC EDUCATIONAL HEALTH AND POLITICAL OVERALL PARTICIPATION ATTAINMENT SURVIVAL EMPOWERMENT
Rank Score Rank Score Rank Score Rank Score Rank Score
0.0
0.2
0.4
0.6
0.8
1.0
2006 2007 2008 2009 2010 2011
Additional Data
Economic EmpowermentFemale adult unemployment rate (% of female labour force) .........6Male adult unemployment rate (% of male labour force) ................4Women in non-agricultural paid labour
(% of total labour force) ....................................................................47Inheritance practices in favour of male heirs2 ................................ —Firms with female participation in ownership (% of firms) ........... —Women’s access to land ownership2 ............................................... —Women’s access to bank loans2 ........................................................ —Women’s access to property other than land2 ............................... —Women’s access to finance programmes3 .........................................5Ability of women to rise to positions of
enterprise leadership1 ....................................................................4.85
EducationFemale teachers, primary education (%) ..........................................98Female teachers, secondary education (%) .....................................72Female teachers, tertiary education (%) ...........................................37Female school life expectancy, primary to secondary (years)......13Male school life expectancy, primary to secondary (years) .........13
Marriage and ChildbearingMean age of marriage for women (years) ........................................31Early marriage (% women, aged 15–19) ........................................... —Fertility rate (births per woman) .......................................................1.40Adolescent fertility rate (births per 1,000 women, aged 15–19) ......5Antenatal care coverage, at least one visit (%) .............................100Births attended by skilled health staff (%) ......................................100Maternal mortality ratio (per 100,000 live births)4 ...............18 [15-20]Contraceptive prevalence, married women (%) ..............................79Female HIV prevalence, aged 15–49 (%) ......................................<0.10Male HIV prevalence, aged 15–49 (%) ............................................0.10Infant mortality rate (per 1,000 live births) ..........................................2Overall population sex ratio (male/female) ....................................0.96
Social Institutions and Political RightsPaternal versus maternal authority2.................................................. —Female genital mutilation2 ................................................................... —Acceptance or legality of polygamy2 ................................................ —Existence of legislation punishing acts
of violence against women2 ............................................................ —Year women received right to vote ................................................1946Quota type ............................................................. Legislated candidate
quotas; voluntary political party quotasExistence of legislation prohibiting
gender-based discrimination ........................................................ Yes
Childcare EcosystemLength of maternity leave ........................................ 105 calendar daysMaternity leave benefits (% of wages paid) ...................................100Provider of maternity coverage .................................................... StateLength of paternity leave .......90 days: 15 days paid, 75 days unpaidPaternity leave benefits (% of wages paid) ...................................100;
with a minimum value and a ceilingDaycare options ..............................................................Public daycare
with allowance; private daycare with and without allowance; homecare without allowance
SloveniaGender Gap Index 2011 (out of 135 countries) 41 0.704 34 0.720 36 0.998 64 0.975 71 0.123
Gender Gap Index 2010 (out of 134 countries) 42 0.705 32 0.723 36 0.998 63 0.975 70 0.123
Gender Gap Index 2009 (out of 134 countries) 52 0.698 31 0.721 36 0.998 80 0.973 87 0.100
Gender Gap Index 2008 (out of 130 countries) 51 0.694 31 0.708 36 0.998 76 0.973 85 0.096
Gender Gap Index 2007 (out of 128 countries) 49 0.684 27 0.705 18 0.999 74 0.973 99 0.060
Gender Gap Index 2006 (out of 115 countries) 51 0.675 34 0.667 22 0.999 71 0.973 88 0.060

Female-to-male ratio
0.00 = INEQUALITY 1.00 = EQUALITY 1.50
0.00 = INEQUALITY 1.00 = EQUALITY 1.50
0.00 = INEQUALITY 1.00 = EQUALITY 1.50
0.00 = INEQUALITY 1.00 = EQUALITY 1.50
Female-to-male ratio
Female-to-male ratio
Female-to-male ratio
310 Country Profiles Global Gender Gap Report 2011
Sample Female-to- Rank Score average Female Male male ratio
country score sample average
0.00 = inequality 1.00 = equality
0.00
0.20
0.40
0.60
0.80
1.00Economy
Education
Politics
Health
Rank Score(out of 135 countries) (0.00 = inequality, 1.00 = equality)
Gender Gap Subindexes
Economic Participation and Opportunity ......... 58 0.665 0.588
Labour force participation .................................... 72 0.76 0.68 51 67 0.76
Wage equality for similar work (survey) ............ 67 0.66 0.65 — — 0.66
Estimated earned income (PPP US$) ................. 74 0.56 0.52 7,411 13,225 0.56
Legislators, senior officials, and managers ...... 59 0.43 0.26 30 70 0.43
Professional and technical workers .................... 1 1.00 0.64 52 48 1.10
Educational Attainment ........................................ 86 0.981 0.928
Literacy rate ............................................................ 83 0.96 0.86 87 91 0.96
Enrolment in primary education .......................... 69 1.00 0.98 85 85 1.00
Enrolment in secondary education ....................... 1 1.00 0.90 65 59 1.11
Enrolment in tertiary education ........................... 94 0.91 0.86 14 16 0.91
Health and Survival ............................................. 102 0.968 0.956
Sex ratio at birth (female/male) ............................. 1 0.94 0.92 — — 0.98
Healthy life expectancy ...................................... 107 1.02 1.04 48 47 1.02
Political Empowerment .......................................... 9 0.377 0.185
Women in parliament .............................................. 2 0.80 0.22 45 56 0.80
Women in ministerial positions ........................... 14 0.52 0.18 34 66 0.52
Years with female head of state (last 50) .......... 52 0.00 0.16 0 50 0.00
South AfricaGender Gap Index 2011 14 0.748
Key Indicators
Total population (millions) 49.96
Population growth (%) 1.29
GDP (US$ billions) 187.23
GDP (PPP) per capita 9,482

Global Gender Gap Report 2011 Country Profiles 311
Economic Participation and Opportunity Educational Attainment Health and Survival Political Empowerment
Evolution 2006–2011
1 Survey data, responses on a 1-to-7 scale (1 = worst score, 7 = best score)2 Data on a 0-to-1 scale (1 = worst score, 0 = best score)3 Data on a 1-to-5 scale (1 = worst score, 5 = best score)4 Bracketed numbers show the range between the uncertainties, estimated
to contain the true maternal mortality ratio with a 95% probability
ECONOMIC EDUCATIONAL HEALTH AND POLITICAL OVERALL PARTICIPATION ATTAINMENT SURVIVAL EMPOWERMENT
Rank Score Rank Score Rank Score Rank Score Rank Score
0.0
0.2
0.4
0.6
0.8
1.0
2006 2007 2008 2009 2010 2011
Additional Data
Economic EmpowermentFemale adult unemployment rate (% of female labour force) .......26Male adult unemployment rate (% of male labour force) ..............20Women in non-agricultural paid labour
(% of total labour force) ....................................................................44Inheritance practices in favour of male heirs2 ..............................1.00Firms with female participation in ownership (% of firms) ............37Women’s access to land ownership2 .............................................0.50Women’s access to bank loans2 ......................................................0.50Women’s access to property other than land2 .............................0.00Women’s access to finance programmes3 .........................................4Ability of women to rise to positions of
enterprise leadership1 ....................................................................4.88
EducationFemale teachers, primary education (%) ..........................................77Female teachers, secondary education (%) .....................................55Female teachers, tertiary education (%) .......................................... —Female school life expectancy, primary to secondary (years)......12Male school life expectancy, primary to secondary (years) .........12
Marriage and ChildbearingMean age of marriage for women (years) ........................................28Early marriage (% women, aged 15–19) ..............................................3Fertility rate (births per woman) .......................................................2.50Adolescent fertility rate (births per 1,000 women, aged 15–19) ....54Antenatal care coverage, at least one visit (%) ...............................92Births attended by skilled health staff (%) ........................................91Maternal mortality ratio (per 100,000 live births)4 .........410 [240-610]Contraceptive prevalence, married women (%) ..............................60Female HIV prevalence, aged 15–49 (%) ......................................22.50Male HIV prevalence, aged 15–49 (%) ..........................................13.10Infant mortality rate (per 1,000 live births) ........................................43Overall population sex ratio (male/female) ....................................0.97
Social Institutions and Political RightsPaternal versus maternal authority2................................................0.50Female genital mutilation2 .................................................................0.00Acceptance or legality of polygamy2 ..............................................0.50Existence of legislation punishing acts
of violence against women2 ..........................................................0.42Year women received right to vote ......................................1930, 1994Quota type ..........................................................................No legislated;
voluntary political party quotasExistence of legislation prohibiting
gender-based discrimination .......................................................... —
Childcare EcosystemLength of maternity leave ........................................................ 4 monthsMaternity leave benefits (% of wages paid) ......... Up to a maximum
amount of 60% depending on the level of incomeProvider of maternity coverage ......Unemployment Insurance FundLength of paternity leave ..................................................................... —Paternity leave benefits (% of wages paid) ..................................... —Daycare options .................................................................................... —
South AfricaGender Gap Index 2011 (out of 135 countries) 14 0.748 58 0.665 86 0.981 102 0.968 9 0.377
Gender Gap Index 2010 (out of 134 countries) 12 0.753 55 0.673 43 0.996 101 0.968 9 0.377
Gender Gap Index 2009 (out of 134 countries) 6 0.771 60 0.663 43 0.996 70 0.975 5 0.449
Gender Gap Index 2008 (out of 130 countries) 22 0.723 93 0.568 45 0.996 67 0.975 9 0.353
Gender Gap Index 2007 (out of 128 countries) 20 0.719 85 0.586 52 0.991 65 0.975 10 0.326
Gender Gap Index 2006 (out of 115 countries) 18 0.713 79 0.556 42 0.993 59 0.976 8 0.326

Female-to-male ratio
0.00 = INEQUALITY 1.00 = EQUALITY 1.50
0.00 = INEQUALITY 1.00 = EQUALITY 1.50
0.00 = INEQUALITY 1.00 = EQUALITY 1.50
0.00 = INEQUALITY 1.00 = EQUALITY 1.50
Female-to-male ratio
Female-to-male ratio
Female-to-male ratio
312 Country Profiles Global Gender Gap Report 2011
Sample Female-to- Rank Score average Female Male male ratio
country score sample average
0.00 = inequality 1.00 = equality
0.00
0.20
0.40
0.60
0.80
1.00Economy
Education
Politics
Health
Rank Score(out of 135 countries) (0.00 = inequality, 1.00 = equality)
Gender Gap Subindexes
Economic Participation and Opportunity ......... 74 0.633 0.588
Labour force participation .................................... 70 0.77 0.68 63 82 0.77
Wage equality for similar work (survey) .......... 122 0.53 0.65 — — 0.53
Estimated earned income (PPP US$) ................. 64 0.57 0.52 22,985 40,000 0.57
Legislators, senior officials, and managers ...... 43 0.48 0.26 32 68 0.48
Professional and technical workers .................. 61 0.98 0.64 50 50 0.98
Educational Attainment ........................................ 37 0.997 0.928
Literacy rate ............................................................ 68 0.98 0.86 97 98 0.98
Enrolment in primary education ............................ 1 1.00 0.98 100 100 1.00
Enrolment in secondary education ....................... 1 1.00 0.90 97 94 1.03
Enrolment in tertiary education ............................. 1 1.00 0.86 82 66 1.24
Health and Survival ............................................... 56 0.976 0.956
Sex ratio at birth (female/male) ......................... 118 0.94 0.92 — — 0.94
Healthy life expectancy .......................................... 1 1.06 1.04 76 71 1.07
Political Empowerment .......................................... 5 0.426 0.185
Women in parliament ............................................ 14 0.58 0.22 37 63 0.58
Women in ministerial positions ............................. 1 1.00 0.18 53 47 1.13
Years with female head of state (last 50) .......... 52 0.00 0.16 0 50 0.00
SpainGender Gap Index 2011 12 0.758
Key Indicators
Total population (millions) 46.22
Population growth (%) 0.56
GDP (US$ billions) 712.34
GDP (PPP) per capita 26,855

Global Gender Gap Report 2011 Country Profiles 313
Economic Participation and Opportunity Educational Attainment Health and Survival Political Empowerment
Evolution 2006–2011
1 Survey data, responses on a 1-to-7 scale (1 = worst score, 7 = best score)2 Data on a 0-to-1 scale (1 = worst score, 0 = best score)3 Data on a 1-to-5 scale (1 = worst score, 5 = best score)4 Bracketed numbers show the range between the uncertainties, estimated
to contain the true maternal mortality ratio with a 95% probability
ECONOMIC EDUCATIONAL HEALTH AND POLITICAL OVERALL PARTICIPATION ATTAINMENT SURVIVAL EMPOWERMENT
Rank Score Rank Score Rank Score Rank Score Rank Score
0.0
0.2
0.4
0.6
0.8
1.0
2006 2007 2008 2009 2010 2011
Additional Data
Economic EmpowermentFemale adult unemployment rate (% of female labour force) .......18Male adult unemployment rate (% of male labour force) ..............10Women in non-agricultural paid labour
(% of total labour force) ....................................................................45Inheritance practices in favour of male heirs2 ................................ —Firms with female participation in ownership (% of firms) ........... —Women’s access to land ownership2 ............................................... —Women’s access to bank loans2 ........................................................ —Women’s access to property other than land2 ............................... —Women’s access to finance programmes3 .........................................5Ability of women to rise to positions of
enterprise leadership1 ....................................................................3.81
EducationFemale teachers, primary education (%) ..........................................75Female teachers, secondary education (%) .....................................55Female teachers, tertiary education (%) ...........................................38Female school life expectancy, primary to secondary (years)......14Male school life expectancy, primary to secondary (years) .........13
Marriage and ChildbearingMean age of marriage for women (years) ........................................29Early marriage (% women, aged 15–19) ........................................... —Fertility rate (births per woman) .......................................................1.40Adolescent fertility rate (births per 1,000 women, aged 15–19) ....13Antenatal care coverage, at least one visit (%) .............................. —Births attended by skilled health staff (%) ....................................... —Maternal mortality ratio (per 100,000 live births)4 .....................6 [5-7]Contraceptive prevalence, married women (%) ..............................66Female HIV prevalence, aged 15–49 (%) ........................................0.20Male HIV prevalence, aged 15–49 (%) ............................................0.60Infant mortality rate (per 1,000 live births) ..........................................3Overall population sex ratio (male/female) ....................................0.97
Social Institutions and Political RightsPaternal versus maternal authority2.................................................. —Female genital mutilation2 ................................................................... —Acceptance or legality of polygamy2 ................................................ —Existence of legislation punishing acts
of violence against women2 ............................................................ —Year women received right to vote ................................................1931Quota type ............................................................. Legislated candidate
quotas; voluntary political party quotasExistence of legislation prohibiting
gender-based discrimination ........................................................ Yes
Childcare EcosystemLength of maternity leave ........................................................16 weeksMaternity leave benefits (% of wages paid) ...................................100Provider of maternity coverage ...................................Social securityLength of paternity leave ...........................................................2 weeksPaternity leave benefits (% of wages paid) ....................................100Daycare options ......................................................................Public and
private daycare, with and without allowance
SpainGender Gap Index 2011 (out of 135 countries) 12 0.758 74 0.633 37 0.997 56 0.976 5 0.426
Gender Gap Index 2010 (out of 134 countries) 11 0.755 78 0.624 40 0.996 63 0.975 5 0.426
Gender Gap Index 2009 (out of 134 countries) 17 0.734 90 0.602 56 0.994 80 0.973 9 0.369
Gender Gap Index 2008 (out of 130 countries) 17 0.728 89 0.577 58 0.994 76 0.973 7 0.369
Gender Gap Index 2007 (out of 128 countries) 10 0.744 84 0.589 39 0.994 74 0.973 5 0.421
Gender Gap Index 2006 (out of 115 countries) 11 0.732 85 0.539 38 0.994 71 0.973 5 0.421
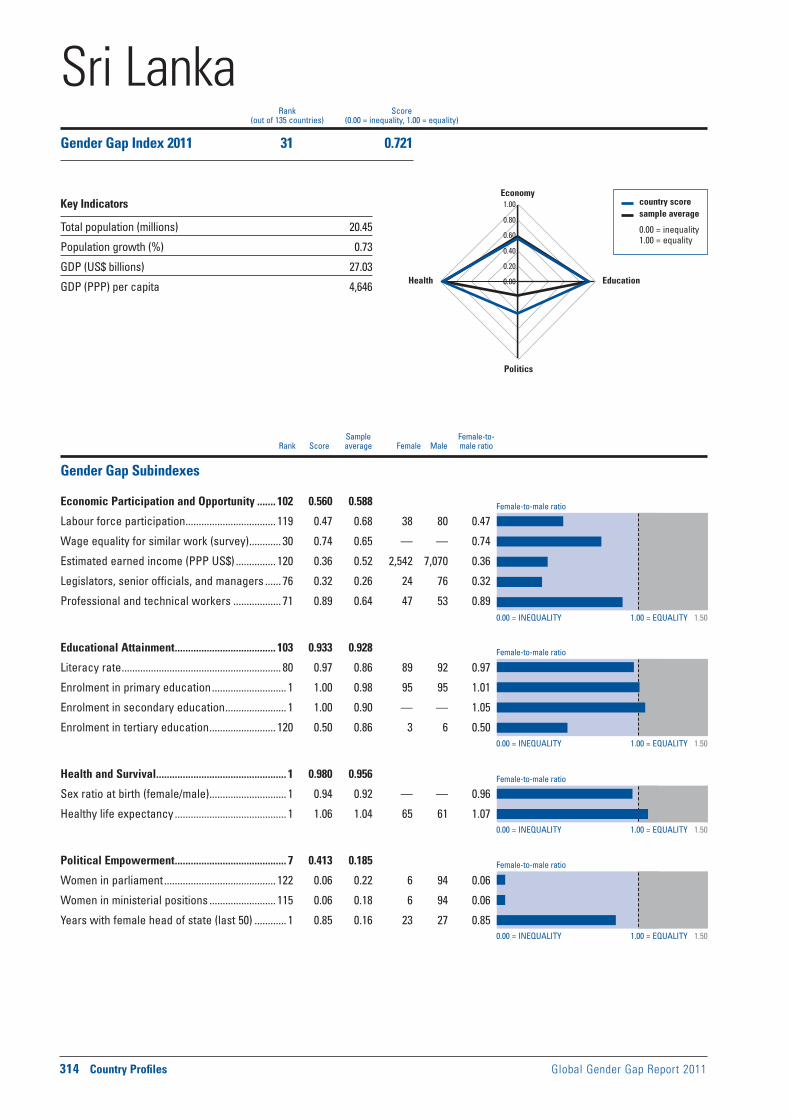
Female-to-male ratio
0.00 = INEQUALITY 1.00 = EQUALITY 1.50
0.00 = INEQUALITY 1.00 = EQUALITY 1.50
0.00 = INEQUALITY 1.00 = EQUALITY 1.50
0.00 = INEQUALITY 1.00 = EQUALITY 1.50
Female-to-male ratio
Female-to-male ratio
Female-to-male ratio
314 Country Profiles Global Gender Gap Report 2011
Sample Female-to- Rank Score average Female Male male ratio
country score sample average
0.00 = inequality 1.00 = equality
0.00
0.20
0.40
0.60
0.80
1.00Economy
Education
Politics
Health
Rank Score(out of 135 countries) (0.00 = inequality, 1.00 = equality)
Gender Gap Subindexes
Economic Participation and Opportunity ....... 102 0.560 0.588
Labour force participation .................................. 119 0.47 0.68 38 80 0.47
Wage equality for similar work (survey) ............ 30 0.74 0.65 — — 0.74
Estimated earned income (PPP US$) ............... 120 0.36 0.52 2,542 7,070 0.36
Legislators, senior officials, and managers ...... 76 0.32 0.26 24 76 0.32
Professional and technical workers .................. 71 0.89 0.64 47 53 0.89
Educational Attainment ...................................... 103 0.933 0.928
Literacy rate ............................................................ 80 0.97 0.86 89 92 0.97
Enrolment in primary education ............................ 1 1.00 0.98 95 95 1.01
Enrolment in secondary education ....................... 1 1.00 0.90 — — 1.05
Enrolment in tertiary education ......................... 120 0.50 0.86 3 6 0.50
Health and Survival ................................................. 1 0.980 0.956
Sex ratio at birth (female/male) ............................. 1 0.94 0.92 — — 0.96
Healthy life expectancy .......................................... 1 1.06 1.04 65 61 1.07
Political Empowerment .......................................... 7 0.413 0.185
Women in parliament .......................................... 122 0.06 0.22 6 94 0.06
Women in ministerial positions ......................... 115 0.06 0.18 6 94 0.06
Years with female head of state (last 50) ............ 1 0.85 0.16 23 27 0.85
Sri LankaGender Gap Index 2011 31 0.721
Key Indicators
Total population (millions) 20.45
Population growth (%) 0.73
GDP (US$ billions) 27.03
GDP (PPP) per capita 4,646

Global Gender Gap Report 2011 Country Profiles 315
Economic Participation and Opportunity Educational Attainment Health and Survival Political Empowerment
Evolution 2006–2011
1 Survey data, responses on a 1-to-7 scale (1 = worst score, 7 = best score)2 Data on a 0-to-1 scale (1 = worst score, 0 = best score)3 Data on a 1-to-5 scale (1 = worst score, 5 = best score)4 Bracketed numbers show the range between the uncertainties, estimated
to contain the true maternal mortality ratio with a 95% probability
ECONOMIC EDUCATIONAL HEALTH AND POLITICAL OVERALL PARTICIPATION ATTAINMENT SURVIVAL EMPOWERMENT
Rank Score Rank Score Rank Score Rank Score Rank Score
0.0
0.2
0.4
0.6
0.8
1.0
2006 2007 2008 2009 2010 2011
Additional Data
Economic EmpowermentFemale adult unemployment rate (% of female labour force) .........8Male adult unemployment rate (% of male labour force) ................4Women in non-agricultural paid labour
(% of total labour force) ....................................................................31Inheritance practices in favour of male heirs2 ..............................0.50Firms with female participation in ownership (% of firms) ........... —Women’s access to land ownership2 .............................................0.50Women’s access to bank loans2 ......................................................0.00Women’s access to property other than land2 .............................0.50Women’s access to finance programmes3 .........................................3Ability of women to rise to positions of
enterprise leadership1 ....................................................................5.31
EducationFemale teachers, primary education (%) ..........................................85Female teachers, secondary education (%) .....................................63Female teachers, tertiary education (%) .......................................... —Female school life expectancy, primary to secondary (years)......13Male school life expectancy, primary to secondary (years) .........12
Marriage and ChildbearingMean age of marriage for women (years) ........................................24Early marriage (% women, aged 15–19) ..............................................7Fertility rate (births per woman) .......................................................2.30Adolescent fertility rate (births per 1,000 women, aged 15–19) ....28Antenatal care coverage, at least one visit (%) ...............................99Births attended by skilled health staff (%) ........................................99Maternal mortality ratio (per 100,000 live births)4 ...............39 [26-57]Contraceptive prevalence, married women (%) ..............................68Female HIV prevalence, aged 15–49 (%) ......................................<0.10Male HIV prevalence, aged 15–49 (%) ..........................................<0.10Infant mortality rate (per 1,000 live births) ........................................13Overall population sex ratio (male/female) ....................................0.97
Social Institutions and Political RightsPaternal versus maternal authority2................................................0.50Female genital mutilation2 .................................................................0.00Acceptance or legality of polygamy2 ..............................................0.00Existence of legislation punishing acts
of violence against women2 ..........................................................0.33Year women received right to vote ................................................1931Quota type .............................................................................................. —Existence of legislation prohibiting
gender-based discrimination .......................................................... —
Childcare EcosystemLength of maternity leave ........................................................12 weeksMaternity leave benefits (% of wages paid) ..................Six-sevenths
(86%) of wages for workers paid at a time-rate or piece-rate; employees covered by the Shop and Offices Employees Act receive 100% of the remuneration
Provider of maternity coverage .............................................EmployerLength of paternity leave ..................................................................... —Paternity leave benefits (% of wages paid) ..................................... —Daycare options .................................................................................... —
Sri LankaGender Gap Index 2011 (out of 135 countries) 31 0.721 102 0.560 103 0.933 1 0.980 7 0.413
Gender Gap Index 2010 (out of 134 countries) 16 0.746 89 0.601 57 0.993 1 0.980 6 0.410
Gender Gap Index 2009 (out of 134 countries) 16 0.740 99 0.573 68 0.992 1 0.980 6 0.416
Gender Gap Index 2008 (out of 130 countries) 12 0.737 99 0.560 65 0.992 1 0.980 5 0.416
Gender Gap Index 2007 (out of 128 countries) 15 0.723 94 0.557 56 0.990 1 0.980 7 0.365
Gender Gap Index 2006 (out of 115 countries) 13 0.720 84 0.545 52 0.990 1 0.980 7 0.365
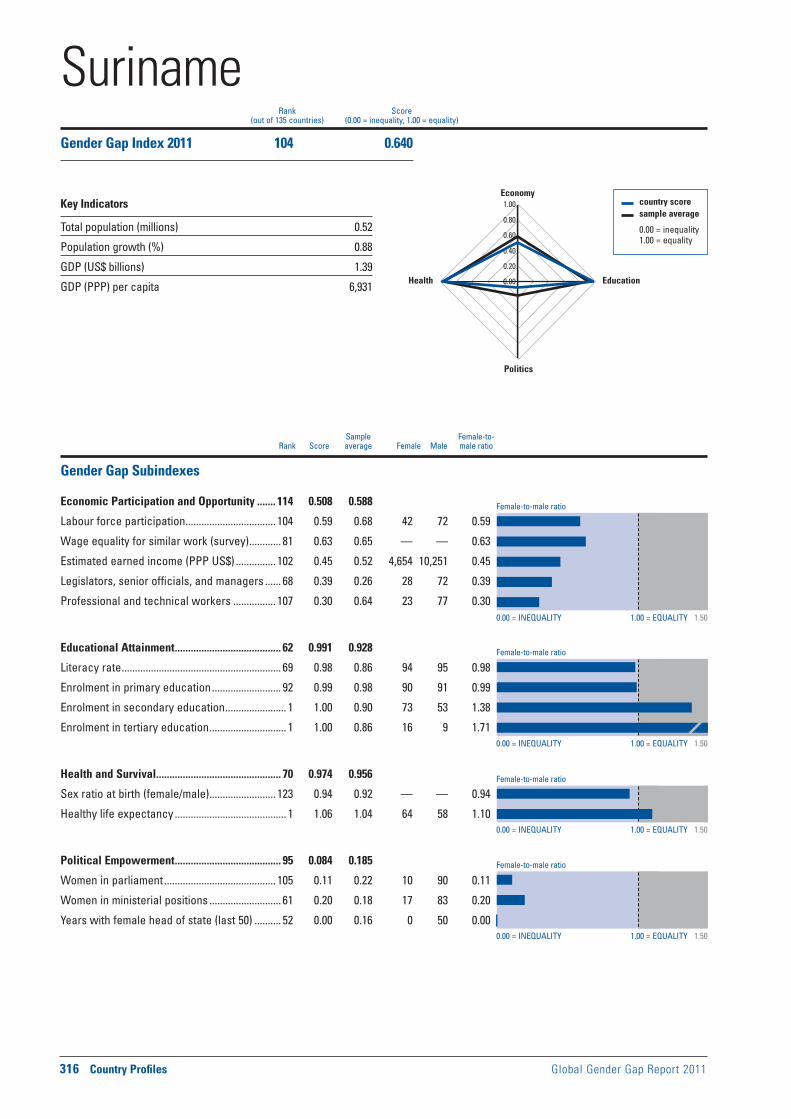
Female-to-male ratio
0.00 = INEQUALITY 1.00 = EQUALITY 1.50
0.00 = INEQUALITY 1.00 = EQUALITY 1.50
0.00 = INEQUALITY 1.00 = EQUALITY 1.50
0.00 = INEQUALITY 1.00 = EQUALITY 1.50
Female-to-male ratio
Female-to-male ratio
Female-to-male ratio
316 Country Profiles Global Gender Gap Report 2011
Sample Female-to- Rank Score average Female Male male ratio
country score sample average
0.00 = inequality 1.00 = equality
0.00
0.20
0.40
0.60
0.80
1.00Economy
Education
Politics
Health
Rank Score(out of 135 countries) (0.00 = inequality, 1.00 = equality)
Gender Gap Subindexes
Economic Participation and Opportunity ....... 114 0.508 0.588
Labour force participation .................................. 104 0.59 0.68 42 72 0.59
Wage equality for similar work (survey) ............ 81 0.63 0.65 — — 0.63
Estimated earned income (PPP US$) ............... 102 0.45 0.52 4,654 10,251 0.45
Legislators, senior officials, and managers ...... 68 0.39 0.26 28 72 0.39
Professional and technical workers ................ 107 0.30 0.64 23 77 0.30
Educational Attainment ........................................ 62 0.991 0.928
Literacy rate ............................................................ 69 0.98 0.86 94 95 0.98
Enrolment in primary education .......................... 92 0.99 0.98 90 91 0.99
Enrolment in secondary education ....................... 1 1.00 0.90 73 53 1.38
Enrolment in tertiary education ............................. 1 1.00 0.86 16 9 1.71
Health and Survival ............................................... 70 0.974 0.956
Sex ratio at birth (female/male) ......................... 123 0.94 0.92 — — 0.94
Healthy life expectancy .......................................... 1 1.06 1.04 64 58 1.10
Political Empowerment ........................................ 95 0.084 0.185
Women in parliament .......................................... 105 0.11 0.22 10 90 0.11
Women in ministerial positions ........................... 61 0.20 0.18 17 83 0.20
Years with female head of state (last 50) .......... 52 0.00 0.16 0 50 0.00
SurinameGender Gap Index 2011 104 0.640
Key Indicators
Total population (millions) 0.52
Population growth (%) 0.88
GDP (US$ billions) 1.39
GDP (PPP) per capita 6,931

Global Gender Gap Report 2011 Country Profiles 317
Economic Participation and Opportunity Educational Attainment Health and Survival Political Empowerment
Evolution 2006–2011
1 Survey data, responses on a 1-to-7 scale (1 = worst score, 7 = best score)2 Data on a 0-to-1 scale (1 = worst score, 0 = best score)3 Data on a 1-to-5 scale (1 = worst score, 5 = best score)4 Bracketed numbers show the range between the uncertainties, estimated
to contain the true maternal mortality ratio with a 95% probability
ECONOMIC EDUCATIONAL HEALTH AND POLITICAL OVERALL PARTICIPATION ATTAINMENT SURVIVAL EMPOWERMENT
Rank Score Rank Score Rank Score Rank Score Rank Score
0.0
0.2
0.4
0.6
0.8
1.0
2006 2007 2008 2009 2010 2011
Additional Data
Economic EmpowermentFemale adult unemployment rate (% of female labour force) .......14Male adult unemployment rate (% of male labour force) ................7Women in non-agricultural paid labour
(% of total labour force) ....................................................................38Inheritance practices in favour of male heirs2 ................................ —Firms with female participation in ownership (% of firms) ........... —Women’s access to land ownership2 ............................................... —Women’s access to bank loans2 ........................................................ —Women’s access to property other than land2 ............................... —Women’s access to finance programmes3 ...................................... —Ability of women to rise to positions of
enterprise leadership1 ....................................................................4.42
EducationFemale teachers, primary education (%) ..........................................93Female teachers, secondary education (%) .....................................60Female teachers, tertiary education (%) ...........................................48Female school life expectancy, primary to secondary (years)......13Male school life expectancy, primary to secondary (years) .........12
Marriage and ChildbearingMean age of marriage for women (years) ........................................19Early marriage (% women, aged 15–19) ........................................... —Fertility rate (births per woman) .......................................................2.40Adolescent fertility rate (births per 1,000 women, aged 15–19) ....66Antenatal care coverage, at least one visit (%) ...............................90Births attended by skilled health staff (%) ........................................90Maternal mortality ratio (per 100,000 live births)4 ...........100 [86-110]Contraceptive prevalence, married women (%) ..............................42Female HIV prevalence, aged 15–49 (%) ........................................0.60Male HIV prevalence, aged 15–49 (%) ............................................1.40Infant mortality rate (per 1,000 live births) ........................................24Overall population sex ratio (male/female) ....................................1.00
Social Institutions and Political RightsPaternal versus maternal authority2.................................................. —Female genital mutilation2 ................................................................... —Acceptance or legality of polygamy2 ................................................ —Existence of legislation punishing acts
of violence against women2 ............................................................ —Year women received right to vote ................................................1948Quota type .............................................................................................. —Existence of legislation prohibiting
gender-based discrimination ........................................................ Yes
Childcare EcosystemLength of maternity leave .................................................................... —Maternity leave benefits (% of wages paid) .................................... —Provider of maternity coverage ......................................................... —Length of paternity leave ..................................................................... —Paternity leave benefits (% of wages paid) ..................................... —Daycare options ..............................................................Public daycare
with allowance; private daycare; homecare, with and without allowance
SurinameGender Gap Index 2011 (out of 135 countries) 104 0.640 114 0.508 62 0.991 70 0.974 95 0.084
Gender Gap Index 2010 (out of 134 countries) 102 0.641 123 0.449 85 0.985 70 0.974 53 0.154
Gender Gap Index 2009 (out of 134 countries) 78 0.673 101 0.571 74 0.990 80 0.973 51 0.155
Gender Gap Index 2008 (out of 130 countries) 79 0.667 101 0.551 70 0.991 76 0.973 49 0.155
Gender Gap Index 2007 (out of 128 countries) 56 0.679 73 0.617 64 0.989 74 0.973 46 0.139
Gender Gap Index 2006 (out of 115 countries) — — — — — — — — — —

Female-to-male ratio
0.00 = INEQUALITY 1.00 = EQUALITY 1.50
0.00 = INEQUALITY 1.00 = EQUALITY 1.50
0.00 = INEQUALITY 1.00 = EQUALITY 1.50
0.00 = INEQUALITY 1.00 = EQUALITY 1.50
Female-to-male ratio
Female-to-male ratio
Female-to-male ratio
318 Country Profiles Global Gender Gap Report 2011
Sample Female-to- Rank Score average Female Male male ratio
country score sample average
0.00 = inequality 1.00 = equality
0.00
0.20
0.40
0.60
0.80
1.00Economy
Education
Politics
Health
Rank Score(out of 135 countries) (0.00 = inequality, 1.00 = equality)
Gender Gap Subindexes
Economic Participation and Opportunity ........... 7 0.793 0.588
Labour force participation ...................................... 8 0.94 0.68 77 82 0.94
Wage equality for similar work (survey) ............ 28 0.75 0.65 — — 0.75
Estimated earned income (PPP US$) ................... 9 0.82 0.52 32,990 40,000 0.82
Legislators, senior officials, and managers ...... 44 0.48 0.26 32 68 0.48
Professional and technical workers .................... 1 1.00 0.64 51 49 1.02
Educational Attainment ........................................ 41 0.996 0.928
Literacy rate .............................................................. 1 1.00 0.86 99 99 1.00
Enrolment in primary education .......................... 85 0.99 0.98 96 96 0.99
Enrolment in secondary education ..................... 82 1.00 0.90 98 98 1.00
Enrolment in tertiary education ............................. 1 1.00 0.86 88 56 1.58
Health and Survival ............................................... 82 0.973 0.956
Sex ratio at birth (female/male) ......................... 114 0.94 0.92 — — 0.94
Healthy life expectancy ........................................ 82 1.04 1.04 75 72 1.04
Political Empowerment .......................................... 4 0.456 0.185
Women in parliament .............................................. 1 0.82 0.22 45 55 0.82
Women in ministerial positions ............................. 6 0.82 0.18 45 55 0.82
Years with female head of state (last 50) .......... 52 0.00 0.16 0 50 0.00
SwedenGender Gap Index 2011 4 0.804
Key Indicators
Total population (millions) 9.39
Population growth (%) 0.98
GDP (US$ billions) 302.11
GDP (PPP) per capita 33,632

Global Gender Gap Report 2011 Country Profiles 319
Economic Participation and Opportunity Educational Attainment Health and Survival Political Empowerment
Evolution 2006–2011
1 Survey data, responses on a 1-to-7 scale (1 = worst score, 7 = best score)2 Data on a 0-to-1 scale (1 = worst score, 0 = best score)3 Data on a 1-to-5 scale (1 = worst score, 5 = best score)4 Bracketed numbers show the range between the uncertainties, estimated
to contain the true maternal mortality ratio with a 95% probability
ECONOMIC EDUCATIONAL HEALTH AND POLITICAL OVERALL PARTICIPATION ATTAINMENT SURVIVAL EMPOWERMENT
Rank Score Rank Score Rank Score Rank Score Rank Score
0.0
0.2
0.4
0.6
0.8
1.0
2006 2007 2008 2009 2010 2011
Additional Data
Economic EmpowermentFemale adult unemployment rate (% of female labour force) .........8Male adult unemployment rate (% of male labour force) ................6Women in non-agricultural paid labour
(% of total labour force) ....................................................................50Inheritance practices in favour of male heirs2 ................................ —Firms with female participation in ownership (% of firms) ........... —Women’s access to land ownership2 ............................................... —Women’s access to bank loans2 ........................................................ —Women’s access to property other than land2 ............................... —Women’s access to finance programmes3 .........................................5Ability of women to rise to positions of
enterprise leadership1 ....................................................................5.55
EducationFemale teachers, primary education (%) ..........................................81Female teachers, secondary education (%) .....................................59Female teachers, tertiary education (%) ...........................................44Female school life expectancy, primary to secondary (years)......12Male school life expectancy, primary to secondary (years) .........12
Marriage and ChildbearingMean age of marriage for women (years) ........................................32Early marriage (% women, aged 15–19) ........................................... —Fertility rate (births per woman) .......................................................1.90Adolescent fertility rate (births per 1,000 women, aged 15–19) ......6Antenatal care coverage, at least one visit (%) .............................100Births attended by skilled health staff (%) ....................................... —Maternal mortality ratio (per 100,000 live births)4 .....................5 [3-8]Contraceptive prevalence, married women (%) ..............................75Female HIV prevalence, aged 15–49 (%) ........................................0.10Male HIV prevalence, aged 15–49 (%) ............................................0.20Infant mortality rate (per 1,000 live births) ..........................................2Overall population sex ratio (male/female) ....................................0.99
Social Institutions and Political RightsPaternal versus maternal authority2.................................................. —Female genital mutilation2 ................................................................... —Acceptance or legality of polygamy2 ................................................ —Existence of legislation punishing acts
of violence against women2 ............................................................ —Year women received right to vote ......................................1919, 1921Quota type ..........................................................................No legislated;
voluntary political party quotasExistence of legislation prohibiting
gender-based discrimination ........................................................ Yes
Childcare EcosystemLength of maternity leave ......................................................... 480 daysMaternity leave benefits (% of wages paid) ....................................80;
up to a ceiling for 390 days; flat rate for remaining 90 daysProvider of maternity coverage ............................... Social insuranceLength of paternity leave ..............................10 optional nursing days
in connection to birth; can be used within 2 months from the birthPaternity leave benefits (% of wages paid) .......... 80; up to a ceiling Daycare options ......................................................................Public and
private daycare, with allowance; homecare with allowance
SwedenGender Gap Index 2011 (out of 135 countries) 4 0.804 7 0.793 41 0.996 82 0.973 4 0.456
Gender Gap Index 2010 (out of 134 countries) 4 0.802 11 0.770 41 0.996 80 0.973 4 0.471
Gender Gap Index 2009 (out of 134 countries) 4 0.814 6 0.785 39 0.998 79 0.974 4 0.499
Gender Gap Index 2008 (out of 130 countries) 3 0.814 5 0.784 33 0.999 75 0.974 4 0.499
Gender Gap Index 2007 (out of 128 countries) 1 0.821 6 0.761 27 0.999 73 0.974 1 0.550
Gender Gap Index 2006 (out of 115 countries) 1 0.813 9 0.731 23 0.999 70 0.973 1 0.550

Female-to-male ratio
0.00 = INEQUALITY 1.00 = EQUALITY 1.50
0.00 = INEQUALITY 1.00 = EQUALITY 1.50
0.00 = INEQUALITY 1.00 = EQUALITY 1.50
0.00 = INEQUALITY 1.00 = EQUALITY 1.50
Female-to-male ratio
Female-to-male ratio
Female-to-male ratio
320 Country Profiles Global Gender Gap Report 2011
Sample Female-to- Rank Score average Female Male male ratio
country score sample average
0.00 = inequality 1.00 = equality
0.00
0.20
0.40
0.60
0.80
1.00Economy
Education
Politics
Health
Rank Score(out of 135 countries) (0.00 = inequality, 1.00 = equality)
Gender Gap Subindexes
Economic Participation and Opportunity ......... 28 0.742 0.588
Labour force participation .................................... 32 0.88 0.68 76 87 0.88
Wage equality for similar work (survey) ............ 80 0.63 0.65 — — 0.63
Estimated earned income (PPP US$) ................... 4 0.89 0.52 35,577 40,000 0.89
Legislators, senior officials, and managers ...... 58 0.43 0.26 30 70 0.43
Professional and technical workers .................. 69 0.91 0.64 48 52 0.91
Educational Attainment ........................................ 68 0.990 0.928
Literacy rate .............................................................. 1 1.00 0.86 99 99 1.00
Enrolment in primary education .......................... 71 1.00 0.98 94 94 1.00
Enrolment in secondary education ................... 100 0.96 0.90 82 86 0.96
Enrolment in tertiary education ............................. 1 1.00 0.86 52 51 1.01
Health and Survival ............................................... 75 0.974 0.956
Sex ratio at birth (female/male) ............................. 1 0.94 0.92 — — 0.95
Healthy life expectancy ........................................ 84 1.04 1.04 76 73 1.04
Political Empowerment ........................................ 13 0.345 0.185
Women in parliament ............................................ 24 0.41 0.22 29 71 0.41
Women in ministerial positions ............................. 7 0.75 0.18 43 57 0.75
Years with female head of state (last 50) .......... 23 0.08 0.16 4 47 0.08
SwitzerlandGender Gap Index 2011 10 0.763
Key Indicators
Total population (millions) 7.79
Population growth (%) 0.76
GDP (US$ billions) 293.61
GDP (PPP) per capita 37,610
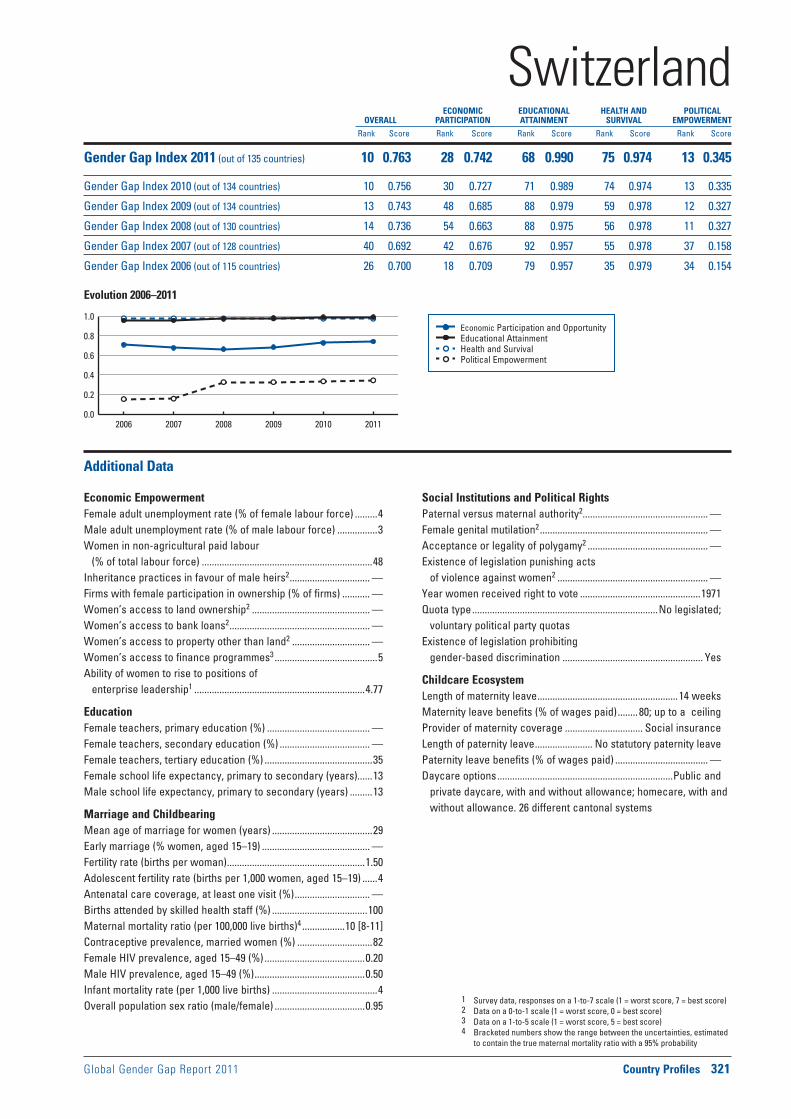
Global Gender Gap Report 2011 Country Profiles 321
Economic Participation and Opportunity Educational Attainment Health and Survival Political Empowerment
Evolution 2006–2011
1 Survey data, responses on a 1-to-7 scale (1 = worst score, 7 = best score)2 Data on a 0-to-1 scale (1 = worst score, 0 = best score)3 Data on a 1-to-5 scale (1 = worst score, 5 = best score)4 Bracketed numbers show the range between the uncertainties, estimated
to contain the true maternal mortality ratio with a 95% probability
ECONOMIC EDUCATIONAL HEALTH AND POLITICAL OVERALL PARTICIPATION ATTAINMENT SURVIVAL EMPOWERMENT
Rank Score Rank Score Rank Score Rank Score Rank Score
0.0
0.2
0.4
0.6
0.8
1.0
2006 2007 2008 2009 2010 2011
Additional Data
Economic EmpowermentFemale adult unemployment rate (% of female labour force) .........4Male adult unemployment rate (% of male labour force) ................3Women in non-agricultural paid labour
(% of total labour force) ....................................................................48Inheritance practices in favour of male heirs2 ................................ —Firms with female participation in ownership (% of firms) ........... —Women’s access to land ownership2 ............................................... —Women’s access to bank loans2 ........................................................ —Women’s access to property other than land2 ............................... —Women’s access to finance programmes3 .........................................5Ability of women to rise to positions of
enterprise leadership1 ....................................................................4.77
EducationFemale teachers, primary education (%) ......................................... —Female teachers, secondary education (%) .................................... —Female teachers, tertiary education (%) ...........................................35Female school life expectancy, primary to secondary (years)......13Male school life expectancy, primary to secondary (years) .........13
Marriage and ChildbearingMean age of marriage for women (years) ........................................29Early marriage (% women, aged 15–19) ........................................... —Fertility rate (births per woman) .......................................................1.50Adolescent fertility rate (births per 1,000 women, aged 15–19) ......4Antenatal care coverage, at least one visit (%) .............................. —Births attended by skilled health staff (%) ......................................100Maternal mortality ratio (per 100,000 live births)4 .................10 [8-11]Contraceptive prevalence, married women (%) ..............................82Female HIV prevalence, aged 15–49 (%) ........................................0.20Male HIV prevalence, aged 15–49 (%) ............................................0.50Infant mortality rate (per 1,000 live births) ..........................................4Overall population sex ratio (male/female) ....................................0.95
Social Institutions and Political RightsPaternal versus maternal authority2.................................................. —Female genital mutilation2 ................................................................... —Acceptance or legality of polygamy2 ................................................ —Existence of legislation punishing acts
of violence against women2 ............................................................ —Year women received right to vote ................................................1971Quota type ..........................................................................No legislated;
voluntary political party quotasExistence of legislation prohibiting
gender-based discrimination ........................................................ Yes
Childcare EcosystemLength of maternity leave ........................................................14 weeksMaternity leave benefits (% of wages paid) ........ 80; up to a ceilingProvider of maternity coverage ............................... Social insuranceLength of paternity leave ....................... No statutory paternity leavePaternity leave benefits (% of wages paid) ..................................... —Daycare options ......................................................................Public and
private daycare, with and without allowance; homecare, with and without allowance. 26 different cantonal systems
SwitzerlandGender Gap Index 2011 (out of 135 countries) 10 0.763 28 0.742 68 0.990 75 0.974 13 0.345
Gender Gap Index 2010 (out of 134 countries) 10 0.756 30 0.727 71 0.989 74 0.974 13 0.335
Gender Gap Index 2009 (out of 134 countries) 13 0.743 48 0.685 88 0.979 59 0.978 12 0.327
Gender Gap Index 2008 (out of 130 countries) 14 0.736 54 0.663 88 0.975 56 0.978 11 0.327
Gender Gap Index 2007 (out of 128 countries) 40 0.692 42 0.676 92 0.957 55 0.978 37 0.158
Gender Gap Index 2006 (out of 115 countries) 26 0.700 18 0.709 79 0.957 35 0.979 34 0.154

Female-to-male ratio
0.00 = INEQUALITY 1.00 = EQUALITY 1.50
0.00 = INEQUALITY 1.00 = EQUALITY 1.50
0.00 = INEQUALITY 1.00 = EQUALITY 1.50
0.00 = INEQUALITY 1.00 = EQUALITY 1.50
Female-to-male ratio
Female-to-male ratio
Female-to-male ratio
322 Country Profiles Global Gender Gap Report 2011
Sample Female-to- Rank Score average Female Male male ratio
country score sample average
0.00 = inequality 1.00 = equality
0.00
0.20
0.40
0.60
0.80
1.00Economy
Education
Politics
Health
Rank Score(out of 135 countries) (0.00 = inequality, 1.00 = equality)
Gender Gap Subindexes
Economic Participation and Opportunity ....... 129 0.409 0.588
Labour force participation .................................. 134 0.27 0.68 22 82 0.27
Wage equality for similar work (survey) ............ 64 0.66 0.65 — — 0.66
Estimated earned income (PPP US$) ............... 129 0.21 0.52 1,657 7,745 0.21
Legislators, senior officials, and managers .... 106 0.11 0.26 10 90 0.11
Professional and technical workers .................. 85 0.70 0.64 41 59 0.70
Educational Attainment ...................................... 109 0.914 0.928
Literacy rate .......................................................... 106 0.86 0.86 78 90 0.86
Enrolment in primary education ........................ 121 0.95 0.98 92 97 0.95
Enrolment in secondary education ..................... 87 0.99 0.90 69 70 0.99
Enrolment in tertiary education ......................... 107 0.72 0.86 12 17 0.72
Health and Survival ............................................... 61 0.976 0.956
Sex ratio at birth (female/male) ......................... 106 0.94 0.92 — — 0.94
Healthy life expectancy ........................................ 68 1.05 1.04 65 62 1.05
Political Empowerment ...................................... 110 0.060 0.185
Women in parliament ............................................ 93 0.14 0.22 12 88 0.14
Women in ministerial positions ......................... 113 0.07 0.18 6 94 0.07
Years with female head of state (last 50) .......... 52 0.00 0.16 0 50 0.00
SyriaGender Gap Index 2011 124 0.590
Key Indicators
Total population (millions) 21.62
Population growth (%) 2.45
GDP (US$ billions) 30.73
GDP (PPP) per capita 4,486
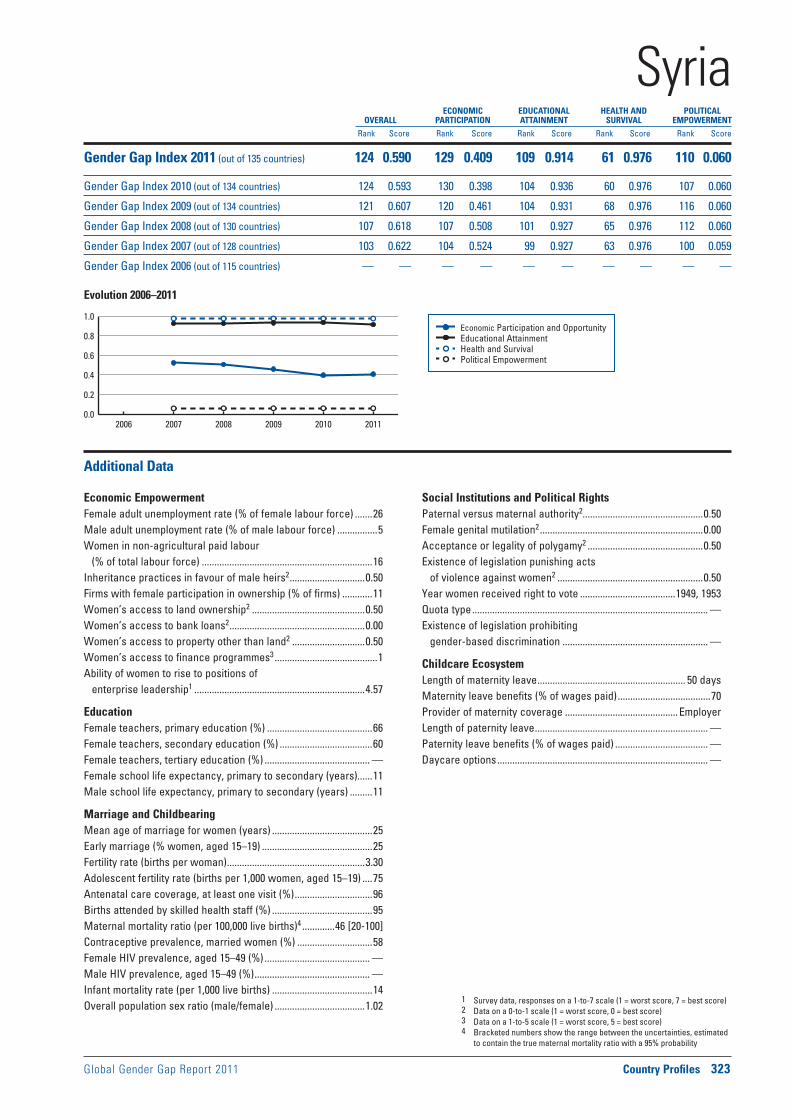
Global Gender Gap Report 2011 Country Profiles 323
Economic Participation and Opportunity Educational Attainment Health and Survival Political Empowerment
Evolution 2006–2011
1 Survey data, responses on a 1-to-7 scale (1 = worst score, 7 = best score)2 Data on a 0-to-1 scale (1 = worst score, 0 = best score)3 Data on a 1-to-5 scale (1 = worst score, 5 = best score)4 Bracketed numbers show the range between the uncertainties, estimated
to contain the true maternal mortality ratio with a 95% probability
ECONOMIC EDUCATIONAL HEALTH AND POLITICAL OVERALL PARTICIPATION ATTAINMENT SURVIVAL EMPOWERMENT
Rank Score Rank Score Rank Score Rank Score Rank Score
0.0
0.2
0.4
0.6
0.8
1.0
2006 2007 2008 2009 2010 2011
Additional Data
Economic EmpowermentFemale adult unemployment rate (% of female labour force) .......26Male adult unemployment rate (% of male labour force) ................5Women in non-agricultural paid labour
(% of total labour force) ....................................................................16Inheritance practices in favour of male heirs2 ..............................0.50Firms with female participation in ownership (% of firms) ............11Women’s access to land ownership2 .............................................0.50Women’s access to bank loans2 ......................................................0.00Women’s access to property other than land2 .............................0.50Women’s access to finance programmes3 .........................................1Ability of women to rise to positions of
enterprise leadership1 ....................................................................4.57
EducationFemale teachers, primary education (%) ..........................................66Female teachers, secondary education (%) .....................................60Female teachers, tertiary education (%) .......................................... —Female school life expectancy, primary to secondary (years)......11Male school life expectancy, primary to secondary (years) .........11
Marriage and ChildbearingMean age of marriage for women (years) ........................................25Early marriage (% women, aged 15–19) ............................................25Fertility rate (births per woman) .......................................................3.30Adolescent fertility rate (births per 1,000 women, aged 15–19) ....75Antenatal care coverage, at least one visit (%) ...............................96Births attended by skilled health staff (%) ........................................95Maternal mortality ratio (per 100,000 live births)4 .............46 [20-100]Contraceptive prevalence, married women (%) ..............................58Female HIV prevalence, aged 15–49 (%) .......................................... —Male HIV prevalence, aged 15–49 (%) .............................................. —Infant mortality rate (per 1,000 live births) ........................................14Overall population sex ratio (male/female) ....................................1.02
Social Institutions and Political RightsPaternal versus maternal authority2................................................0.50Female genital mutilation2 .................................................................0.00Acceptance or legality of polygamy2 ..............................................0.50Existence of legislation punishing acts
of violence against women2 ..........................................................0.50Year women received right to vote ......................................1949, 1953Quota type .............................................................................................. —Existence of legislation prohibiting
gender-based discrimination .......................................................... —
Childcare EcosystemLength of maternity leave ........................................................... 50 daysMaternity leave benefits (% of wages paid) .....................................70Provider of maternity coverage .............................................EmployerLength of paternity leave ..................................................................... —Paternity leave benefits (% of wages paid) ..................................... —Daycare options .................................................................................... —
SyriaGender Gap Index 2011 (out of 135 countries) 124 0.590 129 0.409 109 0.914 61 0.976 110 0.060
Gender Gap Index 2010 (out of 134 countries) 124 0.593 130 0.398 104 0.936 60 0.976 107 0.060
Gender Gap Index 2009 (out of 134 countries) 121 0.607 120 0.461 104 0.931 68 0.976 116 0.060
Gender Gap Index 2008 (out of 130 countries) 107 0.618 107 0.508 101 0.927 65 0.976 112 0.060
Gender Gap Index 2007 (out of 128 countries) 103 0.622 104 0.524 99 0.927 63 0.976 100 0.059
Gender Gap Index 2006 (out of 115 countries) — — — — — — — — — —

Female-to-male ratio
0.00 = INEQUALITY 1.00 = EQUALITY 1.50
0.00 = INEQUALITY 1.00 = EQUALITY 1.50
0.00 = INEQUALITY 1.00 = EQUALITY 1.50
0.00 = INEQUALITY 1.00 = EQUALITY 1.50
Female-to-male ratio
Female-to-male ratio
Female-to-male ratio
324 Country Profiles Global Gender Gap Report 2011
Sample Female-to- Rank Score average Female Male male ratio
country score sample average
0.00 = inequality 1.00 = equality
0.00
0.20
0.40
0.60
0.80
1.00Economy
Education
Politics
Health
Rank Score(out of 135 countries) (0.00 = inequality, 1.00 = equality)
Gender Gap Subindexes
Economic Participation and Opportunity ......... 49 0.683 0.588
Labour force participation .................................... 76 0.75 0.68 60 81 0.75
Wage equality for similar work (survey) ............ 39 0.72 0.65 — — 0.72
Estimated earned income (PPP US$) ................. 70 0.57 0.52 1,433 2,525 0.57
Legislators, senior officials, and managers ......— — 0.26 — — —
Professional and technical workers ..................— — 0.64 — — —
Educational Attainment ...................................... 113 0.884 0.928
Literacy rate ............................................................ 49 1.00 0.86 100 100 1.00
Enrolment in primary education ........................ 118 0.96 0.98 95 99 0.96
Enrolment in secondary education ................... 113 0.88 0.90 77 88 0.88
Enrolment in tertiary education ......................... 128 0.41 0.86 12 28 0.41
Health and Survival ............................................. 122 0.956 0.956
Sex ratio at birth (female/male) ............................. 1 0.94 0.92 — — 0.95
Healthy life expectancy ...................................... 130 0.98 1.04 57 58 0.98
Political Empowerment ........................................ 94 0.088 0.185
Women in parliament ............................................ 61 0.23 0.22 19 81 0.23
Women in ministerial positions ......................... 115 0.06 0.18 6 94 0.06
Years with female head of state (last 50) .......... 52 0.00 0.16 0 50 0.00
TajikistanGender Gap Index 2011 96 0.653
Key Indicators
Total population (millions) 7.07
Population growth (%) 1.75
GDP (US$ billions) 1.92
GDP (PPP) per capita 1,886

Global Gender Gap Report 2011 Country Profiles 325
Economic Participation and Opportunity Educational Attainment Health and Survival Political Empowerment
Evolution 2006–2011
1 Survey data, responses on a 1-to-7 scale (1 = worst score, 7 = best score)2 Data on a 0-to-1 scale (1 = worst score, 0 = best score)3 Data on a 1-to-5 scale (1 = worst score, 5 = best score)4 Bracketed numbers show the range between the uncertainties, estimated
to contain the true maternal mortality ratio with a 95% probability
ECONOMIC EDUCATIONAL HEALTH AND POLITICAL OVERALL PARTICIPATION ATTAINMENT SURVIVAL EMPOWERMENT
Rank Score Rank Score Rank Score Rank Score Rank Score
0.0
0.2
0.4
0.6
0.8
1.0
2006 2007 2008 2009 2010 2011
Additional Data
Economic EmpowermentFemale adult unemployment rate (% of female labour force) ...... —Male adult unemployment rate (% of male labour force) ............. —Women in non-agricultural paid labour
(% of total labour force) ....................................................................37Inheritance practices in favour of male heirs2 ..............................0.50Firms with female participation in ownership (% of firms) ............60Women’s access to land ownership2 .............................................0.50Women’s access to bank loans2 ......................................................0.00Women’s access to property other than land2 .............................0.00Women’s access to finance programmes3 ...................................... —Ability of women to rise to positions of
enterprise leadership1 ....................................................................5.00
EducationFemale teachers, primary education (%) ..........................................68Female teachers, secondary education (%) .....................................49Female teachers, tertiary education (%) ...........................................33Female school life expectancy, primary to secondary (years)......10Male school life expectancy, primary to secondary (years) .........10
Marriage and ChildbearingMean age of marriage for women (years) ........................................21Early marriage (% women, aged 15–19) ............................................12Fertility rate (births per woman) .......................................................3.40Adolescent fertility rate (births per 1,000 women, aged 15–19) ....27Antenatal care coverage, at least one visit (%) ...............................89Births attended by skilled health staff (%) ........................................88Maternal mortality ratio (per 100,000 live births)4 .............64 [29-140]Contraceptive prevalence, married women (%) ..............................38Female HIV prevalence, aged 15–49 (%) ........................................0.10Male HIV prevalence, aged 15–49 (%) ............................................0.30Infant mortality rate (per 1,000 live births) ........................................52Overall population sex ratio (male/female) ....................................0.97
Social Institutions and Political RightsPaternal versus maternal authority2................................................0.00Female genital mutilation2 .................................................................0.00Acceptance or legality of polygamy2 ..............................................0.50Existence of legislation punishing acts
of violence against women2 ..........................................................0.50Year women received right to vote ................................................1924Quota type .............................................................................................. —Existence of legislation prohibiting
gender-based discrimination .......................................................... —
Childcare EcosystemLength of maternity leave ........................................ 140 calendar daysMaternity leave benefits (% of wages paid) .................. Paid amount
not specifiedProvider of maternity coverage ...................................Social securityLength of paternity leave ..................................................................... —Paternity leave benefits (% of wages paid) ..................................... —Daycare options .................................................................................... —
TajikistanGender Gap Index 2011 (out of 135 countries) 96 0.653 49 0.683 113 0.884 122 0.956 94 0.088
Gender Gap Index 2010 (out of 134 countries) 89 0.660 40 0.709 113 0.882 121 0.956 90 0.093
Gender Gap Index 2009 (out of 134 countries) 86 0.666 27 0.730 114 0.875 58 0.979 96 0.081
Gender Gap Index 2008 (out of 130 countries) 89 0.654 44 0.689 112 0.867 55 0.979 98 0.081
Gender Gap Index 2007 (out of 128 countries) 79 0.658 25 0.710 107 0.869 54 0.979 90 0.074
Gender Gap Index 2006 (out of 115 countries) — — — — — — — — — —

Female-to-male ratio
0.00 = INEQUALITY 1.00 = EQUALITY 1.50
0.00 = INEQUALITY 1.00 = EQUALITY 1.50
0.00 = INEQUALITY 1.00 = EQUALITY 1.50
0.00 = INEQUALITY 1.00 = EQUALITY 1.50
Female-to-male ratio
Female-to-male ratio
Female-to-male ratio
326 Country Profiles Global Gender Gap Report 2011
Sample Female-to- Rank Score average Female Male male ratio
country score sample average
0.00 = inequality 1.00 = equality
0.00
0.20
0.40
0.60
0.80
1.00Economy
Education
Politics
Health
Rank Score(out of 135 countries) (0.00 = inequality, 1.00 = equality)
Gender Gap Subindexes
Economic Participation and Opportunity ......... 63 0.657 0.588
Labour force participation ...................................... 4 0.97 0.68 89 91 0.97
Wage equality for similar work (survey) ............ 55 0.68 0.65 — — 0.68
Estimated earned income (PPP US$) ................. 34 0.67 0.52 1,096 1,630 0.67
Legislators, senior officials, and managers ...... 91 0.20 0.26 16 84 0.20
Professional and technical workers .................. 90 0.61 0.64 38 62 0.61
Educational Attainment ...................................... 114 0.878 0.928
Literacy rate .......................................................... 107 0.85 0.86 67 79 0.85
Enrolment in primary education ............................ 1 1.00 0.98 97 96 1.01
Enrolment in secondary education ................... 116 0.87 0.90 24 28 0.87
Enrolment in tertiary education ......................... 123 0.48 0.86 1 2 0.48
Health and Survival ............................................. 111 0.961 0.956
Sex ratio at birth (female/male) ............................. 1 0.94 0.92 — — 0.97
Healthy life expectancy ...................................... 118 1.00 1.04 45 45 1.00
Political Empowerment ........................................ 30 0.265 0.185
Women in parliament ............................................ 15 0.56 0.22 36 64 0.56
Women in ministerial positions ........................... 31 0.37 0.18 27 73 0.37
Years with female head of state (last 50) .......... 52 0.00 0.16 0 50 0.00
TanzaniaGender Gap Index 2011 59 0.690
Key Indicators
Total population (millions) 45.04
Population growth (%) 2.93
GDP (US$ billions) 19.95
GDP (PPP) per capita 1,286

Global Gender Gap Report 2011 Country Profiles 327
Economic Participation and Opportunity Educational Attainment Health and Survival Political Empowerment
Evolution 2006–2011
1 Survey data, responses on a 1-to-7 scale (1 = worst score, 7 = best score)2 Data on a 0-to-1 scale (1 = worst score, 0 = best score)3 Data on a 1-to-5 scale (1 = worst score, 5 = best score)4 Bracketed numbers show the range between the uncertainties, estimated
to contain the true maternal mortality ratio with a 95% probability
ECONOMIC EDUCATIONAL HEALTH AND POLITICAL OVERALL PARTICIPATION ATTAINMENT SURVIVAL EMPOWERMENT
Rank Score Rank Score Rank Score Rank Score Rank Score
0.0
0.2
0.4
0.6
0.8
1.0
2006 2007 2008 2009 2010 2011
Additional Data
Economic EmpowermentFemale adult unemployment rate (% of female labour force) .........6Male adult unemployment rate (% of male labour force) ................3Women in non-agricultural paid labour
(% of total labour force) ....................................................................31Inheritance practices in favour of male heirs2 ..............................0.50Firms with female participation in ownership (% of firms) ............39Women’s access to land ownership2 .............................................0.50Women’s access to bank loans2 ......................................................0.50Women’s access to property other than land2 .............................0.50Women’s access to finance programmes3 .........................................2Ability of women to rise to positions of
enterprise leadership1 ....................................................................4.52
EducationFemale teachers, primary education (%) ..........................................49Female teachers, secondary education (%) .....................................32Female teachers, tertiary education (%) ...........................................17Female school life expectancy, primary to secondary (years)........9Male school life expectancy, primary to secondary (years) ...........9
Marriage and ChildbearingMean age of marriage for women (years) ........................................20Early marriage (% women, aged 15–19) ............................................25Fertility rate (births per woman) .......................................................5.60Adolescent fertility rate (births per 1,000 women, aged 15–19) ..139Antenatal care coverage, at least one visit (%) ...............................96Births attended by skilled health staff (%) ........................................51Maternal mortality ratio (per 100,000 live births)4 ......790 [470-1,300]Contraceptive prevalence, married women (%) ..............................26Female HIV prevalence, aged 15–49 (%) ........................................6.80Male HIV prevalence, aged 15–49 (%) ............................................4.50Infant mortality rate (per 1,000 live births) ........................................68Overall population sex ratio (male/female) ....................................1.00
Social Institutions and Political RightsPaternal versus maternal authority2................................................0.50Female genital mutilation2 .................................................................0.15Acceptance or legality of polygamy2 ..............................................1.00Existence of legislation punishing acts
of violence against women2 ..........................................................0.25Year women received right to vote ................................................1959Quota type ...............................Reserved seats at single/lower houseExistence of legislation prohibiting
gender-based discrimination .......................................................... —
Childcare EcosystemLength of maternity leave ........................................................12 weeksMaternity leave benefits (% of wages paid) ...................................100Provider of maternity coverage ........ National Social Security FundLength of paternity leave ..................................................................... —Paternity leave benefits (% of wages paid) ..................................... —Daycare options .................................................................................... —
TanzaniaGender Gap Index 2011 (out of 135 countries) 59 0.690 63 0.657 114 0.878 111 0.961 30 0.265
Gender Gap Index 2010 (out of 134 countries) 66 0.683 57 0.671 114 0.872 110 0.961 33 0.228
Gender Gap Index 2009 (out of 134 countries) 73 0.680 52 0.682 115 0.868 105 0.969 37 0.200
Gender Gap Index 2008 (out of 130 countries) 38 0.707 3 0.789 111 0.870 100 0.969 35 0.200
Gender Gap Index 2007 (out of 128 countries) 34 0.697 4 0.780 109 0.859 99 0.969 29 0.180
Gender Gap Index 2006 (out of 115 countries) 24 0.704 1 0.809 97 0.859 95 0.967 26 0.180

Female-to-male ratio
0.00 = INEQUALITY 1.00 = EQUALITY 1.50
0.00 = INEQUALITY 1.00 = EQUALITY 1.50
0.00 = INEQUALITY 1.00 = EQUALITY 1.50
0.00 = INEQUALITY 1.00 = EQUALITY 1.50
Female-to-male ratio
Female-to-male ratio
Female-to-male ratio
328 Country Profiles Global Gender Gap Report 2011
Sample Female-to- Rank Score average Female Male male ratio
country score sample average
0.00 = inequality 1.00 = equality
0.00
0.20
0.40
0.60
0.80
1.00Economy
Education
Politics
Health
Rank Score(out of 135 countries) (0.00 = inequality, 1.00 = equality)
Gender Gap Subindexes
Economic Participation and Opportunity ......... 41 0.709 0.588
Labour force participation .................................... 52 0.83 0.68 70 85 0.83
Wage equality for similar work (survey) ............ 17 0.77 0.65 — — 0.77
Estimated earned income (PPP US$) ................. 51 0.63 0.52 6,185 9,865 0.63
Legislators, senior officials, and managers ...... 79 0.31 0.26 24 76 0.31
Professional and technical workers .................... 1 1.00 0.64 56 44 1.25
Educational Attainment ........................................ 82 0.986 0.928
Literacy rate ............................................................ 84 0.96 0.86 92 96 0.96
Enrolment in primary education .......................... 95 0.99 0.98 89 91 0.99
Enrolment in secondary education ....................... 1 1.00 0.90 77 68 1.13
Enrolment in tertiary education ............................. 1 1.00 0.86 51 39 1.31
Health and Survival ................................................. 1 0.980 0.956
Sex ratio at birth (female/male) ............................. 1 0.94 0.92 — — 0.95
Healthy life expectancy .......................................... 1 1.06 1.04 65 59 1.10
Political Empowerment ........................................ 97 0.083 0.185
Women in parliament ............................................ 87 0.15 0.22 13 87 0.15
Women in ministerial positions ........................... 75 0.14 0.18 13 88 0.14
Years with female head of state (last 50) .......... 52 0.00 0.16 0 50 0.00
ThailandGender Gap Index 2011 60 0.689
Key Indicators
Total population (millions) .................................................................... 68.14
Population growth (%) ............................................................................ 0.55
GDP (US$ billions) ................................................................................187.48
GDP (PPP) per capita ............................................................................ 7,783

Global Gender Gap Report 2011 Country Profiles 329
Economic Participation and Opportunity Educational Attainment Health and Survival Political Empowerment
Evolution 2006–2011
1 Survey data, responses on a 1-to-7 scale (1 = worst score, 7 = best score)2 Data on a 0-to-1 scale (1 = worst score, 0 = best score)3 Data on a 1-to-5 scale (1 = worst score, 5 = best score)4 Bracketed numbers show the range between the uncertainties, estimated
to contain the true maternal mortality ratio with a 95% probability
ECONOMIC EDUCATIONAL HEALTH AND POLITICAL OVERALL PARTICIPATION ATTAINMENT SURVIVAL EMPOWERMENT
Rank Score Rank Score Rank Score Rank Score Rank Score
0.0
0.2
0.4
0.6
0.8
1.0
2006 2007 2008 2009 2010 2011
Additional Data
Economic EmpowermentFemale adult unemployment rate (% of female labour force) .........1Male adult unemployment rate (% of male labour force) ................1Women in non-agricultural paid labour
(% of total labour force) ....................................................................45Inheritance practices in favour of male heirs2 ..............................0.00Firms with female participation in ownership (% of firms) ............46Women’s access to land ownership2 .............................................0.00Women’s access to bank loans2 ......................................................0.00Women’s access to property other than land2 .............................0.00Women’s access to finance programmes3 .........................................3Ability of women to rise to positions of
enterprise leadership1 ....................................................................5.32
EducationFemale teachers, primary education (%) ..........................................60Female teachers, secondary education (%) .....................................55Female teachers, tertiary education (%) ...........................................68Female school life expectancy, primary to secondary (years)......10Male school life expectancy, primary to secondary (years) .........10
Marriage and ChildbearingMean age of marriage for women (years) ........................................24Early marriage (% women, aged 15–19) ............................................15Fertility rate (births per woman) .......................................................1.80Adolescent fertility rate (births per 1,000 women, aged 15–19) ....43Antenatal care coverage, at least one visit (%) ...............................99Births attended by skilled health staff (%) ........................................99Maternal mortality ratio (per 100,000 live births)4 ...............48 [32-68]Contraceptive prevalence, married women (%) ..............................81Female HIV prevalence, aged 15–49 (%) .......................................... —Male HIV prevalence, aged 15–49 (%) .............................................. —Infant mortality rate (per 1,000 live births) ........................................12Overall population sex ratio (male/female) ....................................0.97
Social Institutions and Political RightsPaternal versus maternal authority2................................................0.00Female genital mutilation2 .................................................................0.00Acceptance or legality of polygamy2 ..............................................0.50Existence of legislation punishing acts
of violence against women2 ..........................................................0.33Year women received right to vote ................................................1932Quota type ..........................................................................No legislated;
voluntary political party quotasExistence of legislation prohibiting
gender-based discrimination .......................................................... —
Childcare EcosystemLength of maternity leave ........................................................... 90 daysMaternity leave benefits (% of wages paid) ..................Employer for 45 days at a rate of 100%; social insurance for the remaining 45
days at a rate of 50%; social insurance also pays a lump sum on the birth of the child
Provider of maternity coverage ..................................... Employer and social insurance system
Length of paternity leave ..................................................................... —Paternity leave benefits (% of wages paid) ..................................... —Daycare options .................................................................................... —
ThailandGender Gap Index 2011 (out of 135 countries) 60 0.689 41 0.709 82 0.986 1 0.980 97 0.083
Gender Gap Index 2010 (out of 134 countries) 57 0.691 36 0.716 84 0.986 1 0.980 94 0.083
Gender Gap Index 2009 (out of 134 countries) 59 0.691 30 0.722 62 0.993 1 0.980 105 0.069
Gender Gap Index 2008 (out of 130 countries) 52 0.692 25 0.728 69 0.991 1 0.980 104 0.069
Gender Gap Index 2007 (out of 128 countries) 52 0.682 21 0.724 81 0.973 1 0.980 110 0.050
Gender Gap Index 2006 (out of 115 countries) 40 0.683 13 0.722 72 0.973 1 0.980 89 0.058
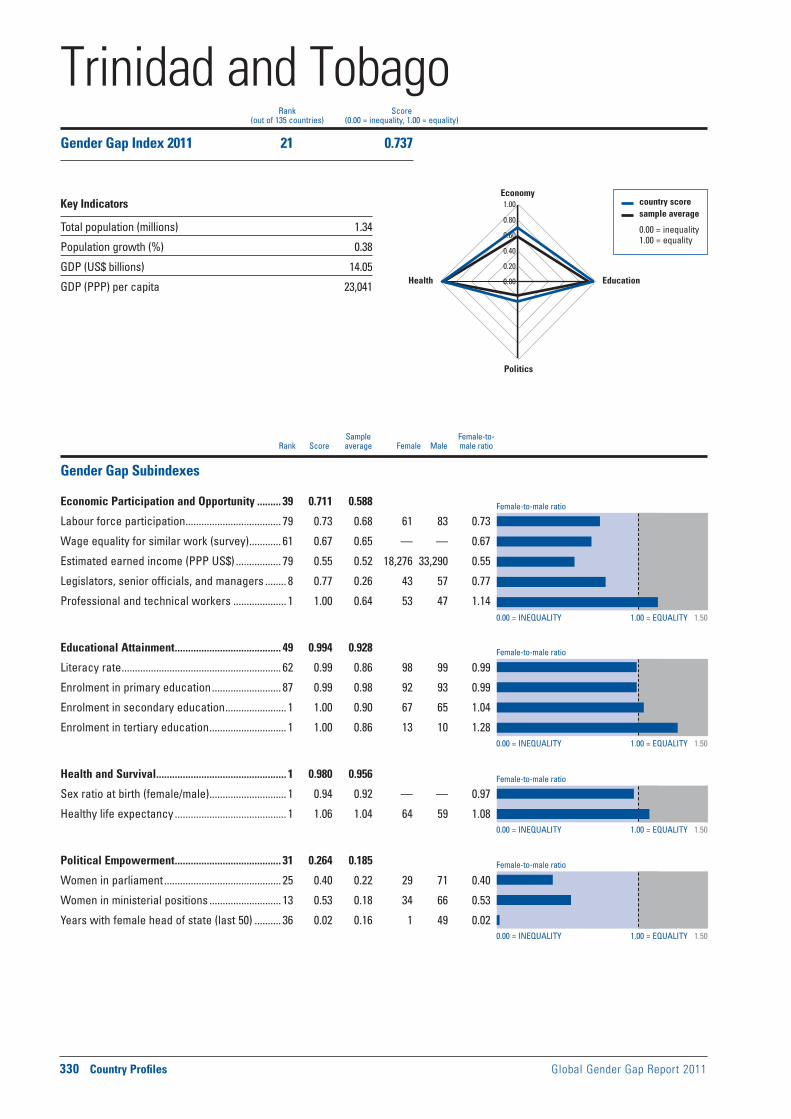
Female-to-male ratio
0.00 = INEQUALITY 1.00 = EQUALITY 1.50
0.00 = INEQUALITY 1.00 = EQUALITY 1.50
0.00 = INEQUALITY 1.00 = EQUALITY 1.50
0.00 = INEQUALITY 1.00 = EQUALITY 1.50
Female-to-male ratio
Female-to-male ratio
Female-to-male ratio
330 Country Profiles Global Gender Gap Report 2011
Sample Female-to- Rank Score average Female Male male ratio
country score sample average
0.00 = inequality 1.00 = equality
0.00
0.20
0.40
0.60
0.80
1.00Economy
Education
Politics
Health
Rank Score(out of 135 countries) (0.00 = inequality, 1.00 = equality)
Gender Gap Subindexes
Economic Participation and Opportunity ......... 39 0.711 0.588
Labour force participation .................................... 79 0.73 0.68 61 83 0.73
Wage equality for similar work (survey) ............ 61 0.67 0.65 — — 0.67
Estimated earned income (PPP US$) ................. 79 0.55 0.52 18,276 33,290 0.55
Legislators, senior officials, and managers ........ 8 0.77 0.26 43 57 0.77
Professional and technical workers .................... 1 1.00 0.64 53 47 1.14
Educational Attainment ........................................ 49 0.994 0.928
Literacy rate ............................................................ 62 0.99 0.86 98 99 0.99
Enrolment in primary education .......................... 87 0.99 0.98 92 93 0.99
Enrolment in secondary education ....................... 1 1.00 0.90 67 65 1.04
Enrolment in tertiary education ............................. 1 1.00 0.86 13 10 1.28
Health and Survival ................................................. 1 0.980 0.956
Sex ratio at birth (female/male) ............................. 1 0.94 0.92 — — 0.97
Healthy life expectancy .......................................... 1 1.06 1.04 64 59 1.08
Political Empowerment ........................................ 31 0.264 0.185
Women in parliament ............................................ 25 0.40 0.22 29 71 0.40
Women in ministerial positions ........................... 13 0.53 0.18 34 66 0.53
Years with female head of state (last 50) .......... 36 0.02 0.16 1 49 0.02
Trinidad and TobagoGender Gap Index 2011 21 0.737
Key Indicators
Total population (millions) 1.34
Population growth (%) 0.38
GDP (US$ billions) 14.05
GDP (PPP) per capita 23,041
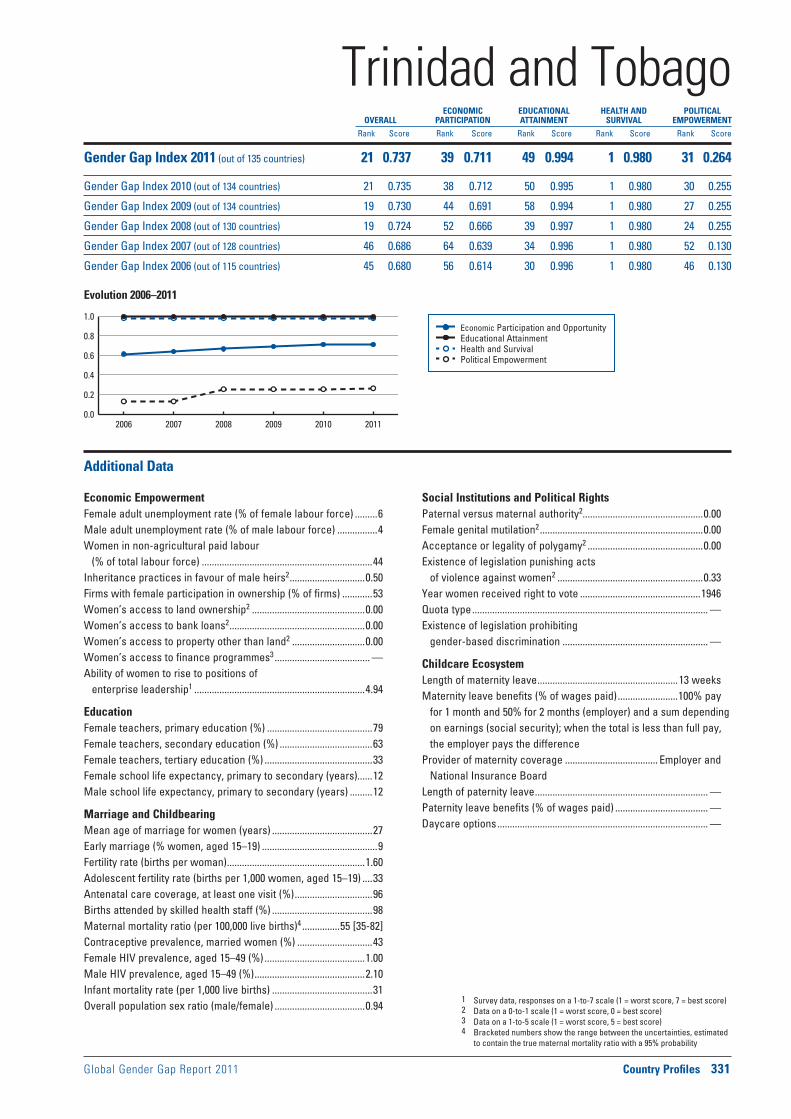
Global Gender Gap Report 2011 Country Profiles 331
Economic Participation and Opportunity Educational Attainment Health and Survival Political Empowerment
Evolution 2006–2011
1 Survey data, responses on a 1-to-7 scale (1 = worst score, 7 = best score)2 Data on a 0-to-1 scale (1 = worst score, 0 = best score)3 Data on a 1-to-5 scale (1 = worst score, 5 = best score)4 Bracketed numbers show the range between the uncertainties, estimated
to contain the true maternal mortality ratio with a 95% probability
ECONOMIC EDUCATIONAL HEALTH AND POLITICAL OVERALL PARTICIPATION ATTAINMENT SURVIVAL EMPOWERMENT
Rank Score Rank Score Rank Score Rank Score Rank Score
0.0
0.2
0.4
0.6
0.8
1.0
2006 2007 2008 2009 2010 2011
Additional Data
Economic EmpowermentFemale adult unemployment rate (% of female labour force) .........6Male adult unemployment rate (% of male labour force) ................4Women in non-agricultural paid labour
(% of total labour force) ....................................................................44Inheritance practices in favour of male heirs2 ..............................0.50Firms with female participation in ownership (% of firms) ............53Women’s access to land ownership2 .............................................0.00Women’s access to bank loans2 ......................................................0.00Women’s access to property other than land2 .............................0.00Women’s access to finance programmes3 ...................................... —Ability of women to rise to positions of
enterprise leadership1 ....................................................................4.94
EducationFemale teachers, primary education (%) ..........................................79Female teachers, secondary education (%) .....................................63Female teachers, tertiary education (%) ...........................................33Female school life expectancy, primary to secondary (years)......12Male school life expectancy, primary to secondary (years) .........12
Marriage and ChildbearingMean age of marriage for women (years) ........................................27Early marriage (% women, aged 15–19) ..............................................9Fertility rate (births per woman) .......................................................1.60Adolescent fertility rate (births per 1,000 women, aged 15–19) ....33Antenatal care coverage, at least one visit (%) ...............................96Births attended by skilled health staff (%) ........................................98Maternal mortality ratio (per 100,000 live births)4 ...............55 [35-82]Contraceptive prevalence, married women (%) ..............................43Female HIV prevalence, aged 15–49 (%) ........................................1.00Male HIV prevalence, aged 15–49 (%) ............................................2.10Infant mortality rate (per 1,000 live births) ........................................31Overall population sex ratio (male/female) ....................................0.94
Social Institutions and Political RightsPaternal versus maternal authority2................................................0.00Female genital mutilation2 .................................................................0.00Acceptance or legality of polygamy2 ..............................................0.00Existence of legislation punishing acts
of violence against women2 ..........................................................0.33Year women received right to vote ................................................1946Quota type .............................................................................................. —Existence of legislation prohibiting
gender-based discrimination .......................................................... —
Childcare EcosystemLength of maternity leave ........................................................13 weeksMaternity leave benefits (% of wages paid) ........................100% pay
for 1 month and 50% for 2 months (employer) and a sum depending on earnings (social security); when the total is less than full pay, the employer pays the difference
Provider of maternity coverage ..................................... Employer and National Insurance Board
Length of paternity leave ..................................................................... —Paternity leave benefits (% of wages paid) ..................................... —Daycare options .................................................................................... —
Trinidad and TobagoGender Gap Index 2011 (out of 135 countries) 21 0.737 39 0.711 49 0.994 1 0.980 31 0.264
Gender Gap Index 2010 (out of 134 countries) 21 0.735 38 0.712 50 0.995 1 0.980 30 0.255
Gender Gap Index 2009 (out of 134 countries) 19 0.730 44 0.691 58 0.994 1 0.980 27 0.255
Gender Gap Index 2008 (out of 130 countries) 19 0.724 52 0.666 39 0.997 1 0.980 24 0.255
Gender Gap Index 2007 (out of 128 countries) 46 0.686 64 0.639 34 0.996 1 0.980 52 0.130
Gender Gap Index 2006 (out of 115 countries) 45 0.680 56 0.614 30 0.996 1 0.980 46 0.130

Female-to-male ratio
0.00 = INEQUALITY 1.00 = EQUALITY 1.50
0.00 = INEQUALITY 1.00 = EQUALITY 1.50
0.00 = INEQUALITY 1.00 = EQUALITY 1.50
0.00 = INEQUALITY 1.00 = EQUALITY 1.50
Female-to-male ratio
Female-to-male ratio
Female-to-male ratio
332 Country Profiles Global Gender Gap Report 2011
Sample Female-to- Rank Score average Female Male male ratio
country score sample average
0.00 = inequality 1.00 = equality
0.00
0.20
0.40
0.60
0.80
1.00Economy
Education
Politics
Health
Rank Score(out of 135 countries) (0.00 = inequality, 1.00 = equality)
Gender Gap Subindexes
Economic Participation and Opportunity ....... 126 0.444 0.588
Labour force participation .................................. 125 0.38 0.68 28 74 0.38
Wage equality for similar work (survey) ............ 13 0.77 0.65 — — 0.77
Estimated earned income (PPP US$) ............... 123 0.28 0.52 3,617 12,875 0.28
Legislators, senior officials, and managers .... 113 0.10 0.26 9 91 0.10
Professional and technical workers ..................— — 0.64 — — —
Educational Attainment ........................................ 94 0.966 0.928
Literacy rate .......................................................... 113 0.82 0.86 71 86 0.82
Enrolment in primary education ............................ 1 1.00 0.98 99 98 1.01
Enrolment in secondary education ....................... 1 1.00 0.90 67 63 1.06
Enrolment in tertiary education ............................. 1 1.00 0.86 42 27 1.53
Health and Survival ............................................. 110 0.964 0.956
Sex ratio at birth (female/male) ......................... 126 0.93 0.92 — — 0.93
Healthy life expectancy ........................................ 95 1.03 1.04 67 65 1.03
Political Empowerment ........................................ 69 0.128 0.185
Women in parliament ............................................ 28 0.38 0.22 28 72 0.38
Women in ministerial positions ......................... 125 0.04 0.18 4 96 0.04
Years with female head of state (last 50) .......... 52 0.00 0.16 0 50 0.00
TunisiaGender Gap Index 2011 108 0.625
Key Indicators
Total population (millions) 10.54
Population growth (%) 0.98
GDP (US$ billions) 30.35
GDP (PPP) per capita 7,714
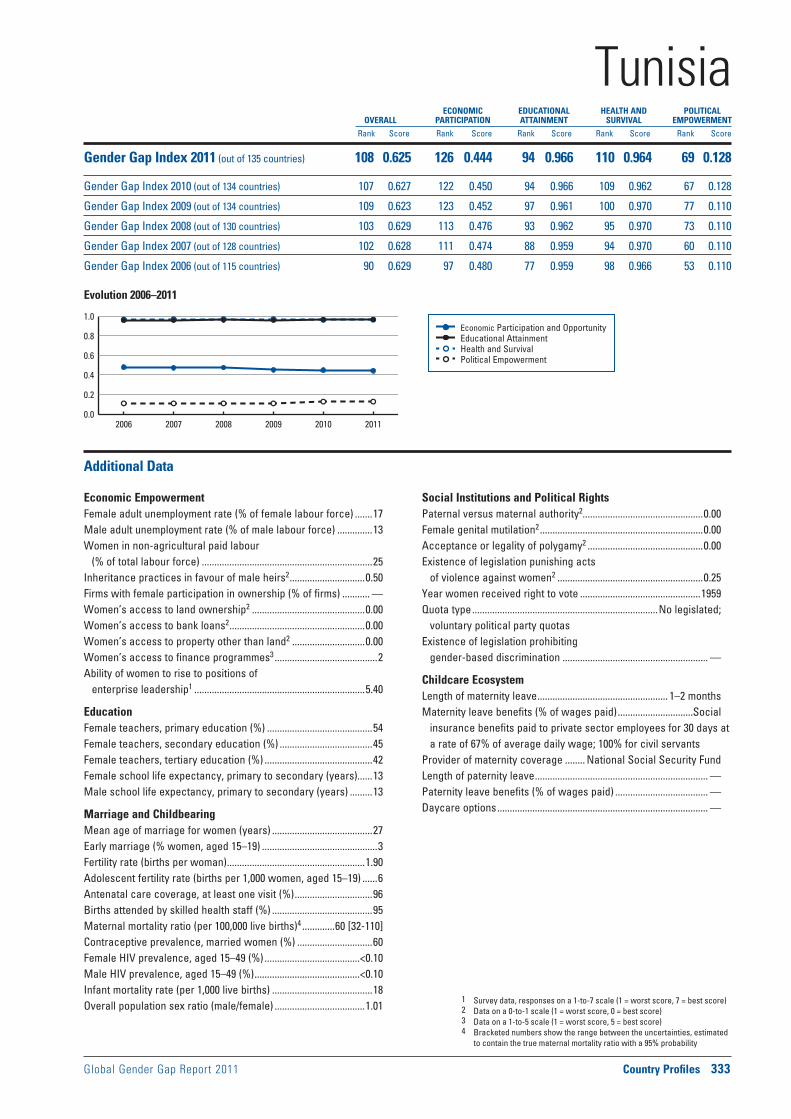
Global Gender Gap Report 2011 Country Profiles 333
Economic Participation and Opportunity Educational Attainment Health and Survival Political Empowerment
Evolution 2006–2011
1 Survey data, responses on a 1-to-7 scale (1 = worst score, 7 = best score)2 Data on a 0-to-1 scale (1 = worst score, 0 = best score)3 Data on a 1-to-5 scale (1 = worst score, 5 = best score)4 Bracketed numbers show the range between the uncertainties, estimated
to contain the true maternal mortality ratio with a 95% probability
ECONOMIC EDUCATIONAL HEALTH AND POLITICAL OVERALL PARTICIPATION ATTAINMENT SURVIVAL EMPOWERMENT
Rank Score Rank Score Rank Score Rank Score Rank Score
0.0
0.2
0.4
0.6
0.8
1.0
2006 2007 2008 2009 2010 2011
Additional Data
Economic EmpowermentFemale adult unemployment rate (% of female labour force) .......17Male adult unemployment rate (% of male labour force) ..............13Women in non-agricultural paid labour
(% of total labour force) ....................................................................25Inheritance practices in favour of male heirs2 ..............................0.50Firms with female participation in ownership (% of firms) ........... —Women’s access to land ownership2 .............................................0.00Women’s access to bank loans2 ......................................................0.00Women’s access to property other than land2 .............................0.00Women’s access to finance programmes3 .........................................2Ability of women to rise to positions of
enterprise leadership1 ....................................................................5.40
EducationFemale teachers, primary education (%) ..........................................54Female teachers, secondary education (%) .....................................45Female teachers, tertiary education (%) ...........................................42Female school life expectancy, primary to secondary (years)......13Male school life expectancy, primary to secondary (years) .........13
Marriage and ChildbearingMean age of marriage for women (years) ........................................27Early marriage (% women, aged 15–19) ..............................................3Fertility rate (births per woman) .......................................................1.90Adolescent fertility rate (births per 1,000 women, aged 15–19) ......6Antenatal care coverage, at least one visit (%) ...............................96Births attended by skilled health staff (%) ........................................95Maternal mortality ratio (per 100,000 live births)4 .............60 [32-110]Contraceptive prevalence, married women (%) ..............................60Female HIV prevalence, aged 15–49 (%) ......................................<0.10Male HIV prevalence, aged 15–49 (%) ..........................................<0.10Infant mortality rate (per 1,000 live births) ........................................18Overall population sex ratio (male/female) ....................................1.01
Social Institutions and Political RightsPaternal versus maternal authority2................................................0.00Female genital mutilation2 .................................................................0.00Acceptance or legality of polygamy2 ..............................................0.00Existence of legislation punishing acts
of violence against women2 ..........................................................0.25Year women received right to vote ................................................1959Quota type ..........................................................................No legislated;
voluntary political party quotasExistence of legislation prohibiting
gender-based discrimination .......................................................... —
Childcare EcosystemLength of maternity leave .................................................... 1–2 monthsMaternity leave benefits (% of wages paid) ..............................Social
insurance benefits paid to private sector employees for 30 days at a rate of 67% of average daily wage; 100% for civil servants
Provider of maternity coverage ........ National Social Security FundLength of paternity leave ..................................................................... —Paternity leave benefits (% of wages paid) ..................................... —Daycare options .................................................................................... —
TunisiaGender Gap Index 2011 (out of 135 countries) 108 0.625 126 0.444 94 0.966 110 0.964 69 0.128
Gender Gap Index 2010 (out of 134 countries) 107 0.627 122 0.450 94 0.966 109 0.962 67 0.128
Gender Gap Index 2009 (out of 134 countries) 109 0.623 123 0.452 97 0.961 100 0.970 77 0.110
Gender Gap Index 2008 (out of 130 countries) 103 0.629 113 0.476 93 0.962 95 0.970 73 0.110
Gender Gap Index 2007 (out of 128 countries) 102 0.628 111 0.474 88 0.959 94 0.970 60 0.110
Gender Gap Index 2006 (out of 115 countries) 90 0.629 97 0.480 77 0.959 98 0.966 53 0.110

Female-to-male ratio
0.00 = INEQUALITY 1.00 = EQUALITY 1.50
0.00 = INEQUALITY 1.00 = EQUALITY 1.50
0.00 = INEQUALITY 1.00 = EQUALITY 1.50
0.00 = INEQUALITY 1.00 = EQUALITY 1.50
Female-to-male ratio
Female-to-male ratio
Female-to-male ratio
334 Country Profiles Global Gender Gap Report 2011
Sample Female-to- Rank Score average Female Male male ratio
country score sample average
0.00 = inequality 1.00 = equality
0.00
0.20
0.40
0.60
0.80
1.00Economy
Education
Politics
Health
Rank Score(out of 135 countries) (0.00 = inequality, 1.00 = equality)
Gender Gap Subindexes
Economic Participation and Opportunity ....... 132 0.389 0.588
Labour force participation .................................. 126 0.35 0.68 26 74 0.35
Wage equality for similar work (survey) .......... 102 0.58 0.65 — — 0.58
Estimated earned income (PPP US$) ............... 124 0.26 0.52 5,602 21,660 0.26
Legislators, senior officials, and managers .... 110 0.11 0.26 10 90 0.11
Professional and technical workers .................. 94 0.54 0.64 35 65 0.54
Educational Attainment ...................................... 106 0.920 0.928
Literacy rate .......................................................... 104 0.89 0.86 85 96 0.89
Enrolment in primary education ........................ 110 0.98 0.98 94 96 0.98
Enrolment in secondary education ................... 111 0.91 0.90 70 77 0.91
Enrolment in tertiary education ......................... 103 0.78 0.86 34 43 0.78
Health and Survival ............................................... 62 0.976 0.956
Sex ratio at birth (female/male) ............................. 1 0.94 0.92 — — 0.95
Healthy life expectancy ........................................ 72 1.05 1.04 67 64 1.05
Political Empowerment ........................................ 89 0.097 0.185
Women in parliament ............................................ 82 0.17 0.22 14 86 0.17
Women in ministerial positions ........................... 99 0.08 0.18 8 92 0.08
Years with female head of state (last 50) .......... 26 0.06 0.16 3 47 0.06
TurkeyGender Gap Index 2011 122 0.595
Key Indicators
Total population (millions) 75.71
Population growth (%) 1.18
GDP (US$ billions) 388.91
GDP (PPP) per capita 12,051

Global Gender Gap Report 2011 Country Profiles 335
Economic Participation and Opportunity Educational Attainment Health and Survival Political Empowerment
Evolution 2006–2011
1 Survey data, responses on a 1-to-7 scale (1 = worst score, 7 = best score)2 Data on a 0-to-1 scale (1 = worst score, 0 = best score)3 Data on a 1-to-5 scale (1 = worst score, 5 = best score)4 Bracketed numbers show the range between the uncertainties, estimated
to contain the true maternal mortality ratio with a 95% probability
ECONOMIC EDUCATIONAL HEALTH AND POLITICAL OVERALL PARTICIPATION ATTAINMENT SURVIVAL EMPOWERMENT
Rank Score Rank Score Rank Score Rank Score Rank Score
0.0
0.2
0.4
0.6
0.8
1.0
2006 2007 2008 2009 2010 2011
Additional Data
Economic EmpowermentFemale adult unemployment rate (% of female labour force) .......14Male adult unemployment rate (% of male labour force) ..............11Women in non-agricultural paid labour
(% of total labour force) ....................................................................22Inheritance practices in favour of male heirs2 ................................ —Firms with female participation in ownership (% of firms) ........... —Women’s access to land ownership2 ............................................... —Women’s access to bank loans2 ........................................................ —Women’s access to property other than land2 ............................... —Women’s access to finance programmes3 .........................................3Ability of women to rise to positions of
enterprise leadership1 ....................................................................4.11
EducationFemale teachers, primary education (%) ......................................... —Female teachers, secondary education (%) .................................... —Female teachers, tertiary education (%) ...........................................40Female school life expectancy, primary to secondary (years)......10Male school life expectancy, primary to secondary (years) .........10
Marriage and ChildbearingMean age of marriage for women (years) ........................................23Early marriage (% women, aged 15–19) ........................................... —Fertility rate (births per woman) .......................................................2.10Adolescent fertility rate (births per 1,000 women, aged 15–19) ....56Antenatal care coverage, at least one visit (%) ...............................92Births attended by skilled health staff (%) ........................................91Maternal mortality ratio (per 100,000 live births)4 ...............23 [15-36]Contraceptive prevalence, married women (%) ..............................71Female HIV prevalence, aged 15–49 (%) ......................................<0.10Male HIV prevalence, aged 15–49 (%) ..........................................<0.10Infant mortality rate (per 1,000 live births) ........................................18Overall population sex ratio (male/female) ....................................1.01
Social Institutions and Political RightsPaternal versus maternal authority2.................................................. —Female genital mutilation2 ................................................................... —Acceptance or legality of polygamy2 ................................................ —Existence of legislation punishing acts
of violence against women2 ............................................................ —Year women received right to vote ................................................1930Quota type .............................................................................................. —Existence of legislation prohibiting
gender-based discrimination ........................................................ Yes
Childcare EcosystemLength of maternity leave ........................................................16 weeksMaternity leave benefits (% of wages paid) ....................................67;
12 weeks coverageProvider of maternity coverage ...................................Social securityLength of paternity leave ..........................Public sector only: 10 daysPaternity leave benefits (% of wages paid) ..................................... —Daycare options .................................................................................... —
TurkeyGender Gap Index 2011 (out of 135 countries) 122 0.595 132 0.389 106 0.920 62 0.976 89 0.097
Gender Gap Index 2010 (out of 134 countries) 126 0.588 131 0.386 109 0.912 61 0.976 99 0.077
Gender Gap Index 2009 (out of 134 countries) 129 0.583 130 0.400 110 0.892 93 0.971 107 0.068
Gender Gap Index 2008 (out of 130 countries) 123 0.585 124 0.412 108 0.890 88 0.971 106 0.068
Gender Gap Index 2007 (out of 128 countries) 121 0.577 118 0.431 110 0.854 87 0.971 108 0.052
Gender Gap Index 2006 (out of 115 countries) 105 0.585 106 0.434 92 0.885 85 0.969 96 0.052
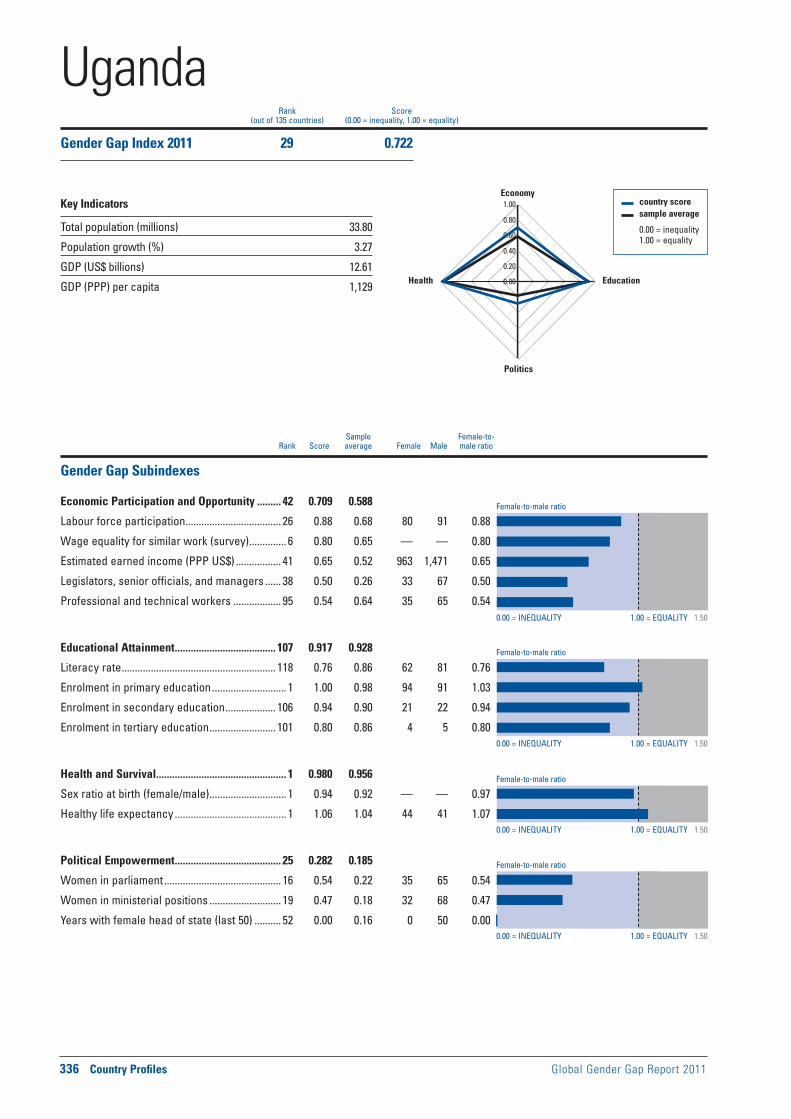
Female-to-male ratio
0.00 = INEQUALITY 1.00 = EQUALITY 1.50
0.00 = INEQUALITY 1.00 = EQUALITY 1.50
0.00 = INEQUALITY 1.00 = EQUALITY 1.50
0.00 = INEQUALITY 1.00 = EQUALITY 1.50
Female-to-male ratio
Female-to-male ratio
Female-to-male ratio
336 Country Profiles Global Gender Gap Report 2011
Sample Female-to- Rank Score average Female Male male ratio
country score sample average
0.00 = inequality 1.00 = equality
0.00
0.20
0.40
0.60
0.80
1.00Economy
Education
Politics
Health
Rank Score(out of 135 countries) (0.00 = inequality, 1.00 = equality)
Gender Gap Subindexes
Economic Participation and Opportunity ......... 42 0.709 0.588
Labour force participation .................................... 26 0.88 0.68 80 91 0.88
Wage equality for similar work (survey) .............. 6 0.80 0.65 — — 0.80
Estimated earned income (PPP US$) ................. 41 0.65 0.52 963 1,471 0.65
Legislators, senior officials, and managers ...... 38 0.50 0.26 33 67 0.50
Professional and technical workers .................. 95 0.54 0.64 35 65 0.54
Educational Attainment ...................................... 107 0.917 0.928
Literacy rate .......................................................... 118 0.76 0.86 62 81 0.76
Enrolment in primary education ............................ 1 1.00 0.98 94 91 1.03
Enrolment in secondary education ................... 106 0.94 0.90 21 22 0.94
Enrolment in tertiary education ......................... 101 0.80 0.86 4 5 0.80
Health and Survival ................................................. 1 0.980 0.956
Sex ratio at birth (female/male) ............................. 1 0.94 0.92 — — 0.97
Healthy life expectancy .......................................... 1 1.06 1.04 44 41 1.07
Political Empowerment ........................................ 25 0.282 0.185
Women in parliament ............................................ 16 0.54 0.22 35 65 0.54
Women in ministerial positions ........................... 19 0.47 0.18 32 68 0.47
Years with female head of state (last 50) .......... 52 0.00 0.16 0 50 0.00
UgandaGender Gap Index 2011 29 0.722
Key Indicators
Total population (millions) 33.80
Population growth (%) 3.27
GDP (US$ billions) 12.61
GDP (PPP) per capita 1,129

Global Gender Gap Report 2011 Country Profiles 337
Economic Participation and Opportunity Educational Attainment Health and Survival Political Empowerment
Evolution 2006–2011
1 Survey data, responses on a 1-to-7 scale (1 = worst score, 7 = best score)2 Data on a 0-to-1 scale (1 = worst score, 0 = best score)3 Data on a 1-to-5 scale (1 = worst score, 5 = best score)4 Bracketed numbers show the range between the uncertainties, estimated
to contain the true maternal mortality ratio with a 95% probability
ECONOMIC EDUCATIONAL HEALTH AND POLITICAL OVERALL PARTICIPATION ATTAINMENT SURVIVAL EMPOWERMENT
Rank Score Rank Score Rank Score Rank Score Rank Score
0.0
0.2
0.4
0.6
0.8
1.0
2006 2007 2008 2009 2010 2011
Additional Data
Economic EmpowermentFemale adult unemployment rate (% of female labour force) .........4Male adult unemployment rate (% of male labour force) ................3Women in non-agricultural paid labour
(% of total labour force) ....................................................................39Inheritance practices in favour of male heirs2 ..............................1.00Firms with female participation in ownership (% of firms) ............39Women’s access to land ownership2 .............................................0.50Women’s access to bank loans2 ......................................................0.50Women’s access to property other than land2 .............................0.50Women’s access to finance programmes3 .........................................2Ability of women to rise to positions of
enterprise leadership1 ....................................................................5.62
EducationFemale teachers, primary education (%) ..........................................40Female teachers, secondary education (%) .....................................23Female teachers, tertiary education (%) ...........................................20Female school life expectancy, primary to secondary (years)......10Male school life expectancy, primary to secondary (years) .........11
Marriage and ChildbearingMean age of marriage for women (years) ........................................20Early marriage (% women, aged 15–19) ............................................32Fertility rate (births per woman) .......................................................6.30Adolescent fertility rate (births per 1,000 women, aged 15–19) ..159Antenatal care coverage, at least one visit (%) ...............................94Births attended by skilled health staff (%) ........................................42Maternal mortality ratio (per 100,000 live births)4 .........430 [240-670]Contraceptive prevalence, married women (%) ..............................24Female HIV prevalence, aged 15–49 (%) ........................................7.70Male HIV prevalence, aged 15–49 (%) ............................................5.30Infant mortality rate (per 1,000 live births) ........................................79Overall population sex ratio (male/female) ....................................1.00
Social Institutions and Political RightsPaternal versus maternal authority2................................................0.50Female genital mutilation2 .................................................................0.05Acceptance or legality of polygamy2 ..............................................1.00Existence of legislation punishing acts
of violence against women2 ..........................................................0.75Year women received right to vote ................................................1962Quota type .......................................................................Reserved seatsExistence of legislation prohibiting
gender-based discrimination .......................................................... —
Childcare EcosystemLength of maternity leave ............................................60 working daysMaternity leave benefits (% of wages paid) ...................................100Provider of maternity coverage .............................................EmployerLength of paternity leave ..................................................................... —Paternity leave benefits (% of wages paid) ..................................... —Daycare options .................................................................................... —
UgandaGender Gap Index 2011 (out of 135 countries) 29 0.722 42 0.709 107 0.917 1 0.980 25 0.282
Gender Gap Index 2010 (out of 134 countries) 33 0.717 42 0.707 107 0.922 1 0.980 29 0.259
Gender Gap Index 2009 (out of 134 countries) 40 0.707 28 0.726 111 0.892 69 0.976 30 0.233
Gender Gap Index 2008 (out of 130 countries) 43 0.698 40 0.694 109 0.889 66 0.976 30 0.233
Gender Gap Index 2007 (out of 128 countries) 50 0.683 41 0.676 104 0.874 64 0.976 24 0.207
Gender Gap Index 2006 (out of 115 countries) 47 0.680 28 0.677 98 0.859 60 0.976 22 0.207
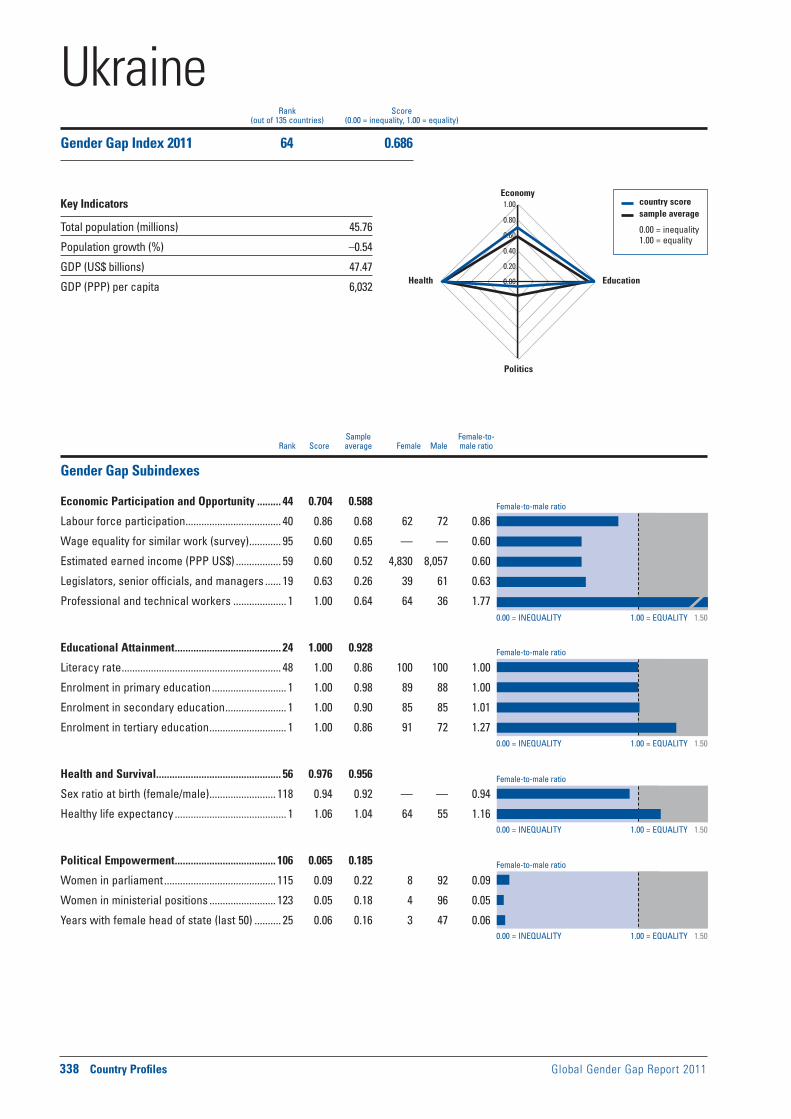
Female-to-male ratio
0.00 = INEQUALITY 1.00 = EQUALITY 1.50
0.00 = INEQUALITY 1.00 = EQUALITY 1.50
0.00 = INEQUALITY 1.00 = EQUALITY 1.50
0.00 = INEQUALITY 1.00 = EQUALITY 1.50
Female-to-male ratio
Female-to-male ratio
Female-to-male ratio
338 Country Profiles Global Gender Gap Report 2011
Sample Female-to- Rank Score average Female Male male ratio
country score sample average
0.00 = inequality 1.00 = equality
0.00
0.20
0.40
0.60
0.80
1.00Economy
Education
Politics
Health
Rank Score(out of 135 countries) (0.00 = inequality, 1.00 = equality)
Gender Gap Subindexes
Economic Participation and Opportunity ......... 44 0.704 0.588
Labour force participation .................................... 40 0.86 0.68 62 72 0.86
Wage equality for similar work (survey) ............ 95 0.60 0.65 — — 0.60
Estimated earned income (PPP US$) ................. 59 0.60 0.52 4,830 8,057 0.60
Legislators, senior officials, and managers ...... 19 0.63 0.26 39 61 0.63
Professional and technical workers .................... 1 1.00 0.64 64 36 1.77
Educational Attainment ........................................ 24 1.000 0.928
Literacy rate ............................................................ 48 1.00 0.86 100 100 1.00
Enrolment in primary education ............................ 1 1.00 0.98 89 88 1.00
Enrolment in secondary education ....................... 1 1.00 0.90 85 85 1.01
Enrolment in tertiary education ............................. 1 1.00 0.86 91 72 1.27
Health and Survival ............................................... 56 0.976 0.956
Sex ratio at birth (female/male) ......................... 118 0.94 0.92 — — 0.94
Healthy life expectancy .......................................... 1 1.06 1.04 64 55 1.16
Political Empowerment ...................................... 106 0.065 0.185
Women in parliament .......................................... 115 0.09 0.22 8 92 0.09
Women in ministerial positions ......................... 123 0.05 0.18 4 96 0.05
Years with female head of state (last 50) .......... 25 0.06 0.16 3 47 0.06
UkraineGender Gap Index 2011 64 0.686
Key Indicators
Total population (millions) 45.76
Population growth (%) –0.54
GDP (US$ billions) 47.47
GDP (PPP) per capita 6,032
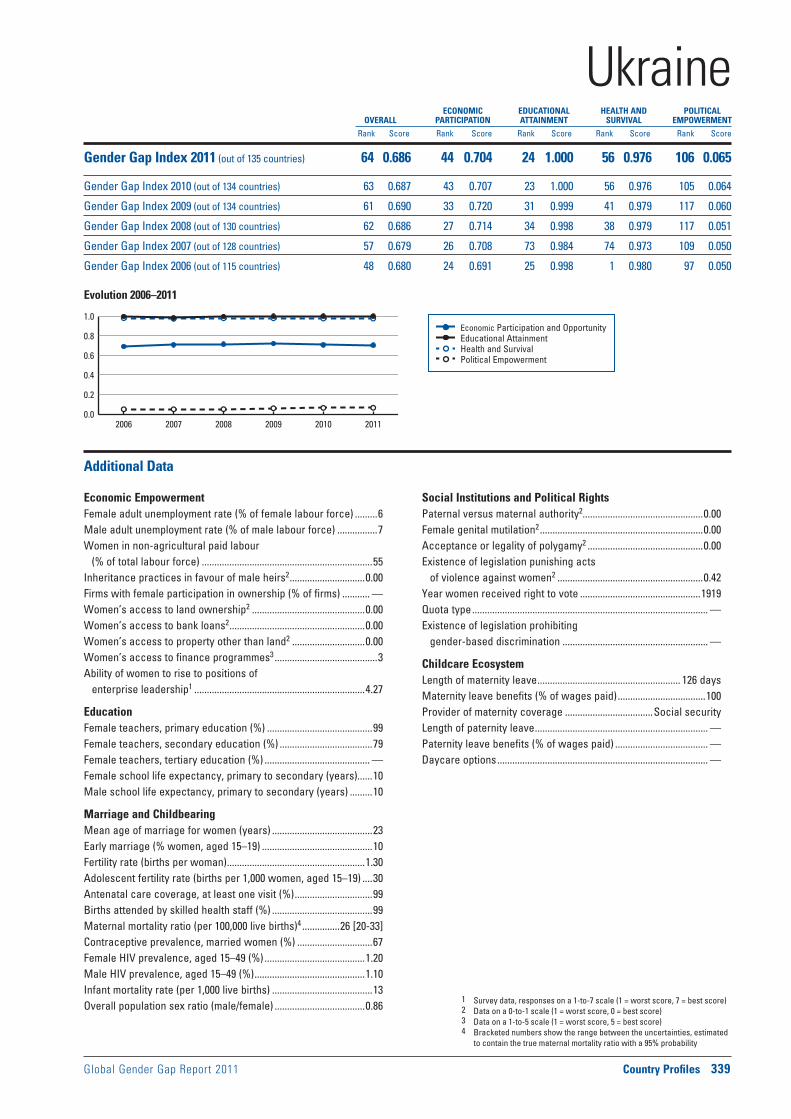
Global Gender Gap Report 2011 Country Profiles 339
Economic Participation and Opportunity Educational Attainment Health and Survival Political Empowerment
Evolution 2006–2011
1 Survey data, responses on a 1-to-7 scale (1 = worst score, 7 = best score)2 Data on a 0-to-1 scale (1 = worst score, 0 = best score)3 Data on a 1-to-5 scale (1 = worst score, 5 = best score)4 Bracketed numbers show the range between the uncertainties, estimated
to contain the true maternal mortality ratio with a 95% probability
ECONOMIC EDUCATIONAL HEALTH AND POLITICAL OVERALL PARTICIPATION ATTAINMENT SURVIVAL EMPOWERMENT
Rank Score Rank Score Rank Score Rank Score Rank Score
0.0
0.2
0.4
0.6
0.8
1.0
2006 2007 2008 2009 2010 2011
Additional Data
Economic EmpowermentFemale adult unemployment rate (% of female labour force) .........6Male adult unemployment rate (% of male labour force) ................7Women in non-agricultural paid labour
(% of total labour force) ....................................................................55Inheritance practices in favour of male heirs2 ..............................0.00Firms with female participation in ownership (% of firms) ........... —Women’s access to land ownership2 .............................................0.00Women’s access to bank loans2 ......................................................0.00Women’s access to property other than land2 .............................0.00Women’s access to finance programmes3 .........................................3Ability of women to rise to positions of
enterprise leadership1 ....................................................................4.27
EducationFemale teachers, primary education (%) ..........................................99Female teachers, secondary education (%) .....................................79Female teachers, tertiary education (%) .......................................... —Female school life expectancy, primary to secondary (years)......10Male school life expectancy, primary to secondary (years) .........10
Marriage and ChildbearingMean age of marriage for women (years) ........................................23Early marriage (% women, aged 15–19) ............................................10Fertility rate (births per woman) .......................................................1.30Adolescent fertility rate (births per 1,000 women, aged 15–19) ....30Antenatal care coverage, at least one visit (%) ...............................99Births attended by skilled health staff (%) ........................................99Maternal mortality ratio (per 100,000 live births)4 ...............26 [20-33]Contraceptive prevalence, married women (%) ..............................67Female HIV prevalence, aged 15–49 (%) ........................................1.20Male HIV prevalence, aged 15–49 (%) ............................................1.10Infant mortality rate (per 1,000 live births) ........................................13Overall population sex ratio (male/female) ....................................0.86
Social Institutions and Political RightsPaternal versus maternal authority2................................................0.00Female genital mutilation2 .................................................................0.00Acceptance or legality of polygamy2 ..............................................0.00Existence of legislation punishing acts
of violence against women2 ..........................................................0.42Year women received right to vote ................................................1919Quota type .............................................................................................. —Existence of legislation prohibiting
gender-based discrimination .......................................................... —
Childcare EcosystemLength of maternity leave ......................................................... 126 daysMaternity leave benefits (% of wages paid) ...................................100Provider of maternity coverage ...................................Social securityLength of paternity leave ..................................................................... —Paternity leave benefits (% of wages paid) ..................................... —Daycare options .................................................................................... —
UkraineGender Gap Index 2011 (out of 135 countries) 64 0.686 44 0.704 24 1.000 56 0.976 106 0.065
Gender Gap Index 2010 (out of 134 countries) 63 0.687 43 0.707 23 1.000 56 0.976 105 0.064
Gender Gap Index 2009 (out of 134 countries) 61 0.690 33 0.720 31 0.999 41 0.979 117 0.060
Gender Gap Index 2008 (out of 130 countries) 62 0.686 27 0.714 34 0.998 38 0.979 117 0.051
Gender Gap Index 2007 (out of 128 countries) 57 0.679 26 0.708 73 0.984 74 0.973 109 0.050
Gender Gap Index 2006 (out of 115 countries) 48 0.680 24 0.691 25 0.998 1 0.980 97 0.050
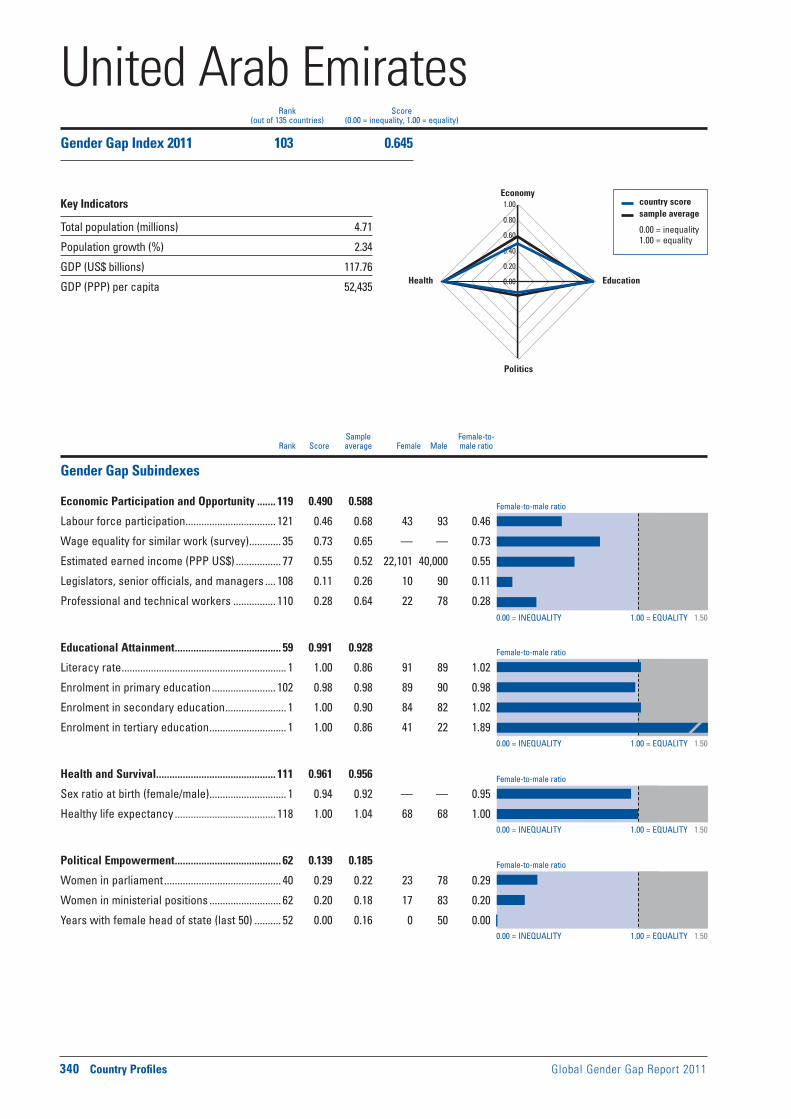
Female-to-male ratio
0.00 = INEQUALITY 1.00 = EQUALITY 1.50
0.00 = INEQUALITY 1.00 = EQUALITY 1.50
0.00 = INEQUALITY 1.00 = EQUALITY 1.50
0.00 = INEQUALITY 1.00 = EQUALITY 1.50
Female-to-male ratio
Female-to-male ratio
Female-to-male ratio
340 Country Profiles Global Gender Gap Report 2011
Sample Female-to- Rank Score average Female Male male ratio
country score sample average
0.00 = inequality 1.00 = equality
0.00
0.20
0.40
0.60
0.80
1.00Economy
Education
Politics
Health
Rank Score(out of 135 countries) (0.00 = inequality, 1.00 = equality)
Gender Gap Subindexes
Economic Participation and Opportunity ....... 119 0.490 0.588
Labour force participation .................................. 121 0.46 0.68 43 93 0.46
Wage equality for similar work (survey) ............ 35 0.73 0.65 — — 0.73
Estimated earned income (PPP US$) ................. 77 0.55 0.52 22,101 40,000 0.55
Legislators, senior officials, and managers .... 108 0.11 0.26 10 90 0.11
Professional and technical workers ................ 110 0.28 0.64 22 78 0.28
Educational Attainment ........................................ 59 0.991 0.928
Literacy rate .............................................................. 1 1.00 0.86 91 89 1.02
Enrolment in primary education ........................ 102 0.98 0.98 89 90 0.98
Enrolment in secondary education ....................... 1 1.00 0.90 84 82 1.02
Enrolment in tertiary education ............................. 1 1.00 0.86 41 22 1.89
Health and Survival ............................................. 111 0.961 0.956
Sex ratio at birth (female/male) ............................. 1 0.94 0.92 — — 0.95
Healthy life expectancy ...................................... 118 1.00 1.04 68 68 1.00
Political Empowerment ........................................ 62 0.139 0.185
Women in parliament ............................................ 40 0.29 0.22 23 78 0.29
Women in ministerial positions ........................... 62 0.20 0.18 17 83 0.20
Years with female head of state (last 50) .......... 52 0.00 0.16 0 50 0.00
United Arab EmiratesGender Gap Index 2011 103 0.645
Key Indicators
Total population (millions) 4.71
Population growth (%) 2.34
GDP (US$ billions) 117.76
GDP (PPP) per capita 52,435

Global Gender Gap Report 2011 Country Profiles 341
Economic Participation and Opportunity Educational Attainment Health and Survival Political Empowerment
Evolution 2006–2011
1 Survey data, responses on a 1-to-7 scale (1 = worst score, 7 = best score)2 Data on a 0-to-1 scale (1 = worst score, 0 = best score)3 Data on a 1-to-5 scale (1 = worst score, 5 = best score)4 Bracketed numbers show the range between the uncertainties, estimated
to contain the true maternal mortality ratio with a 95% probability
ECONOMIC EDUCATIONAL HEALTH AND POLITICAL OVERALL PARTICIPATION ATTAINMENT SURVIVAL EMPOWERMENT
Rank Score Rank Score Rank Score Rank Score Rank Score
0.0
0.2
0.4
0.6
0.8
1.0
2006 2007 2008 2009 2010 2011
Additional Data
Economic EmpowermentFemale adult unemployment rate (% of female labour force) .......12Male adult unemployment rate (% of male labour force) ................2Women in non-agricultural paid labour
(% of total labour force) ....................................................................20Inheritance practices in favour of male heirs2 ..............................0.50Firms with female participation in ownership (% of firms) ........... —Women’s access to land ownership2 .............................................0.50Women’s access to bank loans2 ......................................................0.00Women’s access to property other than land2 .............................0.50Women’s access to finance programmes3 .........................................2Ability of women to rise to positions of
enterprise leadership1 ....................................................................5.05
EducationFemale teachers, primary education (%) ..........................................86Female teachers, secondary education (%) .....................................58Female teachers, tertiary education (%) ...........................................31Female school life expectancy, primary to secondary (years)......12Male school life expectancy, primary to secondary (years) .........12
Marriage and ChildbearingMean age of marriage for women (years) ........................................24Early marriage (% women, aged 15–19) ............................................19Fertility rate (births per woman) .......................................................1.90Adolescent fertility rate (births per 1,000 women, aged 15–19) ....22Antenatal care coverage, at least one visit (%) .............................100Births attended by skilled health staff (%) ......................................100Maternal mortality ratio (per 100,000 live births)4 .................10 [4-24]Contraceptive prevalence, married women (%) ..............................28Female HIV prevalence, aged 15–49 (%) .......................................... —Male HIV prevalence, aged 15–49 (%) .............................................. —Infant mortality rate (per 1,000 live births) ..........................................7Overall population sex ratio (male/female) ....................................2.04
Social Institutions and Political RightsPaternal versus maternal authority2................................................1.00Female genital mutilation2 .................................................................0.30Acceptance or legality of polygamy2 ..............................................1.00Existence of legislation punishing acts
of violence against women2 ..........................................................0.75Year women received right to vote ................................................2006Quota type .............................................................................................. —Existence of legislation prohibiting
gender-based discrimination ........................................................ Yes
Childcare EcosystemLength of maternity leave ........................................................... 45 daysMaternity leave benefits (% of wages paid) ......................100% after
one continuous year of employment, 50% for employment less than one year
Provider of maternity coverage .............................................EmployerLength of paternity leave ........................................ Public sector only:
3 consecutive working days after birth. Private sector: nonePaternity leave benefits
(% of wages paid) ......................................... 100; public sector onlyDaycare options .................................................................................... —
United Arab EmiratesGender Gap Index 2011 (out of 135 countries) 103 0.645 119 0.490 59 0.991 111 0.961 62 0.139
Gender Gap Index 2010 (out of 134 countries) 103 0.640 120 0.461 37 0.998 110 0.961 60 0.139
Gender Gap Index 2009 (out of 134 countries) 112 0.620 126 0.415 67 0.992 116 0.961 76 0.111
Gender Gap Index 2008 (out of 130 countries) 105 0.622 121 0.420 46 0.996 112 0.961 72 0.111
Gender Gap Index 2007 (out of 128 countries) 105 0.618 119 0.421 68 0.987 110 0.961 65 0.105
Gender Gap Index 2006 (out of 115 countries) 101 0.592 109 0.403 61 0.986 100 0.964 112 0.015

Female-to-male ratio
0.00 = INEQUALITY 1.00 = EQUALITY 1.50
0.00 = INEQUALITY 1.00 = EQUALITY 1.50
0.00 = INEQUALITY 1.00 = EQUALITY 1.50
0.00 = INEQUALITY 1.00 = EQUALITY 1.50
Female-to-male ratio
Female-to-male ratio
Female-to-male ratio
342 Country Profiles Global Gender Gap Report 2011
Sample Female-to- Rank Score average Female Male male ratio
country score sample average
0.00 = inequality 1.00 = equality
0.00
0.20
0.40
0.60
0.80
1.00Economy
Education
Politics
Health
Rank Score(out of 135 countries) (0.00 = inequality, 1.00 = equality)
Gender Gap Subindexes
Economic Participation and Opportunity ......... 33 0.722 0.588
Labour force participation .................................... 47 0.84 0.68 69 82 0.84
Wage equality for similar work (survey) ............ 57 0.68 0.65 — — 0.68
Estimated earned income (PPP US$) ................. 23 0.71 0.52 28,354 40,000 0.71
Legislators, senior officials, and managers ...... 35 0.53 0.26 35 65 0.53
Professional and technical workers .................. 70 0.90 0.64 47 53 0.90
Educational Attainment .......................................... 1 1.000 0.928
Literacy rate .............................................................. 1 1.00 0.86 99 99 1.00
Enrolment in primary education ............................ 1 1.00 0.98 100 99 1.00
Enrolment in secondary education ....................... 1 1.00 0.90 95 92 1.03
Enrolment in tertiary education ............................. 1 1.00 0.86 69 50 1.39
Health and Survival ............................................... 91 0.970 0.956
Sex ratio at birth (female/male) ............................. 1 0.94 0.92 — — 0.95
Healthy life expectancy ........................................ 97 1.03 1.04 73 71 1.03
Political Empowerment ........................................ 23 0.293 0.185
Women in parliament ............................................ 45 0.28 0.22 22 78 0.28
Women in ministerial positions ........................... 43 0.29 0.18 23 77 0.29
Years with female head of state (last 50) ............ 7 0.30 0.16 12 38 0.30
United KingdomGender Gap Index 2011 16 0.746
Key Indicators
Total population (millions) 62.25
Population growth (%) 0.66
GDP (US$ billions) 1,698.16
GDP (PPP) per capita 32,173

Global Gender Gap Report 2011 Country Profiles 343
Economic Participation and Opportunity Educational Attainment Health and Survival Political Empowerment
Evolution 2006–2011
1 Survey data, responses on a 1-to-7 scale (1 = worst score, 7 = best score)2 Data on a 0-to-1 scale (1 = worst score, 0 = best score)3 Data on a 1-to-5 scale (1 = worst score, 5 = best score)4 Bracketed numbers show the range between the uncertainties, estimated
to contain the true maternal mortality ratio with a 95% probability
ECONOMIC EDUCATIONAL HEALTH AND POLITICAL OVERALL PARTICIPATION ATTAINMENT SURVIVAL EMPOWERMENT
Rank Score Rank Score Rank Score Rank Score Rank Score
0.0
0.2
0.4
0.6
0.8
1.0
2006 2007 2008 2009 2010 2011
Additional Data
Economic EmpowermentFemale adult unemployment rate (% of female labour force) .........6Male adult unemployment rate (% of male labour force) ................6Women in non-agricultural paid labour
(% of total labour force) ....................................................................52Inheritance practices in favour of male heirs2 ................................ —Firms with female participation in ownership (% of firms) ........... —Women’s access to land ownership2 ............................................... —Women’s access to bank loans2 ........................................................ —Women’s access to property other than land2 ............................... —Women’s access to finance programmes3 .........................................5Ability of women to rise to positions of
enterprise leadership1 ....................................................................4.90
EducationFemale teachers, primary education (%) ..........................................81Female teachers, secondary education (%) .....................................62Female teachers, tertiary education (%) ...........................................42Female school life expectancy, primary to secondary (years)......13Male school life expectancy, primary to secondary (years) .........13
Marriage and ChildbearingMean age of marriage for women (years) ........................................26Early marriage (% women, aged 15–19) ........................................... —Fertility rate (births per woman) .......................................................1.80Adolescent fertility rate (births per 1,000 women, aged 15–19) ....26Antenatal care coverage, at least one visit (%) .............................. —Births attended by skilled health staff (%) ........................................99Maternal mortality ratio (per 100,000 live births)4 ...............12 [11-14]Contraceptive prevalence, married women (%) ..............................82Female HIV prevalence, aged 15–49 (%) ........................................0.20Male HIV prevalence, aged 15–49 (%) ............................................0.30Infant mortality rate (per 1,000 live births) ..........................................5Overall population sex ratio (male/female) ....................................0.96
Social Institutions and Political RightsPaternal versus maternal authority2.................................................. —Female genital mutilation2 ................................................................... —Acceptance or legality of polygamy2 ................................................ —Existence of legislation punishing acts
of violence against women2 ............................................................ —Year women received right to vote ......................................1918, 1928Quota type ..........................................................................No legislated;
voluntary political party quotasExistence of legislation prohibiting
gender-based discrimination ........................................................ Yes
Childcare EcosystemLength of maternity leave ........................................................52 weeksMaternity leave benefits (% of wages paid) ........................ Statutory
maternity leave is paid for a continuous period of up to 39 weeks; 90% for the first 6 weeks and a flat rate for the remaining weeks; from April 2010, paid maternity leave increased to 52 weeks
Provider of maternity coverage .............................................Employer (92% refunded by public funds)
Length of paternity leave ...........................................................2 weeks within the first 8 weeks after birth; fathers may also be able to take up to 26 weeks’ additional paternity leave if the mother returns to work before the end of her 52-week maternity leave period
Paternity leave benefits (% of wages paid) .................................. 90% capped at a flat rate for 2 weeks
Daycare options ......................................................................Public and private daycare, without allowance to families
United KingdomGender Gap Index 2011 (out of 135 countries) 16 0.746 33 0.722 1 1.000 91 0.970 23 0.293
Gender Gap Index 2010 (out of 134 countries) 15 0.746 34 0.721 1 1.000 90 0.970 22 0.293
Gender Gap Index 2009 (out of 134 countries) 15 0.740 35 0.706 1 1.000 72 0.974 22 0.280
Gender Gap Index 2008 (out of 130 countries) 13 0.737 42 0.692 1 1.000 69 0.974 21 0.280
Gender Gap Index 2007 (out of 128 countries) 11 0.744 32 0.695 1 1.000 67 0.974 12 0.307
Gender Gap Index 2006 (out of 115 countries) 9 0.736 37 0.664 1 1.000 63 0.974 12 0.307

Female-to-male ratio
0.00 = INEQUALITY 1.00 = EQUALITY 1.50
0.00 = INEQUALITY 1.00 = EQUALITY 1.50
0.00 = INEQUALITY 1.00 = EQUALITY 1.50
0.00 = INEQUALITY 1.00 = EQUALITY 1.50
Female-to-male ratio
Female-to-male ratio
Female-to-male ratio
344 Country Profiles Global Gender Gap Report 2011
Sample Female-to- Rank Score average Female Male male ratio
country score sample average
0.00 = inequality 1.00 = equality
0.00
0.20
0.40
0.60
0.80
1.00Economy
Education
Politics
Health
Rank Score(out of 135 countries) (0.00 = inequality, 1.00 = equality)
Gender Gap Subindexes
Economic Participation and Opportunity ........... 6 0.800 0.588
Labour force participation .................................... 44 0.85 0.68 68 80 0.85
Wage equality for similar work (survey) ............ 68 0.66 0.65 — — 0.66
Estimated earned income (PPP US$) ................... 5 0.88 0.52 35,346 40,000 0.88
Legislators, senior officials, and managers ...... 10 0.74 0.26 43 57 0.74
Professional and technical workers .................... 1 1.00 0.64 55 45 1.20
Educational Attainment .......................................... 1 1.000 0.928
Literacy rate .............................................................. 1 1.00 0.86 99 99 1.00
Enrolment in primary education ............................ 1 1.00 0.98 92 90 1.02
Enrolment in secondary education ....................... 1 1.00 0.90 89 87 1.02
Enrolment in tertiary education ............................. 1 1.00 0.86 101 72 1.40
Health and Survival ............................................... 39 0.979 0.956
Sex ratio at birth (female/male) ............................. 1 0.94 0.92 — — 0.96
Healthy life expectancy ........................................ 54 1.06 1.04 72 68 1.06
Political Empowerment ........................................ 39 0.186 0.185
Women in parliament ............................................ 72 0.20 0.22 17 83 0.20
Women in ministerial positions ........................... 15 0.50 0.18 33 67 0.50
Years with female head of state (last 50) .......... 52 0.00 0.16 0 50 0.00
United StatesGender Gap Index 2011 17 0.741
Key Indicators
Total population (millions) 309.71
Population growth (%) 0.88
GDP (US$ billions) 11,681.22
GDP (PPP) per capita 42,551
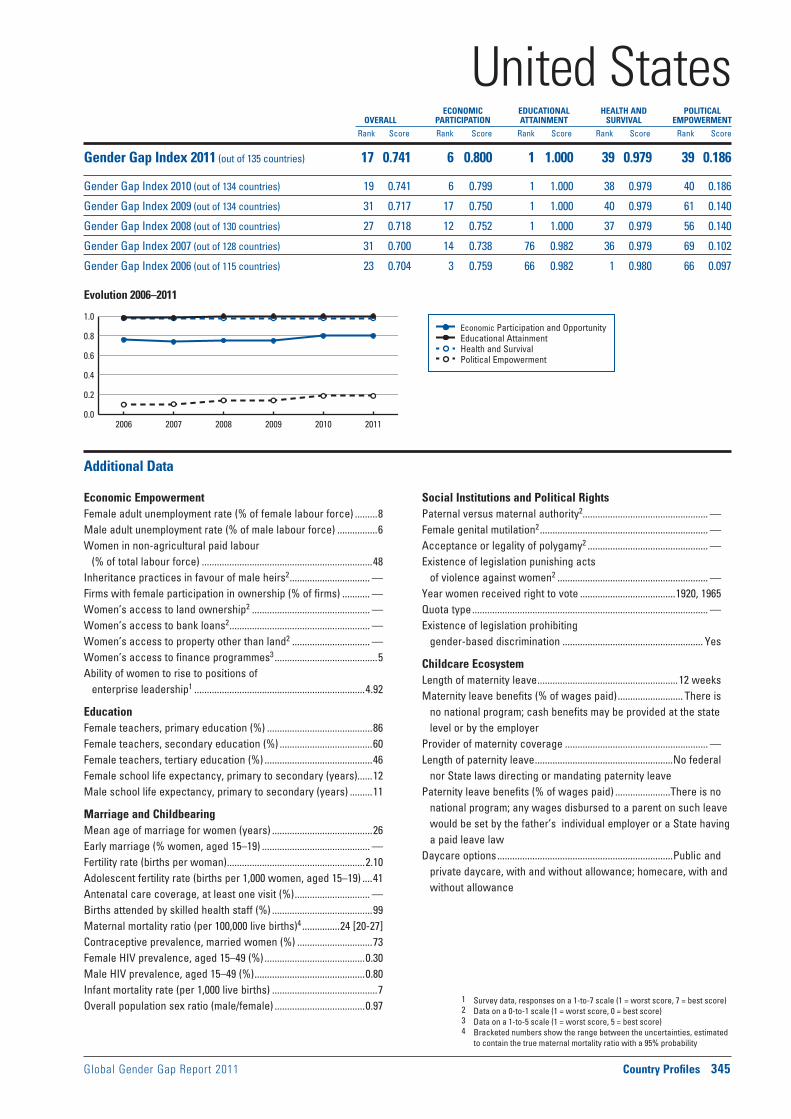
Global Gender Gap Report 2011 Country Profiles 345
Economic Participation and Opportunity Educational Attainment Health and Survival Political Empowerment
Evolution 2006–2011
1 Survey data, responses on a 1-to-7 scale (1 = worst score, 7 = best score)2 Data on a 0-to-1 scale (1 = worst score, 0 = best score)3 Data on a 1-to-5 scale (1 = worst score, 5 = best score)4 Bracketed numbers show the range between the uncertainties, estimated
to contain the true maternal mortality ratio with a 95% probability
ECONOMIC EDUCATIONAL HEALTH AND POLITICAL OVERALL PARTICIPATION ATTAINMENT SURVIVAL EMPOWERMENT
Rank Score Rank Score Rank Score Rank Score Rank Score
0.0
0.2
0.4
0.6
0.8
1.0
2006 2007 2008 2009 2010 2011
Additional Data
Economic EmpowermentFemale adult unemployment rate (% of female labour force) .........8Male adult unemployment rate (% of male labour force) ................6Women in non-agricultural paid labour
(% of total labour force) ....................................................................48Inheritance practices in favour of male heirs2 ................................ —Firms with female participation in ownership (% of firms) ........... —Women’s access to land ownership2 ............................................... —Women’s access to bank loans2 ........................................................ —Women’s access to property other than land2 ............................... —Women’s access to finance programmes3 .........................................5Ability of women to rise to positions of
enterprise leadership1 ....................................................................4.92
EducationFemale teachers, primary education (%) ..........................................86Female teachers, secondary education (%) .....................................60Female teachers, tertiary education (%) ...........................................46Female school life expectancy, primary to secondary (years)......12Male school life expectancy, primary to secondary (years) .........11
Marriage and ChildbearingMean age of marriage for women (years) ........................................26Early marriage (% women, aged 15–19) ........................................... —Fertility rate (births per woman) .......................................................2.10Adolescent fertility rate (births per 1,000 women, aged 15–19) ....41Antenatal care coverage, at least one visit (%) .............................. —Births attended by skilled health staff (%) ........................................99Maternal mortality ratio (per 100,000 live births)4 ...............24 [20-27]Contraceptive prevalence, married women (%) ..............................73Female HIV prevalence, aged 15–49 (%) ........................................0.30Male HIV prevalence, aged 15–49 (%) ............................................0.80Infant mortality rate (per 1,000 live births) ..........................................7Overall population sex ratio (male/female) ....................................0.97
Social Institutions and Political RightsPaternal versus maternal authority2.................................................. —Female genital mutilation2 ................................................................... —Acceptance or legality of polygamy2 ................................................ —Existence of legislation punishing acts
of violence against women2 ............................................................ —Year women received right to vote ......................................1920, 1965Quota type .............................................................................................. —Existence of legislation prohibiting
gender-based discrimination ........................................................ Yes
Childcare EcosystemLength of maternity leave ........................................................12 weeksMaternity leave benefits (% of wages paid) .......................... There is
no national program; cash benefits may be provided at the state level or by the employer
Provider of maternity coverage ......................................................... —Length of paternity leave .......................................................No federal
nor State laws directing or mandating paternity leavePaternity leave benefits (% of wages paid) ......................There is no
national program; any wages disbursed to a parent on such leave would be set by the father’s individual employer or a State having a paid leave law
Daycare options ......................................................................Public and private daycare, with and without allowance; homecare, with and without allowance
United StatesGender Gap Index 2011 (out of 135 countries) 17 0.741 6 0.800 1 1.000 39 0.979 39 0.186
Gender Gap Index 2010 (out of 134 countries) 19 0.741 6 0.799 1 1.000 38 0.979 40 0.186
Gender Gap Index 2009 (out of 134 countries) 31 0.717 17 0.750 1 1.000 40 0.979 61 0.140
Gender Gap Index 2008 (out of 130 countries) 27 0.718 12 0.752 1 1.000 37 0.979 56 0.140
Gender Gap Index 2007 (out of 128 countries) 31 0.700 14 0.738 76 0.982 36 0.979 69 0.102
Gender Gap Index 2006 (out of 115 countries) 23 0.704 3 0.759 66 0.982 1 0.980 66 0.097
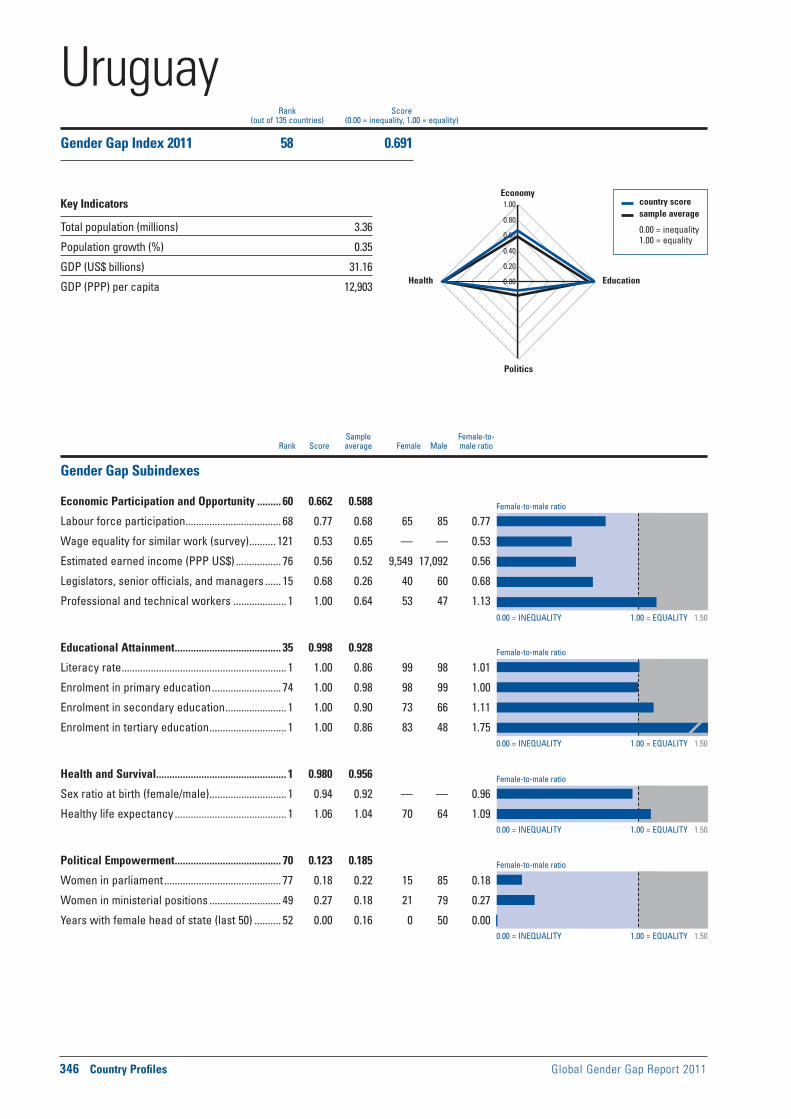
Female-to-male ratio
0.00 = INEQUALITY 1.00 = EQUALITY 1.50
0.00 = INEQUALITY 1.00 = EQUALITY 1.50
0.00 = INEQUALITY 1.00 = EQUALITY 1.50
0.00 = INEQUALITY 1.00 = EQUALITY 1.50
Female-to-male ratio
Female-to-male ratio
Female-to-male ratio
346 Country Profiles Global Gender Gap Report 2011
Sample Female-to- Rank Score average Female Male male ratio
country score sample average
0.00 = inequality 1.00 = equality
0.00
0.20
0.40
0.60
0.80
1.00Economy
Education
Politics
Health
Rank Score(out of 135 countries) (0.00 = inequality, 1.00 = equality)
Gender Gap Subindexes
Economic Participation and Opportunity ......... 60 0.662 0.588
Labour force participation .................................... 68 0.77 0.68 65 85 0.77
Wage equality for similar work (survey) .......... 121 0.53 0.65 — — 0.53
Estimated earned income (PPP US$) ................. 76 0.56 0.52 9,549 17,092 0.56
Legislators, senior officials, and managers ...... 15 0.68 0.26 40 60 0.68
Professional and technical workers .................... 1 1.00 0.64 53 47 1.13
Educational Attainment ........................................ 35 0.998 0.928
Literacy rate .............................................................. 1 1.00 0.86 99 98 1.01
Enrolment in primary education .......................... 74 1.00 0.98 98 99 1.00
Enrolment in secondary education ....................... 1 1.00 0.90 73 66 1.11
Enrolment in tertiary education ............................. 1 1.00 0.86 83 48 1.75
Health and Survival ................................................. 1 0.980 0.956
Sex ratio at birth (female/male) ............................. 1 0.94 0.92 — — 0.96
Healthy life expectancy .......................................... 1 1.06 1.04 70 64 1.09
Political Empowerment ........................................ 70 0.123 0.185
Women in parliament ............................................ 77 0.18 0.22 15 85 0.18
Women in ministerial positions ........................... 49 0.27 0.18 21 79 0.27
Years with female head of state (last 50) .......... 52 0.00 0.16 0 50 0.00
UruguayGender Gap Index 2011 58 0.691
Key Indicators
Total population (millions) 3.36
Population growth (%) 0.35
GDP (US$ billions) 31.16
GDP (PPP) per capita 12,903
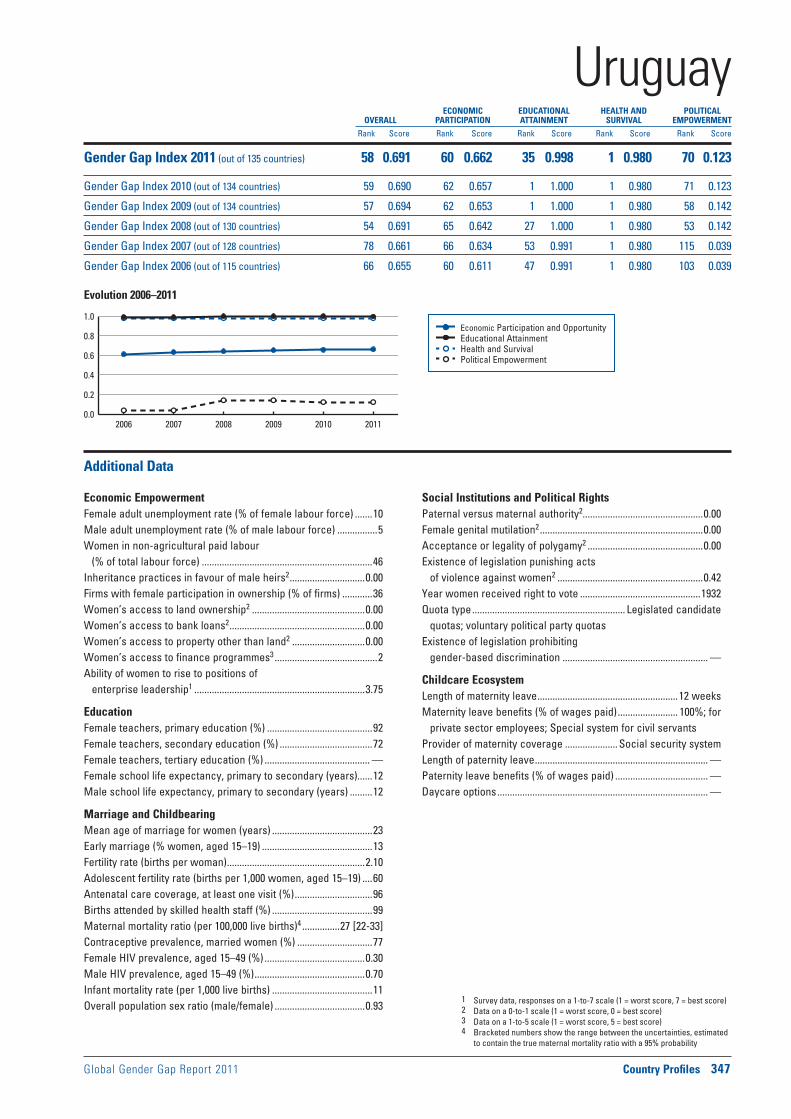
Global Gender Gap Report 2011 Country Profiles 347
Economic Participation and Opportunity Educational Attainment Health and Survival Political Empowerment
Evolution 2006–2011
1 Survey data, responses on a 1-to-7 scale (1 = worst score, 7 = best score)2 Data on a 0-to-1 scale (1 = worst score, 0 = best score)3 Data on a 1-to-5 scale (1 = worst score, 5 = best score)4 Bracketed numbers show the range between the uncertainties, estimated
to contain the true maternal mortality ratio with a 95% probability
ECONOMIC EDUCATIONAL HEALTH AND POLITICAL OVERALL PARTICIPATION ATTAINMENT SURVIVAL EMPOWERMENT
Rank Score Rank Score Rank Score Rank Score Rank Score
0.0
0.2
0.4
0.6
0.8
1.0
2006 2007 2008 2009 2010 2011
Additional Data
Economic EmpowermentFemale adult unemployment rate (% of female labour force) .......10Male adult unemployment rate (% of male labour force) ................5Women in non-agricultural paid labour
(% of total labour force) ....................................................................46Inheritance practices in favour of male heirs2 ..............................0.00Firms with female participation in ownership (% of firms) ............36Women’s access to land ownership2 .............................................0.00Women’s access to bank loans2 ......................................................0.00Women’s access to property other than land2 .............................0.00Women’s access to finance programmes3 .........................................2Ability of women to rise to positions of
enterprise leadership1 ....................................................................3.75
EducationFemale teachers, primary education (%) ..........................................92Female teachers, secondary education (%) .....................................72Female teachers, tertiary education (%) .......................................... —Female school life expectancy, primary to secondary (years)......12Male school life expectancy, primary to secondary (years) .........12
Marriage and ChildbearingMean age of marriage for women (years) ........................................23Early marriage (% women, aged 15–19) ............................................13Fertility rate (births per woman) .......................................................2.10Adolescent fertility rate (births per 1,000 women, aged 15–19) ....60Antenatal care coverage, at least one visit (%) ...............................96Births attended by skilled health staff (%) ........................................99Maternal mortality ratio (per 100,000 live births)4 ...............27 [22-33]Contraceptive prevalence, married women (%) ..............................77Female HIV prevalence, aged 15–49 (%) ........................................0.30Male HIV prevalence, aged 15–49 (%) ............................................0.70Infant mortality rate (per 1,000 live births) ........................................11Overall population sex ratio (male/female) ....................................0.93
Social Institutions and Political RightsPaternal versus maternal authority2................................................0.00Female genital mutilation2 .................................................................0.00Acceptance or legality of polygamy2 ..............................................0.00Existence of legislation punishing acts
of violence against women2 ..........................................................0.42Year women received right to vote ................................................1932Quota type ............................................................. Legislated candidate
quotas; voluntary political party quotasExistence of legislation prohibiting
gender-based discrimination .......................................................... —
Childcare EcosystemLength of maternity leave ........................................................12 weeksMaternity leave benefits (% of wages paid) ........................ 100%; for
private sector employees; Special system for civil servantsProvider of maternity coverage ..................... Social security systemLength of paternity leave ..................................................................... —Paternity leave benefits (% of wages paid) ..................................... —Daycare options .................................................................................... —
UruguayGender Gap Index 2011 (out of 135 countries) 58 0.691 60 0.662 35 0.998 1 0.980 70 0.123
Gender Gap Index 2010 (out of 134 countries) 59 0.690 62 0.657 1 1.000 1 0.980 71 0.123
Gender Gap Index 2009 (out of 134 countries) 57 0.694 62 0.653 1 1.000 1 0.980 58 0.142
Gender Gap Index 2008 (out of 130 countries) 54 0.691 65 0.642 27 1.000 1 0.980 53 0.142
Gender Gap Index 2007 (out of 128 countries) 78 0.661 66 0.634 53 0.991 1 0.980 115 0.039
Gender Gap Index 2006 (out of 115 countries) 66 0.655 60 0.611 47 0.991 1 0.980 103 0.039
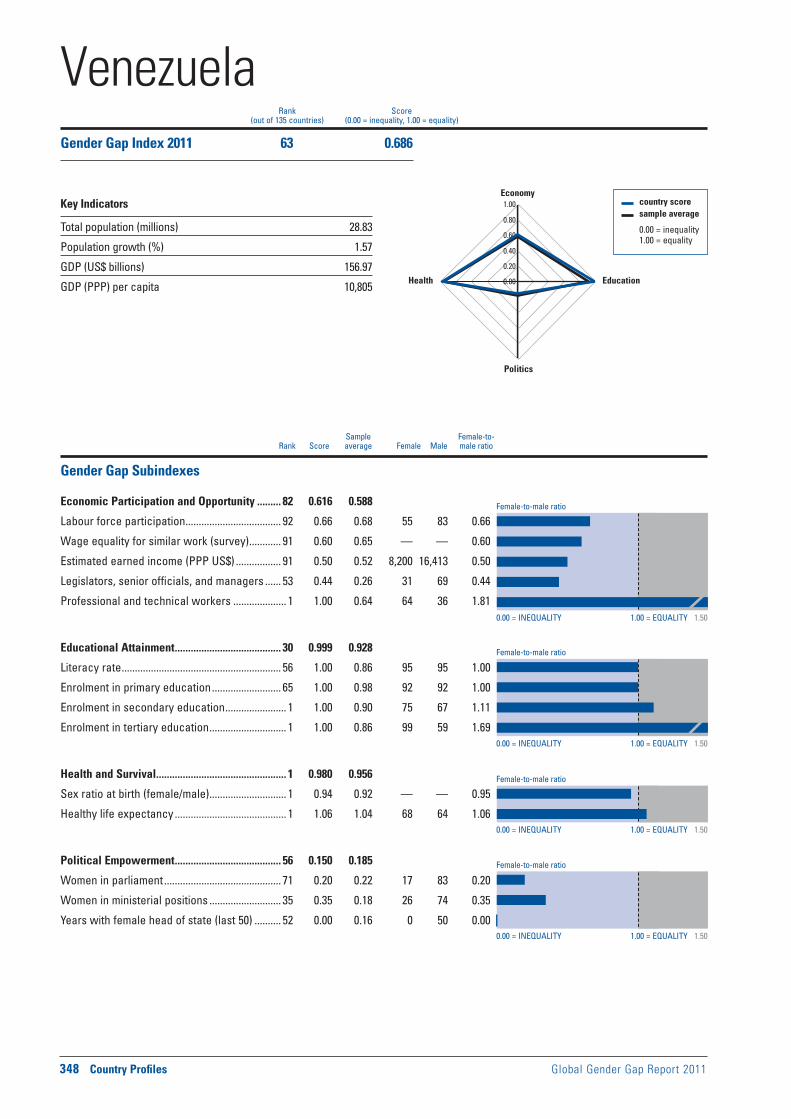
Female-to-male ratio
0.00 = INEQUALITY 1.00 = EQUALITY 1.50
0.00 = INEQUALITY 1.00 = EQUALITY 1.50
0.00 = INEQUALITY 1.00 = EQUALITY 1.50
0.00 = INEQUALITY 1.00 = EQUALITY 1.50
Female-to-male ratio
Female-to-male ratio
Female-to-male ratio
348 Country Profiles Global Gender Gap Report 2011
Sample Female-to- Rank Score average Female Male male ratio
country score sample average
0.00 = inequality 1.00 = equality
0.00
0.20
0.40
0.60
0.80
1.00Economy
Education
Politics
Health
Rank Score(out of 135 countries) (0.00 = inequality, 1.00 = equality)
Gender Gap Subindexes
Economic Participation and Opportunity ......... 82 0.616 0.588
Labour force participation .................................... 92 0.66 0.68 55 83 0.66
Wage equality for similar work (survey) ............ 91 0.60 0.65 — — 0.60
Estimated earned income (PPP US$) ................. 91 0.50 0.52 8,200 16,413 0.50
Legislators, senior officials, and managers ...... 53 0.44 0.26 31 69 0.44
Professional and technical workers .................... 1 1.00 0.64 64 36 1.81
Educational Attainment ........................................ 30 0.999 0.928
Literacy rate ............................................................ 56 1.00 0.86 95 95 1.00
Enrolment in primary education .......................... 65 1.00 0.98 92 92 1.00
Enrolment in secondary education ....................... 1 1.00 0.90 75 67 1.11
Enrolment in tertiary education ............................. 1 1.00 0.86 99 59 1.69
Health and Survival ................................................. 1 0.980 0.956
Sex ratio at birth (female/male) ............................. 1 0.94 0.92 — — 0.95
Healthy life expectancy .......................................... 1 1.06 1.04 68 64 1.06
Political Empowerment ........................................ 56 0.150 0.185
Women in parliament ............................................ 71 0.20 0.22 17 83 0.20
Women in ministerial positions ........................... 35 0.35 0.18 26 74 0.35
Years with female head of state (last 50) .......... 52 0.00 0.16 0 50 0.00
VenezuelaGender Gap Index 2011 63 0.686
Key Indicators
Total population (millions) 28.83
Population growth (%) 1.57
GDP (US$ billions) 156.97
GDP (PPP) per capita 10,805

Global Gender Gap Report 2011 Country Profiles 349
Economic Participation and Opportunity Educational Attainment Health and Survival Political Empowerment
Evolution 2006–2011
1 Survey data, responses on a 1-to-7 scale (1 = worst score, 7 = best score)2 Data on a 0-to-1 scale (1 = worst score, 0 = best score)3 Data on a 1-to-5 scale (1 = worst score, 5 = best score)4 Bracketed numbers show the range between the uncertainties, estimated
to contain the true maternal mortality ratio with a 95% probability
ECONOMIC EDUCATIONAL HEALTH AND POLITICAL OVERALL PARTICIPATION ATTAINMENT SURVIVAL EMPOWERMENT
Rank Score Rank Score Rank Score Rank Score Rank Score
0.0
0.2
0.4
0.6
0.8
1.0
2006 2007 2008 2009 2010 2011
Additional Data
Economic EmpowermentFemale adult unemployment rate (% of female labour force) .........8Male adult unemployment rate (% of male labour force) ................7Women in non-agricultural paid labour
(% of total labour force) ....................................................................42Inheritance practices in favour of male heirs2 ..............................0.00Firms with female participation in ownership (% of firms) ............24Women’s access to land ownership2 .............................................0.00Women’s access to bank loans2 ......................................................0.00Women’s access to property other than land2 .............................0.00Women’s access to finance programmes3 .........................................1Ability of women to rise to positions of
enterprise leadership1 ....................................................................4.39
EducationFemale teachers, primary education (%) ..........................................81Female teachers, secondary education (%) .....................................65Female teachers, tertiary education (%) ...........................................34Female school life expectancy, primary to secondary (years)......10Male school life expectancy, primary to secondary (years) .........10
Marriage and ChildbearingMean age of marriage for women (years) ........................................23Early marriage (% women, aged 15–19) ............................................18Fertility rate (births per woman) .......................................................2.50Adolescent fertility rate (births per 1,000 women, aged 15–19) ..101Antenatal care coverage, at least one visit (%) ...............................94Births attended by skilled health staff (%) ........................................95Maternal mortality ratio (per 100,000 live births)4 ...............68 [59-75]Contraceptive prevalence, married women (%) ..............................70Female HIV prevalence, aged 15–49 (%) .......................................... —Male HIV prevalence, aged 15–49 (%) .............................................. —Infant mortality rate (per 1,000 live births) ........................................15Overall population sex ratio (male/female) ....................................1.01
Social Institutions and Political RightsPaternal versus maternal authority2................................................0.00Female genital mutilation2 .................................................................0.00Acceptance or legality of polygamy2 ..............................................0.00Existence of legislation punishing acts
of violence against women2 ..........................................................0.42Year women received right to vote ................................................1946Quota type .............................................................................................. —Existence of legislation prohibiting
gender-based discrimination .......................................................... —
Childcare EcosystemLength of maternity leave ........................................................18 weeksMaternity leave benefits (% of wages paid) .....................................67Provider of maternity coverage ............................... Social insuranceLength of paternity leave ..................................................................... —Paternity leave benefits (% of wages paid) ..................................... —Daycare options .................................................................................... —
VenezuelaGender Gap Index 2011 (out of 135 countries) 63 0.686 82 0.616 30 0.999 1 0.980 56 0.150
Gender Gap Index 2010 (out of 134 countries) 64 0.686 83 0.615 31 0.999 1 0.980 55 0.152
Gender Gap Index 2009 (out of 134 countries) 69 0.684 80 0.619 34 0.999 1 0.980 63 0.138
Gender Gap Index 2008 (out of 130 countries) 59 0.688 71 0.634 31 0.999 1 0.980 57 0.138
Gender Gap Index 2007 (out of 128 countries) 55 0.680 68 0.631 25 0.999 1 0.980 62 0.110
Gender Gap Index 2006 (out of 115 countries) 57 0.666 66 0.600 62 0.986 71 0.973 57 0.107

Female-to-male ratio
0.00 = INEQUALITY 1.00 = EQUALITY 1.50
0.00 = INEQUALITY 1.00 = EQUALITY 1.50
0.00 = INEQUALITY 1.00 = EQUALITY 1.50
0.00 = INEQUALITY 1.00 = EQUALITY 1.50
Female-to-male ratio
Female-to-male ratio
Female-to-male ratio
350 Country Profiles Global Gender Gap Report 2011
Sample Female-to- Rank Score average Female Male male ratio
country score sample average
0.00 = inequality 1.00 = equality
0.00
0.20
0.40
0.60
0.80
1.00Economy
Education
Politics
Health
Rank Score(out of 135 countries) (0.00 = inequality, 1.00 = equality)
Gender Gap Subindexes
Economic Participation and Opportunity ......... 40 0.711 0.588
Labour force participation .................................... 13 0.92 0.68 74 81 0.92
Wage equality for similar work (survey) ............ 53 0.69 0.65 — — 0.69
Estimated earned income (PPP US$) ................. 29 0.69 0.52 2,409 3,511 0.69
Legislators, senior officials, and managers ...... 83 0.28 0.26 22 78 0.28
Professional and technical workers .................... 1 1.00 0.64 51 49 1.05
Educational Attainment ...................................... 104 0.926 0.928
Literacy rate ............................................................ 86 0.95 0.86 91 95 0.95
Enrolment in primary education ........................ 120 0.95 0.98 91 96 0.95
Enrolment in secondary education ..................... 98 0.96 0.90 68 71 0.96
Enrolment in tertiary education ......................... 106 0.73 0.86 8 11 0.73
Health and Survival ............................................. 130 0.946 0.956
Sex ratio at birth (female/male) ......................... 131 0.90 0.92 — — 0.90
Healthy life expectancy .......................................... 1 1.06 1.04 66 62 1.06
Political Empowerment ........................................ 76 0.111 0.185
Women in parliament ............................................ 34 0.32 0.22 24 76 0.32
Women in ministerial positions ......................... 124 0.04 0.18 4 96 0.04
Years with female head of state (last 50) .......... 52 0.00 0.16 0 50 0.00
VietnamGender Gap Index 2011 79 0.673
Key Indicators
Total population (millions) 88.36
Population growth (%) 1.23
GDP (US$ billions) 62.83
GDP (PPP) per capita 2,828
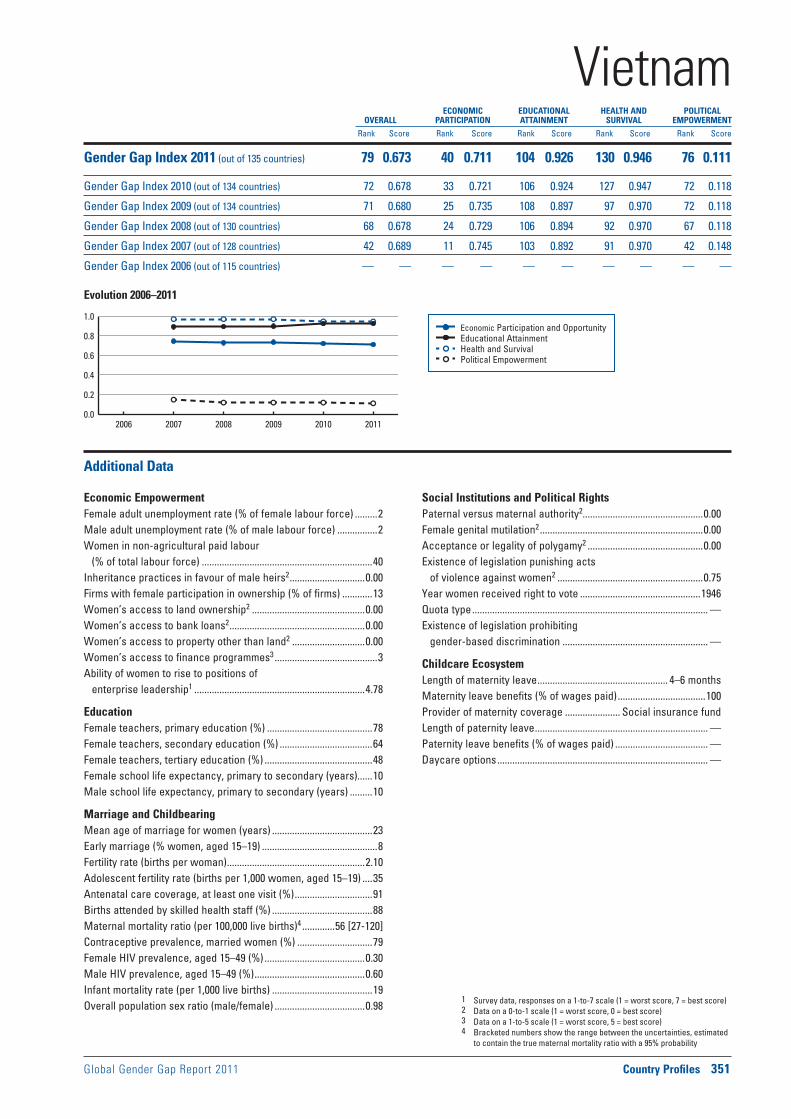
Global Gender Gap Report 2011 Country Profiles 351
Economic Participation and Opportunity Educational Attainment Health and Survival Political Empowerment
Evolution 2006–2011
1 Survey data, responses on a 1-to-7 scale (1 = worst score, 7 = best score)2 Data on a 0-to-1 scale (1 = worst score, 0 = best score)3 Data on a 1-to-5 scale (1 = worst score, 5 = best score)4 Bracketed numbers show the range between the uncertainties, estimated
to contain the true maternal mortality ratio with a 95% probability
ECONOMIC EDUCATIONAL HEALTH AND POLITICAL OVERALL PARTICIPATION ATTAINMENT SURVIVAL EMPOWERMENT
Rank Score Rank Score Rank Score Rank Score Rank Score
0.0
0.2
0.4
0.6
0.8
1.0
2006 2007 2008 2009 2010 2011
Additional Data
Economic EmpowermentFemale adult unemployment rate (% of female labour force) .........2Male adult unemployment rate (% of male labour force) ................2Women in non-agricultural paid labour
(% of total labour force) ....................................................................40Inheritance practices in favour of male heirs2 ..............................0.00Firms with female participation in ownership (% of firms) ............13Women’s access to land ownership2 .............................................0.00Women’s access to bank loans2 ......................................................0.00Women’s access to property other than land2 .............................0.00Women’s access to finance programmes3 .........................................3Ability of women to rise to positions of
enterprise leadership1 ....................................................................4.78
EducationFemale teachers, primary education (%) ..........................................78Female teachers, secondary education (%) .....................................64Female teachers, tertiary education (%) ...........................................48Female school life expectancy, primary to secondary (years)......10Male school life expectancy, primary to secondary (years) .........10
Marriage and ChildbearingMean age of marriage for women (years) ........................................23Early marriage (% women, aged 15–19) ..............................................8Fertility rate (births per woman) .......................................................2.10Adolescent fertility rate (births per 1,000 women, aged 15–19) ....35Antenatal care coverage, at least one visit (%) ...............................91Births attended by skilled health staff (%) ........................................88Maternal mortality ratio (per 100,000 live births)4 .............56 [27-120]Contraceptive prevalence, married women (%) ..............................79Female HIV prevalence, aged 15–49 (%) ........................................0.30Male HIV prevalence, aged 15–49 (%) ............................................0.60Infant mortality rate (per 1,000 live births) ........................................19Overall population sex ratio (male/female) ....................................0.98
Social Institutions and Political RightsPaternal versus maternal authority2................................................0.00Female genital mutilation2 .................................................................0.00Acceptance or legality of polygamy2 ..............................................0.00Existence of legislation punishing acts
of violence against women2 ..........................................................0.75Year women received right to vote ................................................1946Quota type .............................................................................................. —Existence of legislation prohibiting
gender-based discrimination .......................................................... —
Childcare EcosystemLength of maternity leave .................................................... 4–6 monthsMaternity leave benefits (% of wages paid) ...................................100Provider of maternity coverage ...................... Social insurance fundLength of paternity leave ..................................................................... —Paternity leave benefits (% of wages paid) ..................................... —Daycare options .................................................................................... —
VietnamGender Gap Index 2011 (out of 135 countries) 79 0.673 40 0.711 104 0.926 130 0.946 76 0.111
Gender Gap Index 2010 (out of 134 countries) 72 0.678 33 0.721 106 0.924 127 0.947 72 0.118
Gender Gap Index 2009 (out of 134 countries) 71 0.680 25 0.735 108 0.897 97 0.970 72 0.118
Gender Gap Index 2008 (out of 130 countries) 68 0.678 24 0.729 106 0.894 92 0.970 67 0.118
Gender Gap Index 2007 (out of 128 countries) 42 0.689 11 0.745 103 0.892 91 0.970 42 0.148
Gender Gap Index 2006 (out of 115 countries) — — — — — — — — — —

Female-to-male ratio
0.00 = INEQUALITY 1.00 = EQUALITY 1.50
0.00 = INEQUALITY 1.00 = EQUALITY 1.50
0.00 = INEQUALITY 1.00 = EQUALITY 1.50
0.00 = INEQUALITY 1.00 = EQUALITY 1.50
Female-to-male ratio
Female-to-male ratio
Female-to-male ratio
352 Country Profiles Global Gender Gap Report 2011
Sample Female-to- Rank Score average Female Male male ratio
country score sample average
0.00 = inequality 1.00 = equality
0.00
0.20
0.40
0.60
0.80
1.00Economy
Education
Politics
Health
Rank Score(out of 135 countries) (0.00 = inequality, 1.00 = equality)
Gender Gap Subindexes
Economic Participation and Opportunity ....... 135 0.318 0.588
Labour force participation .................................. 132 0.28 0.68 21 74 0.28
Wage equality for similar work (survey) ............ 88 0.62 0.65 — — 0.62
Estimated earned income (PPP US$) ............... 130 0.21 0.52 857 4,046 0.21
Legislators, senior officials, and managers .... 125 0.02 0.26 2 98 0.02
Professional and technical workers ................ 115 0.18 0.64 15 85 0.18
Educational Attainment ...................................... 134 0.642 0.928
Literacy rate .......................................................... 131 0.56 0.86 45 80 0.56
Enrolment in primary education ........................ 133 0.83 0.98 66 79 0.83
Enrolment in secondary education ................... 131 0.46 0.90 21 46 0.46
Enrolment in tertiary education ......................... 126 0.42 0.86 6 14 0.42
Health and Survival ............................................... 83 0.973 0.956
Sex ratio at birth (female/male) ............................. 1 0.94 0.92 — — 0.95
Healthy life expectancy ........................................ 89 1.04 1.04 55 53 1.04
Political Empowerment ...................................... 131 0.016 0.185
Women in parliament .......................................... 129 0.00 0.22 0 100 0.00
Women in ministerial positions ......................... 115 0.06 0.18 6 94 0.06
Years with female head of state (last 50) .......... 52 0.00 0.16 0 50 0.00
YemenGender Gap Index 2011 135 0.487
Key Indicators
Total population (millions) 24.26
Population growth (%) 2.83
GDP (US$ billions) 13.32
GDP (PPP) per capita 2,243

Global Gender Gap Report 2011 Country Profiles 353
Economic Participation and Opportunity Educational Attainment Health and Survival Political Empowerment
Evolution 2006–2011
1 Survey data, responses on a 1-to-7 scale (1 = worst score, 7 = best score)2 Data on a 0-to-1 scale (1 = worst score, 0 = best score)3 Data on a 1-to-5 scale (1 = worst score, 5 = best score)4 Bracketed numbers show the range between the uncertainties, estimated
to contain the true maternal mortality ratio with a 95% probability
ECONOMIC EDUCATIONAL HEALTH AND POLITICAL OVERALL PARTICIPATION ATTAINMENT SURVIVAL EMPOWERMENT
Rank Score Rank Score Rank Score Rank Score Rank Score
0.0
0.2
0.4
0.6
0.8
1.0
2006 2007 2008 2009 2010 2011
Additional Data
Economic EmpowermentFemale adult unemployment rate (% of female labour force) .......41Male adult unemployment rate (% of male labour force) ..............12Women in non-agricultural paid labour
(% of total labour force) ......................................................................6Inheritance practices in favour of male heirs2 ..............................0.50Firms with female participation in ownership (% of firms) ........... —Women’s access to land ownership2 .............................................0.50Women’s access to bank loans2 ......................................................0.50Women’s access to property other than land2 .............................0.50Women’s access to finance programmes3 .........................................1Ability of women to rise to positions of
enterprise leadership1 ....................................................................3.29
EducationFemale teachers, primary education (%) ..........................................20Female teachers, secondary education (%) .....................................21Female teachers, tertiary education (%) ...........................................17Female school life expectancy, primary to secondary (years)........6Male school life expectancy, primary to secondary (years) .........10
Marriage and ChildbearingMean age of marriage for women (years) ........................................22Early marriage (% women, aged 15–19) ............................................27Fertility rate (births per woman) .......................................................5.20Adolescent fertility rate (births per 1,000 women, aged 15–19) ....80Antenatal care coverage, at least one visit (%) ...............................47Births attended by skilled health staff (%) ........................................36Maternal mortality ratio (per 100,000 live births)4 .........210 [110-400]Contraceptive prevalence, married women (%) ..............................28Female HIV prevalence, aged 15–49 (%) .......................................... —Male HIV prevalence, aged 15–49 (%) .............................................. —Infant mortality rate (per 1,000 live births) ........................................51Overall population sex ratio (male/female) ....................................1.02
Social Institutions and Political RightsPaternal versus maternal authority2................................................1.00Female genital mutilation2 .................................................................0.00Acceptance or legality of polygamy2 ..............................................1.00Existence of legislation punishing acts
of violence against women2 ..........................................................0.75Year women received right to vote ......................................1967, 1970Quota type .............................................................................................. —Existence of legislation prohibiting
gender-based discrimination .......................................................... —
Childcare EcosystemLength of maternity leave ........................................................... 60 daysMaternity leave benefits (% of wages paid) ...................................100Provider of maternity coverage .............................................EmployerLength of paternity leave ..................................................................... —Paternity leave benefits (% of wages paid) ..................................... —Daycare options .................................................................................... —
YemenGender Gap Index 2011 (out of 135 countries) 135 0.487 135 0.318 134 0.642 83 0.973 131 0.016
Gender Gap Index 2010 (out of 134 countries) 134 0.460 134 0.195 132 0.657 81 0.973 130 0.016
Gender Gap Index 2009 (out of 134 countries) 134 0.461 134 0.233 133 0.615 1 0.980 133 0.016
Gender Gap Index 2008 (out of 130 countries) 130 0.466 130 0.252 129 0.618 1 0.980 129 0.016
Gender Gap Index 2007 (out of 128 countries) 128 0.451 128 0.251 127 0.565 1 0.980 127 0.008
Gender Gap Index 2006 (out of 115 countries) 115 0.459 114 0.253 114 0.598 48 0.979 113 0.008
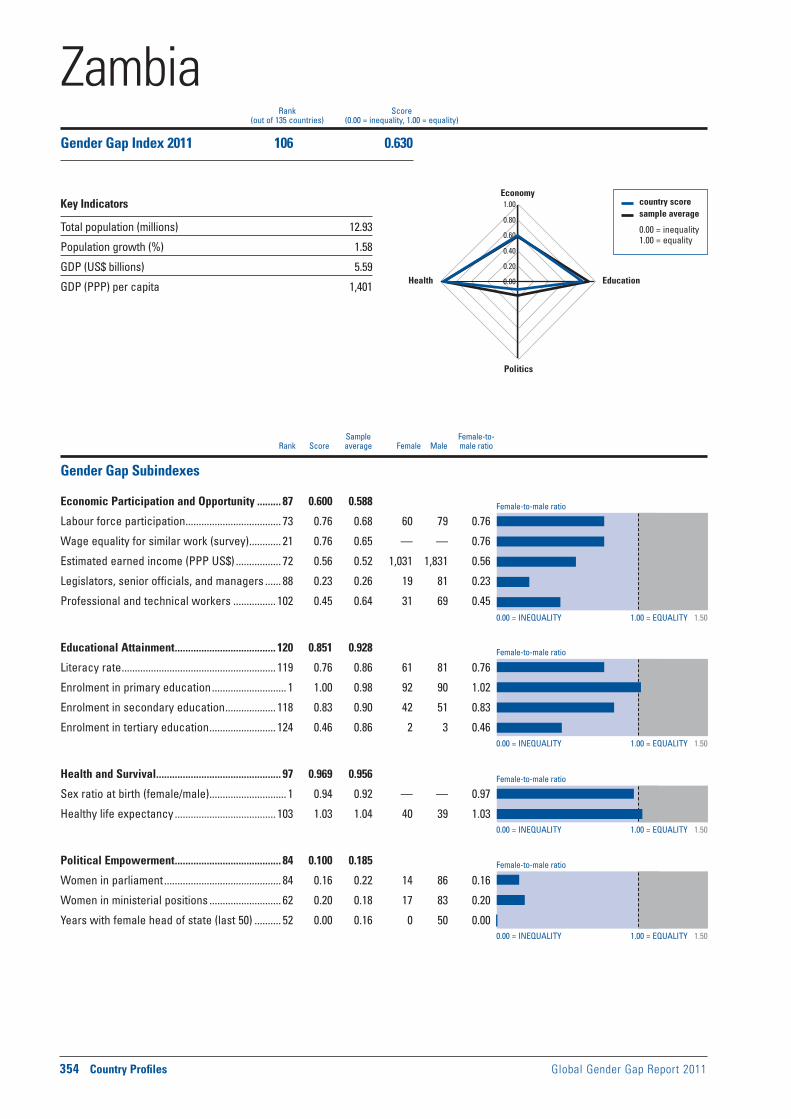
Female-to-male ratio
0.00 = INEQUALITY 1.00 = EQUALITY 1.50
0.00 = INEQUALITY 1.00 = EQUALITY 1.50
0.00 = INEQUALITY 1.00 = EQUALITY 1.50
0.00 = INEQUALITY 1.00 = EQUALITY 1.50
Female-to-male ratio
Female-to-male ratio
Female-to-male ratio
354 Country Profiles Global Gender Gap Report 2011
Sample Female-to- Rank Score average Female Male male ratio
country score sample average
0.00 = inequality 1.00 = equality
0.00
0.20
0.40
0.60
0.80
1.00Economy
Education
Politics
Health
Rank Score(out of 135 countries) (0.00 = inequality, 1.00 = equality)
Gender Gap Subindexes
Economic Participation and Opportunity ......... 87 0.600 0.588
Labour force participation .................................... 73 0.76 0.68 60 79 0.76
Wage equality for similar work (survey) ............ 21 0.76 0.65 — — 0.76
Estimated earned income (PPP US$) ................. 72 0.56 0.52 1,031 1,831 0.56
Legislators, senior officials, and managers ...... 88 0.23 0.26 19 81 0.23
Professional and technical workers ................ 102 0.45 0.64 31 69 0.45
Educational Attainment ...................................... 120 0.851 0.928
Literacy rate .......................................................... 119 0.76 0.86 61 81 0.76
Enrolment in primary education ............................ 1 1.00 0.98 92 90 1.02
Enrolment in secondary education ................... 118 0.83 0.90 42 51 0.83
Enrolment in tertiary education ......................... 124 0.46 0.86 2 3 0.46
Health and Survival ............................................... 97 0.969 0.956
Sex ratio at birth (female/male) ............................. 1 0.94 0.92 — — 0.97
Healthy life expectancy ...................................... 103 1.03 1.04 40 39 1.03
Political Empowerment ........................................ 84 0.100 0.185
Women in parliament ............................................ 84 0.16 0.22 14 86 0.16
Women in ministerial positions ........................... 62 0.20 0.18 17 83 0.20
Years with female head of state (last 50) .......... 52 0.00 0.16 0 50 0.00
ZambiaGender Gap Index 2011 106 0.630
Key Indicators
Total population (millions) 12.93
Population growth (%) 1.58
GDP (US$ billions) 5.59
GDP (PPP) per capita 1,401

Global Gender Gap Report 2011 Country Profiles 355
Economic Participation and Opportunity Educational Attainment Health and Survival Political Empowerment
Evolution 2006–2011
1 Survey data, responses on a 1-to-7 scale (1 = worst score, 7 = best score)2 Data on a 0-to-1 scale (1 = worst score, 0 = best score)3 Data on a 1-to-5 scale (1 = worst score, 5 = best score)4 Bracketed numbers show the range between the uncertainties, estimated
to contain the true maternal mortality ratio with a 95% probability
ECONOMIC EDUCATIONAL HEALTH AND POLITICAL OVERALL PARTICIPATION ATTAINMENT SURVIVAL EMPOWERMENT
Rank Score Rank Score Rank Score Rank Score Rank Score
0.0
0.2
0.4
0.6
0.8
1.0
2006 2007 2008 2009 2010 2011
Additional Data
Economic EmpowermentFemale adult unemployment rate (% of female labour force) .......11Male adult unemployment rate (% of male labour force) ..............14Women in non-agricultural paid labour
(% of total labour force) ....................................................................22Inheritance practices in favour of male heirs2 ..............................1.00Firms with female participation in ownership (% of firms) ............18Women’s access to land ownership2 .............................................1.00Women’s access to bank loans2 ......................................................0.50Women’s access to property other than land2 .............................0.50Women’s access to finance programmes3 .........................................2Ability of women to rise to positions of
enterprise leadership1 ....................................................................5.03
EducationFemale teachers, primary education (%) ..........................................50Female teachers, secondary education (%) .................................... —Female teachers, tertiary education (%) .......................................... —Female school life expectancy, primary to secondary (years)........8Male school life expectancy, primary to secondary (years) ...........9
Marriage and ChildbearingMean age of marriage for women (years) ........................................21Early marriage (% women, aged 15–19) ............................................24Fertility rate (births per woman) .......................................................5.80Adolescent fertility rate (births per 1,000 women, aged 15–19) ..151Antenatal care coverage, at least one visit (%) ...............................94Births attended by skilled health staff (%) ........................................46Maternal mortality ratio (per 100,000 live births)4 .........470 [250-680]Contraceptive prevalence, married women (%) ..............................41Female HIV prevalence, aged 15–49 (%) ......................................16.00Male HIV prevalence, aged 15–49 (%) ..........................................11.10Infant mortality rate (per 1,000 live births) ........................................86Overall population sex ratio (male/female) ....................................1.00
Social Institutions and Political RightsPaternal versus maternal authority2................................................1.00Female genital mutilation2 .................................................................0.00Acceptance or legality of polygamy2 ..............................................1.00Existence of legislation punishing acts
of violence against women2 ..........................................................0.75Year women received right to vote ................................................1962Quota type .............................................................................................. —Existence of legislation prohibiting
gender-based discrimination .......................................................... —
Childcare EcosystemLength of maternity leave ........................................................12 weeksMaternity leave benefits (% of wages paid) ...................................100Provider of maternity coverage .............................................EmployerLength of paternity leave ..................................................................... —Paternity leave benefits (% of wages paid) ..................................... —Daycare options .................................................................................... —
ZambiaGender Gap Index 2011 (out of 135 countries) 106 0.630 87 0.600 120 0.851 97 0.969 84 0.100
Gender Gap Index 2010 (out of 134 countries) 106 0.629 88 0.601 119 0.847 97 0.969 84 0.100
Gender Gap Index 2009 (out of 134 countries) 107 0.631 93 0.593 116 0.865 116 0.961 82 0.105
Gender Gap Index 2008 (out of 130 countries) 106 0.620 94 0.568 115 0.848 112 0.961 78 0.105
Gender Gap Index 2007 (out of 128 countries) 101 0.629 92 0.571 111 0.848 110 0.961 49 0.135
Gender Gap Index 2006 (out of 115 countries) 85 0.636 64 0.602 100 0.843 102 0.963 43 0.135
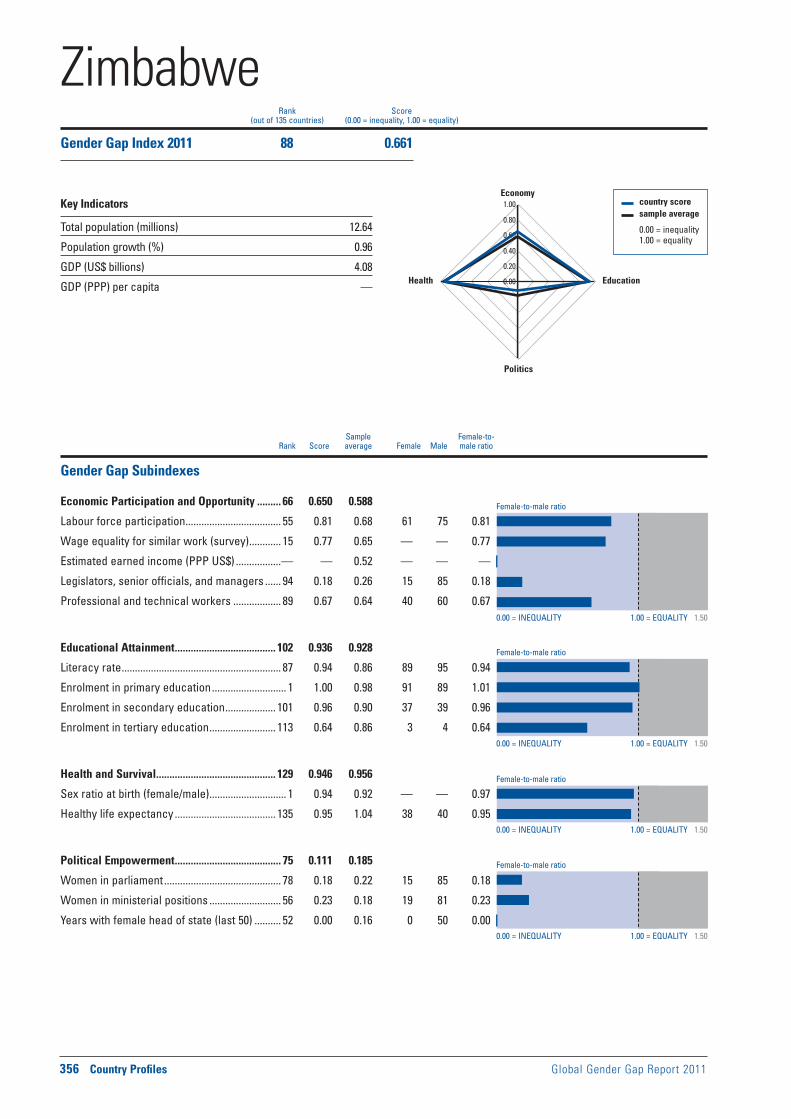
Female-to-male ratio
0.00 = INEQUALITY 1.00 = EQUALITY 1.50
0.00 = INEQUALITY 1.00 = EQUALITY 1.50
0.00 = INEQUALITY 1.00 = EQUALITY 1.50
0.00 = INEQUALITY 1.00 = EQUALITY 1.50
Female-to-male ratio
Female-to-male ratio
Female-to-male ratio
356 Country Profiles Global Gender Gap Report 2011
Sample Female-to- Rank Score average Female Male male ratio
country score sample average
0.00 = inequality 1.00 = equality
0.00
0.20
0.40
0.60
0.80
1.00Economy
Education
Politics
Health
Rank Score(out of 135 countries) (0.00 = inequality, 1.00 = equality)
Gender Gap Subindexes
Economic Participation and Opportunity ......... 66 0.650 0.588
Labour force participation .................................... 55 0.81 0.68 61 75 0.81
Wage equality for similar work (survey) ............ 15 0.77 0.65 — — 0.77
Estimated earned income (PPP US$) .................— — 0.52 — — —
Legislators, senior officials, and managers ...... 94 0.18 0.26 15 85 0.18
Professional and technical workers .................. 89 0.67 0.64 40 60 0.67
Educational Attainment ...................................... 102 0.936 0.928
Literacy rate ............................................................ 87 0.94 0.86 89 95 0.94
Enrolment in primary education ............................ 1 1.00 0.98 91 89 1.01
Enrolment in secondary education ................... 101 0.96 0.90 37 39 0.96
Enrolment in tertiary education ......................... 113 0.64 0.86 3 4 0.64
Health and Survival ............................................. 129 0.946 0.956
Sex ratio at birth (female/male) ............................. 1 0.94 0.92 — — 0.97
Healthy life expectancy ...................................... 135 0.95 1.04 38 40 0.95
Political Empowerment ........................................ 75 0.111 0.185
Women in parliament ............................................ 78 0.18 0.22 15 85 0.18
Women in ministerial positions ........................... 56 0.23 0.18 19 81 0.23
Years with female head of state (last 50) .......... 52 0.00 0.16 0 50 0.00
ZimbabweGender Gap Index 2011 88 0.661
Key Indicators
Total population (millions) 12.64
Population growth (%) 0.96
GDP (US$ billions) 4.08
GDP (PPP) per capita —

Global Gender Gap Report 2011 Country Profiles 357
Economic Participation and Opportunity Educational Attainment Health and Survival Political Empowerment
Evolution 2006–2011
1 Survey data, responses on a 1-to-7 scale (1 = worst score, 7 = best score)2 Data on a 0-to-1 scale (1 = worst score, 0 = best score)3 Data on a 1-to-5 scale (1 = worst score, 5 = best score)4 Bracketed numbers show the range between the uncertainties, estimated
to contain the true maternal mortality ratio with a 95% probability
ECONOMIC EDUCATIONAL HEALTH AND POLITICAL OVERALL PARTICIPATION ATTAINMENT SURVIVAL EMPOWERMENT
Rank Score Rank Score Rank Score Rank Score Rank Score
0.0
0.2
0.4
0.6
0.8
1.0
2006 2007 2008 2009 2010 2011
Additional Data
Economic EmpowermentFemale adult unemployment rate (% of female labour force) .........4Male adult unemployment rate (% of male labour force) ................4Women in non-agricultural paid labour
(% of total labour force) ....................................................................22Inheritance practices in favour of male heirs2 ..............................0.50Firms with female participation in ownership (% of firms) ........... —Women’s access to land ownership2 .............................................1.00Women’s access to bank loans2 ......................................................0.50Women’s access to property other than land2 .............................0.50Women’s access to finance programmes3 ...................................... —Ability of women to rise to positions of
enterprise leadership1 ....................................................................4.98
EducationFemale teachers, primary education (%) ......................................... —Female teachers, secondary education (%) .................................... —Female teachers, tertiary education (%) .......................................... —Female school life expectancy, primary to secondary (years)........9Male school life expectancy, primary to secondary (years) .........10
Marriage and ChildbearingMean age of marriage for women (years) ........................................21Early marriage (% women, aged 15–19) ............................................23Fertility rate (births per woman) .......................................................3.40Adolescent fertility rate (births per 1,000 women, aged 15–19) ..101Antenatal care coverage, at least one visit (%) ...............................93Births attended by skilled health staff (%) ........................................60Maternal mortality ratio (per 100,000 live births)4 ......790 [410-1,200]Contraceptive prevalence, married women (%) ..............................60Female HIV prevalence, aged 15–49 (%) ......................................17.30Male HIV prevalence, aged 15–49 (%) ..........................................11.20Infant mortality rate (per 1,000 live births) ........................................56Overall population sex ratio (male/female) ....................................0.94
Social Institutions and Political RightsPaternal versus maternal authority2................................................0.50Female genital mutilation2 .................................................................0.05Acceptance or legality of polygamy2 ..............................................1.00Existence of legislation punishing acts
of violence against women2 ..........................................................0.67Year women received right to vote ......................................1919, 1957Quota type ..........................................................................No legislated;
voluntary political party quotasExistence of legislation prohibiting
gender-based discrimination .......................................................... —
Childcare EcosystemLength of maternity leave ........................................................... 98 daysMaternity leave benefits (% of wages paid) ...................................100Provider of maternity coverage .............................................EmployerLength of paternity leave ..................................................................... —Paternity leave benefits (% of wages paid) ..................................... —Daycare options .................................................................................... —
ZimbabweGender Gap Index 2011 (out of 135 countries) 88 0.661 66 0.650 102 0.936 129 0.946 75 0.111
Gender Gap Index 2010 (out of 134 countries) 92 0.657 67 0.640 105 0.933 128 0.946 76 0.111
Gender Gap Index 2009 (out of 134 countries) 95 0.652 81 0.618 103 0.934 125 0.952 83 0.104
Gender Gap Index 2008 (out of 130 countries) 92 0.649 76 0.611 100 0.934 121 0.952 83 0.096
Gender Gap Index 2007 (out of 128 countries) 88 0.646 79 0.604 100 0.925 119 0.952 64 0.105
Gender Gap Index 2006 (out of 115 countries) 76 0.646 62 0.606 87 0.920 108 0.957 62 0.102


Global Gender Gap Report 2011 About the Authors 359
Ricardo Hausmann is Director of Harvard’s Center for International Development and Professor of the Practice of Economic Development at the Kennedy School of Government. Previously he served as the first Chief Economist of the Inter-American Development Bank (1994–2000), where he created the Research Department. He has served as Minister of Planning of Venezuela (1992–1993) and as a member of the Board of the Central Bank of Venezuela. He also served as Chair of the IMF World Bank Development Committee. He was Professor of Economics at the Instituto de Estudios Superiores de Administracion (IESA) (1985–1991) in Caracas, where he founded the Center for Public Policy. He holds a PhD in Economics from Cornell University. Professor Hausmann’s research interests include issues of growth, macroeconomic stability, interna-tional finance and the social dimensions of development. He did pioneering work on the causes of macroeconomic volatility in developing countries and studied its effects on growth, poverty and inequality. He also studied the role of budgetary and political institutions in achieving fiscal balance and the role of foreign currency debts in causing economic crises. Professor Hausmann has made important contribu-tions to the study of the “resource curse”. More recently, his growth diagnostics methodology, designed to identify the binding constraints to growth in countries, has been adopted widely by multilateral organizations, and his break-through research on the patterns of change in productive structures is informing countries’ industrial policies around the world. Professor Hausmann developed the methodology of the World Economic Forum Global Gender Gap Index, which looks into areas of health, education, economic par-ticipation and political power; he is also a co-author of the annual Global Gender Gap Report.
Laura D’Andrea Tyson is the S.K. and Angela Chan Professor of Global Management at the Haas School of Business, at the University of California Berkeley. She served as Dean of the London Business School from 2002 to 2006, and as Dean of the Berkeley Haas School of Business from 1998 to 2001. Tyson is a member of President Barack Obama’s Council of Jobs and Competitiveness. She was also a mem-ber of President Obama’s Economic Recovery Advisory Board (2009–2011). She served in the Clinton Administration and was the Chair of the Council of Economic Advisers (1993–1995) and the President’s National Economic Adviser (1995–1996). Tyson is a Senior Advisor at the McKinsey Global Institute, Credit Suisse Research Institute, and The Rock Creek Group. She is a Senior Fellow at the Center for American Progress and is on the Advisory Council of the Brookings Institution Hamilton Project. She serves on the Advisory Board of Newman’s Own, Generation Investment Management, and H&Q Asia Pacific. She is also a Special Advisor at Berkeley Research Group and a Commissioner at the Committee for Responsible Federal Budget. Tyson is a member of the World Economic Forum’s Global Agenda Council, MIT Corporation, Committee on Capital Markets Regulation, and Think Long Committee for California. She is a member of the National Academies’ Board on Science, Technology and Economic Policy and a member of the National Academies Committee on Research Universities. Tyson serves as a member of the Boards of Directors of Eastman Kodak Company, Morgan Stanley, AT&T, Silver Spring Networks, CB Richard Ellis, the Peter G. Peterson Institute of International Economics and the New America Foundation. Tyson has written books and articles on indus-trial competitiveness and trade. She has also written opinion columns for many publications including BusinessWeek, The New York Times and the Financial Times and has made numerous television appearances on economic issues. She is on the editorial board of the International Economy and contributes to the New York Times Economix blog and the Financial Times A-list.
About the Authors
360 About the Authors Global Gender Gap Report 2011
Saadia Zahidi is a Senior Director and Head of Constituents at the World Economic Forum. Under her leadership, the Women Leaders and Gender Parity Programme aims to benchmark global gender gaps, create awareness of the economic incentives for gender parity and promote col-laboration among leaders—women and men—to address gender gaps. Zahidi has been co-author and editor of the Global Gender Gap Report series since its inception in 2006; she is also co-author and editor of the Corporate Gender Gap Report and responsible for the Forum’s initial study in this field, Women’s Empowerment: Measuring the Global Gender Gap, in 2005. Zahidi frequently serves as an expert and spokesperson in the media and at international confer-ences on issues of gender parity. She also serves as an expert and advisor on gender gap issues for several insti-tutions, including as a member of the Scientific Advisory Council of the Gender Equality Project, the Women in Public Service Initiative and The Wall Street Journal Women in the Economy Taskforce, among other initiatives. As Head of Constituents at the World Economic Forum, her responsibili-ties also include the engagement of labour leaders, religious leaders, international organizations, NGOs and other civil society actors. She was previously an Economist with the Forum’s Global Competitiveness Programme. Her research interests include issues of education, gender, skills, employ-ment and human capital. Zahidi holds a cum laude BA degree in Economics from Smith College, Massachusetts, United States and an MPhil degree in International Economics from the Graduate Institute of International Studies in Geneva, Switzerland.

Global Gender Gap Report 2011 Project Team 361
Project Team
Yasmina Bekhouche is Senior Project Associate for the Women Leaders and Gender Parity Programme at the World Economic Forum. Her responsibilities include the produc-tion of The Global Gender Gap Report, encompassing the production of the Index and co-authoring the main chapter. She is also responsible for the production of regional studies and organizing community activities at the World Economic Forum’s annual meetings and regional summits. She previ-ously worked at the Foreign Affairs Division of the Swiss Federal Administration. Bekhouche holds a Master’s degree in International Relations from the Graduate Institute of International Studies in Geneva, Switzerland. Her interests include social issues, human capital management, diversity and geopolitics.
Marc Cuénod is the Team Coordinator and Research Associate for Constituents at the World Economic Forum. His respon-sibilities include coordination among the following communi-ties at the Forum: women leaders, gender parity groups, religious leaders, NGOs and labour leaders. Cuénod has previously contributed to the Corporate Gender Gap Report 2010, The Global Gender Gap Reports 2009 and 2010 and The India Gender Gap Review 2009. He formerly worked in the Hotel Management Industry in Madagascar and as an assistant consultant in a hospitality consulting com-pany. Cuénod holds a Bachelor of Science in International Hospitality Management from the Ecole Hôtelière de Lausanne, Switzerland. His interests include global competi-tiveness, demography, population dynamics and economic growth.
Silvia Magnoni is Community Manager for the Women Leaders and Gender Parity programme at the World Economic Forum, where she coordinates a community of leaders committed to gender equality. Prior to join-ing the Forum, Magnoni worked for Green Center tin Denmark, the European Central Bank and the Food and Agriculture Organization of the United Nations. Her exper-tise encompasses public policy, sustainability and gender mainstreaming. Magnoni holds an Honors Degree in Business Economics from LIUC University, Italy and an Advanced Postgraduate Degree in European Studies and Global Affairs from the Postgraduate School of Economics and International Relations in Milan and Pázmány Péter University in Budapest. She is currently completing a Master Program in African Studies at the University of Copenhagen, with a focus on gender and environment.

Global Gender Gap Report 2011 Acknowledgments 363
Aetna is a leading diversified healthcare benefits company and serves more than 35 million people around the world with information and resources to help them make better informed healthcare decisions. With a workforce of approximately 34,000, Aetna promotes the use of information technology to improve healthcare delivery and build more effective healthcare systems. An innovative leader in the US healthcare services industry, Aetna applies its expertise globally to collaborate with healthcare systems, government entities and plan sponsors to design locally appropriate solutions to measure and manage wellness, as well as improve health, quality and cost outcomes in Asia, Europe, the Middle East and North America. Aetna’s expatriate business is one of the industry’s largest international health benefits providers, supporting more than 400,000 members worldwide.
www.aetna.com
Booz & Company is a leading global management consulting firm, helping the world’s top businesses, governments and organizations. Its founder, Edwin Booz, defined the profession when he established the first management consulting firm in 1914. Today, with more than 3,300 people in 60 offices around the world, Booz & Company brings foresight and knowledge, deep functional expertise and a practical approach to building capabilities and delivering real impact. Booz & Company works closely with its clients to create and deliver essential advantage through strategic insight and operational fitness.
www.booz.com
Burda Media is a media company with 100 years of family tradition that publishes over 260 magazines in Germany and in international markets such as Russia, Eastern Europe, Turkey and South Korea. Burda Media has been a pioneer in taking its strong brands and content to the digital world and transforming them into a convergent offering. The company has a consolidated turnover of 1.587 billion euros (2009) and has invested in more than 40 growth companies in the Internet sector, among them the leading European online business network XING. It holds a strong domestic radio portfolio, operates acclaimed TV productions and runs a media sales network and a cross-media dialogue marketing group.
www.hubert-burda-media.com
An ambition to be the world’s premier law firm underpins Clifford Chance’s business strategy. The firm aims to achieve this goal through sustained investment in managing knowledge and information and by creating a working culture in all its offices that enables its people to offer consistently high standards of client service.
Combining pragmatism and creativity, Clifford Chance offers practical solutions, a down-to-earth approach to complex cases, in-depth industry knowledge and market-leading expertise to address clients’ day-to-day business issues. Clifford Chance builds long-term relationships with clients and is proud of the trust they place in the firm, as it works to develop and implement strategies to take clients’ business further.
As one of the world’s largest law firms, Clifford Chance embraces responsibilities that extend beyond its clients’ work. Through an active programme of pro bono, arts and charitable initiatives, all its people are encouraged to develop strong links with the communities in which they work.
www.cliffordchance.com
The World Economic Forum would like to thank Aetna, Booz & Company, Burda Media, Clifford Chance, The Coca-Cola Company, Ernst & Young, HCL, Heidrick & Struggles, Kraft Foods, ManpowerGroup, McKinsey & Company, Mumtalakat, NYSE Euronext, the Olayan Group, Omnicom and the Renault-Nissan Alliance and for their invaluable support of the Women Leaders and Gender Parity Programme and this Report.
364 Acknowledgments Global Gender Gap Report 2011
The Coca-Cola Company (NYSE: KO) is the world’s largest beverage company, refreshing consumers with nearly 500 sparkling and still brands. Along with Coca-Cola, recognized as the world’s most valuable brand, the Company’s portfolio includes 12 other billion dollar brands, including Diet Coke, Fanta, Sprite, Coca-Cola Zero, vitaminwater, Powerade, Minute Maid, Simply and Georgia Coffee. Globally, the company is the number one provider of sparkling beverages, juices and juice drinks and ready-to-drink teas and coffees. Through the world’s largest beverage distribution system, consumers in more than 200 countries enjoy the company’s beverages at a rate of nearly 1.6 billion servings a day. With an enduring commitment to building sustainable communities, the company is focused on initiatives that protect the environment, conserve resources and enhance the economic development of the communities where it operates.
www.thecocacolacompany.com
Ernst & Young is a global leader in assurance, tax, transaction and advisory services. Its 141,000 people are united by shared values and a commitment to quality. The company’s staff work together to help each other develop and succeed personally and professionally, to help clients deliver on their promises to their markets and stakeholders and to make a difference in the communities in which they live and work.
www.ey.com
HCL is a US$ 5.9 billion leading global technology and IT enterprise that comprises two companies listed in India—HCL Technologies and HCL Infosystems. Founded in 1976, HCL is one of India’s original IT garage start-ups, a pioneer of modern computing and a global transformational enterprise today. Its range of offerings spans product engineering, custom and package applications, BPO, IT infrastructure services, IT hardware, systems integration and the distribution of ICT products across a wide range of focused industry verticals. The HCL team comprises over 80,000 professionals of diverse nationalities, who operate from 31 countries including over 500 points of presence in India. HCL has global partnerships with several leading Fortune 1000 firms, including leading IT and technology firms.
www.hcl.in
Heidrick & Struggles is the leadership advisory firm providing senior-level executive search and leadership consulting services, including succession planning, executive assessment, talent retention management, executive development, transition consulting for newly appointed executives, and M&A human capital integration consulting. For almost 60 years, they have focused on quality service, building strong leadership teams through relationships with clients and individuals worldwide. Today, Heidrick & Struggles’ leadership experts operate from principal business centres in North America, Latin America, Asia Pacific and Europe, Middle East & Africa.
www.heidrick.com
Kraft Foods is building a global snacks powerhouse and an unrivalled portfolio of brands people love. With annual revenues of approximately US$ 48 billion, the company is the world’s second largest food company, making delicious products for billions of consumers in approximately 170 countries. Kraft Foods’ portfolio includes 11 iconic brands with revenues exceeding US$ 1 billion—Oreo, Nabisco and LU biscuits; Milka and Cadbury chocolates; Trident gum; Jacobs and Maxwell House coffees; Philadelphia cream cheeses; Kraft cheeses, dinners and dressings; and Oscar Mayer meats. Approximately 70 brands generate annual revenues of more than US$ 100 million. Kraft Foods (NYSE: KFT) is a member of the Dow Jones Industrial Average, Standard & Poor’s 500, Dow Jones Sustainability Index and Ethibel Sustainability Index.
www.kraftfoodscompany.com
Global Gender Gap Report 2011 Acknowledgments 365
ManpowerGroup (NYSE: MAN), the world leader in innovative workforce solutions, creates and delivers high-impact solutions that enable its clients to achieve their business goals and enhance their competitiveness. With over 60 years of experience, its US$ 19 billion company creates unique time to value through a comprehensive suite of innovative solutions that help clients win in the Human Age. These solutions cover an entire range of talent-driven needs from recruitment and assessment, training and development, and career management, to outsourcing and workforce consulting. ManpowerGroup maintains the world’s largest and industry-leading network of nearly 3,900 offices in over 80 countries and territories, generating a dynamic mix of an unmatched global footprint with valuable insight and local expertise to meet the needs of its 400,000 clients per year, across all industry sectors, small and medium-sized enterprises, local, multinational and global companies. By connecting its deep understanding of human potential to the ambitions of clients, ManpowerGroup helps the organizations and individuals it serves achieve more than they imagined—because their success leads to ManpowerGroup’s success.
www.manpower.com
McKinsey & Company is a management consulting firm that helps leading corporations and organizations make distinctive, lasting and substantial improvements in their performance. Over the past eight decades, the firm’s primary objective has remained constant: to serve as an organization’s most trusted external adviser on critical issues facing senior management. With consultants deployed from more than 90 offices in more than 50 countries, McKinsey advises companies on strategic, operational, organizational and technological issues. The firm has extensive experience in all major industry sectors and primary functional areas as well as in-depth expertise in high priority areas for today’s business.
www.mckinsey.com
Mumtalakat is the investment company for Bahrain, and was established in June 2006 by royal decree as an independent holding company for the government’s strategic non-oil and gas related assets. Mumtalakat was created to align and implement the execution of the government’s initiatives to pursue value-enhancing opportunities, improve transparency and help achieve operational excellence. Mumtalakat holds stakes in over 35 commercial enterprises spanning a variety of sectors, including aluminium production, financial services, telecommunications, real estate, tourism, transportation and food production.
www.mumtalakat.bh
NYSE Euronext (NYX) is a leading global operator of financial markets and provider of innovative trading technologies. The company’s exchanges trade equities, futures, options, fixed income and exchange-traded products in Europe and the United States. With more than 8,000 listed issues, NYSE Euronext’s equities markets—the New York Stock Exchange, Euronext, NYSE Arca and NYSE Amex—represent nearly 40% of the world’s equities trading, the most liquidity of any global exchange group. NYSE Euronext also operates NYSE Liffe, the leading European derivatives business and the world’s second-largest derivatives business by value of trading. The company offers comprehensive commercial technology, connectivity and market data products and services through NYSE Technologies. NYSE Euronext is in the S&P 500 index and is the only exchange operator in the S&P 100 index and Fortune 500.
www.nyx.com
366 Acknowledgments Global Gender Gap Report 2011
The Olayan Group is a private, multinational enterprise made up of more than 50 companies and affiliated businesses. Founded in 1947 by Suliman S. Olayan, the Group has spent more than 60 years building its reputation on a bedrock of dedication, integrity, teamwork, continual improvement and growth. In Saudi Arabia, where the Group originated, Olayan engages in product distribution, manufacturing, services and investment, often alongside leading multinational and regional partners. Internationally, the Group invests in public and private equities, including real estate, and in other asset classes. Olayan’s mission is straightforward: to be a leading diversified Saudi enterprise, a major global investor and the company of choice for its partners, customers and employees.
www.olayangroup.com
Omnicom is a strategic holding company headquartered in New York. It manages a portfolio of global market leaders in the disciplines of advertising, marketing services, specialty communications, interactive/digital media and media buying services. Omnicom Group companies cover more than 30 marketing communications disciplines across more than 200 strategic brand platforms, comprising three global advertising agency networks, leading national advertising agencies, a global network of more than 175 marketing services companies and a media group that includes two of the world’s premier providers of media planning and buying services. Omnicom’s commitment to excellence, quality and client satisfaction is a primary reason its record of new business wins and longevity of major client relationships is the best in the business. Its agency brands are consistently acknowledged as having the best creative talent in the world in all disciplines. A leader in digital media, Omnicom Group has been ranked number one in digital share of revenue among all holding companies.
www.omnicomgroup.com
The Renault-Nissan Alliance, created in 1999, is a unique partnership of five brands that sold more than six million units in 2010. The Alliance employs over 320,000 employees and is active in 190 markets. Renault and Nissan are run as separate companies but united through cross-shareholding, a shared focus on results-driven synergies, cross-cultural management and respect for individual brand and corporate identities. In 2010, the Alliance launched the first of eight planned electric vehicles (the Nissan LEAF), leading the drive toward sustainable zero-emission mobility. With five battery production plants and electric vehicle manufacturing in six countries, the Alliance will be the first automaker to mass market a full range of zero-emission vehicles. The Alliance has agreements with over 100 cities, states and countries that are working to establish the infrastructure and market conditions that will help make electric vehicles affordable and convenient.
www.alliance-renault-nissan.com

World Economic Forum91–93 route de la CapiteCH-1223 Cologny/GenevaSwitzerland
Tel.: +41 (0) 22 869 1212Fax: +41 (0) 22 786 2744
The World Economic Forum is an independent international organization committed to improving the state of the world by engaging business, political, academic and other leaders of society to shape global, regional and industry agendas.
Incorporated as a not-for-profit foundation in 1971 and headquartered in Geneva, Switzerland, the Forum is tied to no political, partisan or national interests.
The Glob
al Gend
er Gap
Rep
ort 2011