the global market for u.s. lpg - platts€¢ in business since the mid-1980s • primary source...
TRANSCRIPT
©2014, ESAI Energy LLC, 401 Edgewater Place, Suite 640 | Wakefield MA 01880 | T: +1781.245.2036 | www.esai.com
The Global Market for U.S. LPG
Prepared for:
Platts 4th Annual NGLs Conference, Houston September 30, 2014
Presented by: Vivek S. Mathur
ESAI Energy, LLC
• In business since the mid-1980s
• Primary source bottom-up data collection and analysis.
• tracks ethane, propane & butane (LPG), naphtha, plant and lease
condensate supply, demand, inventories and trade data by country, globally.
• analyzes and forecasts petroleum and alternative fuels markets.
• Clients include producers, transformers and consumers of energy worldwide
• Headquarters outside of Boston
2
About ESAI Energy
Presentation Structure
U.S. LPG Supply/Demand Outlook to 2020 o Is there no choice but to export? o The exportable surplus
Global Markets for U.S. LPG
o Latin America o Europe o Asia
Impact on Trade Flows
3
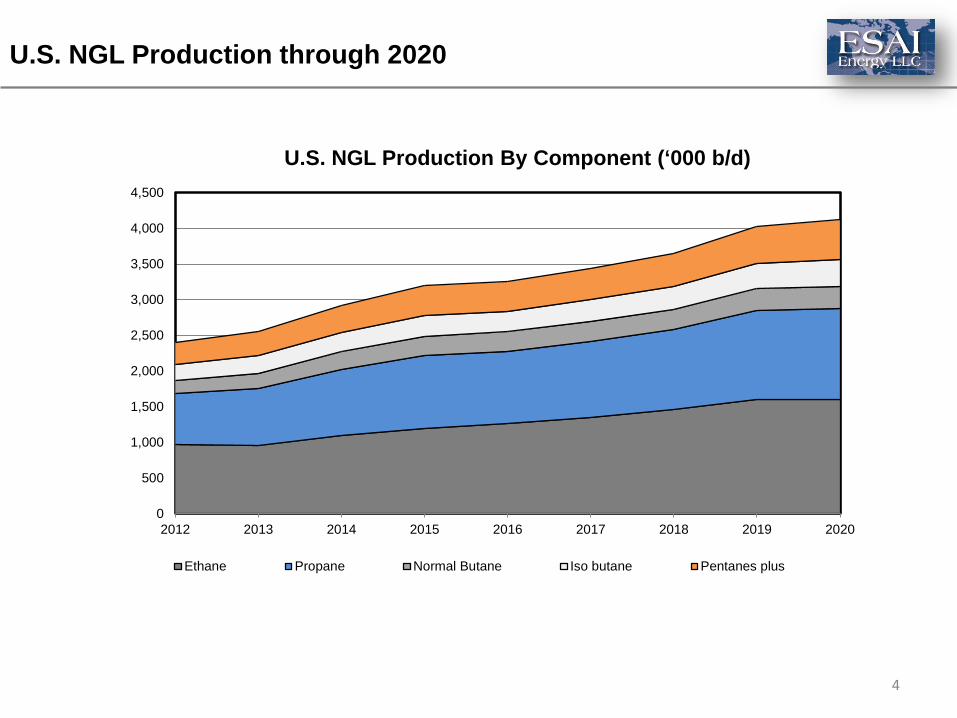
U.S. NGL Production through 2020
0
500
1,000
1,500
2,000
2,500
3,000
3,500
4,000
4,500
2012 2013 2014 2015 2016 2017 2018 2019 2020
U.S. NGL Production By Component (‘000 b/d)
Ethane Propane Normal Butane Iso butane Pentanes plus
4
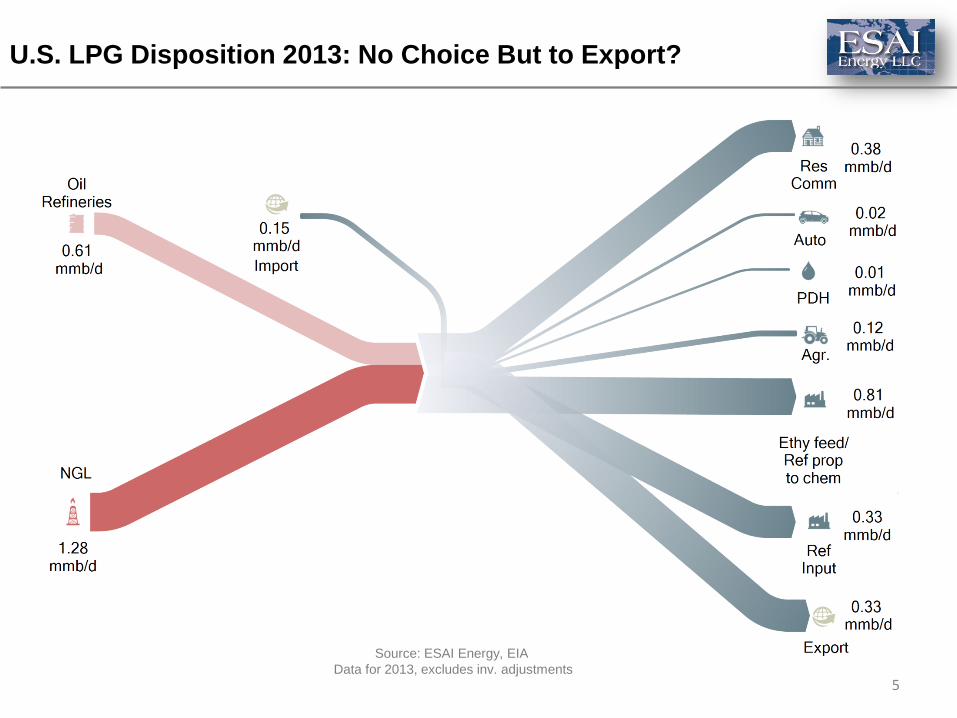
U.S. LPG Disposition 2013: No Choice But to Export?
5
Source: ESAI Energy, EIA Data for 2013, excludes inv. adjustments
0
500
1,000
1,500
2,000
2,500
2012 2013 2014 2015 2016 2017 2018 2019 2020
Ethylene Feedstocks (‘000 b/d)
Ethane Propane Butane Other
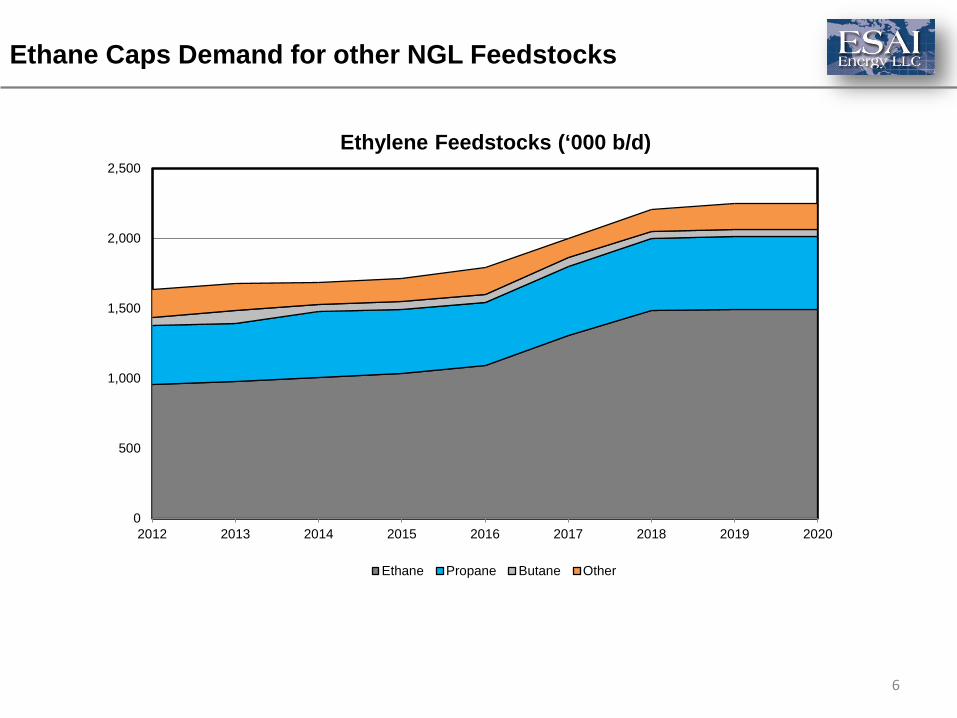
6
Ethane Caps Demand for other NGL Feedstocks
7
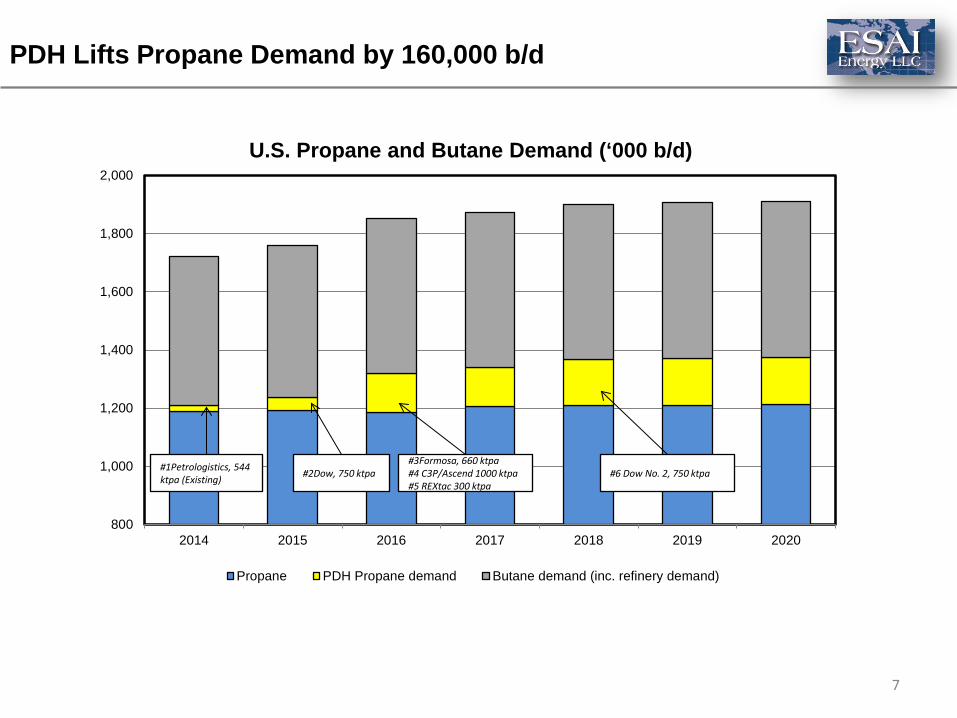
PDH Lifts Propane Demand by 160,000 b/d
800
1,000
1,200
1,400
1,600
1,800
2,000
2014 2015 2016 2017 2018 2019 2020
U.S. Propane and Butane Demand (‘000 b/d)
Propane PDH Propane demand Butane demand (inc. refinery demand)
#1Petrologistics, 544 ktpa (Existing)
#3Formosa, 660 ktpa #4 C3P/Ascend 1000 ktpa #5 REXtac 300 ktpa
#2Dow, 750 ktpa #6 Dow No. 2, 750 ktpa
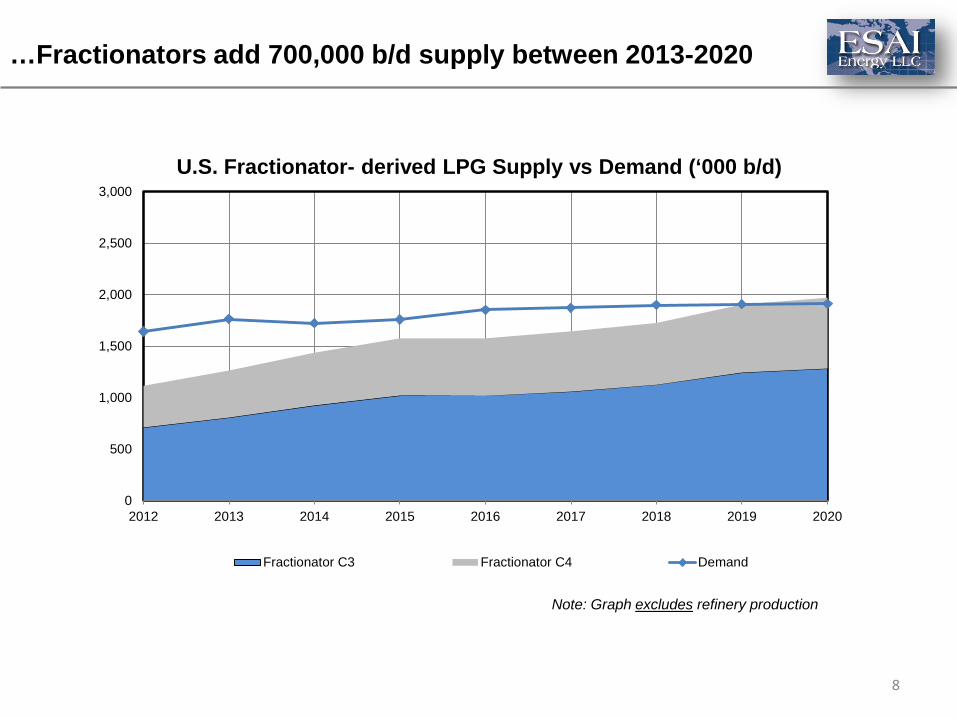
…Fractionators add 700,000 b/d supply between 2013-2020
8
0
500
1,000
1,500
2,000
2,500
3,000
2012 2013 2014 2015 2016 2017 2018 2019 2020
U.S. Fractionator- derived LPG Supply vs Demand (‘000 b/d)
Fractionator C3 Fractionator C4 Demand
Note: Graph excludes refinery production
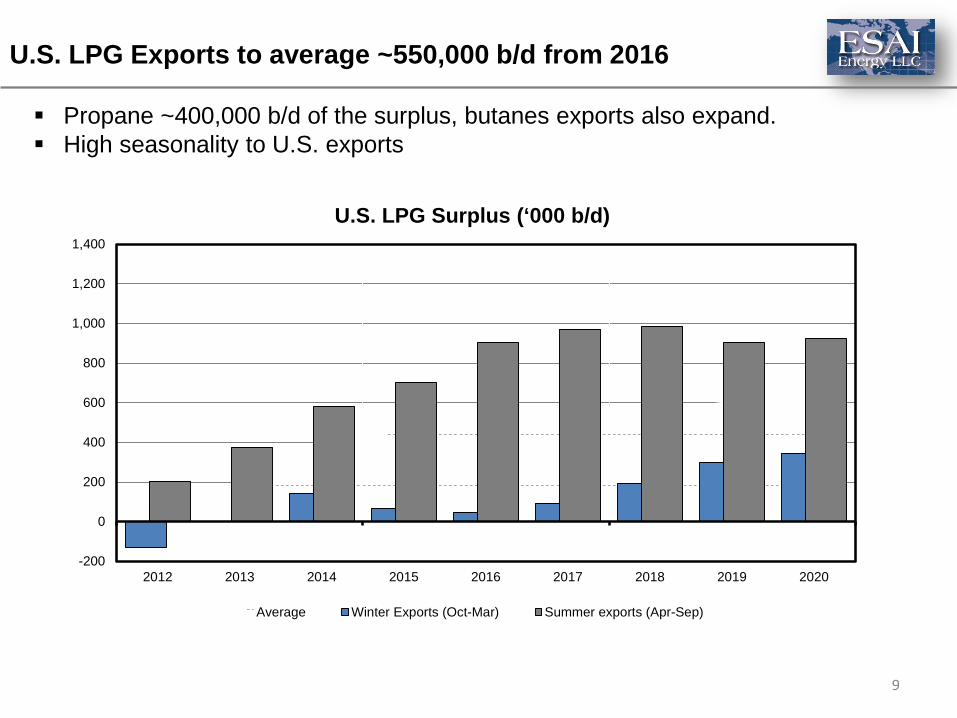
U.S. LPG Exports to average ~550,000 b/d from 2016
9
-200
0
200
400
600
800
1,000
1,200
1,400
2012 2013 2014 2015 2016 2017 2018 2019 2020
U.S. LPG Surplus (‘000 b/d)
Average Winter Exports (Oct-Mar) Summer exports (Apr-Sep)
Propane ~400,000 b/d of the surplus, butanes exports also expand. High seasonality to U.S. exports

U.S. & Canadian LPG Terminal Capacity* (‘000 b/d)
10
0
200
400
600
800
1,000
1,200
1,400
2013 2014 2015 2016 2017 2018 2019 2020
Pembina, BC (Potential)
Altagas/Idemitsu, BC Coast (Potential)
P66-Freeport
BWP/Williams-Lake Charles
Oxy-Ingleside
DCP-Chesapeake
Martin Gas-Pt Aransas
Sea 3-Newington NH
Sea 3 - Tampa
Trafigura-Corpus Christi
Sunoco-Marcus Hook PA
ETC (SXL/LS) Mariner South
Petrogas-Ferndale
Targa-Galena Park
Enterprise-Houston
An LPG Export Capacity Overbuild?
*Capacity announced & under evaluation

Who Will Absorb U.S. LPG? ELLESMERE ISLAND
Household 53%
Autofuel 9%
Petchem 26%
Other industry
12%
Global LPG Demand By Sector, 2013
Key Regional Deficits, 2013
(1,800)
(1,600)
(1,400)
(1,200)
(1,000)
(800)
(600)
(400)
(200)
0
Lat Am Asia Europe Other
11
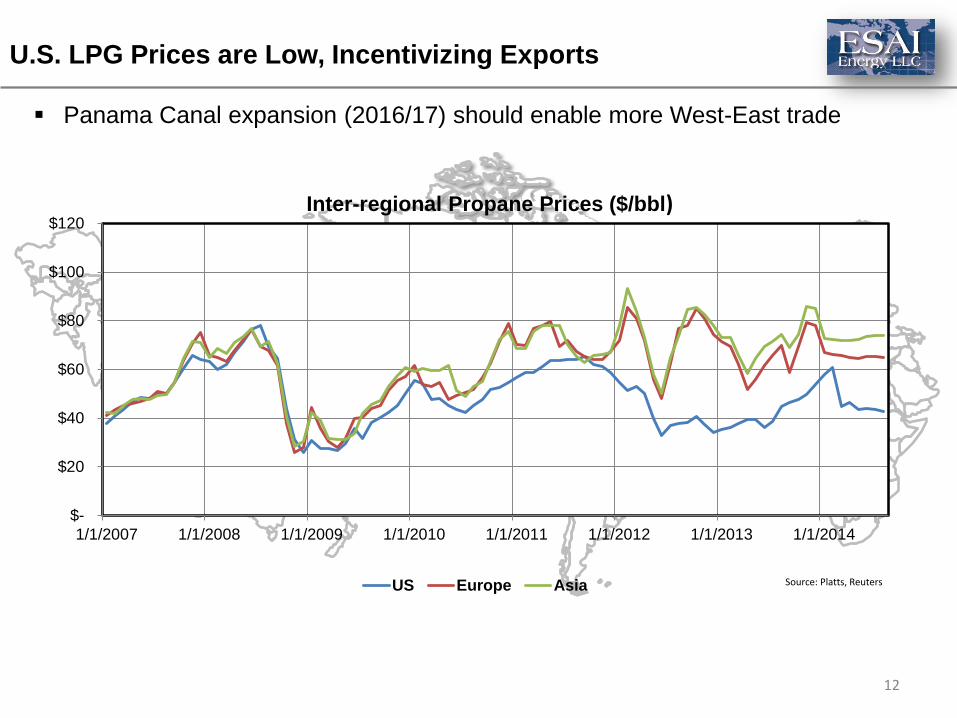
U.S. LPG Prices are Low, Incentivizing Exports ELLESMERE ISLAND
$-
$20
$40
$60
$80
$100
$120
1/1/2007 1/1/2008 1/1/2009 1/1/2010 1/1/2011 1/1/2012 1/1/2013 1/1/2014
Inter-regional Propane Prices ($/bbl)
US Europe Asia Source: Platts, Reuters
Panama Canal expansion (2016/17) should enable more West-East trade
12

13
U.S. Propane and Butane Exports by Destination
0
50
100
150
200
250
300
350
400
2012 2013 2014 YTD
Asia
Europe
Mexico
Canada
S. America
C.America
Caribbean0
50
100
150
200
250
300
350
400
2012 2013 2014 YTD
U.S. Propane Exports (‘000 b/d) U.S. Butane Exports (‘000 b/d)
H1 2014 H1 2014
14
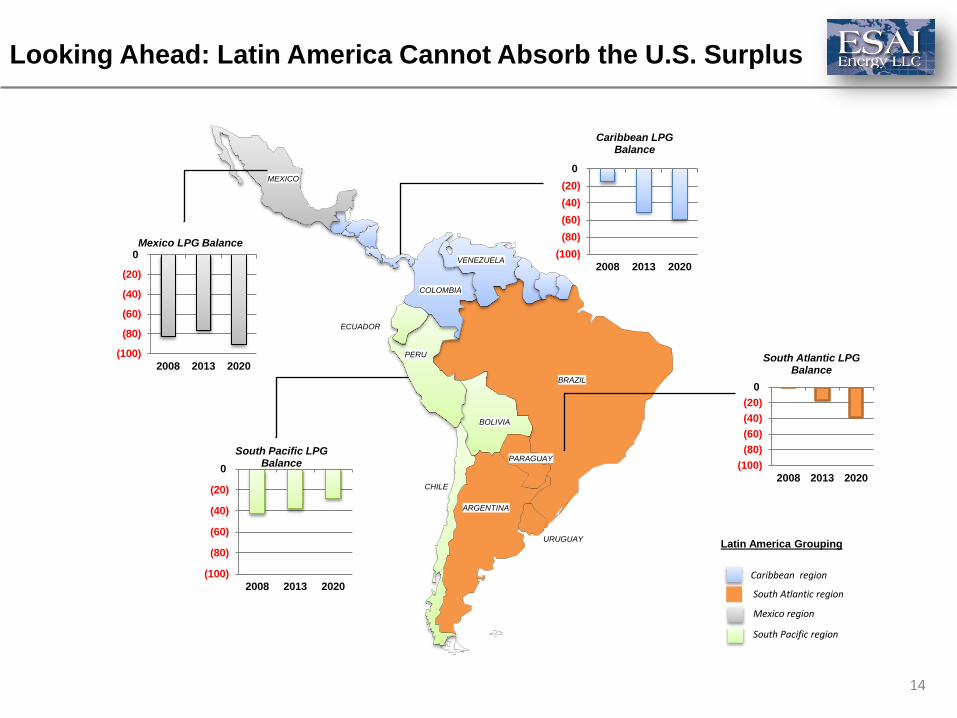
MEXICO
COLOMBIA
VENEZUELA
BRAZIL
PERU
ECUADOR
BOLIVIA
PARAGUAY
CHILE
ARGENTINA
URUGUAY
Caribbean region
South Atlantic region
Mexico region
South Pacific region
Latin America Grouping
Looking Ahead: Latin America Cannot Absorb the U.S. Surplus
(100)(80)(60)(40)(20)
0
2008 2013 2020
Caribbean LPG Balance
(100)
(80)
(60)
(40)
(20)
0
2008 2013 2020
Mexico LPG Balance
(100)
(80)
(60)
(40)
(20)
0
2008 2013 2020
South Pacific LPG Balance (100)
(80)(60)(40)(20)
0
2008 2013 2020
South Atlantic LPG Balance

15
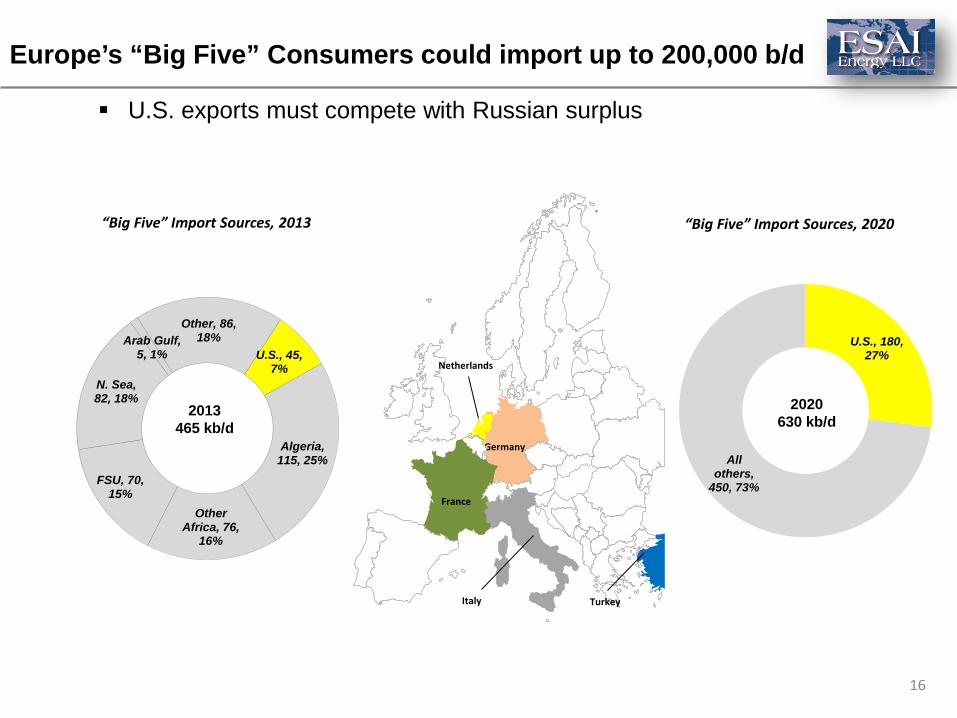
European petchems expand LPG, and shut down some naphtha-based capacity Turkey adds one PDH project
How Much Could Europe Absorb?
2013 2020
Ethane Naphtha Propane Butane Other
Ethylene Production By Feedstock (mil tpa)
18.5 19
16
Germany
France
U.S. exports must compete with Russian surplus
U.S., 45, 7%
Algeria, 115, 25%
Other Africa, 76,
16%
FSU, 70, 15%
N. Sea, 82, 18%
Arab Gulf, 5, 1%
Other, 86, 18%
2013 465 kb/d
U.S., 180, 27%
All others,
450, 73%
2020 630 kb/d
“Big Five” Import Sources, 2020 “Big Five” Import Sources, 2013
Italy Turkey
Netherlands
Europe’s “Big Five” Consumers could import up to 200,000 b/d

17
• Al- KARAANA (2017), 1300 ktpa P/E
• RUWAIS/TAKREER PDH (2014), 500 ktpa • Al- CHEMEYA PDH, 1300 ktpa (+2016) • ADBIC , 1450 ktpa, (+2017) P/B
KEY MIX FEED PETROCHEMICAL PROJECTS *
* Selected list of projects known, or expected to consume LPG
• SADARA (2016) 1500 ktpa, N/P
Note: E= Ethane, P=Propane, B= Butane, N= Naphtha
Petchem Demand in the Mideast Caps LPG Exports
Exports remain in the 1 million b/d range AG mix-feed project cancellations (eg. Al-Sejeel) poses risks
2013 2020
Ethane Naphtha Propane Butane Other
Ethylene Production By Feedstock (mil tpa)
23
29
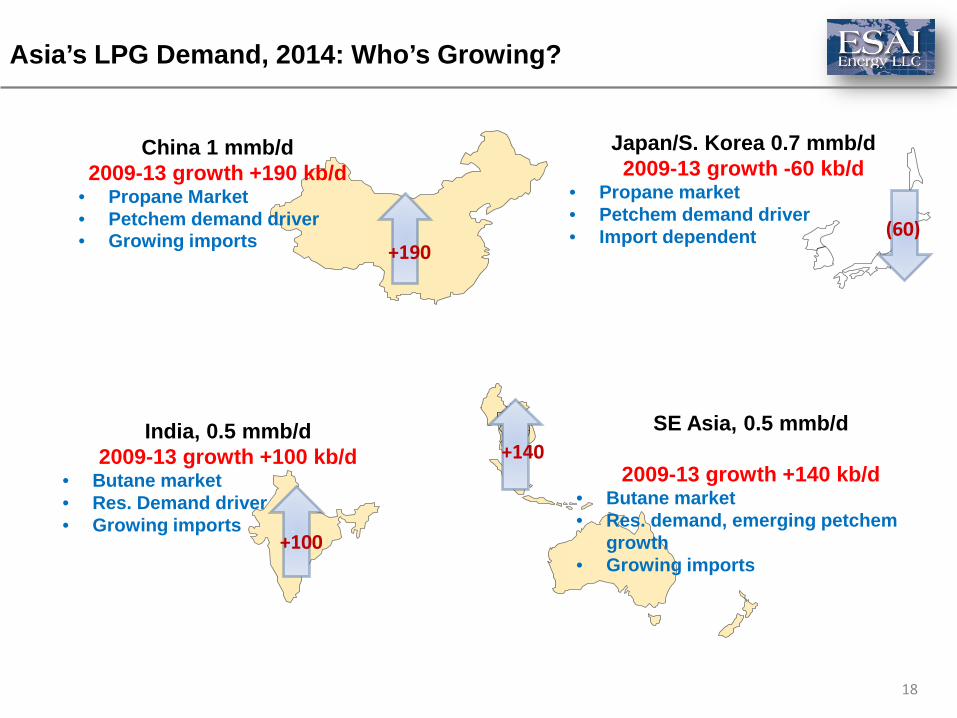
Asia’s LPG Demand, 2014: Who’s Growing?
Japan/S. Korea 0.7 mmb/d 2009-13 growth -60 kb/d
• Propane market • Petchem demand driver • Import dependent
SE Asia, 0.5 mmb/d
2009-13 growth +140 kb/d • Butane market • Res. demand, emerging petchem
growth • Growing imports
India, 0.5 mmb/d 2009-13 growth +100 kb/d
• Butane market • Res. Demand driver • Growing imports
China 1 mmb/d 2009-13 growth +190 kb/d
• Propane Market • Petchem demand driver • Growing imports +190
(60)
+100
+140
18
19
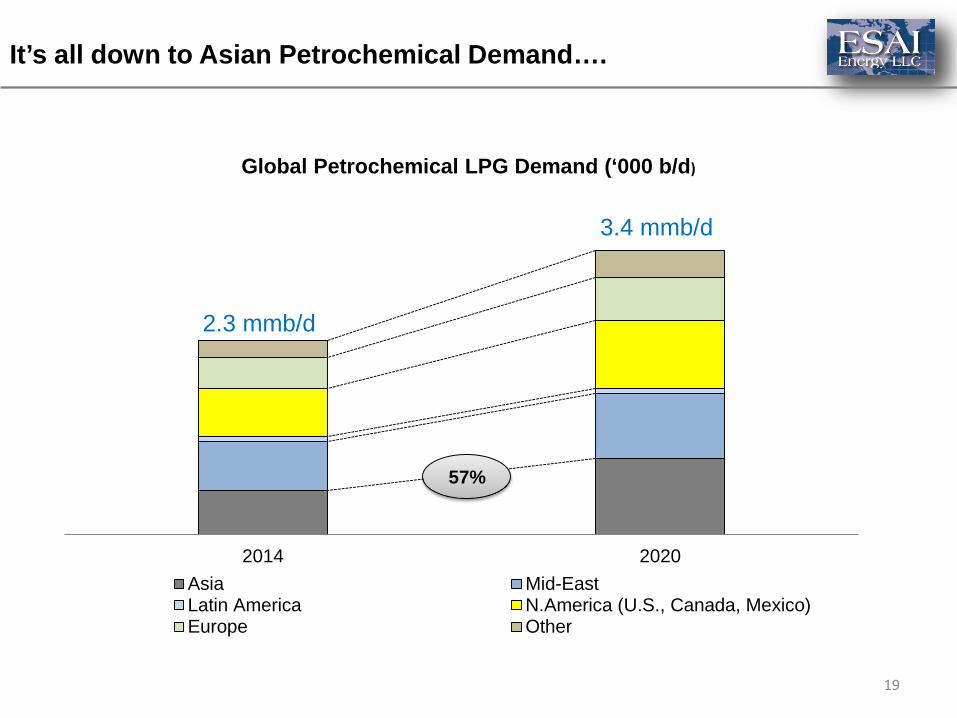
It’s all down to Asian Petrochemical Demand….
2014 2020
Global Petrochemical LPG Demand (‘000 b/d)
Asia Mid-EastLatin America N.America (U.S., Canada, Mexico)Europe Other
2.3 mmb/d
3.4 mmb/d
57%

..especially in China
China’s PDH Projects: Impact on Propane Demand (‘000 b/d)
PDH Propane demand 200,000 b/d by 2015, demand could reach 350,000 b/d 2016+
0
50
100
150
200
250
300
350
400
2013 2014 2015 2016+
Other
Jiangsu Haili
Changjiang Natural Gas Chem
Oriental Energy - 2
Oriental Energy - 1
Meide PC -2
Meide PC -1
Yantai Wanhua
Yanzijiang PC Phase 1
Shaoxing Sanyuan
Satellite
Ningbo Haiyue
Tianjin Bohai
20

21
…this drives up Asian Imports
2014 2020
Res/Comm Petchem Transport Supply
Asia LPG Supply/Demand (‘000 b/d)
3 mmb/d
3.5 mmb/d
Note: Other demand grouped in Res/Comm. demand in this chart
22
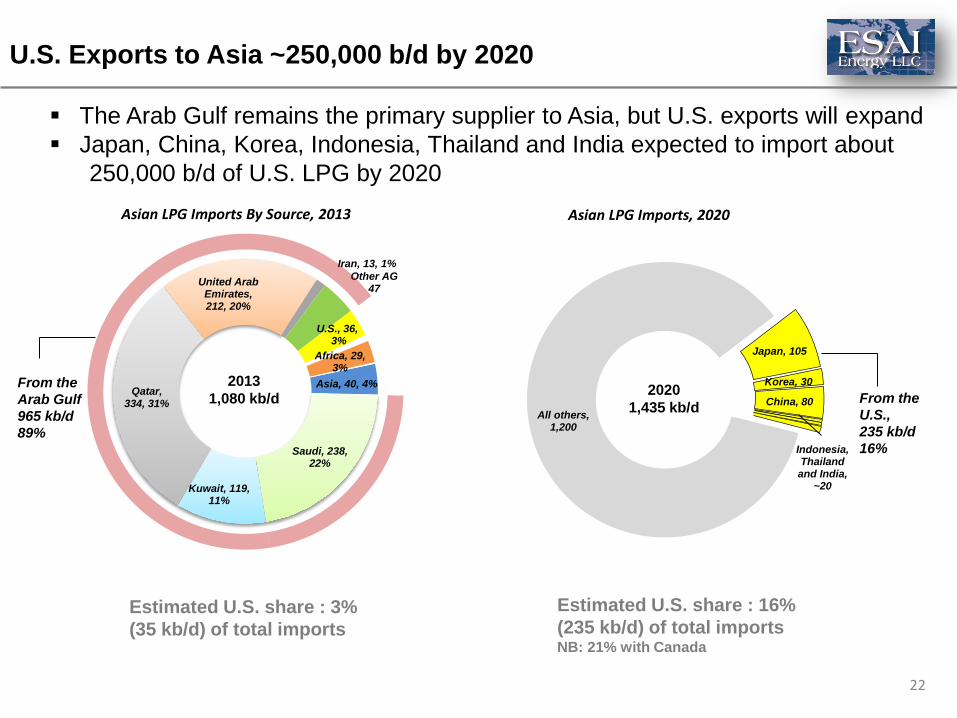
The Arab Gulf remains the primary supplier to Asia, but U.S. exports will expand Japan, China, Korea, Indonesia, Thailand and India expected to import about 250,000 b/d of U.S. LPG by 2020
Asia, 40, 4%
Saudi, 238, 22%
Kuwait, 119, 11%
Qatar,
334, 31%
United Arab Emirates, 212, 20%
Iran, 13, 1% Other AG
47
U.S., 36, 3%
Africa, 29, 3%
2013 1,080 kb/d
All others, 1,200
Japan, 105
Korea, 30
China, 80
Indonesia, Thailand and India,
~20
2020 1,435 kb/d
Asian LPG Imports By Source, 2013 Asian LPG Imports, 2020
From the U.S., 235 kb/d 16%
From the Arab Gulf 965 kb/d 89%
Estimated U.S. share : 3% (35 kb/d) of total imports
Estimated U.S. share : 16% (235 kb/d) of total imports NB: 21% with Canada
U.S. Exports to Asia ~250,000 b/d by 2020

23
200
60
Propane ($/bbl), MBV = $43 Saudi CP ($/bbl) =$73
970
(Figures in ‘000 b/d)
USGC/AG LPG Trade, 2013: West-East Trade
330
40

24
210
185
1000
230
(Figures in ‘000 b/d)
625
Hypothetical USGC/AG LPG Trade, 2020: West-East Trade
+80*
*Potential Canadian exports to Asia
Fundamentals: U.S. Exports Upend Global LPG Trade
• By 2020, U.S. exports will be in the 600,000 b/d range.
• Latin America’s inability to absorb more U.S. LPG will boost exports beyond the Americas.
• Petrochemical demand growth should drive up Asian imports Pricing: Mont Belvieu Pricing Will Impact Asia
• U.S. origin LPG will be 16 percent of Asian LPG imports in 2020.
North American imports into Asia including Canada could be in the 20 percent range.
• Middle Eastern LPG producers will defend market share and lower
prices in the coming years.
25
In Summary
©2014, ESAI Energy LLC, 401 Edgewater Place, Suite 640 | Wakefield MA 01880 | T: +1781.245.2036 | www.esai.com
Thank You!
Questions?
Vivek S. Mathur [email protected]
26