the global pulse markets: recent trends and outlook · the global pulse markets: recent trends and...
TRANSCRIPT

THE GLOBAL PULSE MARKETS: THE GLOBAL PULSE MARKETS: recent trends and outlookrecent trends and outlook
CICILS/IPTIC 2004 CONVENTIONCICILS/IPTIC 2004 CONVENTION1010--12 June 200412 June 2004Beijing, ChinaBeijing, China
Boubaker BENBELHASSENCommodities and Trade Division
United Nations Food and Agriculture Organization (FAO)Rome, Italy
2
Presentation outline
� production of pulses� consumption of pulses� trade in pulses: imports/exports� pulse food aid� price trends� short-term market outlook� future challenges for the industry
3
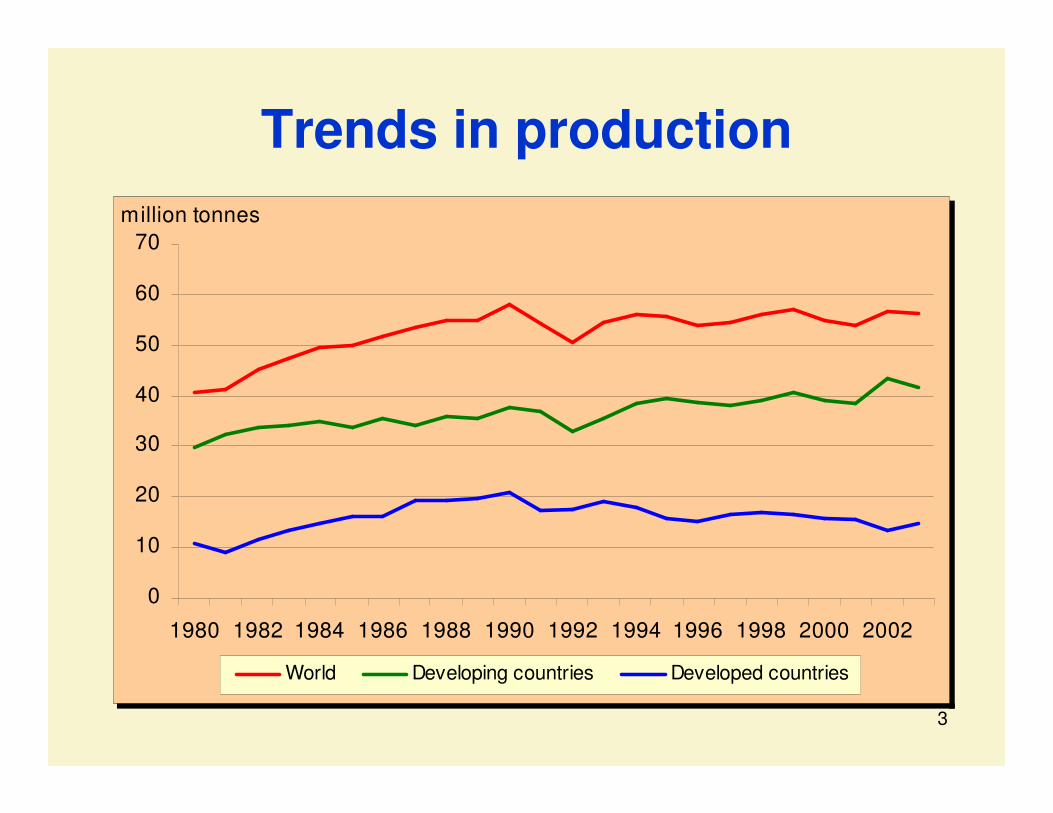
Trends in production
0
10
20
30
40
50
60
70
1980 1982 1984 1986 1988 1990 1992 1994 1996 1998 2000 2002
million tonnes
World Developing countries Developed countries
4
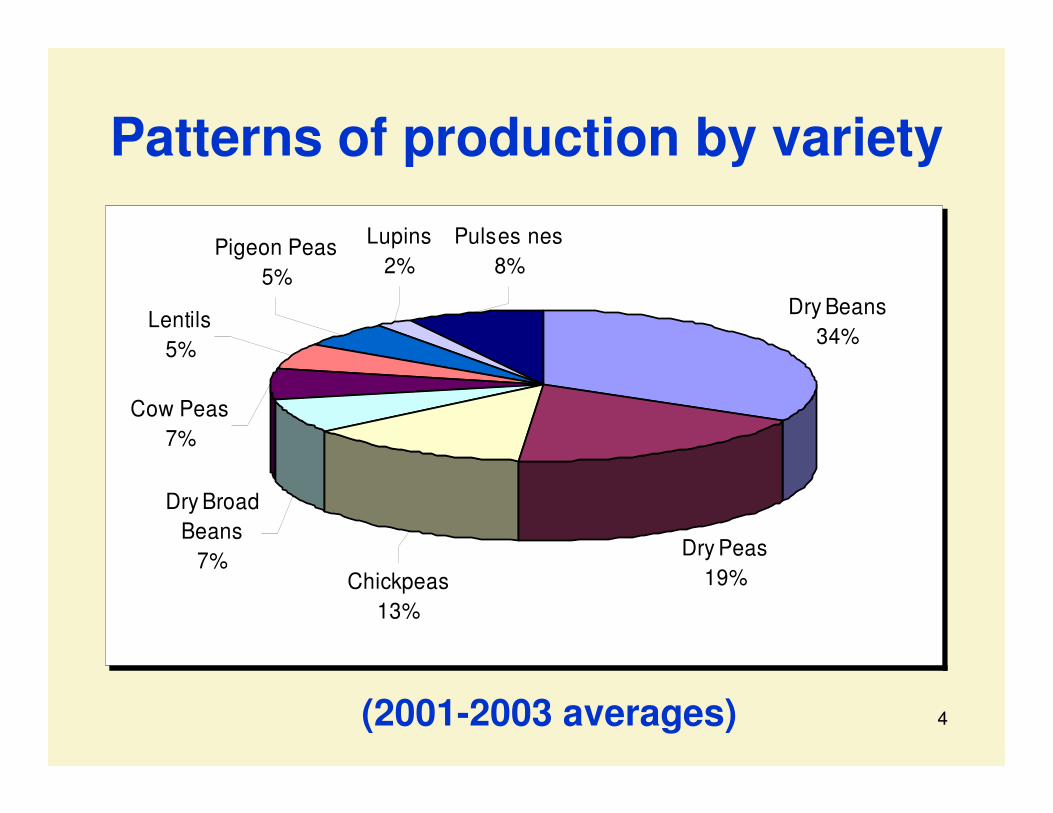
Patterns of production by variety
Dry Beans34%
Dry Peas19%
Pulses nes8%
Lupins2%
Pigeon Peas5%
Lentils5%
Cow Peas7%
Dry Broad Beans
7%Chickpeas
13%
(2001-2003 averages)
5
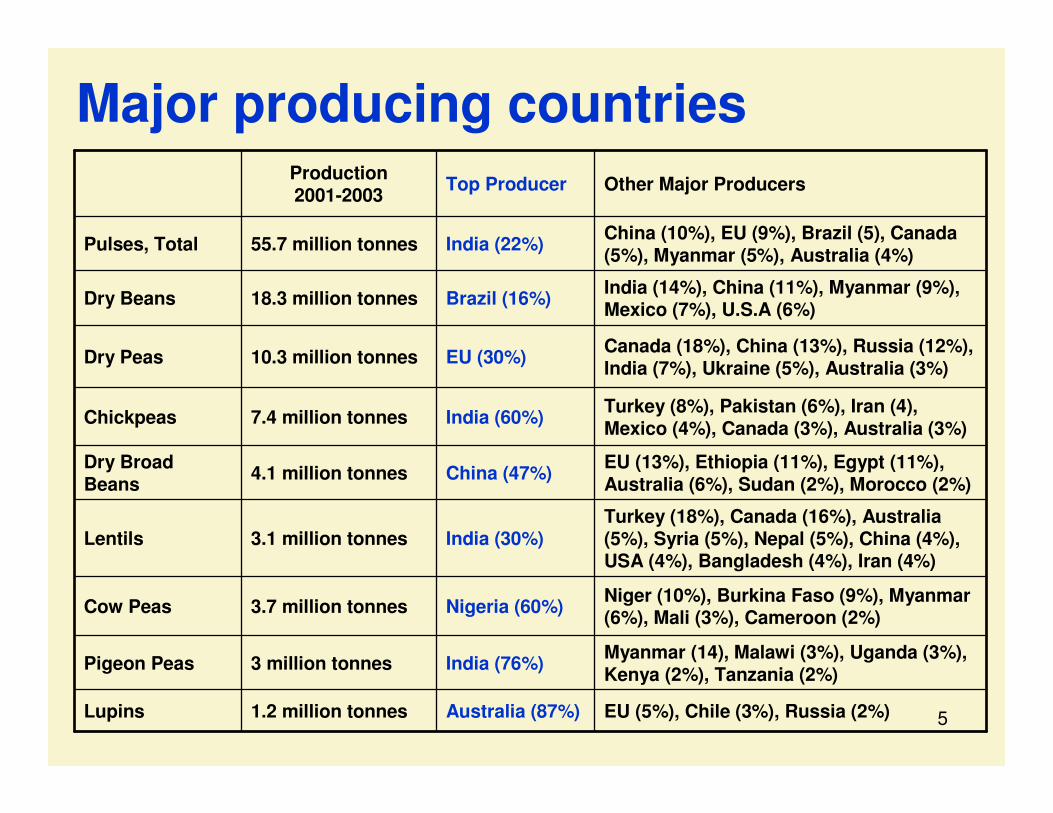
Major producing countries
EU (5%), Chile (3%), Russia (2%)Australia (87%)1.2 million tonnesLupins
Myanmar (14), Malawi (3%), Uganda (3%), Kenya (2%), Tanzania (2%)India (76%)3 million tonnesPigeon Peas
Niger (10%), Burkina Faso (9%), Myanmar (6%), Mali (3%), Cameroon (2%)Nigeria (60%)3.7 million tonnesCow Peas
Turkey (18%), Canada (16%), Australia (5%), Syria (5%), Nepal (5%), China (4%), USA (4%), Bangladesh (4%), Iran (4%)
India (30%)3.1 million tonnesLentils
EU (13%), Ethiopia (11%), Egypt (11%), Australia (6%), Sudan (2%), Morocco (2%)China (47%)4.1 million tonnesDry Broad
Beans
Turkey (8%), Pakistan (6%), Iran (4), Mexico (4%), Canada (3%), Australia (3%)India (60%)7.4 million tonnesChickpeas
Canada (18%), China (13%), Russia (12%), India (7%), Ukraine (5%), Australia (3%)EU (30%)10.3 million tonnesDry Peas
India (14%), China (11%), Myanmar (9%), Mexico (7%), U.S.A (6%)Brazil (16%)18.3 million tonnesDry Beans
China (10%), EU (9%), Brazil (5), Canada (5%), Myanmar (5%), Australia (4%)India (22%)55.7 million tonnesPulses, Total
Other Major ProducersTop ProducerProduction2001-2003
6
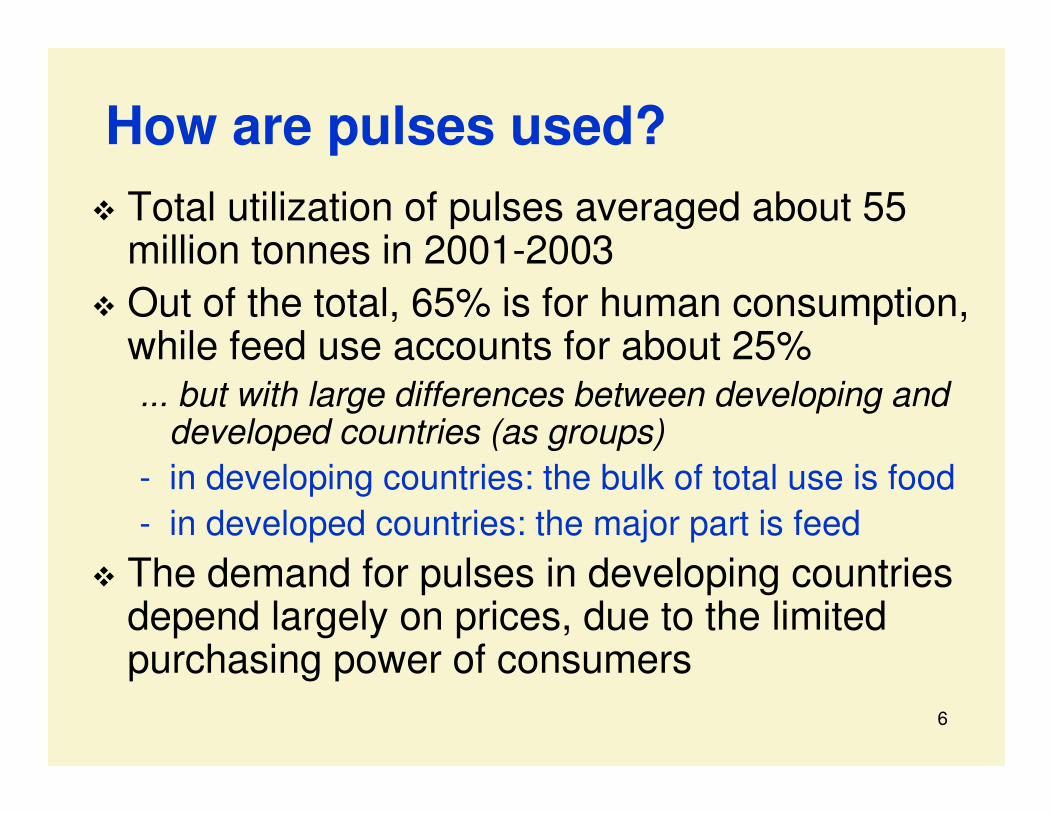
How are pulses used?� Total utilization of pulses averaged about 55
million tonnes in 2001-2003� Out of the total, 65% is for human consumption,
while feed use accounts for about 25%... but with large differences between developing and
developed countries (as groups)- in developing countries: the bulk of total use is food- in developed countries: the major part is feed
� The demand for pulses in developing countries depend largely on prices, due to the limited purchasing power of consumers
7
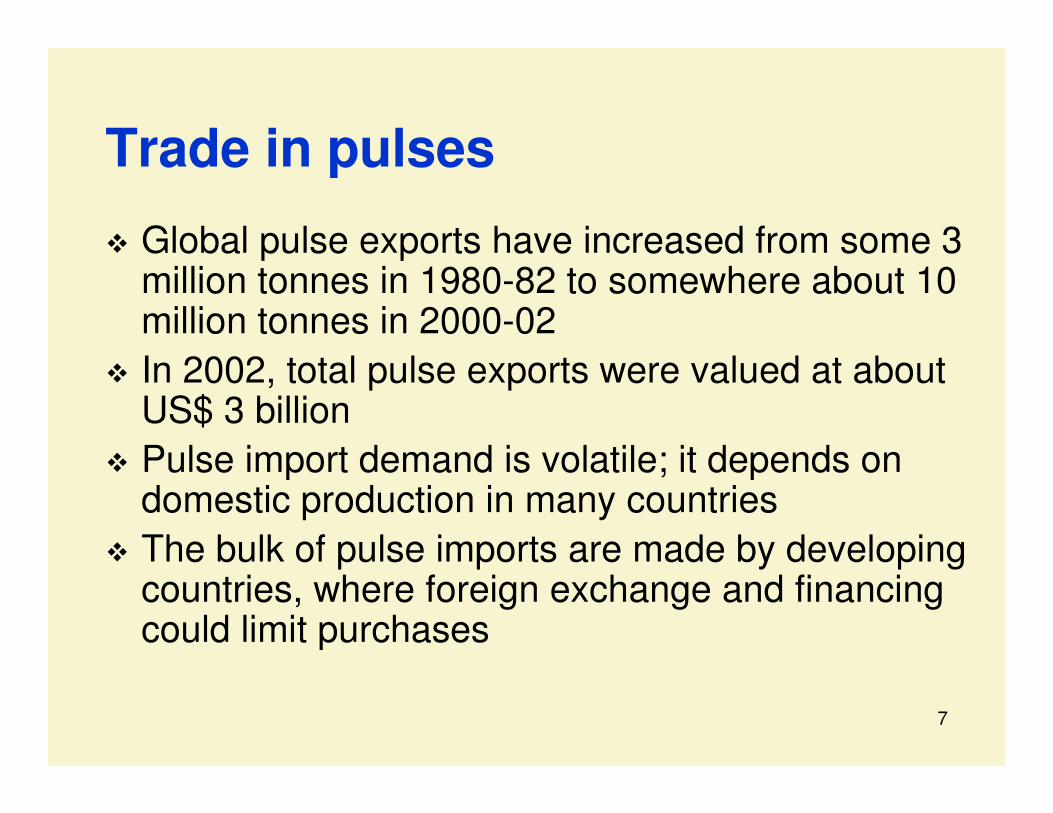
Trade in pulses
� Global pulse exports have increased from some 3 million tonnes in 1980-82 to somewhere about 10 million tonnes in 2000-02
� In 2002, total pulse exports were valued at about US$ 3 billion
� Pulse import demand is volatile; it depends on domestic production in many countries
� The bulk of pulse imports are made by developing countries, where foreign exchange and financing could limit purchases
8
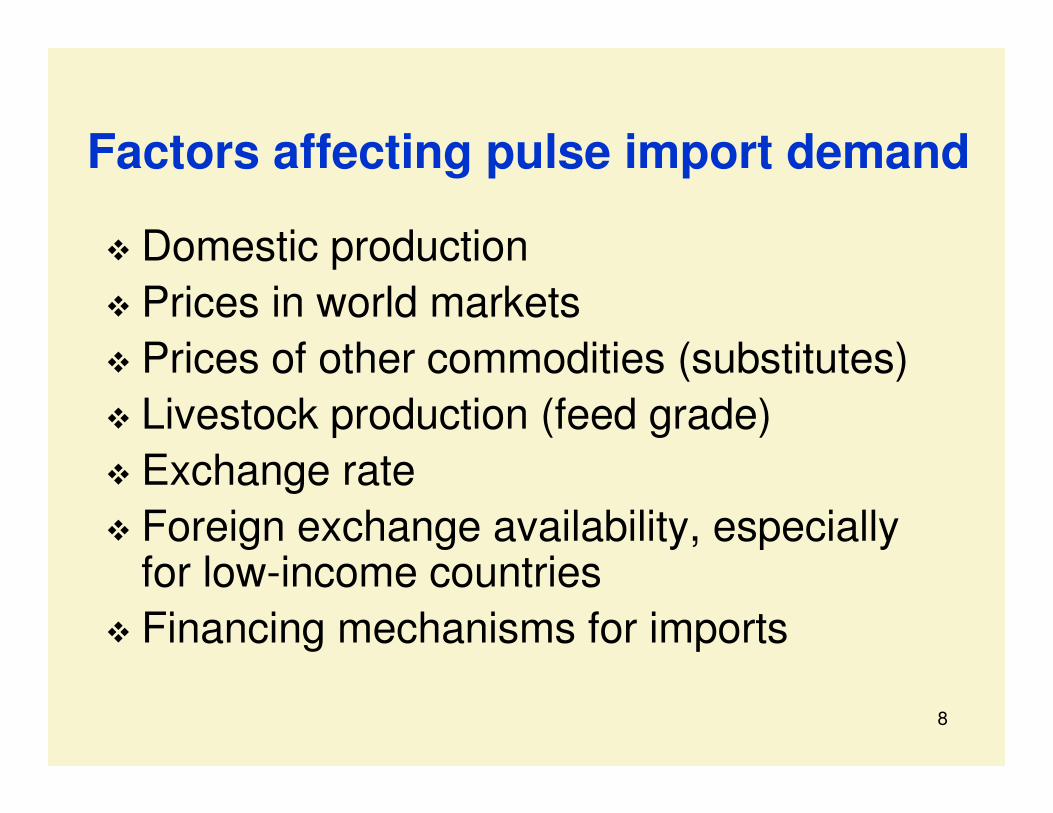
Factors affecting pulse import demand
� Domestic production� Prices in world markets� Prices of other commodities (substitutes)� Livestock production (feed grade)� Exchange rate� Foreign exchange availability, especially
for low-income countries� Financing mechanisms for imports
9
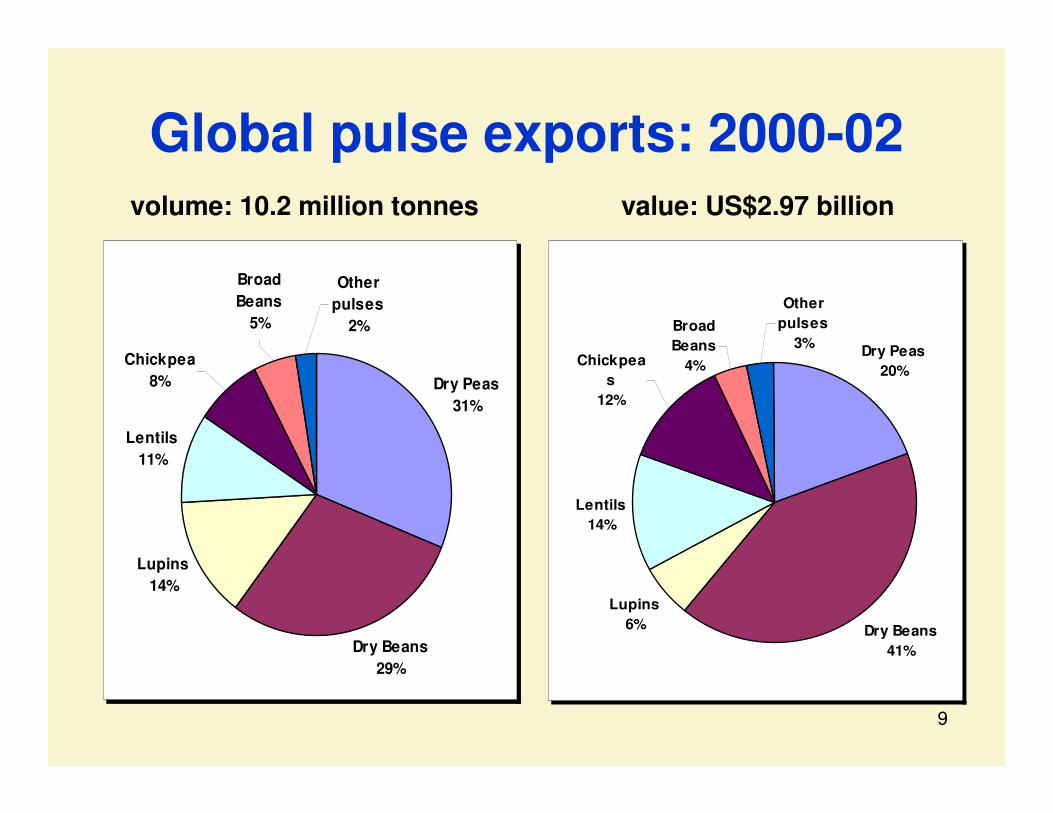
Global pulse exports: 2000-02
Dry Peas20%
Dry Beans41%
Lupins6%
Lentils14%
Broad Beans
4%
Other pulses
3%Chickpea
s12%
Dry Peas31%
Dry Beans29%
Lupins14%
Lentils11%
Chickpea8%
Other pulses
2%
Broad Beans
5%
volume: 10.2 million tonnes value: US$2.97 billion
10
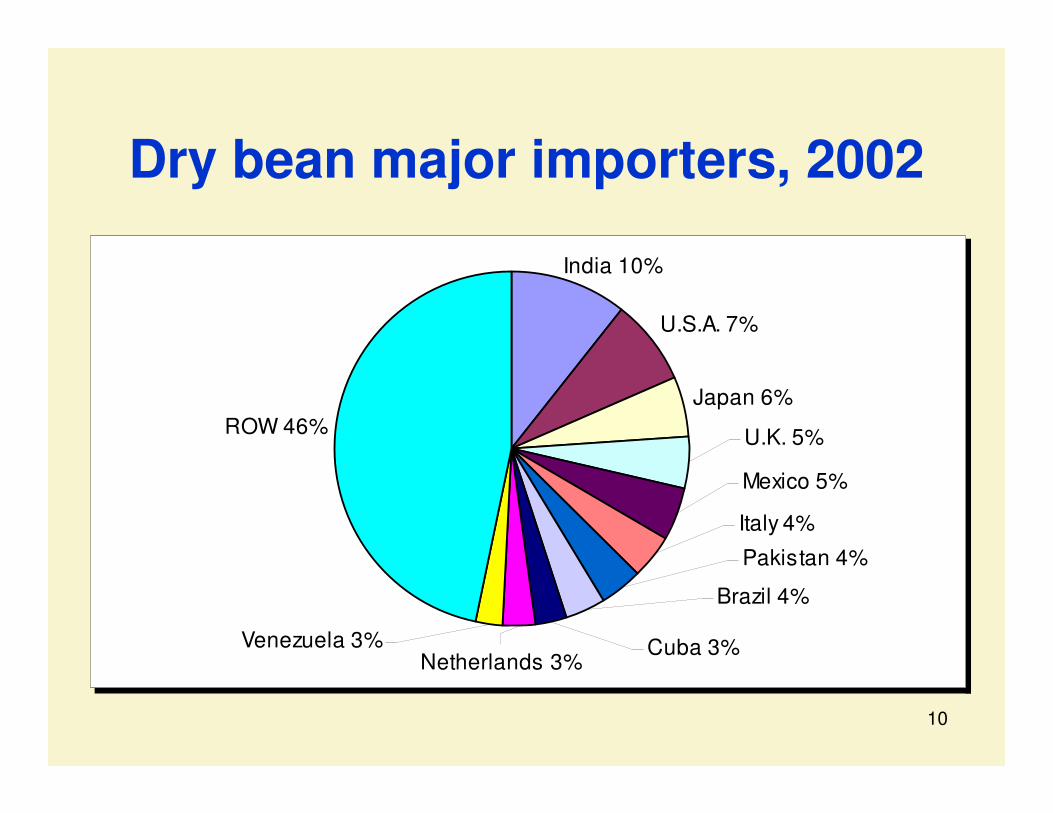
Dry bean major importers, 2002
Japan 6%ROW 46%
U.S.A. 7%
India 10%
Mexico 5%
U.K. 5%
Cuba 3%
Italy 4%
Venezuela 3%Netherlands 3%
Brazil 4%
Pakistan 4%
11
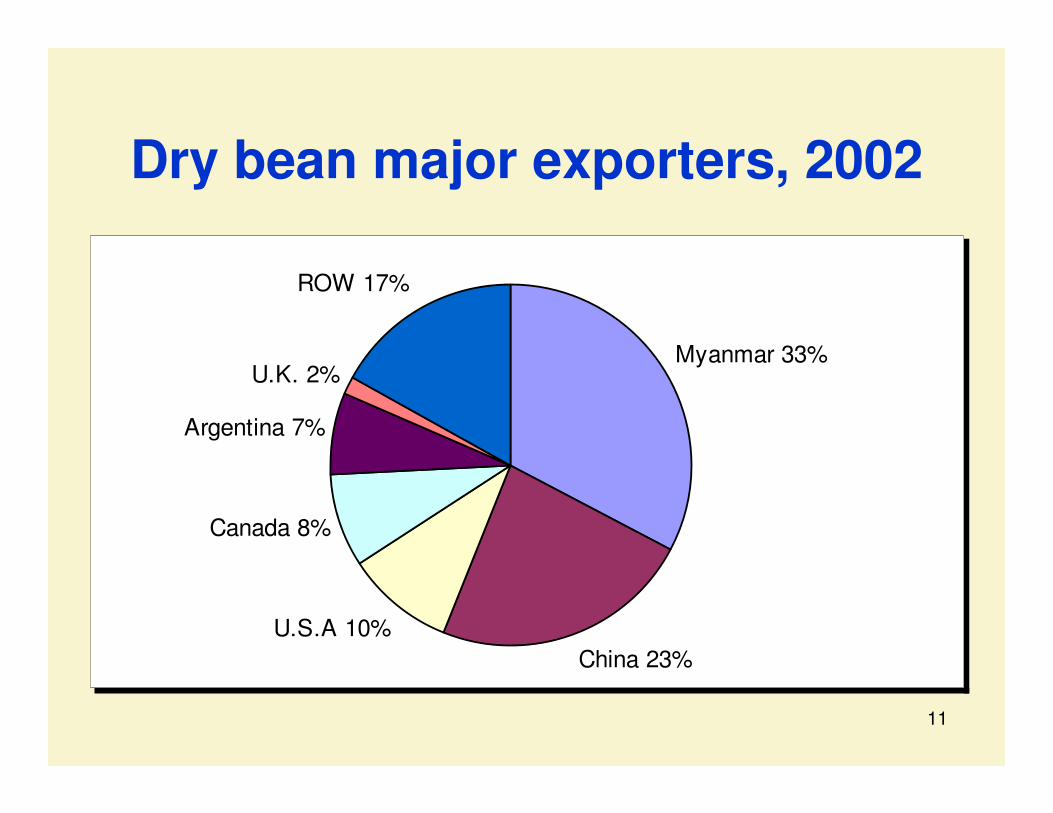
Myanmar 33%
China 23%U.S.A 10%
Canada 8%
Argentina 7%
U.K. 2%
ROW 17%
Dry bean major exporters, 2002
12
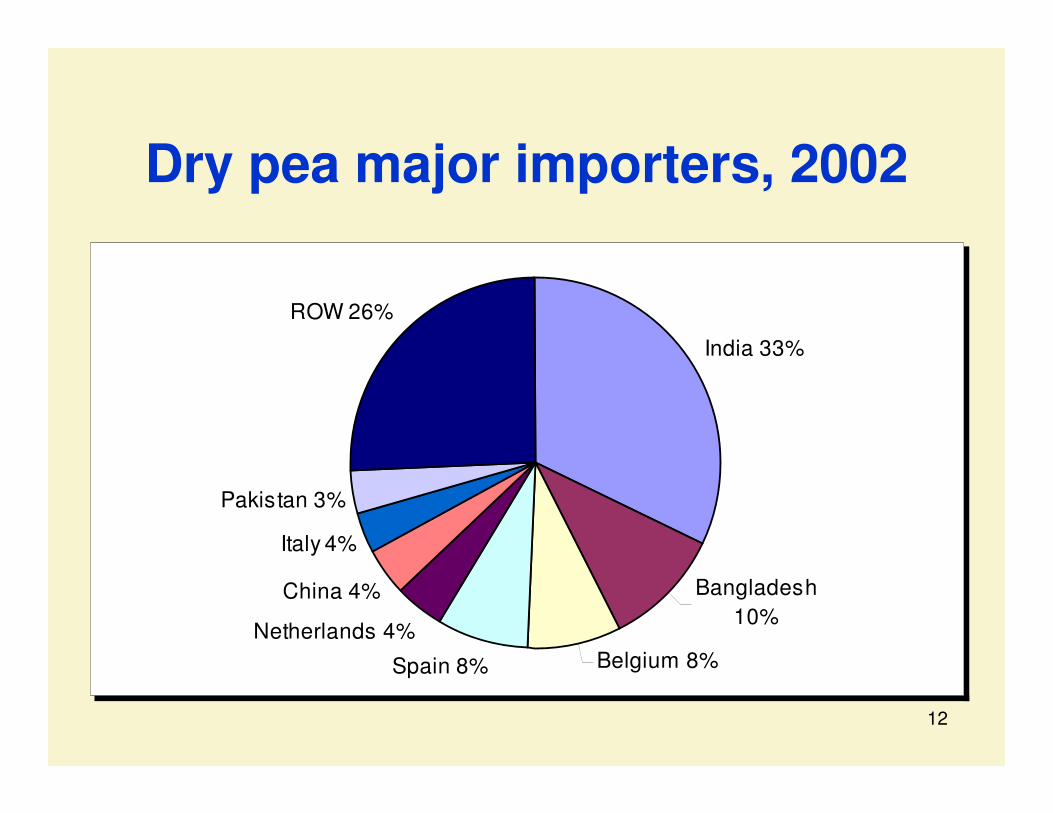
Dry pea major importers, 2002
India 33%
Bangladesh 10%
Belgium 8%Spain 8%
Netherlands 4%
China 4%
Italy 4%
Pakistan 3%
ROW 26%
13
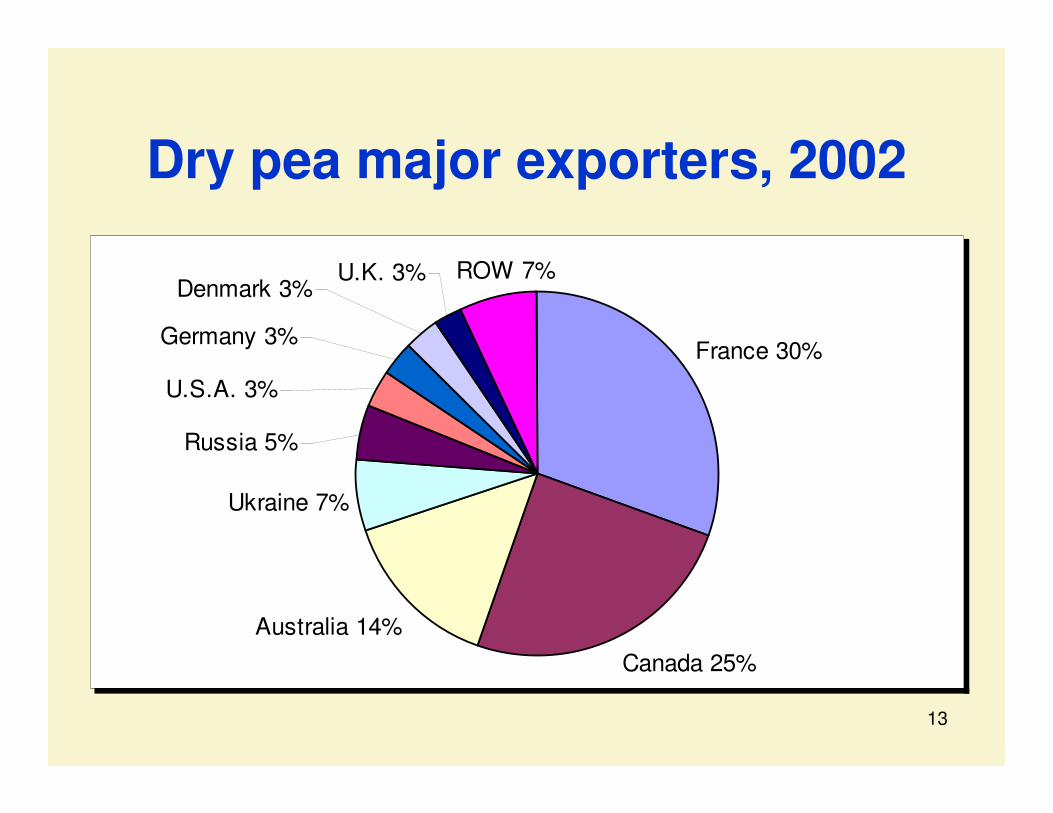
Dry pea major exporters, 2002
France 30%
Canada 25%Australia 14%
Ukraine 7%
Denmark 3%U.K. 3% ROW 7%
U.S.A. 3%
Germany 3%
Russia 5%
14
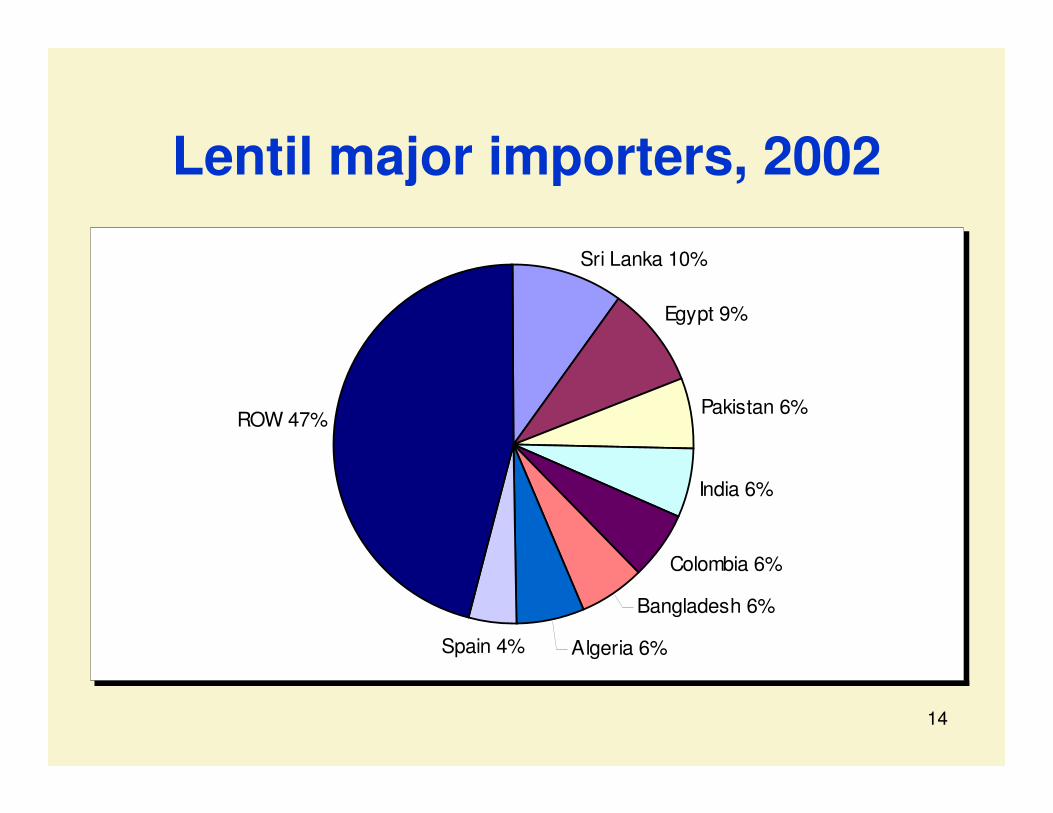
Lentil major importers, 2002
Egypt 9%
Pakistan 6%
India 6%
Colombia 6%
Bangladesh 6%
Algeria 6%Spain 4%
ROW 47%
Sri Lanka 10%
15
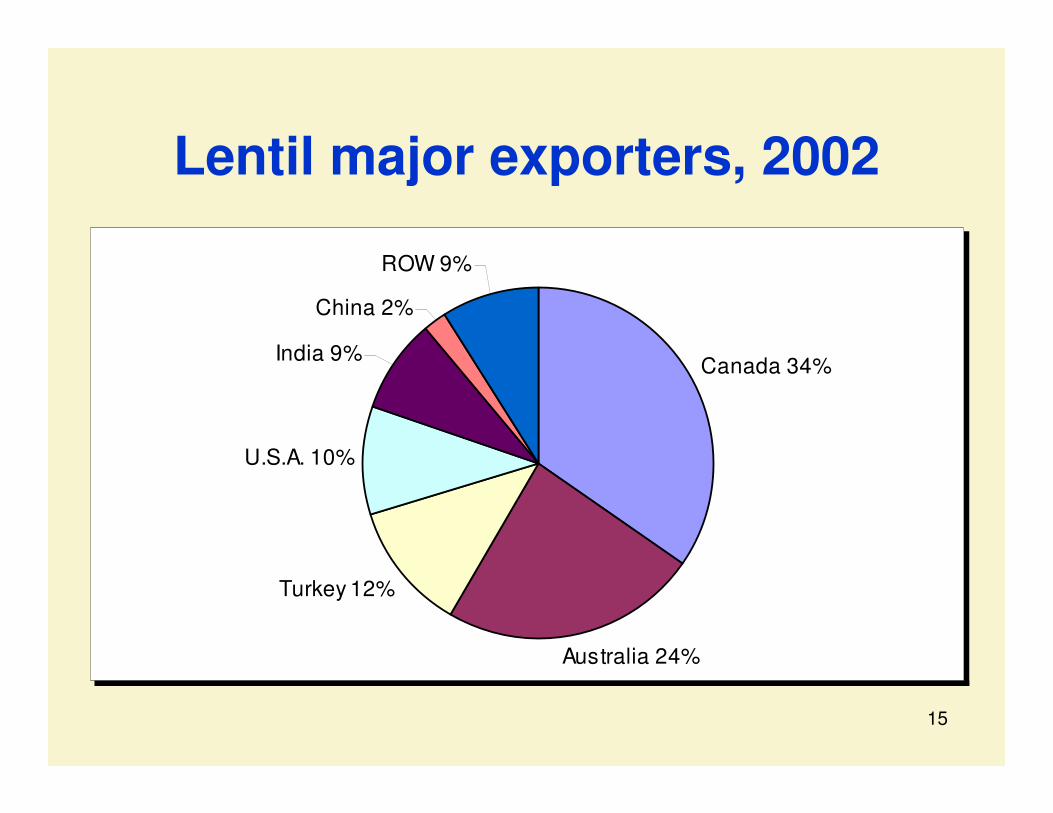
Canada 34%
Australia 24%
Turkey 12%
U.S.A. 10%
China 2%
ROW 9%
India 9%
Lentil major exporters, 2002
16
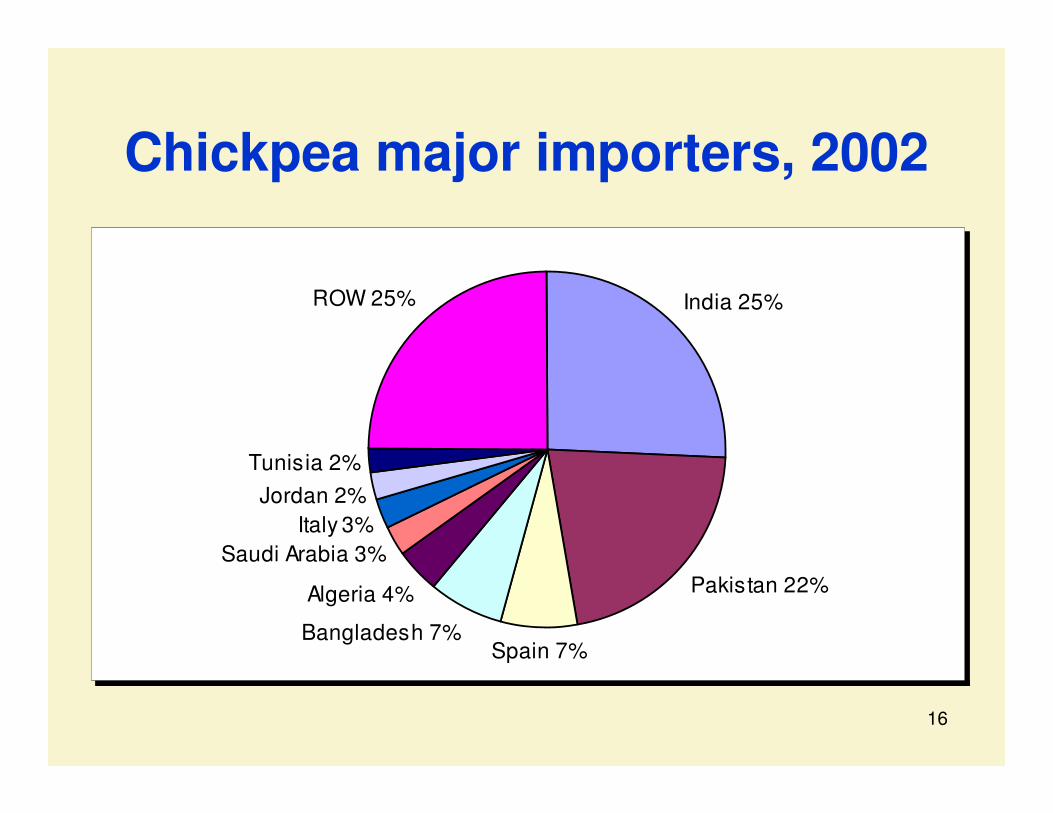
Chickpea major importers, 2002
India 25%
Pakistan 22%
Spain 7%Bangladesh 7%
Algeria 4%
Saudi Arabia 3%Italy 3%
Jordan 2%Tunisia 2%
ROW 25%
17
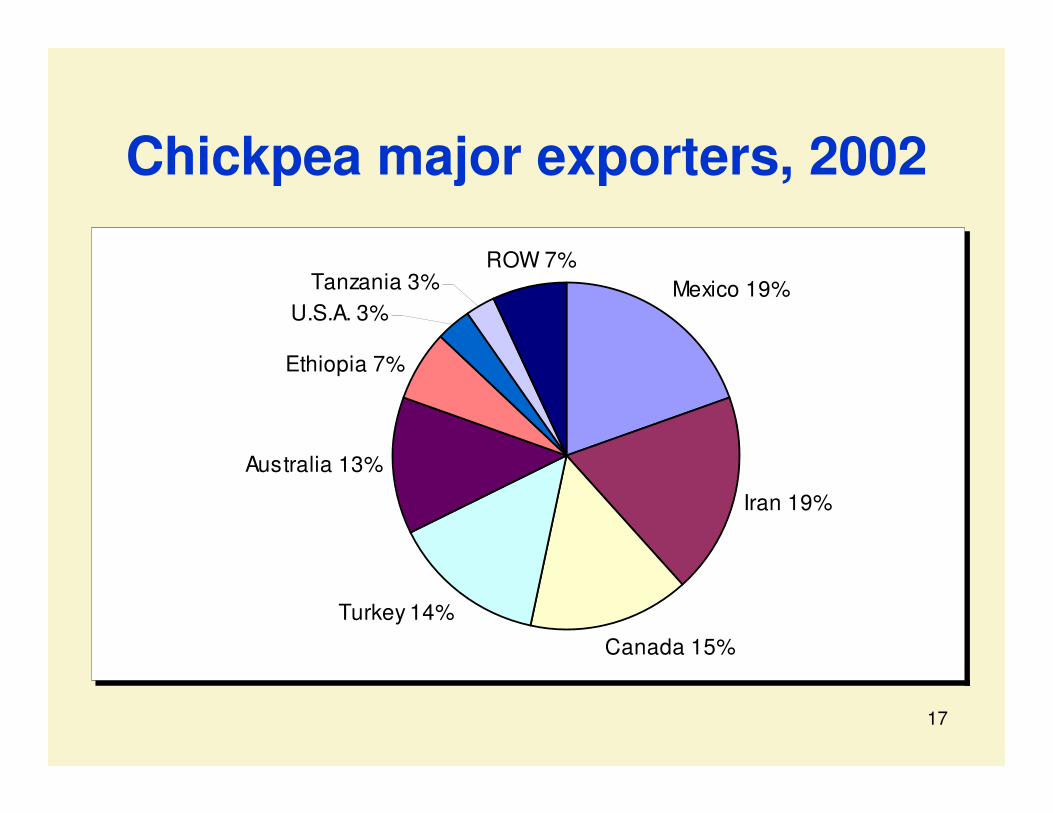
Chickpea major exporters, 2002
Mexico 19%
Iran 19%
Canada 15%
Turkey 14%
Australia 13%
ROW 7%Tanzania 3%
U.S.A. 3%
Ethiopia 7%
18
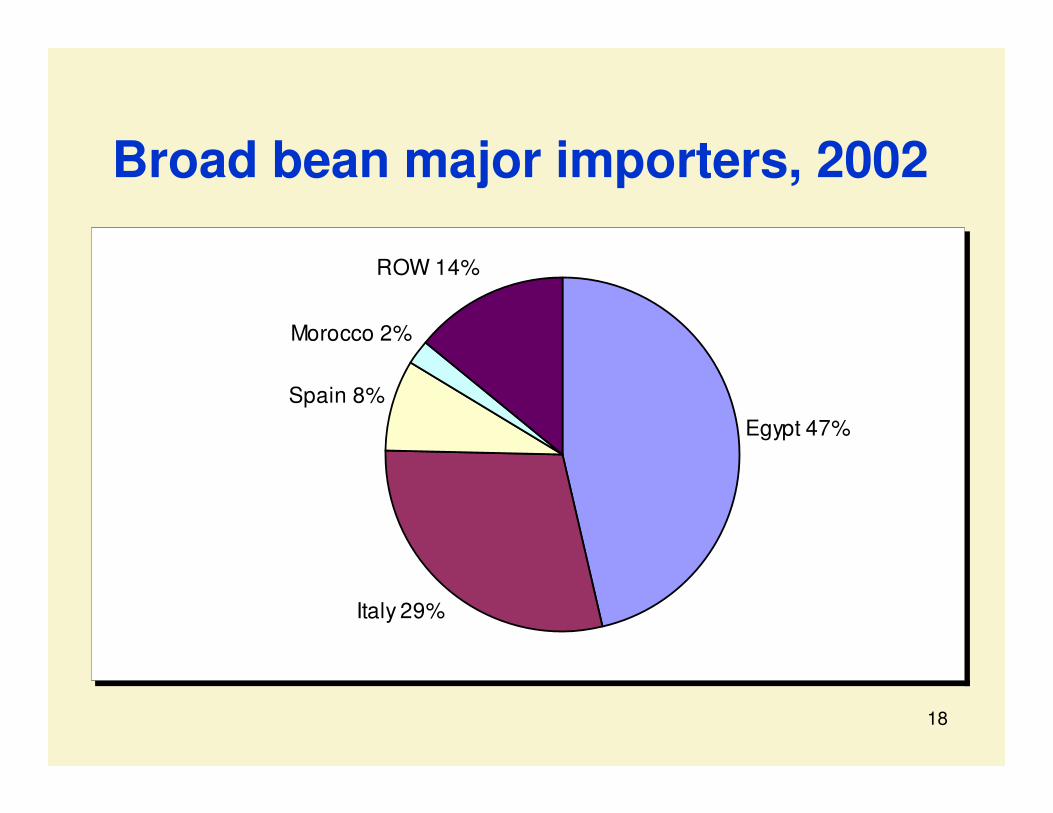
Broad bean major importers, 2002
Egypt 47%
Italy 29%
Spain 8%
Morocco 2%
ROW 14%
19
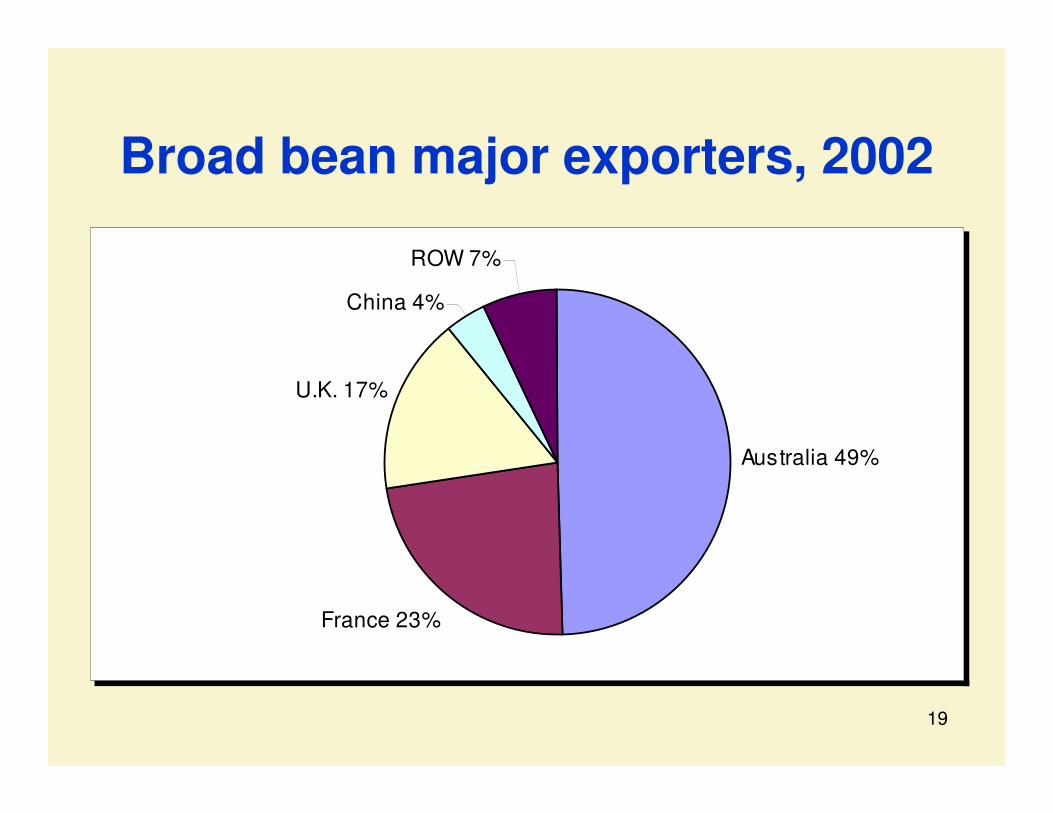
Broad bean major exporters, 2002
Australia 49%
France 23%
U.K. 17%
China 4%
ROW 7%
20
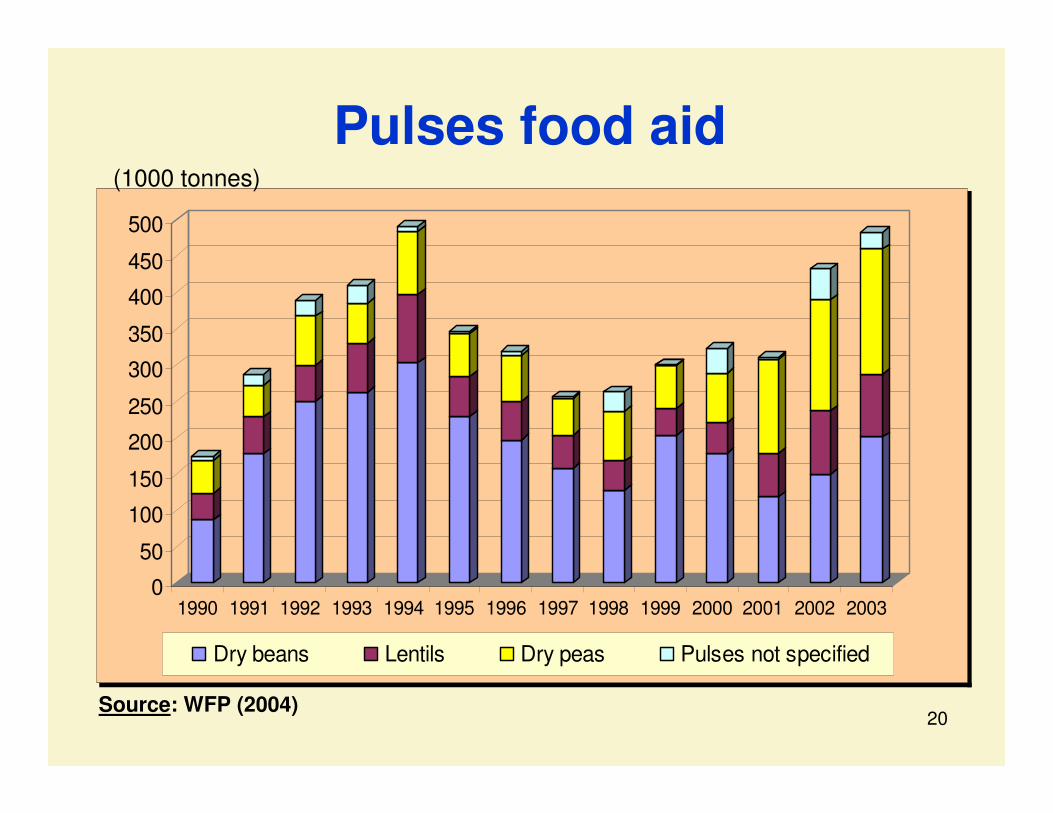
Pulses food aid
0
50
100
150
200
250
300
350
400
450
500
1990 1991 1992 1993 1994 1995 1996 1997 1998 1999 2000 2001 2002 2003
Dry beans Lentils Dry peas Pulses not specified
Source: WFP (2004)
(1000 tonnes)
21
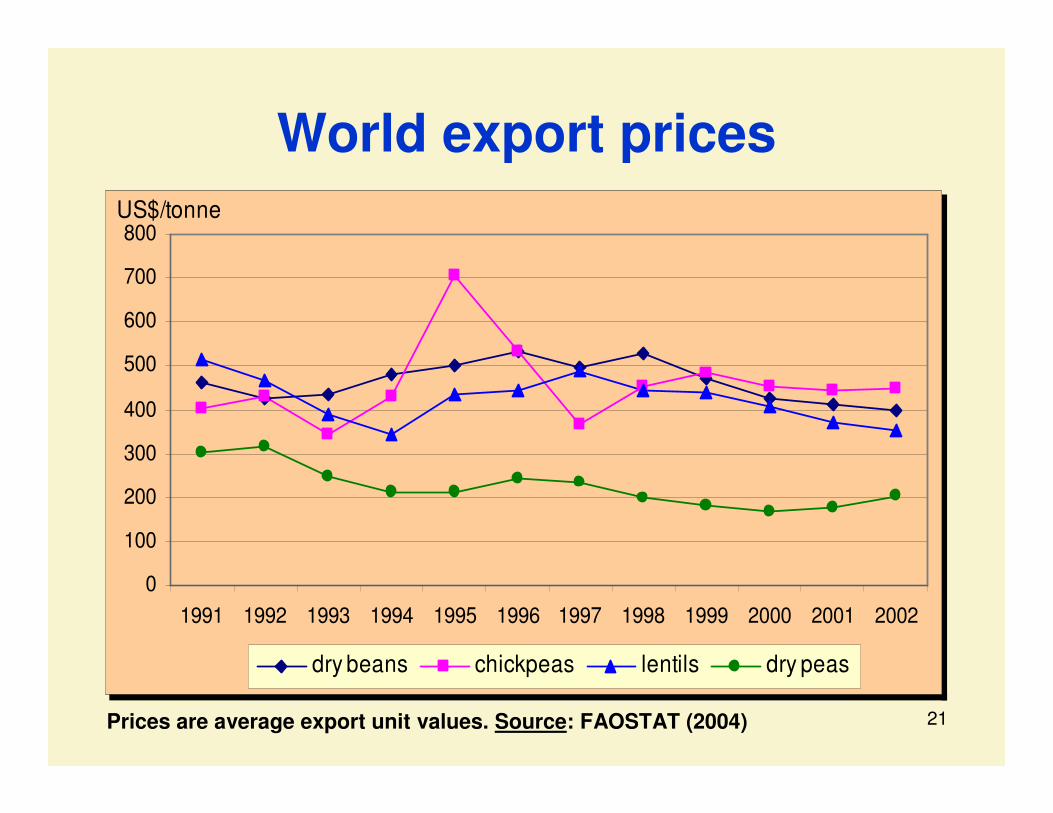
World export prices
0
100
200
300
400
500
600
700
800
1991 1992 1993 1994 1995 1996 1997 1998 1999 2000 2001 2002
US$/tonne
dry beans chickpeas lentils dry peas
Prices are average export unit values. Source: FAOSTAT (2004)
22
Our market outlook for 2004Our market outlook for 2004
� our assessment is based on market information available to us as of May 2004
� unfortunately information on pulses is not easy to obtain
� the general assumption is normal weather conditions throughout the remainder of the seasons
� important to note there is always uncertainty associated with any market outlook
23
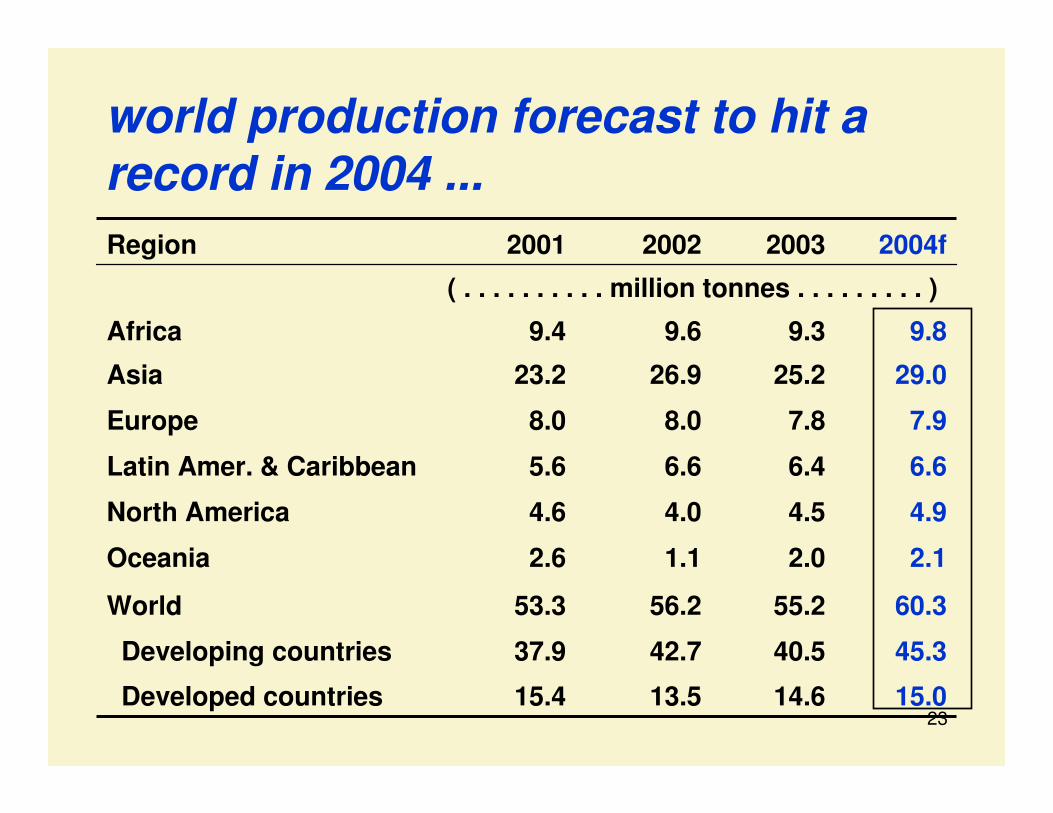
world production forecast to hit a record in 2004 ...
( . . . . . . . . . . million tonnes . . . . . . . . . )
15.014.613.515.4Developed countries
45.340.542.737.9Developing countries
60.355.256.253.3World
2.12.01.12.6Oceania
4.94.54.04.6North America
6.66.46.65.6Latin Amer. & Caribbean
7.97.88.08.0Europe
29.025.226.923.2Asia
9.89.39.69.4Africa
2004f200320022001Region
24
... improved global supplies to boost consumption ...
� total pulse utilization in 2004 is forecast at about 59 million tonnes:- food use: 39 million tonnes- feed use: 13 million tonnes- the rest: seed + other uses
� for developing countries, the increase in pulse utilization is mostly food; while in developed countries, it is mostly feed
25
... overall trade set to grow ...
� global trade in pulses in 2004 is forecast at 10 million tonnes, 9% up from 2003
� the increase in trade is due to:– large exportable supplies in major exporting
countries– strong import demand by countries in South
Asia, Middle East and North Africa, prompted largely by increasing incomes

26
- U.S. prices -
0
100
200
300
400
500
600
700
01/0
3
02/0
3
03/0
3
04/0
3
05/0
3
06/0
3
07/0
3
08/0
3
09/0
3
10/0
3
11/0
3
12/0
3
01/0
4
02/0
4
03/0
4
US$/tonne
dry beans green peas yellow peas lentils
Dealer prices, except dry beans grower pricesSource: USDA, April 2004
... prices, recent trends ...
27
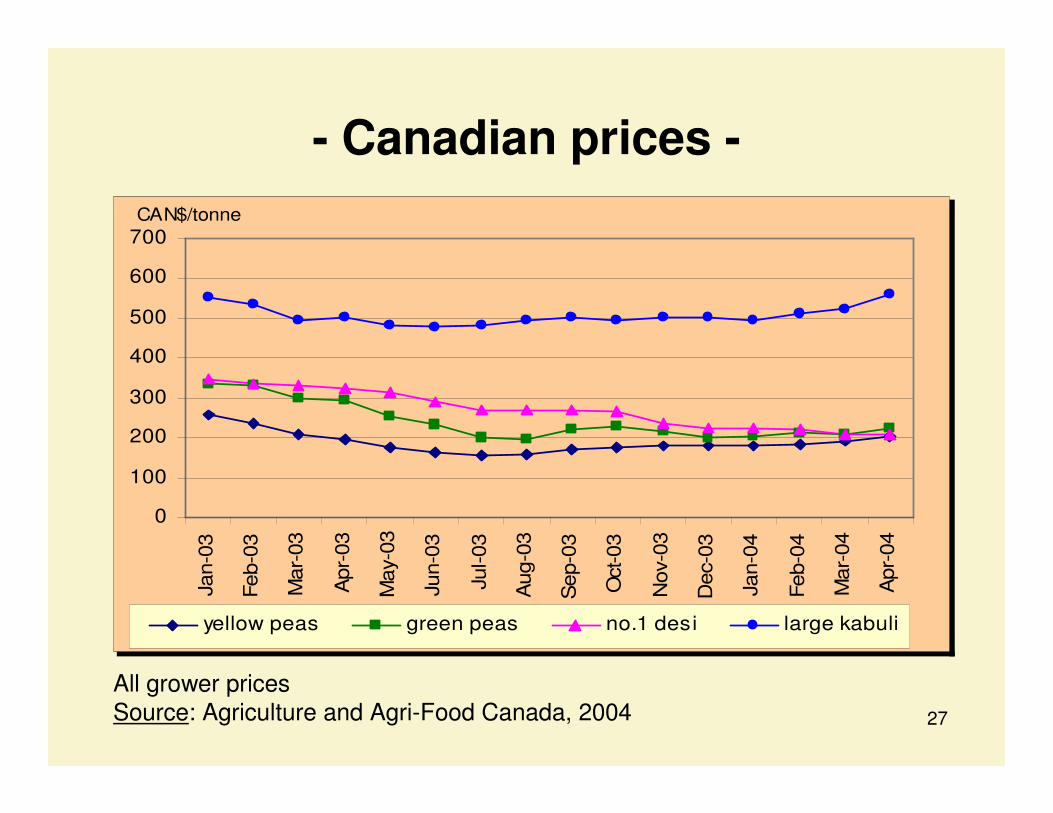
- Canadian prices -
0
100
200
300
400
500
600
700
Jan-
03
Feb-
03
Mar
-03
Apr
-03
May
-03
Jun-
03
Jul-0
3
Aug
-03
Sep
-03
Oct
-03
Nov
-03
Dec
-03
Jan-
04
Feb-
04
Mar
-04
Apr
-04
CAN$/tonne
yellow peas green peas no.1 desi large kabuli
All grower pricesSource: Agriculture and Agri-Food Canada, 2004
28
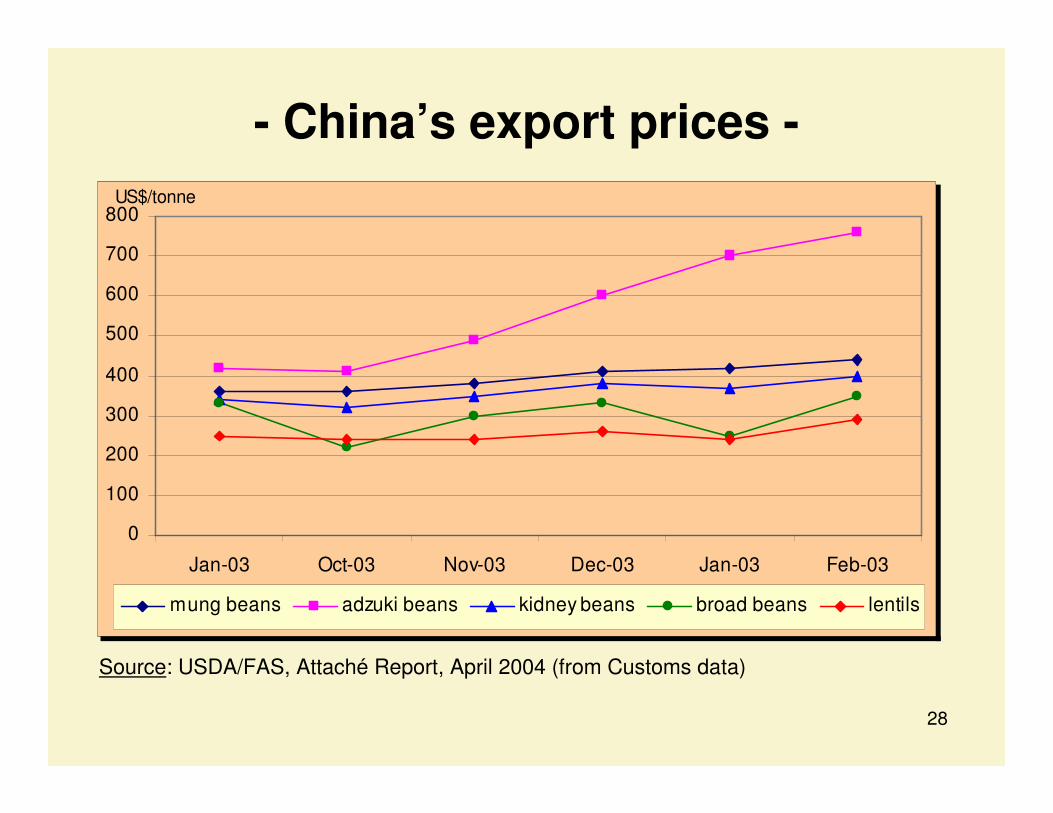
- China’s export prices -
0
100
200
300
400
500
600
700
800
Jan-03 Oct-03 Nov-03 Dec-03 Jan-03 Feb-03
US$/tonne
mung beans adzuki beans kidney beans broad beans lentils
Source: USDA/FAS, Attaché Report, April 2004 (from Customs data)
29
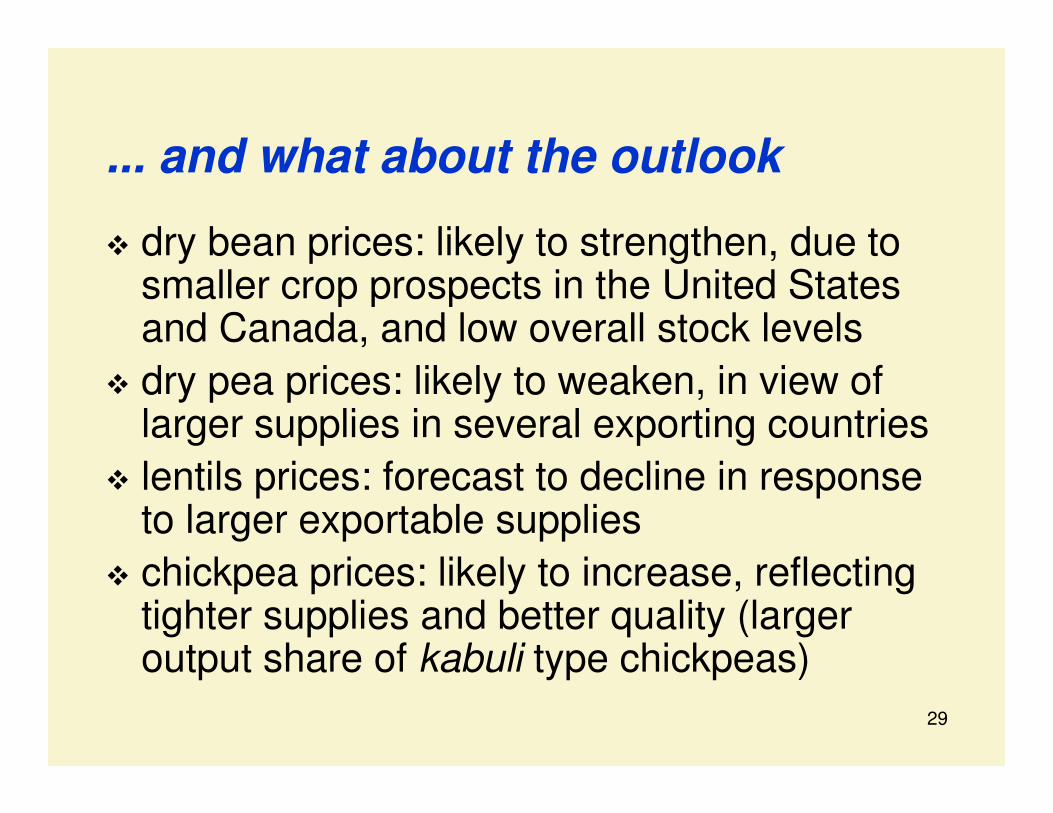
... and what about the outlook
� dry bean prices: likely to strengthen, due to smaller crop prospects in the United States and Canada, and low overall stock levels
� dry pea prices: likely to weaken, in view of larger supplies in several exporting countries
� lentils prices: forecast to decline in response to larger exportable supplies
� chickpea prices: likely to increase, reflecting tighter supplies and better quality (larger output share of kabuli type chickpeas)
30
Emerging issues in pulse trade� SPS measures:
amidst growth in pulse import and export sectors and further dismantling of trade barriers, there is a growing need to keep the industry up to date with the prevailing sanitary and phyto-sanitary standards.
� Quality standards (branding):- with the growing consumer awareness about food, it is important that branded pulses become a normal practice in business – IPQC.- global trade should be enhanced through the establishment of standard brands of pulses.