the globalization of the wine industry: …user globalization of the wine industry: implications for...
TRANSCRIPT
THE GLOBALIZATION OF THE WINE INDUSTRY: IMPLICATIONS FOR OLD AND NEW WORLD PRODUCERS
Susan Cholette, Ph.D., San Francisco State University
Richard M. Castaldi, Ph.D., San Francisco State University April Fredrick, San Francisco State University
Overview
The concept of industry globalization involves the movement in active competition toward a worldwide marketplace environment, the integration of national markets, and leading rivals competing head to head in different countries for worldwide leadership. Through a review of academic, trade and popular press articles and an analysis of recent industry data, this paper explores the globalizing forces that are currently reshaping the wine industry and how different wine regions and the producers therein are reacting to or anticipating the changes. As recently as ten years ago, the industry was highly fragmented. Wine producers in different countries were isolated from each other, and most of the world’s wine drinkers consumed either local wines or imports from nearby producers, such as the United Kingdom’s historical penchant for French wine. As winemakers had minimal cross-border interaction, they followed their own traditions. The wine industry has changed dramatically in recent years. Decreases in tariffs, logistical cost reductions and the lowering of other barriers to international trade have provided producers the opportunity to sell their products outside of a limited region, as well as face competition from distant suppliers. Wines from around the world are desired and sought after by consumers. This new international access is reshaping how wines are produced and consumed alike, and those able to adapt to this wider playing field will gain significant competitive advantage. The purpose of this research effort is to 1) profile the major wine producing countries 2) identify the primary driving forces and key success factors shaping the global wine industry and 3) to identify which countries are best positioned to successfully capitalize on the opportunities and counter the challenges brought by globalization and the other driving forces in the wine industry.
Profiles of Country Producers To understand the different major players in the market this section examines several large wine producing nations. While all countries have their own distinct winemaking styles, cultural and business climates, this paper categorizes producers as either Old World or New World countries. The Old World producers, defined as those within Europe, have a long, uninterrupted history of wine production and consumption. The second smallest continent, Europe produced 73% of all wine in 2001. The four largest European producers, France, Italy, Spain and Germany, accounted for 73% of European wine production and 54% of global production (Table 1). New World wine producing countries are defined as those outside of Europe. Five of the largest and most established New World producers are the United States, Argentina, Australia, South Africa and Chile. These five countries comprised 82% of non-European volume and 23% of global production in 2001. These four Old World and five New World countries accounted for
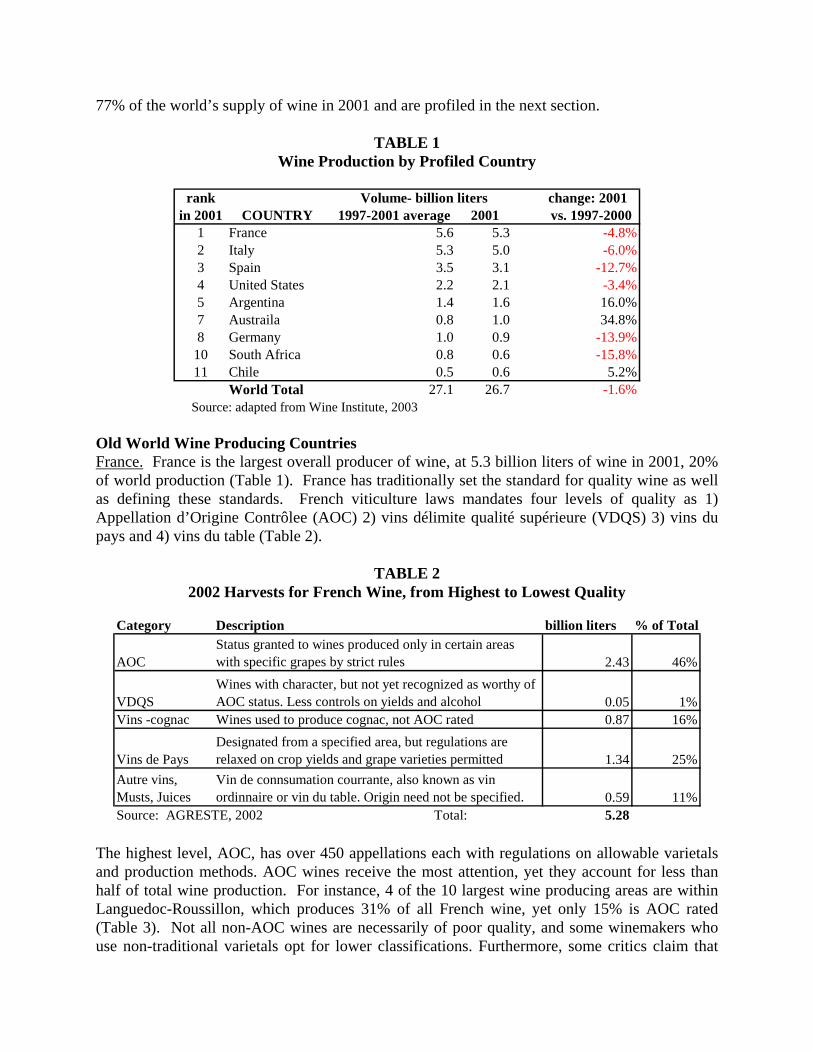
77% of the world’s supply of wine in 2001 and are profiled in the next section.
TABLE 1 Wine Production by Profiled Country
rank change: 2001
in 2001 COUNTRY 1997-2001 average 2001 vs. 1997-20001 France 5.6 5.3 -4.8%
-6.0%-12.7%
-3.4%
-13.9%-15.8%
-1.6%
2 Italy 5.3 5.03 Spain 3.5 3.14 United States 2.2 2.15 Argentina 1.4 1.6 16.0%7 Austraila 0.8 1.0 34.8%8 Germany 1.0 0.9
10 South Africa 0.8 0.611 Chile 0.5 0.6 5.2%
World Total 27.1 26.7
Volume- billion liters
Source: adapted from Wine Institute, 2003 Old World Wine Producing Countries France. France is the largest overall producer of wine, at 5.3 billion liters of wine in 2001, 20% of world production (Table 1). France has traditionally set the standard for quality wine as well as defining these standards. French viticulture laws mandates four levels of quality as 1) Appellation d’Origine Contrôlee (AOC) 2) vins délimite qualité supérieure (VDQS) 3) vins du pays and 4) vins du table (Table 2).
TABLE 2 2002 Harvests for French Wine, from Highest to Lowest Quality
Category Description billion liters % of Total
AOCStatus granted to wines produced only in certain areas with specific grapes by strict rules 2.43 46%
VDQSWines with character, but not yet recognized as worthy of AOC status. Less controls on yields and alcohol 0.05 1%
Vins -cognac Wines used to produce cognac, not AOC rated 0.87 16%
Vins de PaysDesignated from a specified area, but regulations are relaxed on crop yields and grape varieties permitted 1.34 25%
Autre vins, Musts, Juices
Vin de connsumation courrante, also known as vin ordinnaire or vin du table. Origin need not be specified. 0.59 11%
Source: AGRESTE, 2002 Total: 5.28 The highest level, AOC, has over 450 appellations each with regulations on allowable varietals and production methods. AOC wines receive the most attention, yet they account for less than half of total wine production. For instance, 4 of the 10 largest wine producing areas are within Languedoc-Roussillon, which produces 31% of all French wine, yet only 15% is AOC rated (Table 3). Not all non-AOC wines are necessarily of poor quality, and some winemakers who use non-traditional varietals opt for lower classifications. Furthermore, some critics claim that

many AOC wines are mediocre; generic Bordeaux have been dogged by accusations of falling quality (Lechmere, 2004). While France has a few large wine companies such as Castel Frères and LVMH, production is dominated by small scale wineries; Bordeaux alone has over 20,000 producers (Echikson et al, 2001).
TABLE 3 2002 Production of Wine in France, Shown for the Top Departments
Volume- billion liters Rank by Rank (of Top
Department All Wine AOC % AOC Volume 14) by %AOCHerault Languedoc 0.66 0.08 12% 1 12Gironde Bordeaux 0.61 0.59 97% 2 2Aude Languedoc 0.48 0.11 22% 3 11Charente-Maritime Cognac 0.46 0.00 0% 4 ---Charente Cognac 0.44 0.00 0% 5 ---Gard Languedoc 0.37 0.09 25% 6 10Vaucluse 0.25 0.18 73% 7 6Marne Champagne 0.17 0.17 100% 8 1Pyrenees-Orientales Languedoc 0.14 0.07 52% 9 9Var 0.14 0.09 70% 10 7Rhone 0.13 0.12 97% 11 3Maine-et-Loire 0.12 0.09 81% 12 4Loire Atlantic 0.11 0.08 67% 13 8Drome 0.09 0.07 78% 14 5Total: 14 Departments 4.15 1.75 42%Total France 5.28 2.43 46%% of Total from the 14 Departments 79% 72% Source: AGRESTE, 2002 France took first place in total wine consumption at 3.4 billion liters a year in 2001 (Table 4). Per-capita annual consumption in 2001 was also the highest world-wide at 57 liters (Table 5). Impressive as these figures are, Table 5 also shows that France’s wine consumption is in decline. In fact, per-capita consumption fifty years ago was more than double that of today, at 120 liters (Echikson et al, 2001). At 1.6 billion liters, 23% of global wine exports, France is the number two exporter of wine behind Italy (Table 6). However French dominance is waning as exports are decreasing; during the 2000-2003 timeframe French wine imports to the US decreased in volume by 34% and in revenue by 15% (Table 7). Likewise, in the same period France’s share of the UK wine market dropped from 43% to 25% in 2003 with demand shifting toward New World wines, which comprised 43% of the UK market in 2002 (Heijbroek, 2003).
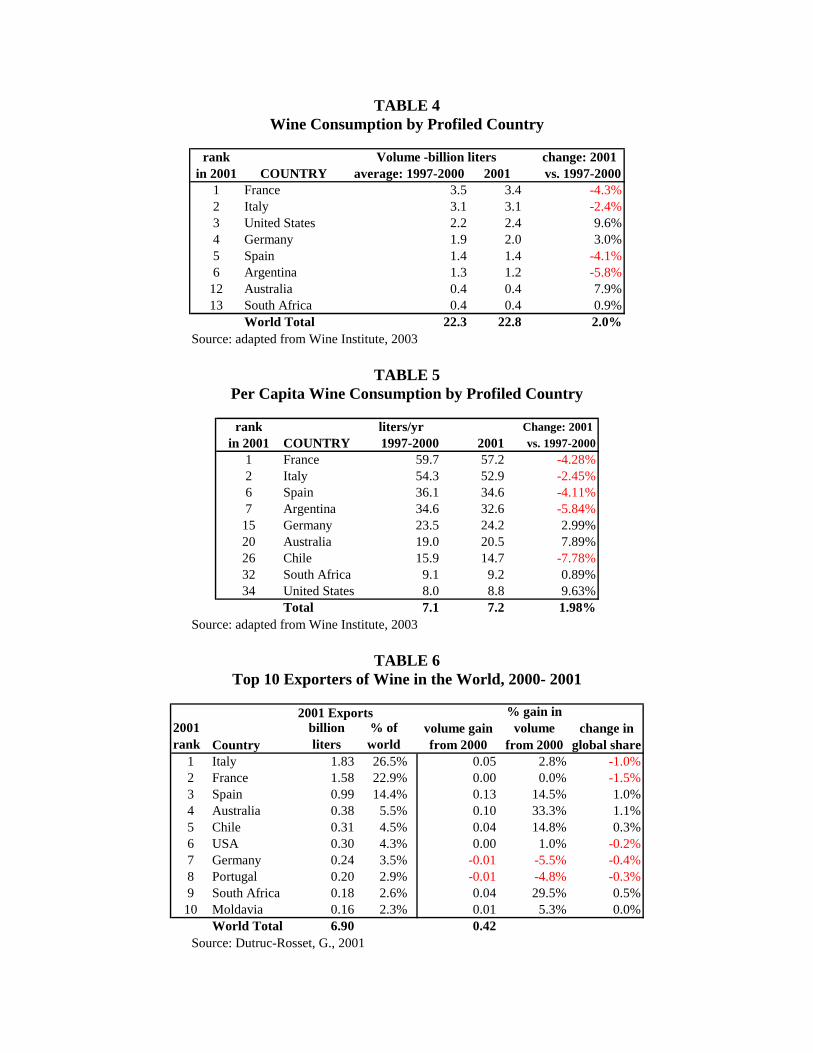
TABLE 4 Wine Consumption by Profiled Country
rank change: 2001
in 2001 COUNTRY average: 1997-2000 2001 vs. 1997-20001 France 3.5 3.4 -4.3%
-2.4%
-4.1%-5.8%
2 Italy 3.1 3.13 United States 2.2 2.4 9.6%4 Germany 1.9 2.0 3.0%5 Spain 1.4 1.46 Argentina 1.3 1.2
12 Australia 0.4 0.4 7.9%13 South Africa 0.4 0.4 0.9%
World Total 22.3 22.8 2.0%
Volume -billion liters
Source: adapted from Wine Institute, 2003
TABLE 5 Per Capita Wine Consumption by Profiled Country
rank liters/yr Change: 2001
in 2001 COUNTRY 1997-2000 2001 vs. 1997-20001 France 59.7 57.2 -4.28%
-2.45%-4.11%-5.84%
-7.78%
2 Italy 54.3 52.96 Spain 36.1 34.67 Argentina 34.6 32.6
15 Germany 23.5 24.2 2.99%20 Australia 19.0 20.5 7.89%26 Chile 15.9 14.732 South Africa 9.1 9.2 0.89%34 United States 8.0 8.8 9.63%
Total 7.1 7.2 1.98% Source: adapted from Wine Institute, 2003
TABLE 6 Top 10 Exporters of Wine in the World, 2000- 2001
2001 Exports
2001 rank Country
billion liters
% of world
1 Italy 1.83 26.5% 0.05 2.8% -1.0%-1.5%
-0.2%-0.01 -5.5% -0.4%-0.01 -4.8% -0.3%
2 France 1.58 22.9% 0.00 0.0%3 Spain 0.99 14.4% 0.13 14.5% 1.0%4 Australia 0.38 5.5% 0.10 33.3% 1.1%5 Chile 0.31 4.5% 0.04 14.8% 0.3%6 USA 0.30 4.3% 0.00 1.0%7 Germany 0.24 3.5%8 Portugal 0.20 2.9%9 South Africa 0.18 2.6% 0.04 29.5% 0.5%
10 Moldavia 0.16 2.3% 0.01 5.3% 0.0%World Total 6.90 0.42
volume gain from 2000
change in global share
% gain in volume
from 2000
Source: Dutruc-Rosset, G., 2001
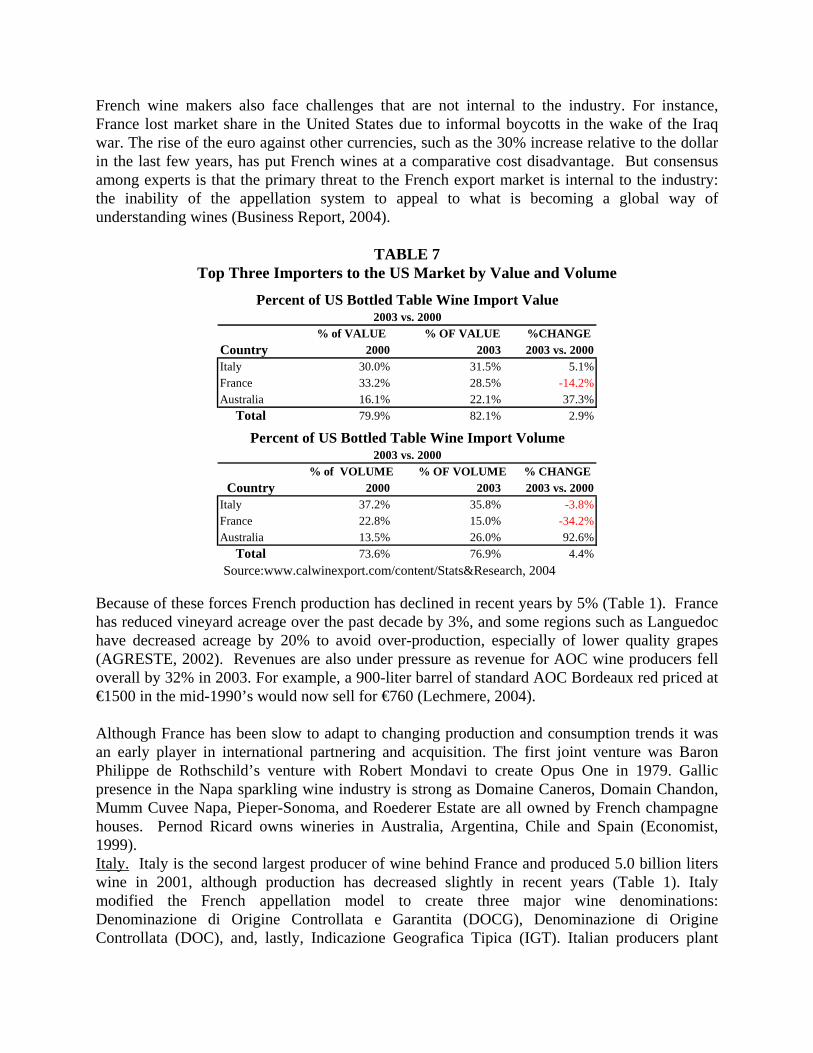
French wine makers also face challenges that are not internal to the industry. For instance, France lost market share in the United States due to informal boycotts in the wake of the Iraq war. The rise of the euro against other currencies, such as the 30% increase relative to the dollar in the last few years, has put French wines at a comparative cost disadvantage. But consensus among experts is that the primary threat to the French export market is internal to the industry: the inability of the appellation system to appeal to what is becoming a global way of understanding wines (Business Report, 2004).
TABLE 7 Top Three Importers to the US Market by Value and Volume
% of VALUE % OF VALUE %CHANGE Country 2000 2003 2003 vs. 2000Italy 30.0% 31.5% 5.1%France 33.2% 28.5% -14.2%
-3.8%-34.2%
Australia 16.1% 22.1% 37.3%Total 79.9% 82.1% 2.9%
% of VOLUME % OF VOLUME % CHANGE Country 2000 2003 2003 vs. 2000
Italy 37.2% 35.8%France 22.8% 15.0%Australia 13.5% 26.0% 92.6%
Total 73.6% 76.9% 4.4%
2003 vs. 2000
Percent of US Bottled Table Wine Import Value2003 vs. 2000
Percent of US Bottled Table Wine Import Volume
Source:www.calwinexport.com/content/Stats&Research, 2004 Because of these forces French production has declined in recent years by 5% (Table 1). France has reduced vineyard acreage over the past decade by 3%, and some regions such as Languedoc have decreased acreage by 20% to avoid over-production, especially of lower quality grapes (AGRESTE, 2002). Revenues are also under pressure as revenue for AOC wine producers fell overall by 32% in 2003. For example, a 900-liter barrel of standard AOC Bordeaux red priced at €1500 in the mid-1990’s would now sell for €760 (Lechmere, 2004). Although France has been slow to adapt to changing production and consumption trends it was an early player in international partnering and acquisition. The first joint venture was Baron Philippe de Rothschild’s venture with Robert Mondavi to create Opus One in 1979. Gallic presence in the Napa sparkling wine industry is strong as Domaine Caneros, Domain Chandon, Mumm Cuvee Napa, Pieper-Sonoma, and Roederer Estate are all owned by French champagne houses. Pernod Ricard owns wineries in Australia, Argentina, Chile and Spain (Economist, 1999). Italy. Italy is the second largest producer of wine behind France and produced 5.0 billion liters wine in 2001, although production has decreased slightly in recent years (Table 1). Italy modified the French appellation model to create three major wine denominations: Denominazione di Origine Controllata e Garantita (DOCG), Denominazione di Origine Controllata (DOC), and, lastly, Indicazione Geografica Tipica (IGT). Italian producers plant
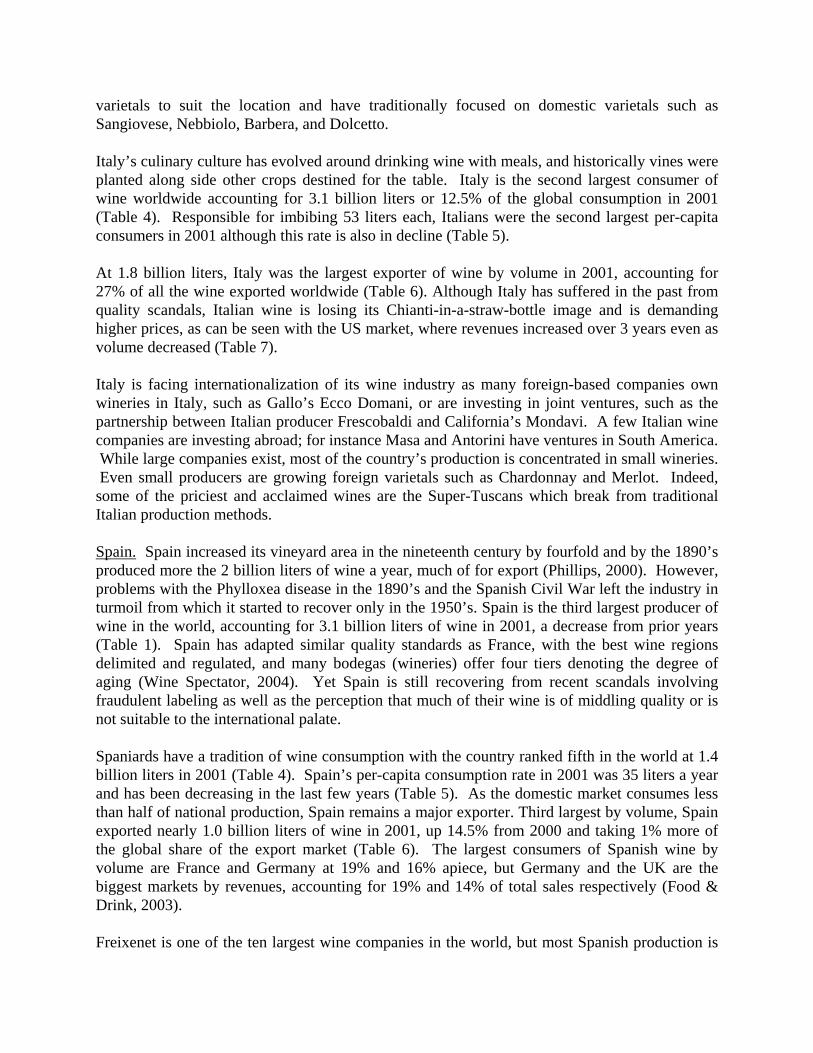
varietals to suit the location and have traditionally focused on domestic varietals such as Sangiovese, Nebbiolo, Barbera, and Dolcetto. Italy’s culinary culture has evolved around drinking wine with meals, and historically vines were planted along side other crops destined for the table. Italy is the second largest consumer of wine worldwide accounting for 3.1 billion liters or 12.5% of the global consumption in 2001 (Table 4). Responsible for imbibing 53 liters each, Italians were the second largest per-capita consumers in 2001 although this rate is also in decline (Table 5). At 1.8 billion liters, Italy was the largest exporter of wine by volume in 2001, accounting for 27% of all the wine exported worldwide (Table 6). Although Italy has suffered in the past from quality scandals, Italian wine is losing its Chianti-in-a-straw-bottle image and is demanding higher prices, as can be seen with the US market, where revenues increased over 3 years even as volume decreased (Table 7). Italy is facing internationalization of its wine industry as many foreign-based companies own wineries in Italy, such as Gallo’s Ecco Domani, or are investing in joint ventures, such as the partnership between Italian producer Frescobaldi and California’s Mondavi. A few Italian wine companies are investing abroad; for instance Masa and Antorini have ventures in South America. While large companies exist, most of the country’s production is concentrated in small wineries. Even small producers are growing foreign varietals such as Chardonnay and Merlot. Indeed, some of the priciest and acclaimed wines are the Super-Tuscans which break from traditional Italian production methods. Spain. Spain increased its vineyard area in the nineteenth century by fourfold and by the 1890’s produced more the 2 billion liters of wine a year, much of for export (Phillips, 2000). However, problems with the Phylloxea disease in the 1890’s and the Spanish Civil War left the industry in turmoil from which it started to recover only in the 1950’s. Spain is the third largest producer of wine in the world, accounting for 3.1 billion liters of wine in 2001, a decrease from prior years (Table 1). Spain has adapted similar quality standards as France, with the best wine regions delimited and regulated, and many bodegas (wineries) offer four tiers denoting the degree of aging (Wine Spectator, 2004). Yet Spain is still recovering from recent scandals involving fraudulent labeling as well as the perception that much of their wine is of middling quality or is not suitable to the international palate. Spaniards have a tradition of wine consumption with the country ranked fifth in the world at 1.4 billion liters in 2001 (Table 4). Spain’s per-capita consumption rate in 2001 was 35 liters a year and has been decreasing in the last few years (Table 5). As the domestic market consumes less than half of national production, Spain remains a major exporter. Third largest by volume, Spain exported nearly 1.0 billion liters of wine in 2001, up 14.5% from 2000 and taking 1% more of the global share of the export market (Table 6). The largest consumers of Spanish wine by volume are France and Germany at 19% and 16% apiece, but Germany and the UK are the biggest markets by revenues, accounting for 19% and 14% of total sales respectively (Food & Drink, 2003). Freixenet is one of the ten largest wine companies in the world, but most Spanish production is
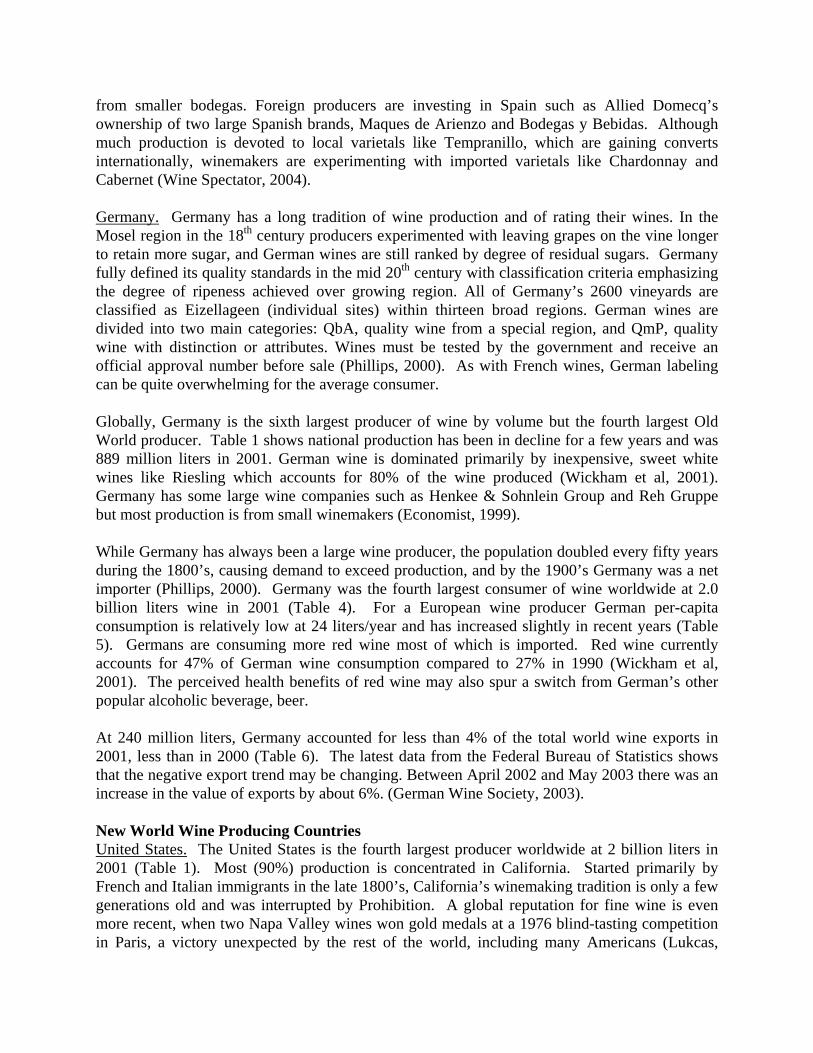
from smaller bodegas. Foreign producers are investing in Spain such as Allied Domecq’s ownership of two large Spanish brands, Maques de Arienzo and Bodegas y Bebidas. Although much production is devoted to local varietals like Tempranillo, which are gaining converts internationally, winemakers are experimenting with imported varietals like Chardonnay and Cabernet (Wine Spectator, 2004). Germany. Germany has a long tradition of wine production and of rating their wines. In the Mosel region in the 18th century producers experimented with leaving grapes on the vine longer to retain more sugar, and German wines are still ranked by degree of residual sugars. Germany fully defined its quality standards in the mid 20th century with classification criteria emphasizing the degree of ripeness achieved over growing region. All of Germany’s 2600 vineyards are classified as Eizellageen (individual sites) within thirteen broad regions. German wines are divided into two main categories: QbA, quality wine from a special region, and QmP, quality wine with distinction or attributes. Wines must be tested by the government and receive an official approval number before sale (Phillips, 2000). As with French wines, German labeling can be quite overwhelming for the average consumer. Globally, Germany is the sixth largest producer of wine by volume but the fourth largest Old World producer. Table 1 shows national production has been in decline for a few years and was 889 million liters in 2001. German wine is dominated primarily by inexpensive, sweet white wines like Riesling which accounts for 80% of the wine produced (Wickham et al, 2001). Germany has some large wine companies such as Henkee & Sohnlein Group and Reh Gruppe but most production is from small winemakers (Economist, 1999). While Germany has always been a large wine producer, the population doubled every fifty years during the 1800’s, causing demand to exceed production, and by the 1900’s Germany was a net importer (Phillips, 2000). Germany was the fourth largest consumer of wine worldwide at 2.0 billion liters wine in 2001 (Table 4). For a European wine producer German per-capita consumption is relatively low at 24 liters/year and has increased slightly in recent years (Table 5). Germans are consuming more red wine most of which is imported. Red wine currently accounts for 47% of German wine consumption compared to 27% in 1990 (Wickham et al, 2001). The perceived health benefits of red wine may also spur a switch from German’s other popular alcoholic beverage, beer. At 240 million liters, Germany accounted for less than 4% of the total world wine exports in 2001, less than in 2000 (Table 6). The latest data from the Federal Bureau of Statistics shows that the negative export trend may be changing. Between April 2002 and May 2003 there was an increase in the value of exports by about 6%. (German Wine Society, 2003). New World Wine Producing Countries United States. The United States is the fourth largest producer worldwide at 2 billion liters in 2001 (Table 1). Most (90%) production is concentrated in California. Started primarily by French and Italian immigrants in the late 1800’s, California’s winemaking tradition is only a few generations old and was interrupted by Prohibition. A global reputation for fine wine is even more recent, when two Napa Valley wines won gold medals at a 1976 blind-tasting competition in Paris, a victory unexpected by the rest of the world, including many Americans (Lukcas,
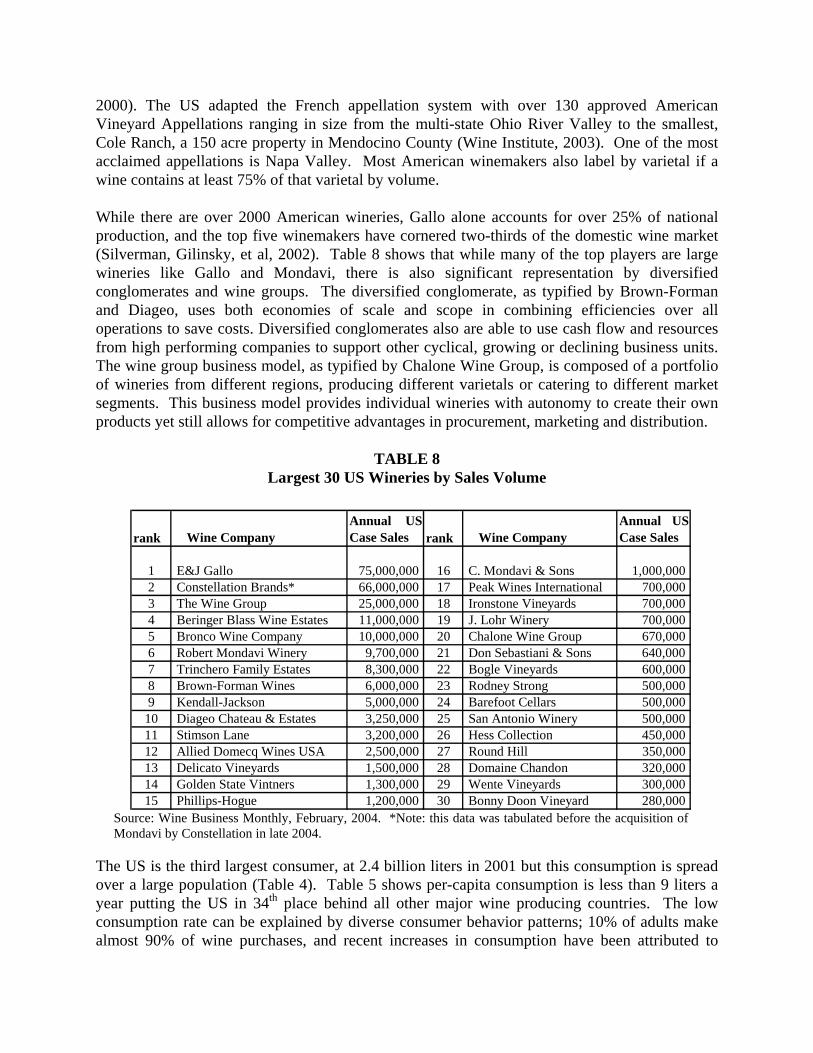
2000). The US adapted the French appellation system with over 130 approved American Vineyard Appellations ranging in size from the multi-state Ohio River Valley to the smallest, Cole Ranch, a 150 acre property in Mendocino County (Wine Institute, 2003). One of the most acclaimed appellations is Napa Valley. Most American winemakers also label by varietal if a wine contains at least 75% of that varietal by volume. While there are over 2000 American wineries, Gallo alone accounts for over 25% of national production, and the top five winemakers have cornered two-thirds of the domestic wine market (Silverman, Gilinsky, et al, 2002). Table 8 shows that while many of the top players are large wineries like Gallo and Mondavi, there is also significant representation by diversified conglomerates and wine groups. The diversified conglomerate, as typified by Brown-Forman and Diageo, uses both economies of scale and scope in combining efficiencies over all operations to save costs. Diversified conglomerates also are able to use cash flow and resources from high performing companies to support other cyclical, growing or declining business units. The wine group business model, as typified by Chalone Wine Group, is composed of a portfolio of wineries from different regions, producing different varietals or catering to different market segments. This business model provides individual wineries with autonomy to create their own products yet still allows for competitive advantages in procurement, marketing and distribution.
TABLE 8 Largest 30 US Wineries by Sales Volume
rank Wine CompanyAnnual USCase Sales rank Wine Company
Annual USCase Sales
1 E&J Gallo 75,000,000 16 C. Mondavi & Sons 1,000,000 2 Constellation Brands* 66,000,000 17 Peak Wines International 700,000 3 The Wine Group 25,000,000 18 Ironstone Vineyards 700,000 4 Beringer Blass Wine Estates 11,000,000 19 J. Lohr Winery 700,000 5 Bronco Wine Company 10,000,000 20 Chalone Wine Group 670,000 6 Robert Mondavi Winery 9,700,000 21 Don Sebastiani & Sons 640,000 7 Trinchero Family Estates 8,300,000 22 Bogle Vineyards 600,000 8 Brown-Forman Wines 6,000,000 23 Rodney Strong 500,000 9 Kendall-Jackson 5,000,000 24 Barefoot Cellars 500,000
10 Diageo Chateau & Estates 3,250,000 25 San Antonio Winery 500,000 11 Stimson Lane 3,200,000 26 Hess Collection 450,000 12 Allied Domecq Wines USA 2,500,000 27 Round Hill 350,000 13 Delicato Vineyards 1,500,000 28 Domaine Chandon 320,000 14 Golden State Vintners 1,300,000 29 Wente Vineyards 300,000 15 Phillips-Hogue 1,200,000 30 Bonny Doon Vineyard 280,000
Source: Wine Business Monthly, February, 2004. *Note: this data was tabulated before the acquisition of Mondavi by Constellation in late 2004.
The US is the third largest consumer, at 2.4 billion liters in 2001 but this consumption is spread over a large population (Table 4). Table 5 shows per-capita consumption is less than 9 liters a year putting the US in 34th place behind all other major wine producing countries. The low consumption rate can be explained by diverse consumer behavior patterns; 10% of adults make almost 90% of wine purchases, and recent increases in consumption have been attributed to
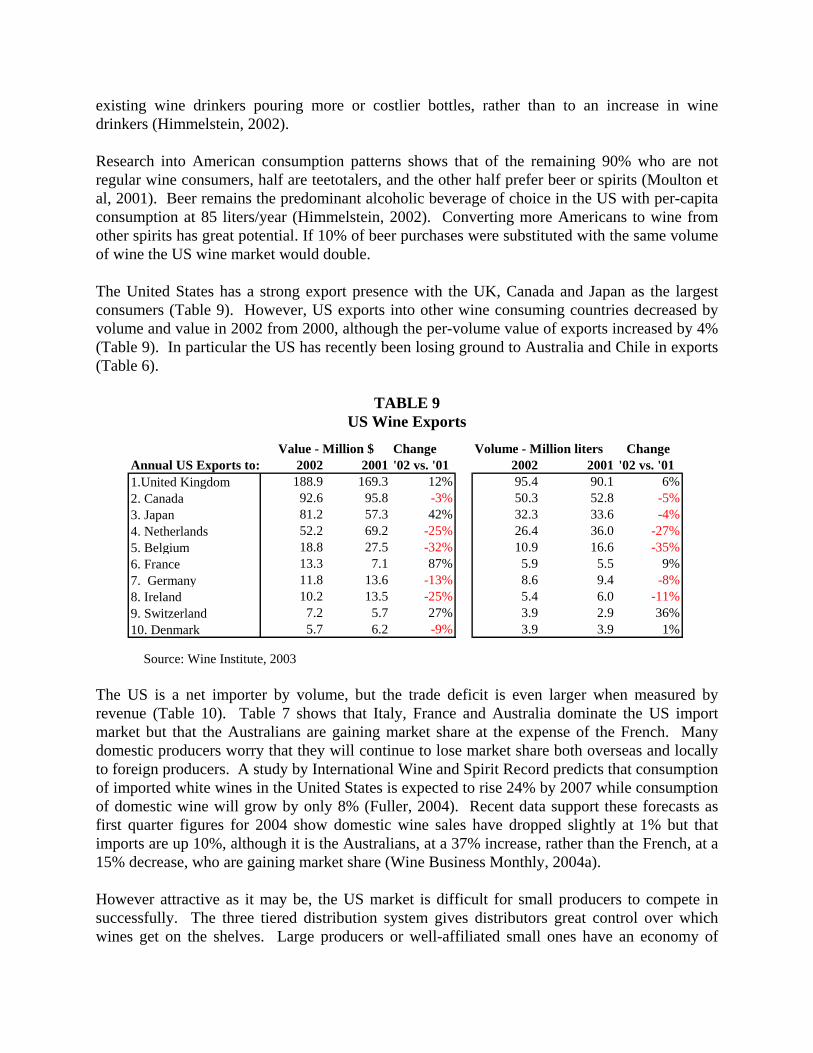
existing wine drinkers pouring more or costlier bottles, rather than to an increase in wine drinkers (Himmelstein, 2002). Research into American consumption patterns shows that of the remaining 90% who are not regular wine consumers, half are teetotalers, and the other half prefer beer or spirits (Moulton et al, 2001). Beer remains the predominant alcoholic beverage of choice in the US with per-capita consumption at 85 liters/year (Himmelstein, 2002). Converting more Americans to wine from other spirits has great potential. If 10% of beer purchases were substituted with the same volume of wine the US wine market would double. The United States has a strong export presence with the UK, Canada and Japan as the largest consumers (Table 9). However, US exports into other wine consuming countries decreased by volume and value in 2002 from 2000, although the per-volume value of exports increased by 4% (Table 9). In particular the US has recently been losing ground to Australia and Chile in exports (Table 6).
TABLE 9 US Wine Exports
Change Volume - Million liters Change Annual US Exports to: 2002 2001 '02 vs. '01 2002 2001 '02 vs. '011.United Kingdom 188.9 169.3 12% 95.4 90.1 6%2. Canada 92.6 95.8 -3% -5%50.3 52.83. Japan 81.2 57.3 42% 32.3 33.64. Netherlands 52.2 69.2 26.4 36.05. Bel
-4%-25% -27%
gium 18.8 27.5 10.9 16.66. France 13.3 7.1 87% 5.9 5.5 9%7. German
-32% -35%
y 11.8 13.6 8.6 9.48. Ireland 10.2 13.5 5.4 6.09. Switzerland 7.2 5.7 27% 3.9 2.9 36%10. Denmark 5.7 6.2 3.9 3.9 1%
Value - Million $
-13% -8%-25% -11%
-9%
Source: Wine Institute, 2003 The US is a net importer by volume, but the trade deficit is even larger when measured by revenue (Table 10). Table 7 shows that Italy, France and Australia dominate the US import market but that the Australians are gaining market share at the expense of the French. Many domestic producers worry that they will continue to lose market share both overseas and locally to foreign producers. A study by International Wine and Spirit Record predicts that consumption of imported white wines in the United States is expected to rise 24% by 2007 while consumption of domestic wine will grow by only 8% (Fuller, 2004). Recent data support these forecasts as first quarter figures for 2004 show domestic wine sales have dropped slightly at 1% but that imports are up 10%, although it is the Australians, at a 37% increase, rather than the French, at a 15% decrease, who are gaining market share (Wine Business Monthly, 2004a). However attractive as it may be, the US market is difficult for small producers to compete in successfully. The three tiered distribution system gives distributors great control over which wines get on the shelves. Large producers or well-affiliated small ones have an economy of
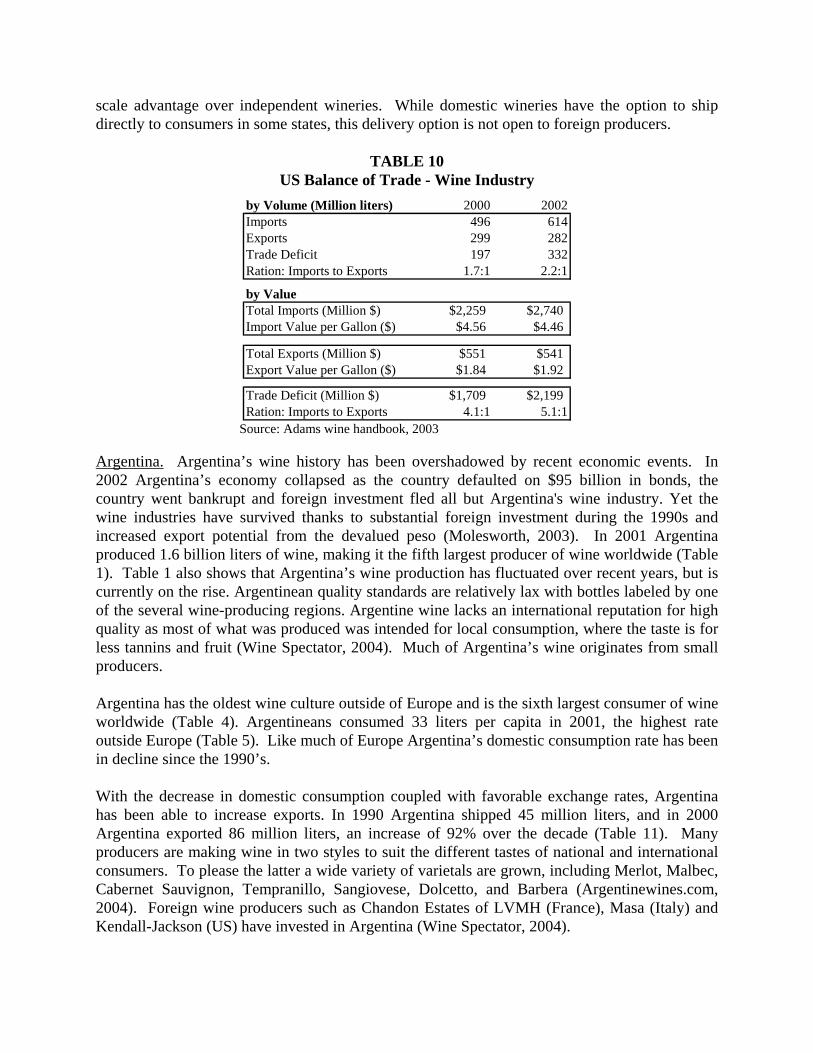
scale advantage over independent wineries. While domestic wineries have the option to ship directly to consumers in some states, this delivery option is not open to foreign producers.
TABLE 10 US Balance of Trade - Wine Industry
by Volume (Million liters) 2000 2002Imports 496 614Exports 299 282Trade Deficit 197 332Ration: Imports to Exports 1.7:1 2.2:1
by ValueTotal Imports (Million $) $2,259 $2,740Import Value per Gallon ($) $4.56 $4.46
Total Exports (Million $) $551 $541Export Value per Gallon ($) $1.84 $1.92
Trade Deficit (Million $) $1,709 $2,199Ration: Imports to Exports 4.1:1 5.1:1
Source: Adams wine handbook, 2003 Argentina. Argentina’s wine history has been overshadowed by recent economic events. In 2002 Argentina’s economy collapsed as the country defaulted on $95 billion in bonds, the country went bankrupt and foreign investment fled all but Argentina's wine industry. Yet the wine industries have survived thanks to substantial foreign investment during the 1990s and increased export potential from the devalued peso (Molesworth, 2003). In 2001 Argentina produced 1.6 billion liters of wine, making it the fifth largest producer of wine worldwide (Table 1). Table 1 also shows that Argentina’s wine production has fluctuated over recent years, but is currently on the rise. Argentinean quality standards are relatively lax with bottles labeled by one of the several wine-producing regions. Argentine wine lacks an international reputation for high quality as most of what was produced was intended for local consumption, where the taste is for less tannins and fruit (Wine Spectator, 2004). Much of Argentina’s wine originates from small producers. Argentina has the oldest wine culture outside of Europe and is the sixth largest consumer of wine worldwide (Table 4). Argentineans consumed 33 liters per capita in 2001, the highest rate outside Europe (Table 5). Like much of Europe Argentina’s domestic consumption rate has been in decline since the 1990’s. With the decrease in domestic consumption coupled with favorable exchange rates, Argentina has been able to increase exports. In 1990 Argentina shipped 45 million liters, and in 2000 Argentina exported 86 million liters, an increase of 92% over the decade (Table 11). Many producers are making wine in two styles to suit the different tastes of national and international consumers. To please the latter a wide variety of varietals are grown, including Merlot, Malbec, Cabernet Sauvignon, Tempranillo, Sangiovese, Dolcetto, and Barbera (Argentinewines.com, 2004). Foreign wine producers such as Chandon Estates of LVMH (France), Masa (Italy) and Kendall-Jackson (US) have invested in Argentina (Wine Spectator, 2004).
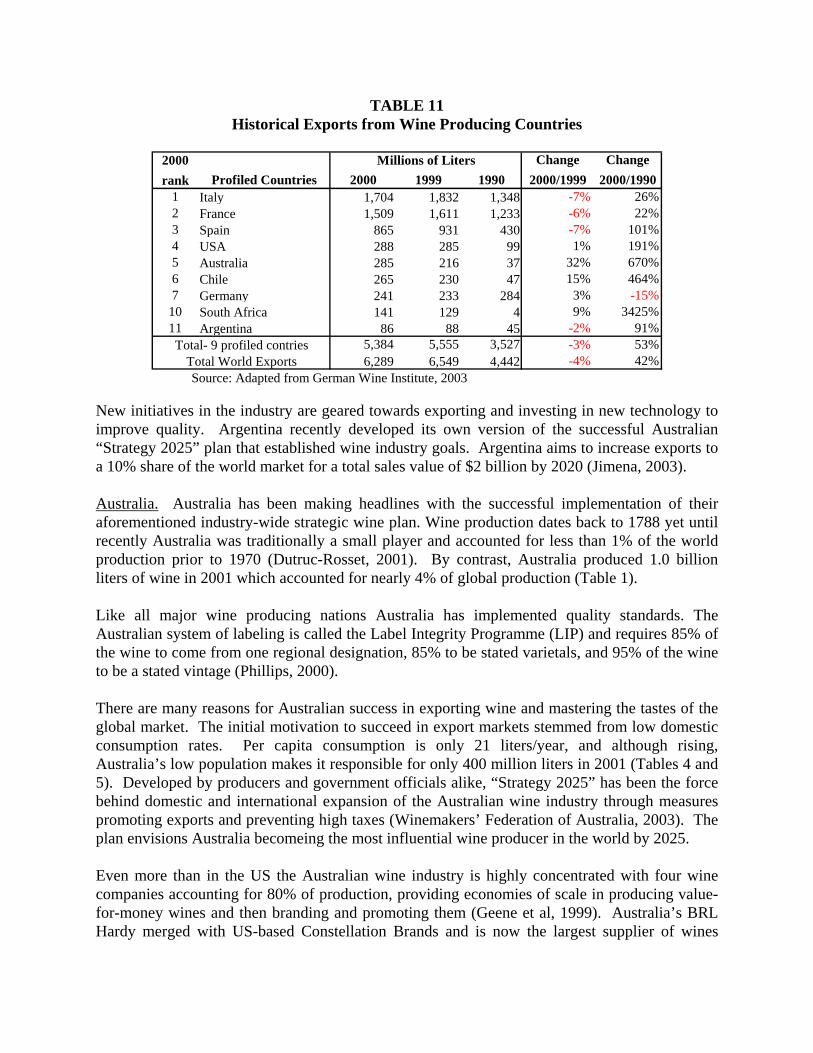
TABLE 11 Historical Exports from Wine Producing Countries
2000 Change Change rank Profiled Countries 2000 1999 1990 2000/1999 2000/1990
1 Italy 1,704 1,832 1,348 -7%-6%
26%2 France 1,509 1,611 1,233 22%3 Spain 865 931 430 101%4 USA 288 285 99 1% 191%5 Australia 285 216 37 32% 670%6 Chile 265 230 47 15% 464%7 German
-7%
y 241 233 284 3%10 South Africa 141 129 4 9% 3425%11 Ar
-15%
gentina 86 88 45 91%5,384 5,555 3,527 53%6,289 6,549 4,442 42%
Millions of Liters
Total- 9 profiled contriesTotal World Exports
-2%-3%-4%
Source: Adapted from German Wine Institute, 2003 New initiatives in the industry are geared towards exporting and investing in new technology to improve quality. Argentina recently developed its own version of the successful Australian “Strategy 2025” plan that established wine industry goals. Argentina aims to increase exports to a 10% share of the world market for a total sales value of $2 billion by 2020 (Jimena, 2003). Australia. Australia has been making headlines with the successful implementation of their aforementioned industry-wide strategic wine plan. Wine production dates back to 1788 yet until recently Australia was traditionally a small player and accounted for less than 1% of the world production prior to 1970 (Dutruc-Rosset, 2001). By contrast, Australia produced 1.0 billion liters of wine in 2001 which accounted for nearly 4% of global production (Table 1). Like all major wine producing nations Australia has implemented quality standards. The Australian system of labeling is called the Label Integrity Programme (LIP) and requires 85% of the wine to come from one regional designation, 85% to be stated varietals, and 95% of the wine to be a stated vintage (Phillips, 2000). There are many reasons for Australian success in exporting wine and mastering the tastes of the global market. The initial motivation to succeed in export markets stemmed from low domestic consumption rates. Per capita consumption is only 21 liters/year, and although rising, Australia’s low population makes it responsible for only 400 million liters in 2001 (Tables 4 and 5). Developed by producers and government officials alike, “Strategy 2025” has been the force behind domestic and international expansion of the Australian wine industry through measures promoting exports and preventing high taxes (Winemakers’ Federation of Australia, 2003). The plan envisions Australia becomeing the most influential wine producer in the world by 2025. Even more than in the US the Australian wine industry is highly concentrated with four wine companies accounting for 80% of production, providing economies of scale in producing value-for-money wines and then branding and promoting them (Geene et al, 1999). Australia’s BRL Hardy merged with US-based Constellation Brands and is now the largest supplier of wines
worldwide. Australia has also been a lure for foreign investment such as Pernod-Ricard’s Jacob Creek and Wyndham Estate brands, and Australians winemakers have aggressively collaborated with their peers worldwide. Australian wines have also been successful at what has traditionally been another American forte, brand building. Top-selling brands like Jacob’s Creek, Alice White and Yellow Tail were developed mainly for international markets (Walker, 2003). Colorful labels, imaginative names and a decent value proposition have helped to make Australians the fourth largest exporter in 2001, up from sixth place in 2000, with 33% growth in export volume in one year (Table 6). The main export markets for Australia are the UK and US which means that Australia is the most threatening competitor to US wineries domestically, as well as in its primary export market. Australia posted a 93% increase in export volume to the US in 2003 from 2000 (Table 7). South Africa. South Africa’s wines were largely unavailable on the world market between 1986 and 1991, but after international trade sanctions were lifted exports exploded (Wine News & Information, 2000). Weakness of the domestic currency and an aggressive marketing campaign also helped to make South Africa the ninth largest exporter in the world in 2001 (Table 6). South Africa was the tenth largest producer of wine worldwide in 2001 at 647 million liters with production decreasing from prior years, despite rising exports (Table 1). Wine quality in South African is based on the French AOC system with a "Wine of Origin certificate" stamped on every bottle (Wine Spectator, 2004). Total consumption decreased to 397 million liters in 2001, with a per capita rate of 9 liters/year down from 10 liters in the mid 1990’s (Tables 4 and 5). Although South Africa has been expanding into global markets it appears that domestically the industry may be facing challenges both in production and consumption. Current challenges to the growth of the South African wine industry include regulatory and other procedural requirements emanating out of an ever evolving new South African government and the uncertainties of the future social, economic and political stability of the nation. South Africa has some excellent soil and climatic areas for additional vineyard development but is largely limited by water resources and increases in labor-related problems. The move toward mechanization through the country has been considerable and may help with some issues (Murchie, 2001). The South African wine industry is experiencing consolidation as seen by the proposed merger of the nation's Distillers Corporation with Stellenbosch Farmers Winery Ltd which would form the largest alcoholic beverage corporation in South Africa (Murchie, 2001). Larger corporations and strong collaborations within the national industry have enabled aggressive and effective marketing efforts abroad. KWV International is the leading brand builder of South African wines in global markets and has a strong focus in Nordic markets with the result that South Africa is expected to replace France as the largest supplier of Sweden’s wine (Cape Business News, 2004). Chile. Until the 1850’s Chilean wines were based on the mission grape that the Spanish had planted everywhere on the west coast of the Americas wherever grapes would grow. Then
Silvestre Ochagavia Errazuriz planted French grapes including Merlot, Cabernet Sauvignon, Malbec, and Sauvignon Blanc in his vineyard south of Santiago. These grape varietals would later become the base of Chilean’s modern wine industry (Phillips, 2000). Chile has the benefit of an ideal climate for grape growing and has been isolated from the Phylloxera disease. The major wine producing areas are Aconcagua, Maipo, Maule and Rapel. The appellation system was enacted in 1996 and is based on these four growing regions, but the big wineries tend to blend across wide areas so regional character is still blurred (Wine Spectator, 2004). Land and water availability is limited, but wine has the highest added crop value per hectare, resulting in increased vineyards and production over the past decade. With the ouster of Pinochet and Chile’s return to democracy in 1990, large investments occurred and greatly expanded production and export of quality wines, and this rapid growth continues today (Foderaro, 2003). Chile is the eleventh largest producer of wine worldwide, increasing production from 382 million liters in 1990 to 538 million liters in 2001 (Table 1). At just under 15 liters a year Chilean per-capita consumption is lower than Argentina’s but higher than that of the US, although it is in decline (Table 5). Chile’s small population means that national consumption was only 244 million liters, 23rd in the world (Table 4). Chile exported 310 million liters of wine in 2001, a dramatic increase from 47 million liters in 1990 (Table 11). Chile advanced two places to become the fourth largest exporter by volume between 2000 to 2001. The main export markets for Chilean wines are the US (35%) followed by the UK (18%) and Canada (7%). Exported wines are produced by a handful of large companies, with few labels and consistent brands, such as Concho y Torro, and production is dominated by red wine wines targeted for a relatively narrow price band, from about $5 to $15 per bottle (Wine Spectator, 2004). With its ideal growing climate and low land and labor costs, Chile has been an attractive target for foreign investment. Mondavi partnered with Errazuriz to create Caliterra. Chile currently attracts a great deal of interest from French companies (Hulot, 2003).
Driving Forces in the Global Wine Industry The driving forces in an industry are the major forces at work that create changes in the industry landscape. The effects that producers are feeling from an increasingly internationalized wine market along with wider and stronger competition are further exacerbated by the following driving forces: 1) a worldwide over supply of grapes and the incumbent pricing pressures 2) consolidation of the wine producers, distributors and retailers and 3) shifting consumer behavior patterns. Worldwide Over Supply of Grapes and Incumbent Pricing Pressure The oversupply of grapes on the world market has been a driving force in the past few years and will continue to be so given favorable weather conditions. Since there is a several year lag between planting vines and increasing or shifting production to more popular varietals it should not be surprising that the supply of wine grapes is often out of sync with demand (Cholette, 2004). Chart 1 shows that although worldwide wine consumption has been growing it has been well below production every year for the past 5 years, and surpluses have ranged between 15% to 20% of total production. While many countries such as France, Italy and Spain have reduced their vineyard acreage, other countries like Argentina and Australia have dramatically increased their production capabilities (Table 1).
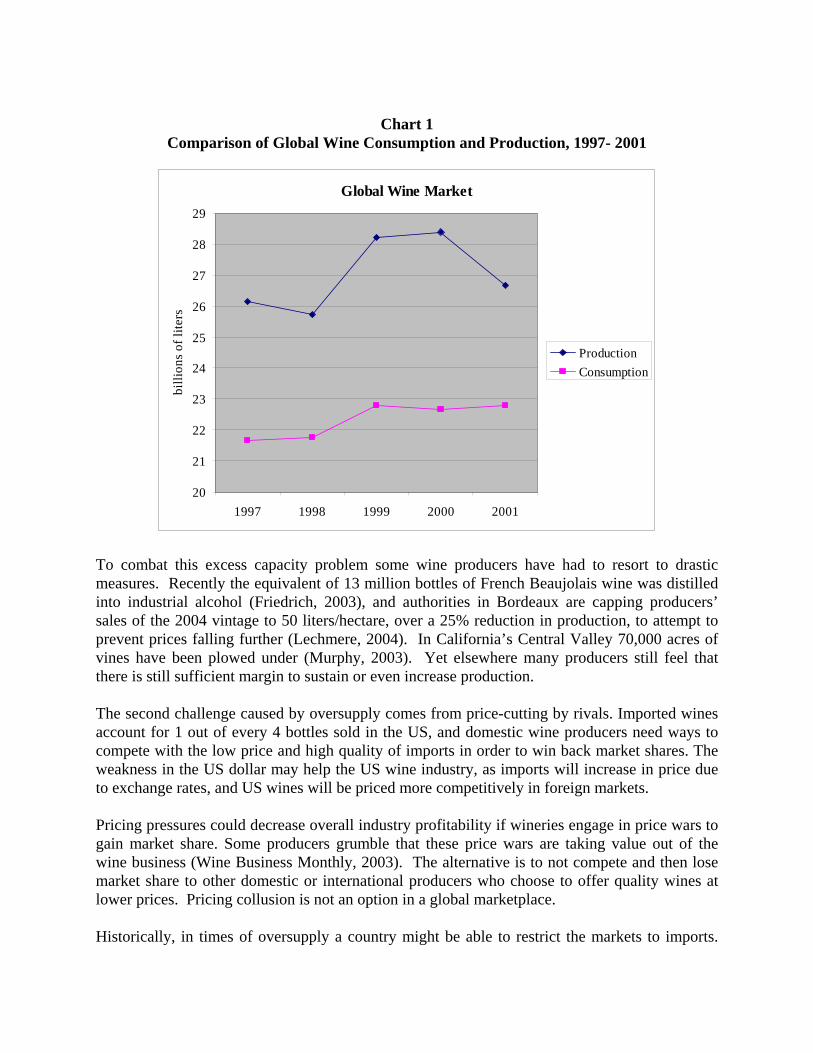
Chart 1
Comparison of Global Wine Consumption and Production, 1997- 2001
Global Wine Market
20
21
22
23
24
25
26
27
28
29
1997 1998 1999 2000 2001
billi
ons o
f lite
rs
ProductionConsumption
To combat this excess capacity problem some wine producers have had to resort to drastic measures. Recently the equivalent of 13 million bottles of French Beaujolais wine was distilled into industrial alcohol (Friedrich, 2003), and authorities in Bordeaux are capping producers’ sales of the 2004 vintage to 50 liters/hectare, over a 25% reduction in production, to attempt to prevent prices falling further (Lechmere, 2004). In California’s Central Valley 70,000 acres of vines have been plowed under (Murphy, 2003). Yet elsewhere many producers still feel that there is still sufficient margin to sustain or even increase production. The second challenge caused by oversupply comes from price-cutting by rivals. Imported wines account for 1 out of every 4 bottles sold in the US, and domestic wine producers need ways to compete with the low price and high quality of imports in order to win back market shares. The weakness in the US dollar may help the US wine industry, as imports will increase in price due to exchange rates, and US wines will be priced more competitively in foreign markets. Pricing pressures could decrease overall industry profitability if wineries engage in price wars to gain market share. Some producers grumble that these price wars are taking value out of the wine business (Wine Business Monthly, 2003). The alternative is to not compete and then lose market share to other domestic or international producers who choose to offer quality wines at lower prices. Pricing collusion is not an option in a global marketplace. Historically, in times of oversupply a country might be able to restrict the markets to imports.
However, many countries are signing trade agreements to keep the markets open. For instance, Australia, Canada, New Zealand and the US have agreed to accept differences in winemaking techniques and are later expected to approve differences on labeling laws and tariff agreements to further reduce trade barriers. So enological differences can no longer be used as an excuse for protectionism (Walker, 2001). Consolidation of Wine Producers, Distributors and Retailers Through mergers and acquisitions, major consolidation is occurring among wineries worldwide. When an industry starts to mature, firms enhance profits by consolidating to become bigger players, creating competitive advantages of economies of scale and scope, increased vertical integration, and pull with distributors. Some industry experts predict that in the next five years, the vast majority of wine sales will be dominated by ten or so borderless mega-consortiums, along the likes of Beringer-Blass (Australia), Constellation (US) and LVMH (France) (Gettler, 2003). The top ten distributors control over half of the wine sold in the US (Wine Business Monthly, 2002). Wholesaler consolidation has made it increasingly difficult for smaller producers to get their product to market. Wholesalers prefer to distribute only the top selling brands, in lieu of small or new labels, since their profits come from markups on products they are able to replenish quickly, and wine turnover is notoriously slow (2.4 turns/year), compared to the churn generated by liquor (50 turns/year) and beer (70 turns/year) (Cholette, 2004). Distributors wish to avoid products that may sit on the customers’ shelves too long and prefer products that are proven bestsellers, relying on the pull from the consumers. Of course only brands that engage in push advertising or have shelf presence have sufficient consumer recognition. At the retail level, consolidation is occurring in both restaurants (on premise) and in supermarkets (off premise) sectors. Smaller brands have a harder time gaining placement on the shelves and on wine lists because the head office may choose a few brands to use in all of their locations. Wine brands that are selected are then pressured for volume discounts, further reducing wineries’ profit margins. Supermarkets accounted for a 41% share of US retail wine sales in 2000, so consolidation of these chains is relevant to the industry (Wickham et al, 2001). The shift to supermarkets and the high-volume wines stocked upon their shelves is no longer solely an American phenomenon as the International Wine Investment Fund estimates 60% to 80% of global wine sales now occur through supermarkets (Gettler, 2003). As a result, tens of thousands of international wine brands vie for space on the store shelves of these fewer, larger, and more powerful supermarkets. Shifting Consumer Behavior Patterns Ultimately what drives the wine industry is the consumer so the wine industry spends money researching and trying to influence consumption patterns. The Old World producers have had the advantage of tradition behind them in their home markets. Before safe drinking water was available wine was a necessary part of people’s diet. Over the centuries wine has become an integral part of many European cultures and is considered standard accompaniment at lunch and dinner. However, there is little room for expansion in their home markets and most countries are experiencing declining per-capita wine consumption, as social campaigns against alcoholism and
drunk driving have increased. Per capita wine consumption in most of the New World countries substantially lags that of Europe. Pushing affordable wine on to the shelves of world markets will not necessarily increase global consumption by itself. Consumers have to pull the bottles off the shelves as consistent purchases. For instance, US per capita consumption has been increasing modestly, but in order to increase further wine must be marketed in a way that will promote everyday drinking in a responsible manner. A survey at the 2003 Wine Symposium shows that distributors think it crucial to make wine more approachable to consumers. Many new wine drinkers feel confused about all the wine choices, especially the intricacies of foreign appellations. Producers need to design and label wines that consumers can better understand. Another design feature that may make wine more approachable to the consumer is using twist top closures instead of corks. Invented in the twentieth century, twist top closures prevent cork taint, are cheaper than cork and have been proven to intimidate customers less. Yet only a few producers, mostly Australian and Americans, are moving away from the ancient but traditional corks. Another problem endemic to the US is that wine is often associated with hard liquor and demonized as immoral. Several states still have “blue laws” that force consumers to buy wine in state-run liquor shops. Recasting wine as another food to be enjoyed with a meal and emphasizing the health benefits may help to increase demand and convert some current non-drinkers.
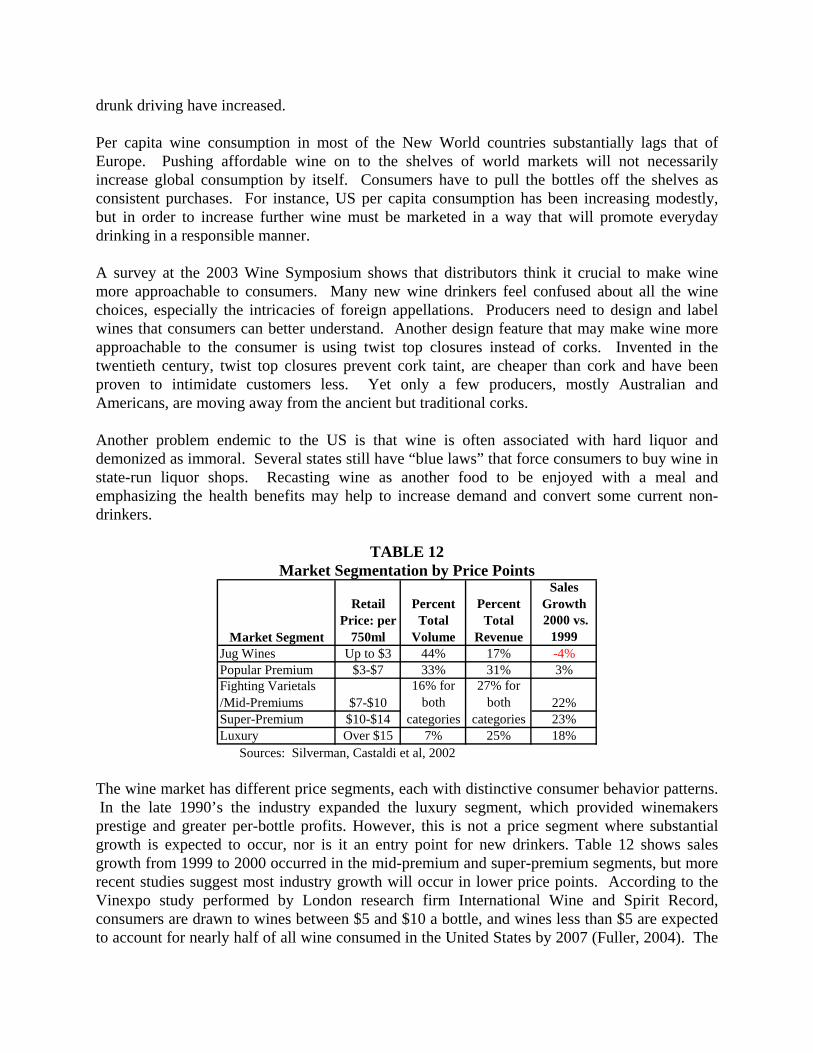
TABLE 12 Market Segmentation by Price Points
Sales Growth2000 vs.
1999Jug Wines Up to $3 44% 17% -4%Popular Premium $3-$7 33% 31% 3%Fighting Varietals /Mid-Premiums $7-$10 22%Super-Premium $10-$14 23%Luxury Over $15 7% 25% 18%
16% for both
categories
27% for both
categories
Market Segment
Retail Price: per
750ml
Percent Total
Volume
Percent Total
Revenue
Sources: Silverman, Castaldi et al, 2002
The wine market has different price segments, each with distinctive consumer behavior patterns. In the late 1990’s the industry expanded the luxury segment, which provided winemakers prestige and greater per-bottle profits. However, this is not a price segment where substantial growth is expected to occur, nor is it an entry point for new drinkers. Table 12 shows sales growth from 1999 to 2000 occurred in the mid-premium and super-premium segments, but more recent studies suggest most industry growth will occur in lower price points. According to the Vinexpo study performed by London research firm International Wine and Spirit Record, consumers are drawn to wines between $5 and $10 a bottle, and wines less than $5 are expected to account for nearly half of all wine consumed in the United States by 2007 (Fuller, 2004). The
recently created super-value wine segment of varietal wines priced at $3 and under has achieved great consumer acceptance.
Discussion and Conclusion
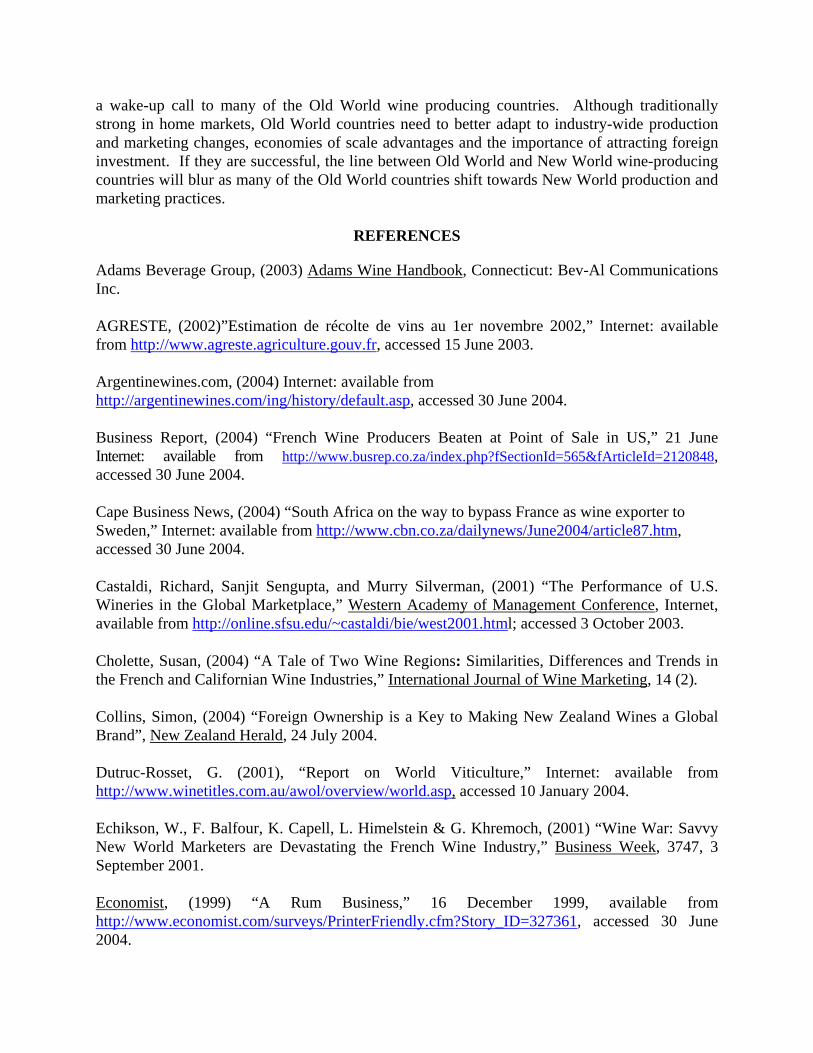
Globalization and the three other driving forces identified will continue to greatly affect the wine industry, and some countries are better positioned to gain than others. In order to summarize this research and provide a country-comparative analysis, a table was created that presents the nine countries profiled with respect to key success factors that contribute to competitiveness in the increasingly global marketplace. All of the nine countries profiled have been major wine producers for many years and meet production standards for wine that appeals to consumers internationally. Most of these countries are producing below full capacity and could expand further if market and demand conditions were favorable. Five key success factors have been identified that are important to compete favorably in the global wine industry: 1) a strong existing domestic market 2) domestic market growth potential 3) economies of scale advantage 4) industry adaptability to change and 5) potential to attract foreign investment. First, a strong domestic market is one where a large volume of wine is purchased and where consumers readily select domestic wines. Second, even more important is the potential for growth in a producer’s domestic market, as this shows if opportunities for additional sales exist where producers may have local knowledge and other native advantages such as local distribution. Third, countries where production is dominated by larger firms have the advantages of scale and scope as well as improved power in promoting and pushing their wines to consumers and retailers. Counterpoint examples exist: LVMH is a huge French conglomerate with substantial wine holdings, and many boutique American winemakers produce only a few hundred cases annually. Yet overall more US wine production is concentrated in large scale concerns than in France, thus granting size advantages. Fourth, industry adaptability to change summarizes the willingness of producers to experiment with cost saving production methods or to pioneer new marketing techniques. It also indicates if producers are free from excessive regulations or blind adherence to long standing traditions. Finally, countries that have business-friendly climates, favorable costs or other natural comparative advantages will attract foreign investment in wine production, which makes these countries stronger global competitors (Collins, 2004). Old World producers were the first to define tastes and quality standards and they have traditionally been supported by a strong local consumer base. The New World has had to work hard to build their wine industry, both in infrastructure and reputation. Large scale wine production is relatively recent, and many of the New World producers faced difficulties such as currency collapse, prohibition and international sanctions. Per-capita consumption also lags that of the Old World countries. Yet New World producers have recently been successful in producing consistent quality wine and in capturing global market share. The Old World countries are gradually losing market share as New World producers increase the scale and quality of production as well their branding expertise (Wickham et al, 2001). Figure 1 presents how each profiled country stacks up on each key success factor and rates its overall competitive advantage. The countries fall into three groups in regard to their comparative competitive advantage position. The group with the strongest position includes
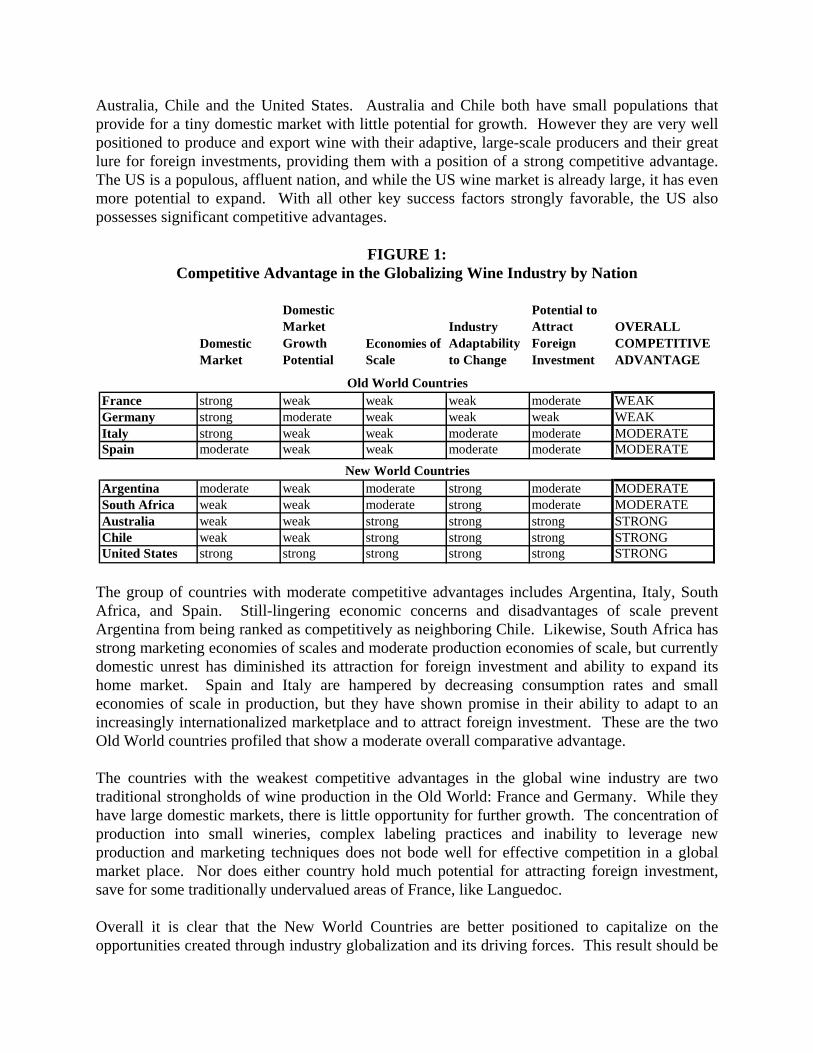
Australia, Chile and the United States. Australia and Chile both have small populations that provide for a tiny domestic market with little potential for growth. However they are very well positioned to produce and export wine with their adaptive, large-scale producers and their great lure for foreign investments, providing them with a position of a strong competitive advantage. The US is a populous, affluent nation, and while the US wine market is already large, it has even more potential to expand. With all other key success factors strongly favorable, the US also possesses significant competitive advantages.
FIGURE 1: Competitive Advantage in the Globalizing Wine Industry by Nation
Domestic Market
Domestic Market Growth Potential
Economies of Scale
Industry Adaptability to Change
Potential to Attract Foreign Investment
OVERALL COMPETITIVE ADVANTAGE
France strong weak weak weak moderate WEAKGermany strong moderate weak weak weak WEAKItaly strong weak weak moderate moderate MODERATESpain moderate weak weak moderate moderate MODERATE
Argentina moderate weak moderate strong moderate MODERATESouth Africa weak weak moderate strong moderate MODERATEAustralia weak weak strong strong strong STRONGChile weak weak strong strong strong STRONGUnited States strong strong strong strong strong STRONG
New World Countries
Old World Countries
The group of countries with moderate competitive advantages includes Argentina, Italy, South Africa, and Spain. Still-lingering economic concerns and disadvantages of scale prevent Argentina from being ranked as competitively as neighboring Chile. Likewise, South Africa has strong marketing economies of scales and moderate production economies of scale, but currently domestic unrest has diminished its attraction for foreign investment and ability to expand its home market. Spain and Italy are hampered by decreasing consumption rates and small economies of scale in production, but they have shown promise in their ability to adapt to an increasingly internationalized marketplace and to attract foreign investment. These are the two Old World countries profiled that show a moderate overall comparative advantage. The countries with the weakest competitive advantages in the global wine industry are two traditional strongholds of wine production in the Old World: France and Germany. While they have large domestic markets, there is little opportunity for further growth. The concentration of production into small wineries, complex labeling practices and inability to leverage new production and marketing techniques does not bode well for effective competition in a global market place. Nor does either country hold much potential for attracting foreign investment, save for some traditionally undervalued areas of France, like Languedoc. Overall it is clear that the New World Countries are better positioned to capitalize on the opportunities created through industry globalization and its driving forces. This result should be
a wake-up call to many of the Old World wine producing countries. Although traditionally strong in home markets, Old World countries need to better adapt to industry-wide production and marketing changes, economies of scale advantages and the importance of attracting foreign investment. If they are successful, the line between Old World and New World wine-producing countries will blur as many of the Old World countries shift towards New World production and marketing practices.
REFERENCES Adams Beverage Group, (2003) Adams Wine Handbook, Connecticut: Bev-Al Communications Inc. AGRESTE, (2002)”Estimation de récolte de vins au 1er novembre 2002,” Internet: available from http://www.agreste.agriculture.gouv.fr, accessed 15 June 2003. Argentinewines.com, (2004) Internet: available from http://argentinewines.com/ing/history/default.asp, accessed 30 June 2004. Business Report, (2004) “French Wine Producers Beaten at Point of Sale in US,” 21 June Internet: available from http://www.busrep.co.za/index.php?fSectionId=565&fArticleId=2120848, accessed 30 June 2004. Cape Business News, (2004) “South Africa on the way to bypass France as wine exporter to Sweden,” Internet: available from http://www.cbn.co.za/dailynews/June2004/article87.htm, accessed 30 June 2004. Castaldi, Richard, Sanjit Sengupta, and Murry Silverman, (2001) “The Performance of U.S. Wineries in the Global Marketplace,” Western Academy of Management Conference, Internet, available from http://online.sfsu.edu/~castaldi/bie/west2001.html; accessed 3 October 2003. Cholette, Susan, (2004) “A Tale of Two Wine Regions: Similarities, Differences and Trends in the French and Californian Wine Industries,” International Journal of Wine Marketing, 14 (2). Collins, Simon, (2004) “Foreign Ownership is a Key to Making New Zealand Wines a Global Brand”, New Zealand Herald, 24 July 2004. Dutruc-Rosset, G. (2001), “Report on World Viticulture,” Internet: available from http://www.winetitles.com.au/awol/overview/world.asp, accessed 10 January 2004. Echikson, W., F. Balfour, K. Capell, L. Himelstein & G. Khremoch, (2001) “Wine War: Savvy New World Marketers are Devastating the French Wine Industry,” Business Week, 3747, 3 September 2001. Economist, (1999) “A Rum Business,” 16 December 1999, available from http://www.economist.com/surveys/PrinterFriendly.cfm?Story_ID=327361, accessed 30 June 2004.
Friedrich, J. (2003), “French Vintners Want Liberté,” Wall Street Journal, 15 January 2003. Foderaro, T.J. (2003) “Chileans Wiser About Wine,” OregonLive.com, 2 December 2003. Internet: available from http://www.oregonlive.com; accessed 2 December 2003. Food & Drink, (2003) “Spanish Wines Increase Exports Again,” 24 December 2003. Internet, available from http://www.foodnavigator.com/news/news-NG.asp?id=48644, accessed 10 January 2004. Fuller, Janet, (2004) “Americans Snap Up Affordable Wine Imports,” Chicago Sun, 20 June 2004. Geene, Annemiek, Arend Heijbroek, Anne Lagerwerf and Rafi Wazir, (1999) The World Wine Business, Netherlands: Rabobank International. German Wine Society, (2003) “Consumption of German Wine Around the World,” Internet: available from http://www.germanwinesociety-hongkong.org/PDF/consum.pdf, accessed 12 December 2003.
Gettler, Leon, (2003) “Giants Tipped to Dominate Industry,” 23 May 2003. Internet: available from http://www.theage.com.au/articles/2003/05/22/1053585644354.html, accessed 30 June 2004. Heijbroek, Arend, (2003) “Major Drivers Reshaping the Wine Industry: A Global Perspective,” 2003 Wine Industry Symposium, September 25-26, Napa, California. Himelstein, L. (2002) “This Merlot’s for You: As Sales Languish, U.S. Winemakers Go Mass Market, Like Beer,” Business Week, 3801, 30 September 2002. Hulot, Mathilde, (2003) “French Producers Still Investing in World Wine,” Wine Business Monthly, 9 June, 42-45. Jimena, Jaquelina, (2003) “Argentina Launches ‘Strategy 2020’,” Decanter.com, 23 December. Internet: available from http://www.decanter.com/news/47474.html, accessed 24 December 2003.
Lechmere, Adam, (2004) “Bordeaux Slashes Wine Sales as Crisis Deepens,” Decanter.com, 29 June 2004. Internet: available from http://www.decanter.com/news/56159.html, accessed 30 June 2004. Lukacs, Paul, (2000) American Vintage: The Rise of the American Wine, New York: Houghton Mifflin Company. Molesworth, James and Davis Sax, (2003) “Argentina’s Red Wines Are Emerging from Obscurity” Wine Spectator, 106, December 2003.
Moulton, K., A. L. Spawton, and M. Bourqui. 2001. “Introduction: Consumer Behavior and Marketing Strategies,” In K. Moulton and J. Lapsley (Eds.), Successful Wine Marketing, Gaithersburg, Maryland: Aspen Publication, Inc. Murphy, D., (2003) “California Grape Industry Is Crushed,” International Herald Tribune, 26 May 2003. Murchie, Gordon W., (2001) “International Challenges Facing the US Wine Industry,” Wine Business Monthly, Internet: available from http://www.findarticles.com/cf_0/m3488/5_82/75620612/p1/article.jhtml, accessed 10 January 2004. Silverman, M., R.Castaldi, S.Baack & G. Sorlien, (2002) “Competition in the Global Wine Industry: A U.S. Perspective,” In A.Thompson & A.J. Strickland (Eds.), Strategic Management: Concepts and Cases, New York: McGraw-Hill Irwin. Silverman, M., A. Gilinsky, M. Guy, & S. Baack, (2002) “Robert Mondavi Corporation,” In A.Thompson & A.J. Strickland (Eds.), Strategic Management: Concepts and Cases, New York: McGraw-Hill Irwin. Walker, Larry, (2001) “Robert Nicholson - Views on Wine Industry Mergers,” Wines & Vines, April 2001. Walker, Larry, (2003) “Who Owns What?” Wines & Vines, January, 2003. Wine Business Monthly, (2002) “The Top 10 Wine Business Stories of 2002,” Internet: available from http://winebusiness.com/html/MonthlyArticle.cfm?aid=64076&issueid=64069 , accessed 10 January 2004. Wine Business Monthly, (2003) “The Top 10 Wine Business Stories of 2003,” Internet: available from http://winebusiness.com/html/MonthlyArticle.cfm?aid=83212&issueid=83183, accessed 10 January 2004. Wine Business Monthly, (2004a) “Retail Sales Data: US Wine Sales Gain 1.7% Over Early 2003,” Internet: available from http://winebusiness.com/SalesMarketing/webarticle.cfm?AID=88546&ISSUEID=88520, accessed 30 June 2004. Wine Business Monthly, (2004b) “The Top 30 US Wine Companies,” Internet” available from http://winebusiness.com, accessed 30 June 2004. Wickham, Christopher, John Wakely, Andrew Gowen and Sara Bellenda (2001) Global Wine Report: Acquiring a Taste for the Consumer, London: Lehman Brothers. Winemakers’ Federation of Australia, (2003) “Strategy 2025,” Internet: available from
http://www.wfa.org.au/planning/strat2025.html; accessed 14 December 2003. Wine News & Information, (2000) “South African Wine: a 300 Year Old Heritage,” Internet: available from http://www.thewineman.com/africa2.htm, accessed 12 November 2003. Wine Institute, (2003) “U.S. Exports Up One Percent in Revenues in 2002, Seven Percent Decrease in Volume,” Internet: available from http://www.wineinstitute.org/communications/statistics/exports_2002.htm, accessed 29 September 2003. Wine Spectator, (2003) “Per Capital Global Wine Consumption Declines in 2002,” Internet: available from http://www.winespectator.com/Wine/Daily/News/0,1145,2052,00.html, accessed 27 April 2004. Wine Spectator, (2004) “Wine Basics,” Internet: available from http://www.winespectator.com/Wine/Wine_Basics/1,1181,,00.html, accessed 30 June 2004.