the government of republic of the gambia national
TRANSCRIPT
THE GOVERNMENT OF REPUBLIC OF THE GAMBIA
NATIONAL NUTRITION AGENCY (NaNA)
STRAGTEGIC PLAN 2011-2015 FOR IMPLEMENTATION OF THE GAMBIA’S NATIONAL NUTRITION PROGRAMME
DETAILED COST TABLES
May, 2011
2011-2015 National Nutrition Strategic Plan, NaNA Page i
FOREWORD

2011-2015 National Nutrition Strategic Plan, NaNA Page ii
INTRODUCTION
Over the period 1998-2005, the Gambia made remarkable progress in improving the nutritional status of its population; reducing
underweight from 26% to 18% partly due to a World Bank financed Participatory Health, Population and Nutrition Project (PHPNP),
which closed in 2005. In fact the WHO classifies The Gambia among countries with moderate malnutrition rates in West Africa.
However, in recent years, malnutrition rates are increasing mainly due to limited funding of the sector. Available statistics from the
2006 Multiple Indicator Cluster Survey (MICS) and the PHPNP show that underweight has increased to 20% from 17.1% in 2000, and
stunting to 22.4% from 19.1% in 2000.
A key factor that has contributed to the upward trend of the malnutrition indicators is lack of adequate funding for implementation of
nutrition interventions. The sector has witnessed limited funding from the government. For example, the nutrition’s share of the
national budget was only 0.1% in 2010 compared to other sectors. In absolute terms, the sector received US$ 163,929 in 2010. The
majority of funding in 2010 came from donor sources with donors contributing a total of US$201,927.
To reverse the trend and improve malnutrition indicators, the National Nutrition Agency (NaNA) revised its Nation Nutrition Policy
[2000-2004] and developed a new comprehensive National Nutrition Policy [2010-2020] outlining broad objectives, strategies and
priority areas that need to be addressed. To translate the policy into concrete actions, NaNA went a mile stone to develop a National
Nutrition Strategic Plan [2011-2015], which spells out the strategies and activities that must be carried out in order to achieve the
policy objectives. The strategies and activities have been costed to ascertain the full cost of the policy.
This paper provides detailed cost tables, which contain the chronology of priority areas, strategies and the activities that need to be
implemented in order to achieve the objectives. Box 1 shows the full list of the priority areas of interventions.
Box 1: Priority areas of interventions.
Improving Maternal Nutrition;
Promoting Optimal Infant and Young Child Feeding;
Food and Nutrition Security at the National, Community and Household Levels;
Preventing Micronutrient Malnutrition
Nutrition and Infectious Diseases;
Improving Food Standards, Quality and Safety;
Preventing and Managing Diet-Related Non-Communicable Diseases;
Caring for the Socio-Economically Deprived and Nutritionally Vulnerable;
Nutrition and HIV/AIDS;
2011-2015 National Nutrition Strategic Plan, NaNA Page iii
Nutrition in Emergency Situations;
Nutrition surveillance;
Human Nutrition Research
Policy Implementation Framework
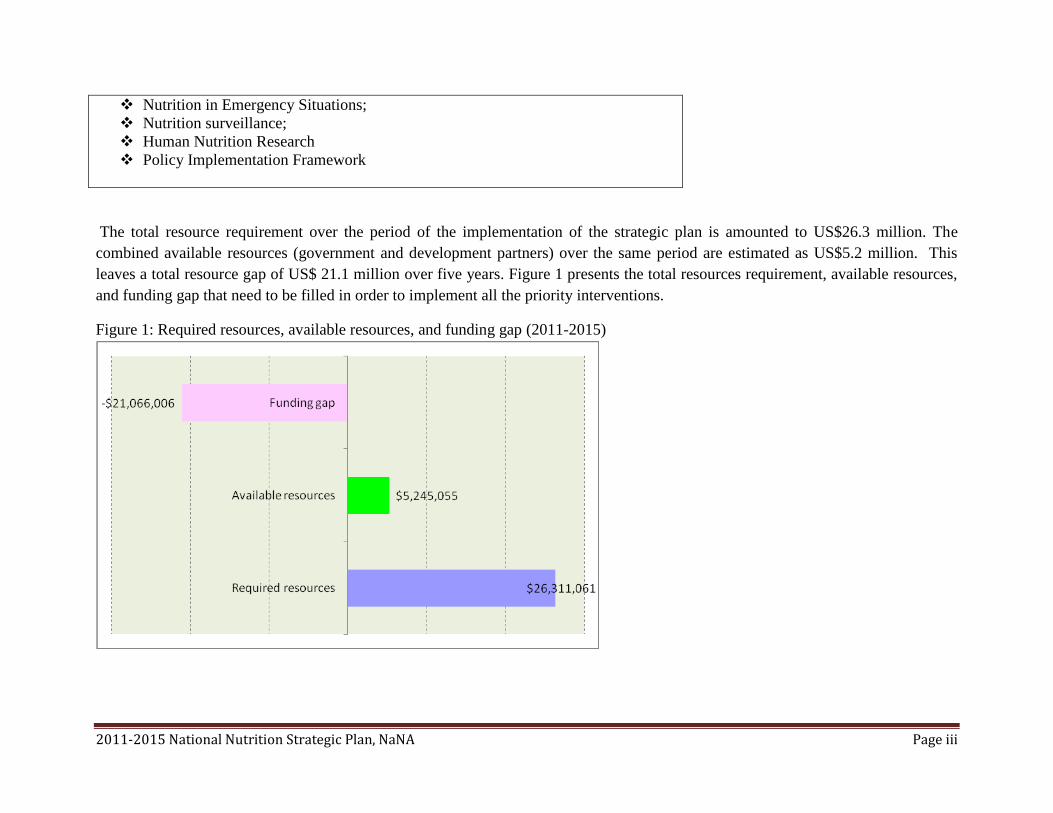
The total resource requirement over the period of the implementation of the strategic plan is amounted to US$26.3 million. The
combined available resources (government and development partners) over the same period are estimated as US$5.2 million. This
leaves a total resource gap of US$ 21.1 million over five years. Figure 1 presents the total resources requirement, available resources,
and funding gap that need to be filled in order to implement all the priority interventions.
Figure 1: Required resources, available resources, and funding gap (2011-2015)
2011-2015 National Nutrition Strategic Plan, NaNA Page 1
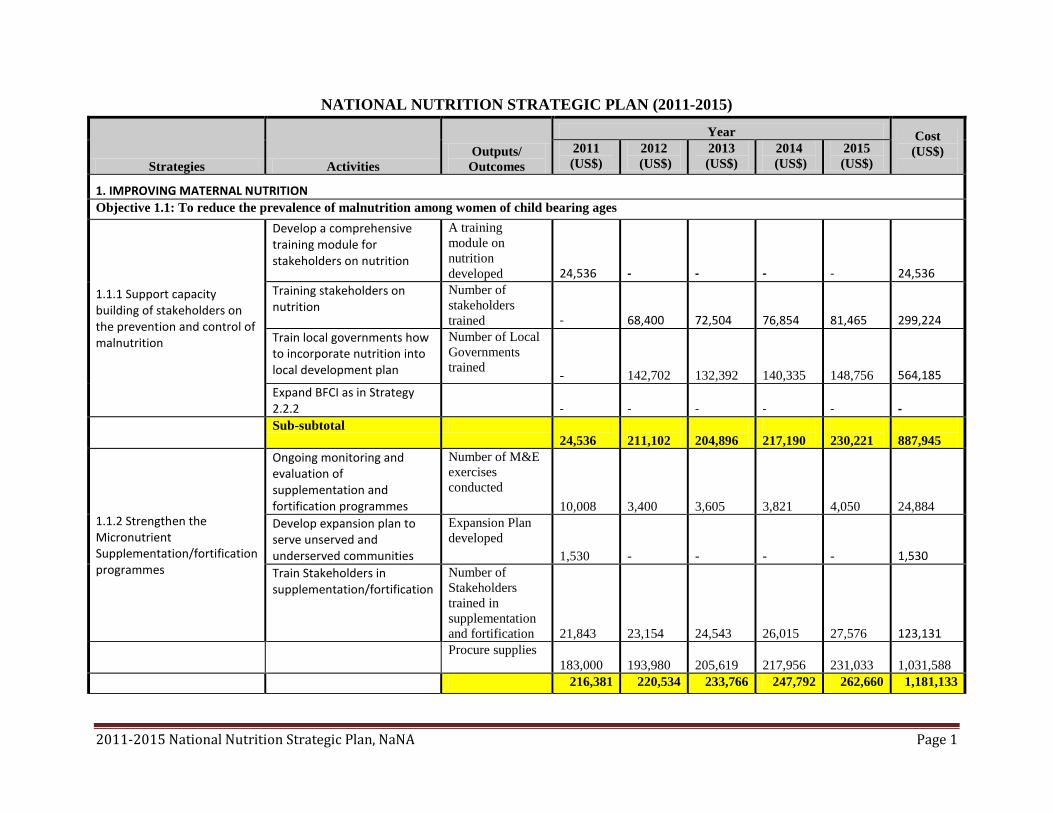
NATIONAL NUTRITION STRATEGIC PLAN (2011-2015)
Strategies Activities
Outputs/
Outcomes
Year Cost
(US$)
2011
(US$)
2012
(US$)
2013
(US$)
2014
(US$)
2015
(US$)
1. IMPROVING MATERNAL NUTRITION
Objective 1.1: To reduce the prevalence of malnutrition among women of child bearing ages
1.1.1 Support capacity building of stakeholders on the prevention and control of malnutrition
Develop a comprehensive training module for stakeholders on nutrition
A training
module on
nutrition
developed 24,536 -
-
-
-
24,536
Training stakeholders on nutrition
Number of
stakeholders
trained
-
68,400
72,504
76,854
81,465
299,224
Train local governments how to incorporate nutrition into local development plan
Number of Local
Governments
trained
-
142,702
132,392
140,335
148,756
564,185
Expand BFCI as in Strategy 2.2.2
-
-
-
-
-
-
Sub-subtotal
24,536
211,102
204,896
217,190
230,221
887,945
1.1.2 Strengthen the Micronutrient Supplementation/fortification programmes
Ongoing monitoring and evaluation of supplementation and fortification programmes
Number of M&E
exercises
conducted
10,008 3,400 3,605 3,821 4,050 24,884
Develop expansion plan to serve unserved and underserved communities
Expansion Plan
developed
1,530
-
-
-
-
1,530
Train Stakeholders in supplementation/fortification
Number of
Stakeholders
trained in
supplementation
and fortification
21,843
23,154
24,543
26,015
27,576
123,131
Procure supplies
183,000
193,980
205,619
217,956
231,033
1,031,588
216,381 220,534 233,766 247,792 262,660 1,181,133
2011-2015 National Nutrition Strategic Plan, NaNA Page 2
Strategies Activities
Outputs/
Outcomes
Year Cost
(US$)
2011
(US$)
2012
(US$)
2013
(US$)
2014
(US$)
2015
(US$)
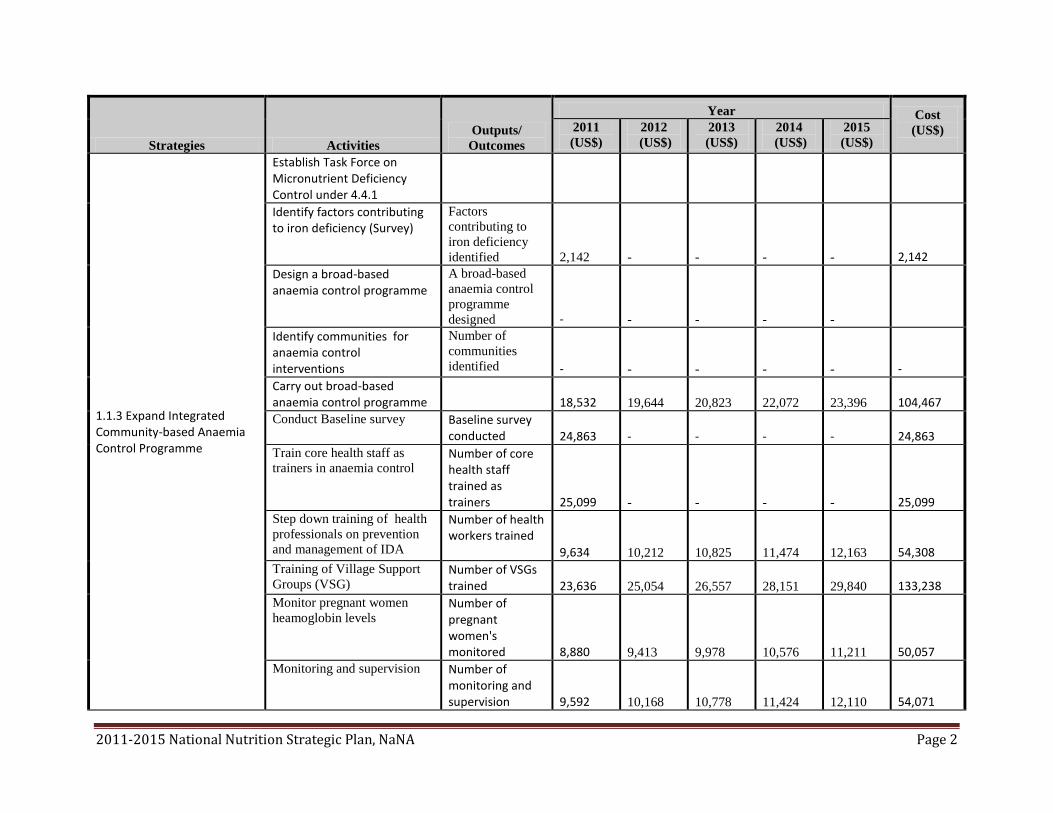
1.1.3 Expand Integrated Community-based Anaemia Control Programme
Establish Task Force on Micronutrient Deficiency Control under 4.4.1
Identify factors contributing to iron deficiency (Survey)
Factors
contributing to
iron deficiency
identified 2,142
-
-
-
-
2,142
Design a broad-based anaemia control programme
A broad-based
anaemia control
programme
designed
-
-
-
-
-
Identify communities for anaemia control interventions
Number of
communities
identified -
-
-
-
-
-
Carry out broad-based anaemia control programme
18,532 19,644 20,823 22,072 23,396
104,467
Conduct Baseline survey Baseline survey conducted 24,863
-
-
-
-
24,863
Train core health staff as
trainers in anaemia control Number of core health staff trained as trainers 25,099
-
-
-
-
25,099
Step down training of health
professionals on prevention
and management of IDA
Number of health workers trained
9,634
10,212
10,825
11,474
12,163
54,308
Training of Village Support
Groups (VSG) Number of VSGs trained
23,636
25,054
26,557
28,151
29,840
133,238
Monitor pregnant women
heamoglobin levels Number of pregnant women's monitored
8,880
9,413
9,978
10,576
11,211
50,057
Monitoring and supervision Number of monitoring and supervision
9,592
10,168
10,778
11,424
12,110
54,071
2011-2015 National Nutrition Strategic Plan, NaNA Page 3
Strategies Activities
Outputs/
Outcomes
Year Cost
(US$)
2011
(US$)
2012
(US$)
2013
(US$)
2014
(US$)
2015
(US$)
exercises conducted
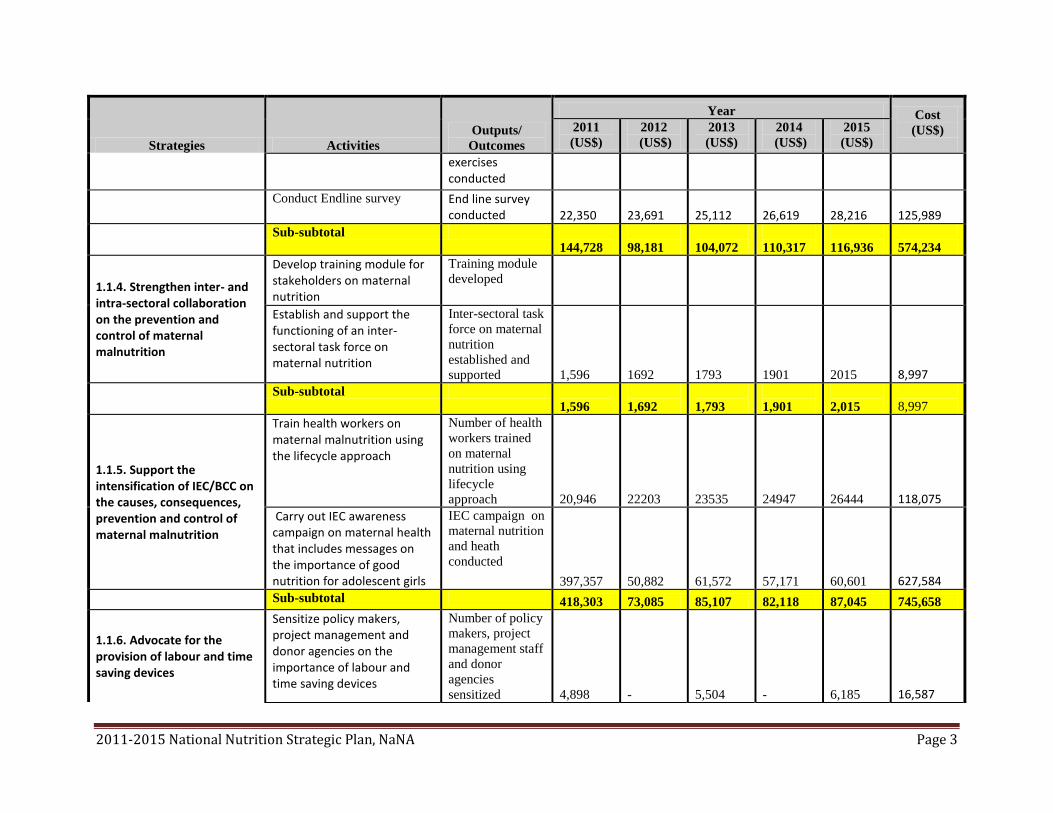
Conduct Endline survey End line survey conducted 22,350 23,691 25,112 26,619 28,216 125,989
Sub-subtotal
144,728
98,181
104,072
110,317
116,936
574,234
1.1.4. Strengthen inter- and intra-sectoral collaboration on the prevention and control of maternal malnutrition
Develop training module for stakeholders on maternal nutrition
Training module
developed
Establish and support the functioning of an inter-sectoral task force on maternal nutrition
Inter-sectoral task
force on maternal
nutrition
established and
supported 1,596 1692 1793 1901 2015
8,997
Sub-subtotal
1,596
1,692
1,793
1,901
2,015
8,997
1.1.5. Support the intensification of IEC/BCC on the causes, consequences, prevention and control of maternal malnutrition
Train health workers on maternal malnutrition using the lifecycle approach
Number of health
workers trained
on maternal
nutrition using
lifecycle
approach 20,946 22203 23535 24947 26444
118,075
Carry out IEC awareness campaign on maternal health that includes messages on the importance of good nutrition for adolescent girls
IEC campaign on
maternal nutrition
and heath
conducted
397,357 50,882 61,572 57,171 60,601
627,584
Sub-subtotal 418,303 73,085 85,107 82,118 87,045 745,658
1.1.6. Advocate for the provision of labour and time saving devices
Sensitize policy makers, project management and donor agencies on the importance of labour and time saving devices
Number of policy
makers, project
management staff
and donor
agencies
sensitized
4,898
-
5,504
-
6,185
16,587

2011-2015 National Nutrition Strategic Plan, NaNA Page 4
Strategies Activities
Outputs/
Outcomes
Year Cost
(US$)
2011
(US$)
2012
(US$)
2013
(US$)
2014
(US$)
2015
(US$)
Sensitize community leaders on the importance of Labour saving devices in improving nutritional status
Number of
community
leaders sensitized
12,884
13,657
14,476
15,345
16,266
72,628
Assist BFCI communities in building Baby Friendly Rest Houses (see Theme 2)
Number of BFCI rest houses built
Sub-subtotal
17,782
13,657
19,980
15,345
22,451
89,215
1.1.7. Advocate for the enrolment and retention of the girl child in school
Sensitize the public on the link between girls education and better nutrition
Number of public
sensitisation
conducted
8,270
8,766
9,292
9,850
10,441
46,619
Sub-subtotal 8,270 8,766 9,292 9,850 10,441 46,619
1.1.8. Strengthen and expand the Baby Friendly Community Initiative (BFCI) strategy to all communities
Expand BFCI as explained in strategy 2.2.2
-
-
-
-
-
-
Sub-subtotal - - - - - -
1.1.9. Advocate for the domestication of the ILO Maternity Protection Convention 183
Sensitise employers on the Maternity Protection articles of the Women's Act
Employers
sensitized
6,490
6,879
7,292
7,730
8,193
36,585
Sub-subtotal 6,490 6,879 7,292 7,730 8,193 36,585
1.1.10. Support adult literacy
and related programmes
Link VSGs to local literacy
programmes where ever
possible
Number of VSGs
linked to literacy
programmes
-
-
-
-
-
Sub-subtotal
1.1.11. Involve men in
advocacy process
Expand BFCI as explained in
2.2.2
-
-
-
-
Sub-subtotal - - - - -
TOTAL (1) 838,086 633,897 666,199 692,242 739,961 3,570,385
2011-2015 National Nutrition Strategic Plan, NaNA Page 5
Strategies Activities
Outputs/
Outcomes
Year Cost
(US$)
2011
(US$)
2012
(US$)
2013
(US$)
2014
(US$)
2015
(US$)
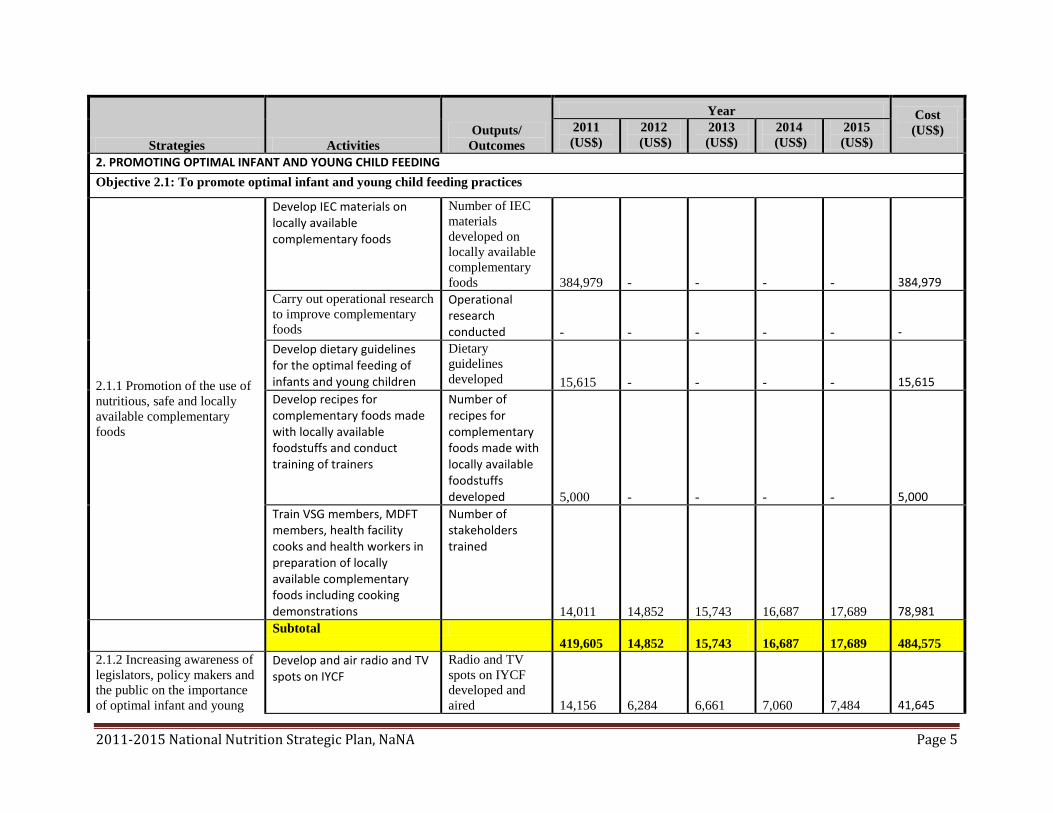
2. PROMOTING OPTIMAL INFANT AND YOUNG CHILD FEEDING
Objective 2.1: To promote optimal infant and young child feeding practices
2.1.1 Promotion of the use of
nutritious, safe and locally
available complementary
foods
Develop IEC materials on locally available complementary foods
Number of IEC
materials
developed on
locally available
complementary
foods
384,979
-
-
-
-
384,979
Carry out operational research
to improve complementary
foods
Operational research conducted
-
-
-
-
-
-
Develop dietary guidelines for the optimal feeding of infants and young children
Dietary
guidelines
developed
15,615
-
-
-
-
15,615
Develop recipes for complementary foods made with locally available foodstuffs and conduct training of trainers
Number of recipes for complementary foods made with locally available foodstuffs developed
5,000
-
-
-
-
5,000
Train VSG members, MDFT members, health facility cooks and health workers in preparation of locally available complementary foods including cooking demonstrations
Number of stakeholders trained
14,011
14,852
15,743
16,687
17,689
78,981
Subtotal
419,605
14,852
15,743
16,687
17,689
484,575
2.1.2 Increasing awareness of
legislators, policy makers and
the public on the importance
of optimal infant and young
Develop and air radio and TV spots on IYCF
Radio and TV
spots on IYCF
developed and
aired 14,156 6,284 6,661 7,060 7,484
41,645
2011-2015 National Nutrition Strategic Plan, NaNA Page 6
Strategies Activities
Outputs/
Outcomes
Year Cost
(US$)
2011
(US$)
2012
(US$)
2013
(US$)
2014
(US$)
2015
(US$)
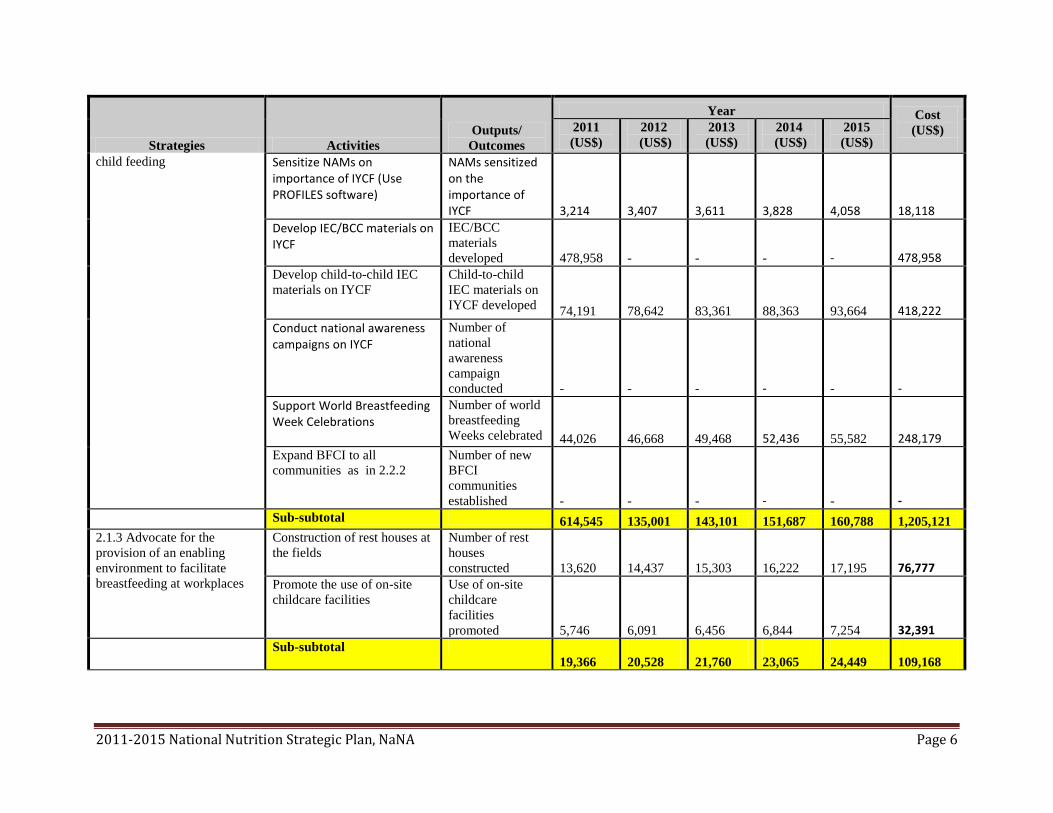
child feeding Sensitize NAMs on importance of IYCF (Use PROFILES software)
NAMs sensitized on the importance of IYCF 3,214 3,407 3,611 3,828 4,058
18,118
Develop IEC/BCC materials on IYCF
IEC/BCC
materials
developed 478,958
-
-
-
-
478,958
Develop child-to-child IEC
materials on IYCF
Child-to-child
IEC materials on
IYCF developed 74,191 78,642 83,361 88,363 93,664
418,222
Conduct national awareness campaigns on IYCF
Number of
national
awareness
campaign
conducted
-
-
-
-
-
-
Support World Breastfeeding Week Celebrations
Number of world
breastfeeding
Weeks celebrated
44,026
46,668
49,468
52,436
55,582
248,179
Expand BFCI to all
communities as in 2.2.2
Number of new
BFCI
communities
established
-
-
-
-
-
-
Sub-subtotal 614,545 135,001 143,101 151,687 160,788 1,205,121
2.1.3 Advocate for the
provision of an enabling
environment to facilitate
breastfeeding at workplaces
Construction of rest houses at
the fields
Number of rest
houses
constructed
13,620
14,437
15,303
16,222
17,195
76,777
Promote the use of on-site
childcare facilities
Use of on-site
childcare
facilities
promoted
5,746
6,091
6,456
6,844
7,254
32,391
Sub-subtotal
19,366
20,528
21,760
23,065
24,449
109,168
2011-2015 National Nutrition Strategic Plan, NaNA Page 7
Strategies Activities
Outputs/
Outcomes
Year Cost
(US$)
2011
(US$)
2012
(US$)
2013
(US$)
2014
(US$)
2015
(US$)
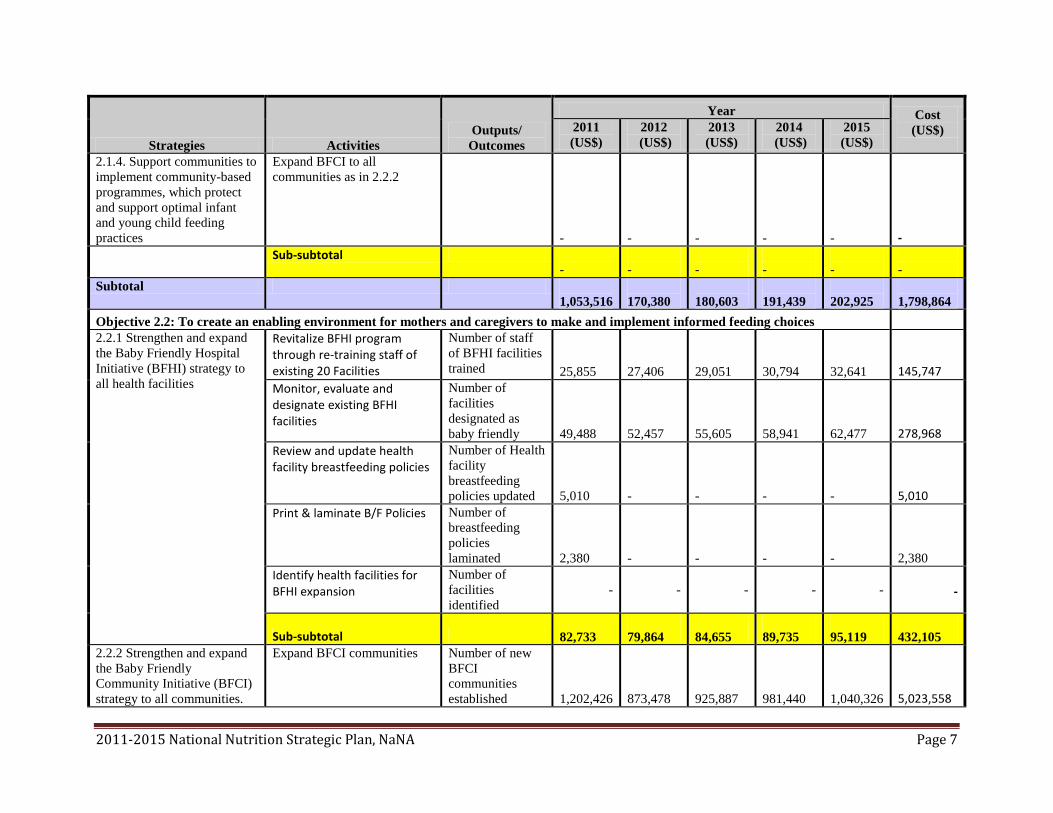
2.1.4. Support communities to
implement community-based
programmes, which protect
and support optimal infant
and young child feeding
practices
Expand BFCI to all
communities as in 2.2.2
-
-
-
-
-
-
Sub-subtotal
-
-
-
-
-
-
Subtotal
1,053,516
170,380
180,603
191,439
202,925
1,798,864
Objective 2.2: To create an enabling environment for mothers and caregivers to make and implement informed feeding choices
2.2.1 Strengthen and expand
the Baby Friendly Hospital
Initiative (BFHI) strategy to
all health facilities
Revitalize BFHI program through re-training staff of existing 20 Facilities
Number of staff
of BFHI facilities
trained
25,855
27,406
29,051
30,794
32,641
145,747
Monitor, evaluate and designate existing BFHI facilities
Number of
facilities
designated as
baby friendly
49,488
52,457
55,605
58,941
62,477
278,968
Review and update health facility breastfeeding policies
Number of Health
facility
breastfeeding
policies updated
5,010
-
-
-
-
5,010
Print & laminate B/F Policies Number of
breastfeeding
policies
laminated
2,380
-
-
-
-
2,380
Identify health facilities for BFHI expansion
Number of
facilities
identified
-
-
-
-
-
-
Sub-subtotal
82,733
79,864
84,655
89,735
95,119
432,105
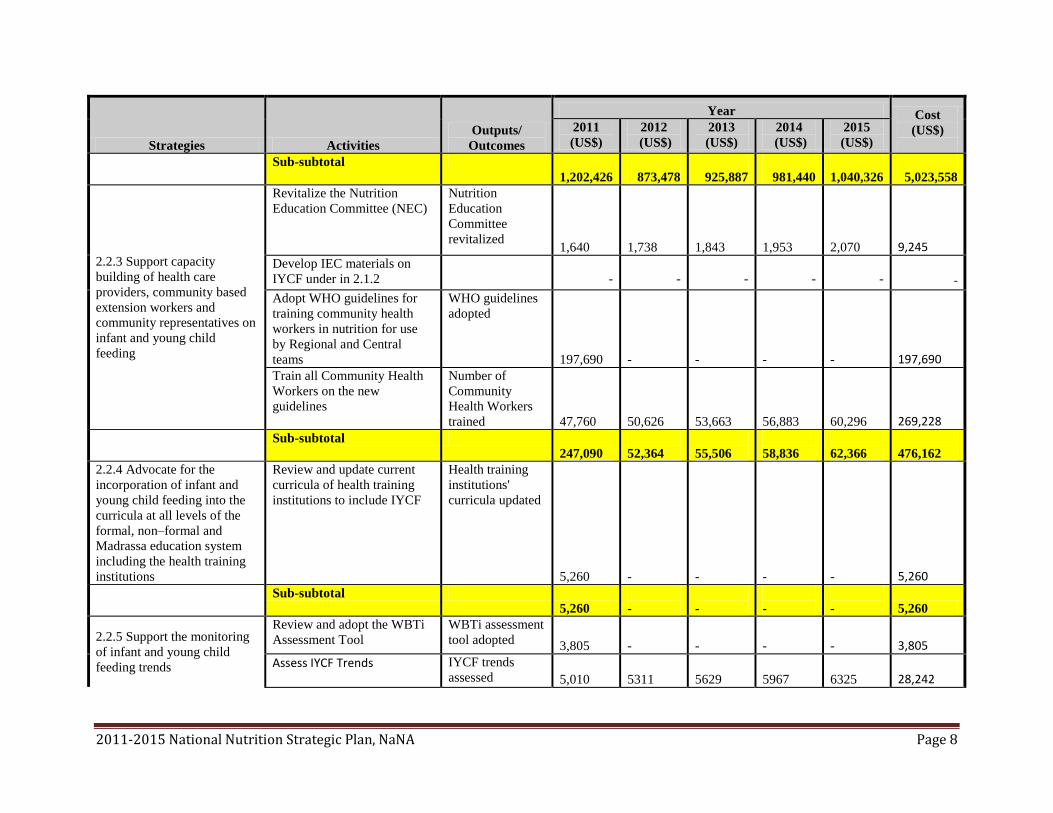
2.2.2 Strengthen and expand
the Baby Friendly
Community Initiative (BFCI)
strategy to all communities.
Expand BFCI communities Number of new
BFCI
communities
established
1,202,426
873,478
925,887
981,440
1,040,326
5,023,558
2011-2015 National Nutrition Strategic Plan, NaNA Page 8
Strategies Activities
Outputs/
Outcomes
Year Cost
(US$)
2011
(US$)
2012
(US$)
2013
(US$)
2014
(US$)
2015
(US$)
Sub-subtotal
1,202,426
873,478
925,887
981,440
1,040,326
5,023,558
2.2.3 Support capacity
building of health care
providers, community based
extension workers and
community representatives on
infant and young child
feeding
Revitalize the Nutrition
Education Committee (NEC)
Nutrition
Education
Committee
revitalized
1,640
1,738
1,843
1,953
2,070
9,245
Develop IEC materials on
IYCF under in 2.1.2
-
-
-
-
-
-
Adopt WHO guidelines for
training community health
workers in nutrition for use
by Regional and Central
teams
WHO guidelines
adopted
197,690
-
-
-
-
197,690
Train all Community Health
Workers on the new
guidelines
Number of
Community
Health Workers
trained 47,760 50,626 53,663 56,883 60,296
269,228
Sub-subtotal
247,090
52,364
55,506
58,836
62,366
476,162
2.2.4 Advocate for the
incorporation of infant and
young child feeding into the
curricula at all levels of the
formal, non–formal and
Madrassa education system
including the health training
institutions
Review and update current
curricula of health training
institutions to include IYCF
Health training
institutions'
curricula updated
5,260
-
-
-
-
5,260
Sub-subtotal
5,260
-
-
-
- 5,260
2.2.5 Support the monitoring
of infant and young child
feeding trends
Review and adopt the WBTi
Assessment Tool
WBTi assessment
tool adopted 3,805
-
-
-
-
3,805
Assess IYCF Trends IYCF trends
assessed 5,010 5311 5629 5967 6325
28,242

2011-2015 National Nutrition Strategic Plan, NaNA Page 9
Strategies Activities
Outputs/
Outcomes
Year Cost
(US$)
2011
(US$)
2012
(US$)
2013
(US$)
2014
(US$)
2015
(US$)
Train community extension
workers in data collection,
analysis and interpretation
(see Theme 11)
-
-
-
-
-
Conduct improved semi-
annual Nutrition Surveillance
Programme under 11.1.2
-
-
-
-
-
Work with National Nutrition Council to encourage member ministries to include IYCF issues in their policies and plans
IYCF issues
included in other
ministries'
policies
-
-
-
-
-
Sub-subtotal 8,815 5,311 5,629 5,967 6,325 32,047
2.2.6 Advocate for the
incorporation of infant and
young child feeding issues
into other relevant sectoral
policies and plans
Sensitize policymakers on
IYCF issues under 2.1.2
-
-
-
-
-
-
Use PROFILES to advocate
for IYCF issues to be
included in relevant sectoral
policies and plans
IYCF issues included in relevant sectoral policies and plans
-
-
-
-
-
-
Sub-subtotal -
-
-
-
-
-
2.2.7 Support Early
Childhood Development
interventions
Expand BFCI under 2.2.2
-
-
-
-
-
-
Coordinate interventions with
Ministry of Education’s EFA
program and NGO-sponsored
ECD programs (e.g.
Children’s Fund)
-
-
-
-
-
-
Sub-subtotal -
-
-
-
-
-
Subtotal (2.2) 1,546,324 1,011,016 1,071,677 1,135,978 1,204,137 5,969,132
2011-2015 National Nutrition Strategic Plan, NaNA Page 10
Strategies Activities
Outputs/
Outcomes
Year Cost
(US$)
2011
(US$)
2012
(US$)
2013
(US$)
2014
(US$)
2015
(US$)
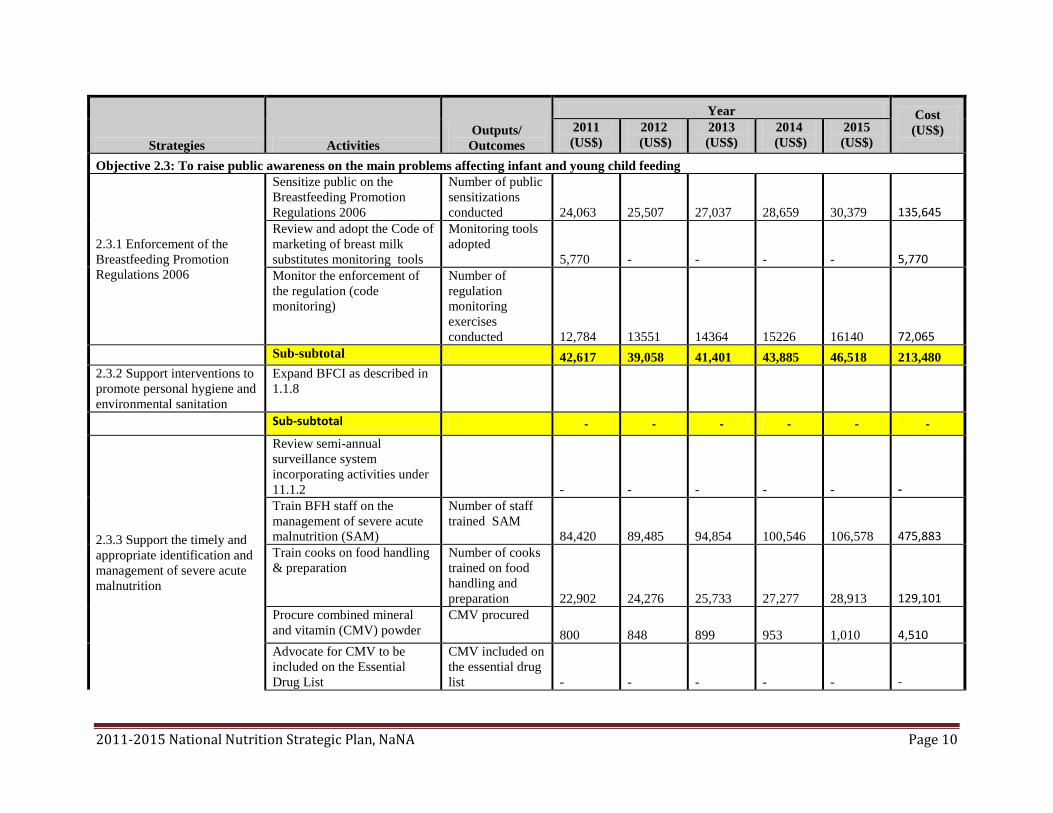
Objective 2.3: To raise public awareness on the main problems affecting infant and young child feeding
2.3.1 Enforcement of the
Breastfeeding Promotion
Regulations 2006
Sensitize public on the
Breastfeeding Promotion
Regulations 2006
Number of public
sensitizations
conducted 24,063
25,507
27,037
28,659
30,379
135,645
Review and adopt the Code of
marketing of breast milk
substitutes monitoring tools
Monitoring tools
adopted
5,770
-
-
-
-
5,770
Monitor the enforcement of
the regulation (code
monitoring)
Number of
regulation
monitoring
exercises
conducted 12,784 13551 14364 15226 16140
72,065
Sub-subtotal 42,617 39,058 41,401 43,885 46,518 213,480
2.3.2 Support interventions to
promote personal hygiene and
environmental sanitation
Expand BFCI as described in
1.1.8
Sub-subtotal - - - - - -
2.3.3 Support the timely and
appropriate identification and
management of severe acute
malnutrition
Review semi-annual
surveillance system
incorporating activities under
11.1.2
-
-
-
-
-
-
Train BFH staff on the
management of severe acute
malnutrition (SAM)
Number of staff
trained SAM
84,420
89,485
94,854
100,546
106,578
475,883
Train cooks on food handling
& preparation
Number of cooks
trained on food
handling and
preparation
22,902
24,276
25,733
27,277
28,913
129,101
Procure combined mineral
and vitamin (CMV) powder
CMV procured
800
848
899
953
1,010
4,510
Advocate for CMV to be
included on the Essential
Drug List
CMV included on
the essential drug
list
-
-
-
-
-
-

2011-2015 National Nutrition Strategic Plan, NaNA Page 11
Strategies Activities
Outputs/
Outcomes
Year Cost
(US$)
2011
(US$)
2012
(US$)
2013
(US$)
2014
(US$)
2015
(US$)
Train health workers in
growth monitoring
Number of health
workers trained
36,763
38,969
41,307
43,785
46,412
207,236
Strengthen and expand
CMAM to more communities
Number of
communities
implementing
CMAM
30,610
32,447
34,393
36,457
38,644
172,551
Sub-subtotal
175,495
186,025
197,186
209,017
221,558
989,282
Subtotal 218,112 225,083 238,587 252,903 268,077 1,202,762
TOTAL (2) 2,817,952 1,406,479 1,490,868 1,580,320 1,675,139 8,970,758
3. FOOD AND NUTRITION SECURITY AT NATIONAL, COMMUNITY AND HOUSEHOLD LEVELS
Objective 3.1: To promote the utilization of diverse and safe foods of high nutritional value
3.1.1 Support IEC/BCC
campaigns on environmental
sanitation, including access to
safe water
Identify, review and update
existing IEC/BCC materials
on sanitation and potable
water
sanitation and
potable water
IEC/BCC
materials updated
3,405
-
-
-
-
3,405
Provide IEC/BCC materials
on sanitation and potable
water to communities
Number of
communities
provided with
IEC/BCC
materials.
20,000
-
-
-
-
20,000
Sub-subtotal
23,405
-
-
-
-
23,405
3.1.2 Promotion of optimal
infant and young child
feeding practices
Carry out activities outlined
in Theme #2, optimal infant
and young child feeding
-
-
-
-
-
-
Sub-subtotal -
-
-
-
-
-
3.1.3 Promotion of inter-
sectoral collaboration in
addressing food and nutrition
security issues
Establish Technical Advisory
Committee described in
Theme #16, Policy
Implementation Framework
-
-
-
-
-
-
Sub-subtotal -
-
-
-
-
-
2011-2015 National Nutrition Strategic Plan, NaNA Page 12
Strategies Activities
Outputs/
Outcomes
Year Cost
(US$)
2011
(US$)
2012
(US$)
2013
(US$)
2014
(US$)
2015
(US$)
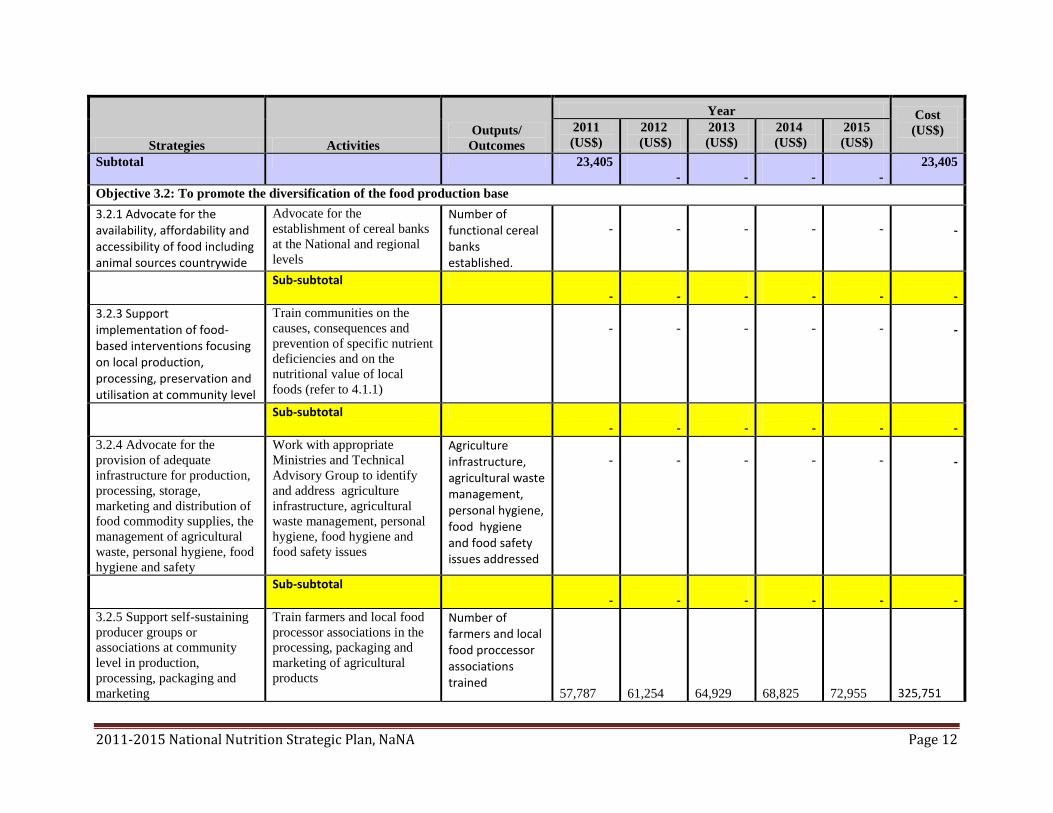
Subtotal 23,405
-
-
-
-
23,405
Objective 3.2: To promote the diversification of the food production base
3.2.1 Advocate for the availability, affordability and accessibility of food including animal sources countrywide
Advocate for the
establishment of cereal banks
at the National and regional
levels
Number of functional cereal banks established.
-
-
-
-
-
-
Sub-subtotal -
-
-
-
-
-
3.2.3 Support implementation of food-based interventions focusing on local production, processing, preservation and utilisation at community level
Train communities on the
causes, consequences and
prevention of specific nutrient
deficiencies and on the
nutritional value of local
foods (refer to 4.1.1)
-
-
-
-
-
-
Sub-subtotal -
-
-
-
-
-
3.2.4 Advocate for the
provision of adequate
infrastructure for production,
processing, storage,
marketing and distribution of
food commodity supplies, the
management of agricultural
waste, personal hygiene, food
hygiene and safety
Work with appropriate
Ministries and Technical
Advisory Group to identify
and address agriculture
infrastructure, agricultural
waste management, personal
hygiene, food hygiene and
food safety issues
Agriculture infrastructure, agricultural waste management, personal hygiene, food hygiene and food safety issues addressed
-
-
-
-
-
-
Sub-subtotal -
-
-
-
-
-
3.2.5 Support self-sustaining
producer groups or
associations at community
level in production,
processing, packaging and
marketing
Train farmers and local food
processor associations in the
processing, packaging and
marketing of agricultural
products
Number of farmers and local food proccessor associations trained
57,787
61,254
64,929
68,825
72,955
325,751
2011-2015 National Nutrition Strategic Plan, NaNA Page 13
Strategies Activities
Outputs/
Outcomes
Year Cost
(US$)
2011
(US$)
2012
(US$)
2013
(US$)
2014
(US$)
2015
(US$)
Sub-subtotal
57,787
61,254
64,929
68,825
72,955
325,751
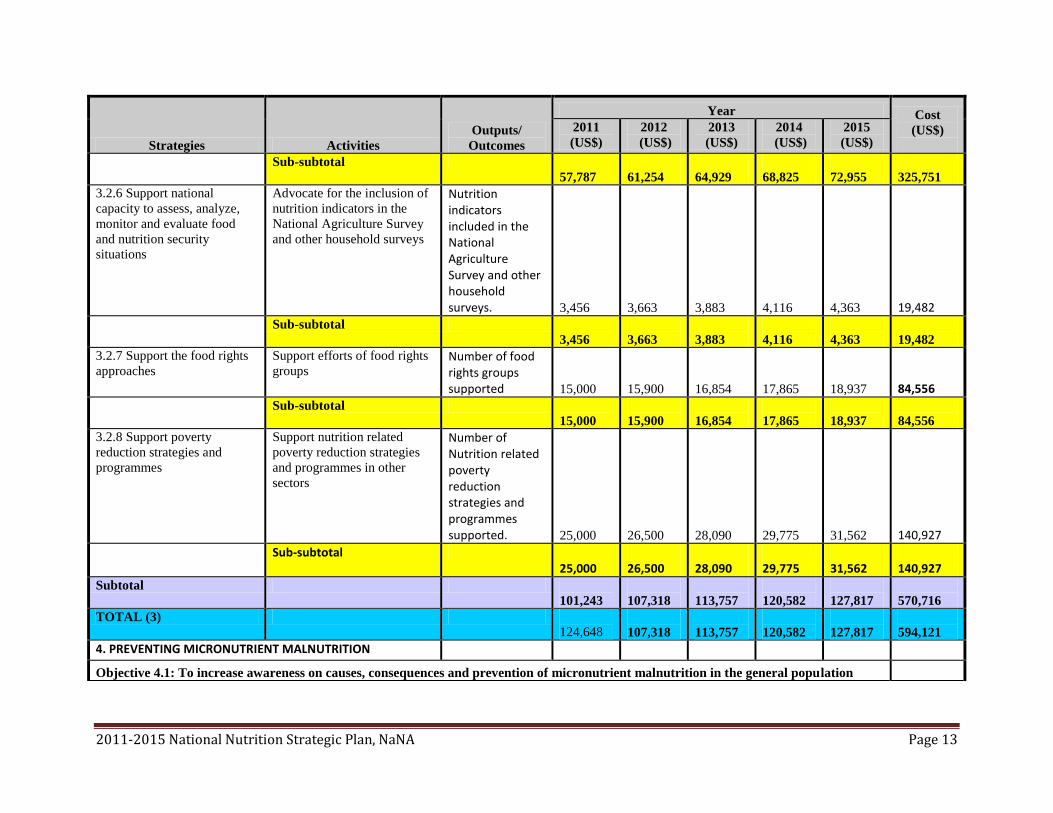
3.2.6 Support national
capacity to assess, analyze,
monitor and evaluate food
and nutrition security
situations
Advocate for the inclusion of
nutrition indicators in the
National Agriculture Survey
and other household surveys
Nutrition indicators included in the National Agriculture Survey and other household surveys.
3,456
3,663
3,883
4,116
4,363
19,482
Sub-subtotal
3,456
3,663
3,883
4,116
4,363
19,482
3.2.7 Support the food rights
approaches
Support efforts of food rights
groups Number of food rights groups supported
15,000
15,900
16,854
17,865
18,937
84,556
Sub-subtotal
15,000
15,900
16,854
17,865
18,937
84,556
3.2.8 Support poverty
reduction strategies and
programmes
Support nutrition related
poverty reduction strategies
and programmes in other
sectors
Number of Nutrition related poverty reduction strategies and programmes supported.
25,000
26,500
28,090
29,775
31,562
140,927
Sub-subtotal 25,000
26,500
28,090
29,775
31,562
140,927
Subtotal
101,243
107,318
113,757
120,582
127,817
570,716
TOTAL (3)
124,648
107,318
113,757
120,582
127,817
594,121
4. PREVENTING MICRONUTRIENT MALNUTRITION
Objective 4.1: To increase awareness on causes, consequences and prevention of micronutrient malnutrition in the general population

2011-2015 National Nutrition Strategic Plan, NaNA Page 14
Strategies Activities
Outputs/
Outcomes
Year Cost
(US$)
2011
(US$)
2012
(US$)
2013
(US$)
2014
(US$)
2015
(US$)
4.1.1 Promote the production,
processing, preservation and
consumption of foods rich in
micronutrients
Support communities in
establishing gardens growing
micro-nutrient rich foods
Number of
communities
supported to
establish gardens 24,000 25,440 26,966 28,584 30,299
135,290
Train community
representatives on the causes,
consequences and prevention
of micronutrient deficiencies
Number of
community
representatives
trained 5,917 6,272 6,648 7,047 7,470
33,355
Sub-subtotal 29,917 31,712 33,615 35,632 37,770 168,645
4.1.2 Revise and update
legislation on micronutrient
fortification of both locally
produced and imported foods
Review and revise Food
Fortification and Salt
Iodization Regulation 2006
Food
Fortification and
Salt Iodization
Regulation 2006
revised 4,377
-
-
-
-
4,377
Present revised regulation to
the National Assembly
Regulation
presented to
National
Assembly
-
-
-
-
-
-
Sub-subtotal 4,377 - - - - 4,377
4.1.3 Implement IEC/BCC
campaign on the importance
of foods rich in
micronutrients
Review and update IEC/BCC
materials (including TV and
radio spots) on micro-nutrient
rich foods
IEC/BCC
materials on
micronutrient rich
foods updated
104,577
-
-
-
-
104,577
Train stakeholders to use
IEC/BCC materials on eating
foods rich in micronutrients
Number of
stakeholders
trained
-
-
-
-
-
-
Disseminate TV and radio
spots on importance of eating
foods rich in micronutrients
TV and radio
spots
disseminated
5,928
6,284
6,661
7,060
7,484
33,417
Sub-subtotal
110,505
6,284
6,661
7,060
7,484
137,994

2011-2015 National Nutrition Strategic Plan, NaNA Page 15
Strategies Activities
Outputs/
Outcomes
Year Cost
(US$)
2011
(US$)
2012
(US$)
2013
(US$)
2014
(US$)
2015
(US$)
4.1.4 Advocate for the
introduction of nutrition
education in the curricula at
all levels of the education
system
Continue working with
Ministry of Education to
develop nutrition curricula for
all levels of primary and
secondary school
Nutriton curricula
for primary and
secondary
schools
developed
-
-
-
-
-
-
Sub-subtotal -
-
-
-
-
-
Subtotal 144,799 37,996 40,275 42,692 45,253 311,016
Objective 4.2: To increase household consumption of iodised salt from 7% in 2005 to 90% by 2015
4.2.1 Support the enforcement
of the Food Fortification and
Salt Iodisation Regulation
2006
Train law enforcement
officers on IDD legislation
Number of law
enforcement
officers trained
13,385
14,188
15,039
15,942
16,898
75,452
Sensitize communities on
requirements of the Food
Fortification and Salt
Iodisation Regulation 2006
Number of
communities
sensitized
13,920
14,755
15,641
16,579
17,574
78,468
Monitor enforcement of the
Food Fortification and Salt
Iodisation Regulation 2006
Number of
monitoring
exercises
conducted
7,464
7,912
8,387
8,890
9,423
42,075
Sub-subtotal 34,769 36,855 39,066 41,410 43,895 195,996
4.2.2 Monitor national
standards for iodized salt,
producer compliance, quality
assurance and measuring
iodine nutrition
Convene a national
stakeholders workshop on salt
iodization
National
stakeholder
workshop
convened
6,057
6,420
6,806
7,214
7,647
34,144
Establish and support the
functioning of a
Micronutrient Deficiency
Control Committee
A functional
Micronutrient
Deficiency
Control
Committee
established
1,440
1,526
1,618
1,715
1,818
8,117
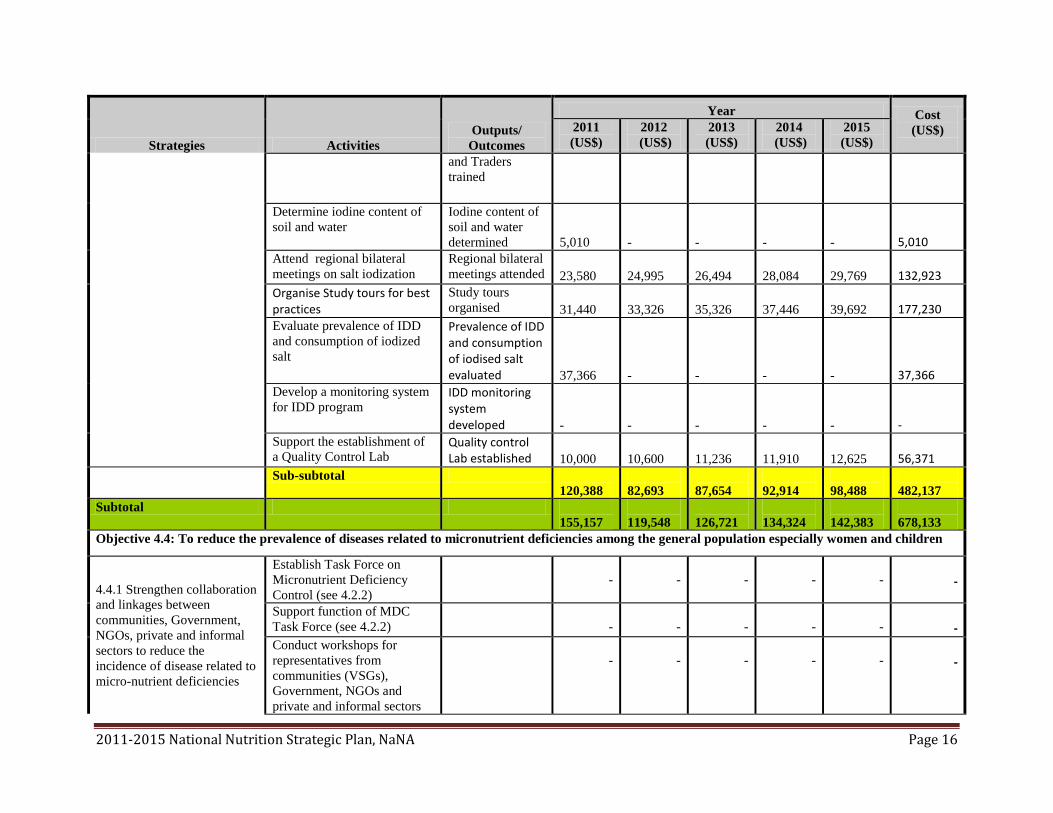
Train National Association of
Salt Producers and Traders on
salt iodization and marketing
National
Association of
Salt Producers
5,495
5,825
6,174
6,545
6,937
30,976
2011-2015 National Nutrition Strategic Plan, NaNA Page 16
Strategies Activities
Outputs/
Outcomes
Year Cost
(US$)
2011
(US$)
2012
(US$)
2013
(US$)
2014
(US$)
2015
(US$)
and Traders
trained
Determine iodine content of
soil and water
Iodine content of
soil and water
determined
5,010
-
-
-
-
5,010
Attend regional bilateral
meetings on salt iodization
Regional bilateral
meetings attended
23,580
24,995
26,494
28,084
29,769
132,923
Organise Study tours for best practices
Study tours
organised
31,440
33,326
35,326
37,446
39,692
177,230
Evaluate prevalence of IDD
and consumption of iodized
salt
Prevalence of IDD and consumption of iodised salt evaluated
37,366
-
-
-
-
37,366
Develop a monitoring system
for IDD program IDD monitoring system developed
-
-
-
-
-
-
Support the establishment of
a Quality Control Lab Quality control Lab established
10,000
10,600
11,236
11,910
12,625
56,371
Sub-subtotal
120,388
82,693
87,654
92,914
98,488
482,137
Subtotal
155,157
119,548
126,721
134,324
142,383
678,133
Objective 4.4: To reduce the prevalence of diseases related to micronutrient deficiencies among the general population especially women and children
4.4.1 Strengthen collaboration
and linkages between
communities, Government,
NGOs, private and informal
sectors to reduce the
incidence of disease related to
micro-nutrient deficiencies
Establish Task Force on
Micronutrient Deficiency
Control (see 4.2.2)
-
-
-
-
-
-
Support function of MDC
Task Force (see 4.2.2)
-
-
-
-
-
-
Conduct workshops for
representatives from
communities (VSGs),
Government, NGOs and
private and informal sectors
-
-
-
-
-
-
2011-2015 National Nutrition Strategic Plan, NaNA Page 17
Strategies Activities
Outputs/
Outcomes
Year Cost
(US$)
2011
(US$)
2012
(US$)
2013
(US$)
2014
(US$)
2015
(US$)
on MDC (see 4.1.1)
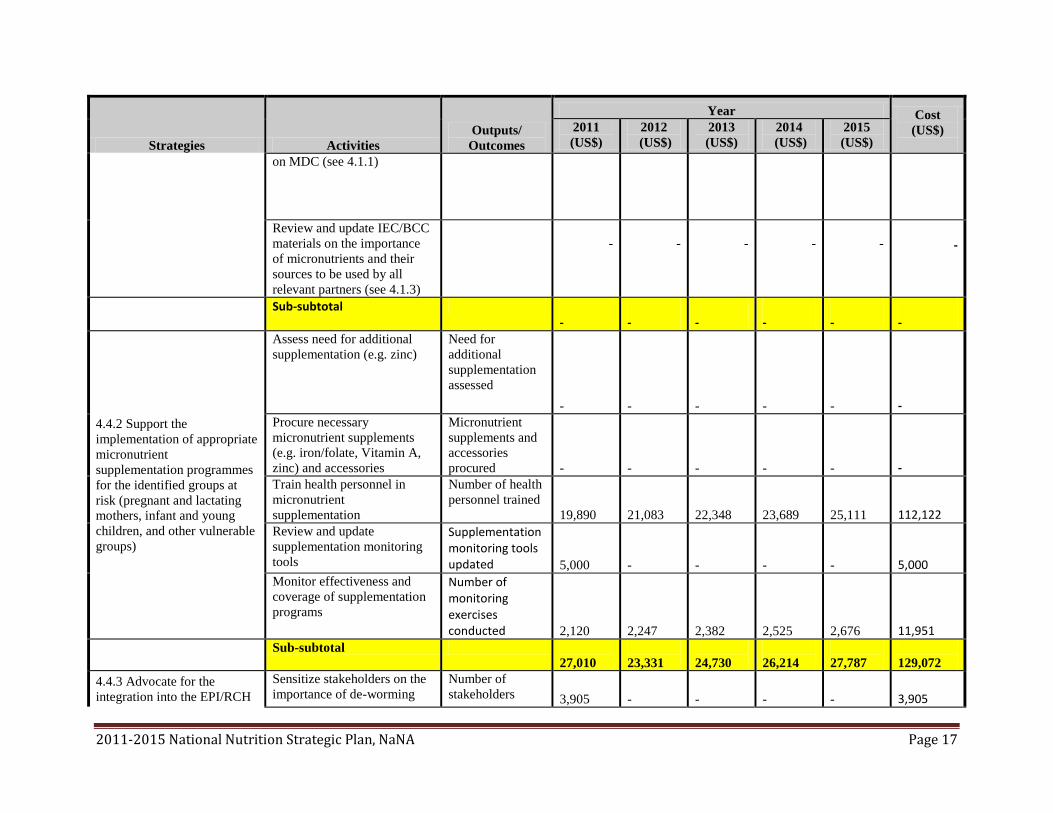
Review and update IEC/BCC
materials on the importance
of micronutrients and their
sources to be used by all
relevant partners (see 4.1.3)
-
-
-
-
-
-
Sub-subtotal -
-
-
-
-
-
4.4.2 Support the
implementation of appropriate
micronutrient
supplementation programmes
for the identified groups at
risk (pregnant and lactating
mothers, infant and young
children, and other vulnerable
groups)
Assess need for additional
supplementation (e.g. zinc)
Need for
additional
supplementation
assessed
-
-
-
-
-
-
Procure necessary
micronutrient supplements
(e.g. iron/folate, Vitamin A,
zinc) and accessories
Micronutrient
supplements and
accessories
procured
-
-
-
-
-
-
Train health personnel in
micronutrient
supplementation
Number of health
personnel trained
19,890
21,083
22,348
23,689
25,111
112,122
Review and update
supplementation monitoring
tools
Supplementation monitoring tools updated
5,000
-
-
-
-
5,000
Monitor effectiveness and
coverage of supplementation
programs
Number of monitoring exercises conducted
2,120
2,247
2,382
2,525
2,676
11,951
Sub-subtotal
27,010
23,331
24,730
26,214
27,787
129,072
4.4.3 Advocate for the
integration into the EPI/RCH
Sensitize stakeholders on the
importance of de-worming
Number of
stakeholders
3,905
-
-
-
-
3,905

2011-2015 National Nutrition Strategic Plan, NaNA Page 18
Strategies Activities
Outputs/
Outcomes
Year Cost
(US$)
2011
(US$)
2012
(US$)
2013
(US$)
2014
(US$)
2015
(US$)
services, routine de-worming
for all children aged 12 - 59
months at 6 monthly intervals.
sensitized
Review and update existing
data collection tools to
include de-worming
Data collection tools updated
3,155
-
-
-
-
3,155
10,000
-
-
-
-
10,000
Sub-subtotal
17,060
-
-
-
-
17,060
Subtotal
44,070
23,331
24,730
26,214
27,787
146,132
TOTAL (4)
344,026
180,874
191,727
203,230
215,424
1,135,281
5. IMPROVING FOOD STANDARDS, QUALITY AND SAFETY
Objective 5.1: To formulate and establish codes of practice for food standards, quality and safety
5.1.1 Support the
establishment of the Food
Standards Agency
Advocate for the
establishment of a Food
Standards Agency
A Food Standards Agency established
6,444
-
-
-
-
6,444
Sub-subtotal 6,444
-
-
-
-
6,444
5.1.2 Support and coordinate
the development of standards
for foods
Review, update and produce
existing standards and code of
practice on identified foods
(National Codex, Sanitary
and Phytosanitary
Committee)
Standards and code of practice on foods produced
14,844
-
-
-
-
14,844
Sub-subtotal
14,844
-
-
-
-
14,844
5.1.3 Coordinate the review,
update and/or formulation of
legislation, guidelines and
codes of practice on food
quality and safety
Support the review and
updating of existing
legislation, guidelines and
codes of practice on food
quality and safety
Legislation, guidelines and codes of practice on food quality
14,844 -
-
-
-
14,844

2011-2015 National Nutrition Strategic Plan, NaNA Page 19
Strategies Activities
Outputs/
Outcomes
Year Cost
(US$)
2011
(US$)
2012
(US$)
2013
(US$)
2014
(US$)
2015
(US$)
and safety updated
Sub-subtotal
14,844
-
-
-
-
14,844
5.1.4 Promotion of regional
and international co-operation
in the area of food standards,
safety and quality control
Support Codex Members to
attend regional and
international meetings
Number of Codex Members attending regional and international meetings
24,000
25,440
26,966
28,584
30,299
135,290
Establish a working
relationship for institutional
cooperation in food standards,
safety and quality control
within the region (e.g. the
laboratories)
Institutional cooperation in food standards, safety and quality control established
45,460
48,188
51,079
54,144
57,392
256,262
Study tour Study tours organised
31,440
33,326
35,326
37,446
39,692
177,230
Sub-subtotal
100,900
106,954
113,371
120,174
127,384
568,783
5.1.5 Support the coordination
of the National
Codex/Sanitary and
Phytosanitary Committee,
Compliance Committee and
Food Control Advisory Board
Support the functioning of the
Codex and Compliance
committees and the Food
Control Advisory Board
Codex and compliance committees and the Food Control Advisory Board Supported
3,600
3,816
4,045
4,288
4,545
20,294
Sub-subtotal
3,600
3,816
4,045
4,288
4,545
20,294
5.1.6 Support the functioning
of Consumer Protection
Groups
Sensitization of the public on
food safety and quality issues Number of public sensitizations conducted
7,722
8,185
8,676
9,197
9,749
43,530

2011-2015 National Nutrition Strategic Plan, NaNA Page 20
Strategies Activities
Outputs/
Outcomes
Year Cost
(US$)
2011
(US$)
2012
(US$)
2013
(US$)
2014
(US$)
2015
(US$)
Sub-subtotal
7,722
8,185
8,676
9,197
9,749
43,530
5.1.7 Support the functioning
of National Laboratories to
ensure food quality and safety
Procure equipment and reagents
Equipment and reagents procured
50,000
53,000
56,180
59,551
63,124
281,855
Support the networking of the laboratories
Number of Networking Laboratories
2,212
2,345
2,485
2,635
2,793
12,469
Support the training of laboratory personnel
Number of personnel laboratory trained
31,097
32,963
34,941
37,037
39,259
175,297
Sub-subtotal
83,309
88,308
93,606
99,222
105,176
469,621
5.1.8 Coordination of
intersectoral actions towards
the implementation of the
Food Act 2005
Train stakeholders on the
Food Act 2005 (or new Act) Number of stakeholders trained
9,469
10,037
10,639
11,278
11,954
53,378
Produce the Food Act Number of copies of the Food Act produced
1,200
1,272
1,348
1,429
1,515
6,765
Sub-subtotal
10,669
11,309
11,988
12,707
13,469
60,142
Subtotal
242,332
218,572
231,686
245,587
260,323
1,198,501
5.2 To raise public awareness on the importance of food quality and safety
5.2.1 Coordination of public
information and/or
educational activities to
sensitise the population on
food quality and safety
Develop and produce
IEC/BCC materials Number and types of IEC/BCC materials produced
99,405
-
-
-
-
99,405
IEC/BCC training on food
quality and safety Number of people trained
5,425
5,751
6,096
6,461
6,849
30,581
Sub-subtotal
104,830
5,751
6,096
6,461
6,849
129,986

2011-2015 National Nutrition Strategic Plan, NaNA Page 21
Strategies Activities
Outputs/
Outcomes
Year Cost
(US$)
2011
(US$)
2012
(US$)
2013
(US$)
2014
(US$)
2015
(US$)
5.2.2 Awareness creation of
the food industry stakeholders
on the food control laws,
regulations and standards
Train food industry
stakeholders on food control
laws, regulations and
standards
Number of food industry stakeholders trained
32,413
34,358
36,419
38,604
40,921
182,715
Sub-subtotal
32,413
34,358
36,419
38,604
40,921
182,715
Subtotal
137,243
40,108
42,515
45,066
47,770
312,701
TOTAL (5)
379,575
258,680
274,201
290,653
308,092
1,511,202
6. NUTRITION AND INFECTIOUS DISEASES
Objective 6.1: To improve the nutritional status of children under five, pregnant and lactating women and other vulnerable groups
6.1.1 Continuous promotion
of optimal infant and young
child feeding practices at all
levels
Support completion of
activities under Theme 2,
Promoting Optimal Infant
and Young Child Feeding
Sub-subtotal -
-
-
-
-
-
6.1.2 Strengthen the
management of severely
malnourished children at
community and health facility
levels
Train health personnel in
management of severely
malnourished children
Number of health personnel trained
Train VSGs/community
representatives in community
management of severely
malnourished children
Number of
VSGs/community
representatives
trained
Procure RUTF and other
supplies
RUTF and other
supplies Procured 57,948 61,425 65,110 69,017 73,158
326,658
Produce training manual on
the management of severe
acute malnutrition
Number of
Training manuals
produced
-
-
-
-
-
-
Sub-subtotal
57,948
61,425
65,110
69,017
73,158
326,658
2011-2015 National Nutrition Strategic Plan, NaNA Page 22
Strategies Activities
Outputs/
Outcomes
Year Cost
(US$)
2011
(US$)
2012
(US$)
2013
(US$)
2014
(US$)
2015
(US$)
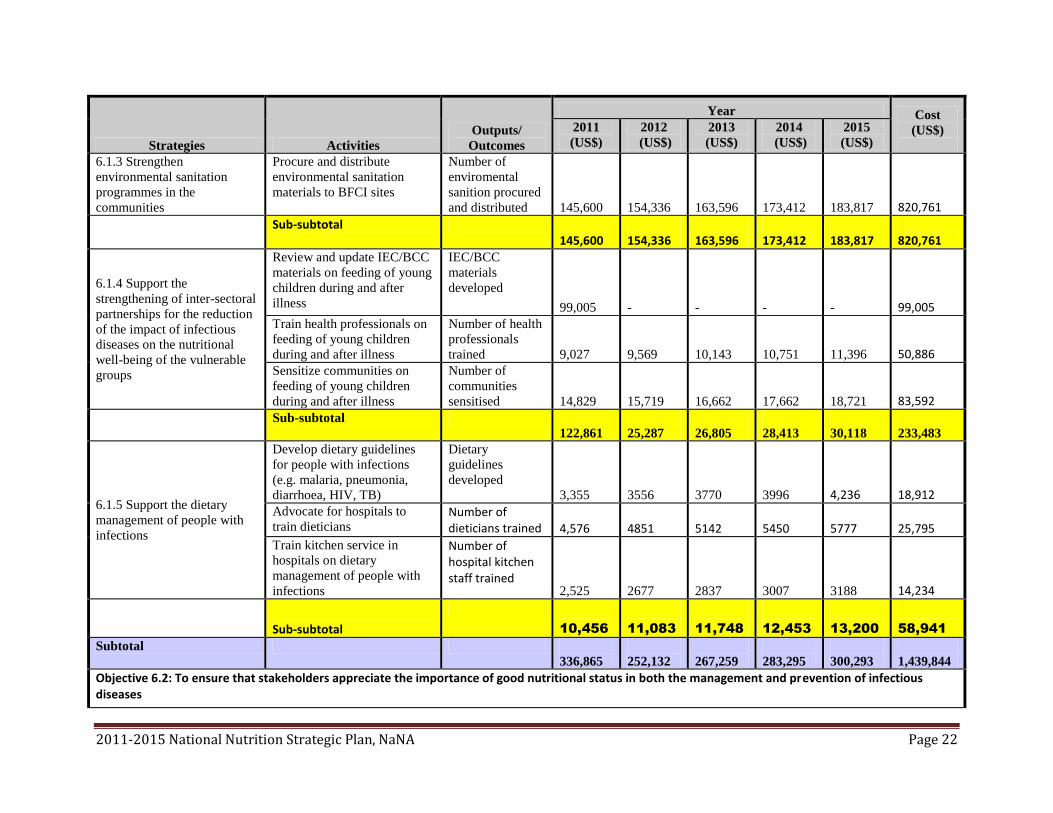
6.1.3 Strengthen
environmental sanitation
programmes in the
communities
Procure and distribute
environmental sanitation
materials to BFCI sites
Number of
enviromental
sanition procured
and distributed
145,600
154,336
163,596
173,412
183,817
820,761
Sub-subtotal 145,600
154,336
163,596
173,412
183,817
820,761
6.1.4 Support the
strengthening of inter-sectoral
partnerships for the reduction
of the impact of infectious
diseases on the nutritional
well-being of the vulnerable
groups
Review and update IEC/BCC
materials on feeding of young
children during and after
illness
IEC/BCC
materials
developed
99,005
-
-
-
-
99,005
Train health professionals on
feeding of young children
during and after illness
Number of health
professionals
trained
9,027
9,569
10,143
10,751
11,396
50,886
Sensitize communities on
feeding of young children
during and after illness
Number of
communities
sensitised
14,829
15,719
16,662
17,662
18,721
83,592
Sub-subtotal
122,861
25,287
26,805
28,413
30,118
233,483
6.1.5 Support the dietary
management of people with
infections
Develop dietary guidelines
for people with infections
(e.g. malaria, pneumonia,
diarrhoea, HIV, TB)
Dietary
guidelines
developed
3,355 3556 3770 3996
4,236
18,912
Advocate for hospitals to
train dieticians Number of dieticians trained 4,576 4851 5142 5450 5777
25,795
Train kitchen service in
hospitals on dietary
management of people with
infections
Number of hospital kitchen staff trained
2,525 2677 2837 3007 3188
14,234
Sub-subtotal
10,456
11,083
11,748
12,453
13,200
58,941
Subtotal
336,865
252,132
267,259
283,295
300,293
1,439,844
Objective 6.2: To ensure that stakeholders appreciate the importance of good nutritional status in both the management and prevention of infectious diseases

2011-2015 National Nutrition Strategic Plan, NaNA Page 23
Strategies Activities
Outputs/
Outcomes
Year Cost
(US$)
2011
(US$)
2012
(US$)
2013
(US$)
2014
(US$)
2015
(US$)
6.2.1 Support the systematic
collection, efficient
management and
dissemination of
epidemiological information
on infectious diseases
Develop Nutrition
Information System at
regional and national level
and train users
Nutrition Information System Developed
5,010
-
-
-
-
5,010
Sub-subtotal
5,010
-
-
-
-
5,010
6.2.2 Advocate for the
enforcement of legislation and
regulations related to
environmental sanitation
-
-
-
-
-
-
Sub-subtotal -
-
-
-
-
-
6.2.3 Strengthen IEC/BCC on
the role of nutrition in the
prevention and management
of infectious diseases
Review and update IEC/BCC
materials on dietary
prevention and management
of infectious diseases
IEC/BCC materials updated
-
-
-
-
-
-
Train stakeholders on the role
of nutrition in the prevention
and management of infectious
diseases
Number of stakeholders trained
-
-
-
-
-
-
Sub-subtotal -
-
-
-
-
-
Subtotal
5,010
-
-
-
-
5,010
TOTAL (6)
341,875
252,132
267,259
283,295
300,293
1,444,854
7. PREVENTING AND MANAGING DIET-RELATED NON-COMMUNICABLE DISEASES
Objective 7.1: To increase awareness of the risk factors and major determinants of diet-related NCDs
7.1.1 Strengthen the IEC/BCC
on diet-related NCDs
Review and update IEC/BCC
materials on diet-related
NCDs
IEC/BCC
materials updated
1,953
-
-
-
-
1,953
Sub-subtotal
1,953
-
-
-
-
1,953
2011-2015 National Nutrition Strategic Plan, NaNA Page 24
Strategies Activities
Outputs/
Outcomes
Year Cost
(US$)
2011
(US$)
2012
(US$)
2013
(US$)
2014
(US$)
2015
(US$)
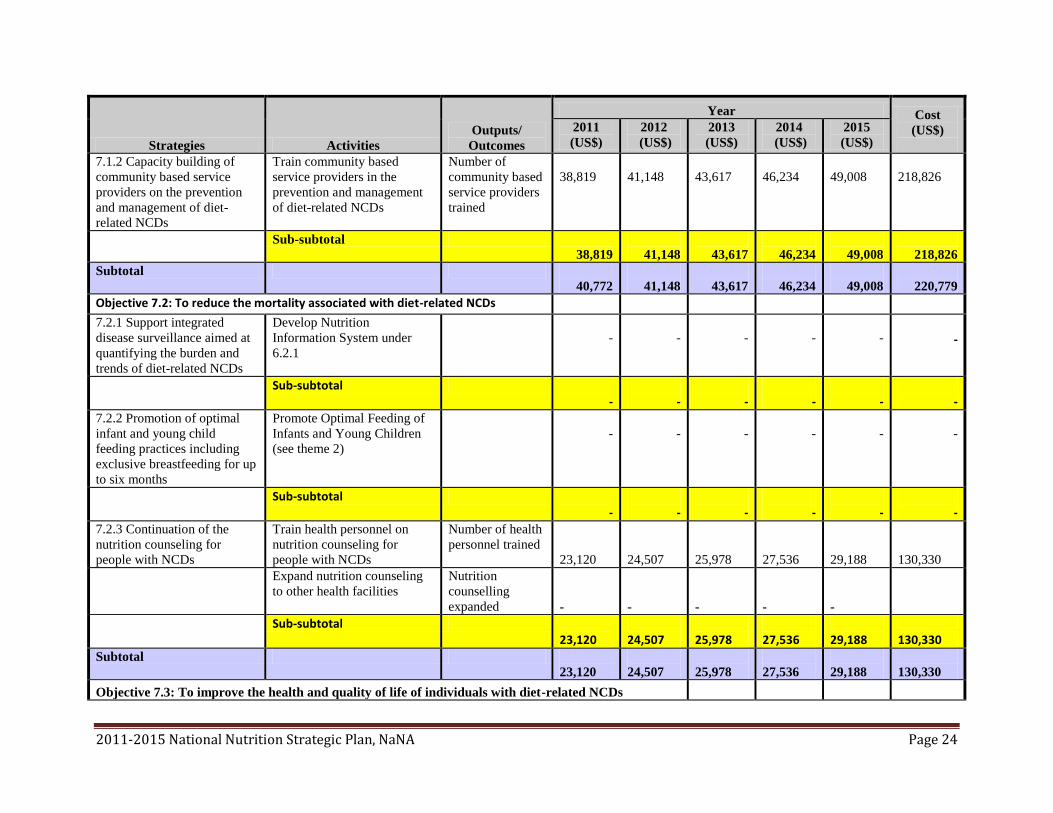
7.1.2 Capacity building of
community based service
providers on the prevention
and management of diet-
related NCDs
Train community based
service providers in the
prevention and management
of diet-related NCDs
Number of
community based
service providers
trained
38,819
41,148
43,617
46,234
49,008
218,826
Sub-subtotal
38,819
41,148
43,617
46,234
49,008
218,826
Subtotal
40,772
41,148
43,617
46,234
49,008
220,779
Objective 7.2: To reduce the mortality associated with diet-related NCDs
7.2.1 Support integrated
disease surveillance aimed at
quantifying the burden and
trends of diet-related NCDs
Develop Nutrition
Information System under
6.2.1
-
-
-
-
-
-
Sub-subtotal -
-
-
-
-
-
7.2.2 Promotion of optimal
infant and young child
feeding practices including
exclusive breastfeeding for up
to six months
Promote Optimal Feeding of
Infants and Young Children
(see theme 2)
-
-
-
-
-
-
Sub-subtotal -
-
-
-
-
-
7.2.3 Continuation of the
nutrition counseling for
people with NCDs
Train health personnel on
nutrition counseling for
people with NCDs
Number of health
personnel trained
23,120
24,507
25,978
27,536
29,188
130,330
Expand nutrition counseling
to other health facilities
Nutrition
counselling
expanded
-
-
-
-
-
Sub-subtotal 23,120
24,507
25,978
27,536
29,188
130,330
Subtotal
23,120
24,507
25,978
27,536
29,188
130,330
Objective 7.3: To improve the health and quality of life of individuals with diet-related NCDs

2011-2015 National Nutrition Strategic Plan, NaNA Page 25
Strategies Activities
Outputs/
Outcomes
Year Cost
(US$)
2011
(US$)
2012
(US$)
2013
(US$)
2014
(US$)
2015
(US$)
7.3.1 Advocate for the
formulation of an evidence
based policy on diet-related
NCDs
Conduct research on the
incidence and causes of diet-
related NCDs
Research
conducted
10,000
-
-
-
-
10,000
Advocate for the development
of a policy on diet-related
NCDs
Diet related
NCD Policy
developed
2,515
-
-
-
-
2,515
Sub-subtotal 12,515
-
-
-
-
12,515
7.3.2 Support the
development of partnerships
with public, private sector and
NGOs in the prevention of
diet-related NCDs
Support Technical Advisory
Committee to strengthen
prevention of diet-related
NCDs (See….)
TAC
strengthened
-
-
-
-
-
-
Sub-subtotal -
-
-
-
-
-
7.3.3 Advocate for increased
recreation facilities and their
usage to improve physical
activity
Sensitize local government
authorities on the importance
of playgrounds and other
recreation facilities in the
prevention and management
of NCDs
Number of Local Government Authorities trained
7,287
-
-
-
-
7,287
Sub-subtotal 7,287
-
-
-
-
7,287
Subtotal
19,802
-
-
-
-
19,802
TOTAL (7)
83,694
65,655
69,595
73,770
78,197
370,911
8. CARING FOR THE SOCIO-ECONOMICALLY DEPRIVED & NUTRITIONALLY VULNERABLE
Objective 8.1: To establish an effective nutritional care and support system for the socio-economically deprived and nutritionally vulnerable groups
8.1.1 Capacity building for
the provision of nutritional
care and support to the socio-
economically deprived and
nutritionally vulnerable
Develop training modules on
nutritional care and support
Training modules
developed
-
-
-
-
-
-
2011-2015 National Nutrition Strategic Plan, NaNA Page 26
Strategies Activities
Outputs/
Outcomes
Year Cost
(US$)
2011
(US$)
2012
(US$)
2013
(US$)
2014
(US$)
2015
(US$)
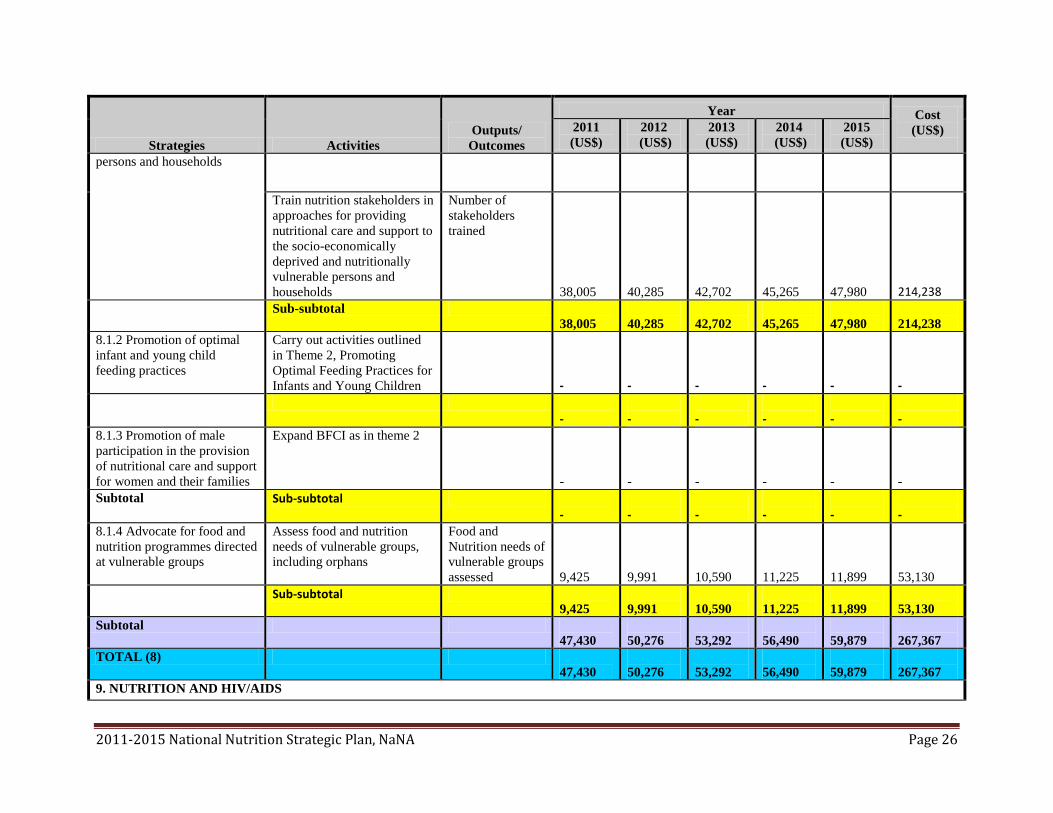
persons and households
Train nutrition stakeholders in
approaches for providing
nutritional care and support to
the socio-economically
deprived and nutritionally
vulnerable persons and
households
Number of
stakeholders
trained
38,005
40,285
42,702
45,265
47,980
214,238
Sub-subtotal
38,005
40,285
42,702
45,265
47,980
214,238
8.1.2 Promotion of optimal
infant and young child
feeding practices
Carry out activities outlined
in Theme 2, Promoting
Optimal Feeding Practices for
Infants and Young Children
-
-
-
-
-
-
-
-
-
-
-
-
8.1.3 Promotion of male
participation in the provision
of nutritional care and support
for women and their families
Expand BFCI as in theme 2
-
-
-
-
-
-
Subtotal Sub-subtotal -
-
-
-
-
-
8.1.4 Advocate for food and
nutrition programmes directed
at vulnerable groups
Assess food and nutrition
needs of vulnerable groups,
including orphans
Food and
Nutrition needs of
vulnerable groups
assessed
9,425
9,991
10,590
11,225
11,899
53,130
Sub-subtotal
9,425
9,991
10,590
11,225
11,899
53,130
Subtotal
47,430
50,276
53,292
56,490
59,879
267,367
TOTAL (8)
47,430
50,276
53,292
56,490
59,879
267,367
9. NUTRITION AND HIV/AIDS

2011-2015 National Nutrition Strategic Plan, NaNA Page 27
Strategies Activities
Outputs/
Outcomes
Year Cost
(US$)
2011
(US$)
2012
(US$)
2013
(US$)
2014
(US$)
2015
(US$)
9.1 To increase awareness on the relationship between nutrition and HIV/AIDS -
9.1.1 Intensification of
Nutrition and HIV/AIDS
education through outreach
programmes and grass root
organizations
Organize national conference
on nutrition and HIV/AIDS
National
Conference
organised
10,240
-
-
-
-
10,240
Review BFHI breastfeeding
policies to incorporate
HIV/AIDS (see theme 2)
-
-
-
-
-
-
Review and update IEC/BCC
materials on nutrition and
HIV/AIDS
IEC/BCC
materials updated
98,155
-
-
-
-
98,155
Train stakeholders on
nutrition and HIV/AIDS
Number of
stakeholders
trained
43,019
45,600
48,336
51,236
54,310
242,502
Integrate nutrition indicators
into the HIV/AIDS
monitoring system
Nutrition indicators integrated into HIV/AIDs monitoring system
3,555
-
-
-
-
3,555
Sub-subtotal
154,969
45,600
48,336
51,236
54,310
354,452
9.1.2 Promotion of activities
of primary HIV prevention
Train stakeholders under
9.1.1
-
-
-
-
-
-
Sub-subtotal -
-
-
-
-
-
9.1.3 Strengthened
collaboration with other
institutions working in
HIV/AIDS
Sponsor annual national
conference under 9.1.1
-
-
-
-
-
-
Sub-subtotal -
-
-
-
-
-
Subtotal
154,969
45,600
48,336
51,236
54,310
354,452
2011-2015 National Nutrition Strategic Plan, NaNA Page 28
Strategies Activities
Outputs/
Outcomes
Year Cost
(US$)
2011
(US$)
2012
(US$)
2013
(US$)
2014
(US$)
2015
(US$)
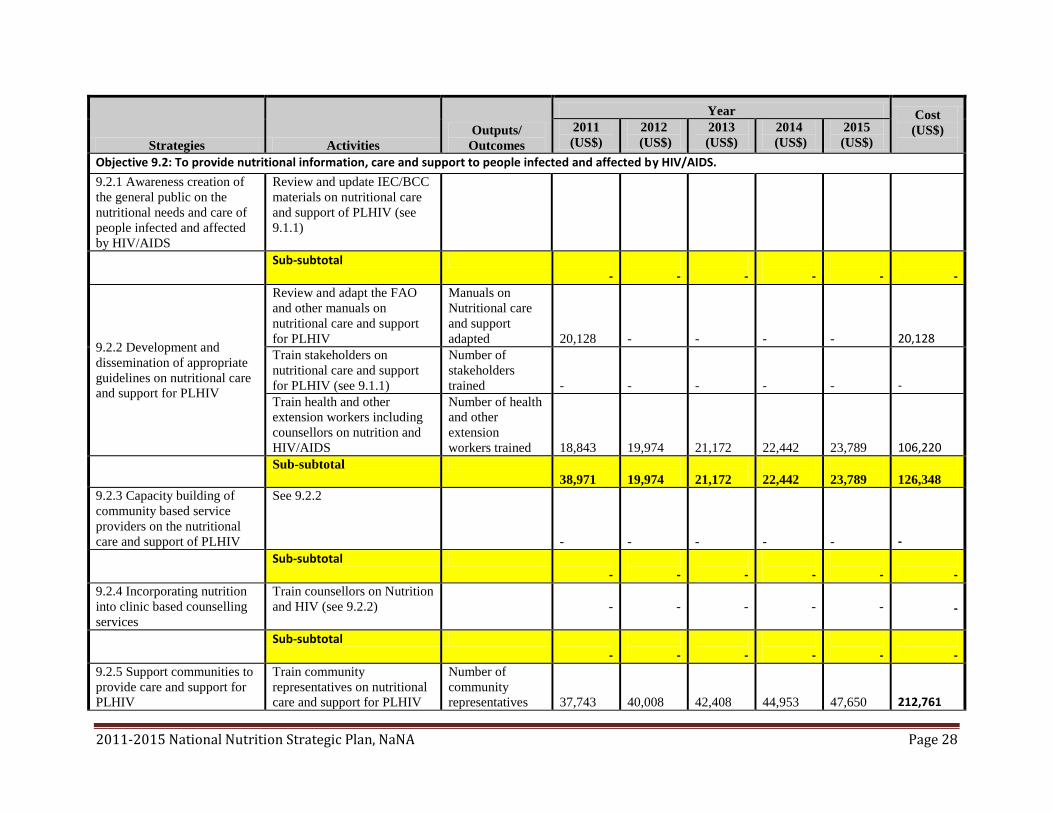
Objective 9.2: To provide nutritional information, care and support to people infected and affected by HIV/AIDS.
9.2.1 Awareness creation of
the general public on the
nutritional needs and care of
people infected and affected
by HIV/AIDS
Review and update IEC/BCC
materials on nutritional care
and support of PLHIV (see
9.1.1)
Sub-subtotal -
-
-
-
-
-
9.2.2 Development and
dissemination of appropriate
guidelines on nutritional care
and support for PLHIV
Review and adapt the FAO
and other manuals on
nutritional care and support
for PLHIV
Manuals on
Nutritional care
and support
adapted
20,128
-
-
-
-
20,128
Train stakeholders on
nutritional care and support
for PLHIV (see 9.1.1)
Number of
stakeholders
trained
-
-
-
-
-
-
Train health and other
extension workers including
counsellors on nutrition and
HIV/AIDS
Number of health
and other
extension
workers trained
18,843
19,974
21,172
22,442
23,789
106,220
Sub-subtotal
38,971
19,974
21,172
22,442
23,789
126,348
9.2.3 Capacity building of
community based service
providers on the nutritional
care and support of PLHIV
See 9.2.2
-
-
-
-
-
-
Sub-subtotal -
-
-
-
-
-
9.2.4 Incorporating nutrition
into clinic based counselling
services
Train counsellors on Nutrition
and HIV (see 9.2.2)
-
-
-
-
-
-
Sub-subtotal -
-
-
-
-
-
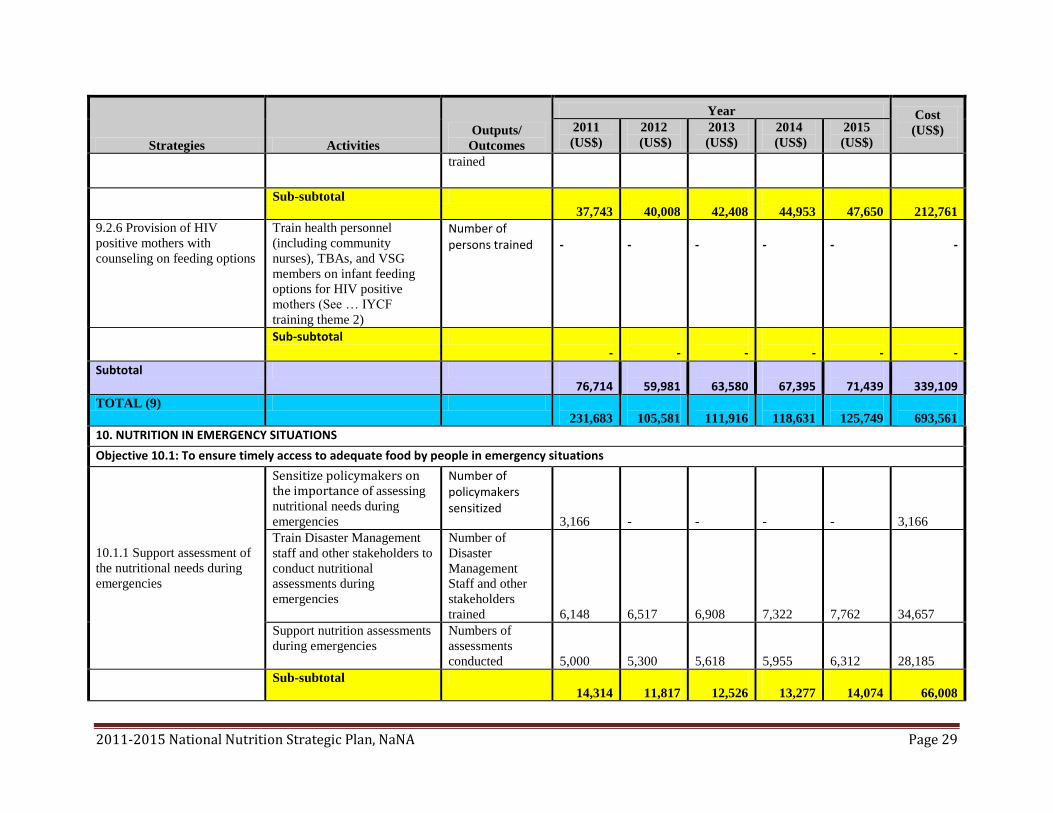
9.2.5 Support communities to
provide care and support for
PLHIV
Train community
representatives on nutritional
care and support for PLHIV
Number of
community
representatives
37,743
40,008
42,408
44,953
47,650
212,761
2011-2015 National Nutrition Strategic Plan, NaNA Page 29
Strategies Activities
Outputs/
Outcomes
Year Cost
(US$)
2011
(US$)
2012
(US$)
2013
(US$)
2014
(US$)
2015
(US$)
trained
Sub-subtotal
37,743
40,008
42,408
44,953
47,650
212,761
9.2.6 Provision of HIV
positive mothers with
counseling on feeding options
Train health personnel
(including community
nurses), TBAs, and VSG
members on infant feeding
options for HIV positive
mothers (See … IYCF
training theme 2)
Number of persons trained
-
-
-
-
-
-
Sub-subtotal -
-
-
-
-
-
Subtotal 76,714
59,981
63,580
67,395
71,439
339,109
TOTAL (9)
231,683
105,581
111,916
118,631
125,749
693,561
10. NUTRITION IN EMERGENCY SITUATIONS
Objective 10.1: To ensure timely access to adequate food by people in emergency situations
10.1.1 Support assessment of
the nutritional needs during
emergencies
Sensitize policymakers on the importance of assessing
nutritional needs during
emergencies
Number of policymakers sensitized
3,166
-
-
-
-
3,166
Train Disaster Management
staff and other stakeholders to
conduct nutritional
assessments during
emergencies
Number of
Disaster
Management
Staff and other
stakeholders
trained
6,148
6,517
6,908
7,322
7,762
34,657
Support nutrition assessments
during emergencies
Numbers of
assessments
conducted
5,000
5,300
5,618
5,955
6,312
28,185
Sub-subtotal
14,314
11,817
12,526
13,277
14,074
66,008
2011-2015 National Nutrition Strategic Plan, NaNA Page 30
Strategies Activities
Outputs/
Outcomes
Year Cost
(US$)
2011
(US$)
2012
(US$)
2013
(US$)
2014
(US$)
2015
(US$)
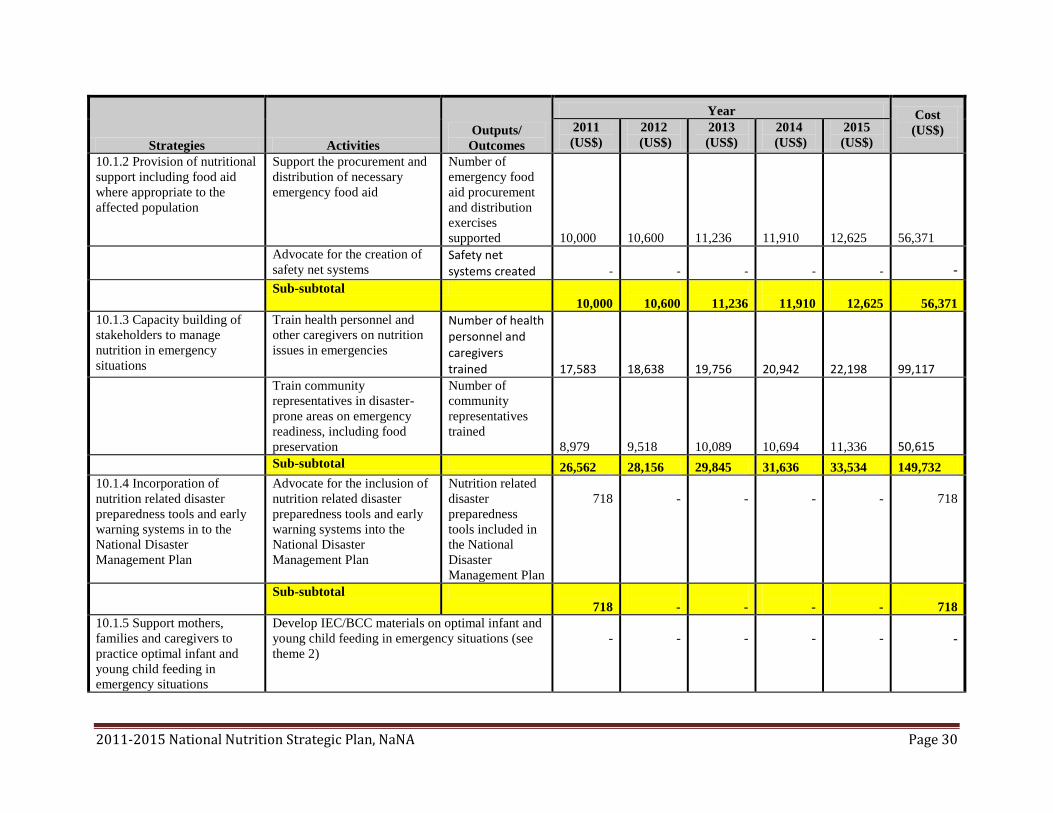
10.1.2 Provision of nutritional
support including food aid
where appropriate to the
affected population
Support the procurement and
distribution of necessary
emergency food aid
Number of
emergency food
aid procurement
and distribution
exercises
supported
10,000
10,600
11,236
11,910
12,625
56,371
Advocate for the creation of
safety net systems Safety net systems created
-
-
-
-
-
-
Sub-subtotal
10,000
10,600
11,236
11,910
12,625
56,371
10.1.3 Capacity building of
stakeholders to manage
nutrition in emergency
situations
Train health personnel and
other caregivers on nutrition
issues in emergencies
Number of health personnel and caregivers trained
17,583
18,638
19,756
20,942
22,198
99,117
Train community
representatives in disaster-
prone areas on emergency
readiness, including food
preservation
Number of
community
representatives
trained
8,979
9,518
10,089
10,694
11,336
50,615
Sub-subtotal 26,562 28,156 29,845 31,636 33,534 149,732
10.1.4 Incorporation of
nutrition related disaster
preparedness tools and early
warning systems in to the
National Disaster
Management Plan
Advocate for the inclusion of
nutrition related disaster
preparedness tools and early
warning systems into the
National Disaster
Management Plan
Nutrition related
disaster
preparedness
tools included in
the National
Disaster
Management Plan
718
-
-
-
-
718
Sub-subtotal
718
-
-
-
-
718
10.1.5 Support mothers,
families and caregivers to
practice optimal infant and
young child feeding in
emergency situations
Develop IEC/BCC materials on optimal infant and
young child feeding in emergency situations (see
theme 2)
-
-
-
-
-
-

2011-2015 National Nutrition Strategic Plan, NaNA Page 31
Strategies Activities
Outputs/
Outcomes
Year Cost
(US$)
2011
(US$)
2012
(US$)
2013
(US$)
2014
(US$)
2015
(US$)
Train Disaster Management
staff and other stakeholders
on optimal infant and young
child feeding in emergency
situations
Number of
Disaster
Management
Staff and other
stakeholders
trained
4,203
4,455
4,722
5,006
5,306
23,693
Sub-subtotal
4,203
4,455
4,722
5,006
5,306
23,693
10.1.6 Institute mechanisms
for timely access to adequate
and quality food for people in
emergency situations
see 10.1.2 -
-
-
-
-
-
Sub-subtotal -
-
-
-
-
-
TOTAL (10)
55,797
55,028
58,329
61,829
65,539
296,522
11. NUTRITION SURVEILLANCE
Objective 11.1: To make nutrition information available to all stakeholders for appropriate decision making, planning, policy development and
programming
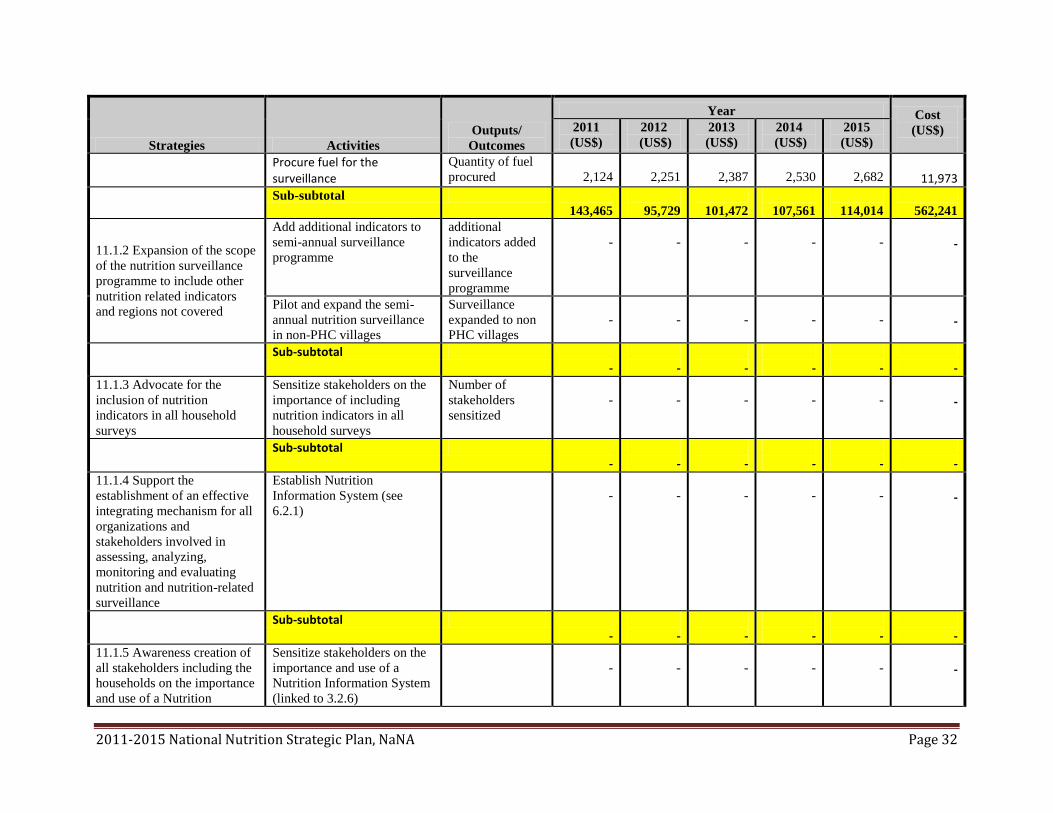
11.1.1 Strengthen institutional
capacity at all levels, to
efficiently compile, assess,
analyse and monitor nutrition
and nutrition related situations
Review and update current
nutrition surveillance tools Nutrition surveillance tools updated
3,155
-
-
-
-
3,155
Train health and other
extension staff in nutrition
surveillance data collection
and analysis
Number of health
and other
extension staff
trained
31,824
33,733
35,757
37,903
40,177
179,395
Procure and distribute
equipment
Number of
equipment
procured and
distributed
50,000
-
-
-
-
50,000
Conduct presurveillance
workshop
Number of
presurveillance
workshops
conducted
56,362
59,744
63,328
67,128
71,156
317,718
2011-2015 National Nutrition Strategic Plan, NaNA Page 32
Strategies Activities
Outputs/
Outcomes
Year Cost
(US$)
2011
(US$)
2012
(US$)
2013
(US$)
2014
(US$)
2015
(US$)
Procure fuel for the surveillance
Quantity of fuel
procured
2,124
2,251
2,387
2,530
2,682
11,973
Sub-subtotal
143,465
95,729
101,472
107,561
114,014
562,241
11.1.2 Expansion of the scope
of the nutrition surveillance
programme to include other
nutrition related indicators
and regions not covered
Add additional indicators to
semi-annual surveillance
programme
additional
indicators added
to the
surveillance
programme
-
-
-
-
-
-
Pilot and expand the semi-
annual nutrition surveillance
in non-PHC villages
Surveillance
expanded to non
PHC villages
-
-
-
-
-
-
Sub-subtotal -
-
-
-
-
-
11.1.3 Advocate for the
inclusion of nutrition
indicators in all household
surveys
Sensitize stakeholders on the
importance of including
nutrition indicators in all
household surveys
Number of
stakeholders
sensitized
-
-
-
-
-
-
Sub-subtotal -
-
-
-
-
-
11.1.4 Support the
establishment of an effective
integrating mechanism for all
organizations and
stakeholders involved in
assessing, analyzing,
monitoring and evaluating
nutrition and nutrition-related
surveillance
Establish Nutrition
Information System (see
6.2.1)
-
-
-
-
-
-
Sub-subtotal -
-
-
-
-
-
11.1.5 Awareness creation of
all stakeholders including the
households on the importance
and use of a Nutrition
Sensitize stakeholders on the
importance and use of a
Nutrition Information System
(linked to 3.2.6)
-
-
-
-
-
-
2011-2015 National Nutrition Strategic Plan, NaNA Page 33
Strategies Activities
Outputs/
Outcomes
Year Cost
(US$)
2011
(US$)
2012
(US$)
2013
(US$)
2014
(US$)
2015
(US$)
Information System
Sub-subtotal -
-
-
-
-
-
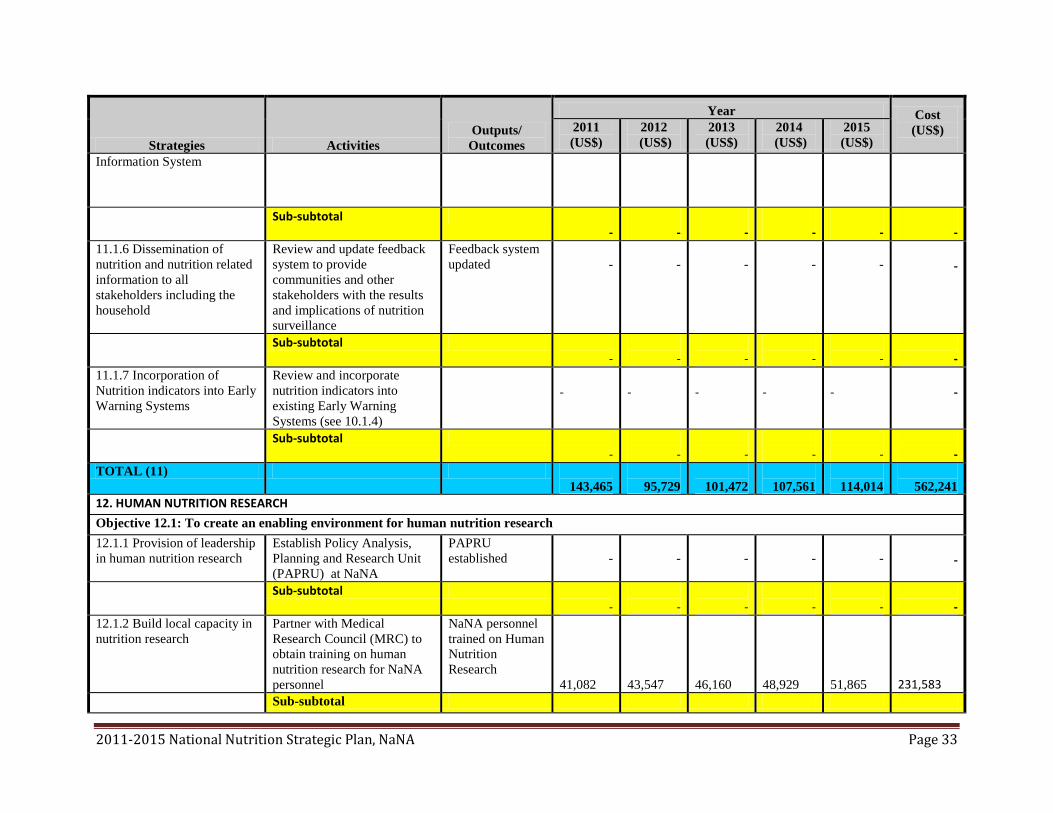
11.1.6 Dissemination of
nutrition and nutrition related
information to all
stakeholders including the
household
Review and update feedback
system to provide
communities and other
stakeholders with the results
and implications of nutrition
surveillance
Feedback system
updated
-
-
-
-
-
-
Sub-subtotal -
-
-
-
-
-
11.1.7 Incorporation of
Nutrition indicators into Early
Warning Systems
Review and incorporate
nutrition indicators into
existing Early Warning
Systems (see 10.1.4)
-
-
-
-
-
-
Sub-subtotal -
-
-
-
-
-
TOTAL (11)
143,465
95,729
101,472
107,561
114,014
562,241
12. HUMAN NUTRITION RESEARCH
Objective 12.1: To create an enabling environment for human nutrition research
12.1.1 Provision of leadership
in human nutrition research
Establish Policy Analysis,
Planning and Research Unit
(PAPRU) at NaNA
PAPRU
established
-
-
-
-
-
-
Sub-subtotal -
-
-
-
-
-
12.1.2 Build local capacity in
nutrition research
Partner with Medical
Research Council (MRC) to
obtain training on human
nutrition research for NaNA
personnel
NaNA personnel
trained on Human
Nutrition
Research
41,082
43,547
46,160
48,929
51,865
231,583
Sub-subtotal

2011-2015 National Nutrition Strategic Plan, NaNA Page 34
Strategies Activities
Outputs/
Outcomes
Year Cost
(US$)
2011
(US$)
2012
(US$)
2013
(US$)
2014
(US$)
2015
(US$)
41,082 43,547 46,160 48,929 51,865 231,583
12.1.3 Advocate for the
strengthening of research in
the diversification and
development of food
production, processing and
preservation
Sensitize public and private
sector stakeholders on
importance of research in the
diversification and
development of food
production, processing and
preservation techniques
Public and private
sector
stakeholders
sensitised
17,012
18,033
19,115
20,262
21,477
95,898
Sub-subtotal
17,012
18,033
19,115
20,262
21,477
95,898
12.1.4 Support research in
micronutrient deficiencies
Conduct research on
micronutrient deficiencies
Research on
micronutrient
deficiencies
conducted
200,000
-
-
-
-
200,000
Sub-subtotal
200,000
-
-
-
-
200,000
12.1.5 Strengthen
collaborative research in the
area of food standard, quality
and safety
Conduct operational research in complementary foods
Operational
research
conducted
50,000
-
-
-
-
50,000
Sub-subtotal
50,000
-
-
-
-
50,000
12.1.6 Support research on
diet-related NCDs including
traditional medicine
Conduct study to determine
prevalence of NCDs (see
7.3.1)
Study on the
prevalence of
NCDs conducted
-
-
-
-
-
-
Sub-subtotal -
-
-
-
-
-
12.1.7 Support research on
malnutrition among specific
population groups
-
-
-
-
-
-
Sub-subtotal -
-
-
-
-
-
12.1.8 Mobilisation of
resources for quality nutrition
research
Identify possible sources of
resources for nutrition
research
Possible source for resources for nutrition
-
-
-
-
-
-
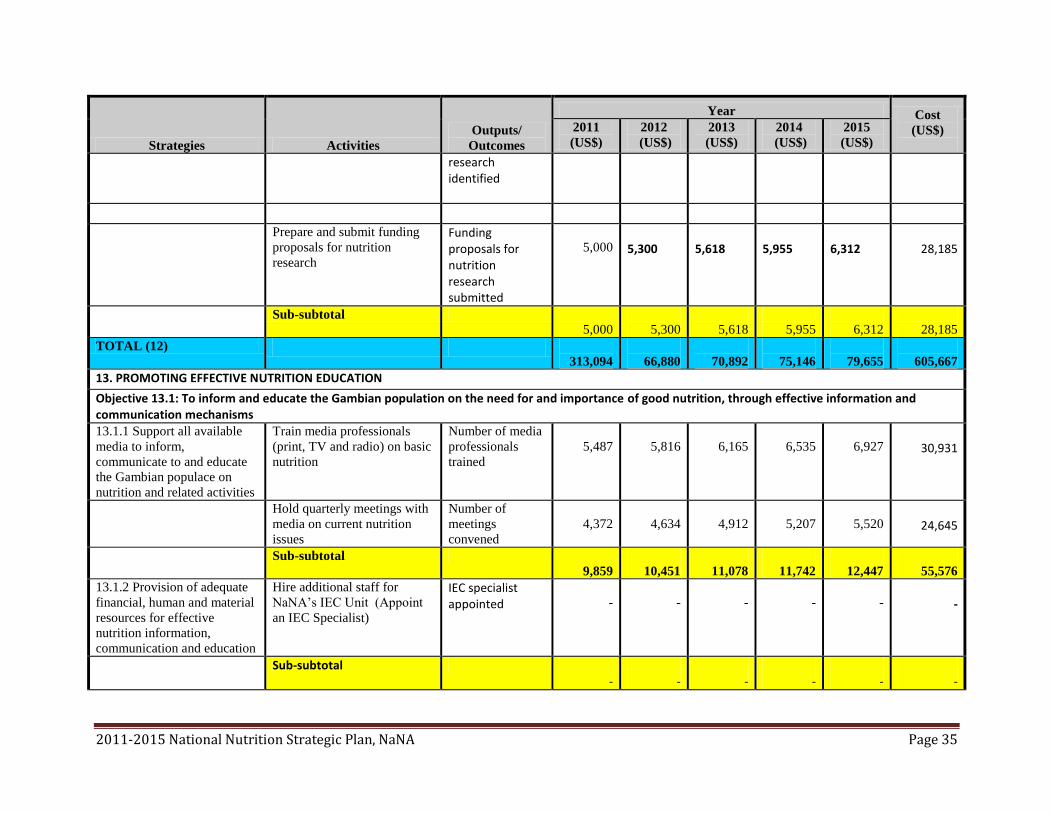
2011-2015 National Nutrition Strategic Plan, NaNA Page 35
Strategies Activities
Outputs/
Outcomes
Year Cost
(US$)
2011
(US$)
2012
(US$)
2013
(US$)
2014
(US$)
2015
(US$)
research identified
Prepare and submit funding
proposals for nutrition
research
Funding proposals for nutrition research submitted
5,000 5,300
5,618
5,955
6,312
28,185
Sub-subtotal
5,000
5,300
5,618
5,955
6,312
28,185
TOTAL (12)
313,094
66,880
70,892
75,146
79,655
605,667
13. PROMOTING EFFECTIVE NUTRITION EDUCATION
Objective 13.1: To inform and educate the Gambian population on the need for and importance of good nutrition, through effective information and communication mechanisms
13.1.1 Support all available
media to inform,
communicate to and educate
the Gambian populace on
nutrition and related activities
Train media professionals
(print, TV and radio) on basic
nutrition
Number of media
professionals
trained
5,487
5,816
6,165
6,535
6,927
30,931
Hold quarterly meetings with
media on current nutrition
issues
Number of
meetings
convened
4,372
4,634
4,912
5,207
5,520
24,645
Sub-subtotal
9,859
10,451
11,078
11,742
12,447
55,576
13.1.2 Provision of adequate
financial, human and material
resources for effective
nutrition information,
communication and education
Hire additional staff for
NaNA’s IEC Unit (Appoint
an IEC Specialist)
IEC specialist appointed
-
-
-
-
-
-
Sub-subtotal -
-
-
-
-
-

2011-2015 National Nutrition Strategic Plan, NaNA Page 36
Strategies Activities
Outputs/
Outcomes
Year Cost
(US$)
2011
(US$)
2012
(US$)
2013
(US$)
2014
(US$)
2015
(US$)
13.1.3 Strengthen
coordination mechanisms of
nutrition education
programmes and activities
Revitalize Nutrition
Education Subcommittee (see
2.2.3)
-
-
-
-
-
-
Sub-subtotal -
-
-
-
-
-
13.1.4 Empowerment of
community structures for full
participation in nutrition
education and related
activities
Train community structures
(see 1.1.1, 1.1.6, 2.1.1, 2.2.2,
2.2.5, 3.2.3, 3.2.5, 4.1.1,
6.1.2, 6.2.2, 7.1.2, 9.2.5 and
10.1.3) and sensitize (under
2.2.2, 4.2.1, 6.1.4, 7.3.3 and
8.1.3) for full participation in
nutrition education and
related activities
-
-
-
-
-
-
Sub-subtotal -
-
-
-
-
-
13.1.5 Strengthen nutrition
education in the school
system through an extended
nutrition curriculum
Strengthen nutrition
curriculum (see 4.1.4)
-
-
-
-
-
Sub-subtotal -
-
-
-
-
-
13.1.6 Capacity building of
stakeholders to carry out
nutrition education activities
in both formal and informal
settings
Train stakeholders (under
1.1.1, 1.1.4, 4.1.3, 6.2.3,
8.1.1, 9.1.1 and 9.2.2) and
sensitize (under 1.1.9, 4.4.3,
11.1.3, 11.1.5 and 12. 1.3) to
build capacity to carry out
nutrition education activities
-
-
-
-
-
-
Sub-subtotal -
-
-
-
-
-
TOTAL (13)
9,859
10,451
11,078
11,742
12,447
55,576
14. RESOURCE MOBILIZATION

2011-2015 National Nutrition Strategic Plan, NaNA Page 37
Strategies Activities
Outputs/
Outcomes
Year Cost
(US$)
2011
(US$)
2012
(US$)
2013
(US$)
2014
(US$)
2015
(US$)
Objective 14.1: To improve on the resources base of the Agency for effective functioning and investment in nutrition
14.1.1 Exploration of creative
approaches and innovative
resource mobilisation
techniques with non-
traditional donors
PAPR Unit at NaNA explores
creative approaches and
innovative resource
mobilisation techniques with
non-traditional donors
Creative
approaches and
innovative
resource
mobilasation
techniques
explored
-
-
-
-
-
-
PAPR Unit prepares
necessary proposals and grant
applications to pursue
creative approaches for
resource mobilisation
Proposals and
grants
applications
prepared
-
-
-
-
-
-
Sub-subtotal -
-
-
-
-
-
Establish PROFILES in
NaNA for resource
mobilisation advocacy
PROFILES established
50,000
-
-
-
-
50,000
Use PROFILES and Business
Plan to advocate for increased
investment in nutrition
Funding for
nutrition
increased
3,149
3,338
3,538
3,751
3,976
17,751
Implement new scheme of
service
Scheme of
service
implemented
-
-
-
-
-
-
Strengthen Nutrition
Resource Centres
Number of
Nutrition
Resource Centres
strengthened
25,000
-
-
-
-
25,000
Sub-subtotal
78,149
3,338
3,538
3,751
3,976
92,751
Subtotal
78,149
3,338
3,538
3,751
3,976
92,751
Objective 14.2: To create an enabling environment to facilitate resource mobilization for various partners and stakeholders for the provision of
adequate resources
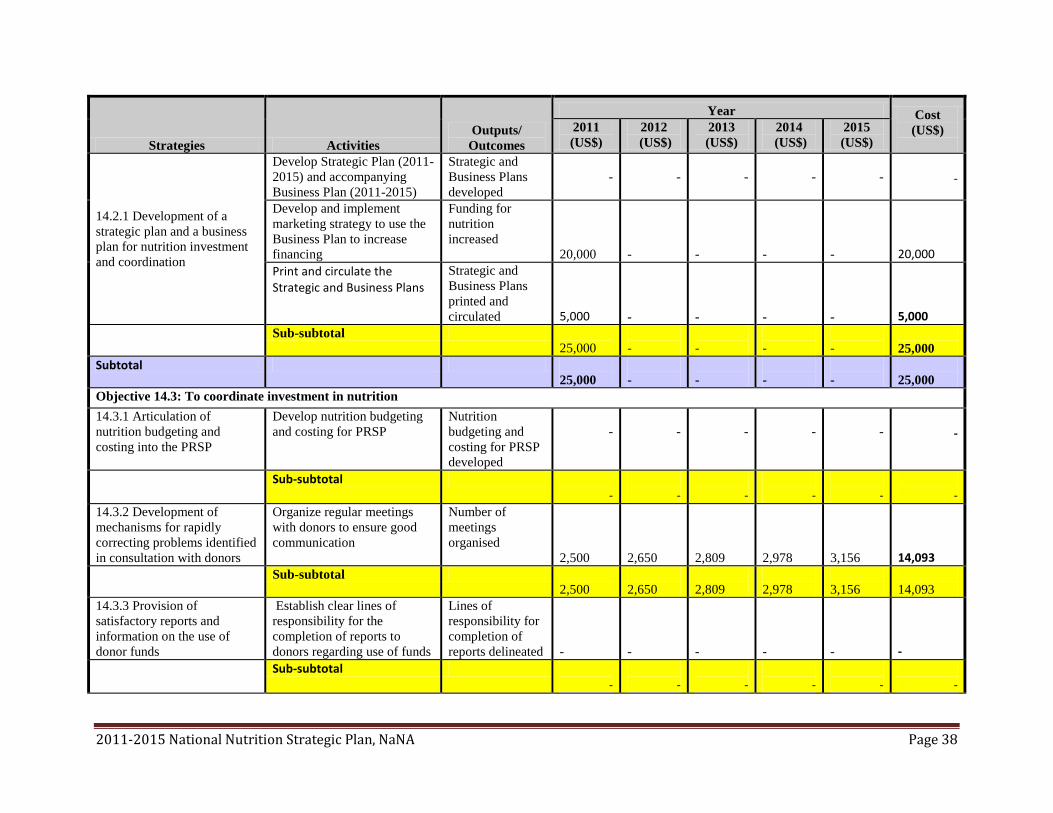
2011-2015 National Nutrition Strategic Plan, NaNA Page 38
Strategies Activities
Outputs/
Outcomes
Year Cost
(US$)
2011
(US$)
2012
(US$)
2013
(US$)
2014
(US$)
2015
(US$)
14.2.1 Development of a
strategic plan and a business
plan for nutrition investment
and coordination
Develop Strategic Plan (2011-
2015) and accompanying
Business Plan (2011-2015)
Strategic and
Business Plans
developed
-
-
-
-
-
-
Develop and implement
marketing strategy to use the
Business Plan to increase
financing
Funding for
nutrition
increased
20,000
-
-
-
-
20,000
Print and circulate the Strategic and Business Plans
Strategic and
Business Plans
printed and
circulated
5,000
-
-
-
-
5,000
Sub-subtotal
25,000
-
-
-
-
25,000
Subtotal
25,000
-
-
-
-
25,000
Objective 14.3: To coordinate investment in nutrition
14.3.1 Articulation of
nutrition budgeting and
costing into the PRSP
Develop nutrition budgeting
and costing for PRSP
Nutrition
budgeting and
costing for PRSP
developed
-
-
-
-
-
-
Sub-subtotal -
-
-
-
-
-
14.3.2 Development of
mechanisms for rapidly
correcting problems identified
in consultation with donors
Organize regular meetings
with donors to ensure good
communication
Number of
meetings
organised
2,500
2,650
2,809
2,978
3,156
14,093
Sub-subtotal
2,500
2,650
2,809
2,978
3,156
14,093
14.3.3 Provision of
satisfactory reports and
information on the use of
donor funds
Establish clear lines of
responsibility for the
completion of reports to
donors regarding use of funds
Lines of
responsibility for
completion of
reports delineated
-
-
-
-
-
-
Sub-subtotal -
-
-
-
-
-
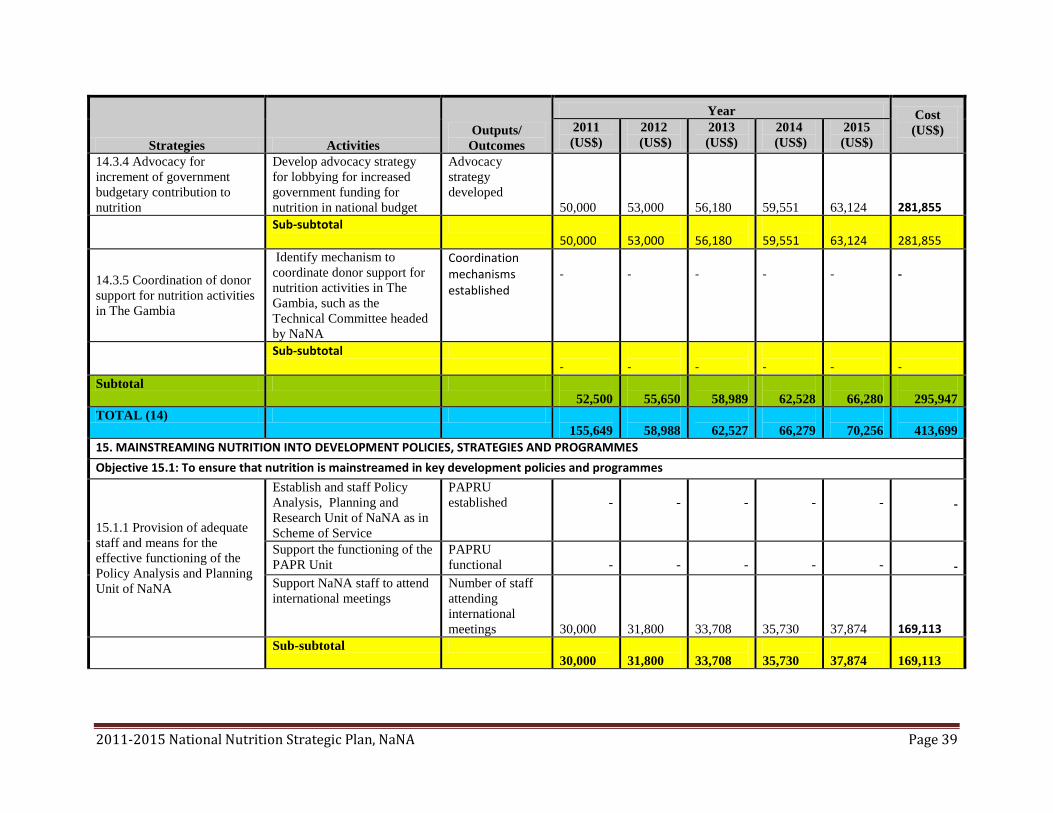
2011-2015 National Nutrition Strategic Plan, NaNA Page 39
Strategies Activities
Outputs/
Outcomes
Year Cost
(US$)
2011
(US$)
2012
(US$)
2013
(US$)
2014
(US$)
2015
(US$)
14.3.4 Advocacy for
increment of government
budgetary contribution to
nutrition
Develop advocacy strategy
for lobbying for increased
government funding for
nutrition in national budget
Advocacy
strategy
developed
50,000
53,000
56,180
59,551
63,124
281,855
Sub-subtotal 50,000
53,000
56,180
59,551
63,124
281,855
14.3.5 Coordination of donor
support for nutrition activities
in The Gambia
Identify mechanism to
coordinate donor support for
nutrition activities in The
Gambia, such as the
Technical Committee headed
by NaNA
Coordination mechanisms established
-
-
-
-
-
-
Sub-subtotal -
-
-
-
-
-
Subtotal
52,500
55,650
58,989
62,528
66,280
295,947
TOTAL (14)
155,649
58,988
62,527
66,279
70,256
413,699
15. MAINSTREAMING NUTRITION INTO DEVELOPMENT POLICIES, STRATEGIES AND PROGRAMMES
Objective 15.1: To ensure that nutrition is mainstreamed in key development policies and programmes
15.1.1 Provision of adequate
staff and means for the
effective functioning of the
Policy Analysis and Planning
Unit of NaNA
Establish and staff Policy
Analysis, Planning and
Research Unit of NaNA as in
Scheme of Service
PAPRU
established
-
-
-
-
-
-
Support the functioning of the
PAPR Unit
PAPRU
functional
-
-
-
-
-
-
Support NaNA staff to attend
international meetings
Number of staff
attending
international
meetings
30,000
31,800
33,708
35,730
37,874
169,113
Sub-subtotal
30,000
31,800
33,708
35,730
37,874
169,113

2011-2015 National Nutrition Strategic Plan, NaNA Page 40
Strategies Activities
Outputs/
Outcomes
Year Cost
(US$)
2011
(US$)
2012
(US$)
2013
(US$)
2014
(US$)
2015
(US$)
15.1.2 Support the capacity
building of other Planning
Units in nutrition planning
and mainstreaming
Sensitize other sectors'
Planning Units on the need to
mainstream nutrition into
their sectoral plans
Number of
planning unit
sensitised
2,525
2,677
2,837
3,007
3,188
14,234
Sub-subtotal 2,525
2,677
2,837
3,007
3,188
14,234
15.1.3 Facilitation and
support of the establishment
and functioning of networks
of public, private sector and
NGOs for nutrition advocacy,
networking, dialogue and
action
Establish a Technical
Advisory Committee at the
National Level
National level
TAC established
-
-
-
-
-
-
Support functioning of
Technical Advisory
Committees at national under
Theme 16
28,000
29,680
31,461
33,348
35,349
157,839
Sub-subtotal 28,000
29,680
31,461
33,348
35,349
157,839
15.1.4 Support the
mobilisation of resources for
nutrition and nutrition related
programmes
See Theme 14
-
-
-
-
-
-
Sub-subtotal -
-
-
-
-
-
15.1.5 Conduct periodic
reviews of sectoral policies
and programmes
PAPR Unit reviews sectoral
policies and programmes
periodically for nutrition
content
Number of sectoral policies and programmes reviewed
20,000
21,200
22,472
23,820
25,250
112,742
Sub-subtotal 20,000
21,200
22,472
23,820
25,250
112,742
TOTAL (15)
80,525
85,357
90,478
95,907
101,661
453,927

2011-2015 National Nutrition Strategic Plan, NaNA Page 41
Strategies Activities
Outputs/
Outcomes
Year Cost
(US$)
2011
(US$)
2012
(US$)
2013
(US$)
2014
(US$)
2015
(US$)
16. POLICY IMPLEMENTATION FRAMEWORK
Objective 16.1: To ensure effective implementation of the Policy
16.1.1 Retain existing staff
and recruit additional staff as
per the Scheme of Service
Maintain existing staff Staff maintained
82,901 87,875 93,148 98,736 104,661 467,321
Recruit additional staff Number of
additional staff
recruited 38,829 41,159 43,628 46,246 49,021 218,883
Subtotal 121,730 129,034 136,776 144,982 153,681 686,203
16.1.2 Support the effective
functioning of NaNA units
Train NaNA staff at various
levels Number of staff trained
780,000
826,800
876,408
928,992
984,732
4,396,933
Subtotal 780,000
826,800
876,408
928,992
984,732
4,396,933
Procure office equipment &
supplies and maintain the
offices
Office equipment and supplies procured and offices maintained
20,000
21,200
22,472
23,820
25,250
112,742
Maintenance of vehicles and
motorcycles
30,000
31,800
33,708
35,730
37,874
169,113
Sub-subtotal 50,000
53,000
56,180
59,551
63,124
281,855
TOTAL (16)
951,730
1,008,834
1,069,364
1,133,526
1,201,537
5,364,990
GRAND TOTAL
6,919,088
4,442,157
4,702,954
4,971,203
5,275,660
26,311,061