the gps toolkit: open source clock tools
TRANSCRIPT

40th Annual Precise Time and Time Interval (PTTI) Meeting
THE GPS TOOLKIT:
OPEN SOURCE CLOCK TOOLS
Timothy J. H. Craddock, Richard John Broderick,
Colin P. Petersen, and Alex Hu Applied Research Laboratories: The University of Texas at Austin
Space and Geophysics Group PO Box 8029, Austin, TX 78751, USA
[email protected], [email protected], [email protected], [email protected]
Abstract
The GPS Toolkit (GPSTk) is an open source software project sponsored by the Space and Geophysics Laboratory of Applied Research Laboratories, The University of Texas at Austin. The GPSTk provides processing and analysis tools for GPS data. Clock Tools, a recent addition to the GPSTk, allows for basic clock stability analyses. These Clock Tools are interoperable with other GPSTk programs, allowing clock analyses to be easily run alongside other GPS analyses.
The Clock Tools suite currently computes the Allan, overlapping Allan, modified Allan, total
Allan, overlapping Hadamard, and dynamic Allan deviation stability metrics. These Clock Tools may be run from the command line with their output piped to other GPSTk programs. Data formatting and outlier removal routines for GPS and time interval analyzer datasets facilitate compatibility with the Clock Tools stability programs. Python and Octave graphing scripts were created to plot the raw data output by Clock Tools and current work is focused on a Qt-based graphical front-end for the suite. The graphical front-end will enable integrated stability metric selection and graphing. In the near term, we plan to expand the functionality of the graphical front-end and add noise-type identification functions.
Results from the validation of Clock Tools are presented along with demonstrations of
typical applications. Specifically, Clock Tools stability plots will be compared to those generated by Stable32. Analyses of RINEX datasets will be traced through the GPSTk toolchain, from calculation of observed range deviation to outlier removal, data parsing, stability calculation, and plot generation. A preview of the graphical front-end and its use will be presented. The analyses will be in the context of a worldwide GPS monitor station network with high-quality atomic frequency standards.
The Clock Tools suite provides the GPS and precise timing community free access to basic
clock stability analyses. Clock Tools also allows for improved work flow in environments requiring GPS data analysis. Since the project is open source, community members are encouraged to add to the project.
255
Report Documentation Page Form ApprovedOMB No. 0704-0188
Public reporting burden for the collection of information is estimated to average 1 hour per response, including the time for reviewing instructions, searching existing data sources, gathering andmaintaining the data needed, and completing and reviewing the collection of information. Send comments regarding this burden estimate or any other aspect of this collection of information,including suggestions for reducing this burden, to Washington Headquarters Services, Directorate for Information Operations and Reports, 1215 Jefferson Davis Highway, Suite 1204, ArlingtonVA 22202-4302. Respondents should be aware that notwithstanding any other provision of law, no person shall be subject to a penalty for failing to comply with a collection of information if itdoes not display a currently valid OMB control number.
1. REPORT DATE 01 DEC 2008
2. REPORT TYPE N/A
3. DATES COVERED -
4. TITLE AND SUBTITLE The GPS Toolkit: Open Source Clock Tools
5a. CONTRACT NUMBER
5b. GRANT NUMBER
5c. PROGRAM ELEMENT NUMBER
6. AUTHOR(S) 5d. PROJECT NUMBER
5e. TASK NUMBER
5f. WORK UNIT NUMBER
7. PERFORMING ORGANIZATION NAME(S) AND ADDRESS(ES) Applied Research Laboratories: The University of Texas at Austin Spaceand Geophysics Group PO Box 8029, Austin, TX 78751, USA
8. PERFORMING ORGANIZATIONREPORT NUMBER
9. SPONSORING/MONITORING AGENCY NAME(S) AND ADDRESS(ES) 10. SPONSOR/MONITOR’S ACRONYM(S)
11. SPONSOR/MONITOR’S REPORT NUMBER(S)
12. DISTRIBUTION/AVAILABILITY STATEMENT Approved for public release, distribution unlimited
13. SUPPLEMENTARY NOTES See also ADM002186. Annual Precise Time and Time Interval Systems and Applications Meeting (40th)Held in Reston, Virginia on 1-4 December 2008, The original document contains color images.
14. ABSTRACT
15. SUBJECT TERMS
16. SECURITY CLASSIFICATION OF: 17. LIMITATION OF ABSTRACT
UU
18. NUMBEROF PAGES
20
19a. NAME OFRESPONSIBLE PERSON
a. REPORT unclassified
b. ABSTRACT unclassified
c. THIS PAGE unclassified
Standard Form 298 (Rev. 8-98) Prescribed by ANSI Std Z39-18
40th Annual Precise Time and Time Interval (PTTI) Meeting
INTRODUCTION Clock Tools is an open source software suite that implements clock time-domain frequency stability metrics, as well as data editing, noise identification, and plotting routines. The Clock Tools were developed within the framework of the Global Positioning System Toolkit (GPSTk), an open source software project sponsored by the Space and Geophysics Laboratory (SGL) of Applied Research Laboratories, The University of Texas at Austin (ARL:UT). The GPSTk provides processing and analysis tools for GPS data and can be downloaded on the project website at http://gpstk.org/ [1].
SGL assists in GPS monitoring, providing support for a global network of GPS monitor stations operated by the National Geospatial-Intelligence Agency (NGA). Within each monitor station are GPS receivers that are phase-locked to atomic clocks. Weekly data analysis reports examine GPS data integrity and monitor station performance, including monitor station clock performance. Archived GPS data are analyzed to determine clock performance. GPS data fall into two categories, observation data and navigation data. Both types of data may be stored in Receiver Independent Exchange (RINEX) files. RINEX is a standard file format for storing GPS data. Using RINEX GPS observation and navigation files, clock estimates are generated using either the GPSTk Observed Range Deviation (ORD) Tools or the NGA Kalman filter clock estimates [2]. Time interval analyzer datasets provide another source of clock data. The TSC 5110A Time Interval Analyzer (TIA) compares two input clocks and outputs the phase difference between them at a 10- to 100-Hz sampling rate. These clock estimates are used for time-domain frequency stability analysis. Frequency stability measures the ability of a clock to maintain its nominal frequency over a given period of time. From input clock data, both short-term and long-term stability can be assessed. The Allan variance represents the variance of a clock from its nominal value over a range of averaging times. An Allan variance plot is often helpful in stability analysis. Routines within the Clock Tools suite fall into four functional categories: input parsing, data grooming, data analysis, and plotting. Input parsing takes data generated outside of Clock Tools and puts them in a format understood within the suite. Data grooming cleans the data of outliers before analysis. Data analysis performs the frequency stability calculations. Plotting creates a graphical representation of the frequency stability. This paper describes each functional category in detail. STABILITY METRICS & VALIDATION The fundamentals of frequency stability will be derived from the clock model below.
(1) In this model V (t) is the actual clock output, whose timekeeping properties are related to f0, the nominal frequency of the clock, and φ (t), a time varying phase fluctuation within the clock. V0 represents the amplitude of the clock signal, and is not important in time-domain frequency analysis. In general, the amplitude V0 is ignored and the normalized frequency deviation is defined as follows:
(2)
256
40th Annual Precise Time and Time Interval (PTTI) Meeting
The time error function can be derived from the normalized frequency deviation as follows:
(3) The discrete time error sample xi, shown below, is defined in terms of t0, the measurement starting time and τ = iτ0, the measurement interval.
(4) The stability metrics described in this section, such as the Allan variance, are used to analyze these time error samples. The result of an Allan variance calculation is an array of data points consisting of a τ, the averaging factor, and its corresponding Allan variance. A higher τ value represents longer averaging times and, thus, its corresponding Allan variance represents longer-term clock stability, whereas the Allan variance corresponding to a lower τ value represents shorter-term clock stability. A lower Allan variance corresponds to a more stable clock, for a given value of τ. It should be noted that, while the variance is presented mathematically, the plots and code calculations are deviations, or square root of the variance. The stability metrics implemented are presented along with plots created using data generated by Clock Tools and Stable32 [3]. Stable32 is the industry standard for frequency stability analysis software. In addition to the stability plots, difference graphs are presented. These difference graphs are created by differencing the Stable32 and Clock Tools stability calculations at the corresponding τ and plotting the confidence interval of the Stable32 calculations. The difference graphs provide a sanity check on the Clock Tools stability implementations. It should be noted that the output data lengths generated by Clock Tools were matched to Stable32. Users of Clock Tools should trim the output data length to the appropriate averaging time. ALLAN VARIANCE (nallandev) Allan variance [4] a time averaged two-sample variance, is the most common time-domain measurement of frequency stability. It is formulated in terms of the measurement interval τ and the N phase values xi spaced by τ.
(5)
The Allan variance converges independently of the number of samples for a greater variety of diverging noise types than does an ordinary variance. The Allan variance is also an IEEE standard for stability analysis (IEEE Std. 1139) [5]. Below are graphs presented for verification of the Clock Tools implementation. The figure on the left presents the Allan deviation plot generated by Clock Tools and the middle plot is that generated by Stable32. Visually both plots look identical. The right plot is a difference graph. No difference between the data generated by Clock Tools and Stable32 lie outside the confidence interval of Stable32 data, and the deviation calculations of Clock Tools lie within 10-21 of the Stable32 calculations. In each graph, the x-axis represents the averaging time τ in seconds, and the y-axis the deviation.
257

40th Annual Precise Time and Time Interval (PTTI) Meeting
Figure 1. Allan deviation comparison: a) Clock Tools implementation, b) Stable32 implementation, c) difference plot.
OVERLAPPING ALLAN VARIANCE (oallandev) The overlapping Allan variance [4] is similar to the Allan variance, but improves the confidence of the Allan variance by making maximum use of the available data. It is formulated in terms of the measurement interval τ = mτo, and the N phase values xi spaced by τo.
(6)
The confidence improves with the overlapping technique, as making maximum use of the data increases the number of degrees of freedom in the calculation [4]. As seen in Figure 2, no difference between the data generated by Clock Tools and Stable32 lie outside the confidence interval of Stable32, and the deviation calculations of Clock Tools lie within 10-21 of the Stable32 calculations.
258
40th Annual Precise Time and Time Interval (PTTI) Meeting
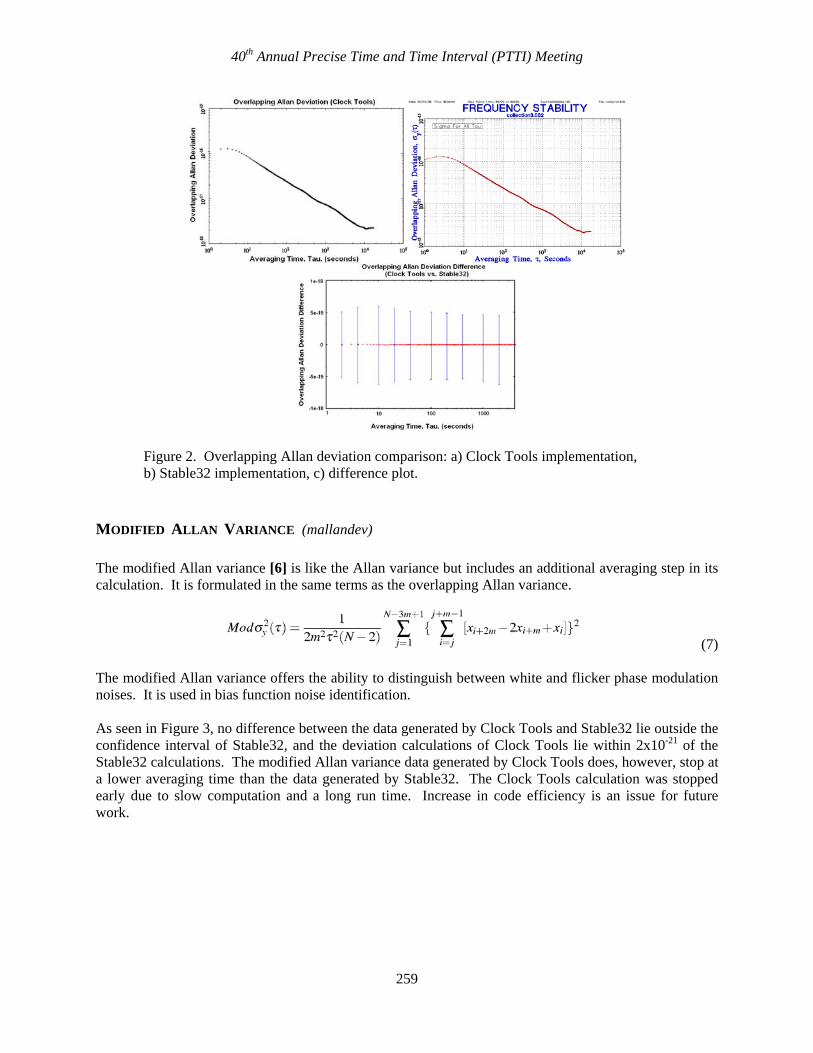
Figure 2. Overlapping Allan deviation comparison: a) Clock Tools implementation, b) Stable32 implementation, c) difference plot.
MODIFIED ALLAN VARIANCE (mallandev) The modified Allan variance [6] is like the Allan variance but includes an additional averaging step in its calculation. It is formulated in the same terms as the overlapping Allan variance.
(7)
The modified Allan variance offers the ability to distinguish between white and flicker phase modulation noises. It is used in bias function noise identification. As seen in Figure 3, no difference between the data generated by Clock Tools and Stable32 lie outside the confidence interval of Stable32, and the deviation calculations of Clock Tools lie within 2x10-21 of the Stable32 calculations. The modified Allan variance data generated by Clock Tools does, however, stop at a lower averaging time than the data generated by Stable32. The Clock Tools calculation was stopped early due to slow computation and a long run time. Increase in code efficiency is an issue for future work.
259

40th Annual Precise Time and Time Interval (PTTI) Meeting
Figure 3. Modified Allan deviation comparison: a) Clock Tools implementation, b) Stable32 implementation, c) difference plot.
TOTAL ALLAN VARIANCE (totvar) The total Allan variance [7] offers improved confidence over the Allan variance at long averaging times. It is calculated by expanding the data by reflection at both ends of the set and then performing a calculation similar to the overlapping Allan variance. It is formulated in the same terms as the overlapping Allan variance.
(8) The total Allan variance was created to address the problem of underestimation of the Allan variance due to symmetry in the data at long averaging times. As seen in Figure 4, no difference between the data generated by Clock Tools and Stable32 lie outside the confidence interval of Stable32, and the deviation calculations of Clock Tools lie within 10-21 of the Stable32 calculations.
260
40th Annual Precise Time and Time Interval (PTTI) Meeting
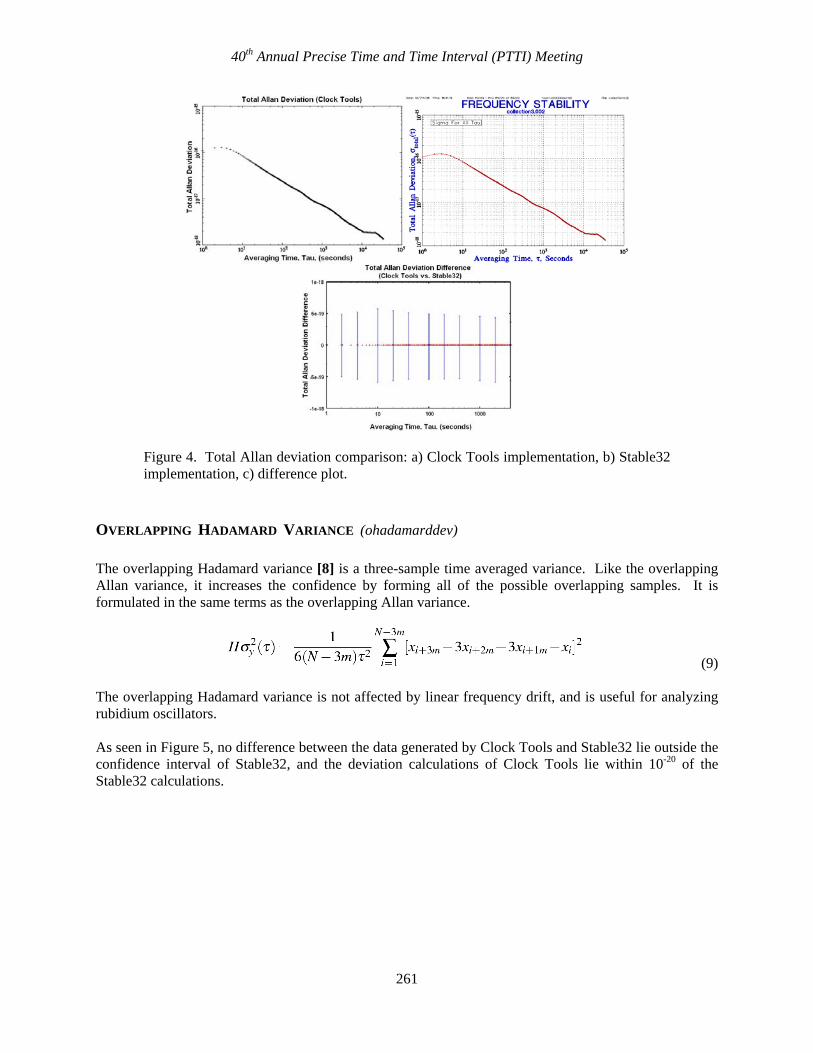
Figure 4. Total Allan deviation comparison: a) Clock Tools implementation, b) Stable32 implementation, c) difference plot.
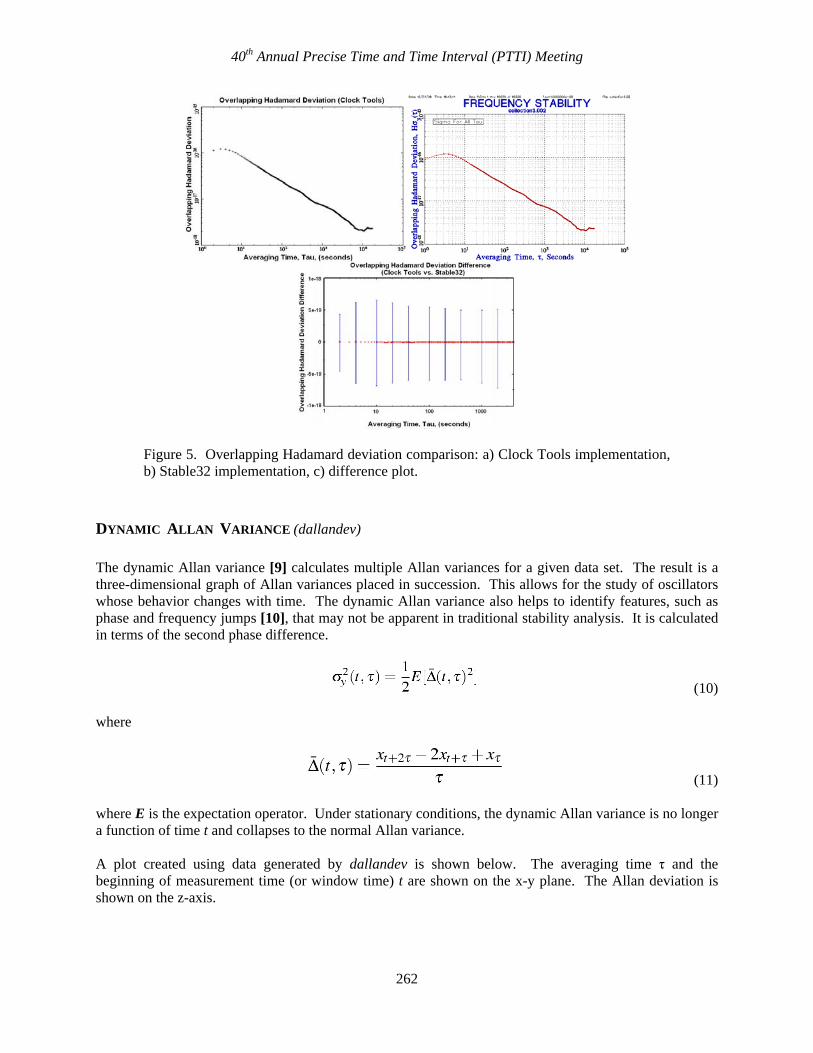
OVERLAPPING HADAMARD VARIANCE (ohadamarddev) The overlapping Hadamard variance [8] is a three-sample time averaged variance. Like the overlapping Allan variance, it increases the confidence by forming all of the possible overlapping samples. It is formulated in the same terms as the overlapping Allan variance.
(9)
The overlapping Hadamard variance is not affected by linear frequency drift, and is useful for analyzing rubidium oscillators. As seen in Figure 5, no difference between the data generated by Clock Tools and Stable32 lie outside the confidence interval of Stable32, and the deviation calculations of Clock Tools lie within 10-20 of the Stable32 calculations.
261
40th Annual Precise Time and Time Interval (PTTI) Meeting
Figure 5. Overlapping Hadamard deviation comparison: a) Clock Tools implementation, b) Stable32 implementation, c) difference plot.
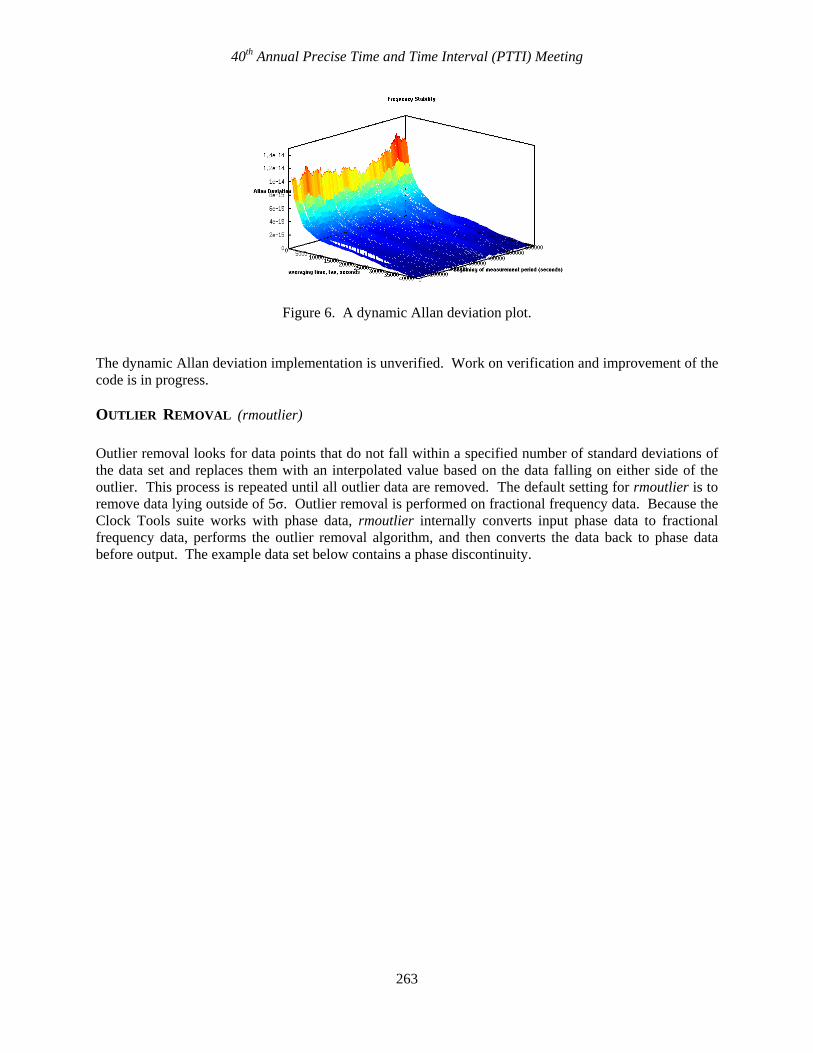
DYNAMIC ALLAN VARIANCE (dallandev) The dynamic Allan variance [9] calculates multiple Allan variances for a given data set. The result is a three-dimensional graph of Allan variances placed in succession. This allows for the study of oscillators whose behavior changes with time. The dynamic Allan variance also helps to identify features, such as phase and frequency jumps [10], that may not be apparent in traditional stability analysis. It is calculated in terms of the second phase difference.
(10) where
(11) where E is the expectation operator. Under stationary conditions, the dynamic Allan variance is no longer a function of time t and collapses to the normal Allan variance. A plot created using data generated by dallandev is shown below. The averaging time τ and the beginning of measurement time (or window time) t are shown on the x-y plane. The Allan deviation is shown on the z-axis.
262
40th Annual Precise Time and Time Interval (PTTI) Meeting
Figure 6. A dynamic Allan deviation plot.
The dynamic Allan deviation implementation is unverified. Work on verification and improvement of the code is in progress. OUTLIER REMOVAL (rmoutlier) Outlier removal looks for data points that do not fall within a specified number of standard deviations of the data set and replaces them with an interpolated value based on the data falling on either side of the outlier. This process is repeated until all outlier data are removed. The default setting for rmoutlier is to remove data lying outside of 5σ. Outlier removal is performed on fractional frequency data. Because the Clock Tools suite works with phase data, rmoutlier internally converts input phase data to fractional frequency data, performs the outlier removal algorithm, and then converts the data back to phase data before output. The example data set below contains a phase discontinuity.
263
40th Annual Precise Time and Time Interval (PTTI) Meeting
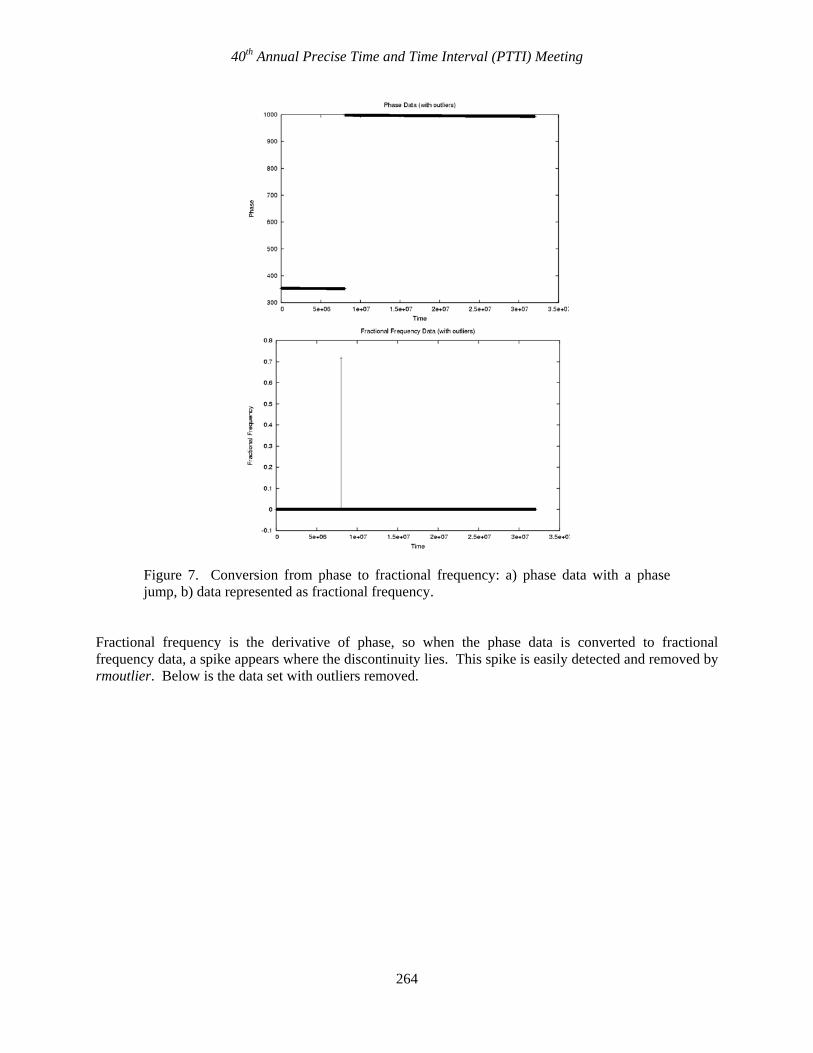
Figure 7. Conversion from phase to fractional frequency: a) phase data with a phase jump, b) data represented as fractional frequency.
Fractional frequency is the derivative of phase, so when the phase data is converted to fractional frequency data, a spike appears where the discontinuity lies. This spike is easily detected and removed by rmoutlier. Below is the data set with outliers removed.
264

40th Annual Precise Time and Time Interval (PTTI) Meeting
Figure 8. Conversion from fractional frequency to phase: a) fractional frequency data with spike removed, b) phase data with phase jump removed.
When the groomed fractional frequency data are converted back to phase data, no discontinuity remains and constant biases are removed. The data set is now ready for stability analysis. Figure 9 present two overlapping Allan deviation plots, one created using the original data set and one created using the data set with the outliers removed. The same data set was also run through the Stable32 outlier removal function for verification. The red points and bars on the right graph show the results and confidence intervals of the overlapping Allan deviation performed by Stable32 after outlier removal by Stable32.
265

40th Annual Precise Time and Time Interval (PTTI) Meeting
Figure 9. Overlapping Allan deviations: a) overlapping Allan deviation performed on data containing outliers, b) overlapping Allan deviation performed on data with outliers removed.
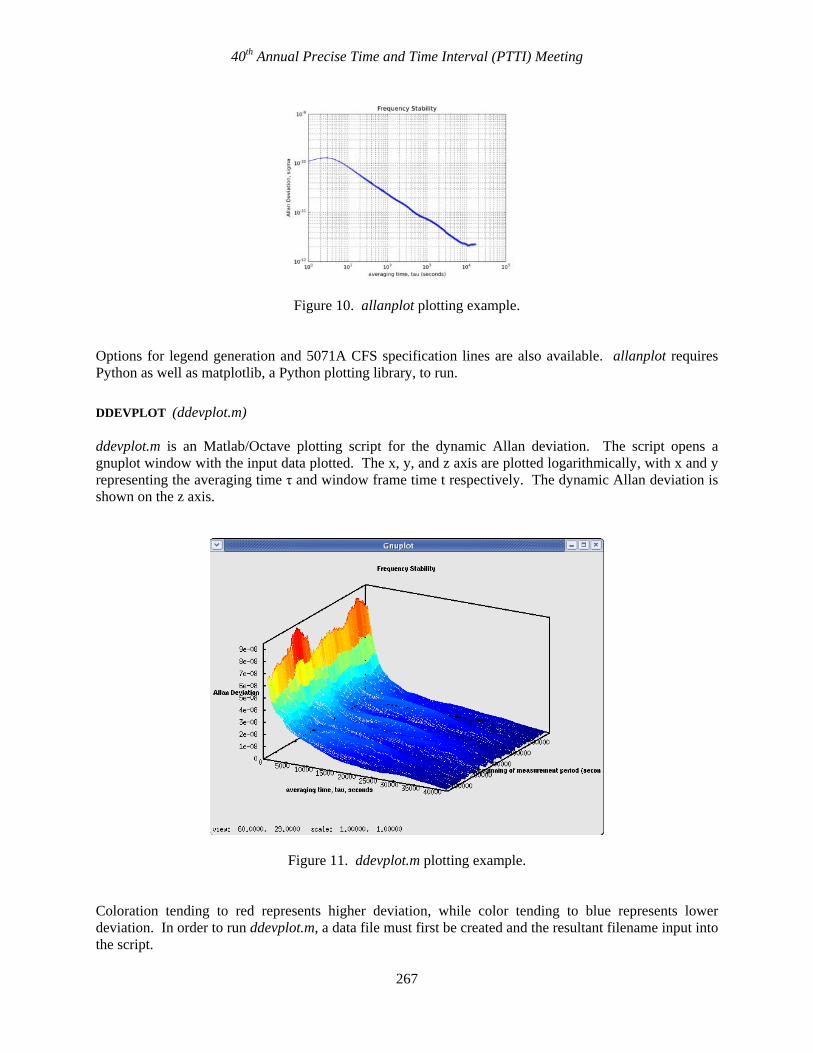
The overlapping Allan deviation run on a 5071A cesium frequency standard (CFS) dataset before outlier removal is between 4×10⁻⁹ and 4×10-11, while the overlapping Allan deviation run on the groomed data set lies between 2×10-13 and 6×10-15. The second frequency stability analysis yields results consistent with the specifications for the 5071A CFS [11], while the first does not. The results Clock Tools generates match closely to Stable32. PLOTTING TOOLS The Clock Tools suite has two plotting scripts. The first script is a Python script that produces a plot and has the ability to save the graph. The second is an Octave script that plots the three-dimensional dynamic Allan deviation. Alternatively, the raw data output of Clock Tools can be plotted with another tool of the user’s choice. Many of the plots in this paper were created using gnuplot. ALLANPLOT (allanplot) allanplot is a Python plotting script. The script opens an interface that allows the user to view the plot and a command line option allows plot saving in JPEG, PNG, Post Script, and other formats. The x and y axis are plotted logarithmically, with x representing the averaging time τ, and y representing the frequency stability.
266
40th Annual Precise Time and Time Interval (PTTI) Meeting
Figure 10. allanplot plotting example.
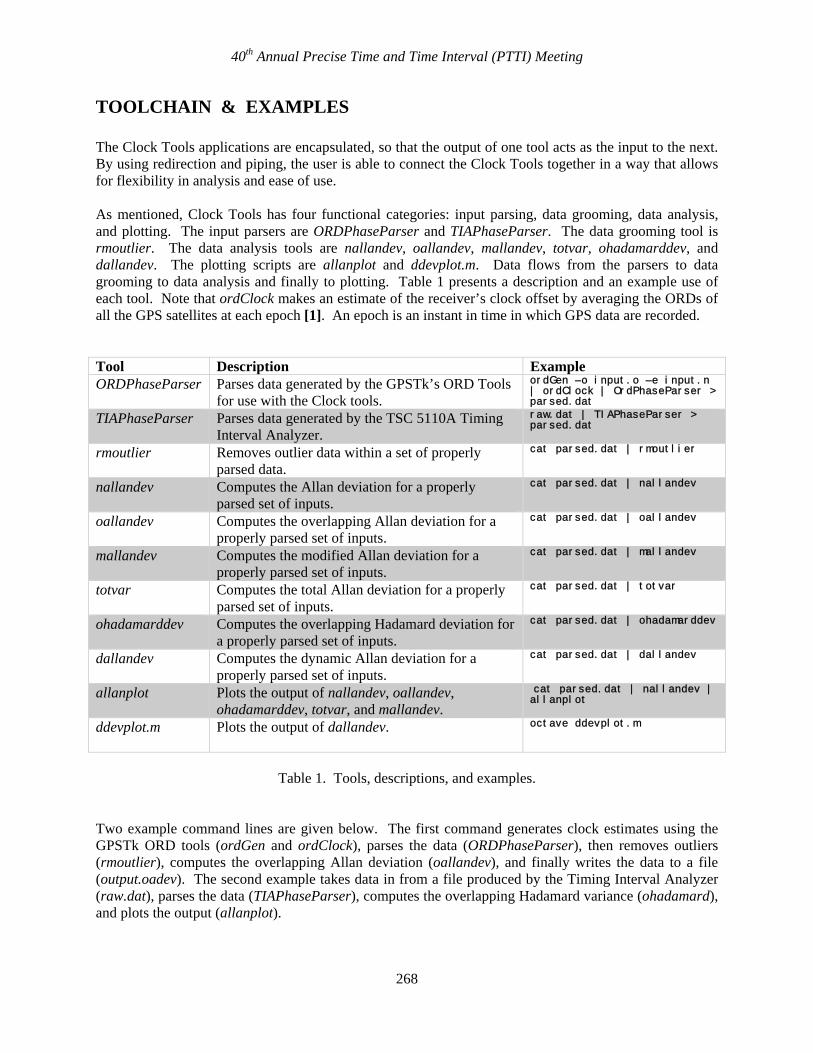
Options for legend generation and 5071A CFS specification lines are also available. allanplot requires Python as well as matplotlib, a Python plotting library, to run. DDEVPLOT (ddevplot.m) ddevplot.m is an Matlab/Octave plotting script for the dynamic Allan deviation. The script opens a gnuplot window with the input data plotted. The x, y, and z axis are plotted logarithmically, with x and y representing the averaging time τ and window frame time t respectively. The dynamic Allan deviation is shown on the z axis.
Figure 11. ddevplot.m plotting example.
Coloration tending to red represents higher deviation, while color tending to blue represents lower deviation. In order to run ddevplot.m, a data file must first be created and the resultant filename input into the script.
267
40th Annual Precise Time and Time Interval (PTTI) Meeting
TOOLCHAIN & EXAMPLES The Clock Tools applications are encapsulated, so that the output of one tool acts as the input to the next. By using redirection and piping, the user is able to connect the Clock Tools together in a way that allows for flexibility in analysis and ease of use. As mentioned, Clock Tools has four functional categories: input parsing, data grooming, data analysis, and plotting. The input parsers are ORDPhaseParser and TIAPhaseParser. The data grooming tool is rmoutlier. The data analysis tools are nallandev, oallandev, mallandev, totvar, ohadamarddev, and dallandev. The plotting scripts are allanplot and ddevplot.m. Data flows from the parsers to data grooming to data analysis and finally to plotting. Table 1 presents a description and an example use of each tool. Note that ordClock makes an estimate of the receiver’s clock offset by averaging the ORDs of all the GPS satellites at each epoch [1]. An epoch is an instant in time in which GPS data are recorded. Tool Description Example ORDPhaseParser Parses data generated by the GPSTk’s ORD Tools
for use with the Clock tools. ordGen –o input.o –e input.n | ordClock | OrdPhaseParser > parsed.dat
TIAPhaseParser Parses data generated by the TSC 5110A Timing Interval Analyzer.
raw.dat | TIAPhaseParser > parsed.dat
rmoutlier Removes outlier data within a set of properly parsed data.
cat parsed.dat | rmoutlier
nallandev Computes the Allan deviation for a properly parsed set of inputs.
cat parsed.dat | nallandev
oallandev Computes the overlapping Allan deviation for a properly parsed set of inputs.
cat parsed.dat | oallandev
mallandev Computes the modified Allan deviation for a properly parsed set of inputs.
cat parsed.dat | mallandev
totvar Computes the total Allan deviation for a properly parsed set of inputs.
cat parsed.dat | totvar
ohadamarddev Computes the overlapping Hadamard deviation for a properly parsed set of inputs.
cat parsed.dat | ohadamarddev
dallandev Computes the dynamic Allan deviation for a properly parsed set of inputs.
cat parsed.dat | dallandev
allanplot Plots the output of nallandev, oallandev, ohadamarddev, totvar, and mallandev.
cat parsed.dat | nallandev | allanplot
ddevplot.m Plots the output of dallandev.
octave ddevplot.m
Table 1. Tools, descriptions, and examples.
Two example command lines are given below. The first command generates clock estimates using the GPSTk ORD tools (ordGen and ordClock), parses the data (ORDPhaseParser), then removes outliers (rmoutlier), computes the overlapping Allan deviation (oallandev), and finally writes the data to a file (output.oadev). The second example takes data in from a file produced by the Timing Interval Analyzer (raw.dat), parses the data (TIAPhaseParser), computes the overlapping Hadamard variance (ohadamard), and plots the output (allanplot).
268
40th Annual Precise Time and Time Interval (PTTI) Meeting
ordGen –o input.o –e input.n | ordClock | ORDPhaseParser | rmoutlier | oallandev > output.oadev
raw.dat | TIAPhaseParser | ohadamard | allanplot
Figure 12. Example commands.
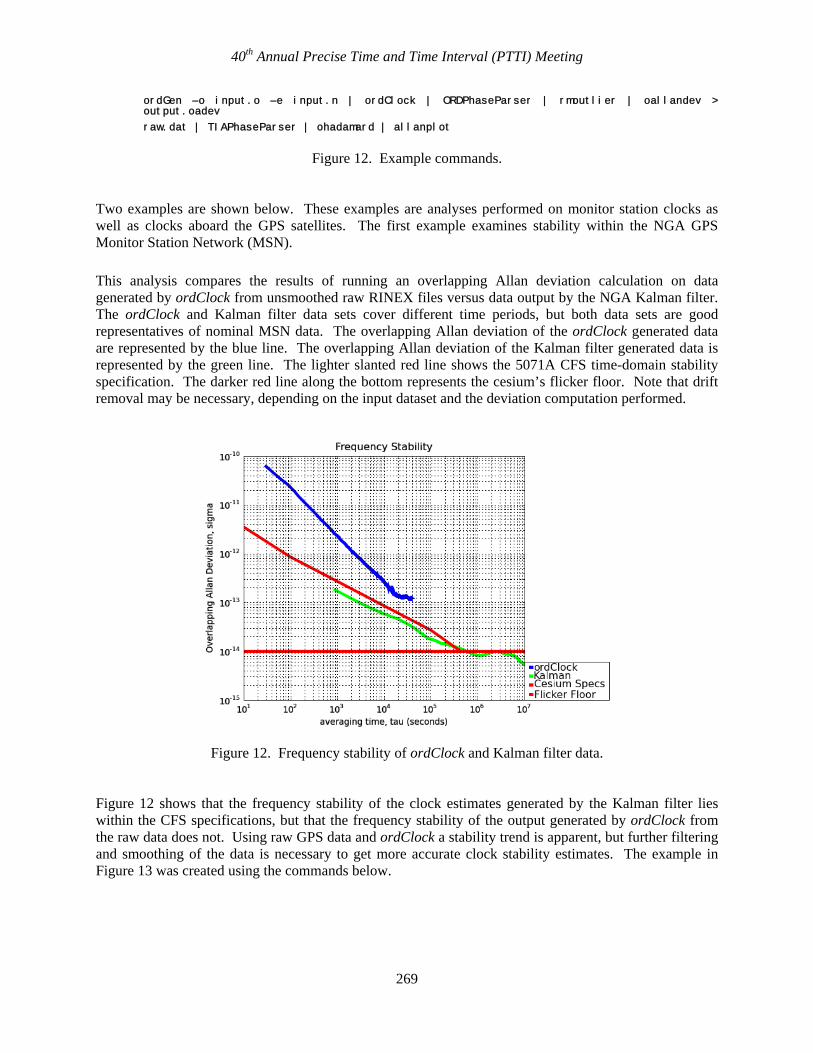
Two examples are shown below. These examples are analyses performed on monitor station clocks as well as clocks aboard the GPS satellites. The first example examines stability within the NGA GPS Monitor Station Network (MSN). This analysis compares the results of running an overlapping Allan deviation calculation on data generated by ordClock from unsmoothed raw RINEX files versus data output by the NGA Kalman filter. The ordClock and Kalman filter data sets cover different time periods, but both data sets are good representatives of nominal MSN data. The overlapping Allan deviation of the ordClock generated data are represented by the blue line. The overlapping Allan deviation of the Kalman filter generated data is represented by the green line. The lighter slanted red line shows the 5071A CFS time-domain stability specification. The darker red line along the bottom represents the cesium’s flicker floor. Note that drift removal may be necessary, depending on the input dataset and the deviation computation performed.
Figure 12. Frequency stability of ordClock and Kalman filter data.
Figure 12 shows that the frequency stability of the clock estimates generated by the Kalman filter lies within the CFS specifications, but that the frequency stability of the output generated by ordClock from the raw data does not. Using raw GPS data and ordClock a stability trend is apparent, but further filtering and smoothing of the data is necessary to get more accurate clock stability estimates. The example in Figure 13 was created using the commands below.
269
40th Annual Precise Time and Time Interval (PTTI) Meeting
ordGen –o s141220a.08o –e s141220a.08n –w 414_220a.08m | ordClock | ORDPhaseParser | rmoutlier | oallandev > ordClockout
cat kalman.85414 | rmoutlier | oallandev > Kalmanout
allanplot ordClockout Kalmanout –c –l
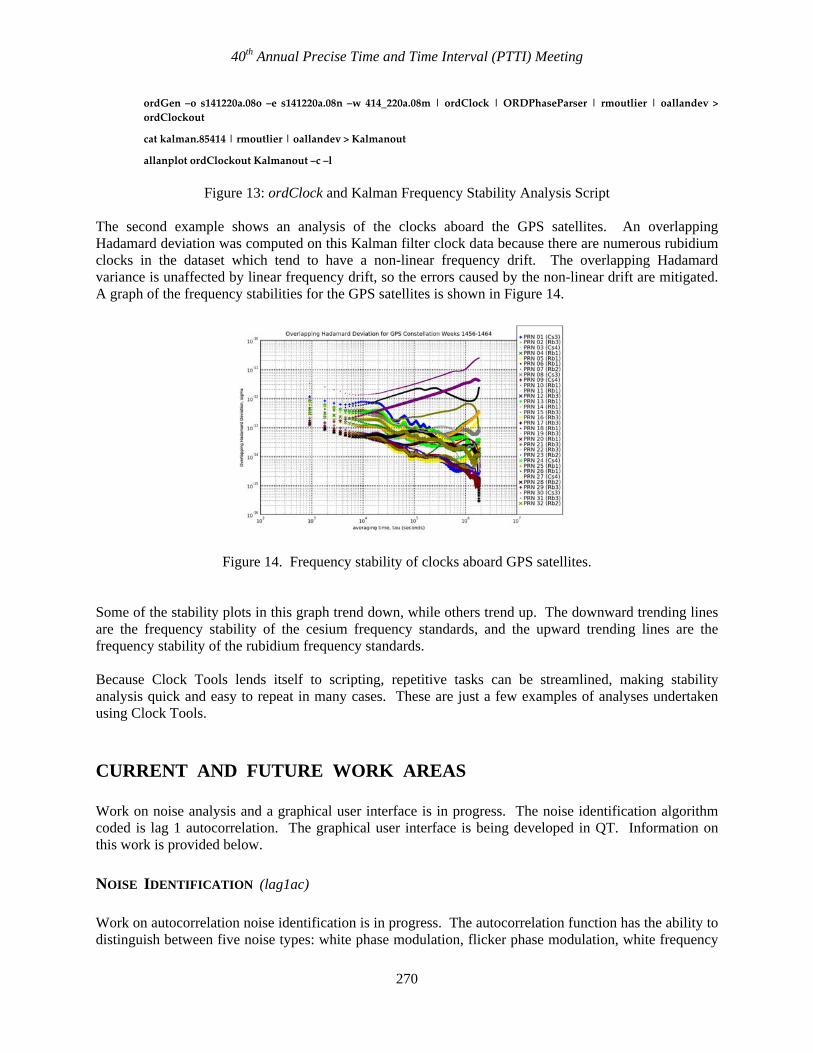
Figure 13: ordClock and Kalman Frequency Stability Analysis Script The second example shows an analysis of the clocks aboard the GPS satellites. An overlapping Hadamard deviation was computed on this Kalman filter clock data because there are numerous rubidium clocks in the dataset which tend to have a non-linear frequency drift. The overlapping Hadamard variance is unaffected by linear frequency drift, so the errors caused by the non-linear drift are mitigated. A graph of the frequency stabilities for the GPS satellites is shown in Figure 14.
Figure 14. Frequency stability of clocks aboard GPS satellites.
Some of the stability plots in this graph trend down, while others trend up. The downward trending lines are the frequency stability of the cesium frequency standards, and the upward trending lines are the frequency stability of the rubidium frequency standards. Because Clock Tools lends itself to scripting, repetitive tasks can be streamlined, making stability analysis quick and easy to repeat in many cases. These are just a few examples of analyses undertaken using Clock Tools. CURRENT AND FUTURE WORK AREAS Work on noise analysis and a graphical user interface is in progress. The noise identification algorithm coded is lag 1 autocorrelation. The graphical user interface is being developed in QT. Information on this work is provided below. NOISE IDENTIFICATION (lag1ac) Work on autocorrelation noise identification is in progress. The autocorrelation function has the ability to distinguish between five noise types: white phase modulation, flicker phase modulation, white frequency
270
40th Annual Precise Time and Time Interval (PTTI) Meeting
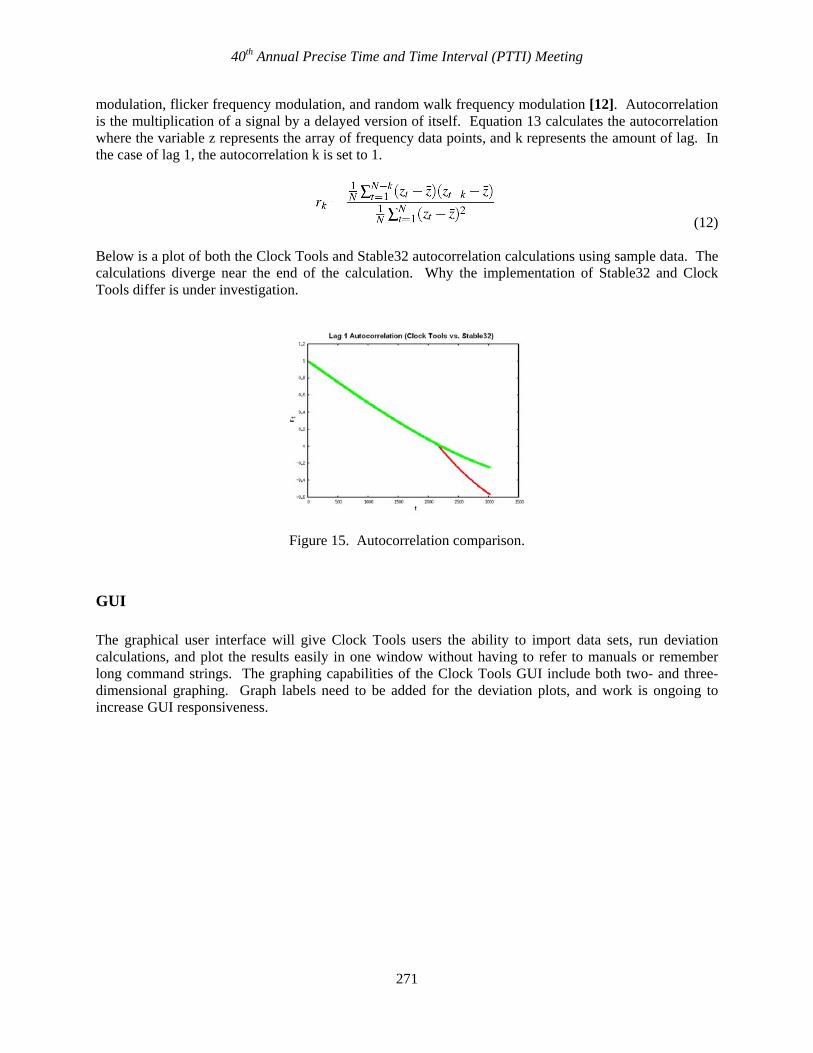
modulation, flicker frequency modulation, and random walk frequency modulation [12]. Autocorrelation is the multiplication of a signal by a delayed version of itself. Equation 13 calculates the autocorrelation where the variable z represents the array of frequency data points, and k represents the amount of lag. In the case of lag 1, the autocorrelation k is set to 1.
(12)
Below is a plot of both the Clock Tools and Stable32 autocorrelation calculations using sample data. The calculations diverge near the end of the calculation. Why the implementation of Stable32 and Clock Tools differ is under investigation.
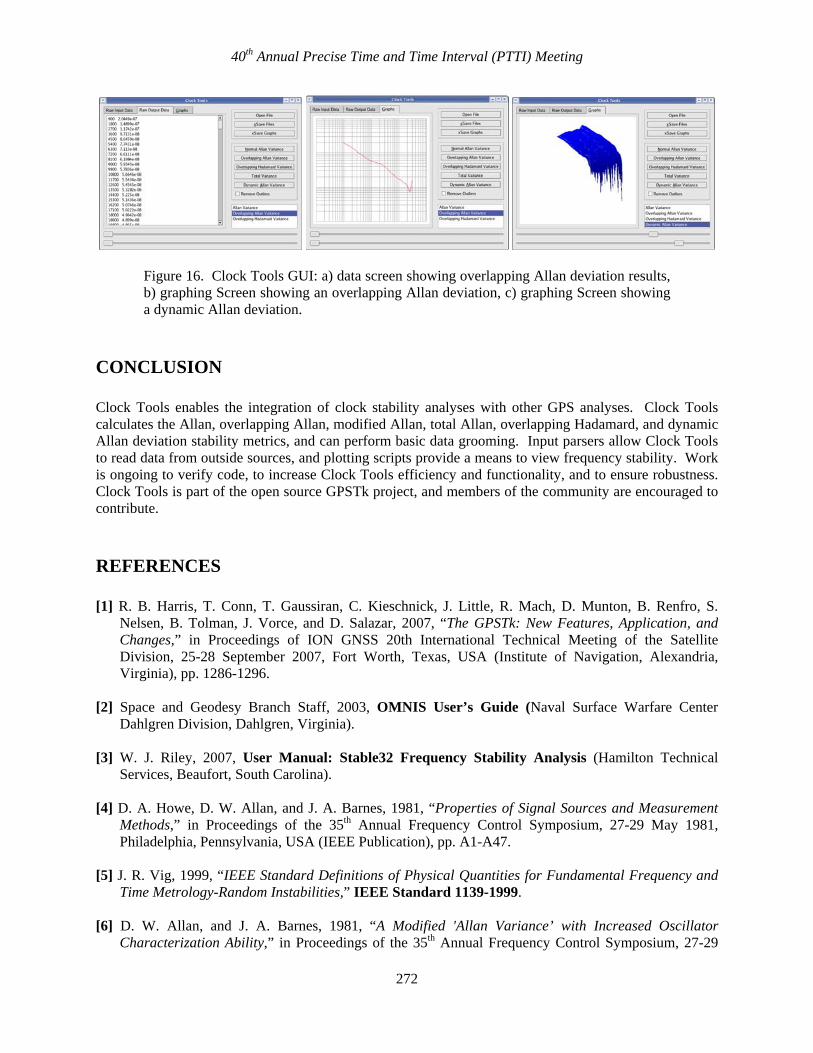
Figure 15. Autocorrelation comparison. GUI The graphical user interface will give Clock Tools users the ability to import data sets, run deviation calculations, and plot the results easily in one window without having to refer to manuals or remember long command strings. The graphing capabilities of the Clock Tools GUI include both two- and three- dimensional graphing. Graph labels need to be added for the deviation plots, and work is ongoing to increase GUI responsiveness.
271
40th Annual Precise Time and Time Interval (PTTI) Meeting
Figure 16. Clock Tools GUI: a) data screen showing overlapping Allan deviation results, b) graphing Screen showing an overlapping Allan deviation, c) graphing Screen showing a dynamic Allan deviation.
CONCLUSION Clock Tools enables the integration of clock stability analyses with other GPS analyses. Clock Tools calculates the Allan, overlapping Allan, modified Allan, total Allan, overlapping Hadamard, and dynamic Allan deviation stability metrics, and can perform basic data grooming. Input parsers allow Clock Tools to read data from outside sources, and plotting scripts provide a means to view frequency stability. Work is ongoing to verify code, to increase Clock Tools efficiency and functionality, and to ensure robustness. Clock Tools is part of the open source GPSTk project, and members of the community are encouraged to contribute. REFERENCES [1] R. B. Harris, T. Conn, T. Gaussiran, C. Kieschnick, J. Little, R. Mach, D. Munton, B. Renfro, S.
Nelsen, B. Tolman, J. Vorce, and D. Salazar, 2007, “The GPSTk: New Features, Application, and Changes,” in Proceedings of ION GNSS 20th International Technical Meeting of the Satellite Division, 25-28 September 2007, Fort Worth, Texas, USA (Institute of Navigation, Alexandria, Virginia), pp. 1286-1296.
[2] Space and Geodesy Branch Staff, 2003, OMNIS User’s Guide (Naval Surface Warfare Center
Dahlgren Division, Dahlgren, Virginia). [3] W. J. Riley, 2007, User Manual: Stable32 Frequency Stability Analysis (Hamilton Technical
Services, Beaufort, South Carolina). [4] D. A. Howe, D. W. Allan, and J. A. Barnes, 1981, “Properties of Signal Sources and Measurement
Methods,” in Proceedings of the 35th Annual Frequency Control Symposium, 27-29 May 1981, Philadelphia, Pennsylvania, USA (IEEE Publication), pp. A1-A47.
[5] J. R. Vig, 1999, “IEEE Standard Definitions of Physical Quantities for Fundamental Frequency and
Time Metrology-Random Instabilities,” IEEE Standard 1139-1999. [6] D. W. Allan, and J. A. Barnes, 1981, “A Modified 'Allan Variance’ with Increased Oscillator
Characterization Ability,” in Proceedings of the 35th Annual Frequency Control Symposium, 27-29
272
40th Annual Precise Time and Time Interval (PTTI) Meeting
May 1981, Philadelphia, Pennsylvania, USA (IEEE Publication), pp. 470-475. [7] C. A. Greenhall, D. A. Howe, D. B. Percival, 1999, “Total Variance, and Estimator of Long-Term
Frequency Stability,” IEEE Transactions on Ultrasonics, Ferroelectrics, and Frequency Control, UFFC-46, 1183-1191.
[8] R. A. Baugh, “Frequency Modulation Analysis with the Hadamard Variance,” in Proceedings of the
25th Annual Frequency Control Symposium, 26-28 June 1971, Fort Monmouth, New Jersey, USA (IEEE Publication), pp. 222-225.
[9] L. Galleani and P. Tavella, 2003, “The Characterization of Clock Behavior with the Dynamic Allan
Variance,” in Proceedings of the 2003 IEEE International Frequency Control Symposium (FCS) and PDA Exhibition Jointly with the 17th European Frequency and Time Forum (EFTF), 5-8 May 2003, Tampa, Florida, USA (IEEE Publication 03CH37409), pp. 239-244.
[10] L. Galleani and P. Tavella, 2008, “Identifying Nonstationary Clock Noises in Navigation Systems,”
International Journal of Navigation and Observation, 2008, 1-5. [11] Symmetricom, 2006, 5071A Primary Frequency Standard, Operating and Programming
Manual, San Jose, California, pp. 6-4. [12] W. J. Riley, C.A Greenhall, 2004, “Power Law Noise Identification Using the Lag 1 Auto-
correlation,” in Proceedings of the 18th European Frequency and Time Forum, 5-7 April 2004, University of Surrey, Guildford, UK.
273
40th Annual Precise Time and Time Interval (PTTI) Meeting
274