the graduate college - uw-stout behavior-based safety programs ... population and sample 40 ... to...
TRANSCRIPT

An Investigation of Methods to Measure the Effectiveness Of Behavior-based Safety Programs
In the XYZ Company
By
Michael R. Wendt
A Research Paper
Submitted in Partial Fulfillment of the Requirements for the
Master of Science Degree With a Major in
Risk Control
Approved: 3 Semester Credits
__________________________________
Investigation Advisor
The Graduate College University of Wisconsin-Stout
May 2002

ii
The Graduate College University of Wisconsin – Stout
Menomonie, WI 54751
ABSTRACT Wendt Michael R. (Writer) (Last Name) (First) (Initial) An Investigation of Methods to Measure the Effectiveness of Behavior-Based Safety Programs in the XYZ Company (Title) Risk Control Elbert Sorrell May, 2002 101 (Graduate Major) (Research Advisor) (Month/Year) (No. of Pages)
American Psychological Association (APA) Publication Format, 5th Edition (Name of Style Manual Used in this Study)
This study was an investigation of determining methods to measure the
effectiveness of a behavior-based safety (BBS) program in the XYZ Company. BBS was
a proactive process for managing the safety of employees through the use of
observations, measurement, feedback, and reinforcement. The objective of BBS was
continuous improvement in safety results based on the measurement of operationally
defined critical behaviors by employees. Critical behaviors and conditions were defined
to identify “ safe behaviors” by employees and “at risk” behaviors that could lead to
employee illness and injury.

iii
This research considered determining reliable methods of measuring the
effectiveness of BBS in improving safety performance. Effectiveness was measured in
terms of improvements of “down stream” indicators such as the reduction in the
frequency and severity of illness and injuries (OSHA incident rates) and worker
compensation incurred costs. “Upstream” indicators measured were % safe behaviors
observed compared to OSHA incident rates and improvements in employee perceptions
of safety.
Statistical methods identified to measure the effectiveness of the BBS process
included statistical process control charting (SPC) of incident rates and incurred medical
costs, linear and step change trending of incident rates and incurred costs using control
charts, analysis of variance, regression analysis, and correlation analysis of the data.
Statistically significant changes in OSHA frequency rates were found in 37% of
the BBS locations of XYZ Company after process implementation. Forty six percent of
the BBS locations had significant downward changes in the OSHA severity rate.
Nineteen percent of the BBS locations had statistically significant changes in worker
compensation incurred costs after BBS implementation. There was little statistical
difference in OSHA incident rates between BBS and selected non-BBS locations for the
year 2000 and 2001.
There was a strong inverse relationship between percent safe behaviors observed
and the OSHA frequency rate (OSHA IR) (correlation coefficient = - .822, p = 0.023).
As percent safe observations increased, the corresponding OSHA frequency rate
decreased.

iv
A safety perception survey was given to a Wisconsin location of the XYZ
Company. There were statistically significant differences in seven of eight categories
designed to measure the effectiveness of the BBS process between two work groups at
the location. One work group had been exposed to the BBS process for two years, while
the majority of the plant population was just being introduced to the process.

v
Acknowledgements
I would like to thank Elbert Sorrell and Brian Finder of the University of
Wisconsin – Stout Risk Control Department for their help and guidance in the
preparation of this document. It has been a pleasure to work with them over the past
several years as I finally complete my degree. Elbert, Brian, John Olson, and Gene
Ruenger have provided me with the academic base for my second career in the EHS
profession for my company. I would also like to thank my former and present supervisor,
Stan Garnsworthy and Gary Lewis, for the opportunity and support they have given me
since I began this degree program in January 1997. I would also like to thank Jeff Keyes,
Scott Johnson, and Ken Christenson, former graduates of the Risk Control program and
coworkers, for their assistance and encouragement. Lastly, I would like to thank my
caring and understanding wife, Jeanne, and my two wonderful daughters, Olivia and
Danielle, for their love and support through this process.

vi
TABLE OF CONTENTS
Page No.
ABSTRACT ii
ACKNOWLEDGEMENTS v
TABLE OF CONTENTS vi
LIST OF TABLES ix
LIST OF FIGURES x
CHAPTER 1 STATEMENT OF THE PROBLEM
Introduction to the Study 1
Purpose of the Study 2
Goals of the Study 2
Background and Significance 2
Limitations and Assumptions 3
Definitions 4
CHAPTER 2 REVIEW OF LITERATURE
Background 8
Behavior Based Safety Concepts 11
Safety Performance Measurements 19
Measurement of BBS Effectiveness 26
Review of Effectiveness at XYZ Company 33
Conclusion 36

vii
Page No.
CHAPTER 3 METHODS AND PROCEDURES
Introduction 38
Method of Study 39
Population and Sample 40
Instrumentation and Materials 42
Method of Analysis 45
Summary 48
CHAPTER 4 RESULTS AND DISCUSSION
Results and Discussion 50
Objective 1: Methods of Measurement 50
Objective 2: Does BBS Work? 55
Summary 65
CHAPTER 5 SUMMARY, CONCLUSIONS AND RECOMMENDATIONS
Introduction 66
Summary 66
Conclusions 70
Recommendations 73
REFERENCES 76
APPENDICES
Appendix A – XYZ Company BBS Locations 82
Appendix B – XYZ Company Global Safety and 83
Health Plan (GSHP)

viii
Page No.
Appendix C – Safety Culture Survey 92
Appendix D – BBS Studies Reporting Impact on 93
Injuries
Appendix E – BPCharts of Cynthiana 96

ix
LIST OF TABLES
Page No.
Table 1 Results of BAPP Implementations at XYZ Company 34
Table 2 Brookings, S.D. I/I Rates and Incurred Costs 44
Table 3 Summary of Step Change Analysis of BBS Locations 57
of XYZ Company
Table 4 Summary of One-way ANOVA of BBS Locations 58
in XYZ Company
Table 5 Summary of Linear Trends of Indices in BBS Locations 59
of XYZ Company
Table 6 Analysis of Variance of Incident Rates for BBS 60
and Non-BBS Locations
Table 7 T-test for Equality of Means between Plant and Optical 61
Systems Employees for Eight Safety Perceptions
Measured

x
LIST OF FIGURES
Page No.
Figure 1. Analysis of Variance for Question number 6 48
Figure 2. Run Chart: Cynthiana OSHA IR (1991-2001) 51
Figure 3. Individual Chart: Cynthiana OSHA IR (1991-2001) 52
Figure 4. Moving Range Chart: Cynthiana OSHA IR (1991-2001) 53
Figure 5. Linear trend chart: Cynthiana OSHA IR (1991-2001) 53
Figure 6. Linear trend chart: Cynthiana OSHA IR (1997-2001) 54
Figure 7. Step Change Chart: Cynthiana OSHA IR after BBS 54
implementation
Figure 8. ANOVA for OSHA IR at Cynthiana from Minitab 55
Figure 9. OSHA IR vs. % Safe Observations 60

Effectiveness 1
Chapter 1
Statement of the Problem
Introduction to the Study
Behavior based safety (BBS) is a proactive process for managing the safety of
employees through the use of observations, measurement, feedback, and reinforcement.
As Dennis (1997) wrote “the objective of behavior-based safety is continuous,
statistically significant improvement based on the measurement of operationally defined
critical behaviors” (p. 114). Critical behaviors and conditions are defined to identify “
safe behaviors” by employees and “at risk” behaviors that could lead to employee illness
and injury. Feedback and positive reinforcement are given for “safe behaviors” and
actions are taken by management to eliminate barriers that cause “at risk” behaviors.
Company XYZ has 19 facilities in the US and Europe that had implemented some
form of BBS to improve safety performance in the workplace over the past 10 years.
Several of these facilities had implemented these systems with the assistance of outside
consultants, such as Behavioral Science Technology, Inc. (BST, 2002) and Safety
Performance Solutions (SPS, 2002) who specialize in the implementation of the BBS
process. Other sites have or are conducting self-implementation of BBS based on current
BBS theories and principles (see Appendix A). One Wisconsin facility of Company
XYZ had implemented a BBS program in one of their major operating departments
(about one fourth of the employees at the site), two years ago. The remainder of the plant
was just beginning implementation of the BBS process. There has been limited research
conducted within XYZ Company to determine the effectiveness of BBS alone towards
safety performance improvement.

Effectiveness 2
Purpose of the Study
The focus of this study was the determination of reliable methods to measure the
effectiveness of the behavior-based safety process in the XYZ Company.
Goals of the Study
The primary goals of this study were:
1. To identify statistically valid techniques that measured the effectiveness
of BBS alone as a management tool to improve safety performance.
2. To determine if the behavior-based safety process worked? In a company
where existing EHS management systems were relatively identical from
facility to facility, was it shown that BBS alone had improved overall
safety performance in those plants that had implemented this process?
Background and Significance of the Study
Background. The BBS process had become a popular choice for many
organizations in the past 10 years to manage their safety performance (Peterson, 1998).
The XYZ Company has had 15 U.S. locations implement the process, with the earliest
implementation beginning in approximately 1995 (refer to Appendix A). Research on the
effectiveness of the behavior-based safety process in improving safety performance had
not been extensively conducted in the XYZ Company. BST had provided XYZ
management with some measured results in facilities that initially installed the process
through their consulting firm in 1998 (BST, 1998). An internal study conducted in 1999
attempted to correlate the percentage of safe observations observed with a decrease in
OSHA recordable incident rates (Bond, 1999). As with any process or management
system, methods to effectively measure improvement must be a consideration before an

Effectiveness 3
organization fully embraces the program. Therefore, this remained the main purpose and
significance of this study.
Significance of study. The significance of this study:
1. Provided information to XYZ Company management on the effectiveness
of BBS by determining reliable methods of measurement. Was it effective
to implement a BBS program over other traditional safety management
approaches?
2. Verified or disproved previous research conducted within XYZ Company
on BBS effectiveness.
3. Contributed to the knowledge base of other researchers in the support of
determining statistically reliable methods of measuring the effectiveness
of BBS in improving safety performance.
Limitations and Assumptions of the Study
Limitations. This study included the following limitations:
1. This study was limited to Company XYZ and those XYZ facilities that
had implemented the behavior-based safety process.
2. No comparisons were made to the European facilities that have
implemented the process.
3. Access to worker compensation information was limited.
4. There was a time constraint of three months to complete the study.
Assumptions. The following assumptions were made concerning this study:
1. Previous research conducted in this area may have been bias since
considerable research in measuring BBS effectiveness had been conducted

Effectiveness 4
by consultants that marketed the BBS process to clients (i.e. BST and
SPS).
2. Since BBS was a long term cultural change in an organization, the
relatively short duration of time where BBS had been implemented in
some facilities may not have been shown in indices such as a reduction in
OSHA incident rates. It was assumed that if employees believed in the
BBS process, their perception (attitude) of EHS issues should have been
more positive than those employees not engaged with the process. A
perception survey was conducted in only one facility – the Wisconsin
facility where one major department implemented BBS two years ago,
while the remainder of the plant had just started implementation of a BBS
program.
3. Changes in incident rates were due primarily to the introduction of the
BBS process into the organization. Outside factors that may have also
contributed to changes in incident rates could have been more proactive
activity in return–to-work programs, ergonomic initiatives, management
allocation of additional resources and emphasis of the safety activity in the
plants, internal OSHA record keeping audits, voluntary OSHA VPP STAR
certification programs, and other factors related to these changes.
Definitions.
Illnesses. Illnesses were anything other than an instantaneous event in the work
environment (XYZ Company, 2002).

Effectiveness 5
Incidence Rate. The number of injuries, illnesses or lost workdays related to a
common exposure base of 100 full-time workers. The common exposure base enabled
accurate inter-industry comparisons, trend analysis over time or comparisons among
firms regardless of size (XYZ Company, 2002). This rate was calculated as:
Incidence Rate = # Cases or Days x 200,000
Total Hours Worked
Injuries. Injuries caused by instantaneous events in the work environment (XYZ
Company, 2002).
Lost workdays. The number of workdays, consecutive or not, on which the
employee would have worked but could not because of an occupational injury or illness.
(XYZ Company, 2002).
Lost workday, cases. Cases which involved a full day away from work or more
(XYZ Company, 2002).
Lost workday case incidence rate (LWIR). The number of lost workday cases /
100 workers. It was calculated as follows: (# lost workday cases) x 200,000/ # hours
worked (CompWatch, 2002).
OSHA incidence frequency rate (OSHA IR). The number of workers/100 workers
who had lost or restricted workdays. It was calculated as follows: (# lost workday and
restricted cases) x 200,000/ # hours worked (CompWatch, 2002).
OSHA lost workday severity rate (LWSR). The number of lost workdays / 100
workers. It was calculated as follows: (# lost workdays) x 200,000/ # hours worked
(CompWatch, 2002).

Effectiveness 6
OSHA severity rate (OSHA SR). The number of workdays/100 workers who had
lost or restricted workdays. It was calculated as follows: (# of lost and restricted
workdays) x 200,000/ # hours worked (CompWatch, 2002).
Restricted work only, cases. Cases which the employee, because of the result of a
job-related injury or illness, was physically or mentally unable to perform all or any part
of his or her normal assignment during all or any part of the workday or shift (XYZ
Company, 2002).
Restricted work, days. The number of workdays, consecutive or not, on which,
because of injury or illness: (1) the employee was assigned to another job on a temporary
basis; or (2) the employee worked at a permanent job less than full time; or (3) the
employee worked at a permanently assigned job but could not perform all duties
normally connected with it (XYZ Company, 2002).
Total lost workdays. The number of workdays, consecutive or not, beyond the
day of injury or onset of illness, the employee was away from work or limited to
restricted work activity because of an occupational injury or illness (XYZ Company,
2002).
Total lost workday, cases. Cases which involved days away from work or days of
restricted work activity or both (XYZ Company, 2002).
Total recordables. All work-related deaths, illnesses and those work-related
injuries, which resulted in: loss of consciousness, restriction of work or motion, transfer
to another job or required medical treatment beyond first aid (XYZ Company, 2002).

Effectiveness 7
Total recordable OSHA incident rate (TRIR). The number of workers / 100
workers who had OSHA recordable injury and illnesses (I/I). It was calculated as
follows:
(# of OSHA recordable I/I) x 200,000/# hours worked (CompWatch, 2002).

Effectiveness 8
Chapter 2
Review of Literature
Background
Crisis in safety management. There still remains a crisis in safety management in
business and industry. According to a report issued by the National Safety Council, in
2000 there were 5,200 workplace fatalities due to unintentional injuries in the United
States. This equated to 3.8 deaths per 100,000 workers during that year. On the job, 3.9
million American workers suffered disabling injuries during the same time period.
Economically it was estimated that these injuries cost Americans 131.2 billion dollars in
2000. These losses exceeded the combined profits of the top 13 Fortune 500 companies
during that year (NSC, 2001). Obviously the reduction in the loss of life, a reduction in
disabling injuries, and the associated monetary loss should be the primary goal of the
safety management of any firm.
History of safety management. Unfortunately effective safety management has
not been a core value business and industry embraced consistently in their strategic
planning in the Twentieth Century. Safety is not a new management responsibility. In
1931 H.W. Heinrich, an employee in the insurance industry, developed the domino model
of accident causation (Heinrich, Roos, & Petersen, 1980). This theory stated accidents
were caused by one of five factors in a sequence: ancestry and social environment, a
personal flaw, unsafe acts and conditions, the accident itself, and the resulting injury. By
minimizing or removing the “unsafe acts” or “unsafe conditions”, Heinrich believed that
accidents could be controlled. This model dominated the thinking of safety management
during the remainder of the century. Legislation passed during the century, such as the

Effectiveness 9
Occupational Safety and Health Act (OSHA) in 1970 was based heavily on identifying
unsafe conditions in the workplace.
Even companies that developed hazard recognition systems purported to be based
on behavioral principles, such as the Dupont STOP (Safety Training Observation
Program) program, was largely designed to “correct unsafe acts and conditions”. These
were actual words written on their website (Dupont, 2002). Geller (2002) stated that this
approach lacked perceived ownership by employees, which was a necessary success
factor in implementing a BBS process. McSween (1995) described the process as “a
process of layered safety audits” by management. Each level of management was
required at least weekly to observe their subordinates and “document any unsafe acts they
have observed on STOP cards (but not the names of offenders)” (p.7).
From the early 1900s to the present employers and safety practitioners
have employed the three Es of safety management – engineering, education, and
enforcement (Geller, 1996; Pettinger, Boyce, & Geller, 2002). These three Es of safety
focused on (a) engineering that designed safe equipment and work conditions, (b)
educating and training employees on engineering interventions, and (c) enforcement of
recommended safe work practices. This was consistent with the top down management
approach of the traditional safety management model.
Traditional safety management focused on injuries and illnesses, reactive rather
than proactive involvement, treated safety as a separate function in the management
hierarchy, was not system –oriented, tended to blame workers for accidents, focused on
attitudes of workers, relied heavily on rewards and promotions, was based on a top down

Effectiveness 10
management model, and placed a strong emphasis on rules and close supervision of
workers (Dennis, 1997).
In contrast to the tenets of traditional safety management supported by Heinrich,
another major viewpoint of safety management developed during the century. These
concepts evolved from quality management theory developed during the times preceding
and following World War II. Walter Shewart, a contemporary of Heinrich, found in his
empirical research that (a) 85 percent of the causes of error were caused by the system
(deemed common causes), and (b) 15 percent of the causes of error originated outside the
system, and were therefore special causes (Dennis, 1997). Therefore, since management
controlled the system this meant management was responsible for 85 percent of the
errors, while the workers were responsible for 15 percent of the errors. Most problems in
any operation were systemic, derived from the workplace and work methods created by
management. Therefore management was responsible for resolution. The worker was
responsible for the small remainder (Manuele, 1998). This was in direct opposition to the
theory developed by Heinrich, which placed most of the blame on the worker for accident
causation.
After World War II, Japan enlisted two quality experts, Joseph M. Juran and W.
Edward Deming, who had studied Shewart’s theories of management, to rebuild their
economy. These individuals developed management theories based on quality principles.
Using statistical process control (SPC) and other management tools that stressed
leadership, measurement, and participation, they helped transform the Japan economy
into a world industrial power by the 1980s. “Deming’s 14 Obligations of Management”
applied to any management system, including safety management. When applied to an

Effectiveness 11
organization’s safety management system, top management must create a constancy of
purpose, take responsibility to institute management controls, focus on upstream
prevention, measure the quality of the system, and focus on continuous improvements of
the system (Salazar, 1989). These systems management principles became the dominant
approach advocated by leading safety professionals in the past 25 years (Petersen, 1994).
Whereas the attempt of the traditional safety management approach was to
identify factors in the workplace environment (unsafe conditions) and factors with
employees (unsafe acts), the BBS effort has focused on defining and managing an
employee’s behavior to improve safety performance. Since the early 1990’s many
organizations have embraced this approach to be the “Holy Grail of accident prevention –
the ‘silver bullet’ that will ‘slay the werewolves’ preventing us from achieving zero
accidents” (Ragan, 1997).
Behavior Based Safety Concepts
Development of behavior-based safety. The BBS process was based on a
proactive process for managing safety through the use of employee observations,
measurement, feedback and reinforcement. The four main elements of a behavioral-
based safety process were identifying critical behaviors, observation/data gathering,
giving feedback, and removing barriers that cause illness and injury. (Geller, 1996). This
process evolved out of research in the behavioral sciences that can be traced back to the
early Twentieth century. The concepts stemmed from works from John Watson, a
psychologist who wrote about behaviorism as early as 1910, Pavlov who experimented
with “classical conditioning” in the 1920s, and B.F. Skinner’s “operant conditioning”
concepts in the 1940s (Petersen, 2000a). According to behaviorist theory, consequences

Effectiveness 12
(reinforcement), which were positive, immediate, and certain (rewards) would keep
employees working safely. Negative consequences, which were immediate and certain
(punishment), discouraged unsafe behaviors (Smith, 1999).
In 1978 Judi Komaki (Komaki, Barwick, & Scott, 1978) was one of the first
applied psychologists to apply BBS principles, referred to at that time as applied
behavioral analysis (ABA), in the workplace setting. During that same time period, two
employees at Proctor & Gamble were developing the same methodology to be used in an
integrated safety management system (known now as the P&G Key Elements model).
The P&G employees were believed to be the first safety professionals to use the term
“behavior-based safety” to describe the process (Krause, 2001).
Application to safety management. The Komaki study (Komaki, et. al., 1978)
applied behavioral psychology to safety problems in a food processing plant. This study
(a) defined safety-related behaviors in clear and simple terms, (b) assessed observed
behaviors against defined desirable behaviors, (c) introduced the concept of “percent
safe” for observed behaviors, and (d) provided feedback to workers based on safety-
related behaviors. This became the model upon which the BBS process has been refined.
Application of the BBS process was built around this research approach. The
main concept of the BBS process was the antecedent-behavior-consequence (ABC)
model. Antecedents (also called activators) were events that triggered or preceded
behaviors. Behaviors were observable actions. Consequences were states or events that
followed behavior. Consequences, both positive and negative, were the most powerful
influence on changing behaviors (Williams & Geller, 2000) . In the BBS process , the
identification of key, observable safe behaviors upstream in the process was the first step

Effectiveness 13
in establishing the ABC model. Antecedents (activators) that encouraged these safe
behaviors were identified or established and those behaviors that caused at-risk behaviors
were removed. Concurrently, predictable positive and negative consequences were
implemented to reinforce desired behaviors and discourage unsafe behaviors. Therefore,
by designing and controlling effective workplace antecedents and consequences,
management could increase safe behaviors and discourage at-risk behaviors. Therefore,
in theory, the effective management of select critical behaviors upstream in the process in
combination with well-planned antecedents and consequences would result in fewer
accidents and injuries (Reynolds, 1998).
Implementation of the BBS process. Although a particular consultant or
organization may have differed in the methods or steps in the process, these were the
basic steps of implementation (Hans, 1996):
1. Identified site –specific critical behaviors and developed a critical
behaviors inventory (CBI) relative to the organization.
2. Performed a loss analysis to compare the identified critical behaviors to
historical accident and injury data to confirm the CBI.
3. Trained employees in observation and feedback skills to identify safe and
at-risk behaviors. Observations were anonymous and non-punitive to all
employees.
4. Integrated the observation process into normal organizational activities.
5. Data collected from the observations was collected and analyzed to
determine required interventions. The Plan-Do-Check-Act (PDCA)
quality model was applied for continuous improvement (Dennis, 1997).

Effectiveness 14
6. Regular feedback to employees was given to influence behavioral change.
Safe behaviors were reinforced and became habits.
7. Removal of barriers that caused at-risk behaviors. These barriers could
have been a lack of employee training, failure in the management system
(lack of procedures), lack of engineering controls or safeguards, or
organizational culture.
Comparison of BBS methods. Three leading consultants evolved out of the BBS
research that was conducted beginning in the late 1970s in the United States: (a) Thomas
R. Krause, founder of BST, (b), E. Scott Geller, founder of SPS, and (c) Terry McSween,
an independent BBS consultant, writer, and colleague of Geller.
Krause referred to his BST process mostly as behavior-based safety (BBS)
methods (Krause, Hidley, & Hodson, 1990). E. Scott Geller took a more psychological
and humanistic approach and referred to his process as “Actively Caring in a Total Safety
Culture” (Geller, 1996). Terry McSween called his approach “Values Based Safety”
(VBS) methods since this concept promoted making safe behavior a value that would
endure in the culture of an organization and not be another program that dwindled away
(McSween, 1995). Both Geller and McSween believed that the BBS process must be a
core value in the organization rather than just habitual. All these processes were based on
sound social and psychological principles backed by peer-reviewed research. All three
systems used a form of operant conditioning to modify behavior toward the desired end.
Krause and McSween described this conditioning as Antecedent-Behavior-Consequence.
Geller interchanged Activator with Antecedent.

Effectiveness 15
All consultants used the terminology “safe” and “unsafe behavior” for the
observable behaviors and the data collectors were called either observers or coaches
(Geller, 1996). All consultants agreed that an assessment of the existing safety programs
and organizational culture was necessary to identify potential barriers and help plan
implementation strategy. The observation record was called the Critical Behavior
Inventory (CBI) by Krause, the Safety Checklist by McSween, and the Critical Behaviors
Checklist (CBC) by Geller. Each consultant used a slightly different format, but the
results were the same.
All consultants stressed the power and advantage of the BBS process to empower
the rank and file worker. McSween developed this further into team building and
individual skills development. Geller stressed teams, but also emphasized the individual
psychological processes involved with the BBS process. Krause, through his BST
resources, offered other organizational applications based on the BBS process such as
Total Quality Management (TQM), Statistical Process Control (SPC), and Continuous
Process Improvement (CPI) (BST, 2002). Krause utilized proprietary data management
software to track the results of the BBS data. Geller, through his SPS organization,
offered similar data management software (SPS, 2002). McSween did not offer this
service.
Geller promoted humanistic behavior of individuals within organizations to
“actively care” for the safety of their coworkers, not just themselves. Geller introduced
the concept of the safety triad (person-behavior-environment). He also advocated the
new three “E”s of safety: ergonomics, empowerment, and evaluation. Geller
recommended a redirection of safety incentives/awards to “celebrate” the

Effectiveness 16
accomplishments of the BBS process and to sustain the interest in the program (Geller,
1996).
McSween’s approach to the BBS process was more employee–driven and team-
oriented that worked within the existing framework of the organization. McSween
recommended a redirection of incentive/rewards from the traditional approach (results-
oriented) to activity–based rewards and recognition (McSween, 1995).
Krause ‘s approach to the BBS process appeared to be the most regimented. It
was employee-driven and attempted to change the organizational culture. Krause
appeared to be against awards and incentives and only passed judgment that these
alternatives were ineffective and needed to be replaced (Krause, et. al., 1990).
Advantages of BBS. According to the proponents of the BBS process, the concept
had several advantages over other traditional safety management approaches. BBS
identified systems causes of illness and injuries, enhanced traditional safety systems, and
were based on sound behavioral analysis principles (Blair, 1999). The process was
administered to individuals with minimal professional training, reached employees at the
problem, was cost effective, and intervention was easily applied by indigenous personnel
monitoring target behaviors (Geller, Boyce, Williams, Pettinger, DePasquale, &
Clarke,1998).
The BBS process functioned well in the employee feedback/communication loop
needed to continually improve the process. The observation and feedback cycle
reinforced the “relaxed awareness” (optimal state of safe and productive performance) of
employees, and especially kept veteran employees from “going on automatic pilot” with
the increased risk of suffering an accident. (Dennis, 1997). As noted earlier, traditional

Effectiveness 17
thought stated 88% of accidents were caused by unsafe acts by employees (Heinrich, et
al, 1980). By identifying the critical behaviors and controlling their antecedents and
consequences, the frequency of at-risk behaviors and the potential for accidents were
reduced. The cooperative problem solving between employees created an atmosphere of
trust among employees and fostered changes in the organizational culture (Dennis, 1997).
By identifying subtle employee behaviors that caused accidents, the BBS process was an
opportunity for organizations with exemplary safety records to move to the next level of
safety performance ( Loafmann, 1998).
Disadvantages of BBS. Just as there have been many safety professionals that
have supported the claim that BBS was the paradigm shift needed to move safety
management to the next level, there have also been as many doubters of the process.
Opponents of the process claimed BBS placed responsibility for safety on the employee
and not management, could not be a substitute for the lack of other solid safety programs
required in the work place, and has been proliferated with consultants with a “sell
mentality”(Atkinson, 2000).
Organized labor has also voiced opposition to the process. In an article published
by the UAW, Jim Howe , union representative, stated,” Victim blaming” is at the heart of
behavior-based safety programs.” (Blair, 1999). According to Howe,” Behavior-based
safety programs appeal to many companies because they make health and safety seem
simple , do not require management change, focus on workers, and seem cheaper than
correcting health and safety hazards.” (Karr, 2000). Even Charles Jeffress, former head
of OSHA, had reservations on how BBS could be applied in organizations that tried to
correct unsafe behaviors by employees but shirked their management responsibility to

Effectiveness 18
provide a safe workplace. Jeffress stated, “I’m troubled by programs that use behavior-
based safety as a basis for the program” (Karr, 2000).
Other opponents say success has been measured and conclusions drawn based on
causal relationships. In an article published by the National Safety Council, one writer
suggested that the research that has been conducted have been only case studies and
anecdotal stories, and not predicated on rigorous scientific research. (Karr, 2000). No
studies have taken into account the influence of other programs that may have influenced
the results. Some companies have chosen to scrap the BBS process when it did not
produce the desired outcomes. One safety professional that worked in an organization
where BBS was tried but abandoned said that BBS would be “an excellent tool in an ideal
world.” “Its good for getting employees to take ownership for their own well-being and a
lot of employers think it’s the be-all and end all…But people run into trouble when they
try to substitute it for engineering controls.” (Karr, 2000).
According to Dr. Richard D. Fulwiler, former corporate director of health and
safety for Proctor & Gamble-worldwide, and key contributor to the development of the
P&G key elements process, BBS has had its shortcomings when implemented by some
management. He blamed too many programs have been implemented where there has
been a lack of focus from management. Management had introduced it as a “program”
and not integrated into the overall management system or worse yet, according to
Fulwiler, it had become the main delivery system for safety management in the
organization. (Fulwiler, 2000).
Another disadvantage of BBS seen by some is the long length of time and
resources needed to implement the program. The National Safety Council regarded BBS

Effectiveness 19
as a useful tool but cautioned that it was not a “magic bullet” for organizations. As Don
Ostrander, NSC director of the organization’s consulting division, stated, “We endorse
any concept that stimulates an organization to make safety and health a priority. But
behavior-based programs are only effective in the long run if companies maintain the
interest and if there’s sufficient internal support to let the system thrive”(Hans, 1996).
The cultural change required for the process may be too long for some organizations to
endure, who give up, and go back to their old ways. Acceptance by foreign companies,
where the culture of the society may have problems with the observation and feedback
process, such as in the Orient, has not been extensively studied (Hans, 1996).
Lastly, some opponents, such as T. A. Smith, have argued the roots of the BBS
process are based too much on behaviorism (the human element) and have not fit well
with the new integrated management systems that required systems thinking by
employees. Smith contended the BBS has fit well with the command –and-control style
of management , but not within the quality/integrated management model. The quality
model dictated that the cause of accidents was the system and not the employees. “When
management discovers this is a better way to manage their safety, then they will give up
the BBS concepts and take aim at managing the system” (Smith 1999).
Safety Performance Measurements
Measurement criteria. A common management proverb has stated, “What gets
measured gets done.” (Source unknown). In terms of the measurement of safety
performance the questions become: what is measured and how is it measured? Safety
performance has been measured to (a) determine benchmarks to sense improvement, (b)

Effectiveness 20
measure and determine accountability, (c) measure communication/feedback in the
management system, and (d) measure costs (Dennis, 1997).
Downstream measurement. The traditional method of measuring safety
performance has been downstream or after-the-fact accident rates. The OSHA frequency,
severity, and total recordable incident rates (refer to Chapter 1 definitions) have been
used since the inception of OSHA in 1970 to measure the success of any organization’s
safety performance. There has been much discussion on how incident rates should be
used to measure safety performance. Even Heinrich recognized the need to measure the
results of accidents during the 1930s. In Industrial Accident Prevention, Heinrich states
“The most valued methods in accident prevention are analogous with the methods for the
control of quality, cost, and quantity of production” (Heinrich 13-16)(O’Brien, 1998).
Industry has typically measured safety by one single number – OSHA
recordables. Geller contended that this was the wrong standard to be used to measure
safety success. Geller argued that this has been the only indices that some companies
have used to evaluate their success and for determining promotions and pay raises.
According to Geller, other drawbacks of using the incident rate for measuring success has
been the manipulation of the numbers for company advantage by under-reporting
employee injuries and illnesses to make the company look good. (Geller, 2002).
O’Brien (1998) discussed the inadequacies of results oriented metrics, but also
stated that downstream metrics must also be used for internal and external safety
measurements such as benchmarking and industry comparisons. He stated,
The focus is on constant improvement of leading edge indicators that will
ultimately improve the trailing edge indicators. Lagging indicators that should be

Effectiveness 21
used are OSHA recordable incident rate, severity rate, and insurance reserves.
Leading indicators should be measuring activities: safety suggestions, safety
meetings, safety audits, contractor measurement, housekeeping, documentation,
and management involvement. Safety performance must be measured in the same
way that other business sectors are measured.
Dan Petersen, noted safety management consultant, has also realized the
drawbacks of downstream indicators to measure safety success. If incident rates were to
be used they required statistical validity consistent with the other quality management
systems in the organization. Petersen advocated replacing traditional measures (incident
rates) with valid meaningful upstream measures such as process improvements achieved
or through measured improvements through safety perception surveys. (Petersen, 1997).
Petersen further stated that the incident rates were false benchmarks for organizations.
Insurance companies used them to set rates and organizations used them internally to
measure safety system effectiveness. Peterson contended that this information is used
wrongly to punish or reward management, determined which organizations were best in
safety, set unrealistic goals, and was the determining factor for management action or
inaction. “Results measures nearly always measure only luck and do not diagnose
problems”, said Petersen (Petersen, 1998b).
Other safety professionals (Salazar, 1989) have equated incident rates in terms of
quality metrics: the measurement of the number of defects in the system. Deming
advocated the measurement of the quality of the system and not the quality of results.
Salazar contended that incident rates were an unreliable metric based on chance if there

Effectiveness 22
was no intervention by management. The reporting of incident rates has been subject to
under reporting and bias by organizations.
Stricoff (2000) contended there were two types of safety measures used in
industry – accountability indicators and performance indicators. The safety profession
has historically relied on retrospective indicators (accountability indicators) – injury
frequency rates. Management has been reactive when the frequency rate exceeded the
upper limit of the norm and management acted to drive the rate down. When the rate fell
below the limit, management tended to ignore safety and the recordable rate increased
again. Injury rate outcomes were after-the-fact indicators and not suited for proactive
safety management efforts. With emphasis on the rates, these measurements have been
more suspect to manipulation to “make the numbers” come out right by organizations.
Stricoff explained, “This rate is the ultimate outcome for the safety process and is
analogous to the business measuring profit”.
In summary, use of the incident rate to measure safety performance has been
applied extensively in industry. However the incident rate-focused approach to safety
concentrated on the outcomes of the safety process. Management became reactive when
the incident rate exceeded their comfort level and became complacent when the incident
rate dropped below their lower comfort level. The fallacy of this approach was that
incident rates may reflect no more than random variation rather that a valid indication of
safety performance improvement. Incident rates may plateau with no efforts given by
management to improve the safety process even though losses occurred. Upstream
measurement was more desirable. Incident rates can be used as sound benchmarks over a
span of time for large companies who have tracked their progress after a program has

Effectiveness 23
been implemented (such as this study). Incident rates can be “bottom line” measures and
therefore can be used to track long-range trends in the organization. As with BBS, the
organization should use statistically valid incident rates as an indicator on how well the
process was affecting safety performance (Dial,1992).
Upstream measurement. As has been indicated in the literature review thus far,
down stream measurements, such as incident rates, should only be considered for the
measurement of long-term results and trends in the safety management system. The
measurement of upstream or before-the-fact metrics was argued to be the most effective
way to manage the system. Upstream metrics included safety perception surveys, safety
audits, critical behavior checklists, and the tracking of safety activities in organizations.
Perception surveys. Perception surveys can be used to measure the
effectiveness of the safety management system (Krause, Hidley, & Hodson, 1991). Dan
Petersen (Petersen, 2000b) stated that perception surveys can be a means of measuring
the safety “health” in an organization. Perception surveys measured what employees
thought about safety management as opposed to benchmarking against safety programs.
Benchmarking or “best practices” asked management what was working or not working,
but not how employees felt about their safety. Peterson recommended the Minnesota
Perception Survey to be one instrument that has been statistically validated. It measured
perceptions in 20 categories of a safety management system. The results were presented
in % positive responses. Responses below 60% positive were considered to be “red
flags” for management. “Surveys reveal where performance levels actually are”, stated
Petersen.

Effectiveness 24
Safety audits. Safety audits can be another upstream metric to indicate
safety performance. Dan Petersen (Petersen, 2000b) proposed audits should be used only
when the organization has validated that the audit items have correlated to its accident
record over a period of years to identify problem areas. He stated that audits were
developed to define upstream measures – elements of the safety system that were in place
to prevent accidents. However, Petersen argued that there has been little effort to
correlate audit results to the accident record. Research conducted by various
organizations and individuals show mixed results that accident rates could be reduced by
improving safety audit scores. Only if audits are constructed to correlate accident records
in large enough numbers to show validity would they be considered to be effective
(Petersen, 1998b).
Measuring behavioral indicators. Krause, et al (1991) advocated that the
“most valid method of achieving sustainable, long-term results is to steer a facility’s
safety efforts by a variety of behavior-based indicators, in judicious combination to
accident frequency”. Measuring safe behaviors against a predetermined critical behavior
checklist or inventory has been the preferred upstream method of evaluating the
effectiveness of the BBS process. The authors advocated upstream measures based on
the quality improvement cycle: specify standards, measure compliance, and provide
feedback. The standards related to an inventory of critical safety-related behaviors and
the measure of compliance compared the ratio of safe to unsafe critical behaviors.
Feedback on improvement provided employees with reports and charts on their progress
on the inventory of behaviors. The analysis of persistent unsafe behaviors highlighted
management system issues. According to the authors there were five safety management

Effectiveness 25
indicators: accident frequency, frequency of observation, percentage of actions that rated
as “safe”, safety-related maintenance information, and involvement indicators and
surveys. “In a number of informal studies, frequency of observations per 100 employees
has been shown to be a consistent predictor of accident frequency rates”, stated the
authors. There was found to be an inverse relationship to these variables – when
observations increased, the frequency of accidents decreased.
Other safety professionals have supported the idea that leading behavioral
indicators were the preferred method of measuring and managing safety performance.
Loafmann supported the concept that upstream behavioral indicators could be used to
uncover root-cause barriers likely to cause injuries in the future (Loafmann, 1998).
Stricoff, president and principal consultant with BST, also supported the idea that
behavioral indicators were valid upstream measures. He stated, “Measuring exposures is
a highly valid prospective measure of injury exposure. At-risk behaviors are indicative of
exposures, thus measuring them can be used to develop a good upstream indicator”
(Stricoff, 2000).
Stricoff went on further to state that the BBS process allowed an organization to
track and report upstream parameters directly related to exposures. He stated, “Because
BBS generates data at the exposure stage – directly upstream from injuries – they can be
harnessed as a foundation for improved upstream measurement”. (Stricoff, 2000). If
properly employed, valid measured data (observations) correlated “percent safe
behaviors” to injury rates. To produce data predictive of this performance a site selected
behaviors indicative of exposures that produced injuries at the facilities, and developed

Effectiveness 26
risk-based, well-defined observation criteria, together with valid and consistent sampling
procedures.
Measurement of BBS Effectiveness Downstream measurement. There has been numerous case studies and research
conducted on how the BBS process has reduced accident incident rates. Beth Sulzer-
Azaroff and John Austin, both university behavioral psychologists, conducted a
comprehensive literature review of this topic. A review of literature of 83 databased
evaluations of behavioral safety programs identified 33 studies that reported data on
changes in incident rates. (See appendix D). Of the 33 studies reviewed, 32 reported
reductions in injuries. However, the format of reported changes varied widely. Some
studies reported incident rates, lost workdays, percent improvement from a baseline, or
numbers of accidents. There was not a consistent measure between studies. In addition,
some accident rates were reported on miles driven instead of hours worked, the standard
denominator to measure OSHA incident rates. Other factors that may have influenced
the results of this study were reporting validity and the ranges of baseline injury rates
reported. Sites that had initially high injury rates have a larger potential of improvement
than those sites with low rates (Sulzer-Azaroff & Austin, 2000). In a similar study
conducted earlier, a systematic review of 53 OSH studies since 1977 indicated that BBS
had the highest average injury rate reduction (59.6%) (Gaustello, 1993).
Incident rates. Much of the major research conducted on the effectiveness
of the BBS process to reduce accident/illness incident rates have been conducted by the
major consultants in the industry (BST and SPS).
Effectiveness 27
BST conducted an extensive study of five years of injury data from 73 companies,
drawn from a target population of 229 companies that had implemented a BBS process
(Krause, Seymour, & Sloat, 1998). Comparisons of pre–to-post incident rates across the
group indicated a significant decrease in incident rates following BBS implementation.
The average years since BBS observations began for the survey companies were 3.11
years. The average reduction from baseline amounted to 26% in the first year increasing
to 69% by the fifth year. Tests of internal and external validity were conducted as part of
the study. Limitations of the study were (a) voiced concern by the researchers that only
successful sites (i.e. those that showed incident rate improvement) submitted data, (b) the
researchers did not consider other alternative treatments to explain safety improvements
other than the BBS process, and (c) companies considered in the survey used the
consulting services of a BBS firm.
A review of individual case studies, primarily led by BBS consultants, has
resulted in similar reductions in the incident rates. Contrary to some union opposition to
the process, implementation of the BBS process in large unionized facilities has resulted
in reduction in incident rates after implementation. Implementation of a BBS process in
some ARCO oil refineries over a span of seven years reduced the OSHA TRIR from 8.0
in 1990 to 0.39 by the end of 1996 (Barton, Caldwell, & Hodson, 1997). A BST-led
process installed in a Weyerhaeuser pulp mill in 1995 showed a 57% step-change
improvement in the OSHA incident rater (TRIR). There were 265 union workers at this
site. Union and management worked closely together to implement the process. This
supported the evidence that management commitment was a key factor in program
success. The 47-month baseline TRIR was 8.12 (1992-1995). The TRIR was reduced to

Effectiveness 28
3.53 (1995-1999). The plant manager credited the BBS process as the major reason for
the safety performance improvement and that it had been a positive shift in the safety
culture of the plant work force (Hidley & Airhart, 1999). In another BST
implementation, the Tennessee Eastman maintenance organization, a 1000 person
unionized department, reduced their TRIR 88% from 20.5 in 1990 to 2.5 in 1998. This
was particular noteworthy for a large maintenance staff working in a highly hazardous
chemical plant where the potential for serious injury was present. As the process
matured, special focus was placed on cumulative trauma disorder (CTD) injuries. The
CTD-related TRIR rate decreased from a mid-1993 rate of 4.40 to a 1998 rate of 0.41
(Hodson & Hall, 1999).
The review of literature did not find extensive research of the BBS process
applied in the construction industry. However, one case study was reviewed involving a
major construction firm. The M.W. Kellogg Company, an international construction
firm, noted the following reductions in OSHA incident rates in an extensive construction
project over two years: TRIR of 1.27 by the end of the project, LWIR of 0.11 and LWSR
of 0.7. The observations per worker per month was tracked against the TRIR and
appeared to indicate that as observations increased, the incident rate slightly decreased
during the same time period (Hodson, Groover, & Ray, 1999).
Worker compensation costs. The literature review revealed limited
research has been conducted on the impact of the BBS process on worker compensation
costs. M.W. Kellogg Company reduced baseline worker compensation costs from $0.75-
$0.99 cents per hour worked to $0.18 per hour worked in a major construction project
over 2 years (Hodson, et. al, 1999). The result of a one-year BBS intervention study in

Effectiveness 29
an engine bearing manufacturing produced an estimated $200,000 savings in worker
compensation costs ( Pettinger, et. al, 2002). A significant reduction in costs occurred in
a pork slaughterhouse that implemented a form of a BBS program to reduce worker
compensation costs from 1.8 million to $400,000. However, since the injury rate at this
company was so high, almost any intervention would have worked to reduce costs and
injury rates according to a former corporate safety director. Before BBS the TRIR was a
staggering 119 (30 was the industry average) and that was lowered to 40. However, since
the results were still too high, the company decided that any further gains were not worth
the efforts expended through the BBS process (Karr, 2000).
Upstream measurement. The predominant research conducted on the upstream
measurement of the effectiveness of the BBS process has been conducted in the area of
perception surveys concerning the implementation and sustainment of the BBS process
and the relationship of observed safe behaviors and the resulting incident rates. BST has
developed a BST Culture Factors survey that measured statistically validated
organizational characteristics that underlie safety performance. The survey measured
organizational factors such as perceived management support and credibility, teamwork,
workgroup relations, organizational values of safety, safety communication, and
approaching others to discuss safety performance (Stricoff, 2001).
Research studies on perceptions. E. Scott Geller and Jason P. DePasquale
conducted research concerning perception surveys that were administered in twenty
different organizations to measure the interpersonal trust, management support, and
employee participation/involvement with BBS programs. The results indicated five
factors that influenced the success of a sustainable program – perceptions that BBS

Effectiveness 30
training was effective, trust in management abilities, accountability for BBS through
performance reviews, education in the BBS process, and tenure with the organization.
Organizations that made BBS involvement mandatory saw higher levels of involvement,
trust in management, trust in coworkers, and satisfaction with BBS training than
organizations that made it voluntary (DePasquale & Geller, 1999).
In other research studies, Geller, Roberts, and Gilmore (1996) applied a 154 item
Safety Culture Survey (SCS) that showed support of the Antecedent –Consequence
model to prove workers “actively cared” for the safety of their coworkers who had been
trained and implemented a BBS. Another study constructed and validated a 50-item
instrument entitled the Work Safety Scale (WSS) to assess five distinct areas necessary to
support a BBS process: (a) job safety, (b) coworker safety, (c) supervisor safety, (d)
management safety practices, and (e) satisfaction with the safety program. The purpose
of the instrument was to show correlation between worker’s perceptions of safety on the
job with variables related to industrial accident rates. The strongest correlation between
employee compliance with safe behaviors was found to be coworker safety and
supervisor safety (Hayes, Perander, Smecko, & Trask, 1998).
Two foreign studies used perception surveys to determine the acceptability of
behavior-based safety in their industrial cultures. An Australian study ( Harper, Cordery,
de Klerk, Sevastos, Geelhoed, Gunson, Robinson, Sutherland, Osborn, & Colquhoun,
1996) conducted a qualitative analysis of observed managerial behavior in relation to
program effectiveness in seven Australian companies. Effectiveness was measured in
terms of a statistical significance of changes in safe work practice rates and good
housekeeping rates between a base line period and the intervention period. Nine

Effectiveness 31
parameters of management behavior were found to be associated with BBS effectiveness:
active managerial involvement in safety, delegation of authority for safety to employees,
effective organizational communication, consistency of management safety practices,
managerial safety leadership, positive safety role models, equal priority for safety vs.
production, and cooperation of management with the research team. The study also
concluded that even in companies that were considered to have strong management
commitment to safety, the probability of BBS being effective in promoting safe behaviors
was found to be only 50% compared to other studies cited in the research. The study
reaffirmed that management commitment and support must be in place for the BBS
process to be effective and that BBS only appeared effective in companies with
recognizable managerial styles.
The second foreign study involved a Finnish study of the safety culture in the
wood processing industry in that country. A questionnaire measured the safety climate in
eight wood processing companies in Finland. The conclusions reached in the study
indicated that the more favorable the safety climate in the company, the lower the
accident rates. When comparisons were made, four companies with an accident rate
below the average for the wood-processing industry had a better safety climate than four
similar companies with accident rates above the average (Varonen & Mattila, 2000).
Research studies on safe behaviors. Many research studies have indicated
direct relationships between observed safe behaviors and accident incident rates.
Krause’s implementation of the BBS process in his client firms has indicated that as
observed percent safe performance increased, recordable rates decreased. Likewise his

Effectiveness 32
research has suggested that as contact rate (the average number of times per month that a
full-time employee is observed) increased, recordable rates decreased (Krause, 1998).
Since Komaki et al’s (1978) research on the correlation of safe work behaviors to
incident rates was conducted, many other research studies have attempted to validate this
relationship. The behavior safety performance index (BSI), a ratio of the number of
observations safe divided by the number of safe and unsafe , (Komaki, et al., 1978) was
used to measure the degree of safety in the organization. Research conducted since that
time has appeared to validate an inverse relationship between the BSI index and the
incident rate. That is, as the BSI index increased, the incident rate decreased.
Research conducted by Ray and Frey (1999) substantiated this relationship.
During a six-month study the BSI index was calculated against the OSHA recordable
(TRIR) rate and lost time injury rates (LWIR). Visual inspection of graphical data (BSI
index and incident rates) appeared to indicate this inverse relationship. The findings
supported the hypothesis that the frequency of safe behavior was inversely related to the
frequency of injuries in the workplace. A statistical test of correlation between these
variables was applied to determine whether this inverse relationship was significant. The
following results were shown:
The correlation (rho) between recordable incident rates and mean safety indexes
for each group was found to be – 0.77, which indicates a moderate-to-strong
inverse relationship between the two samples. The correlation between lost-time
injury rates and the mean safety indexes was found to be - 0.63, which indicates
a moderately strong inverse relationship between the two samples. As these
results show, the statistical test provided evidence that a statistically significant

Effectiveness 33
inverse relationship exists between the BSI and injury rate, and, thus supports the
findings depicted in the visual graphic analysis.
Review of Effectiveness at XYZ Company
BST evaluation. BST furnished a management report to the director of corporate
safety for XYZ Company on the status of the locations that had implemented their
BAPP (Behavioral Accident Prevention Process) in May 1998 (BST, 1998). BST
identified five “Success Factors” that were needed to assure successful implementation at
the eight sites identified in the report. These factors were (a) management support, (b)
frequency and quality of observations, (c) sharing data and problem solving, (d)
communication, and (e) accountability. BST concluded the following at the close of the
report:
Evaluating the above XYZ Company implementations of the BAPP technology
in relation to BST overall client base, it is our judgment that the factor
differentiating the most successful from the least successful processes is
leadership on the part of site management. For those processes that are not doing
as well as one would expect, systematic attention to leadership practices are
indicated.
An evaluation of the status, results, and opportunities for improvement for each facility as
reported by BST was included in Table 1.
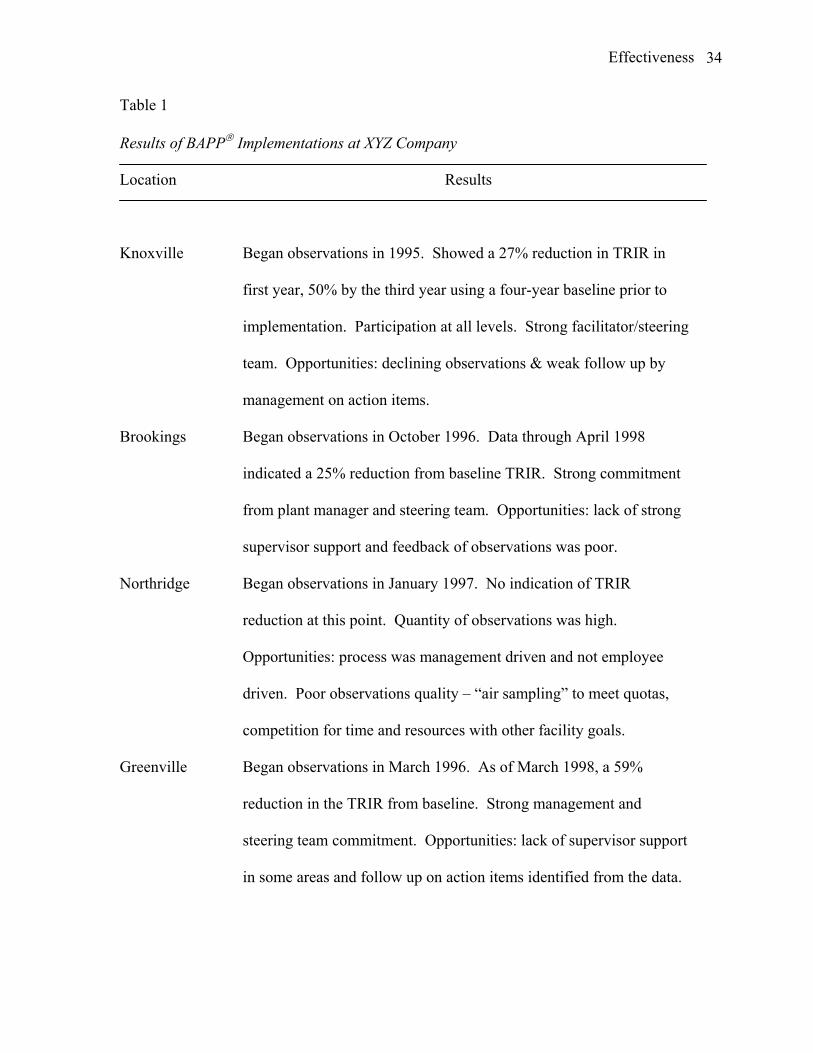
Effectiveness 34
Table 1
Results of BAPP Implementations at XYZ Company Location
Results
Knoxville Began observations in 1995. Showed a 27% reduction in TRIR in
first year, 50% by the third year using a four-year baseline prior to
implementation. Participation at all levels. Strong facilitator/steering
team. Opportunities: declining observations & weak follow up by
management on action items.
Brookings Began observations in October 1996. Data through April 1998
indicated a 25% reduction from baseline TRIR. Strong commitment
from plant manager and steering team. Opportunities: lack of strong
supervisor support and feedback of observations was poor.
Northridge Began observations in January 1997. No indication of TRIR
reduction at this point. Quantity of observations was high.
Opportunities: process was management driven and not employee
driven. Poor observations quality – “air sampling” to meet quotas,
competition for time and resources with other facility goals.
Greenville Began observations in March 1996. As of March 1998, a 59%
reduction in the TRIR from baseline. Strong management and
steering team commitment. Opportunities: lack of supervisor support
in some areas and follow up on action items identified from the data.

Effectiveness 35
Decatur film /
chemical plants
Began observations in the fall of 1995. TRIR in the film plant has
decreased 32% from baseline period. TRIR in the chemical plant
showed a 60% increase from the baseline period. Strong management
sponsorship in film plant. Data is used effectively to remove barriers.
Has become engrained into the organizational culture. Opportunities:
more management commitment from plant manager in the chemical
plant. More frequent and quality observations were needed.
Cordova Began observations in 1996. Supervisors performed observations.
Strong facilitator and management sponsor. Average observations
were 160/month. Opportunities: top down approach has created
problems with employees and steering team in accepting process.
Petaluma Implemented directly by BST facilitator. Small operation (50
employees) has resulted in limited resources for planning, training,
and follow up.
XYZ Company BBS research study. An internal study by a XYZ Company safety
engineer was conducted in 1999 to determine the effect that percent safe observations had
on the TRIR for eight locations that had implemented the BBS process (Bond, 1999).
Descriptive and analytical statistical methods were used to determine valid correlations
between the percent safe behaviors observed and the OSHA recordable (TRIR) incident
rate. The hypothesis was that as safe behaviors increased, there would be a resultant
decline in the TRIR rate. An analysis of variance (ANOVA) was used to test the
correlation between the observed percent safe behaviors and the OSHA incident rates.

Effectiveness 36
Correlations were low between all locations tested. Bond (1999) concluded, “there is no
evidence of any downward trend in incident rates once a behavior-based safety process is
implemented” (p. 171). Individual /moving range (I/MR) statistical process control
charts were also applied in this study to track individual facility incident rates over time.
Four locations showed a downward trend in incident rates, however this downward trend
was occurring before the implementation of the BBS process. Three locations showed no
trend in incident rate change before or after BBS implementation. Recommendations
from this research included (a) more research on incident rates at other locations to
support or reject the study findings, (b) a corporate database to track and assess the
process corporate wide, and (c) networking between locations to further promote and
validate the process.
Conclusion
The literature review has examined the origins of safety management, behavior-
based safety concepts, safety performance measurements, and research conducted to
measure the effectiveness of behavior-based processes in organizations. The review
indicated that both upstream and downstream metrics should be used to evaluate the
effectiveness of the BBS process. Downstream indicators, such as accident incident rates
and worker compensation costs, should be used for long-range verification of the process
and for benchmarking between facilities and industries. Upstream or proactive
indicators, such as safety perception surveys and percent safe behaviors should be used to
manage the process, remove barriers that could cause loss, and serve as verification that
the process is working. Previous studies conducted within XYZ Company differed in

Effectiveness 37
their interpretation of the effectiveness and measurement of the process. Thus, it is the
conclusion of this review that this remains the main purpose of this study.

Effectiveness 38
Chapter 3
Methods and Procedures
Introduction
The methods and procedures used in this study are explained in this
chapter under the headings of (1) method of study, (2) population and sample, (3)
instrumentation, and (4) method of analysis.
This research considered determining reliable methods of measuring the
effectiveness of BBS in improving safety performance. Effectiveness could be measured
in terms of statistically valid “down stream” indicators such as the reduction in the
frequency and severity of illness and injuries (OSHA incident rates) and worker
compensation incurred costs. “Upstream measurements” that could be measured
included percent safe behaviors observed, improvements in employee perceptions of
safety, number of corrective actions (barriers) identified and resolved, number of
workplace environmental hazards eliminated, and safety work orders or suggestions
submitted.
The review of literature has indicated measurement of statistically valid
downstream indicators such as changes in incident rates can be a valid measurement of
BBS effectiveness (Barton, et al., 1997; Hodson & Hall, 1999; Krause, et al., 1998).
Perception surveys and the correlation of observed safe behaviors to changes in incident
rates have also been shown to be valid upstream indicators of BBS performance
(DePasquale & Geller, 1999; Geller, et al., 1996; Hayes, et al., 1998; Komaki, et al.,
1978; Ray & Frey, 1999).

Effectiveness 39
Method of study
Therefore, these methods were chosen for the design of this study:
1. Statistical analysis of OSHA incident frequency rates (OSHA IR), severity rates
(OSHA SR), and worker compensation incurred costs in BBS facilities of XYZ
Company before and after intervention with the BBS process.
2. Statistical comparison between BBS and non-BBS facilities for the periods of
2000 and 2001 in terms of OSHA incident rates.
3. Correlation between % safe behaviors observed and OSHA incident rates (OSHA
IR) in BBS facilities of XYZ Company.
4. Correlation of safety perceptions between work groups in the same facility of the
XYZ Company. One work group implemented the BBS process two years ago,
while the remainder of the plant had not been exposed to the process.
Incident rates. It has been suggested that many occupational injuries go
unreported (Weddle, 1996). Therefore using safety metrics that are difficult to mask or
hide, such as lost-time or restricted work injuries, provided a more accurate depiction of
the impact of a safety process improvement than a record of minor or OSHA recordables.
Therefore, the OSHA severity rate (OSHA SR), which indicated the severity (# of days of
lost or restricted work/100 workers) and the OSHA frequency rate (OSHA IR), which
indicated how often restricted or lost workday cases occurred, was the basis for
measurement of the effectiveness of the BBS process in the XYZ Company.
As the literature review has indicated, one method that determined the
effectiveness of behavior-based safety was the examination of the effect the process had
on OSHA incident rates. A statistical analysis was performed on each XYZ Company

Effectiveness 40
facility that had implemented the process. OSHA severity (OSHA SR) and OSHA
frequency rates (OSHA IR) were examined for linear trends and statistical differences
before and after the application of the BBS process. The same process was used to
examine worker compensation incurred costs in the same facilities.
A comparison of BBS and non-BBS facilities was made using the same indices
during the two most recent reporting years. Statistical tests were performed between
these groups to examine any differences in the measured criteria.
An examination of percent safe behaviors compared to incident rate was
conducted similar to the studies conducted by Ray and Frey (Ray & Frey, 1999) and
Bond (Bond, 1999) to confirm or disprove the hypotheses that as percent safe behaviors
observed increases the incident rate decreases.
Perception survey. A survey instrument that measured safety perceptions of the
BBS process was given voluntarily to the entire production employee population in one
of the Wisconsin facilities of the XYZ Company. Since a portion of the facilities
employees had been operating with the BBS process for two years, an analysis was
performed on the responses from this group to determine if any statistical differences
existed in this group compared to the plant general population.
Population and sample
For the purpose of this study three distinct populations were identified for
analysis. The 15 locations of the XYZ Company that had installed behavior-based safety
programs beginning in 1995 were examined for changes in incident rate and worker
compensation costs. The relationship of percent safe behaviors observed and incident
rate was also examined. Four locations were excluded from this analysis due to the short

Effectiveness 41
time duration that the facility had operated with the BBS process. These locations
included: Columbia, Guin, the Wisconsin location, and Hutchinson. All locations
selected represented medium to large manufacturing facilities within the XYZ Company.
A variety of plants were selected intentionally in order to represent a full spectrum of
different business groups, manufacturing and employee diversity, geographic locations,
and cultures. Plant locations varied from the east coast, west coast, and southern
locations, with a majority of the plants located in the central United States. Refer to
Appendix A for these locations.
The non-BBS plants were selected similarly in terms of geographic location,
similar manufacturing technologies, and employee and cultural diversity. Facilities that
matched well included: Nevada and Cynthiana; Irvine, Monrovia and Northridge;
Springfield and Cordova; Columbia and New Ulm; and Valley, Aberdeen, and
Brookings. Additional non-BBS plant locations selected included: Alexandria, Ames,
Bristol, Brownwood, Menomonie, Monrovia, Stillwater, and Wausau. These plants were
selected for similar geographic, technological, and cultural similarities to the BBS
locations. All plants within XYZ Company were subject to adherence to the
corporation’s Global, Safety, and Health Plan (GSHP) which defined the major
requirements of the safety management system in the company (refer to Appendix B).
Therefore, the risks inherent with the workplace environment (physical and chemical
hazards) in each plant were assumed to be managed similarly.
The third population of this study was the production employees at one of the
Wisconsin locations of the XYZ Company. Since this group was most involved with the
implementation of a site-wide BBS process, this group was surveyed with the safety

Effectiveness 42
perception survey. There were 437 employees at this location at the end of 2001. Of this
population, 338 were considered to be in manufacturing and administrative positions that
would be involved with the process. The manufacturing group, Optical Systems
Division, that implemented the BBS process two years ago, comprised a subset of 70
employees of the identified manufacturing and administrative employees. The remaining
employees were in supervisory or management positions that would be supporting the
BBS process.
Instrumentation and materials
Perception survey. A 32-question safety perception survey was administered to
the general manufacturing population of the Wisconsin facility (refer to Appendix C). Its
content was based from the Safety Culture Survey available from Safety Performance
Solutions (SPS, 2002). The intent of the survey was to gain a baseline measurement of
employee perceptions about their safety attitudes prior to the implementation of a
behavior-based safety (BBS) process.
The second purpose related to the application of this survey, and a major goal of
this study, was a measurement of the perceptions of a specific work group at the facility
that implemented the BBS process two years ago. This group’s results would be
compared to the general plant population. It was assumed that the effectiveness of the
process would be shown with statistical differences in the responses compared to the
remaining plant population.
The 32-question survey related to perceptions concerning these areas: accident
reporting, peer feedback, safety rules and regulations, employee safety involvement and
inititative, job “short cuts”, supervisory and mangement support for safety, peer

Effectiveness 43
relationships and trust, and safety environment. Responses were analyzed to determine
barriers that were present in the system that would impede the process.
A Lickert scale was used to quantify the survey questions from each participant.
The scale was designed as follows: (1) highly disagree, (2) disagree, (3) agree, and (4)
highly agree. Each question in the survey had a desired positive or negative response.
This data was structured to statistically measure these responses. The BBS
implementation team at the facility decided not to include a scale factor for “no opinion”
since they wanted the participants to have a definite opinion on each question.
Incident rates and worker compensation costs. Various sources were utilized to
analyze the data concerning incident rates, worker compensation costs, and percent safe
behaviors. Injury and illness data and worker compensation costs were analyzed for the
period 1991 through 2001. Information for the years 1996 through 2001 was obtained
through the corporate safety web site (XYZ Company, 2002a). Reports from 1991
through 1995 were obtained in hard copy from the corporate safety staff contact that
compiled these reports. Worker compensation incurred costs were obtained from the
corporate safety department.
Spreadsheets were developed for each BBS and non-BBS location for the years
1991 through 2001. Data included on the spreadsheet included the OSHA I/I data and
worker compensation incurred costs. Refer to Table 2 for an example of these
spreadsheets.

Effectiveness 44
Table 2
Brookings, S.D. I/I rates and incurred costs
Year TRIR LWIR OSHA IR LWSR OSHA SRIncurred costs
($1000)
1991 13.29 3.12 5.43 4.48 169.68 116.2
1992 11.55 3.23 4.97 19 214.75 145.4
1993 11.32 2.64 3.77 38.36 119.62 153.7
1994 7.95 1.3 3.78 20.85 89.77 167.2
1995 7.36 0.4 2.54 7.49 43.89 151.3
1996 6.3 0.84 2.1 7.28 38.52 47.3
1997 6.55 0.66 2.23 3.93 31.86 77.4
1998 3.76 0.39 0.91 15.04 44.85 56.8
1999 4.15 0.54 1.07 2.54 29.57 178
2000 4.16 0.38 1.26 1.51 9.07 39.6
2001 6.62 0.36 2.41 4.45 50.28 270
Statistical analysis of each BBS location will be discussed in the Method of
analysis section.
% Safe behaviors vs. incident rates. Information about observed percent safe
behaviors was collected from the BBS facilitators at the individual plant locations.
Requests were made to each BBS facility to provide the total percent safe behavior
observations from the years 2000 and 2001. Analysis of the data is discussed in the
Method of Analysis section.

Effectiveness 45
Perception survey. The 32 question survey instrument was given to 338
production and administrative employees at the Wisconsin facility beginning in February,
2002. Subjects had the survey distributed by their supervisor asking them to voluntarily
complete the survey. Completed surveys were returned anonymously to their supervisor
or to the plant BBS coordinator. Employees had sufficient time to complete the survey
during their work time. No deadlines or completion dates were attached to the survey.
The employee participation in the survey was strictly voluntary and the only identifier
associated with the survey was the employee’s assigned department. By the end of
March, 2002, 218 surveys were returned for a completion rate of 64%. The Optical
Systems Division returned 37 of 70 surveys for a participation rate of 53%.
Method of analysis
Incident rates and worker compensation costs. Since behavior-based safety is a
process, statistical process control techniques can be applied to evaluate its effect on the
system. Process charts show historical patterns of variation to provide a better
understanding of where the process is headed. Process charting provided information to
show short term or “common cause” variation of the process and identified whether
unusual or “special cause” variation had occurred. Common causes were variations that
belong to the system and constitute, according to Deming, about 94 percent of the
variation of the process. Special causes, or variation from causes outside the system,
made up 6% of the variation in a system (Dennis, 1997). If special cause variation was
shown this indicated that a change had occurred in the process. Therefore, in this study,
these charts were examined before and after the implementation of a behavior-based
safety system on selected incident rates for the BBS locations of the XYZ Company.

Effectiveness 46
The statistical software packages used for data analysis included BPChart,
Version 4.0 (BPChart, 2001) and Minitab, Version 13.3. BPChart was customized
statistical software designed within the XYZ Company for business and process charting.
It used Microsoft Excel software with macros developed to easily build and apply
statistical process control (SPC) techniques. Minitab was used for statistical analysis of
variance and correlation.
To analyze any statistical differences in the OSHA IR, OSHA SR, and worker
compensation incurred costs in the BBS locations before and after implementation,
control charts were constructed for each facility. A Run chart was first constructed to
view the overall process so that trends or patterns could be easily identified on the graph.
Next an “I Chart” was plotted for each facility. An “I Chart” or Individual chart was a
time series plot with a calculated mean centerline and process limits. Special cause
indicators based on sound control chart theory (Wheeler, 1993) were built into the graph.
The I chart indicated that the process average was stable. Next a MR chart, or moving
range chart was constructed. A MR chart, a chart that plotted the moving range,
indicated the process variation.
BPChart was also capable of linear trending of the process. This was applied to
the three indices (OSHA IR, OSHA SR, and incurred costs) after the BBS
implementation in each facility. The confidence level or “P-value” associated with the
linear fit should be within the range of 0.0 to 0.05 range to be accepted as strong
statistical validity.
BPChart also has the capability of evaluating step changes in the process. The
step change model was the best trending model to be used in this study since it was

Effectiveness 47
known when the BBS process was implemented in each facility. The year that the
process began was excluded from the analysis to allow the process to stabilize. A step
change chart was generated and the difference (if any) was analyzed with a one-way
analysis of variance (ANOVA) in Minitab.
Comparison of BBS and non-BBS facilities. A statistical comparison of BBS and
non-BBS facilities in terms of the accident incident rates defined in this study was
conducted. A one-way ANOVA test of the OSHA incident rates was conducted for the
period of 2000 and 2001 from the available data.
% Safe behaviors vs. incident rates. Data was analyzed similar to the study
conducted by Ray and Frey (Ray & Frey, 1999). Results were analyzed in two ways (1)
visual inspection of graphical data plotted for percent safe behaviors and incident rate
(OSHA IR) and (2) statistical testing using a rank difference correlation (Spearman rho)
between facility incident rates and the corresponding facility percent safe behaviors.
Perception survey. The data from the survey was compiled into an Microsoft
Excel spreadsheet. Participant response to each question was tabulated into the
spreadsheet by department location. The participants from the Optical Systems Division
were separated from the remainder of the plant surveys since it was a goal of the survey
to prove that there could be a statistical difference in their responses.
A one-way analysis of variance (ANOVA) using Minitab was conducted for each
question that compared the plant response to the response from the Optical Systems
division. This test indicated any statistical difference to the response to the question. For
example, the ANOVA of question six (Q6) is shown in Figure 1.

Effectiveness 48
Source DF SS MS F P Process 1 3.749 3.749 8.26 0.004 Error 211 95.800 0.454 Total 212 99.549 Individual 95% CIs For Mean Based on Pooled StDev Level N Mean StDev --+---------+---------+---------+---- Optical 33 2.0000 0.5000 (-----------*-----------) Plant 180 2.3667 0.7004 (----*----) --+---------+---------+---------+---- Pooled StDev = 0.6738 1.80 2.00 2.20 2.40
Figure 1. Analysis of Variance for Question number 6
This type of analysis would indicate a statistical difference between the means of
the two samples in the population (p= 0.004). Results were compiled for each question
and discussed in Chapter 4, Results and Discussion.
Results of the survey were also submitted to the statistical and research consultant
at the University of Wisconsin – Stout Computer Education and User Services for
additional analysis. Independent group t-tests using Levene’s test for equality of
variances were used in this analysis. Independent group t-tests were performed on the
32-question survey using the Optical Systems Department and the remaining plant
population for comparison. The eight specific perception areas specified in the survey
were also analyzed using this test. Results of this analysis are discussed in Chapter 4.
Summary
This chapter identified methods and procedures to be used in the study to identify
ways to measure BBS effectiveness. SPC techniques along with descriptive statistics
were implemented to evaluate downstream metrics of measurement. Techniques to
analyze results from perception surveys related to BBS concepts were also explained.

Effectiveness 49
Finally, percent safe behaviors observed, an upstream metric, were correlated with injury
rates to validate a method of measurement.

Effectiveness 50
Chapter 4
Results and Discussion
The purpose of this study was to determine methods to measure the effectiveness
of behavior-based safety in the XYZ Company. The objectives of this study were to (1)
identify statistically valid methods to measure the BBS process, and (2) determine if the
BBS process improved safety performance in the XYZ Company facilities that
implemented the process. The literature review showed both upstream and downstream
measures could be used to determine BBS effectiveness. The methods used in this study
included (1) statistical analysis of accident and injury rates and worker compensation
costs for both BBS and non-BBS plants using SPC, trending, and analysis of variance, (2)
an examination of the relationship between percent safe observations and OSHA IR, and
(3) measurement of differences in safety perceptions between employees that had been
exposed to the BBS process and those who had no exposure to the process.
Results and Discussion Objective 1: Determine statistically reliable methods to measure BBS
effectiveness.
Results. Using the methodology established in Chapter 3, Methods and
Procedures, each BBS location within the XYZ Company was examined for the effects
that the BBS process had on downstream measures such as incident rates and incurred
costs. Upstream evaluation included an analysis of how percent safe behaviors
influenced incident rates. Linear regression and correlation analysis was used for this
analysis. Statistical analysis of group responses to a safety perception survey, an
upstream measure, was also conducted to determine the effectiveness of the process.

Effectiveness 51
OSHA incident rate (OSHA IR), OSHA severity rate (OSHA SR), and worker
compensation incurred costs were analyzed using SPC charting, trending, and analysis of
variance for each BBS facility. For the purpose of this discussion, the results of the
analysis of the OSHA IR for the Cynthiana location are shown in this section. For the
complete analysis of the remaining indices (OSHA SR and incurred costs) for this
location refer to Appendix E.
Discussion. Incident rates and incurred costs were examined before and
after the introduction of the BBS process at each XYZ Company BBS location. The
locations at Hutchinson, Columbia, and Guin were not included in this analysis. Guin
tried the process through BST for two years, but decided not to continue the program.
Hutchinson and Columbia just began formal site observations in the fourth quarter, 2001
and therefore were not be included in the analysis.
Run charts, I charts, and MR charts for the OSHA IR were constructed using
BPChart. These charts are shown in Figure 2, Figure 3, and Figure 4 respectively.
Special cause indications were discussed with each chart when applicable.
OSHA IR
-2
-1
0
1
2
3
4
5
6
1991
1992
1993
1994
1995
1996
1997
1998
1999
2000
2001
Year
Indi
vidu
al V
alue
1 1 2 3 3 3 4 4 4 4 4
Figure 2. Run Chart: Cynthiana OSHA IR (1991-2001)

Effectiveness 52
Figure 3, the I Chart, indicated a special cause flag when two out of three incident
rates were beyond two standard deviations (sigma) of the incident rate average in 1992
through 1994 (special cause flag E). Another special cause flag revealed four out of five
incident rates were beyond one sigma from 1991 through 1995 (special cause flag F).
Beginning in 1993 there was a seven-year downward trend in the incident rate beginning
in 1993 and ending in 1999 (special cause flag C). In 1999 the incident rate dropped
below the incident rate mean lower control limit (obviously the lower control limit for
accidents should be theoretically zero) to 0.074.
OSHA IR
0
1
2
3
4
5
1991
1992
1993
1994
1995
1996
1997
1998
1999
2000
2001
Year
Indi
vidu
al V
alue
EF C AC F
Special Cause Flag
Special Cause Detected Chart Type: Chart for Individuals Database
Column Centerline: 2.740 Process Limits: Lower: 0.9235 Upper: 4.556 3 Avg of Data Shown 2.74 A.1 Beyond Control Limit E. 2 of 3 Beyond 2 Sigma Median Data Shown 2.46 B.9 On One Side of Average F. 4 of 5 Beyond 1 Sigma Sigma for Limits 0.6055 C.6 Trending Up or Down G. 15 Within 1 Sigma Base for Limits Average MR D.14 Alternating Up & Down H. 8 Outside 1 Sigma X. Excluded or Missing Data
Figure 3. Individual Chart: Cynthiana OSHA IR (1991-2001)

Effectiveness 53
OSHA IR
0
0.5
1
1.5
2
2.5
1991
1992
1993
1994
1995
1996
1997
1998
1999
2000
2001
Year
Mov
ing R
ange
Average MR = 0.6830
UCL = 2.232
Figure 4. Moving Range Chart: Cynthiana OSHA IR (1991-2001)
Trend charts were produced to visually examine the evidence of trends in the
process. Linear trending charts were constructed for the three indices from 1991 through
2001. In Figure 5, the Cynthiana location indicated a downward trend in the OSHA IR
(p= 0.003). However, from 1996, the year the BBS process was implemented, through
2001, there was no statistical evidence to support a downward trend in the incident rate (p
= 0.576). This is indicated by Figure 6.
OSHA IR
-1
0
1
2
3
4
5
6
1991
1992
1993
1994
1995
1996
1997
1998
1999
2000
2001
Year
Indi
vidu
al V
alue
Special Cause Flag
Current probability of no trend = p = 0.003
Figure 5. Linear trend chart: Cynthiana OSHA IR (1991-2001)

Effectiveness 54
OSHA IR
-1
0
1
2
3
4
5
1991
1992
1993
1994
1995
1996
1997
1998
1999
2000
2001
Year
Indi
vidu
al V
alue
X X X X X
Special Cause Flag
Current probability of no trend = p = 0.576
Figure 6. Linear trend chart: Cynthiana OSHA IR (1997-2001)
Step change modeling was applied to this example to indicate changes in the
incident rate means before and after the BBS process was installed. In Cynthiana, the
BBS process was implemented in 1996. This year was excluded from the modeling to
allow the BBS process to stabilize in the facility. The result of the step change modeling
is shown in Figure 7. The p value was equal to 0.005, which indicated the change in the
OSHA IR mean was statistically significant.
Current probability of no trend = p = 0.005
OSHA IR
-1
0
1
2
3
4
5
6
1991
1992
1993
1994
1995
1996
1997
1998
1999
2000
2001
Year
Indi
vidu
al V
alue
X
Special Cause Flag
Figure 7. Step Change Chart: Cynthiana OSHA IR after BBS implementation

Effectiveness 55
To further test the significance in the change of the OSHA IR in Cynthiana, a one
–way ANOVA test was performed using Minitab. The results are indicated in Figure 8
below.
Analysis of Variance for OSHA IR Source DF SS MS F P Status 1 10.609 10.609 32.38 0.000 Error 8 2.621 0.328 Total 9 13.230 Individual 95% CIs For Mean Based on Pooled StDev Level N Mean StDev ---------+---------+---------+------- After BB 5 1.7380 0.5948 (-----*-----) Before B 5 3.7980 0.5490 (-----*-----) ---------+---------+---------+------- Pooled StDev = 0.5724 2.0 3.0 4.0
Figure 8. ANOVA for OSHA IR at Cynthiana from Minitab
The results showed a clear statistical difference in the OSHA IR means for the
Cynthiana location after the implementation of the BBS process in 1996. Similar
analyses were performed with the OSHA severity rate and worker compensation incurred
costs. The results of this analysis are shown in Appendix E.
The application of statistical process control charting, linear trending, step change
trending, and analysis of variance for the incident rates and incurred costs were done for
the remaining BBS locations. This fulfilled the first objective of this study.
Objective 2: Did BBS work in the BBS locations of the XYZ Company? By
applying the statistical analysis methods discussed in the first objective of the study, a
determination could be made on how effective the BBS process was in decreasing
incident rates and incurred costs at the BBS locations of the XYZ Company.

Effectiveness 56
Results. Table 3 shows the results of the statistical analysis performed in
BPChart for the OSHA IR, OSHA SR, and worker compensation incurred costs using the
step-change modeling in the program. The results of the one-way analysis of variance
using the Minitab statistical program for the same indices are shown in Table 4. A
summary of the linear trending before and after the implementation of BBS at each
location is shown in Table 5. A comparison of incident rates between BBS locations and
selected non-BBS locations for the years 2000 and 2001 are shown in Table 6. The
correlation between the OSHA IR rate and percent safe observations is shown in Figure
9. The results of the perception survey are shown in Table 7.

Effectiveness 57
Table 3
Summary of Step Change Analysis of BBS Locations of XYZ Company
Location OSHA IR p value
OSHA SR p value
WC Incurred Costs p value
Austin 0.08* 0.008** 0.634
Brookings 0.001** 0.002** 0.808
Cordova 0.346 0.472 0.376
Cynthiana 0.005** 0.011** 0.024**
Decatur - Chemical 0.53 0.315 0.064*
Decatur - Film 0.873 0.537 0.451
Greenville - Film 0.181 0.212 0.814
Greenville - Tape 0.148 0.281 0.454
Knoxville 0.922 0.189 0.966
New Ulm 0.164 0.389 0.857
Northridge 0.688 0.122 0.122
Note. *p <0.10 **p < 0.05

Effectiveness 58
Table 4
Summary of One-way ANOVA of BBS Locations in XYZ Company
Location OSHA IR p value
OSHA SR p value
WC Incurred Costs p value
Austin 0.054* 0.031** 0.936
Brookings 0.003** 0.015** 0.74
Cordova 0.185 0.579 0.25
Cynthiana 0** 0.003** 0.041**
Decatur - Chemical 0.288 0.114 0.059*
Decatur - Film 0.75 0.429 0.959
Greenville - Film 0.041* 0.297 0.529
Greenville - Tape 0.421 0.1* 0.345
Knoxville 0.476 0.088* 0.866
New Ulm 0.214 0.418 0.63
Northridge 0.989 0.114 0.187
Note. *p <0.10 **p < 0.05
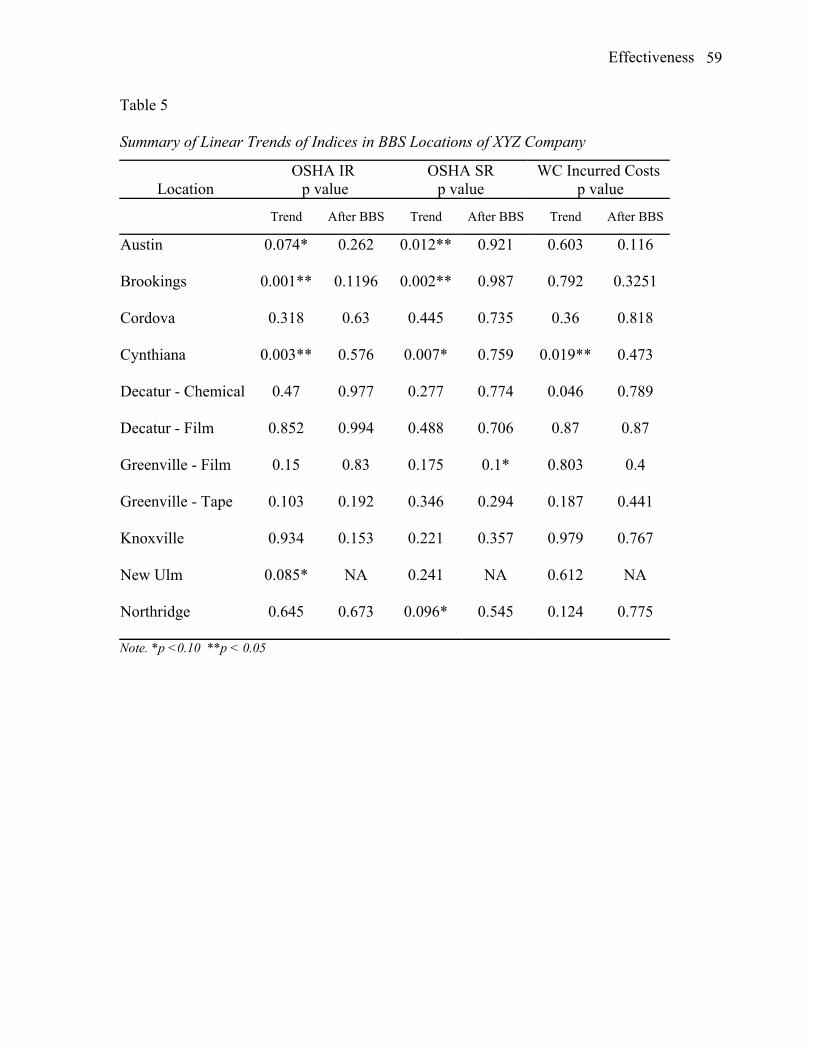
Effectiveness 59
Table 5
Summary of Linear Trends of Indices in BBS Locations of XYZ Company
Location OSHA IR p value
OSHA SR p value
WC Incurred Costs p value
Trend After BBS Trend After BBS Trend After BBS
Austin 0.074* 0.262 0.012** 0.921 0.603 0.116
Brookings 0.001** 0.1196 0.002** 0.987 0.792 0.3251
Cordova 0.318 0.63 0.445 0.735 0.36 0.818
Cynthiana 0.003** 0.576 0.007* 0.759 0.019** 0.473
Decatur - Chemical 0.47 0.977 0.277 0.774 0.046 0.789
Decatur - Film 0.852 0.994 0.488 0.706 0.87 0.87
Greenville - Film 0.15 0.83 0.175 0.1* 0.803 0.4
Greenville - Tape 0.103 0.192 0.346 0.294 0.187 0.441
Knoxville 0.934 0.153 0.221 0.357 0.979 0.767
New Ulm 0.085* NA 0.241 NA 0.612 NA
Northridge 0.645 0.673 0.096* 0.545 0.124 0.775
Note. *p <0.10 **p < 0.05

Effectiveness 60
Table 6
Analysis of Variance of Incident Rates for BBS and Non-BBS Locations
Year TRIR p value
LWIR p value
OSHA IR p value
LWSR p value
OSHA SR p value
2001 0.912 0.091* 0.260 0.043** 0.312
2000 0.764 0.204 0.777 0.584 0.969
Note. *p <0.10 **p < 0.05
95.5 96.5 97.5 98.5
0
1
2
3
4
%safe
OSH
A IR
OSHA IR = 99.1154 - 1.00150 %safe
S = 0.649254 R-Sq = 75.8 % R-Sq(adj) = 71.8 %
Regression Plot
Figure 9. OSHA IR vs. % Safe Observations

Effectiveness 61
Table 7
T-test for Equality of Means between Plant and Optical Systems Employees for Eight
Safety Perceptions Measured
Perception F Sig. t df Sig. (2-
tailed)
Peer feedback 3.895 .50 5.472 69.814 0.001**
Rules 3.215 0.074 2.167 212 0.031**
Initiative 2.517 .114 1.697 212 0.091*
Shortcuts 0.16 .898 1.281 206 .202
Management 5.688 .018 3.792 74.855 0.001**
Peer trust .379 .539 2.219 208 0.028**
Safety environment .238 .626 1.854 209 .065*
Caring for others .532 .466 2.301 213 .0.022**
Note. *p <0.10 **p < 0.05
Discussion.
Changes in incident rates. In Table 3 three of the 11 locations had
changes in the OSHA IR rate that were statistically significant. Two of the three of these
locations had statistically significant changes at the 95% confidence level (p < 0.05),
while the remaining location had a statistically significant change at the 90% confidence
level (p < 0.10). The same three locations, Austin, Brookings, and Cynthiana had
statistically significant changes in the OHSA SR (p < .05). Two locations had a
statistically significant change in their worker compensation incurred costs.

Effectiveness 62
The results of the one-way analysis of variance using Minitab for OSHA IR,
OSHA SR, and worker compensation incurred costs were shown in Table 4. Using this
method, four of 11 locations had statistically significant changes in their OSHA IR rate.
Two of the four facilities had changes significant at the 95% confidence level (p < .05),
while two facilities had changes at the 90% confidence level (p < 0.10). Five of the
eleven facilities had statistically significant changes in their OSHA SR – three facilities at
the 95% confidence level and two facilities at the 90% confidence level. Two of the 11
facilities had statistically significant changes in their worker compensation incurred costs.
This calculation method increased the number of facilities that had statistically significant
changes in indices. This was caused by the way the software calculated the population
means. By using the ANOVA method, one additional facility achieved a statistical
difference in the OSHA IR and OSHA SR. The facilities that showed a significant
change in incurred costs remained the same using either method.
Linear trends in indices. Table 5 showed the results of linear trending
before and after the intervention of BBS at each facility. Four of 11 facilities showed a
downward linear trend in OSHA IR rate for the 10-year period that was statistically
significant. Two facilities were significant at the 95% confidence level and two at the
90% level. However, no facilities showed a statistically significant trend after the
implementation of the BBS process. Four facilities also showed a significant change in
the OSHA SR rate for the period. One facility showed a statistically significant change in
the OSHA SR after implementation (Greenville-Film). Only one facility, Cynthiana,
showed a statistically significant linear trend in the reduction of worker compensation

Effectiveness 63
incurred costs from 1991 through 2001. However, no trend was indicated in any facility
after BBS implementation.
Comparison of BBS and non-BBS facilities. In Table 6, a one-way
ANOVA was conducted in Minitab comparing statistical differences in all of the I/I rates
(TRIR, LWIR, OSHA, IR, LWSR, and OSHA SR) between the plant locations that have
employed the BBS process and selected non-BBS locations in the XYZ Company.
Comparisons were made for the years 2000 and 2001.
Two indices, lost work incident rate and lost work severity rate, were statistically
significant for the year 2001 in the BBS locations as compared to the non-BBS locations
at the 90 % and 95% confidence levels respectively. The mean LWIR was 0.87 for the
BBS locations compared to 1.70 for the non-BBS locations. The mean LWSR for BBS
locations was 11.17 compared to 26.91 for non-BBS locations. There were no
statistically significant differences between any of the OSHA I/I rates for the year 2000.
Correlation of percent safe to incident rate. In Figure 9 the OSHA IR
rates for the individual BBS plants were visually graphed against their corresponding
percent safe behaviors observed. Percent safe observations were collected from
individual locations for the years 2000 and 2001 when available. Locations at Cynthiana
and Northridge did not track this information. Hutchinson began tracking this
information during fourth quarter, 2001 and was not included in this analysis. Data was
received from the locations at Brookings, both Decatur plants, New Ulm, the Columbia
Plant Engineering group, and Knoxville. Contact was made at both Greenville plants and
the Decatur location. No information or contact was received from the Austin location.
When the Decatur information is excluded, a strong inverse relationship (Pearson

Effectiveness 64
coefficient = - 0.822, p = 0.023) was evident. When the Decatur chemical plant
information was included for the years 2000 and 2001, a rather low positive relationship
developed between percent safe observations and the incident rate (Pearson coefficient =
0.345, p = 0.363).
Results of the perception survey. Analysis of the perception survey
indicated differences between the Optical Systems Division employees and the remaining
plant population on individual questions in the survey. Questions that were statistically
significant (p < 0.05) between groups were questions: 2, 3, 6, 7, 8, 9, 10, 13, 16, 17, 18,
19, 20, 23, 24, 25, and 30 (refer to Appendix C for the survey questions).
Independent group t-tests were performed on the eight perception areas to be
evaluated between the work groups. Perception areas measured were: (1) peer feedback,
(2) conformance to safety rules, (3) safety involvement/initiative, (4) job “shortcuts”, (5)
management support of safety, (6) peer relationships/ trust, (7) safety environment, and
(8) propensity to actively care for peers. The t-test for equality of means between the two
work groups is summarized in Table 7.
In the group t-test comparisons, the Optical Systems employees had statistically
significant differences in seven out of eight perception areas measured. The Optical
Systems employee’s responses to seven of the eight perception areas were more positive (
the preferred ideal responses) than the plant group. Five of the seven groups measured
were to the 95% confidence level , while the remaining two areas where at the 90%
confidence level. Job “shortcuts” was the only perception category measured where there
was no significant difference between the plant group and the Optical Systems Division
employees.

Effectiveness 65
Summary
The identification and application of statistical methods to determine ways to
measure and evaluate the effectiveness of the BBS process in the XYZ Company were
the prime objectives of this study. Use of SPC, trending, analysis of variance, regression
analysis, correlation analysis, perception surveys, and the analysis of the perception
survey using individual and group t-tests were used in this chapter to measure the
effectiveness of the BBS process. Results of the analysis of the upstream and
downstream indicators in the BBS locations revealed the effectiveness of the process
within the company. The conclusions and recommendations of this study will be
discussed in the next chapter.

Effectiveness 66
Chapter 5
Summary, Conclusions and Recommendations
Introduction This chapter contains: (1) a review of the study, (2) final conclusions based on the
results of the study, (3) recommendations drawn from this study, and (4)
recommendations for future study.
Summary
In was revealed in this study that the behavior-based safety process is not the
“silver bullet” that can cure all an organization’s safety ills, but rather another tool in the
safety toolbox to be used to improve safety performance. The summary of this research
includes a restatement of the problem, a review of the primary objectives of the study,
methods and procedures employed, and a discussion of the major findings of the
research.
Restatement of the problem. The focus of this study was the determination of
reliable methods to measure the effectiveness of the behavior-based safety process in the
XYZ Company. The major objectives of the study were: (1) an identification of
statistically valid techniques that measured the effectiveness of BBS, and (2) an
evaluation of the behavior-based safety process in the improvement of safety
performance in facilities of the XYZ Company that subscribed to the process.
Methods and procedures. The methods and procedures used in this study involved
various statistical analyses of OSHA accident incident rates and worker compensation
incurred costs in XYZ Company facilities that implemented the BBS process. Other
methods used to meet the objectives of the study were a comparison of BBS and selected
non-BBS facilities in terms of OSHA I/I rates for the past two years, correlation of

Effectiveness 67
OSHA IR and percent safe observations in BBS facilities, and a measurement of safety
perceptions in groups of employees that were familiar and not familiar with the BBS
process.
Statistical analysis of OSHA incident frequency rates (OSHA IR), severity rates
(OSHA SR), and worker compensation incurred costs in BBS facilities of XYZ Company
were examined before and after intervention of the BBS process in these facilities.
Statistical methods applied included control charting of these indices using statistical
process control techniques. Linear trends before and after the application of BBS in each
facility were also reviewed using control chart methods. Statistical significance was
determined for each indices for each BBS facility using a one-way analysis of variance
that examined statistical significance before and after the application of the BBS process.
The same process was used to examine worker compensation incurred costs.
A statistical comparison between BBS and selected non-BBS facilities in terms of
OSHA incident rates was performed for the periods of 2000 and 2001. A one-way
ANOVA was performed between these groups for the past two years to determine any
statistically significant difference in the OSHA I/I rates between the BBS and non-BBS
locations.
The correlation between percent safe behaviors observed and OSHA incident rates
(OSHA IR) were evaluated for reporting BBS facilities of the XYZ Company. Results
were analyzed in two ways: (1) visual inspection of graphical data plotted for percent safe
behaviors and incident rate (OSHA IR) and (2) statistical testing that determined
correlation between facility incident rates and the corresponding facility percent safe
behaviors.

Effectiveness 68
The last method employed to measure the effectiveness of the BBS process was a
safety perception survey. A 32-question safety perception survey was given to
production and administrative employees at one of the Wisconsin locations of the XYZ
Company. Two distinct work groups were statistically compared from results of the
survey: one work group implemented the BBS process two years ago, while the
remainder of the plant had not been exposed to the process. Statistically significant
differences of safety perceptions between these work groups were determined using
individual and group t-tests.
Major findings. Major findings from this study supported the purpose and
objectives of this research. Findings were reported for (1) statistical measurement of
BBS, (2) incident rates and incurred costs in BBS facilities, (3) comparison of incident
rates in BBS and non-BBS facilities, (4) correlation of percent safe behavior and OSHA
IR rates, and (5) results of the safety perception survey towards the BBS process.
Statistical measurement of BBS. It was shown in this study that the
effectiveness of the BBS process can be measured using statistically valid process control
charting techniques and other statistical analysis tools that can evaluate process changes.
Custom control charting software (BPChart) that was uniformly available and applied
throughout the XYZ Company for process control was used for this analysis. Trending
of the measured indices were tracked and statistically significant changes noted. Other
statistical tools used in the study included analysis of variance, correlation and regression
analysis, and individual and group t-tests.
Incident rates and incurred costs in BBS facilities. Four of the 11 BBS
locations (37%) had statistically significant downward changes in their OSHA IR rate

Effectiveness 69
after BBS implementation. These locations were Austin, Brookings, Cynthiana, and the
Greenville film plant. Five locations (46%) had statistically significant downward
changes in their OSHA SR rate. These locations were Austin, Brookings, Cynthiana,
Greenville tape plant, and the Knoxville location. Two plants (19%) had statistically
significant downward changes in their worker compensation incurred costs: Cynthiana
and the Decatur chemical plant location. Only the Cynthiana location had statistically
significant changes in all three indices after BBS implementation.
A downward linear trend was shown in four of the 11 locations for the OSHA
incident rate during the ten –year period 1991-2001. These locations were Austin,
Brookings, Cynthiana, and New Ulm. There was no indication of a downward trend in
the OSHA IR for any facility after the implementation of the BBS process. Four facilities
(Austin, Brookings, Cynthiana, and Northridge) also showed a significant change in the
OSHA SR rate for the 10-year period. Only one facility showed a statistically significant
change in the OSHA SR after BBS implementation (Greenville-Film). One facility,
Cynthiana, showed a statistically significant downward trend in the reduction of worker
compensation incurred costs from 1991 through 2001. However, no downward trend was
indicated in any facility after BBS implementation.
Incident rates in BBS and non-BBS facilities. All the OSHA incident rates
were compared for the year 2000 and 2001 between the BBS and selected non-BBS
locations in the XYZ Company. Two indices, lost work incident rate (LWIR) and lost
work severity rate (LWSR), were statistically significant for the year 2001 in the BBS
locations as compared to the non-BBS locations. The mean LWIR was 0.87 for the BBS
locations compared to 1.70 for the non-BBS locations. The mean LWSR for BBS

Effectiveness 70
locations was 11.17 compared to 26.91 for non-BBS locations. There were no
statistically significant differences between any of the OSHA I/I rates for the year 2000.
Correlation of percent safe behaviors and OSHA IR rates. The OSHA IR
rates for the individual BBS plants were visually graphed against their corresponding
percent safe behaviors observed. Excluding the Decatur plant information, a strong
inverse relationship (correlation coefficient = - 0.822, p = 0.023) was evident. This
supported the hypothesis that as percent observed safe behaviors increased, the accident
incident rate decreased.
Safety perception survey. In the 32-question safety perception survey, a
work group (Optical Systems employees) within the plant that had been exposed to the
BBS process for the past two years, had statistically significant differences in seven out
of eight perception areas measured compared to plant employees that had not been
exposed to the process. The Optical Systems employee’s responses to seven of the eight
perception areas were more positive (the preferred ideal responses) than the plant group.
Conclusions
Several conclusions may be drawn from the results of this study. Conclusions to
be made about ways to measure and evaluate the effectiveness of the behavior – based
safety process are discussed under (1) statistical methods, (2) incident rates, (3) percent
safe behaviors, and (4) safety perception surveys.
Statistical methods. In was shown in this study that employing statistical process
charting methods was a valid method to measure and track the effectiveness of the BBS
process. By measuring incident rates over a period of time and using modeling such as
linear and step-change trending, the process could be measured and predictions made

Effectiveness 71
about which way the process was headed. As Dial (1992) stated, “the organization
should use statistically valid incident rates as an indicator on how well the process was
affecting safety performance.” By listening to the “voice of the process”, the SPC
methods evaluated in this study could be used to determine the effectiveness of the BBS
process. The methods used in this research satisfied one of the objectives of this study: to
determine statistically reliable methods to measure the effectiveness of the BBS process.
Although this was measurement of “end of the pipe” results of the process, the
information can be used for tracking the process and providing feedback to management
on how well the process was working and what direction it was heading.
Incident rates. Another major objective of this study was to determine the
effectiveness of the BBS process within the XYZ Company. Simply stated, did BBS
work? There was not convincing evidence that BBS alone improved the OSHA
frequency rates (OSHA IR), severity rates (OSHA SR) or worker compensation incurred
costs in BBS locations of the XYZ Company. Only a minority of the locations showed
improvements in any of these areas after they implemented the BBS process. Only one
facility, Cynthiana, showed a significant downward improvement in all three areas. It
was also evident that in most BBS locations was there was already a downward trend in
these indices prior to the implementation of the BBS process at their locations.
The comparison of the OSHA incident rates between selected non-BBS locations
and BBS locations for the past two years showed no significant differences in these rates.
The exception was the LWIR and the LWSR rates for the year 2001 in the BBS locations.
These rates were statistically lower than the non-BBS locations. This indicated the
frequency and severity of lost–time injuries were lower that year in the BBS locations.

Effectiveness 72
Other factors that may have influenced these results must be considered. During
the first part of the review period (1990-1995), the corporation set safety goals for plants
that may have encouraged under-reporting to meet these objectives. Programs that
promoted recognition based on incident rates and obtaining the “Million Hour Club”
award (one million worked hours without an OSHA recordable incident) may have
caused reporting bias by plant locations. Later in the decade, similar programs, such as
the “50-in 4” program (a 50% reduction in illness and injury rates over four years) may
have caused similar effects on incident reporting. Since this study considered only “hard
case” incident rates – those cases that had restricted work days or lost –time days, it was
assumed that these rates would be more reliable than the minor or OSHA recordable-only
cases for analysis.
Other influences on incident rates that may have affected the outcome were more
proactive back-to-work programs, ergonomic initiatives, corporate–wide nip guard,
machine guarding, and process safety audits, the development of the GSHP, introduction
of workplace safety performance correction guidelines (progressive discipline for safety
violations), and OSHA record keeping audits. These factors and not solely the effects of
implementing the BBS process could have had an influence on the study results.
Percent safe behaviors. Results supported previous research that percent safe
behaviors observed are inversely proportional to the accident rate. That is, as the percent
safe observations increased, the accident rate decreased. Results reported from the
Decatur chemical plant were not included in the analysis, since these results did not
support the hypothesis found by other research (Ray & Fry, 1999). This hypothesis was
supported by the strong inverse correlation found in this study and the reliability of the

Effectiveness 73
data. Additional validity of the hypothesis could have been proven if more BBS
locations within the XYZ Company had reported this data.
Perception survey. The results of the perception survey indicated this may be the
most valid method to determine if the BBS process is working in the organization. Seven
of eight categories measured between the two work groups had statistically significant
differences in responses.
Recommendations
Recommendations related to this study. These are the recommendations related to
this study:
1. Continue to use the control charting process and other statistical tools
identified in this study to measure the downstream effects of the process.
The techniques used in this study can be used to track safety performance
regardless if the location is involved with the BBS process.
2. The use of frequency rates, severity rates, worker compensation incurred
costs, and other downstream safety measures should be used if these
indicators are properly interpreted and used together with upstream
indicators such as behavior data. It was shown in this study that there is a
strong relationship between percent safe observations and the incident
rates.
3. More data is needed to further verify the relationship of percent safe
behaviors and incident rates. Several BBS locations had just started
collecting this information or did not track it. Some BBS systems, such as
the BST approach, made it easier to track this information with their

Effectiveness 74
software than the SPS system. Locations with self-implemented BBS
processes should consider using these systems or developing their own.
The Hutchinson location has developed their own tracking system that
could be shared with other locations.
4. Establish a BBS-user group between locations. When interviewing
locations about their BBS process, the common issues occurring in BBS
plants were (1) keeping the process “fresh” to their employees, and (2)
getting or maintaining management support for the process. Although an
environmental, health, and safety (EHS) forum database exists for sharing
ideas and programs across the company, the BBS discussion topic area in
the database has been largely unused in the past two years. This database
should be used more extensively to share ideas between BBS locations.
5. Further develop the use of the safety perception survey to measure
employee attitudes about the BBS process and identify barriers that may
exist. The survey given at the Wisconsin location should be administered
again in two years to evaluate the effects the BBS process has had on the
plant population. Consideration should be given to expanding the survey
with questions designed to measure additional process criteria as the
process evolves in the organization.
6. The findings of this study should be distributed to the BBS locations that
assisted with this study. This information can also be shared with other
facilities of the XYZ Company who have not developed methods or a
process of determining BBS effectiveness. There have been requests from

Effectiveness 75
the corporate XYZ Company safety management to review the results of
this study. This study can also be posted to the EHS database forum
previously mentioned in this discussion.
Recommendations for further study. These are recommendations for further
study based on the results of this research:
1. Perform additional research on the BBS process or safety management
system that has been implemented at the Cynthiana location. This
location had statistically significant changes in all measured criteria in the
study. Interestingly, Cynthiana no longer tracks percent safe behaviors,
but has focused their activities on identifying and eliminating barriers in
the process.
2. Further research could be conducted on determining the “critical mass” of
at-risk behaviors in a facility (Krause, et al, 1991). When at-risk
behaviors reach a critical mass at a location, accidents occur. An
important risk management activity would be to determine the location’s
critical mass percent at-risk and percent safe baseline. The closer the
facility ‘s baseline percent safe comes to the at-risk critical mass, the
greater the risk of accidents occurring.
3. Focus further research on identifying valid upstream indicators of the
BBS process. Indicators that could be considered are: number of barriers
identified and eliminated, number of observations completed, employee
participation in observations, number of behaviors targeted per
month/quarter, or a variety of other indicators.

Effectiveness 76
References
Atkinson, W. (2000). Behavior based safety. Management Review, 89(2), 41-45.
Barton, J. , Caldwell, T. C. , & Hodson, S. (1997). Case study: Behavior-based
safety in action. Occupational Health & Safety, 66(10), 80-84.
Behavioral Science Technology, Inc. (2002). Website: http://www.bstsolutions.com/
Behavior Science Technology, Inc. (1998). Summary of BAPP implementations:
prepared for XYZ Company, May 29,1998.
Blair, E. (1999). Behavior-based safety: Myths, magic, & reality. Professional Safety,
44(8), 25-29.
BPChart.XLS. Version 4.0. (2001). An Excel spreadsheet for management data.
Developed by the XYZ Statistical Practitioners Forum. 1994-2001. XYZ
Company.
Bond, W. S. (1999). Behavior-based safety processes: safety improvement concepts for
manufacturing operations. Unpublished master’s thesis, Kennedy-Western
University, Cheyenne, Wyoming.
CompWatch. (2002). Injury/Illness Rate Formula Report. Retrieved February 24, 2002
from http://www.bsiweb.com/rateform.htm
Dennis, P. (1997). Quality, safety, and environment: Synergy in the 21st century.
Milwaukee: Quality Press
DePasquale, J. P. & Geller, E. S. (1999). Critical success factors for behavior-based
safety: A study of twenty industry-wide applications. Journal of Safety Research,
30(4), 237-249.
Dial, C. M. (1992). Incident-focused managers. Professional Safety, 37(4), 37-45.

Effectiveness 77
Dupont STOP program. (2002). Website:
http://www.dupont.com/safety/products/stop.html
Fulwiler, R. D. (2000). Behavior-based safety and the missing links. Occupational
Hazards, 62(1), 53-55.
Guastello, S. J. (1993). Do we really know how well our occupational accident
prevention programs work? Safety Science, 16 , 445-463.
Geller, E. S. (1996). Working safe: How to help people actively care for health and
safety. Boston: CRC Press.
Geller, E. S. , Roberts, D. S. , & Gilmore, M. R. (1996). Predicting propensity to
actively care for occupational safety. Journal of Safety Science, 27(1), 1-8.
Geller, E. S. , Boyce, T. E. , Williams, J. H. , Pettinger, C. B. , DePasquale, J.
P. , & Clarke, S. (1998). Researching behavior-based safety: A multi-method
assessment and evaluation. In Proceedings of the 37th Annual Professional
Development Conference and Exposition (pp. 537-559). Des Plaines, IL: American
Society of Safety Engineers
Geller, E. S. (2002). Seven common pitfalls to avoid when implementing behavior
based safety. Retrieved February 23, 2002 from
http://www.safetyperformance.com/pitfall.html
Hans, M. (1996). Does behavior-based safety work? Safety & Health, 153(6), 44-47.
Harper, A. C. , Cordery, J. L. , de Klerk, N. H. , Sevastos, P. , Geelhoed, E. ,
Gunson, C. , Robinson, L. , Sutherland, M. , Osborn, D. & Colquhoun, J.
(1996). Curtin industrial safety trial: Managerial behavior and program effectiveness.
Safety Science, 24(3), 173-179.

Effectiveness 78
Hayes, B. E. , Perander, J. , Smecko, T. , & Trask, J. (1998). Measuring
perceptions of workplace safety: Development and validation of the work safety
scale. Journal of Safety Research, 29(3), 145-161.
Heinrich, H. W. , Roos, N. , & Peterson, D. (1980). Industrial Accident Prevention
(5th ed.). New York: McGraw-Hill.
Hidley, S. & Airhart, T. ( First quarter, 1999). Perspectives in Behavioral
Management. 18-21.
Hodson, S. , Groover, D. , & Ray, S. (1999). M.W. Kellogg adapts BST’s
behavior-based safety model to meet the safety challenges of industrial construction
worldwide. Retrieved February 22, 2002 from
http://www.bstsolutions.com/current.htm
Hodson, S. , & Hall, R. (first quarter, 1999). With behavior-based safety in its
toolbox. Perspectives in Behavioral Management. 2-6.
Karr, A. (2000). Behavior-based safety: Is it the Holy Grail of the workplace? Safety &
Health, 161(3), 35-42.
Komaki, J. , Barwick, K. D. , & Scott, L. R. (1978). A behavioral approach to
occupational safety: Pinpointing and reinforcing in a food manufacturing plant.
Journal of Applied Psychology, 63(4), 434-445.
Krause, T. R. , Hidley, J. H. , & S. J. Hodson. (1990). The Behavior-based safety
process. New York: Van Nostrand Reinhold
Krause, T. R. , Hidley, J. H. , & S. J. Hodson. (1991). Measuring safety
performance: The process approach. Reprinted from Occupational Hazards, June,
1991.

Effectiveness 79
Krause, T. R. (1998). Safety incentives from a behavioral perspective: Presenting a
balance sheet. Professional Safety, 43(8), 24-28.
Krause, T. R. , Seymour, K. J. , & Sloat, K. C. M. (1999). Long term evaluation
of a behavior-based method for improving safety performance: A meta-analysis of 73
interrupted time –series replications. Safety Science, 32(1), 1-18.
Krause, T. R. (2001). Moving to the second generation in behavior-based safety.
Professional Safety, 46(3) , 27-32.
Loafmann, B. (1998). Behavior–based safety: Power and pitfalls. Professional Safety
43(8) 20-23.
Manuele, F. A. (1998). Perspectives on behavioral safety: Observations of ASEE’s
behavioral safety symposium. Professional Safety, 43(8), 32-37.
McSween, T. E. (1995). The values-based safety process: Improving your safety culture
with a behavioral approach. New York: Van Nostrand Reinhold
National Safety Council. (2001, October). Report on injuries in America, 2001.
Retrieved February 4, 2002 from http://www.nsc.org/library/rept2000.htm
O’Brien, D. P. (1998). Business metrics for safety: A quantitative measurement
approach to safety performance. Professional Safety, 43(8), 41-44.
Petersen, D. (1994). Integrating safety into total quality management. Professional
Safety, 39(6), 28-30.
Petersen, D. (1997). Behavior-based safety systems: A definition and criteria to assess.
Professional Safety, 42(1), 30-32.
Petersen, D. (1998a). Behavior-based safety: magic pill, fad, or what? Professional
Safety, 43, (8), 34-35.

Effectiveness 80
Petersen, D. (1998b). What measure should we use and why: Measuring system safety
effectiveness. Professional Safety, 43(10), 37-40.
Petersen, D. (2000a). The behavioral approach to safety management. Professional
Safety, 45(3), 37-39.
Petersen, D. (2000b). Safety management 2000: Our strengths and weaknesses.
Professional Safety, 45(1), 16-19.
Pettinger, C. B. , Boyce, T. E. , & Geller, E. S. (in press). Effects of employee
involvement on behavior based safety. Retrieved March 23, 2002 from
http://www.safetyperformance.com/TheoryArticles.asp
Ragan, P. T. (1997). Behavioral safety: Safety’s silver bullet?. Professional Safety,
42(10) , 26-31.
Ray, P. S. , & Frey, A. (1999). Validation of the behavioral safety index.
Professional Safety, 44(7) , 25-28.
Reynolds, S. H. (1998). Back to the future: The importance of learning the ABCs of
behavioral safety. Professional Safety, 43(2) , 23-25.
Safety Performance Solutions. (2002). Website: http://www.safetyperformance.com/
Salazar, N. (1989). Applying the Deming philosophy to the safety system. Professional
Safety, 34(12), 22-27.
Smith, T. A. (1999). What’s wrong with behavior-based safety? Professional Safety,
44(9) , 37-40.
Stricoff, R. S. (2000). Safety performance measurement: Identifying prospective
indicators with high validity. Professional Safety, 45(1), 36-39.

Effectiveness 81
Stricoff, R. S. (Second Quarter, 2001). Measuring safety culture: Linking science to
perception. Perspectives in Behavioral Management. 15.
Sulzer-Azaroff, B. & Austin, J. (2000). Does BBS work? Behavior-based safety &
injury reduction: A survey of the evidence. Professional Safety, 45(7), 19-24.
Varonen, U. , & Mattila, M. (2000). The safety climate and its relationship to safety
practices, safety of the work environment and occupational accidents in eight wood-
processing companies. Accident Analysis & Prevention, 32, 761-769.
Weddle, M. G. (1996). Reporting occupational injuries: the first step. Journal of
Safety Research, 27(4), 217-233.
Wheeler, D. J. (1993). Understanding variation: The key to managing chaos.
Knoxville, TN: SPC Press.
Williams, J. H. , Geller, E. S. (2000). Behavior-based intervention for occupational
safety: Critical impact of social comparison feedback. Journal of Safety Research, 31
(3), 135-142.
XYZ Company. (2002a). Corporate Safety Reports. Retrieved from the Internet on
April 6, 2002: http://intranet.mmm.com/ehs/ehssafety/reports.htm
XYZ Company. (2002b). Glossary. 1997 Corporate Safety Report. Retrieved from the
Internet on April 6, 2002:
http://intranet.mmm.com/ehs/ehssafety/anreport/us97/Glssry97.htm

Effectiveness 82
Appendix A
XYZ Company BBS Locations
Facility Location BBS Source* Year Implemented
Austin, TX BST 1997 Brookings, SD BST 1996 Columbia, MO SPS 1999 Cordova, IL BST 1996 Cynthiana, KY SPS 1996 Decatur, Al – Chemical BST 1995 Decatur, Al – Film BST 1995 Greenville, SC – Film BST 1996 Greenville SC,– Tape SPS 1998 Guin, Al BST 1998 Hutchinson, MN Self-
implementation 1999
Knoxville, IA BST 1995 Menomonie, WI – Optical Systems
SPS 1998
New Ulm, MN SPS 1999 Northridge, CA. BST 1997
*Note: BST is Behavioral Science Technology Inc; SPS is Safety Performance Solutions

Effectiveness 83
Appendix B
XYZ Company Global Safety and Health Plan (GSHP) 1. Management System Elements
1.1 Location Safety and Health Plan
A written location-specific Safety and Health Plan is designed to outline the location's
safety and health needs. The plan lists the required safety and health elements and the
action plans to initiate, implement, or improve each element
1.2 Safety and Health in the Performance Appraisal System
A system must be in place to ensure that safe and healthy work practices are expected
and recognized as an integral part of the performance appraisal process.
1.3 Safety and Health Committee
An established and active safety and health committee is necessary to assist in the
implementation of the Safety and Health Plan. The committee helps to oversee that
safety and health systems and procedures are followed, promoted, and continuously
improved.
1.4 Safety and Health Staffing and Qualifications
Each location must provide qualified staffing to support the required safety and health
programs. Specific coordinator needs are based on the size and complexity of the
location involved. The coordinators must receive appropriate training, time, and support
to serve as a vital resource and effectively oversee safety and health-related activities.

Effectiveness 84
1.5 Safety and Health Orientation and Training
A written Safety and Health Orientation and Training Program is required to properly
train employees in the safe and healthful performance of their jobs.
1.6 Safety and Health Self-Surveys and Evaluations
A plan for conducting regular safety and health self-surveys and evaluations is required
for each location. Self-surveys and evaluations help to ensure that safe and healthful
practices are maintained. They provide early opportunities for identifying areas for
improvement before they become a safety or health issue. They can also be used to
measure progress on identified issues.
1.7 Record Keeping, Reporting, and Follow-Up
A system with written procedures for record keeping, reporting, and follow-up is required.
Also, the location is required to maintain accurate and complete records of all safety and
health-related activities and incidents. Records must be kept in compliance with XYZ
Company standards and government regulations.
1.8 Employee Involvement and Ownership
The location Safety and Health Plan shall promote employee involvement, ownership,
and accountability at all levels. This involvement is critical to achieving effective,
proactive solutions to safety and health issues. Just as employees are more involved in
production and product quality, increasing employee ownership in safety and health will
help provide a safer, healthier work place. Emphasis should be placed on a cooperative
effort between management and employees in achieving these goals.

Effectiveness 85
1.9 Proactive Evaluation and Control of Hazards
Written procedures are required to anticipate and address work place safety and health
hazards in a proactive manner. This program includes procedures to identify potential
hazards in materials, processes, and equipment and to establish and implement
appropriate controls. These issues should be identified early in the life of a product or
project in order to achieve the best and most cost-effective solutions.
1.10 Policies, Standards, Guidelines, and Programs
Locations must comply with all applicable government regulations and XYZ Company
safety and health policies and standards. XYZ Company guidelines and programs are
available to assist locations in addressing safety and health issues.
2. Process Elements
2.1 Chemical Exposure Assessment and Management
A written Exposure Assessment Program is necessary at each manufacturing location
where there is potential for significant chemical exposure to employees. This program is
intended to provide an understanding of what chemicals are used, in what processes,
and the potential for employee exposures. Other locations, such as R&D laboratories,
should evaluate exposure assessment needs individually.

Effectiveness 86
2.2 Process Safety Management
A written Process Safety Management (PSM) program is required for hazardous
processes where releases of hazardous materials could result in fire, explosion, or toxic
exposures. Effective PSM protects XYZ Company employees, property, the
environment, and the surrounding community from potential toxic, reactive, or flammable
chemical releases.
2.3 Ergonomics
A written Ergonomics Program is required at each manufacturing location. Other
locations, such as R&D laboratories, administration, and engineering, should assess
ergonomic program needs individually. Good work place design is the best way to
prevent or control ergonomic-related hazards, which may result in injuries and illnesses.
This can often help improve productivity, reduce costs, and boost product quality.
3. Procedural Elements
3.1 Emergency Preparedness
A written location-specific emergency plan is required to adequately prepare and
practice for quick and effective emergency response when needed.

Effectiveness 87
3.2 Incident and Potential Hazard Reporting, Record Keeping, Investigation,
and Follow-Up
A system to report, record, and investigate incidents and potential hazards is required to
ensure that root causes are identified and appropriate corrective action is implemented
3.3 Job Hazard Analysis
A written Job Hazard Analysis Program is required. This program includes established
standard operating procedures that provide a consistent method to assess potential
safety and health job hazards and to identify and implement appropriate control
measures.
3.4 Contractor Safety and Health
A written Contractor Safety and Health Program is required to ensure that contractors
are informed and comply with XYZ Company safety and health policies and procedures
while working on XYZ Company premises.
4. Medical Elements
4.1 Medical Management
Medical management systems are required to assess employees' initial health status
and to monitor the continued health of affected employees, as necessary. These
systems may include pre-placement exams, medical surveillance, and handling of
disability cases.

Effectiveness 88
4.2 Biosafety
Exposure control plans are required to protect employees from potential exposure to
biohazardous material. Any employee who may reasonably anticipate having skin, eye,
mucous membrane, or other contact with blood or other biohazardous material in job-
related duties must be a part of this program.
5. Chemical Hazard Elements
5.1 Hazard Communication
A written program, available to all employees, is required and must inform employees
who work with hazardous chemicals how to obtain information on how those chemicals
can affect their health, what precautions to take, and what to do in an emergency.
5.2 Respirators
A written Respiratory Protection Program is required to promote safe respirator use in
environments containing airborne contaminants. Only employees who have been
certified through a program of medical evaluation, training, and fit- testing shall use
respiratory protection.
6. Physical Hazard Elements
6.1 Electrical Safety
Electrical safety procedures are required for the safe operation and maintenance of
equipment to minimize the effects of electrical hazards in the work place.

Effectiveness 89
6.2 Ionizing Radiation
All locations that utilize radioactive materials or other ionizing radiation sources are
required to have a written Radiation Protection Program. This program is designed to
ensure that good safety practices minimize employee exposure to ionizing radiation and
that exposures are within the radiological health standards of regulatory agencies.
6.3 Non-Ionizing Radiation
Precautionary and protective measures must be routinely taken to minimize employee
exposure to non-ionizing radiation sources.
6.4 Powered Industrial Vehicles
A written safety program covering the safety rating, safe operation, and maintenance of
powered industrial vehicles is required where this type of equipment is being used.
6.5 Fire Protection and Prevention
A written Fire Protection and Prevention Program are required which includes fire
protection systems and equipment, procedures for fire hazard control, and fire protection
and prevention training. Careful planning, training, and use of fire protection systems
and equipment help prevent fires and casualty losses.
6.6 Fleet Safety
A written Fleet Safety Program, designed for the safe operation of XYZ Company
vehicles, is required where XYZ Company owned and leased vehicles are used by XYZ
Company employees.

Effectiveness 90
6.7 Lockout/Tagout
Written lockout/tagout procedures are required to isolate all types of energy in order to
prevent an unexpected release of stored energy that could cause injury. This applies to
equipment during installation, repair, maintenance, removal, and non-routine operations.
6.8 Machine Guarding
A system is required for compliance with XYZ Company's machine guarding
specifications and procedures to protect operators and other employees from hazards in
machine areas.
6.9 Noise Control and Hearing Conservation
A system is necessary to identify, evaluate, and control potentially harmful noise. The
control of noise exposures helps prevent workplace noise-induced hearing loss. If any
employee has the potential for noise exposures greater than or equal to 85 dBA
averaged over eight hours, the location is required to have a written Hearing
Conservation Program.
6.10 Hoist Systems for Overhead Material Handling
A system is required for compliance with XYZ Company's specifications for hoist
systems for overhead material handling. This applies to the design, purchase,
installation, labeling, operation and maintenance of these devices.
7. Combined Chemical and Physical Related Elements

Effectiveness 91
7.1 Confined Space Entry
A written program is required for all locations with confined spaces. Confined spaces
must be identified, evaluated, and designated in compliance with XYZ Company
standards. Entry permits, proper equipment, and training are necessary for safe entry
and work in potentially hazardous environments.
7.2 Flammable Liquid Handling and Storage
Flammable liquid handling and storage procedures must be established and
implemented wherever flammable liquids are used and/or stored. Requirements
primarily depend on the liquid's fire characteristics, particularly the flash point, which is
the basis for liquid classification. Where Class H or Class IH liquids are heated above
their flashpoints during use or storage, additional requirements may be necessary.
7.3 Personal Protective Equipment
A written Personal Protective Equipment (PPE) Program is required for every location
where PPE is used. Personal protective equipment is one of the methods for controlling
employees' exposure to hazards in the work place. It should be considered the last
choice among control strategies because it may be ineffective if used improperly

Effectiveness 92
Appendix C
Safety Culture Survey Please check (√) your assigned department: CMS&O SRW PE TFTR E-Beam PCRP TPTC TCM LSD Fuel Cell SWP/Zippy OSD SF&C Please circle the number that reflects your feelings for each particular question within this survey. Highly Agree – 4Agree – 3Disagree – 2Highly Disagree - 1
1. Reporting minor injuries is usually a waste of time because most can’t be prevented anyway 1 2 3 4 2. Employees appreciate feedback from their coworkers about their safe behaviors 1 2 3 4 3. I am willing to put forth a little extra effort to improve workplace safety 1 2 3 4 4. I feel pressure from my co-workers to “short cut” safe work practices 1 2 3 4 5. Employees in my work area caution each other about unsafe behaviors 1 2 3 4 6. If I approach my coworkers about their unsafe behaviors, they will react negatively 1 2 3 4 7. Supervisors regularly discuss safety improvement goals and efforts with employees 1 2 3 4 8. I enjoy being with my coworkers 1 2 3 4 9. I don’t give safety feedback to my coworkers because I’m not sure I can do it well 1 2 3 4 10. Supervisors routinely acknowledge employees for safe behaviors 1 2 3 4 11. I sometimes overlook hazards to get the job done 1 2 3 4 12. In the past 12 months, I have been asked to perform a task which I thought was unsafe 1 2 3 4 13. When employees in my group are cautioned about working unsafely, they begin working more
safely 1 2 3 4
14. I am encouraged to stop a job if a safety hazard is identified 1 2 3 4 15. I am willing to caution my coworkers about working unsafely 1 2 3 4 16. Employees fully understand the potential hazards of their jobs 1 2 3 4 17. I trust my coworkers 1 2 3 4 18. Most employees would feel uncomfortable if their work practices were observed and recorded
by a coworker 1 2 3 4
19. Work stress affects my ability to do my job safely 1 2 3 4 20. I am willing to praise my coworkers for working safely 1 2 3 4 21. Following all safety rules and regulations needlessly slows down my job 1 2 3 4 22. I have more respect for my coworkers who work safely than for those who don’t 1 2 3 4 23. Employees in my work group participate in defining safe work practices 1 2 3 4 24. I am willing to observe the work practices of my coworkers to give them safety feedback 1 2 3 4 25. Employees should observe the work practices of their coworkers to give them safety feedback 1 2 3 4 26. Employees here often “short cut” safe work practices 1 2 3 4 27. When an employee sees a safety hazard, they should correct it themselves if possible 1 2 3 4 28. It is the responsibility of each employee to seek out opportunities to prevent injury to others 1 2 3 4 29. Supervisors consistently set a good example for safety through their own safe behavior 1 2 3 4 30. Work productivity and quality usually have a higher priority than work safety 1 2 3 4 31. Production demands do not override supervisors’ concern for safety 1 2 3 4 32. I would be willing to have a coworker observe me while I work, to give me feedback about safe
and unsafe behaviors observed 1 2 3 4
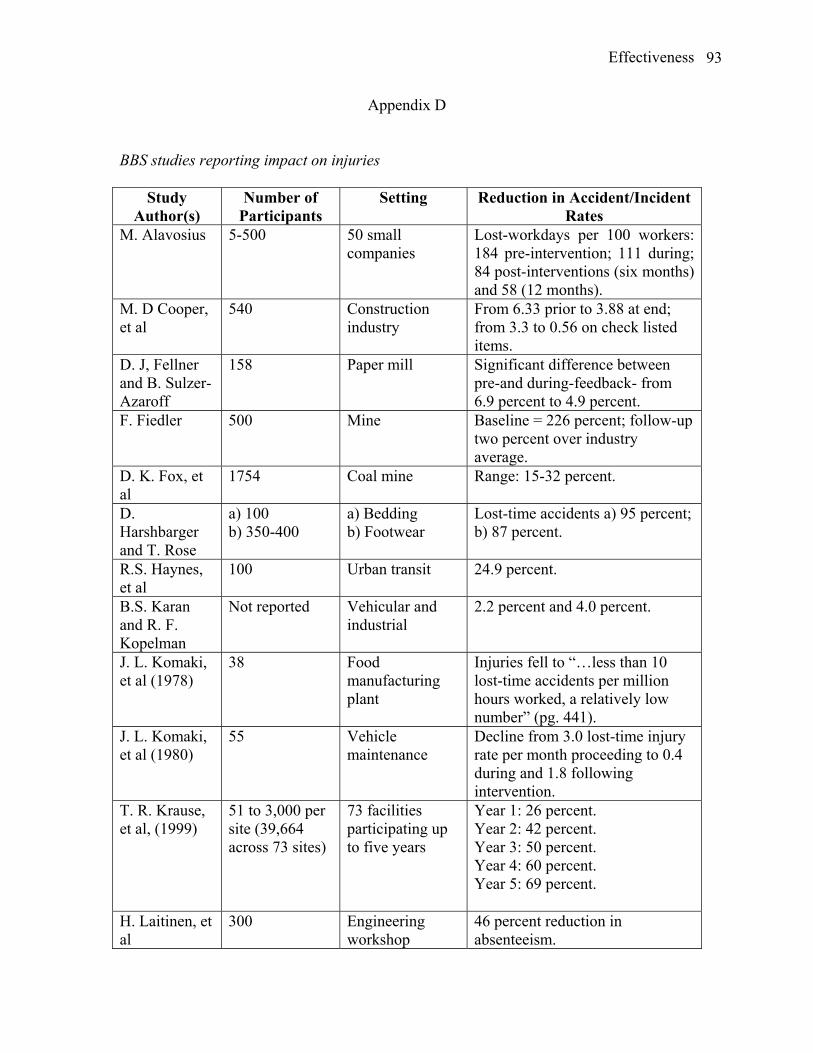
Effectiveness 93
Appendix D
BBS studies reporting impact on injuries
Study Author(s)
Number of Participants
Setting Reduction in Accident/Incident Rates
M. Alavosius 5-500 50 small companies
Lost-workdays per 100 workers: 184 pre-intervention; 111 during; 84 post-interventions (six months) and 58 (12 months).
M. D Cooper, et al
540 Construction industry
From 6.33 prior to 3.88 at end; from 3.3 to 0.56 on check listed items.
D. J, Fellner and B. Sulzer-Azaroff
158 Paper mill Significant difference between pre-and during-feedback- from 6.9 percent to 4.9 percent.
F. Fiedler 500 Mine Baseline = 226 percent; follow-up two percent over industry average.
D. K. Fox, et al
1754 Coal mine Range: 15-32 percent.
D. Harshbarger and T. Rose
a) 100 b) 350-400
a) Bedding b) Footwear
Lost-time accidents a) 95 percent; b) 87 percent.
R.S. Haynes, et al
100 Urban transit 24.9 percent.
B.S. Karan and R. F. Kopelman
Not reported Vehicular and industrial
2.2 percent and 4.0 percent.
J. L. Komaki, et al (1978)
38 Food manufacturing plant
Injuries fell to “…less than 10 lost-time accidents per million hours worked, a relatively low number” (pg. 441).
J. L. Komaki, et al (1980)
55 Vehicle maintenance
Decline from 3.0 lost-time injury rate per month proceeding to 0.4 during and 1.8 following intervention.
T. R. Krause, et al, (1999)
51 to 3,000 per site (39,664 across 73 sites)
73 facilities participating up to five years
Year 1: 26 percent. Year 2: 42 percent. Year 3: 50 percent. Year 4: 60 percent. Year 5: 69 percent.
H. Laitinen, et al
300 Engineering workshop
46 percent reduction in absenteeism.

Effectiveness 94
B. Loafmann Not reported Utility company Treatment group about 78
percent; control group had a 50 percent increase.
L. Lopez-Mena and J.V. Antidrian
914 Forestry (2) and cement factory (1)
62.8 percent; maintained for three years.
L. Lopez-Mena and R. Baynes
41 Electrical distribution system
84.9 percent in one setting; 60.8 percent in a second setting.
L. Lopez – Mena, et al
191 Electrical energy distribution system
34.3 percent.
M. Mattila and M. Hyodynmaa
100 Building construction
Accident rate per 100 workers at control site higher during (166) and after (55) than experimental site – 94 and 47, respectively.
T. McSween Not reported Gas pipeline company
35 percent lost-time accidents.
T. McSween Not reported Chemical company (union-coordinated)
From four to zero the next 18 months.
R. Montero Not reported Industry (general)
“Rate dropped almost to zero”.
M. Nasanen and J. Saari
32 Shipyard 50-to-75-percent reduction in accidents.
D. Petersen Not reported Railroad “Experimental groups had fewer injuries than control [groups].”
R. A. Reber, et al (1984)
105 Farm machinery manufacturing
53.83 percent.
R. A. Reber, et al (1990 )
44 Manufacturing 50 percent.
K. L. Saarela 2,800 Shipyard Modest, non-significant reduction in accident frequency. This intervention involved a poster campaign, not a full behavioral program, and feedback to supervisors.
K. L. Saarela 24 Shipyard 20 percent during; about 40 percent after.
K. L. Saarela > 900 Shipyard 60+ percent. J. Saari and M. Nasanen
24 Shipyard 25-percent reduction in accidents; 30 percent reduction in injuries.
R. Schwartz 110 Grocery distribution
39.4 percent.

Effectiveness 95
workers M. Smith, et al
44 Shipyard Average decrease in eye injuries of 7.48 per 100 workers; control group average reduction of 1.16.
B. Sulzer-Azaroff, et al
140 Paper mill From 19 recordable incidents during baseline to two after feedback given for three behaviors.

Effectiveness 96
Appendix E
BPCharts of Cynthiana
BPChart special cause chart (example)
Special Cause Detected Chart Type: Chart for Individuals Database
Column Centerline: 65.59 Process Limits: Lower: -25.02 Upper: 156.2 6 Avg of Data Shown 65.5875 A.1 Beyond Control Limit E. 2 of 3 Beyond 2 Sigma Median Data Shown 36.4 B.9 On One Side of Average F. 4 of 5 Beyond 1 Sigma Sigma for Limits 30.20 C.6 Trending Up or Down G. 15 Within 1 Sigma Base for Limits Average MR D.14 Alternating Up & Down H. 8 Outside 1 Sigma X. Excluded or Missing Data Cynthiana run charts
OSHA SR
-20
0
20
40
60
80
100
120
1991
1992
1993
1994
1995
1996
1997
1998
1999
2000
2001
Year
Indi
vidua
l Val
ue
1A 1A 1A 1A 1A 1A 2A 2A 2A 2A 2A
Incurred costs x 1000
-100
0
100
200
300
400
500
1991
1992
1993
1994
1995
1996
1997
1998
1999
2000
2001
Year
Indi
vidu
al V
alue
1A 1A 1A 1A 1A 1A 2A 2A 2A 2A 2A

Effectiveness 97
Cynthiana I Charts
OSHA SR
-20
0
20
40
60
80
100
120
14019
91
1992
1993
1994
1995
1996
1997
1998
1999
2000
2001
Year
Indi
vidu
al V
alue
F F
Special Cause Flag
Incurred costs x 1000
-100
0
100
200
300
400
500
1991
1992
1993
1994
1995
1996
1997
1998
1999
2000
2001
Year
Indi
vidu
al V
alue
A F F
Special Cause Flag

Effectiveness 98
Cynthiana MR Charts
OSHA SR
0
10
20
30
40
50
60
70
80
9019
91
1992
1993
1994
1995
1996
1997
1998
1999
2000
2001
Year
Mov
ing
Ran
ge
Average MR = 25.76
UCL = 84.17
Incurred costs x 1000
0
50
100
150
200
250
300
350
400
1991
1992
1993
1994
1995
1996
1997
1998
1999
2000
2001
Year
Mov
ing
Ran
ge
*
Average MR = 70.91
UCL = 231.7

Effectiveness 99
Cynthiana Linear Trend Charts
OSHA SR
-100
-50
0
50
100
150
200
1991
1992
1993
1994
1995
1996
1997
1998
1999
2000
2001
Year
Indi
vidu
al V
alue
Special Cause Flag
Current probability of no trend = p= 0.007
Current probability of no trend = P =0.142
Incurred costs x 1000
-300
-200
-100
0
100
200
300
400
500
1991
1992
1993
1994
1995
1996
1997
1998
1999
2000
2001
Year
Indi
vidu
al V
alue
A
Special Cause Flag
Current probability of no trend = p = 0.019

Effectiveness 100
Cynthiana linear trend after BBS
Current probability of no trend = p= 0.759
Current probability of no trend = P = 0.473
OSHA SR
-40
-20
0
20
40
60
80
100
1991
1992
1993
1994
1995
1996
1997
1998
1999
2000
2001
Year
Indi
vidu
al V
alue
X X X X X
Special Cause Flag
Incurred costs x 1000
-40
-20
0
20
40
60
80
100
1991
1992
1993
1994
1995
1996
1997
1998
1999
2000
2001
Year
Indi
vidu
al V
alue
X X X X X X
Special Cause Flag

Effectiveness 101
Cynthiana Step Change Charts
Current probability of no trend = P = 0.0111993
1994
1995
1996
1997
1998
Current probability of no trend = p = 0.011
Current probability of no trend = p = 0.024
OSHA SR
-50
0
50
100
150
20019
91
1992
1999
2000
2001
Year
Indi
vidu
al V
alue
X
Special Cause Flag
Incurred costs x 1000
-200
-100
0
100
200
300
400
500
1991
1992
1993
1994
1995
1996
1997
1998
1999
2000
2001
Year
Indi
vidu
al V
alue
A X
Special Cause Flag