the grammar of graphics - department of computer science
TRANSCRIPT

The Grammar of Graphics
Han-Wei ShenCSE 5544

Grammar• Grammar gives language rules• Grammar makes language expressive– A language contains words but no rules expresses only
as many ideas as there are words• Grammar of Graphics – grammatical rules for
creating perceivable graphs– Take us from charts to statements – Both mathematical and aesthetic
• Elegant design requires us to think about a theory of graphics, not charts

Object Oriented Graphics System• Three stages of graphic creation – Specification
• Translation of user actions into a formal language• Required for an automatic system to understand the graphic
request– Assembly
• Assemble a graphical scene from a specification; coordinate its geometry, layout, and aesthetics
– Display • Aesthetic attributes • Dynamic design to enable brushing, drill-down, zooming,
linking, etc.

Specifications
• Statistical graphic specification are expressed in six statements– DATA: create variables from datasets– TRANS: variable transformation – SCALE: scale transformation (e.g., log)– COORD: a coordinate system (e.g., polar)– ELEMENT: geometry/mark (e.g., points) and their
aesthetic attributes/channel (e.g., color) – GUIDE: one or more guides (axes, legends, etc.)

Example

Example

• Data flow of making a pie
– What is the format of the data– How are the pie wedges to be colored?– What variables should be used to label the pie? – ….
• The above questions are common to many charts. The goal of the grammars of graphics is to create new charts flexibly
Make a Pie

• Data flow of making a pie
Make a Pie

Refined Data Flow
• The internal processes of making a pie, which constitute the syntax of the grammar of graphics
• The order of the following stages is important
Variables Algebra Scales Statistics Geometry Coordinates Aesthetic
Source
Renderer

A More Detailed ExampleA survey of US ScholarsCommissioned by the American Council of Learned Societies. (ACLS)Reported in Morton and Price (1989)Surveyed were 5385Respondents numbered 3835Response rate was 71 percentAmong respondents, 74% male, 26% femaleRespondents answered the question: “How often, if at all, do you think the
peer review refereeing system for scholarly journals in your field is biased in favor of the following categories of people? “… Males were one of the target categories
The percentages of respondents choosing each of five adverbs for now often the review process is biased in favor of males:Males: Rarely (30), Infrequently (15), Occasionally (10), Frequently (7), Not Sure (38)Females: Rarely (8), Infrequently (11), Occasionally (17), Frequently (32), Not Sure (32)

Create Variables
• Load from SQL
– Response = loadFromSQL(“ACLS”, “bias_...”, case”); – Gender = loadFromSQL(“ACLS”,”Gender”, “case”);
• Return
Case ID Gender Bias in favor of Male … …
CaseID Response1 Frequently
2 Not Sure
3 Frequently
…
3834 Rarely
3835 Infrequently
CaseID Gender1 Male
2 Female
3 Male
…
3834 Male
3835 Female

Apply Algebra
• Algebra: a collection of 1) sets 2) operators 3)rules for the combination of operators
• Join the two tables using the cross (inner join) function
x a x ay b y bz c z c
* =Case ID Response Gender1 Frequently Male
2 Not Sure Female
3 Frequently Male
… … …
3834 Rarely Male
3835 Infrequently Female

Apply Scales
• Define an order for the categorical variable Response and Gender – Categorical scale transformation: associate the values of a
categorical variable with a set of integers– Can be done by alphabetical, relative frequency, or any
user selected order
Case ID Response Gender1 4 2
2 5 1
3 4 2
…
3835 2 1
Rarely = 1 ; Infrequently = 2; Occasionally = 3; Frequently = 4; Not sure = 5Female = 1; Male = 2

Compute Statistics
• Use summary proportion() statistical methodCase ID Summary Response GenderFemale, Rarely 0.08 1 1
Female, Infrequently 0.11 2 1
Female, Occasionally 0.17 3 1
Female, Frequently 0.32 4 1
Female, Not sure 0.32 5 1
Male, Rarely 0.30 1 2
Male, Infrequently 0.15 2 2
Male, Occasionally 0.10 3 2
Male, Frequently 0.07 4 2
Male, Not sure 0.38 5 2
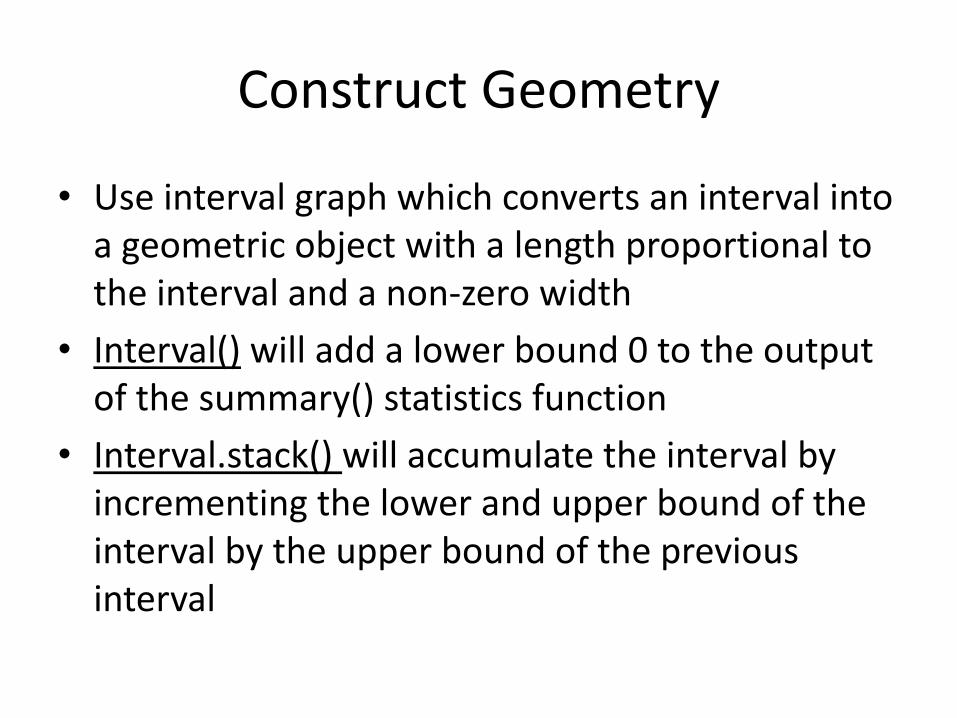
Construct Geometry
• Use interval graph which converts an interval into a geometric object with a length proportional to the interval and a non-zero width
• Interval() will add a lower bound 0 to the output of the summary() statistics function
• Interval.stack() will accumulate the interval by incrementing the lower and upper bound of the interval by the upper bound of the previous interval

Construct Geometry

Apply Coordinates• Apply a polar polar transformation to the shapes that were
produced by the geometry• (x,y) -> (r, theta)

Compute Aesthetics• Translate a graph into a graphic• Position()
– Input: a region defined by the polar transformation of the region created by the interval.stack() geometric element operating on the summary.proportion() operating on the varsetcreated by crossing Response and Gender
– Output: the references to screen coordinates• Color():
– Intput: all possible values of the Response variable– Output: pointer to the entries of a color table
• Label():– Inupt: same as that of color()– Output: pointers to the character strings containing the label

Compute Aesthetics
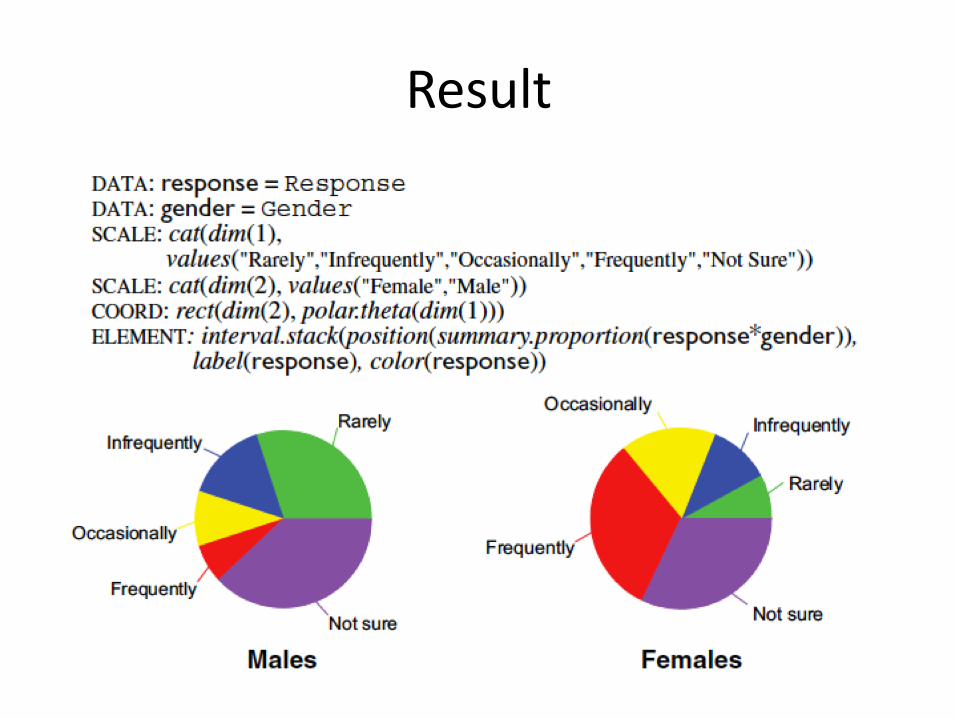
Result
