the graying of massachusetts · executive summary massachusetts is at the leading edge of the...
TRANSCRIPT

Aging, the New Rules of Retirement, and the Changing Workforce
The Graying of Massachusetts:
MassINCTHE MASSACHUSETTS INSTITUTE FOR A NEW COMMONWEALTH
A Project of the Economic Prosperity Initiative
Publisher of CommonWealth magazine
SPONSORED BY:A JOINT PROJECT OF:

Aging, the New Rules of Retirement, and the Changing Workforce
The Graying of Massachusetts:
Alicia H. MunnellKevin E. CahillAndrew D. EschtruthSteven A. Sass
with: Kevin Meme Amy Chasse Natalia Jivan Tatiana Mihailovschi-Muntean Mauricio Soto Greg Wiles
CENTER FOR RETIREMENT RESEARCH AT BOSTON COLLEGE
Dana Ansel, Ph.D.,
MassINC Research Director
Rachel Deyette Werkema, Ph.D.,
MassINC Deputy Research Director
June 2004
MassINCTHE MASSACHUSETTS INSTITUTE FOR A NEW COMMONWEALTH
A Project of the Economic Prosperity Initiative
Publisher of CommonWealth magazine
SPONSORED BY:A JOINT PROJECT OF:

June 2004
Dear Friend:
MassINC is proud to present The Graying of Massachusetts: Aging, the New Rules of Retirement, and theChanging Workforce, a report produced in partnership with the Center for Retirement Research at BostonCollege and made possible by the generous support of Blue Cross Blue Shield of Massachusetts.
MassINC is at the leading edge of a huge demographic shift to a much older population. At the same time,the rules of retirement have changed, shifting much of the responsibility onto individual families. Thischange occurs as many of the state’s 1.87 million Baby Boomers are getting ready to start retiring. Ourresearch indicates that many people are not prepared for the new world and instead are falling through thecracks as the nature of pensions have rapidly changed from traditional pensions to employee-directed plans like401(k)s. A stunning number of full-time workers do not have access to any form of 401(k) or other pensioncoverage from their current employer, and about one-quarter of those who have access to a 401(k) don’t useit. In addition, savings rates remain at historic lows, and the average 401(k) balance is relatively small forhouseholds approaching retirement.
All of these changes point to a reversal of a 20-year trend. Since the mid-1980s, American workers havebeen retiring in their early 60s. Going forward, it is likely that workers will have to delay their retirement.There is a bit of a silver lining to this grim picture. It appears that Massachusetts residents are better equippedthan their peers across the country to adjust to the new rules by working longer: Bay State residents arehealthier, better educated, and our jobs are less physically demanding.
Finally, the shift to an older population has huge implications for the Massachusetts labor market. Absent asubstantial increase in new immigrants, there could be a shortage of prime-age workers. In Massachusetts,over the next 25 years, the number of people under age 55 will decline in absolute terms. Older workers mayoffer a way to stem the impending labor shortages, but a number of challenges exist be able to capitalize onthis mutual interest.
In presenting these findings, we owe a debt of gratitude to our partners: Alicia Munnell, Kevin Cahill, AndrewEschtruth, Steven Sass and their colleagues who conducted the research. We would also like to thank themany reviewers whose critical insights have strengthened the final report. Lastly, we owe special thanks toDana Ansel, MassINC’s Research Director, for her excellent work in conceptualizing this important researchand shepherding it to such a successful conclusion. Finally, we would like to thank our sponsors at BlueCross Blue Shield of Massachusetts, who have been generous and enthusiastic partners, encouraging theauthors to go where the data led them.
We hope you find The Graying of Massachusetts an informative and timely resource. We believe policymakersand civic leaders across the state should initiate a conversation about the implications of an aging Common-wealth. As always, we welcome your feedback and invite you to become more involved in MassINC.
Sincerely,
Ian Bowles Gloria Cordes Larson Peter MeadePresident & CEO Co-Chair Co-Chair

EXECUTIVE SUMMARY . . . . . . . . . . . . . . . . . . . . . . . . . . . . . . . . . . . . . . . . . . . . . . . . 5Key Facts . . . . . . . . . . . . . . . . . . . . . . . . . . . . . . . . . . . . . . . . . . . . . . . . . . . . . . . 9
FINDINGS . . . . . . . . . . . . . . . . . . . . . . . . . . . . . . . . . . . . . . . . . . . . . . . . . . . . . . . . . 23
CHAPTER 1: Introduction . . . . . . . . . . . . . . . . . . . . . . . . . . . . . . . . . . . . . . . . . . . . 27
CHAPTER 2: The Population is Graying Rapidly . . . . . . . . . . . . . . . . . . . . . . . . . 32
CHAPTER 3: Traditional Income Sources Will Fall Short . . . . . . . . . . . . . . . . . 39
CHAPTER 4: Older Non-Married Women Are Most At Risk . . . . . . . . . . . . . . . 55
CHAPTER 5: The Work-Retirement Divide . . . . . . . . . . . . . . . . . . . . . . . . . . . . . 63
CHAPTER 6: Will Older People Want to Work Longer? . . . . . . . . . . . . . . . . . . . 68
CHAPTER 7: Will Employers Want Older Workers? . . . . . . . . . . . . . . . . . . . . . . 77
CHAPTER 8: Meeting the Challenge of An Aging Population . . . . . . . . . . . . . 98
ABOUT THE AUTHORS . . . . . . . . . . . . . . . . . . . . . . . . . . . . . . . . . . . . . . . . . . . . . . 103
THE GRAYING OF MASSACHUSETTS 3
TABLE OF CONTENTS

Massachusetts is on a collision course. The
Bay State faces a huge demographic shift to a
much older population. At the same time, the
rules of retirement that shaped our expectations
of the “golden years” are in a state of transition.
Changes to Social Security and private pen-
sions mean that if workers want to maintain
their standard of living, they will be forced to
retire later than expected. And everyone will
have to take more responsibility for managing
their retirement savings. To add a dose of con-
fusion, many of the state’s 1.87 million baby
boomers who are on the brink of retirement
will be caught in limbo between the new and
old rules of retirement.
The degree of change depends on a worker’s
age. For example, the oldest boomers, who will
turn 63—the average age of retirement in
Massachusetts—in less than five years, may not
see a dramatic shift in their expected retirement
income. The younger boomers and subsequent
generations, however, will likely be forced to
play by the new rules. Yet, while the world of
retirement has fundamentally changed over
the last decade, there has been surprisingly lit-
tle financial education to prepare families.
The nation will soon enter uncharted terri-
tory about how to meet the needs of an older
population. At the state level, Massachusetts
must tackle many of the same issues. There
are enormous public policy implications to an
aging population: Housing, healthcare, and
workforce development—to name a few policy
areas—will confront dramatically new and dif-
ferent challenges. And the financial implica-
tions of this demographic shift loom large. How
the Social Security system and Medicare will
accommodate the growing number of seniors
remains a hotly contested question.
While academics, policymakers, and advo-
cacy organizations have been grappling with
different pieces of this puzzle nationally, there
has been little work at the state level. The shift
to a much older population poses both enor-
mous challenges and opportunities for Massa-
chusetts. The good news is that there is time.
Because the most rapid increase of older Bay
Staters is expected between 2010 and 2030,
there is a small but critical window for educa-
tion and planning.
The purpose of this study is to begin the
process. This research focuses on three specif-
ic questions:
�What does this demographic shift look like?
�How well prepared are families for retirement?
�How will this demographic shift impact the
Massachusetts labor market?
What we find is that Massachusetts, as the
12th oldest state in the nation, is at the leading
edge of this coming age shift; indeed, some
Massachusetts counties are already older than
the oldest states in the nation. So the effects of
this demographic change evident nationwide
are likely to be felt sooner here. How prepared
are Massachusetts families—and the Massa-
chusetts economy—to make this adjustment?
The picture is mixed. Higher incomes ought
to give families the means to save for retire-
ment, but a high cost of living and low rate of
homeownership offset some of that financial
advantage. A slightly higher percentage of
Massachusetts workers are covered by pen-
sions than their national counterparts, but at
least one-third of all full-time workers have
THE GRAYING OF MASSACHUSETTS 5
Executive Summary
massachusetts is at the leadingedge of the coming age shift.

no access to any form of pension coverage at
their workplace. There is, unfortunately, every
reason to believe that Massachusetts families
approaching retirement age are without suffi-
cient resources and will have to consider
working well past age 63, the current average
age of retirement.
On the positive side, Massachusetts resi-
dents appear better equipped than their peers
across the country to work longer. Over the last
several years, large numbers of older workers
in our state have already been postponing retire-
ment and/or re-entering the labor force. This
recent trend could benefit Massachusetts com-
panies, because in just a few years, there could
be a shortage of prime-age workers. Thus, if
businesses can prepare for both the opportu-
nities and challenges of a mature workforce, a
mutually beneficial solution can potentially be
forged between older workers who need to work
longer and employers who will be searching
for workers.
The Graying Population:
“A Nation of Floridas”
Our nation is growing older, and it is happen-
ing quickly. Today, one out of every eight peo-
ple is 65 years or older. By 2030, one out of
five people (20%) will be 65 years or older.
Consider that, today, the state with the oldest
population is Florida, where 18 percent of the
population is at least 65 years old. In the five
youngest states, that number is less than 10
percent. By 2025, 39 states will look like Florida
does today, which has led one commentator to
describe the future United States as a “nation
of Floridas.”1
Two simple factors explain why the nation
is aging: 1) individuals are living longer; and 2)
women are having fewer children than in pre-
vious generations, and they are having them
later in life. The increases in a person’s life
expectancy in the United States are dramatic.
In 1935, at the time that Social Security was
enacted, men were expected to live 12 years
after the Social Security age (65 years old),
while women were expected to live 13 years.
Today, the life expectancy for 65-year-olds has
increased to 16.6 years for men and 19.6 years
for women.
6 THE MASSACHUSETTS INSTITUTE FOR A NEW COMMONWEALTH
ES FIGURE 1. States with 18 Percent of the Population 65 and
Over, 2000 and 2025
TODAY
TOMORROW
Source: Committee for Economic Development. 1999. New Opportunities for Older Workers. New York:Research and Policy Committee of the Committee for Economic Development. Updated with the 2000Census. [Available at: http://www.census.gov/population/cen2000/phc-t13/tab03.pdf].

At the same time that people are living
longer, fertility rates have declined, and women
are having children later. In 1800, an average
woman gave birth to seven children; today,
she has about two children. Because women
are having fewer children, the new supply of
younger people is limited, while the increase
in life expectancy means that there are greater
numbers of older people.
An Aging Massachusetts
Massachusetts is already an older state, and
New England is the oldest region in the coun-
try. As of 2000, the Commonwealth was the
12th oldest state in the union, with 13.5 per-
cent of its population older than 65 years. By
2025, that number will jump to 18 percent.
Within Massachusetts, Barnstable County
and Berkshire County, the oldest counties, are
at opposite ends of the state. Both of these
counties have a significantly higher propor-
tion of older residents than the other Bay State
counties. Indeed, even today, the populations
in these two counties are already older than
the state of Florida. In Barnstable, 23.1 percent
of the population is older than 65, and in Berk-
shire, 17.9 percent—compared to 17.6 per-
cent of Floridians. Nonetheless, as the most
populous county, Middlesex is the home to
the greatest number of older people, with
187,000 people over age 65.
So far, the social and economic implica-
tions of the aging population have been
masked by what could be called a “demograph-
ic holiday.” Many of today’s elderly were born
during the 1920s and 1930s, a period when
there was a sharp drop in fertility rates. At the
same time, the huge number of baby boomers
has swelled the non-aged population. As a
result, today’s retirees are a relatively small
group compared with the working-age popula-
tion. But this holiday is about to end.
Over the next 20 years, the United States
will see a rapid acceleration of its aging popu-
lation because of the baby boom generation—
the 80 million people born between 1946 and
1964. The oldest baby boomers will turn 62—
the nation’s average retirement age—in 2008.
At that time, the boomers will begin a massive
shift to retirement.
THE GRAYING OF MASSACHUSETTS 7
ES FIGURE 2. Massachusetts Age Distribution, 1980 and 2020
Source: U.S. Census 1980 and 2000.
1980Male | Female
2020Male | Female
6% 4% 2% 0% 2% 4% 6% 6% 4% 2% 0% 2% 4% 6%
85+80-8475-7970-7465-6960-6455-5950-5445-4940-4435-3930-3425-2920-2415-1910-145-9<5
85+80-8475-7970-7465-6960-6455-5950-5445-4940-4435-3930-3425-2920-2415-1910-145-9<5

How Well Prepared Are Families for
Retirement?
As the baby boomers prepare for retirement,
fundamental changes in the sources of retire-
ment income point to a reversal of a 20-year
trend. For the last two decades, the average
retirement age for men has been stable at
about 63.2 For women, it has remained steady
at about 61. In Massachusetts, the average age
of retirement is slightly higher; for men, it is
64, and for women, 62.3 Compare this to the
early 1900s when the national average age of
retirement for men was 74. The retirement
age declined dramatically in the last century
because of increased prosperity, but the new
retirement realities seriously call into question
whether future retirees will have the choice of
retiring in their early 60s.
Before examining the sources of income, it
is important to consider the issue of what in-
come people need to retire. Ideally, families in
retirement should be able to maintain the same
standard of living that they enjoyed while work-
ing. This is not an unreasonable goal: Retirees
typically need less money because they have
lower costs than working people. They have
lower clothing and transportation expenses as
a result of not working; they no longer pay
payroll taxes; many have paid off their mort-
gages; and they have less need to save money.
Financial planners assume that households
need 65 to 85 percent of their pre-retirement
income to maintain their standard of living.
That calculation may be changing, though.
As life expectancy increases, more and more
baby boomers face the additional and unknown
responsibilities of caring for elderly parents.
The rising costs of long-term care and health
care also add uncertainty to the equation. A
recent study by the Employee Benefit Research
Institute (EBRI) finds that routine, unreim-
bursed medical expenses can drastically re-
duce the share of Massachusetts households
that have adequate retirement income.4 Overall,
our ability to forecast the future is complicated,
making it difficult to prepare for retirement.
Anxiety among Massachusetts families is
already evident. According to the MassINC
survey The Pursuit of Happiness, almost one
quarter of families have no money set aside
for retirement. Fully 75 percent of families
headed by someone between the ages of 50
and 64 years old say that they are “somewhat”
or “very” concerned about not having enough
money for retirement. Younger respondents
voice similar concerns.5
Sources of Retirement Income:
Social Security
The sources of retirement income are often
described as a three-legged stool: Social Secur-
ity, private pensions, and savings.6 Currently,
Social Security is the biggest source of retire-
ment income. In 2000, in the typical house-
hold headed by an individual age 65 or older,
Social Security benefits accounted for nearly
8 THE MASSACHUSETTS INSTITUTE FOR A NEW COMMONWEALTH
ES FIGURE 3. Average Retirement Age of Men, 1910-2002
Source: Gary Burtless and Joseph F. Quinn. 2002. “Is Working Longer the Answer for an AgingWorkforce?” Issue Brief No. 11. Chestnut Hill, MA: Center for Retirement Research at Boston College,(December). Authors’ calculations using BLS data.
76
74
72
70
68
66
64
62
60
1910
1920
1930
1940
1950
1960
1970
1980
1990
2000
Age

two-thirds (64%) of its income.7 Indeed, for
one-third of all older households, Social
Security accounted for at least 90 percent of
their income. Going forward, however, Social
Security will replace less of retirees’ pre-retire-
ment income than it does now.
The serious long-term financial deficit of
Social Security, a “pay-as-you-go” system, has
been well documented. What is less well
understood is that the Social Security law has
already changed to address some of the struc-
tural problems, and these changes are now
being implemented. Perhaps the most signifi-
cant change is the increase of the Normal
Retirement Age, from age 65 to age 66 and
then to age 67. People born between 1943 and
1959 will have to wait until they are at least 66
years old to collect the maximum amount of
Social Security benefits each year, and people
born in 1960 or later will have to wait until
they are at least 67 years old. Thus, these
changes will affect all of the baby boomers.
Today, the majority of people collect their
benefits before they reach age 65. As a result,
they receive less money each year for the rest
of their lives. In 2001, 54 percent of all men
and 58 percent of all women started claiming
their benefits at age 62. Consider that an aver-
THE GRAYING OF MASSACHUSETTS 9
KEY FACTS • Fundamental changes in the sources of retirement income point to a reversal of a 20-
year trend. Since the mid-1980s, American workers have been retiring in their early
60s. In Massachusetts, the average retirement age is 64 for men and 62 for women.
Going forward, the increase in the Social Security age and low savings rates are just
two factors that make it likely that workers will have to delay retirement.
• About one-third of full-time workers in Massachusetts lack any form of pension cover-
age— including a 401(k)—at their current workplace.
• Of those households that do have pensions, the nature of pension coverage has changed
dramatically. Since 1992, the percentage covered by a traditional pension plan decreased
from 40% to 20%. During the same time, the share of those with a tax-deferred retirement
account at the workplace, such as a 401(k), increased from 38% to 58%. The new type of
pension shifts a substantial portion of the responsibility for retirement to the employee.
• About one-quarter of people eligible to participate in pensions do not.
• The average 401(k) balance of households approaching retirement (ages 55-64) is
only $55,000.
• At slightly more than 2%, the personal savings rate of 2001 was at its lowest point
since the Great Depression.
• As the Social Security age increases from 65 to 67, future retirees will either have to
work longer or accept a reduction in their monthly Social Security benefits.
• In less than five years, the 1.87 million baby boomers in the Bay State (29% of the
population) will begin to retire.
• Several key factors suggest that Massachusetts residents are better positioned to work
longer. Compared with their national peers, Bay State residents approaching retirement are
healthier; they have higher levels of education; and their jobs are less physically demanding.
• One important disadvantage is the state’s lower rate of homeownership, a key finding
since a home is the primary asset for most people. Slightly less than 76% of Massa-
chusetts households approaching retirement (ages 55-64) own their homes, com-
pared with almost 80% of their peers nationwide. The gap widens to 10 percentage
points for household heads over the age of 65.
• Old-age poverty is concentrated among single women. In Massachusetts, 10,312 single
women over 65 years old (28% of all women in this age group) are poor or near poor.
• In 2000, Massachusetts was the 12th oldest state in the U.S., with 13.5% of its popula-
tion older than 65 years. By 2025, that number will jump to 18%.
• Massachusetts labor markets could face labor shortages as the number of people under
55 is projected to decline in absolute terms between 2010 and 2025. As older workers
become a growing portion of the labor force, they could provide a new source of labor.
ES FIGURE 4. Retirement Income by Source,
Households Age 65 and Older, Middle Income
Quintile
Source: U.S. Social Security Administration. 2002. Income of the Popu-lation Aged 55 and Older, 2000. Washington, D.C. (February). http://www.ssa.gov/policy/docs/statcomps/inc_pop55/2000/incpop00.pdf
Employer pensions
Earnings
Income from assets
Other
SocialSecurity

age earner who retires at age 62 will receive
$11,051 per year, compared with the $13,814 if
that person waited until 65 to start collecting
benefits.8 If the Normal Retirement Age were
67 today, a person who retired at age 62 would
collect only $9,670 per year. Future retirees
will face the stark choice of working longer or
retiring before age 67 and receiving a signifi-
cant reduction in their monthly benefits.
Other changes in the law will also decrease
the amount of pre-retirement income that in-
dividuals will receive, due to an increase in the
Medicare premiums and a greater number of
people subject to taxes on a portion of their
Social Security benefits because the income
threshold is not indexed for growth in wages
or for inflation. Moreover, it is likely that addi-
tional cost-saving changes in the future will be
necessary to address the structural deficit.
Taken together, these changes mean that Social
Security will replace a smaller share of income
for retirees, even if they work until age 67. If
they continue to retire at an earlier age, then
monthly benefits will be even lower.
Pensions: The Dawn of the 401(k)
The second key source of retirement income
is private pensions provided by employers.
Since the 1970s, the portion of U.S. workers
who have a pension plan has remained stable.
A slightly higher proportion of workers in
Massachusetts have pension coverage. In the
Bay State, 58.5 percent of full-time workers
participate in a pension plan, compared with
55.8 percent of workers nationwide.9
While the overall participation rate has
remained static, the nature of pension cover-
age has fundamentally changed over the last
10 years. Traditionally, most people with a
pension had what is called a “defined benefit”
plan. These pensions pay a lifetime annuity at
retirement. For instance, a typical annuity
might be worth $50 per month for each year
of service. So, a worker with 20 years of serv-
ice would receive $1,000 per month at age 65.
In these types of plans, employers finance
benefits at no direct cost to the employee.
Employers also hold the assets in trust, direct
the investments, and ultimately bear the risk.
Today, the world of pensions looks very
different. There has been a huge shift from
traditional pensions (defined benefit plans) to
a new style of pensions (defined contribution
10 THE MASSACHUSETTS INSTITUTE FOR A NEW COMMONWEALTH
ES TABLE 2. Percent of the Private Workforce
Participating in a Pension, 1980 and 2002
MA US
1980 2002 1980 2002
Aged 25-64, full-time only 63.9 58.5 61.8 55.8
Aged 25-64, all workers 49.0 51.6 50.7 48.7
All ages, all workers 42.7a 44.8 40.7 41.1
Source: Authors’ calculations using the March CPS, 1980 and 2002.a. The Massachusetts coverage figure comes from the 1981 survey.
ES FIGURE 5. Social Security Benefits for the
Average Earner, 2003
Source: Social Security Administration
ES TABLE 1. Percent of Men and Women Claiming Social Security
Benefits, by Age, 2001
AGE 62 AGE 63-64 AGE 65 AGE 66+ TOTAL
Men 53.6 21.5 20.7 4.1 100.0
Women 57.6 20.9 14.4 7.2 100.0
Source: U.S. Social Security Administration. 2002b. Social Security Bulletin, Annual Statistical Supplement.Table 6.B5. Washington, D.C.: U.S. Government Printing Office, (December). http://www.ssa.gov/policy/docs/statcomps/supplement/2002/supp02.pdf.
15,000
12,500
10,000
7,500
5,000
2,500
0
Retire at Age 62 Retire at Age 65
$11,051
$13,814
Dolla
rs

plans)—most often a 401(k). Since 1992, of
all the households with pension coverage, those
covered by a traditional pension plan decreased
from about 40 percent to 20 percent. During
this same period the percent of households
with a 401(k)-type pension increased 20 per-
centage points, from 38 to 58 percent.
The new type of pension shifts a substantial
portion of the responsibility for retirement
income to the employee. First, unlike the tradi-
tional pensions, participation in these plans is
voluntary. Second, an employee must sacrifice
money today to save for retirement. If an employ-
ee decides to participate, he or she must deter-
mine how much to contribute, how to invest
the assets, and, at the time of retirement, how
to use the assets, which are generally received
as a lump sum. Moreover, workers can with-
draw money from their 401(k) before they retire,
although they pay a steep penalty fee to do so.
In theory, workers could accumulate sub-
stantial pension wealth under 401(k) plans.
But in practice, they do not. Nationally, the aver-
age household approaching retirement has
accumulated only $55,000—not much money
to support a couple for two decades. In the new
world of retirement, almost all of the burden
of saving and investing for retirement falls on
employees, and many make poor choices or
mistakes at every step. One-quarter of those
eligible do not even participate in a plan. Of
those who do participate, less than 10 percent
contribute the maximum amount of money
allowable by law. Further, over half of partici-
THE GRAYING OF MASSACHUSETTS 11
ES FIGURE 6. Types of Pension Coverage
Source: Authors’ calculations from the Survey of Consumer Finances.
2002 1992
BothBothTraditional
Pension
Traditional Pension
401(k)-Style Pension
401(k)-Style Pension
The Retirement System for Massachusetts Public Employees
Unlike their counterparts in other states, the nearly 290,000 public employees in Massachusetts
are not covered by Social Security. When Social Security was originally passed, there were consti-
tutional concerns about the federal government’s ability to tax the individual states. However, as
Social Security expanded over the next thirty years, coverage was extended to public employees
on a voluntary basis. Only Nevada, Ohio, and Massachusetts opted to stay out of Social Security
and instead provide state and local employees with their own defined benefit pension plans.
The Massachusetts pension plan for public employees has both some advantages and disad-
vantages relative to the Social Security system. The benefits of the Massachusetts system are
quite generous, but it is important to remember that they replace both Social Security and private
pensions for these workers. In addition, the state provides health and life insurance for almost all
public employees. On the other hand, the state plan lacks several important features of Social
Security. The most important is inflation protection. Social Security benefits are adjusted annually
for increases in the cost of living. In contrast, the state system makes some ad hoc adjustments
on the first $12,000 of benefits. Second, Social Security pays at least 50 percent of the employee
benefit to spouses without sufficient earnings to claim a higher benefit on their own. The state
system provides no such allowance. Finally, the Massachusetts system offers more limited survivor
benefits for young widows and widowers.

pants fail to diversify their investments, and
almost none re-balance their investments as
they age or in response to market returns.
Finally, many cash out of their 401(k) when
they change jobs, paying substantial penalties
and wiping out their retirement nest egg.
These problems underscore the fundamen-
tal challenge of shifting all of the responsibili-
ty for managing one’s pension to the individ-
ual worker. At best, these are difficult finan-
cial decisions for people to manage on their
own. Considering the magnitude of the shift,
the accompanying financial education has
been meager, despite research indicating its
positive impact on people’s savings behavior.10
Still, those with pensions are the lucky ones;
about one-third of all full-time workers in
Massachusetts work for employers who do not
offer any form of pension coverage.
Individual Savings
In 2001, individual savings, the third leg of
retirement, were at their lowest rate since
the Great Depression. In 1980, the personal
savings rate was 10 percent of disposable per-
sonal income, and in 2001, it was just over 2
percent. According to a recent national survey,
about 4 in 10 workers are currently not saving
any money for retirement.11 Moreover, the
amount of assets that families do have is rela-
tively small. According to the 2001 Survey of
Consumer Finances, excluding the value of a
person’s primary home, the median value of
family assets is only $47,000. The amount of
savings varies by a person’s age. For workers
between the ages of 45 and 54 years old, prime
earning years for retirement savings, 30 per-
cent have saved less than $25,000 (excluding
the value of a primary residence).12 These data
indicate that few boomers have enough money
to bridge the inevitable gap between Social
Security and pensions and what they will need
to maintain their current standard of living in
retirement.
In short, we are currently in a transition to
a new set of rules for retirement. In the new
world, people will have to defer retiring until
they are 67 years old, compared to the average
age of retirement of 62 today, or be prepared
to collect substantially less money each year
from Social Security. Individuals will also
have to take much greater responsibility for
saving and managing their retirement money.
Many of the 1.87 million baby boomers in
Massachusetts who are on the brink of retire-
ment age will be caught between the old and
new rules of retirement.
Older Women Are Most at Risk
Women, and especially women living on
their own, are the most at risk for not having
enough money in retirement, and as a
consequence, living in poverty. Non-married
women account for 71 percent of all senior
12 THE MASSACHUSETTS INSTITUTE FOR A NEW COMMONWEALTH
ES FIGURE 7. Personal Saving in the United States as a Percentage
of Disposable Personal Income, 1950-2003
Source: Bureau of Economic Analysis. 2003. National Income and Product Accounts (NIPA) data.http://www.bea.gov/bea/dn/nipaweb/SelectTable.asp?Selected=Y
0%
2%
4%
6%
8%
10%
12%
1950 1955 1960 1965 1970 1975 1980 1985 1990 1995 2000

households in Massachusetts who live in
poverty. About 10,300 single women over
age 65 (28%) live at or near the poverty line.
The two main reasons that so many women
end up poor are: 1) the retirement system in
our country is based on earnings and women
tend to have low earnings; and 2) women live
longer than men, and the retirement income
of married women drops significantly when
their husbands die.
The Low Earnings of Women
Women have low lifetime earnings compared
to men because: 1) they have lower wages; 2)
they are more likely to work part-time; and 3)
they spend fewer years in the labor force. In
Massachusetts, the earnings of female full-
time workers equal only 74 percent of their
male counterparts. The wage gap is due to a
number of factors, including different work
histories, different levels of education, differ-
ent occupations, possible gender discrimina-
tion, etc. In addition, because more than twice
as many women work part-time compared
with men (25% vs. 11%), their lifetime earn-
ings are lower. Finally, of the women who
retired in 1999, the typical woman worked 32
years compared with 44 years for the typical
man. Lower lifetime earnings lead to low ben-
efits for women, both in terms of Social
Security benefits and pension benefits.
Women Live Longer
Married women who share their husbands’
benefits fare better than single women. But
even the situation for married women is pre-
carious, because women tend to live longer
than men. Because the life expectancy for a
65-year-old woman is 19.6 years compared with
16.6 years for a similar man, many women end
up widowed. When the husband dies, the cou-
ple’s Social Security benefit is reduced between
one third and one half. The couple’s private
pension is either reduced or completely disap-
pears. Upon the death of their husbands,
women suffer a severe decline in their income.
The Financial Future for Older Women
Because more women are working, in the
future, women will have higher earnings,
which will tend to improve their retirement
income prospects. However, the large increas-
es in divorced and never-married women are
likely to negatively affect women’s financial
security because of their lower earnings. In
addition, a greater reliance on 401(k) plans
does not bode well for women because of the
low balances in these accounts. The financial
future for women appears to be a mixed story,
but it seems likely many will continue to be at
risk for poverty.
What Does This Mean for Massachusetts
Families?
The story for Massachusetts families is a mixed
one. Overall, the changes in the retirement
system will affect Massachusetts families in
much the same way that they will affect their
peers across the nation. The impact of the
increase in the Social Security age and the
change in the nature of pensions should be
the same for families here as they are for fam-
ilies elsewhere. There are some indications,
however, that Massachusetts workers may
have some advantages in making the transi-
tion to the new world of retirement.
First, Massachusetts families might not be
THE GRAYING OF MASSACHUSETTS 13
women are the most at risk for not having enough
money in retirement.

as strapped financially as their national coun-
terparts. Massachusetts households have
higher incomes—20 percent above the nation-
al average in 2000. Of course, this average
conceals the vulnerable members of the Com-
monwealth—those who have low incomes,
poor health, and little or no higher education.
In addition, income inequality is more extreme
in Massachusetts than in most other states.
The cost of living in Massachusetts is also
higher than in other parts of the country, which
eats into our incomes. Still, our higher earnings
and income suggest that Massachusetts resi-
dents, on average, might be more able to save
for retirement on their own than individuals
in other states.
In addition, if Massachusetts families do
not have sufficient money to retire in their
early 60s, they also appear in a better position
to work longer. According to the Health and
Retirement Study, Massachusetts residents
approaching retirement appear to be healthier
than older Americans generally.13 Both men
and women in Massachusetts were half as
likely to report their health status as “poor”
compared with older workers nationally. Older
Massachusetts women were much more likely
to rate their health status as “excellent” or
“very good” (65% versus 53%). Our general
good health will enable workers to work to a
more advanced age, if they need to.
Moreover, the mix of jobs in Massachusetts
is less physically demanding than in the nation
as a whole. In 2000, only 30 percent of jobs in
the Bay State were considered physical, com-
pared with 39 percent of jobs nationally. For
obvious reasons, jobs that require less physi-
cal activity tend to be a better fit for older
workers. Finally, that Massachusetts workers
are highly educated makes them attractive to
employers. In 2000, one-third of all Bay State
residents age 25 and older had at least a bach-
elor’s degree, compared with about one-quar-
ter of all U.S. residents, and the gap in educa-
tional attainment between older and younger
workers is diminishing.
There is some indication that older workers
in Massachusetts (and across the nation) have
begun to adjust to the new rules. In recent
years, older workers (ages 55 to 64) appear to
14 THE MASSACHUSETTS INSTITUTE FOR A NEW COMMONWEALTH
ES FIGURE 9. Job Status of Workers, 2000
Source: U.S. Bureau of the Census. 2003. Summary Social, Economic, and Housing Characteristics(Massachusetts and U.S. 2000). [Available at: http://www.census.gov/prod/cen2000/phc-2-23.pdfand http://www.census.gov/prod/cen 2000/phc-2-1-pt1.pdf]. Note: “Physical” jobs include the following occupations: Farming, Fishing, and Forestry; Constructionand Maintenance; Production and Transportation. “Less physical” jobs include Service, Sales andOffice, and Management and Professional.
United States Massachusetts
Physical Jobs Less
Physical Jobs
Less Physical
Jobs
Physical Jobs
ES FIGURE 10. Percent of Persons 25 and Over with a Bachelor’s
Degree or More, U.S. and Massachusetts, 1970-2000
Source: Authors’ calculations using the Census one-percent file, 1970, 1980, 1990; U.S. Bureau ofthe Census. 2003. United States: 2000 - Summary Social, Economic, and Housing Characteristics.PHC-2-1. http://www.census.gov/prod/cen2000
1970 1980 1990 2000
MA US
35%
30%
25%
20%
15%
10%
5%
0%
12.4%10.8%
20.5%
16.2%
26.9%
20.3%
33.2%
24.4%
be postponing retirement and/or re-entering
the labor force. Nationally, from 2000 to 2002,
the labor force participation rate for older men
increased from 67.3 to 69.2 percent, and the
rate for older women increased from 51.8 to
55.2 percent. The magnitude of the increase
appears to be even greater in Massachusetts
than in the nation, although we need more
data to verify this trend.14 Given the long-term
trend toward earlier retirement, this increase
in labor force participation by older workers is
noteworthy. While we cannot say for certain
why workers are postponing retirement or re-
entering the labor market, some analysts
believe it is related to the recent downturn in
the financial markets. An interesting question
remains about whether the greater increase of
older Massachusetts workers indicates that
our older workers are better able and willing to
work or whether they have greater financial
anxiety about their future.
One key area where Massachusetts families
are at a disadvantage is homeownership. For
most families, their home represents their
main financial asset in retirement. Massachu-
setts has one of the lowest rates of homeown-
ership in the country. Of the pre-retirement
households (ages 55 to 64 years old), slightly
less than 76 percent of Massachusetts house-
holds own their homes, compared with almost
80 percent of their peers nationwide.15
The Impact of an Aging Population on the
Massachusetts Labor Markets
The challenges of an aging population will not
be limited to individual families. Little noticed
is the profound impact that the shift to an
older population will have on the Massachu-
setts (and national) economy. Absent a sub-
stantial increase in new immigrants, there
could be a shortage of prime-age workers.
This shortage may lead employers to view
older workers as an important source of labor,
which, in turn, has the potential to reshape the
workplace in terms of new types of careers
starting at older ages, more part-time work
opportunities, more opportunities for gradual
retirement, and other changes reflecting an
older workforce.
Labor Shortages Ahead
As the baby boomers age over the next two
decades, older workers will be a growing
portion of the labor force across the country.
Because older workers will still account for a
small fraction of the labor force, the United
States labor force is projected to grow at a rel-
atively slow rate, which suggests a potential
for future labor shortages.
In Massachusetts, despite our current rela-
tively high unemployment rates, future labor
shortages could be even more serious than the
nation’s. Unlike the nation, in Massachusetts
the number of people under age 55 will de-
crease in absolute terms. In 2000, there were
2.86 million people between the ages of 25 and
54 years old in Massachusetts. In 2025, that
number is projected to be 2.60 million people
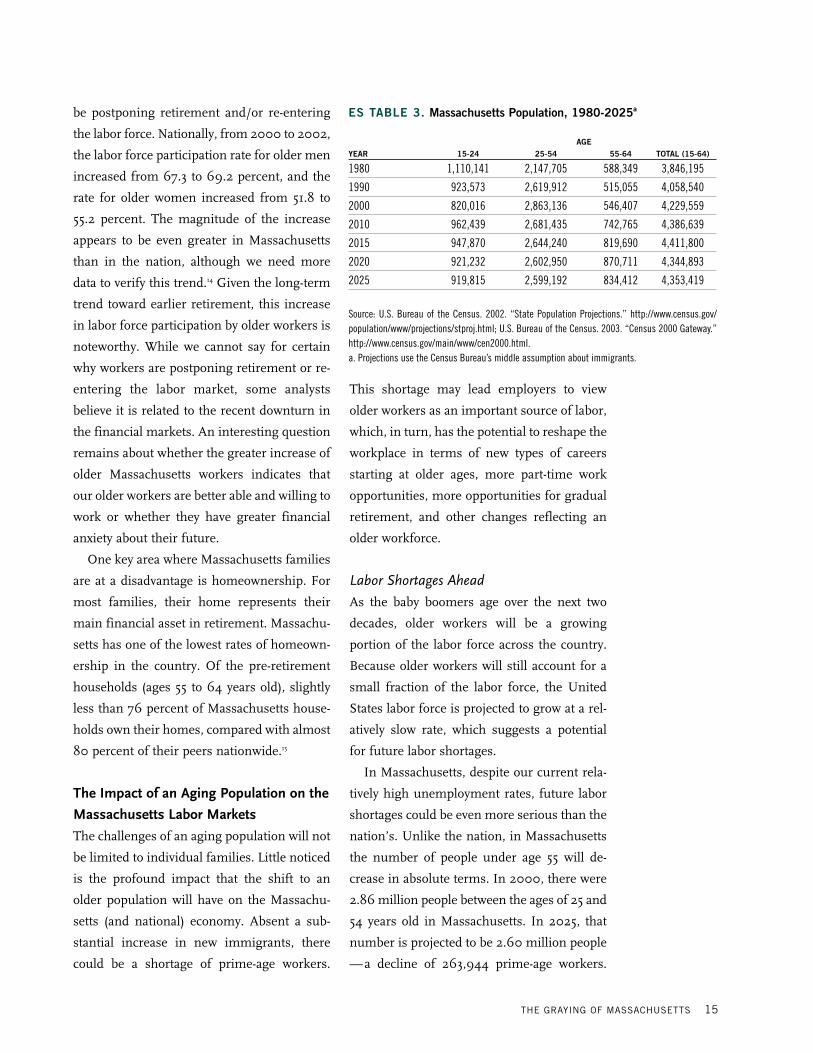
—a decline of 263,944 prime-age workers.
THE GRAYING OF MASSACHUSETTS 15
ES TABLE 3. Massachusetts Population, 1980-2025a
AGEYEAR 15-24 25-54 55-64 TOTAL (15-64)
1980 1,110,141 2,147,705 588,349 3,846,195
1990 923,573 2,619,912 515,055 4,058,540
2000 820,016 2,863,136 546,407 4,229,559
2010 962,439 2,681,435 742,765 4,386,639
2015 947,870 2,644,240 819,690 4,411,800
2020 921,232 2,602,950 870,711 4,344,893
2025 919,815 2,599,192 834,412 4,353,419
Source: U.S. Bureau of the Census. 2002. “State Population Projections.” http://www.census.gov/population/www/projections/stproj.html; U.S. Bureau of the Census. 2003. “Census 2000 Gateway.”http://www.census.gov/main/www/cen2000.html.a. Projections use the Census Bureau’s middle assumption about immigrants.

(This projection assumes the current rate of
immigration, which is fairly high by historical
standards.) If additional workers are not found,
the state’s economic base will shrink, threat-
ening future prosperity.
Massachusetts labor markets will likely
become significantly tighter over the next 20
years. If there is a lack of qualified workers,
the ability of existing firms to expand will be
limited and they may opt to do so elsewhere.
In addition, efforts to recruit new firms could
become increasingly difficult. Although the rest
of the country will also be shifting to an older
population, Massachusetts already suffers from
one of the nation’s lowest labor force growth
rates. Further, there will more young people
in other parts of the country. The bottom line
is that the search for workers is likely to be a top
business concern over the next several decades.
Conventional Sources of Labor Supply
Given the impending shortages, where will
the labor supply come from? Traditional
sources of supplemental workers include:
immigrants, domestic migrants, and women.
As we shall see, these traditional sources will
likely not be sufficient to compensate for the
decline of prime-age workers.
During the 1990s, Massachusetts relied
heavily on immigrants to meet its labor force
needs. In fact, without immigrants, the Massa-
chusetts labor force would have shrunk.16 The
current labor force projections forecasting a
decline of prime-age workers assume the same
immigration patterns of the 1990s. Given
today’s much more restrictive environment, it
is hard to imagine the much higher levels of
immigration that would be needed to solve
future labor shortages.
Domestic migration is also unlikely to yield
enough new workers. Recent MassINC and
UMass research, Mass.Migration, documented
that over the last 12 years, on net, Massachu-
setts lost 213,000 domestic migrants. Even
during the economic boom of the late 1990s
—despite the Bay State’s low unemployment
rates and high vacancy rates—the state lost
more people than it gained every single year.
Thus, neither domestic nor international migra-
tion is likely to solve future labor shortages.
The number of new women workers who
can be lured into the labor market also appears
limited. Massachusetts already outpaces the
rest of the nation in terms of the percentage of
women in the labor force. In the Bay State,
62.3 percent of all women work outside the
home, compared with 59.6 percent of women
across the country. Massachusetts employers
appear to be close to fully tapping into the sup-
ply of women workers, making it unlikely that
they will be able to close the labor force deficit
solely by hiring more women.
Unconventional Sources of Labor Supply:
Older Workers
Older workers—those over the age of 55—are
a less conventional source of labor, but they
may offer a way to stem the impending labor
shortages. Consider that in 2000, there were
546,407 people in Massachusetts between the
ages of 55 and 64. By 2025 that number will
increase by 53 percent to 834,412 people. The
number of Massachusetts residents between
the ages of 65 and 74 is also projected to
increase significantly — from 427,830 in
2000 to 690,777 in 2025.
Because of the high labor force participa-
tion rates of older workers in Massachusetts,
there is an opportunity for older workers to
offset the decline of prime-age workers. In
2003, the labor force participation rate of
workers between the ages of 55 and 64 years
16 THE MASSACHUSETTS INSTITUTE FOR A NEW COMMONWEALTH

old was 72.3 percent. If those rates remain, in
2025 there will be roughly 606,000 older
workers in this age range. There will also be
more workers over the age of 65. These work-
ers could be enough to offset the decline in
prime-age workers and, at the same time,
maintain a growing labor force. It does mean
that the age mix in the workforce will shift to
include a greater number of older workers,
and it is unclear how their presence will alter
the workplace.
Potential Demand for Hiring Older Workers
Three important factors suggest that there
may be a demand for tomorrow’s older work-
ers: 1) older workers are well educated; 2) they
are healthier than in the past; and 3) jobs are
no longer as physically demanding.
The educational gap between older and
younger workers is diminishing. While people
over 65 years old have substantially less edu-
cation than their younger counterparts, the
educational levels for men aged 45 to 64,
which includes the bulk of the baby boomers,
is about the same as levels for younger men.
The picture for women is a bit more compli-
cated, but the gap between older and younger
women is also getting successively smaller.
While older workers have increased levels
of education, whether they have the skills to
fill future jobs is an open question. Over the
next decade, over half of the new jobs in
Massachusetts are projected in professional,
managerial, and technical jobs. This includes
computer analysts, engineers and scientists,
teachers, and health practitioners. Service
workers, such as nursing and home health
aides, cooks, janitors, etc., are the next largest
component of job growth. Of the 345,000 new
jobs projected over the period of 1998 to
2008, over half will require at least a bache-
lor’s degree, and 62 percent will require at
least an associate’s degree. At the same time,
there will also be a large number of replace-
ment jobs—i.e., job vacancies due to workers
who retire, change jobs, or advance up the
career ladders. Many of these jobs will be in
less skilled occupations.
A key factor in determining a person’s job
prospects is the ability to learn new skills or
update existing skills. A common employer per-
ception is that older workers are not as able to
adapt to the changing skills requirement. The
state’s workforce development programs will
need to play a bigger role in helping older
workers attain the skills they need to be com-
petitive in the job market. Changes will be
necessary because, for the most part, these
programs are not currently geared to older
workers. The Blue Ribbon Commission on
Older Workers has offered a number of impor-
tant steps that the workforce development sys-
tem could take to better align the programs
with the needs of older workers.17 For instance,
community-based organizations, plus commu-
nity colleges and other post-secondary institu-
tions, should do more outreach and training
of older workers. As the workforce ages, it is
essential that the state’s training programs
adapt to meet the needs of older workers.
The news is positive when it comes to the
health of the elderly. Today’s elderly are in-
creasingly healthy and getting even healthier.
This should help make them attractive to
employers. Recall that older people in Massa-
chusetts are even healthier than the national
THE GRAYING OF MASSACHUSETTS 17
the state’s job training programs must meet the needs
of older workers.

average. In addition, because the nature of
employment has changed dramatically over
the last 20 years, jobs are now much more
concentrated in knowledge-based activities,
not in physically demanding tasks. This new
generation of older workers should be very
appealing to employers.
Although the stage seems set for hiring
older workers, a number of stumbling blocks
still exist. First, older workers are more expen-
sive for a number of reasons. Their earnings
tend to be higher than those of younger work-
ers—beyond what can be attributed to pro-
ductivity gains. In addition, the cost of bene-
fits such as health insurance also rises with
age. In particular, for jobs that require little
training, the cost of older workers is likely a
serious impediment.
In addition, the structure of the workplace
does not tend to match the preferences of
older workers. Older workers consistently pre-
fer to work part-time, while employers have
traditionally resisted part-time work. Indeed,
during the 1990s, the percent of workers
employed part-time declined and is currently
slightly less than 12 percent of all workers.
Part-time work is concentrated in small busi-
nesses and in companies in the service sector.
If some of the fixed costs associated with hir-
ing and training workers could be reduced,
perhaps part-time workers would look more
attractive. Older workers also prefer phased
retirement, where they gradually reduce their
work effort as they approach retirement. But
few firms offer such an option. For compa-
nies, there are often legal complications con-
cerning the treatment of benefits.
While increased employment of older work-
ers is clearly in the interest of workers and
employers, a number of challenges to capital-
izing on this mutual interest remain.
Concluding Thoughts
Our nation and the Commonwealth are on the
brink of a huge demographic change. Over the
next several decades, the population will age
rapidly. At the same time, the rules of retire-
ment are changing. Because of changes in the
Social Security law and the nature of private
pensions, it is likely that most people will no
longer be able to retire in their early 60s as
they have been doing for the last 20 years.
While there are some indications that Massa-
chusetts families might be better positioned to
transition into the new world of retirement by
working longer, transitions such as this one
are difficult. It will require attitudinal and behav-
ioral shifts at all levels of society, including
individuals, employers, and policymakers.
There are clearly a number of ways that the
federal government, as the biggest provider of
income and services to older citizens, can help
ease this transition for families. Putting the
finances of Social Security and Medicare on
sound long-term footing is critical. While the
federal issues are critical, they have already
attracted significant policy attention. In con-
trast, there has been much less of a focus on
issues at the state level, both within and out-
side of government. Our goal is to get busi-
ness, labor, and community leaders and peo-
ple at all levels of government to work togeth-
er to help families better prepare for retire-
ment and, at the same time, prepare the
Commonwealth for its aging population.
18 THE MASSACHUSETTS INSTITUTE FOR A NEW COMMONWEALTH
how can we best prepare families to take greater
responsibility in managingtheir retirement savings?

The key issues at the state level include:
How can we best prepare families to take
greater responsibility in managing their retire-
ment savings? How can we make it as easy as
possible for employers to offer a pension plan,
ideally with some form of a matching contri-
bution? And, finally, how can we help older
workers remain competitive in the job market
and help employers find the employees they
need? To start the conversation, we offer six
ideas for action:
� Increase access to retirement savings
plans at the workplace.
About one-third of full-time workers in Massa-
chusetts do not have access to any form of
pension—including a 401(k)—at their current
place of employment.18 Saving works best when
it is directly deducted from a paycheck, and
the limits on personal IRAs are much lower
than those of 401(k)s. Given these realities,
efforts to expand access should focus on the
workplace.
Not surprisingly, workers at small busi-
nesses are the least likely to have pension cov-
erage. Among the reasons that small employ-
ers offer for not providing coverage are: high
employee turnover and the preference of their
employees for cash wages, the cost of setting
up and administering the account, and uncer-
tainty about future earnings. Efforts to increase
access have focused on federal law and policy.
However, there are opportunities at the state
level for creative policymaking. There is a
range of possible ways to expand pension cov-
erage. Ideas include:
• Business associations offering group
retirement savings plans, like the group health
care plan model, for its members to help
reduce the cost for individual businesses;
• Using its power of persuasion, the state
playing an intermediary role connecting small
businesses and financial institutions;
• Allowing small employers to participate in
the state’s 457-pension plan.
These are complex ideas that require con-
sensus. To do this, government should con-
vene a task force of small businesses, regional
chambers of commerce, business associa-
tions, financial institutions, and other stake-
holders to develop a strategy to help more
small businesses offer private pensions. The
goal of this taskforce should be to create a plan
to increase pension access that includes out-
reach to small businesses.
�Employers should consider ways to help
increase employee participation and help
employees manage their retirement savings.
Employers have an opportunity to help their
workers better plan for retirement. About one-
quarter of eligible workers do not participate
in 401(k)s, and of those who do participate,
their account balances tend to be low. There
are a number of ways employers can encour-
age employees to participate. First, research
indicates that participation rates are higher
when there is an employer match. Whenever
possible, as many already do, employers should
share in the responsibility of helping workers
prepare for retirement.
In addition, some employers offer what is
called “automatic enrollment” (or “presumptive”
enrollment) in 401(k)s. In these companies,
an eligible employee is automatically enrolled
in a 401(k) plan with a specific percentage of
their salary deducted and deposited in the
retirement account. Employees are, of course,
free to opt out of the plan or change the amount
of the deduction at any time, but few actually
do so. Rather, research finds that automatic
enrollment can have a dramatic effect on retire-
THE GRAYING OF MASSACHUSETTS 19

ment savings.19 Automatically deducting money
from a worker’s salary should never be taken
lightly, even if the money is for the worker’s
own retirement. In companies that offer an
employer match, however, employees who do
not participate are sacrificing a portion of their
benefits. These employers, in particular,
should consider trying automatic enrollment.
Again, if they do so, employees must be fully
informed and able to opt out easily.
�The state should take a more active role
in the financial education of its citizens.
Everyone agrees that more financial education
is necessary. The changes to the new rules of
retirement have happened with virtually no
accompanying financial education, despite the
evidence that such efforts do make a positive
difference. State government, labor unions,
business associations, employers, and com-
munity-based organizations all have a role to
play in this public education effort.
With its large-scale convening powers, the
state is in a unique position to offer leadership
on such an effort. The goal is not to offer in-
vestment advice, but rather to give people a
wake-up call and offer general information
about the need to save, possible savings vehi-
cles, etc. There are already many existing offices
and organizations within government that could
sponsor these programs. For several years, the
Office of the State Treasurer has offered finan-
cial education programs focused on young
people and women. These efforts could be
expanded to include retirement planning for
all ages. One option could be a new Retirement
Planning Initiative, using the visibility of top
elected officials to shine a light on this issue.
Part of this initiative should include a market-
ing campaign to highlight the benefits of sav-
ing for retirement.
The workplace is the best place to reach
workers. While most large employers already
offer some form of financial education, there
is a gap at many small businesses. In partner-
ship with regional Chambers of Commerce,
business associations, and small employers,
the state should consider spearheading an
effort to offer retirement financial education
for employees at small businesses. Most of
this work could be done through the existing
infrastructure with little additional funding. If
additional funds are needed, corporate or
foundation support could be sought. The state
could also consider spinning off the financial
education component, once it is established,
into its own nonprofit, as the state of Delaware
did in 2001. An independent nonprofit offers
better fundraising opportunities, but it is crit-
ical that the state provide oversight and quali-
ty control.
�For individuals, we hope this report serves
as a wake-up call.
In the new world of retirement, individuals
must take more responsibility for their retire-
ment finances. Fading fast are the days when
workers could retire in their early 60s, expect-
ing Social Security and private pensions to pro-
vide them with most of the income they need.
Baby boomers and younger generations will
need to save more on their own and manage
that money wisely. They will also need to com-
mit themselves to lifelong learning. Today’s
workers need to constantly upgrade their skills,
and, whatever their age, they must be able to
adapt to the demands of the workplace.
20 THE MASSACHUSETTS INSTITUTE FOR A NEW COMMONWEALTH

�The workforce development system
should improve opportunities for job
training of older workers.
Historically, the workforce development system
has focused on younger workers, displaced
workers, and low-skilled workers. As the work-
force ages, the state’s job training and post-
secondary education programs must adapt to
meet the needs of older workers. Programs
and services should be designed to accommo-
date the physical challenges faced by many
seniors. In addition, a key factor in determin-
ing a person’s job prospects is the ability to
learn new skills or update existing skills. The
state’s workforce development programs could
play a bigger role in helping older workers
attain the skills they need to be competitive in
the job market. In order to change the status
quo, the State Workforce Investment Board
and the Board of Higher Education should
develop a specific focus on older workers, led
by the Department of Labor and Workforce
Development. The Department should track
the number of older workers served by the
Career Centers. It should develop a strategy
for additional outreach to older workers. And,
finally, it should evaluate the outcomes of
older workers who are served by state- funded
workforce development programs.
�Policymakers and civic leaders should
initiate an ongoing statewide conversation
about the implications of the aging
Commonwealth.
The topics addressed in this report are just the
beginning. The shift to an older population
will affect our communities in many different
ways. It will influence housing, transporta-
tion, public safety, workforce development,
volunteerism, and health care. There is a criti-
cal window of opportunity to prepare for these
changes. The Executive Office of Elder Affairs
is beginning some of this work through its
Boomer Ready Initiative, which will help pre-
pare municipalities for the aging population.
Such efforts are critical. Policymakers should
initiate an ongoing public conversation with
business and labor leaders, local officials, non-
profit organizations, foundations, and civic
leaders about the upcoming demographic
changes and what they will mean for the
Commonwealth.
THE GRAYING OF MASSACHUSETTS 21

ENDNOTES1. Peter G. Peterson. 1996. Will America Grow Up Before it Grows
Old?: How the Coming Social Security Crisis Threatens You, YourFamily, and Your Country. Random House.
2. In this report, the average retirement age is defined as theyoungest age at which half of the population is out of the laborforce.
3. Our special thanks to Andrew Sum and his colleagues at theCenter for Labor Market Studies at Northeastern University forsupplying the Massachusetts retirement data. Their work alsoshows that the average age of retirement varies by the educa-tion of the worker. The average age of retirement for male work-ers with a master’s degree is 67-68 years, compared with 60-61years for workers who lack a high school diploma.
4. VanDerhei, Jack L. and Craig Copeland. “2002 MassachusettsFuture Retirement Income Assessment Project: Third Draft.”Mimeo. Washington, D.C.: EBRI Education and Research Fund.
5. Princeton Survey Research Associates. 2003. The Pursuit ofHappiness: A Survey on the Quality of Life. MassINC.
6. AARP considers health insurance to be the fourth leg of retire-ment, with Medicare covering major expenses but supplementalinsurance as an additional need for most retirees.
7. "Typical" household refers to households in the middle quintileof the income distribution.
8. These amounts are actuarially fair, meaning that the averageindividual will receive the same lifetime benefit regardless ofwhat age they start claiming benefits.
9. The data refer to individual workers at one point in time. Over alifetime and on a household— rather than an individual—basis, coverage rates are somewhat higher. In addition, cover-age varies by income, with high-income households havingmuch more coverage.
10. Choi, James, David Laibson et al., Defined Contribution Pensions:Plan Rules, Participant Decisions, and the Path of Least Re-sistance, NBER Working Paper No. w8655, December 2001.
11. Employee Benefit Research Institute, American SavingsEducation Council, and Mathew Greenwald & Associates, Inc.,2004 Retirement Confidence Survey.
12. Ibid.
13. According to the survey, those Massachusetts residents whowere aged 51-61 in 1992 appeared to be healthier than olderAmericans generally.
14. The labor force participation rate comes from the Current Pop-ulation Surveys. Because of the small sample size for Massa-chusetts, we need additional years of data to determine therobustness of this finding.
15. Depending on the educational level of the household, the gapsin the rates of homeownership are either much larger or non-existent. The rates of homeownership among the Common-wealth’s better educated households are comparable to theirnational peers, but those for the less educated households aresignificantly lower than their national peers. Our thanks toAndrew Sum and his colleagues at the Center for Labor MarketStudies at Northeastern University for sharing this insight.
16. Sum, Andrew M., W. Neal Fogg, et al. 1999. The ChangingWorkforce: Immigrants and the New Economy in Massachu-setts. MassINC.
17. Commonwealth of Massachusetts Blue Ribbon Commission onOlder Workers. 2000. Older Workers: An Essential Resource forMassachusetts.
18. Our special thanks to Nelson Gerew at the Federal ReserveBank of Boston for supplying us with this number.
19. Choi, James, David Laibson, et al., For Better or For Worse:Default Effects and 401(k) Savings, NBER Working Paper No.w8651, December 2001.
22 THE MASSACHUSETTS INSTITUTE FOR A NEW COMMONWEALTH

�The Graying Population:
“A Nation of Floridas”
Today, 1 out of every 8 people in the United
States is 65 years or older. In 2030, 1 out of
every 5 people will be 65 years or older. . .32*
In Massachusetts, today, 1 out of every 7 peo-
ple is 65 years or older. . . . . . . . . . . . . . . .34
The Northeast is the oldest region in the
country, and Massachusetts is the 12th oldest
state. . . . . . . . . . . . . . . . . . . . . . . . . . . . . . .35
Barnstable and Berkshire are the oldest coun-
ties in the state. Nantucket and Suffolk coun-
ties are the youngest . . . . . . . . . . . . . . . . . .35
In Massachusetts, women account for over 68
percent of the residents who are 80 years or
older . . . . . . . . . . . . . . . . . . . . . . . . . . . . . .35
The most rapid increase in the number and
share of people over 65 years old will take
place between 2010 and 2030 . . . . . . . . . .34
�How Well Prepared Are Families for
Retirement?
Financial planners estimate that retired
households need 65 to 85 percent of their pre-
retirement income to maintain their standard
of living . . . . . . . . . . . . . . . . . . . . . . . . . . .39
The average retirement age has declined dra-
matically among men for much of the last
century. In 1910, the average retirement age
was 74 years old for men. Today, it is 63 years
old for men and 61 years old for women. In
Massaschusetts, the average retirement age is
slightly higher . . . . . . . . . . . . . . . . . . . . . .63
In recent years, however, more older people
are working. Between 2000 and 2002, labor
force participation rates of workers aged 55
to 64 increased by about 2-3 percentage points
. . . . . . . . . . . . . . . . . . . . . . . . . . . . . . . . . .73
Some studies indicate that one reason for
the increased labor force participation of
older workers is the decline in stock market
wealth . . . . . . . . . . . . . . . . . . . . . . . . . . . . .74
Up to the 1990s, the retirement income sys-
tem provided financial incentives for early
retirement, but in recent years, many of those
incentives have been eliminated . . . . . . . .69
Financial incentives influence workers’ deci-
sions about when to retire . . . . . . . . . . . . .70
In 2008, the oldest baby boomers will begin to
retire. At that time, the boomers will begin to
shift from ages when most people work to
ages when most people withdraw from the
labor force . . . . . . . . . . . . . . . . . . . . . . . . . .27
Social Security
In 2001, Social Security was by far the largest
asset of the typical household approaching
retirement. Social Security accounts for nearly
two-thirds of retirement income for the typical
household . . . . . . . . . . . . . . . . . . . . . . . . .40
As people get older, Social Security accounts
for a larger and larger share of their income.
. . . . . . . . . . . . . . . . . . . . . . . . . . . . . . . . . .42
Most people start collecting Social Security at
age 62. More than 75% of people start collect-
ing their benefits before they turn 65 . . . .41
THE GRAYING OF MASSACHUSETTS 23
Findings
*Refers to page number.

In 2003, an average earner who starts collecting
Social Security at age 62 will receive $11,051
per year. A person who waits until age 65 will
collect $13,814 per year. . . . . . . . . . . . . . . .41
The Normal Retirement Age for Social Security
is gradually increasing from age 65 to age 67
. . . . . . . . . . . . . . . . . . . . . . . . . . . . . . . . . .42
The premiums for Medicare Part B, which are
automatically deducted from Social Security
benefits, are scheduled to increase, which will
decrease the amount of people’s Social
Security benefits . . . . . . . . . . . . . . . . . . . . .43
Today, only about 20 percent of Social
Security recipients pay taxes on their benefits.
Going forward, a significantly higher percent-
age will be subjected to taxes . . . . . . . . . . .43
Private Pensions
About half of private sector workers participate
in employer-sponsored pension plans . . . .44
Massachusetts workers have slightly higher
pension coverage, but still more than 40 per-
cent of full-time workers lack pension cover-
age . . . . . . . . . . . . . . . . . . . . . . . . . . . . . . .45
Over the last 20 years, pension coverage has
generally decreased for male workers and
increased for female workers . . . . . . . . . . .45
Participation in pensions is closely correlated
with earnings, with greater coverage for work-
ers in the top earnings quintile . . . . . . . . .45
The nature of pension coverage has shifted over
the last twenty years from defined benefit pen-
sions to defined contribution pensions. . .46
In 2001, of those households with pensions,
58 percent had a defined-contribution pension
plan—most often a 401(k) . . . . . . . . . . . .46
One-quarter of those eligible to participate in
retirement plans do not . . . . . . . . . . . . . . .46
Balances in 401(k) plans are surprisingly low
—the average balance of households approach-
ing retirement (ages 55-64) is $55,000 . . .46
Individual Savings
The personal savings rate of 2001 was at its
lowest point since the Great Depression . .49
In 2001, the personal savings rate, as a percent-
age of disposable income, was just over 2 per-
cent, compared with 10 percent in 1980 . .49
Outside of employer-sponsored pensions, peo-
ple seem to have almost no additional savings.
. . . . . . . . . . . . . . . . . . . . . . . . . . . . . . . . . .50
�What does This Mean for
Massachusetts Families?
The median Massachusetts household in-come
is 20 percent higher than the national average
. . . . . . . . . . . . . . . . . . . . . . . . . . . . . . . . . .36
Massachusetts residents approaching retire-
ment are healthier than older Americans gen-
erally . . . . . . . . . . . . . . . . . . . . . . . . . . . . . .36
Massachusetts workers have higher levels of
educational attainment than their national
counterparts . . . . . . . . . . . . . . . . . . . . . . . .36
The jobs in Massachusetts are less physically
demanding than those in the rest of the nation
(39% vs. 30%) . . . . . . . . . . . . . . . . . . . . . . .36
24 THE MASSACHUSETTS INSTITUTE FOR A NEW COMMONWEALTH

More workers in Massachusetts remain in the
labor force at older ages compared with their
national counterparts . . . . . . . . . . . . . . . . .74
The homeownership rates for older Massa-
chusetts households is 10 percent lower than
that of their national counterparts . . . . . . .37
Employee Benefit Research Institute (EBRI)
research finds that regular unreimbursed
health care costs sharply reduce the share of
Massachusetts households with adequate
income at retirement . . . . . . . . . . . . . . . . .50
The System for Massachusetts Public
Employees
Unlike most other states, the nearly 290,000
public employees in Massachusetts are not
covered by Social Security . . . . . . . . . . . . .48
Relative to Social Security, there are both
advantages and disadvantages to the state’s
pension plan . . . . . . . . . . . . . . . . . . . . . . .48
�Older Women are Most At Risk
Old-age poverty in the Commonwealth, as in
the nation, is concentrated among single
women . . . . . . . . . . . . . . . . . . . . . . . . . . . .55
Non-married women account for 71 percent of
all older Massachusetts residents living in
poverty. In 2000, 28 percent of single older
women in Massachusetts (about 10,312 state-
wide) are either poor or near poor. . . . . . . .55
Women are at greater risk of old-age poverty
because the retirement income system in the
country is based on earnings. Women have low
earnings because they have lower wages, they
are more likely to work part-time, and they
spend fewer years in the labor force . . . . .56
Massachusetts is ahead of the nation in terms
of labor force participation of women, espe-
cially for older women . . . . . . . . . . . . . . . .82
Because the life expectancy for women at age
65 is 19.6 years compared with 16.6 years for
men, most women end up widowed. When a
husband dies, the couple’s Social Security ben-
efit is cut between one-third and one-half, and
the couple’s private pension either disappears
completely or is reduced . . . . . . . . . . . . . .58
Since more women are working, women will
have higher future earnings, and perhaps
more savings and pension benefits. . . . . .60
On the other hand, the number of divorced
women and never-married women has
increased, and both groups have high poverty
rates. In addition, some of the changes in
Social Security and the nature of pensions are
likely to adversely affect women . . . . . . . .60
�The Impact of an Aging Population on
the Massachusetts Labor Markets
Older workers will constitute an increasing
proportion of the labor force over the next two
decades . . . . . . . . . . . . . . . . . . . . . . . . . . . .77
All of the growth in the Massachusetts labor
force over the next two decades will come
from older workers . . . . . . . . . . . . . . . . . . .78
Nationally, the number of younger workers
will remain constant between 2010 and 2025
. . . . . . . . . . . . . . . . . . . . . . . . . . . . . . . . . .78
In Massachusetts, the number of people
under age 55 is projected to decline in absolute
numbers between 2010 and 2025 . . . . . . .78
THE GRAYING OF MASSACHUSETTS 25

Massachusetts labor markets will likely become
significantly tighter over the next 20 years,
and there could be labor shortages . . . . . .78
Conventional sources of labor are unlikely to
compensate for this decline . . . . . . . . . . . .78
Current levels of immigration are already rel-
atively high, and the projected decline of prime-
age workers already assumes a substantial
number of new immigrants . . . . . . . . . . . .79
Given the state’s historic patterns of domestic
out-migration, it seems unlikely that domestic
migrants will fill the gap . . . . . . . . . . . . . .80
Massachusetts employers already appear
close to fully tapping the supply of women
workers . . . . . . . . . . . . . . . . . . . . . . . . . . . .81
Older workers are a less conventional source
of labor, but they may offer a way to stem the
impending labor shortages . . . . . . . . . . . . .83
Both part-time work and self employment
are much more common among older work-
ers. . . . . . . . . . . . . . . . . . . . . . . . . . . . . . . .72
Older workers in Massachusetts are more
likely to be working part-time and less likely to
be self-employed than their national counter-
parts . . . . . . . . . . . . . . . . . . . . . . . . . . . . . .72
Potential Demand for Older Workers
Older workers are well-educated. The educa-
tional gap between older and younger workers
is diminishing. . . . . . . . . . . . . . . . . . . . . . .83
Older workers are healthier than in the past.
The share of the elderly with severe disabili-
ties has declined . . . . . . . . . . . . . . . . . . . . .84
Across the nation, jobs are no longer as phys-
ically demanding. In Massachusetts, there is
an even greater concentration of knowledge-
based jobs than in other states . . . . . . . . . .85
Impediments to Hiring Older Workers
Older workers are expensive. Their earnings
are higher than those of comparable younger
workers, and the cost of benefits also rises
with age . . . . . . . . . . . . . . . . . . . . . . . . . . .85
Older workers may not have the required
skills for the jobs . . . . . . . . . . . . . . . . . . . .88
Employers resist part-time employment, while
older workers prefer it . . . . . . . . . . . . . . . .90
Few firms offer phased retirement, which
many older workers desire . . . . . . . . . . . . .92
Older workers must combat age discrimina-
tion . . . . . . . . . . . . . . . . . . . . . . . . . . . . . . .94
Regulatory restrictions constrain employers in
implementing flexible work arrangements
that appeal to older workers . . . . . . . . . . . .92
26 THE MASSACHUSETTS INSTITUTE FOR A NEW COMMONWEALTH

June 2004
Dear Friend:
MassINC is proud to present The Graying of Massachusetts: Aging, the New Rules of Retirement, and theChanging Workforce, a report produced in partnership with the Center for Retirement Research at BostonCollege and made possible by the generous support of Blue Cross Blue Shield of Massachusetts.
MassINC is at the leading edge of a huge demographic shift to a much older population. At the same time,the rules of retirement have changed, shifting much of the responsibility onto individual families. Thischange occurs as many of the state’s 1.87 million Baby Boomers are getting ready to start retiring. Ourresearch indicates that many people are not prepared for the new world and instead are falling through thecracks as the nature of pensions have rapidly changed from traditional pensions to employee-directed plans like401(k)s. A stunning number of full-time workers do not have access to any form of 401(k) or other pensioncoverage from their current employer, and about one-quarter of those who have access to a 401(k) don’t useit. In addition, savings rates remain at historic lows, and the average 401(k) balance is relatively small forhouseholds approaching retirement.
All of these changes point to a reversal of a 20-year trend. Since the mid-1980s, American workers havebeen retiring in their early 60s. Going forward, it is likely that workers will have to delay their retirement.There is a bit of a silver lining to this grim picture. It appears that Massachusetts residents are better equippedthan their peers across the country to adjust to the new rules by working longer: Bay State residents arehealthier, better educated, and our jobs are less physically demanding.
Finally, the shift to an older population has huge implications for the Massachusetts labor market. Absent asubstantial increase in new immigrants, there could be a shortage of prime-age workers. In Massachusetts,over the next 25 years, the number of people under age 55 will decline in absolute terms. Older workers mayoffer a way to stem the impending labor shortages, but a number of challenges exist be able to capitalize onthis mutual interest.
In presenting these findings, we owe a debt of gratitude to our partners: Alicia Munnell, Kevin Cahill, AndrewEschtruth, Steven Sass and their colleagues who conducted the research. We would also like to thank themany reviewers whose critical insights have strengthened the final report. Lastly, we owe special thanks toDana Ansel, MassINC’s Research Director, for her excellent work in conceptualizing this important researchand shepherding it to such a successful conclusion. Finally, we would like to thank our sponsors at BlueCross Blue Shield of Massachusetts, who have been generous and enthusiastic partners, encouraging theauthors to go where the data led them.
We hope you find The Graying of Massachusetts an informative and timely resource. We believe policymakersand civic leaders across the state should initiate a conversation about the implications of an aging Common-wealth. As always, we welcome your feedback and invite you to become more involved in MassINC.
Sincerely,
Ian Bowles Gloria Cordes Larson Peter MeadePresident & CEO Co-Chair Co-Chair

EXECUTIVE SUMMARY . . . . . . . . . . . . . . . . . . . . . . . . . . . . . . . . . . . . . . . . . . . . . . . . 5Key Facts . . . . . . . . . . . . . . . . . . . . . . . . . . . . . . . . . . . . . . . . . . . . . . . . . . . . . . . 9
FINDINGS . . . . . . . . . . . . . . . . . . . . . . . . . . . . . . . . . . . . . . . . . . . . . . . . . . . . . . . . . 23
CHAPTER 1: Introduction . . . . . . . . . . . . . . . . . . . . . . . . . . . . . . . . . . . . . . . . . . . . 27
CHAPTER 2: The Population is Graying Rapidly . . . . . . . . . . . . . . . . . . . . . . . . . 32
CHAPTER 3: Traditional Income Sources Will Fall Short . . . . . . . . . . . . . . . . . 39
CHAPTER 4: Older Non-Married Women Are Most At Risk . . . . . . . . . . . . . . . 55
CHAPTER 5: The Work-Retirement Divide . . . . . . . . . . . . . . . . . . . . . . . . . . . . . 63
CHAPTER 6: Will Older People Want to Work Longer? . . . . . . . . . . . . . . . . . . . 68
CHAPTER 7: Will Employers Want Older Workers? . . . . . . . . . . . . . . . . . . . . . . 77
CHAPTER 8: Meeting the Challenge of An Aging Population . . . . . . . . . . . . . 98
ABOUT THE AUTHORS . . . . . . . . . . . . . . . . . . . . . . . . . . . . . . . . . . . . . . . . . . . . . . 103
THE GRAYING OF MASSACHUSETTS 3
TABLE OF CONTENTS

MassINC wishes to express its thanks to those individuals and organizations whose financial support makes our work possible. Your generosity is deeply appreciated.
MassINC’s MissionThe mission of MassINC is to develop a public agenda for Massachusetts that promotes the growth andvitality of the middle class. We envision a growing, dynamic middle class as the cornerstone of a newcommonwealth in which every citizen can live the American Dream. Our governing philosophy is rootedin the ideals embodied by the American Dream: equality of opportunity, personal responsibility and astrong commonwealth.
MassINC is a non-partisan, evidence-based organization. We reject rigid ideologies that are out of touchwith the times and we deplore the too-common practice of partisanship for its own sake. We follow the facts wherever they lead us. The complex challenges of a new century require a new approach thattranscends the traditional political boundaries.
MassINC is a different kind of organization, combining the intellectual rigor of a think tank with thevigorous civic activism of an advocacy campaign. Our work is organized within four Initiatives that use research, journalism and public education to address the most important forces shaping the lives of middle-class citizens:
• Economic Prosperity—Expanding economic growth and opportunity• Lifelong Learning—Building a ladder of opportunity through the continuum of learning• Safe Neighborhoods—Creating crime-free communities for all• Civic Renewal—Restoring a sense of "commonwealth"
MassINC’s work is published for educational purposes. Views expressed in the Institute’s publicationsare those of the authors and not necessarily those of MassINC’s directors, staff, sponsors, or other advisors. The work should not be construed as an attempt to influence any election or legislative action.
MassINC is a 501(c) 3, tax exempt, charitable organization that accepts contributions from individuals,corporations, other organizations, and foundations.
About MassINC’s Economic Prosperity InitiativeThrough the Economic Prosperity Initiative MassINC works to improve the overall economic well beingof Massachusetts citizens by pursuing answers to a range of economic questions. Among them: Howhard are people working and for what kinds of rewards? How secure are their futures? How healthy are our families? What are the strengths and limitations of state government in promoting economicactivity? What is the role of the private sector? And, what are the keys to our future economic success?
MassINC has a long history of work within this initiative. Past research projects include: Mass.Migration(2003), The State of the American Dream in Massachusetts, 2002 (2002), The Changing Workforce: Immigrantsand the New Economy in Massachusetts (1999), The Road Ahead: Emerging Threats to Workers, Families, andthe Massachusetts Economy (1998), and Lessons Learned: 25 Years of State Economic Policy (1998). Recentarticles in CommonWealth magazine include: “Blue Collar Blues” (Spring 2004), “Job (Dis)Qualifications”(Fall 2003), “Mass. Production” (Summer 2003), “The Sprawl Doctor” (Spring 2003), “Life After Lucent:A region tries to adjust”(Winter 2002), and “Heritage Road, Five Years Later: The American Dream, StillElusive in Suburbia”(Spring 2001). All of MassINC’s research and CommonWealth articles are availablefree-of-charge through our website, www.massinc.org.

BOARD OF DIRECTORS
Gloria Cordes Larson, Co-Chairman
Peter Meade, Co-Chairman
Joseph D. Alviani
Andrew J. Calamare
Heather P. Campion
Kathleen Casavant
Neil Chayet
Vincent Cipolla
Mark Erlich
David H. Feinberg
Robert B. Fraser
Chris Gabrieli
C. Jeffrey Grogan
Steve Grossman
Rev. Raymond Hammond
Bruce Herzfelder
Harold Hestnes
Joanne Jaxtimer
Jeffrey Jones
Tripp Jones
Elaine Kamarck
R.J. Lyman
Paul Mattera
Kristen McCormack
Melvin B. Miller
Hilary C. Pennington
Michael E. Porter
Mark E. Robinson
Charles Rodgers
Alan D. Solomont
Benaree P. Wiley
BOARD OF POLICY ADVISORS
ECONOMIC PROSPERITY INITIATIVE:
Wayne M. Ayers, FleetBoston Financial
Peter D. Enrich, Northeastern University
Rosabeth Moss Kanter, Harvard Business School
Edward Moscovitch, Cape Ann Economics
Andrew Sum, Northeastern University
David A. Tibbetts, Merrimack Valley Economic
Development Council
LIFELONG LEARNING INITIATIVE:
Harneen Chernow, AFL-CIO of Massachusetts
Carole A. Cowan, Middlesex Community College
William L. Dandridge, Lesley University
John D. Donahue, John F. Kennedy School of Government
Michael B. Gritton, City of Louisville
Sarah Kass, City on a Hill Charter School
Leonard A. Wilson, First Essex Bank
SAFE NEIGHBORHOODS INITIATIVE:
Jay Ashe, Hampden County House of Correction
William J. Bratton, The Bratton Group LLC
Mark A. R. Kleiman, UCLA School of Public Policy and
Social Research
Anne Morrison Piehl, John F. Kennedy School of Government
Eugene F. Rivers 3d, Ella J. Baker House
Donald K. Stern, Bingham Dana, LLP
CIVIC RENEWAL INITIATIVE:
Alan Khazei, City Year
Larry Overlan, Stonehill College
Jeffrey Leigh Sedgwick, University of Massachusetts Amherst
MASSINC STAFF
EXECUTIVE
Ian Bowles, President & CEO
RESEARCH & POLICY
Dana Ansel, Ph.D., Research Director
Rachel Deyette Werkema, Deputy Research Director
Christopher Fox, Senior Policy Advisor
COMMONWEALTH MAGAZINE
Robert Keough, Editor
Michael Jonas, Associate Editor
Robert Sullivan, Associate Editor
THE RENNIE CENTER FOR EDUCATION
RESEARCH & POLICY
S. Paul Reville, Executive Director
Celine Toomey Coggins, Research Director
Jennifer Candon, Assistant Director
DEVELOPMENT & COMMUNITY AFFAIRS
Lori Davis Febbo, Director
Ben Geffen, Deputy Director
COMMUNICATIONS
Jennifer Armini, Director
PROGRAMS & OPERATIONS
John Schneider, Director of Programs & Operations
John Donato, Outreach Director & New Media Manager
Colleen Lynch, Events & Administrative Manager
David N. Martin, Controller/IT Director
Emily Wood, Assistant Outreach Director
Heather Kramer Hartshorn, Graphic Designer

MassINCTHE MASSACHUSETTS INSTITUTE FOR A NEW COMMONWEALTH
Publisher of CommonWealth magazine
PRESORTEDSTANDARD
U.S. POSTAGEPAID
HOLLISTON, MAPERMIT NO. 72
18 Tremont Street, Suite 1120Boston, Massachusetts 02108
www.massinc.org
$25.00