the great refesh
TRANSCRIPT

The Great REfresh Marti O’Mara PhD, CRE Minneapolis Minnesota
November 2015

Confidential – Colliers International 2014 2 The Place Strategy Process has been applied to ~ 2 billion SF of occupancy including 12 of the 100 largest office portfolios
Strategy and Innovation Consulting: Background
Much of what you have today may not be what you will need in the future. Corporate real estate and facility investments are the longest range commitments most organizations make and require a view towards the company’s future competitive demands that go well beyond the typical business forecasting horizon. The development of a Colliers Place Strategy focuses on aligning location, workplace, culture and technology with future business demand. Our solutions result in impactful real estate and workplace solutions that increase innovation, productivity and business returns.

Confidential – Colliers International 2014
What is the Great REfresh?
1. Aging assets: most office buildings today are more than 30 years old. Most interiors are 10 or more years older.
2. The connections between social, economic and technological change that are impacting
where, how and when people work in offices 3. New drivers of location strategy
4. What is a “future ready” building?
5. How can we respond?
3

Confidential – Colliers International 2014
1. Aging Assets While overall demand for office space is not increasing (actually decreasing) except in very few markets, the age and obsolescence of assets is a growing issue.
Deferred maintenance
High cost of renovation
Obsolete layout
Obsolete infrastructure
Wrong location
Fun facts! • SMR found, the average age of U.S. commercial buildings (all classes – 4.61 million
buildings) is 41.7 years.
• The weighted average office building age in Manhattan is 60.4 years.
4

Confidential – Colliers International 2014 5
1st Web page I phone Notebook Tablet VPN intro
Cloud
US “Skyscraper” completions and office technology advancements
10 years ago 25 years ago
88%
40 years ago
Confidential – Colliers International 2014 6
1st Web page I phone Notebook Tablet VPN intro
Cloud
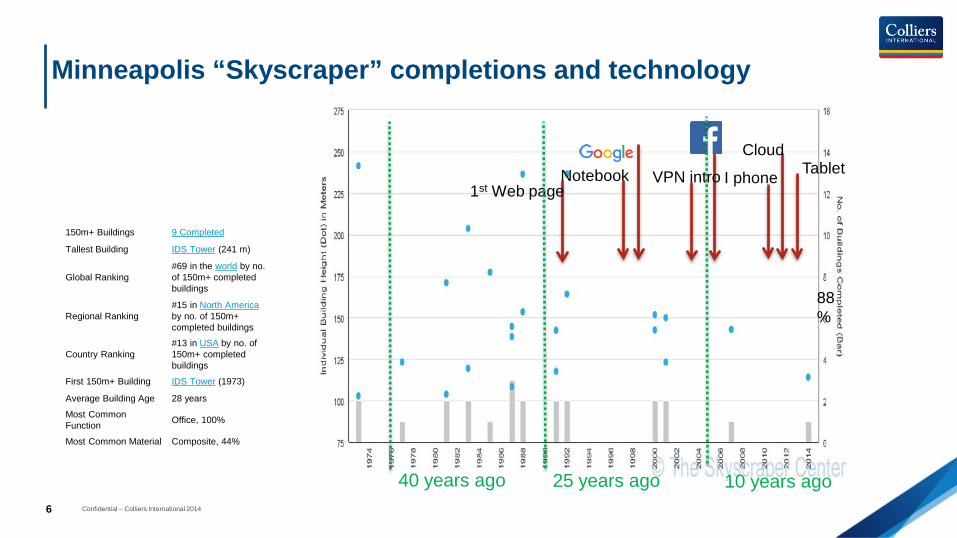
Minneapolis “Skyscraper” completions and technology
10 years ago 25 years ago
88%
40 years ago
150m+ Buildings 9 Completed
Tallest Building IDS Tower (241 m)
Global Ranking #69 in the world by no. of 150m+ completed buildings
Regional Ranking #15 in North America by no. of 150m+ completed buildings
Country Ranking #13 in USA by no. of 150m+ completed buildings
First 150m+ Building IDS Tower (1973)
Average Building Age 28 years
Most Common Function Office, 100%
Most Common Material Composite, 44%

Confidential – Colliers International 2014
Example: “older asset” – ca 1980’s - Rigid layout and poor utilization (20 year lease was up)
7
Bldg Address Lease
Rentable Area (SF)
Occupied/ assigned
Capacity (# workstations)
SF/per person
SF/per workstation
1 15 Hampshire St 107,000 294 474 364 226 2 9 & 11 Hampshire St 160,000 337 485 475 330 3 100 Hampshire Rd 124,803 384 531 325 235 4 5 Hampshire St 83,400 325 522 257 160 Total 475,203 1340 2012 355 236
Bldg.1 2nd flr.
Bldg.2 2nd flr.

No one wants to work in an ugly box….
YUCK!
“High utilization breeds collaboration, while high vacancy breeds more vacancy.”
8

2. The perfect storm leading to the changing workplace
Sustainability & Carbon reduction
Demographics: younger workers’
work-styles
Operating Cost Reduction
$$
Cost & Performance of Mobility Tools
Lag between our workplaces and the
work that we actually do

10
Boomers now 70-50
Gen X: 49-35 a lot fewer
Next gen/millennials “Arrested Development”
Where are our employees, managers and leaders of the future?
Changing workforce demographics

Underlying social trends impacting workplace Everything in life is getting spread out over more years
11
2. Longer periods of formal education. It takes longer to achieve a college degree (6yrs) and a larger proportion of college graduates pursue post-college studies - 40%.
1. Longer life expectancy: 50 years ago, average life expectancy in the US was 69.9 years. Today it is 78.1. Expansion of “middle years” rather than elderly years is key.
3. Marrying later – or not at all In the 70’s – average age of marriage for a college educated person was 23.By 2000, rose to age 28+. By married couples are less than half of American households, compared to nearly 80% in the 1950’s.
4. Having children later – or not at all Labor force participation for mothers with children under 18 is 70%, compared with 47% in the 1970’s. 20-25% of US women will not have children. It is already 25% in the UK.

Confidential – Colliers International 2014
How much space” is now a really hard question!
12
Three “P”s of High Performance Workplace Transformation
ToPography
People
Property Highest cost/FTE Ability to exit space Poorest quality space
Already mobile Work processes can support mobility Demographics – career stage
Long commutes Public transportation options Attractiveness of urban core, edge cities
When you don’t have to go to the office, what makes you want to go there?
Confidential – Colliers International 2014 13
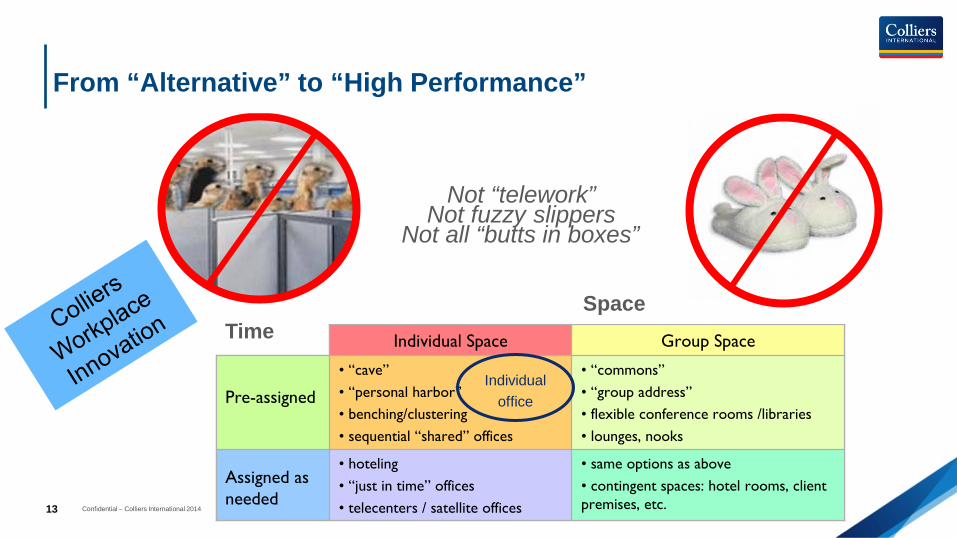
Not “telework” Not fuzzy slippers
Not all “butts in boxes”
Assigned as needed
Pre-assigned
Group SpaceIndividual Space
• same options as above• contingent spaces: hotel rooms, client premises, etc.
• hoteling• “just in time” offices• telecenters / satellite offices
• “commons”• “group address”• flexible conference rooms /libraries• lounges, nooks
• “cave”• “personal harbor”• benching/clustering• sequential “shared” offices
Time Space
Individual office
From “Alternative” to “High Performance”

Confidential – Colliers International 2014
Space per FTE is shrinking ‘increased asset utilization’ = higher load
14 SF/PERSON VARIES BY REGION AND INDUSTRY
SF/PERSON PER IS TRENDING DOWNWARD DRAMATICALLY
0
100
200
300
400
500 U.S. Square Feet per Worker in 2010
180
10 years 5 years 3 years Today
227 SQ.FT
205 SQ.FT 180
SQ.FT 135 SQ.FT
Corenet Global, NY Times, Feb. 2, 2015
BOMA Experience Exchange Report
OFFICES VS. CUBES Based on CoStar data
In 3 Years
100? SQ.FT
0
100
200
300
400
500Office Space per Worker by U.S. Industry
Office 186 SF
Cube 90 SF
Confidential – Colliers International 2014
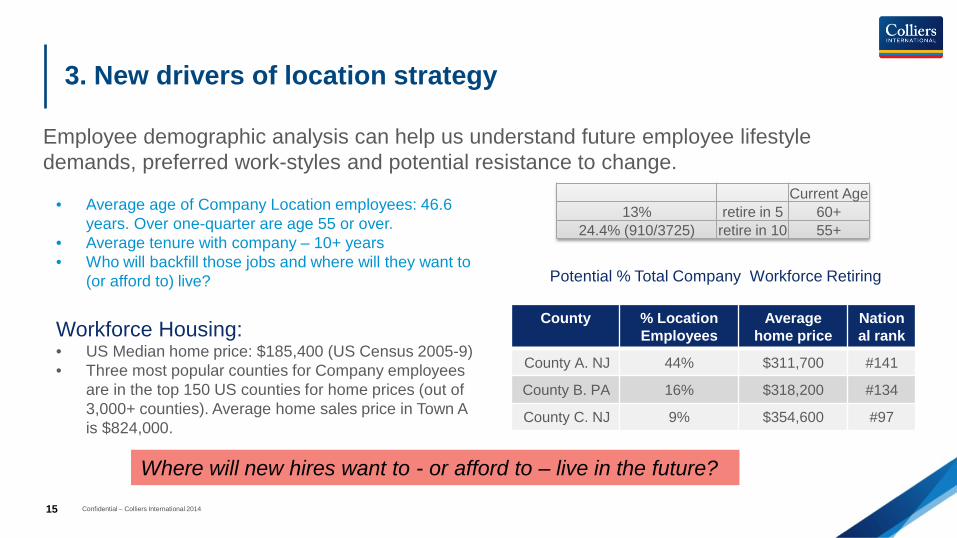
3. New drivers of location strategy
15
Employee demographic analysis can help us understand future employee lifestyle demands, preferred work-styles and potential resistance to change.
• Average age of Company Location employees: 46.6 years. Over one-quarter are age 55 or over.
• Average tenure with company – 10+ years • Who will backfill those jobs and where will they want to
(or afford to) live? Workforce Housing: • US Median home price: $185,400 (US Census 2005-9) • Three most popular counties for Company employees
are in the top 150 US counties for home prices (out of 3,000+ counties). Average home sales price in Town A is $824,000.
Current Age 13% retire in 5 60+
24.4% (910/3725) retire in 10 55+
County % Location Employees
Average home price
National rank
County A. NJ 44% $311,700 #141
County B. PA 16% $318,200 #134
County C. NJ 9% $354,600 #97
Where will new hires want to - or afford to – live in the future?
Potential % Total Company Workforce Retiring
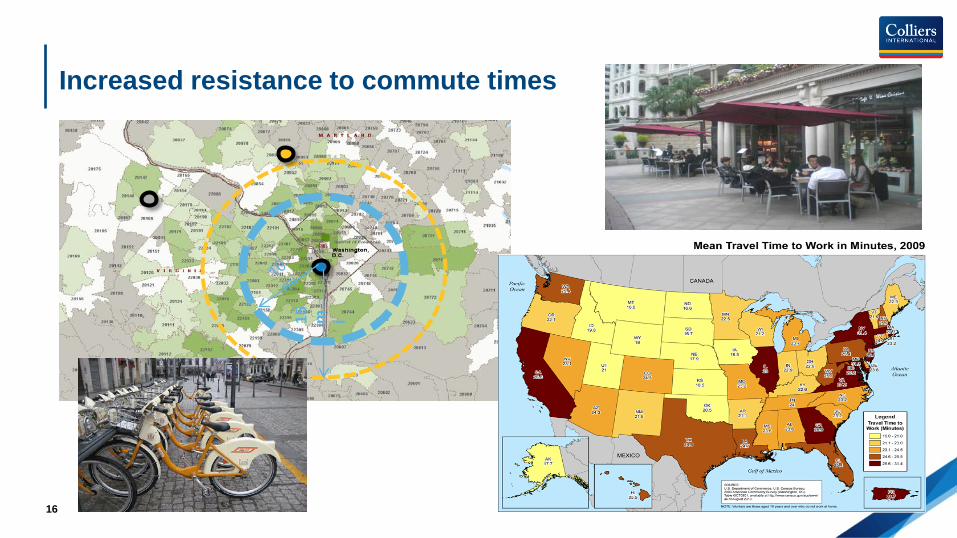
Increased resistance to commute times
16
15
m i
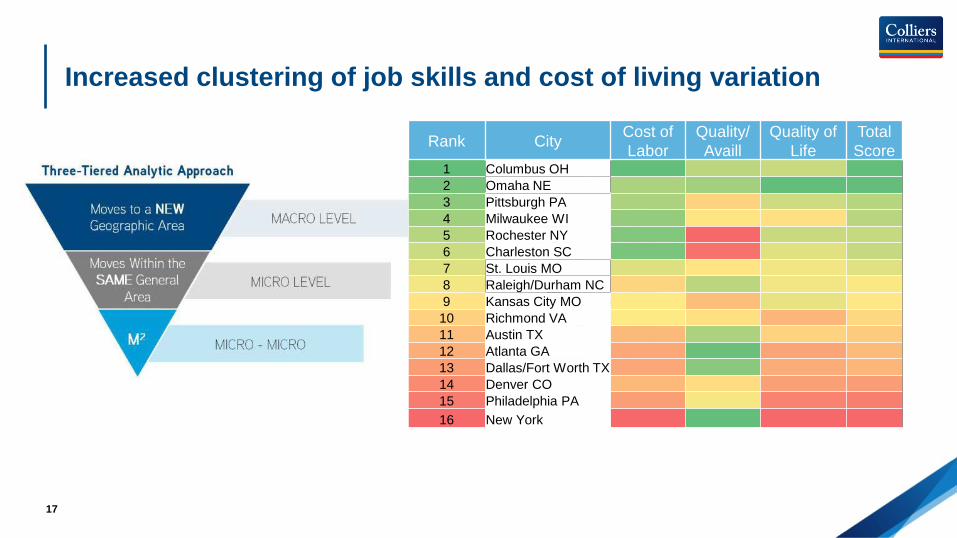
17
Rank City Cost of Labor
Quality/ Availl
Quality of Life
Total Score
1 Columbus OH 2 Omaha NE 3 Pittsburgh PA 4 Milwaukee WI 5 Rochester NY 6 Charleston SC 7 St. Louis MO 8 Raleigh/Durham NC 9 Kansas City MO 10 Richmond VA 11 Austin TX 12 Atlanta GA 13 Dallas/Fort Worth TX 14 Denver CO 15 Philadelphia PA 16 New York
Increased clustering of job skills and cost of living variation

18
“Percentage of total” compares each city’s salary per occupation to the most expensive salary for that occupation
Columbus OH Austin TX
Denver CO Rochester NY
Omaha NE Milwaukee WI Richmond VA St. Louis MO
Charleston SC Raleigh/Durham NC
Atlanta GA Dallas/Fort Worth TX
Pittsburgh PA Philadelphia PA Kansas City MO
New York
Securities…Avg Salary And % of Total
40% 45% 46% 49% 51% 52% 53% 55% 57% 59% 59% 60% 63% 71% 74%
100%
Financial Analysts Avg Salary and % of Total
75% 95% 85% 80% 75% 75% 78% 72% 70% 82% 87% 86% 77% 87% 80%
100%
Management Analysts Avg Salary and % of Total
63% 78% 83% 63% 61% 64% 72% 69% 50% 65% 65% 74% 60% 67% 62%
100%
Systems Software Avg Salary
And % of Total
74% 90% 98% 60% 83% 73% 81% 82% 75% 83%
100% 84% 71% 87% 74% 93%
Source: US BLS
Targeting desired employee skills/salary differentials
Confidential – Colliers International 2014
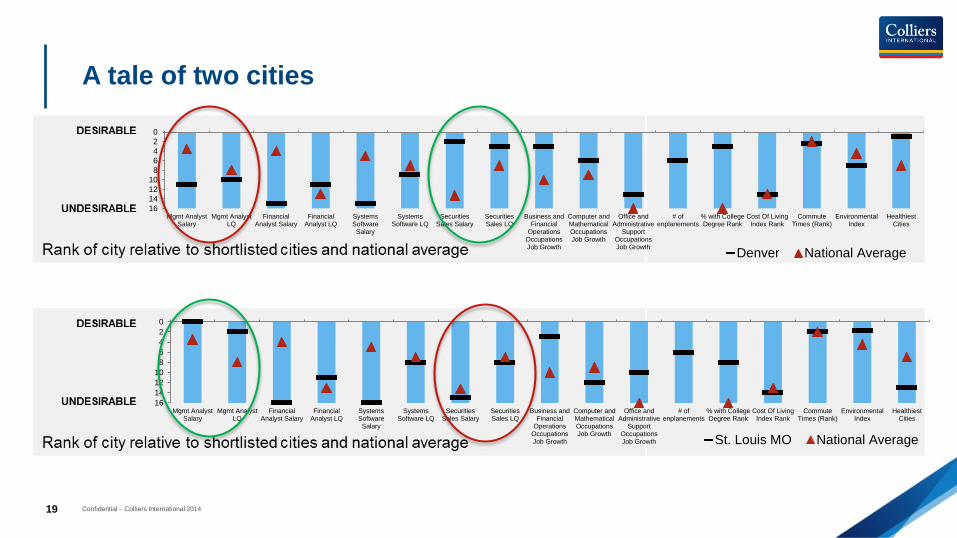
A tale of two cities
19
02468
10121416
Mgmt AnalystSalary
Mgmt AnalystLQ
FinancialAnalyst Salary
FinancialAnalyst LQ
SystemsSoftwareSalary
SystemsSoftware LQ
SecuritiesSales Salary
SecuritiesSales LQ
Business andFinancial
OperationsOccupationsJob Growth
Computer andMathematicalOccupationsJob Growth
Office andAdministrative
SupportOccupationsJob Growth
# ofenplanements
% with CollegeDegree Rank
Cost Of LivingIndex Rank
CommuteTimes (Rank)
EnvironmentalIndex
HealthiestCities
St. Louis MO National Average
02468
10121416
Mgmt AnalystSalary
Mgmt AnalystLQ
FinancialAnalyst Salary
FinancialAnalyst LQ
SystemsSoftwareSalary
SystemsSoftware LQ
SecuritiesSales Salary
SecuritiesSales LQ
Business andFinancial
OperationsOccupationsJob Growth
Computer andMathematicalOccupationsJob Growth
Office andAdministrative
SupportOccupationsJob Growth
# ofenplanements
% with CollegeDegree Rank
Cost Of LivingIndex Rank
CommuteTimes (Rank)
EnvironmentalIndex
HealthiestCities
Denver National Average
Confidential – Colliers International 2014
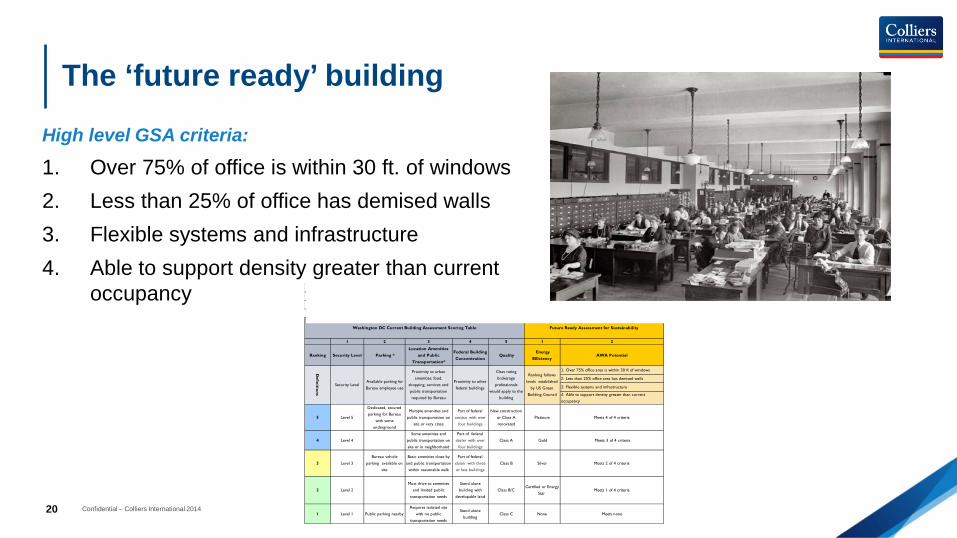
The ‘future ready’ building
20
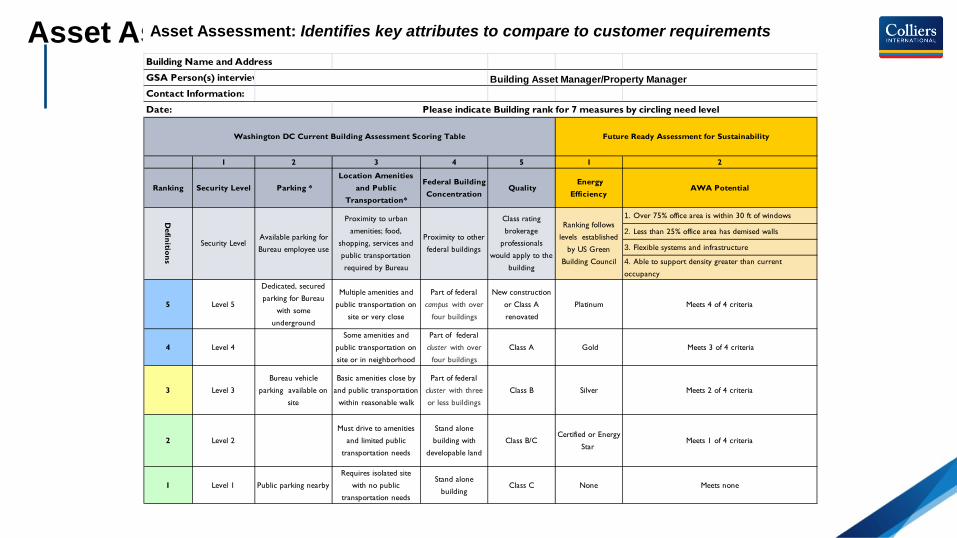
Building Name and Address
GSA Person(s) interview Building Asset Manager/Property ManagerContact Information:
Date: Please indicate Building rank for 7 measures by circling need level
1 2 3 4 5 1 2
Ranking Security Level Parking * Location Amenities
and Public Transportation*
Federal Building Concentration
Quality Energy
EfficiencyAWA Potential
1. Over 75% office area is within 30 ft of windows
2. Less than 25% office area has demised walls
3. Flexible systems and infrastructure
4. Able to support density greater than current
occupancy
5 Level 5
Dedicated, secured
parking for Bureau
with some
underground
Multiple amenities and
public transportation on
site or very close
Part of federal
campus with over
four buildings
New construction
or Class A
renovated
Platinum Meets 4 of 4 criteria
4 Level 4
Some amenities and
public transportation on
site or in neighborhood
Part of federal
cluster with over
four buildings
Class A Gold Meets 3 of 4 criteria
3 Level 3
Bureau vehicle
parking available on
site
Basic amenities close by
and public transportation
within reasonable walk
Part of federal
cluster with three
or less buildings
Class B Silver Meets 2 of 4 criteria
2 Level 2
Must drive to amenities
and limited public
transportation needs
Stand alone
building with
developable land
Class B/CCertified or Energy
Star Meets 1 of 4 criteria
1 Level 1 Public parking nearby
Requires isolated site
with no public
transportation needs
Stand alone
buildingClass C None Meets none
Definitions
Security LevelAvailable parking for
Bureau employee use
Proximity to urban
amenities; food,
shopping, services and
public transportation
required by Bureau
Proximity to other
federal buildings
Class rating
brokerage
professionals
would apply to the
building
Ranking follows
levels established
by US Green
Building Council
Washington DC Current Building Assessment Scoring Table Future Ready Assessment for Sustainability
High level GSA criteria:
1. Over 75% of office is within 30 ft. of windows 2. Less than 25% of office has demised walls 3. Flexible systems and infrastructure 4. Able to support density greater than current
occupancy

“All Roads Lead to Rome” – getting to 150 usf/fte
Lower Cost / Change Higher Cost / More Change
Workplace Design Change
Work Style Change
21

Increase utilization with current furnishings by “Sharing” 1 1 1 1 1 1 1 1 1 1 1 1 1 1 1 1 1 1 1 1 1 1 1 1 1 1 1 1 1 1 1 1 1 1 1 1 1 1 1 1
1 1 1 1 1 1 1 1 1 1 1 1 1 1 1 1 1 1 1 1 1 1 1 1 1 1 1 1 1 1 1 1 1 1 1 1 1 1 1 1
1 1 1 1 1 1 1 1 1 1 1 1 1 1 1 1 1 1 1 1 1 1 1 1 1 1 1 1 1 1 1 1 1 1 1 1 1 1 1 1
1 1 1 1 1 1 1 1 1 1 1 1 1 1 1 1 1 1 1 1 1 1 1 1 1 1 1 1 1 1 1 1 1 1 1 1 1 1 1 1
1 1 1 1 1 1 1 1 1 1 1 1 1 1 1 1 1 1 1 1 1 1 1 1 1 1 1 1 1 1 1 1 1 1 1 1 1 1 1 1
1 1 1 1 1 1 1 1 1 1 1 1 1 1 1 1 1 1 1 1 1 1 1 1 1 1 1 1 1 1 1 1 1 1 1 1 1 1 1 1
1 1 1 1 1 1 1 1 1 1 1 1 1 1 1 1 1 1 1 1 1 1 1 1 1 1 1 1 1 1 1 1 1 1 1 1 1 1 1 1
1 1 1 1 1 1 1 1 1 1 1 1 1 1 1 1 1 1 1 1 1 1 1 1 1 1 1 1 1 1 1 1 1 1 1 1 1 1 1 1
1 1 1 1 1 1 1 1 1 1 1 1 1 1 1 1 1 1 1 1 1 1 1 1 1 1 1 1 1 1 1 1 1 1 1 1 1 1 1 1
1 1 1 1 1 1 1 1 1 1 1 1 1 1 1 1 1 1 1 1 1 1 1 1 1 1 1 1 1 1 1 1 1 1 1 1 1 1 1 1
1 1 1 1 1 1 1 1 2 2 1 1 1 1 1 1 1 1 1 1 1 1 1 1 1 1 1 1 1 1 1 1 2 2 2 2 2 2 2 2
1 1 1 1 1 1 1 1 2 2 1 1 1 1 1 1 1 1 1 1 1 1 1 1 1 1 1 1 1 1 1 1 2 2 2 2 2 2 2 2
1 1 1 1 1 1 1 1 2 2 1 1 1 1 1 1 1 1 1 1 1 1 1 1 1 1 1 1 1 1 1 1 2 2 2 2 2 2 2 2
1 1 1 1 1 1 1 1 2 2 1 1 1 1 1 1 1 1 1 1 1 1 1 1 1 1 1 1 1 1 1 1 2 2 2 2 2 2 2 2
1 1 1 1 1 1 1 1 2 2 1 1 1 1 1 1 1 1 1 1 1 1 1 1 1 1 1 1 1 1 1 1 2 2 2 2 2 2 2 2
1 1 1 1 1 1 1 2 2 2 1 1 1 1 1 1 1 1 1 1 1 1 1 1 1 1 1 1 1 1 1 1 1 2 2 2 2 2 2 2
1 1 1 1 1 1 1 2 2 2 1 1 1 1 1 1 1 1 1 1 1 1 1 1 1 1 1 1 1 1 1 1 1 2 2 2 2 2 2 2
1 1 1 1 1 1 1 2 2 2 1 1 1 1 1 1 1 1 1 1 1 1 1 1 1 1 1 1 1 1 1 1 1 2 2 2 2 2 2 2
1 1 1 1 1 1 1 2 2 2 1 1 1 1 1 1 1 1 1 1 1 1 1 1 1 1 1 1 1 1 1 1 1 2 2 2 2 2 2 2
1 1 1 1 1 1 1 2 2 2 1 1 1 1 1 1 1 1 1 1 1 1 1 1 1 1 1 1 1 1 1 1 1 2 2 2 2 2 2 2
1 1 1 1 1 1 1 1 2 2 1 1 1 1 1 1 1 1 1 1 1 1 1 1 1 6 6 6 6 6 6 6 3
1 1 1 1 1 1 1 1 2 2 1 1 1 1 1 1 1 1 1 1 1 1 1 1 1
1 1 1 1 1 1 1 1 2 2 1 1 1 1 1 1 1 1 1 1 1 1 1 1 1 6 6 6 6 6 6 6 3
1 1 1 1 1 1 1 1 2 2 1 1 1 1 1 1 1 1 1 1 1 1 1 1 1
1 1 1 1 1 1 1 1 2 2 1 1 1 1 1 1 1 1 1 1 1 1 1 1 1 6 6 6 6 6 6 6 3
1 1 1 1 1 1 1 2 2 2 1 1 1 1 1 1 1 1 1 1 1 1 1 1 1
1 1 1 1 1 1 1 2 2 2 1 1 1 1 1 1 1 1 1 1 1 1 1 1 1 6 6 6 6 6 6 6 3
1 1 1 1 1 1 1 2 2 2 1 1 1 1 1 1 1 1 1 1 1 1 1 1 1
1 1 1 1 1 1 1 2 2 2 1 1 1 1 1 1 1 1 1 1 1 1 1 1 1 6 6 6 6 6 6 6 3
1 1 1 1 1 1 1 2 2 2 1 1 1 1 1 1 1 1 1 1 1 1 1 1 1
1 1 1 1 1 1 1 2 2 2 1 1 1 1 1 1 1 1 1 1 1 1 1 1 1 1 1 1 1 1 1 1 2 2 2 2 2 2 2 2
1 1 1 1 1 1 1 2 2 2 1 1 1 1 1 1 1 1 1 1 1 1 1 1 1 1 1 1 1 1 1 1 2 2 2 2 2 2 2 2
1 1 1 1 1 1 1 2 2 2 1 1 1 1 1 1 1 1 1 1 1 1 1 1 1 1 1 1 1 1 1 1 2 2 2 2 2 2 2 2
1 1 1 1 1 1 1 2 2 2 1 1 1 1 1 1 1 1 1 1 1 1 1 1 1 1 1 1 1 1 1 1 2 2 2 2 2 2 2 2
1 1 1 1 1 1 1 2 2 2 1 1 1 1 1 1 1 1 1 1 1 1 1 1 1 1 1 1 1 1 1 1 2 2 2 2 2 2 2 2
1 1 1 1 1 1 1 1 2 2 1 1 1 1 1 1 1 1 1 1 1 1 1 1 1 1 1 1 1 1 1 1 1 2 2 2 2 2 2 2
1 1 1 1 1 1 1 1 2 2 1 1 1 1 1 1 1 1 1 1 1 1 1 1 1 1 1 1 1 1 1 1 1 2 2 2 2 2 2 2
1 1 1 1 1 1 1 1 2 2 1 1 1 1 1 1 1 1 1 1 1 1 1 1 1 1 1 1 1 1 1 1 1 2 2 2 2 2 2 2
1 1 1 1 1 1 1 1 2 2 1 1 1 1 1 1 1 1 1 1 1 1 1 1 1 1 1 1 1 1 1 1 1 2 2 2 2 2 2 2
1 1 1 1 1 1 1 1 2 2 1 1 1 1 1 1 1 1 1 1 1 1 1 1 1 1 1 1 1 1 1 1 1 2 2 2 2 2 2 2
Existing: All Assigned
Seating
Offices Open Plan: Cubes or Benching
Future: 25% Additional
Capacity
All Individually Assigned
50% of Offices 25% of Open Plan
Individually Assigned
70% of Offices 50% of Open
Plan Individually Assigned
70% of Offices 70% of Open
Plan Individually Assigned
2:1
11:10
2:1 6:5
1.5:1
5:4
22

Illustrative purposes only
Ways to increase utilization without a major overhaul Existing Plan – could double capacity
(18-20 offices/wing ~360 sf/person)
Replace file and storage areas with benching
Double up some offices
Confirm staff assigned to every seat
Remove demountable walls where possible
Replace sections of modular cubes with benching
Maximum (70-80 seats/wing ~ 100 usf/person)

People – Some Should Be in the Office Everyday
24

Confidential – Colliers International 2014
Thank you!!
25

Confidential – Colliers International 2014
Workplace Innovation
26
Real Estate Factors Human Resource Factors
Strategic Redeploy capital to core business Greater geographical access to labor markets
Financial Operating cost reduction Cost savings to employees from commuting
Operational Locations based upon use, function
Access to a more diverse workforce through flexible schedules
Individual Work settings that support the way work is done
More personal choice regarding schedule, work-style
Stakeholder Impact Analysis
How will offering high performance workplace strategies help build and maintain competitive advantage? What is good for the business?

People: Parents, Professionals and Potentates
27 Office images courtesy of Margulies Perruzzi Architects
Mobility Metrics by Industy
IndustryPerson per Seat
Target
Seat Per Person
Target
Insurance Firm 0.71 1.4:1
Pharmaceutical Firm 0.83 1.2:1
Financial Firm (IT & Support) 0.83 1.2:1
Public Accounting 0.17 - 0.10 6:1 - 10:1
Source: Workplace Mobility’, Corporate Real Estate Journal, November 2010. Underlying research performed by Christine Barber and Andrew Garner-Wortzel of Gensler and Trex Morris of Ernst & Young.

Confidential – Colliers International 2014
1. No more “butts in boxes”. Ever. 2. Most everyone’s life runs better if they can work from home one day a week. 3. If you don’t have to go to the office, what is going to make you want to go to the office? 4. Organizational structures and managerial practices seriously lag the revolution in mobile work. From corporate real estate strategy to
PLACE STRATEGY™
“Organizing your company in space and time, utilizing human talent and technology to its highest potential.”
28

Confidential – Colliers International 2014 29
http://www.imdb.com/title/tt0151804/trailers
Building Name and Address
GSA Person(s) interview Building Asset Manager/Property ManagerContact Information:
Date: Please indicate Building rank for 7 measures by circling need level
1 2 3 4 5 1 2
Ranking Security Level Parking * Location Amenities
and Public Transportation*
Federal Building Concentration
Quality Energy
EfficiencyAWA Potential
1. Over 75% office area is within 30 ft of windows
2. Less than 25% office area has demised walls
3. Flexible systems and infrastructure
4. Able to support density greater than current
occupancy
5 Level 5
Dedicated, secured
parking for Bureau
with some
underground
Multiple amenities and
public transportation on
site or very close
Part of federal
campus with over
four buildings
New construction
or Class A
renovated
Platinum Meets 4 of 4 criteria
4 Level 4
Some amenities and
public transportation on
site or in neighborhood
Part of federal
cluster with over
four buildings
Class A Gold Meets 3 of 4 criteria
3 Level 3
Bureau vehicle
parking available on
site
Basic amenities close by
and public transportation
within reasonable walk
Part of federal
cluster with three
or less buildings
Class B Silver Meets 2 of 4 criteria
2 Level 2
Must drive to amenities
and limited public
transportation needs
Stand alone
building with
developable land
Class B/CCertified or Energy
Star Meets 1 of 4 criteria
1 Level 1 Public parking nearby
Requires isolated site
with no public
transportation needs
Stand alone
buildingClass C None Meets none
Definitions
Security LevelAvailable parking for
Bureau employee use
Proximity to urban
amenities; food,
shopping, services and
public transportation
required by Bureau
Proximity to other
federal buildings
Class rating
brokerage
professionals
would apply to the
building
Ranking follows
levels established
by US Green
Building Council
Washington DC Current Building Assessment Scoring Table Future Ready Assessment for Sustainability
Asset Assessment Worksheet Asset Assessment: Identifies key attributes to compare to customer requirements