the greater agulhas current system: an integrated study of ... · the greater agulhas current...
TRANSCRIPT
The greater Agulhas Currentsystem: An integrated study of
its mesoscale variability
BC Backeberg MSc, Department of Oceanography, University of Cape Town, South Africa& Mohn-Sverdrup Center for Global Ocean Studies and Operational Oceanography,
Bergen, NorwayProf JA Johannessen, Nansen Environmental and Remote Sensing Center, Bergen, Norway &
Geophysical Institute, University of Bergen, NorwayDr L Bertino, Mohn-Sverdrup Center for Global Ocean Studies and Operational
Oceanography, Bergen, Norway & Nansen Environmental and Remote Sensing Center,Bergen, Norway
Prof CJ Reason, Department of Oceanography, University of Cape Town, South Africa
For the purpose of developing an operational oceanography system for the greaterAgulhas Current regime, a high resolution Hybrid Coordinate Ocean Model (HYCOM)has been set in a nested configuration. The intense and complex current regime poses achallenge in modelling. However, access to satellite and in-situ data with strong andpersistent signals of the dynamics and mesoscale variability ensure that adequate modelvalidation is feasible. The study concludes that HYCOM reproduces the general largerscale circulation of the greater Agulhas Current reasonably accurately in addition to theregionally specific characteristics and mesoscale variability. Furthermore, strong antic-yclonic eddies occurring in the Mozambique Channel at a frequency of 5–6 per year,are found to drift southward and merge with the northern Agulhas Current. Evidence ofthese eddies can also be tracked further southwestwards into the southern AgulhasCurrent and sometimes all the way towards the Agulhas retroflection region. Opera-tional forecasting of the greater Agulhas Current, and in particular the retroflection, musttherefore adequately account for the presence and influence of the MozambiqueChannel eddies, in order to forecast their evolution on time scales from days to weeks
LEAD AUTHOR’S BIOGRAPHY
BC Backeberg is a PhD student in the Department ofOceanography at the University of Cape Town, SouthAfrica. The PhD study is undertaken in collaboration withthe Mohn-Sverdrup Center for Global Ocean Studies andOperational Oceanography and the Nansen Environmentaland Remote Sensing Center in Bergen, Norway. The mainaim of the PhD is to demonstrate the readiness in usingintegrated satellite observations, in-situ data and a validatednumerical ocean model for operational forecasting of thegreater Agulhas Current regime.
INTRODUCTION
The Agulhas Current has been described as one of
the strongest western boundary currents in the
world’s oceans.27 Forming part of the South-West
Indian Ocean sub-gyre, the current flows pole-
wards along the southeastern coast of Southern Africa from
27oS, eventually retroflecting and flowing eastward back
into the South Indian Ocean south of Africa between 40o
and 42oS.18,38
The upstream source region for the Agulhas Current has
distinct contributions from the flow through the Mozambi-
The greater Agulhas Current system: An integrated study of its mesoscale variability
Volume 1 No. 1 2008 Journal of Operational Oceanography 29
que Channel, the poleward flowing East Madagascar Cur-
rent (EMC), and recirculation from the South-West Indian
Ocean sub-gyre, which supplies the greater part of the
volume transport in the Agulhas Current, ie, 40 Sv of a total
60 Sv in the upper 1000m.38 The flow in the Mozambique
Channel is dominated by southward moving anticyclonic
eddies.33,3,13 These eddies have spatial scales of approxi-
mately 300–350km and propagate southwards at speeds of
approximately 3–6km/day.34,35 Concurrently, the EMC ret-
roflects southwest of Madagascar,36 generating cyclonic and
anticyclonic eddies up to 250km diameter.31 These propa-
gate westwards towards the Agulhas Current.14 Although
the Mozambique Channel eddies and the EMC do not form
a continuum with the Agulhas Current, they both affect its
dynamics27 and contribute to the fluxes of volume, heat and
salt.
Mesoscale variability in the northern Agulhas Current19
occurs in the form of intermittent cyclonic meanders,
known as Natal Pulses. These form at the Natal Bight,
between 298S and 308S, where the gentler continental slope
and wider shelf present favourable conditions for the occur-
rence of instabilities and subsequent growth of meanders.12
Natal Pulses form approximately six times per year and
propagate downstream at rates of 10km/day.23 A further
source of variability is the Mozambique Channel eddies.
Their propagation into the source region of the Agulhas
Current has been confirmed by previous altimetry stud-
ies.3,34 Additionally, their interaction with the Agulhas Cur-
rent has been shown to influence the timing and frequency
of Agulhas ring shedding events at the retroflection. It is
suggested34 this occurs via two mechanisms. Firstly, the
southward progressing Mozambique Channel eddies trigger
the formation of the aforementioned Natal Pulse, and these
are known to precede ring shedding events at the retroflec-
tion by approximately 180 days.42 Secondly, the migration
of Mozambique Channel eddies into the Agulhas retroflec-
tion region may lead to an early occlusion of the retroflec-
tion loop allowing Agulhas Ring shedding to occur.
Numerical models need to adequately resolve the
mesoscale dynamics and variability of the greater Agulhas
Current regime in order to be considered for use in an
operational oceanography system.
In this paper, we demonstrate that the intense dynamics
and mesoscale variability of the greater Agulhas Current
system act as an excellent natural laboratory for studies
using integrated satellite and in-situ observations with mod-
el simulations. As well as allowing model validation, the
integrated approach also ensures advances in process under-
standing of this complicated current regime. The data
sources and model characteristics are described in the next
section, followed by an intercomparison of the model simu-
lation results with observations, considering spatial, tempor-
al and drift analyses of the mesoscale variability and
dynamics over an 11-year period from 1996–2006. The
paper ends with the summary and conclusion.
DATA DESCRIPTIONThe strong thermal gradients and sea level anomalies asso-
ciated with the dynamics and mesoscale variability of the
greater Agulhas Current system make it particularly amen-
able to monitoring via satellite remote sensing observations
such as those from radiometry and microwave altimetry. In
addition, a comprehensive database of Lagrangian surface
drifter data allows complementary quantitative analyses of
the surface currents.
Satellite data
Sea surface temperature (SST) observations from the cloud
independent Tropical Rainfall Measuring Mission (TRMM)
Microwave Imager and the Advanced Microwave Scanning
Radiometer for EOS (AMSR-E) are used in the model
validation process. TRMM follows an equatorial orbit with
a 358 inclination, allowing for coverage between 408N and
408S, while the National Aeronautic and Space Administra-
tion (NASA) Aqua satellite follows a near polar orbit allow-
ing for global coverage. These data are used to calculate
optimally interpolated sea surface temperature fields (OI
SST) on a daily basis with a spatial resolution of �25km.
The Microwave OI SST data are produced by Remote Sen-
sing Systems and sponsored by National Oceanographic
Partnership Program (NOPP), the NASA Earth Science
Physical Oceanography Program, and the NASA REASoN
DISCOVER Project. Weekly averages have been calculated
from the daily data available at www.remss.com.
Moreover, gridded data of sea level anomaly (SLA) and
surface geostrophic velocities derived from maps of abso-
lute dynamic topography are used for comparison against
the model fields. The gridded data are merged from multi-
ple altimeter missions, namely TOPEX/Poseidon, Jason-1,
ERS-1/2, GFO and ENVISAT. They span the time period
from January 1996 to December 2006. The data were
obtained from the SSALTO/DUACS near-real time and de-
layed mode multimission altimeter data processing system
at Centre National d’Etudes Spatiales (CNES; www.aviso.
oceanobs.com). The mapping technique used to produce the
gridded maps has been outlined in detail.15 The gridded
data has a horizontal resolution of 1/3o on a Mercator grid,
which therefore provides grid-resolution of 24km to 37km
in the Agulhas region. These maps are available at weekly
intervals.
Surface drifter data
The surface drifter data with drogues at 15m include posi-
tion and time observations. Archived data from the Global
Drifter Program, formerly World Ocean Circulation experi-
ment Surface Velocity Programme (WOCE-SVP), are avail-
able from the Marine and Environmental Data Services at
Fisheries & Oceans Canada (www.meds-sdmm.dfo-mpo.
gc.ca).
Daily average drift velocities were calculated from the
successive positions and times given for the individual
drifters. The data were then binned into a 18 spatial grid.
For the purpose of this study only drifter data for the region
of the Mozambique Channel, the Agulhas Current proper,
the Agulhas Retroflection and the ring shedding corridor is
considered for the period 1996–2006.
30 Journal of Operational Oceanography Volume 1 No. 1 2008
The greater Agulhas Current system: An integrated study of its mesoscale variability
Model characteristics and setup
The Hybrid Coordinate Ocean Model (HYCOM) used in
this study was developed from the Miami Isopycnic Coordi-
nate Model (MICOM5). It is a primitive equation model
that smoothly inter-changes the vertical coordinates between
z-level coordinates for resolving upper-ocean mixed layer
processes, isopycnic in the stratified open ocean, and
sigma-coordinates that follow the bathymetry in the shallow
coastal regions.4 The name ‘hybrid’ is derived from its
ability to inter-change between these three vertical coordi-
nate schemes.
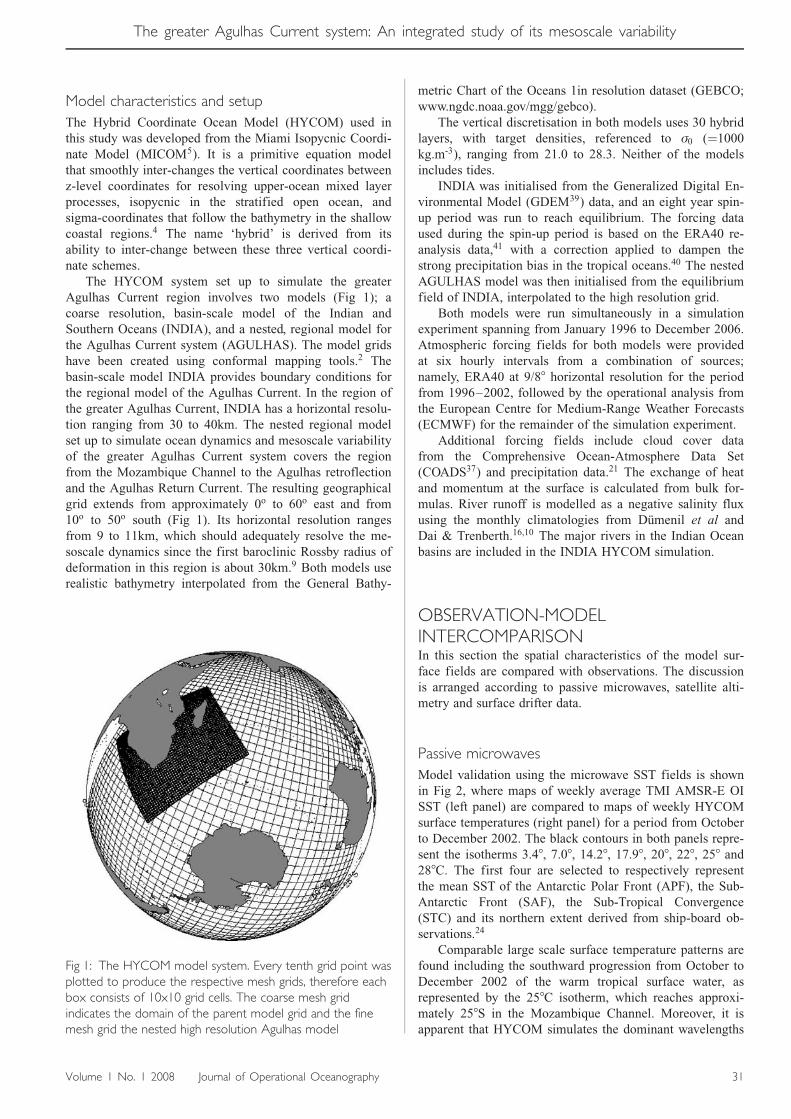
The HYCOM system set up to simulate the greater
Agulhas Current region involves two models (Fig 1); a
coarse resolution, basin-scale model of the Indian and
Southern Oceans (INDIA), and a nested, regional model for
the Agulhas Current system (AGULHAS). The model grids
have been created using conformal mapping tools.2 The
basin-scale model INDIA provides boundary conditions for
the regional model of the Agulhas Current. In the region of
the greater Agulhas Current, INDIA has a horizontal resolu-
tion ranging from 30 to 40km. The nested regional model
set up to simulate ocean dynamics and mesoscale variability
of the greater Agulhas Current system covers the region
from the Mozambique Channel to the Agulhas retroflection
and the Agulhas Return Current. The resulting geographical
grid extends from approximately 0o to 60o east and from
10o to 50o south (Fig 1). Its horizontal resolution ranges
from 9 to 11km, which should adequately resolve the me-
soscale dynamics since the first baroclinic Rossby radius of
deformation in this region is about 30km.9 Both models use
realistic bathymetry interpolated from the General Bathy-
metric Chart of the Oceans 1in resolution dataset (GEBCO;
www.ngdc.noaa.gov/mgg/gebco).
The vertical discretisation in both models uses 30 hybrid
layers, with target densities, referenced to �0 (¼1000
kg.m-3), ranging from 21.0 to 28.3. Neither of the models
includes tides.
INDIA was initialised from the Generalized Digital En-
vironmental Model (GDEM39) data, and an eight year spin-
up period was run to reach equilibrium. The forcing data
used during the spin-up period is based on the ERA40 re-
analysis data,41 with a correction applied to dampen the
strong precipitation bias in the tropical oceans.40 The nested
AGULHAS model was then initialised from the equilibrium
field of INDIA, interpolated to the high resolution grid.
Both models were run simultaneously in a simulation
experiment spanning from January 1996 to December 2006.
Atmospheric forcing fields for both models were provided
at six hourly intervals from a combination of sources;
namely, ERA40 at 9/88 horizontal resolution for the period
from 1996–2002, followed by the operational analysis from
the European Centre for Medium-Range Weather Forecasts
(ECMWF) for the remainder of the simulation experiment.
Additional forcing fields include cloud cover data
from the Comprehensive Ocean-Atmosphere Data Set
(COADS37) and precipitation data.21 The exchange of heat
and momentum at the surface is calculated from bulk for-
mulas. River runoff is modelled as a negative salinity flux
using the monthly climatologies from Dumenil et al and
Dai & Trenberth.16,10 The major rivers in the Indian Ocean
basins are included in the INDIA HYCOM simulation.
OBSERVATION-MODELINTERCOMPARISONIn this section the spatial characteristics of the model sur-
face fields are compared with observations. The discussion
is arranged according to passive microwaves, satellite alti-
metry and surface drifter data.
Passive microwaves
Model validation using the microwave SST fields is shown
in Fig 2, where maps of weekly average TMI AMSR-E OI
SST (left panel) are compared to maps of weekly HYCOM
surface temperatures (right panel) for a period from October
to December 2002. The black contours in both panels repre-
sent the isotherms 3.48, 7.08, 14.28, 17.98, 208, 228, 258 and
288C. The first four are selected to respectively represent
the mean SST of the Antarctic Polar Front (APF), the Sub-
Antarctic Front (SAF), the Sub-Tropical Convergence
(STC) and its northern extent derived from ship-board ob-
servations.24
Comparable large scale surface temperature patterns are
found including the southward progression from October to
December 2002 of the warm tropical surface water, as
represented by the 258C isotherm, which reaches approxi-
mately 258S in the Mozambique Channel. Moreover, it is
apparent that HYCOM simulates the dominant wavelengths
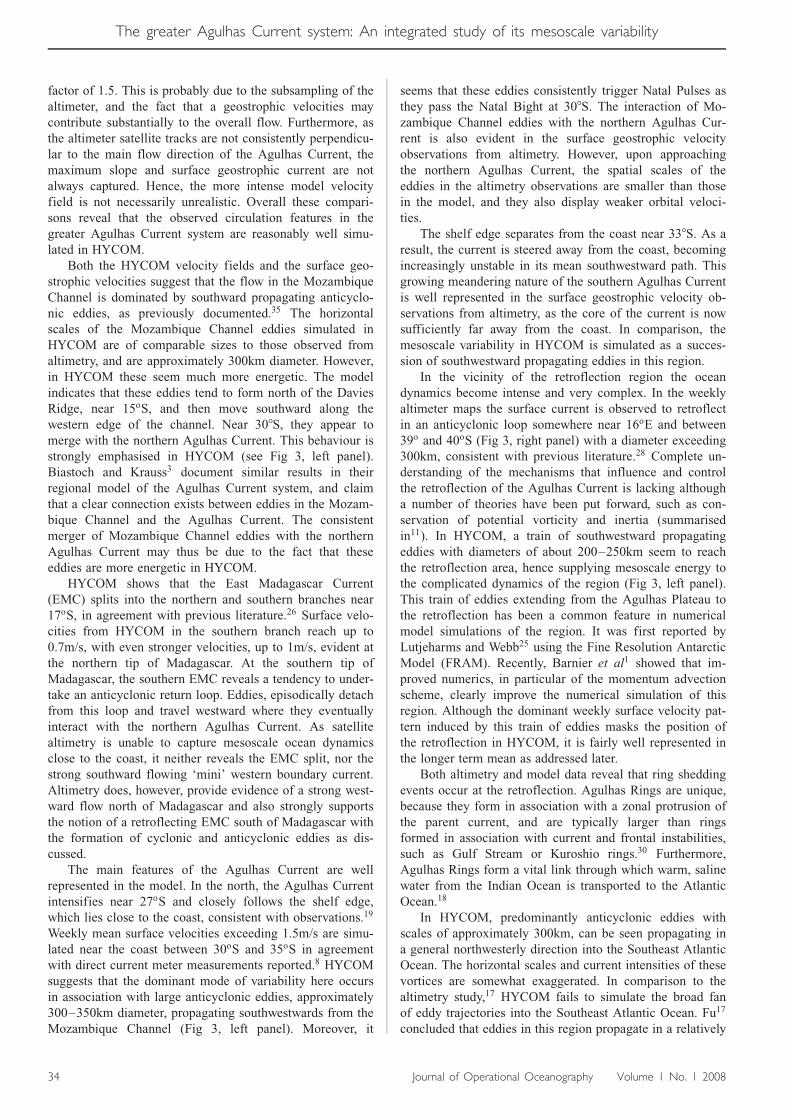
Fig 1: The HYCOM model system. Every tenth grid point wasplotted to produce the respective mesh grids, therefore eachbox consists of 10x10 grid cells. The coarse mesh gridindicates the domain of the parent model grid and the finemesh grid the nested high resolution Agulhas model
Volume 1 No. 1 2008 Journal of Operational Oceanography 31
The greater Agulhas Current system: An integrated study of its mesoscale variability
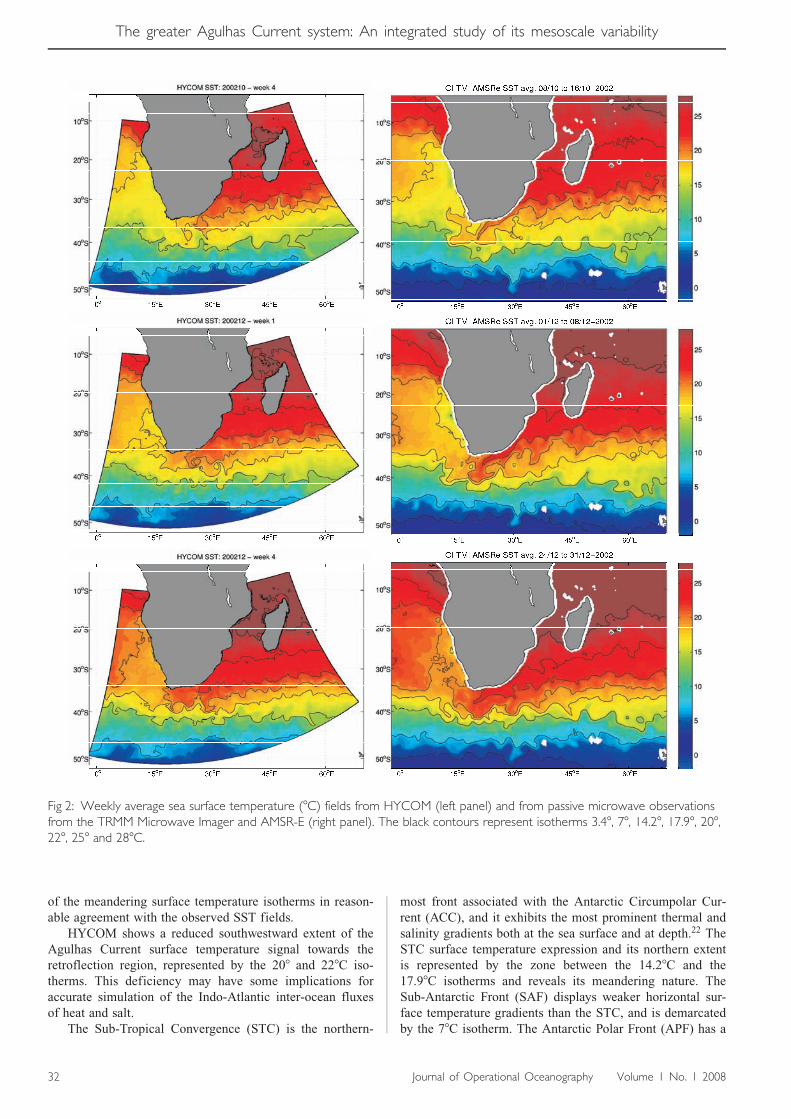
of the meandering surface temperature isotherms in reason-
able agreement with the observed SST fields.
HYCOM shows a reduced southwestward extent of the
Agulhas Current surface temperature signal towards the
retroflection region, represented by the 208 and 228C iso-
therms. This deficiency may have some implications for
accurate simulation of the Indo-Atlantic inter-ocean fluxes
of heat and salt.
The Sub-Tropical Convergence (STC) is the northern-
most front associated with the Antarctic Circumpolar Cur-
rent (ACC), and it exhibits the most prominent thermal and
salinity gradients both at the sea surface and at depth.22 The
STC surface temperature expression and its northern extent
is represented by the zone between the 14.28C and the
17.98C isotherms and reveals its meandering nature. The
Sub-Antarctic Front (SAF) displays weaker horizontal sur-
face temperature gradients than the STC, and is demarcated
by the 78C isotherm. The Antarctic Polar Front (APF) has a
Fig 2: Weekly average sea surface temperature (8C) fields from HYCOM (left panel) and from passive microwave observationsfrom the TRMM Microwave Imager and AMSR-E (right panel). The black contours represent isotherms 3.48, 78, 14.28, 17.98, 208,228, 258 and 288C.
32 Journal of Operational Oceanography Volume 1 No. 1 2008
The greater Agulhas Current system: An integrated study of its mesoscale variability
less distinct surface expression with an average middle tem-
perature expression of 3.48C. The mean latitudinal positions
of the STC, SAF and APF as outlined in24 of 418, 468 and
508S respectively agree reasonable well to locations given
by the microwave SST. Moreover HYCOM is also able to
reproduce agreeable mean latitudinal positions of these
fronts in the southern regions except the APF which does
not fall within the model domain.
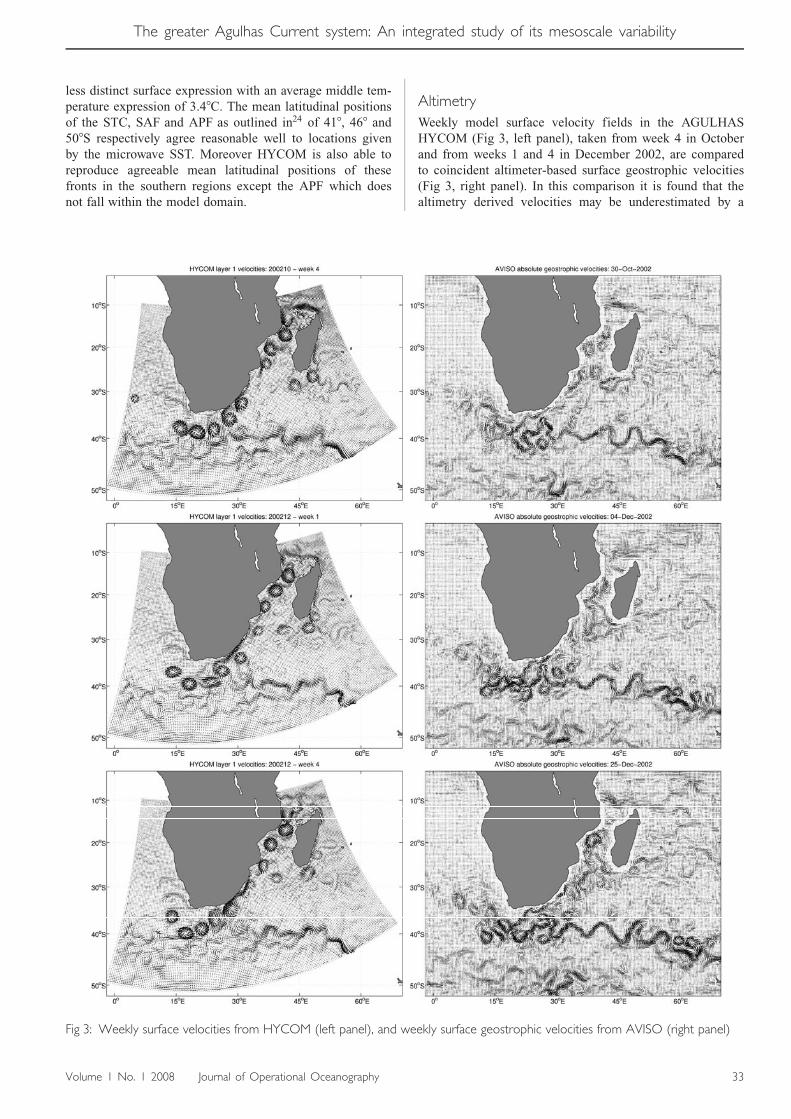
Altimetry
Weekly model surface velocity fields in the AGULHAS
HYCOM (Fig 3, left panel), taken from week 4 in October
and from weeks 1 and 4 in December 2002, are compared
to coincident altimeter-based surface geostrophic velocities
(Fig 3, right panel). In this comparison it is found that the
altimetry derived velocities may be underestimated by a
Fig 3: Weekly surface velocities from HYCOM (left panel), and weekly surface geostrophic velocities from AVISO (right panel)
Volume 1 No. 1 2008 Journal of Operational Oceanography 33
The greater Agulhas Current system: An integrated study of its mesoscale variability
factor of 1.5. This is probably due to the subsampling of the
altimeter, and the fact that a geostrophic velocities may
contribute substantially to the overall flow. Furthermore, as
the altimeter satellite tracks are not consistently perpendicu-
lar to the main flow direction of the Agulhas Current, the
maximum slope and surface geostrophic current are not
always captured. Hence, the more intense model velocity
field is not necessarily unrealistic. Overall these compari-
sons reveal that the observed circulation features in the
greater Agulhas Current system are reasonably well simu-
lated in HYCOM.
Both the HYCOM velocity fields and the surface geo-
strophic velocities suggest that the flow in the Mozambique
Channel is dominated by southward propagating anticyclo-
nic eddies, as previously documented.35 The horizontal
scales of the Mozambique Channel eddies simulated in
HYCOM are of comparable sizes to those observed from
altimetry, and are approximately 300km diameter. However,
in HYCOM these seem much more energetic. The model
indicates that these eddies tend to form north of the Davies
Ridge, near 15oS, and then move southward along the
western edge of the channel. Near 308S, they appear to
merge with the northern Agulhas Current. This behaviour is
strongly emphasised in HYCOM (see Fig 3, left panel).
Biastoch and Krauss3 document similar results in their
regional model of the Agulhas Current system, and claim
that a clear connection exists between eddies in the Mozam-
bique Channel and the Agulhas Current. The consistent
merger of Mozambique Channel eddies with the northern
Agulhas Current may thus be due to the fact that these
eddies are more energetic in HYCOM.
HYCOM shows that the East Madagascar Current
(EMC) splits into the northern and southern branches near
17oS, in agreement with previous literature.26 Surface velo-
cities from HYCOM in the southern branch reach up to
0.7m/s, with even stronger velocities, up to 1m/s, evident at
the northern tip of Madagascar. At the southern tip of
Madagascar, the southern EMC reveals a tendency to under-
take an anticyclonic return loop. Eddies, episodically detach
from this loop and travel westward where they eventually
interact with the northern Agulhas Current. As satellite
altimetry is unable to capture mesoscale ocean dynamics
close to the coast, it neither reveals the EMC split, nor the
strong southward flowing ‘mini’ western boundary current.
Altimetry does, however, provide evidence of a strong west-
ward flow north of Madagascar and also strongly supports
the notion of a retroflecting EMC south of Madagascar with
the formation of cyclonic and anticyclonic eddies as dis-
cussed.
The main features of the Agulhas Current are well
represented in the model. In the north, the Agulhas Current
intensifies near 27oS and closely follows the shelf edge,
which lies close to the coast, consistent with observations.19
Weekly mean surface velocities exceeding 1.5m/s are simu-
lated near the coast between 30oS and 35oS in agreement
with direct current meter measurements reported.8 HYCOM
suggests that the dominant mode of variability here occurs
in association with large anticyclonic eddies, approximately
300–350km diameter, propagating southwestwards from the
Mozambique Channel (Fig 3, left panel). Moreover, it
seems that these eddies consistently trigger Natal Pulses as
they pass the Natal Bight at 308S. The interaction of Mo-
zambique Channel eddies with the northern Agulhas Cur-
rent is also evident in the surface geostrophic velocity
observations from altimetry. However, upon approaching
the northern Agulhas Current, the spatial scales of the
eddies in the altimetry observations are smaller than those
in the model, and they also display weaker orbital veloci-
ties.
The shelf edge separates from the coast near 338S. As a
result, the current is steered away from the coast, becoming
increasingly unstable in its mean southwestward path. This
growing meandering nature of the southern Agulhas Current
is well represented in the surface geostrophic velocity ob-
servations from altimetry, as the core of the current is now
sufficiently far away from the coast. In comparison, the
mesoscale variability in HYCOM is simulated as a succes-
sion of southwestward propagating eddies in this region.
In the vicinity of the retroflection region the ocean
dynamics become intense and very complex. In the weekly
altimeter maps the surface current is observed to retroflect
in an anticyclonic loop somewhere near 16oE and between
39o and 40oS (Fig 3, right panel) with a diameter exceeding
300km, consistent with previous literature.28 Complete un-
derstanding of the mechanisms that influence and control
the retroflection of the Agulhas Current is lacking although
a number of theories have been put forward, such as con-
servation of potential vorticity and inertia (summarised
in11). In HYCOM, a train of southwestward propagating
eddies with diameters of about 200–250km seem to reach
the retroflection area, hence supplying mesoscale energy to
the complicated dynamics of the region (Fig 3, left panel).
This train of eddies extending from the Agulhas Plateau to
the retroflection has been a common feature in numerical
model simulations of the region. It was first reported by
Lutjeharms and Webb25 using the Fine Resolution Antarctic
Model (FRAM). Recently, Barnier et al1 showed that im-
proved numerics, in particular of the momentum advection
scheme, clearly improve the numerical simulation of this
region. Although the dominant weekly surface velocity pat-
tern induced by this train of eddies masks the position of
the retroflection in HYCOM, it is fairly well represented in
the longer term mean as addressed later.
Both altimetry and model data reveal that ring shedding
events occur at the retroflection. Agulhas Rings are unique,
because they form in association with a zonal protrusion of
the parent current, and are typically larger than rings
formed in association with current and frontal instabilities,
such as Gulf Stream or Kuroshio rings.30 Furthermore,
Agulhas Rings form a vital link through which warm, saline
water from the Indian Ocean is transported to the Atlantic
Ocean.18
In HYCOM, predominantly anticyclonic eddies with
scales of approximately 300km, can be seen propagating in
a general northwesterly direction into the Southeast Atlantic
Ocean. The horizontal scales and current intensities of these
vortices are somewhat exaggerated. In comparison to the
altimetry study,17 HYCOM fails to simulate the broad fan
of eddy trajectories into the Southeast Atlantic Ocean. Fu17
concluded that eddies in this region propagate in a relatively
34 Journal of Operational Oceanography Volume 1 No. 1 2008
The greater Agulhas Current system: An integrated study of its mesoscale variability
broad northwestward direction at a mean speed of 3–4 km/
day.
The eastward flowing current from the retroflection
region between 39oS and 40oS is known as the Agulhas
Return Current. HYCOM simulates the mean position of
this meandering return current in good agreement with the
altimeter observations as well as the satellite SST observa-
tions reported above. The semi-permanent meanders, pre-
viously documented,6 are visible in the surface geostrophic
velocity fields as well as in HYCOM, with their southern
crests evident near 298E, 358E and 438E. The gradual shift
of the core of the Agulhas Return Current towards higher
latitudes in the east is also evident in the model.
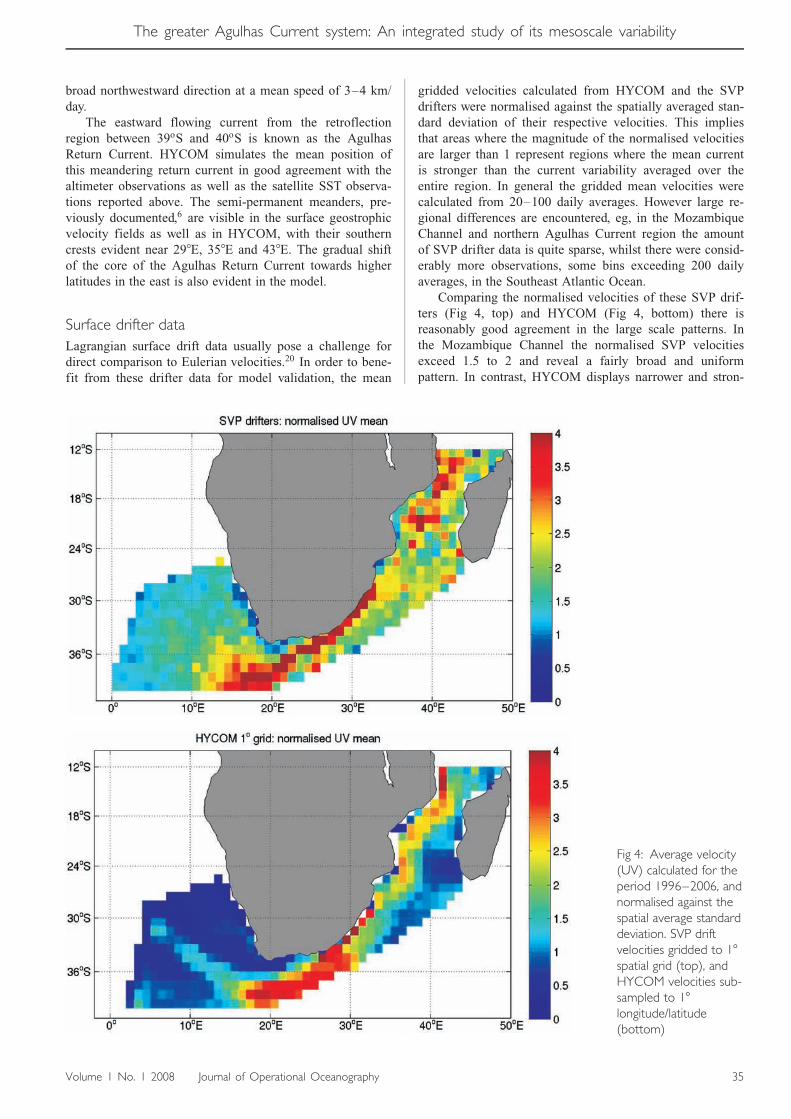
Surface drifter data
Lagrangian surface drift data usually pose a challenge for
direct comparison to Eulerian velocities.20 In order to bene-
fit from these drifter data for model validation, the mean
gridded velocities calculated from HYCOM and the SVP
drifters were normalised against the spatially averaged stan-
dard deviation of their respective velocities. This implies
that areas where the magnitude of the normalised velocities
are larger than 1 represent regions where the mean current
is stronger than the current variability averaged over the
entire region. In general the gridded mean velocities were
calculated from 20–100 daily averages. However large re-
gional differences are encountered, eg, in the Mozambique
Channel and northern Agulhas Current region the amount
of SVP drifter data is quite sparse, whilst there were consid-
erably more observations, some bins exceeding 200 daily
averages, in the Southeast Atlantic Ocean.
Comparing the normalised velocities of these SVP drif-
ters (Fig 4, top) and HYCOM (Fig 4, bottom) there is
reasonably good agreement in the large scale patterns. In
the Mozambique Channel the normalised SVP velocities
exceed 1.5 to 2 and reveal a fairly broad and uniform
pattern. In contrast, HYCOM displays narrower and stron-
Fig 4: Average velocity(UV) calculated for theperiod 1996–2006, andnormalised against thespatial average standarddeviation. SVP driftvelocities gridded to 18spatial grid (top), andHYCOM velocities sub-sampled to 18longitude/latitude(bottom)
Volume 1 No. 1 2008 Journal of Operational Oceanography 35
The greater Agulhas Current system: An integrated study of its mesoscale variability
ger normalised velocity pattern confined to the western
edge of the channel. The lack of a stronger signal southwest
of Madagascar may indicate that HYCOM places compara-
tively less emphasis on the contribution from the EMC
retroflection to the total volume flux in the Agulhas Cur-
rent. This aspect was also evident when considering the
zonal component of the flow (not shown).
The drifter data provides valuable information about the
Agulhas Current core, which is not represented in altimetry
observations due to their inability to provide accurate ob-
servations near the coast. Throughout the Agulhas Current,
both the drifter data and HYCOM show that the mean
current is generally stronger than the average variability. At
approximately 288-298S, the mean southwestward current
can be seen to intensify. This intensification is well repre-
sented in HYCOM and in good agreement with previous
literature. Evidence of the strong mean currents can also be
seen to extend southwestward toward the retroflection. Due
to the barotropic structure of the Agulhas Current, it closely
follows the shelf break, which widens near 248E, 348S.
Further downstream, at the southern most point of the
Agulhas Bank, the current separates from the shelf break.
Although the number of drifters are few, this is well cap-
tured in the surface drifter data and compares relatively well
with HYCOM.
The core locations of the retroflection area as depicted
in the normalised velocities of the drifters and HYCOM at
about 16–208E and 39–408S are in overall good agreement.
This core location is also in agreement with the altimeter
observations addressed above.
Distinct differences in normalised velocities are found
in the ring shedding corridor. The narrow path in the nor-
malised velocities confirms the tendency that the ring shed-
ding in HYCOM follows a northwestward path from the
retroflection. This is in contrast to the broader fan of nor-
malised drift velocities spreading out from the retroflection
in the drifter data. This is in agreement with the satellite
altimetry observations above.
Overall, the comparison to the satellite and in-situ ob-
servations indicates that HYCOM is able to simulate the
mesoscale variability and dynamics of the greater Agulhas
Current regime with satisfactory accuracy, although some
deficiencies are recognised. The large scale SST distribu-
tion in HYCOM is well represented, and with the exception
of reduced southwestward penetration of the southern Agul-
has Current, the characteristic SST patterns are evident. The
flow in the Mozambique Channel is dominated by south-
ward propagating eddies, and the horizontal scales in
HYCOM are comparable to surface geostrophic velocity
observations from altimetry. The northern Agulhas Current
intensification near 288-298S and its separation from the
coast further south is evident in the normalised velocities of
both the drifter observations as well as in HYCOM. The
mean position of the Agulhas retroflection is well repre-
sented, as well as the eastward flow of the Agulhas Return
Current with its semi-permanent meanders. The model si-
mulates ring shedding at the retroflection. However, in con-
trast to altimetry and drifter observations, these rings tend
to follow a too narrow northwestward path into the South-
east Atlantic Ocean.
In the next section, this observation-model inter com-
parison is extended with a space-time analysis of the
mesoscale features.
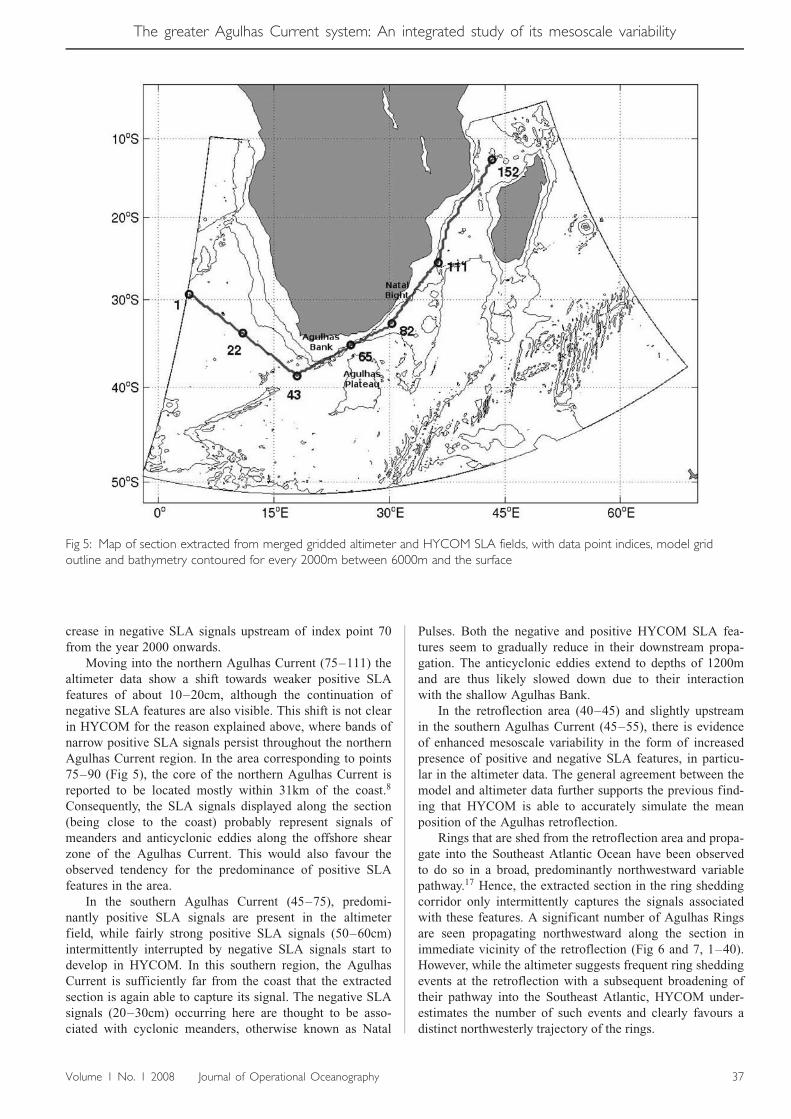
SPACE-TIME ANALYSISSLAs from HYCOM are produced by removal of the model
mean dynamic topography (assumed constant). Weekly
maps of SLA from altimetry and HYCOM are then used to
examine characteristic spatial and temporal frequency pat-
terns of the mesocale variability along the section marked
in Fig 5. This analysis was adopted from the approach
reported by Schouten et al.34 Data points along the sections
are assumed to capture the mesoscale variability in the
pathway of the greater Agulhas Current, extending from the
Mozambique Channel (data points 111–152) through the
northern Agulhas Current (75–111) and southern Agulhas
Current (45–75) to the retroflection area (40–45) and then
into the ring shedding corridor in the Southeast Atlantic
Ocean (1–40). Mesoscale feature occurrences and propaga-
tion speeds were estimated from Hovmoeller plots along the
section, while a fast Fourier transform (FFT) was applied to
the SLA time series at locations along the section to gain
further insight into the dominant variability modes in the
Agulhas Current system. A limitation of the approach cho-
sen is that the signals are interrupted whenever a mesoscale
feature moves off the section. We have, however, taken care
of picking the points on the apparent preferential paths so
that the statistics should be most stable. The results from
these analyses are further addressed in the next sub-
sections.
Hovmoeller analyses
Hovmoeller plots of SLA features from the altimeter and
the model are shown in Fig 6 and 7 from January 1996 until
December 2006. Positive SLA signals are assumed to repre-
sent anticyclonic eddies within the greater Agulhas Current
system. In general, the patterns displayed in the Hovmoeller
plots suggest the presence of southwestward propagating
mesoscale features with speeds ranging from about 7–
10km/day in the Mozambique Channel and northern Agul-
has Current to approximately 5km/day in the southern
Agulhas Current and retroflection region. In the ring shed-
ding corridor (points 1–40) the propagation speed is the
same as in the southern Agulhas current while the direction
shifts towards west-northwest with more distinct elongated
positive SLA features depicted in HYCOM.
In the Mozambique Channel (111–152) the altimeter
data shows that both positive and negative SLA features
with amplitude reaching up to � 60cm exist. A closer look
suggests a slight dominance of negative SLA features. HY-
COM shows a persistent train of positive features propagat-
ing downstream from the Mozambique Channel, which
compared to the altimetry seems too regular and structured.
Similarly, Biastoch and Krauss3 mention that the time and
space structure simulated in their model was less compli-
cated than in reality. Note that a slight negative trend in the
model sea surface height (SSH) was encountered for this
study period. This probably accounts for the apparent in-
36 Journal of Operational Oceanography Volume 1 No. 1 2008
The greater Agulhas Current system: An integrated study of its mesoscale variability
crease in negative SLA signals upstream of index point 70
from the year 2000 onwards.
Moving into the northern Agulhas Current (75–111) the
altimeter data show a shift towards weaker positive SLA
features of about 10–20cm, although the continuation of
negative SLA features are also visible. This shift is not clear
in HYCOM for the reason explained above, where bands of
narrow positive SLA signals persist throughout the northern
Agulhas Current region. In the area corresponding to points
75–90 (Fig 5), the core of the northern Agulhas Current is
reported to be located mostly within 31km of the coast.8
Consequently, the SLA signals displayed along the section
(being close to the coast) probably represent signals of
meanders and anticyclonic eddies along the offshore shear
zone of the Agulhas Current. This would also favour the
observed tendency for the predominance of positive SLA
features in the area.
In the southern Agulhas Current (45–75), predomi-
nantly positive SLA signals are present in the altimeter
field, while fairly strong positive SLA signals (50–60cm)
intermittently interrupted by negative SLA signals start to
develop in HYCOM. In this southern region, the Agulhas
Current is sufficiently far from the coast that the extracted
section is again able to capture its signal. The negative SLA
signals (20–30cm) occurring here are thought to be asso-
ciated with cyclonic meanders, otherwise known as Natal
Pulses. Both the negative and positive HYCOM SLA fea-
tures seem to gradually reduce in their downstream propa-
gation. The anticyclonic eddies extend to depths of 1200m
and are thus likely slowed down due to their interaction
with the shallow Agulhas Bank.
In the retroflection area (40–45) and slightly upstream
in the southern Agulhas Current (45–55), there is evidence
of enhanced mesoscale variability in the form of increased
presence of positive and negative SLA features, in particu-
lar in the altimeter data. The general agreement between the
model and altimeter data further supports the previous find-
ing that HYCOM is able to accurately simulate the mean
position of the Agulhas retroflection.
Rings that are shed from the retroflection area and propa-
gate into the Southeast Atlantic Ocean have been observed
to do so in a broad, predominantly northwestward variable
pathway.17 Hence, the extracted section in the ring shedding
corridor only intermittently captures the signals associated
with these features. A significant number of Agulhas Rings
are seen propagating northwestward along the section in
immediate vicinity of the retroflection (Fig 6 and 7, 1–40).
However, while the altimeter suggests frequent ring shedding
events at the retroflection with a subsequent broadening of
their pathway into the Southeast Atlantic, HYCOM under-
estimates the number of such events and clearly favours a
distinct northwesterly trajectory of the rings.
Fig 5: Map of section extracted from merged gridded altimeter and HYCOM SLA fields, with data point indices, model gridoutline and bathymetry contoured for every 2000m between 6000m and the surface
Volume 1 No. 1 2008 Journal of Operational Oceanography 37
The greater Agulhas Current system: An integrated study of its mesoscale variability
Frequency analysis
In order to gain further insight into the dominant variability
modes in the Agulhas Current system, a fast Fourier trans-
form (FFT) was applied to the 11 year altimetry and HY-
COM SLA time series at every point along the section (Fig
5). Prior to the FFT, a linear detrending function was
applied, and the outer 10% of the data were smoothed by
means of sinusoidal tapering function to minimise signal
noise and leakage. Further details and explanation of the
FFT is given in.7
The power spectra (Figs 8 and 9) obtained from the
Fourier analysis support the previous findings that there is
strong and regionally distinct variability throughout the
greater Agulhas Current system from the Mozambique
Fig 6: Hovmoeller plotof altimeter SLA fields(SLA in cm) extractedfrom the sectionmarked in Fig 4
Fig 7: Hovmoeller plotof HYCOM SLA fields(SLA in cm) extractedfrom the sectionmarked in Fig 4
38 Journal of Operational Oceanography Volume 1 No. 1 2008
The greater Agulhas Current system: An integrated study of its mesoscale variability
Channel to the ring shedding corridor. A broad spectrum of
frequencies is evident (Nyquist frequency is at about 24 per
year), ranging from about 21 days (18 per year) to monthly
(12 per year), seasonal (4–6 per year) and annual. There
are differences between the two spectra, in particular mani-
fested from region to region. In addition to the distribution,
we consider the individual frequencies which clearly stand
out from the background.
The northern Agulhas Current and MozambiqueChannel
In the northern Agulhas Current and Mozambique Channel
(indices 75 to 152), the frequency range is slightly com-
pressed to the lower frequencies from about 2–6 per year in
altimetry versus 4–6 per year in HYCOM. This suggests
that the model is not able to properly represent the half-
annual signal in this area as captured in altimetry. On the
Fig 8: Power spectrumfor extracted section(Fig 4) derived from 11years of mergedgridded altimeter SLAfields
Fig 9: Power spectrumfor extracted section(Fig 4) derived from 11years of HYCOM SLAfields
Volume 1 No. 1 2008 Journal of Operational Oceanography 39
The greater Agulhas Current system: An integrated study of its mesoscale variability
other hand, HYCOM simulates more high frequency varia-
bility of about 12–16 per year in the southern part of the
Mozambique Channel and northern Agulhas Current (75–
120). These higher frequencies, which are not present in the
altimetry SLAs, are perhaps a result of the abundant num-
ber of meanders and eddies propagating downstream from
the Mozambique Channel in HYCOM as was addressed in
the previous section (Fig 3, left panel).
A distinct frequency peak at 5–6 per year in the Mo-
zambique Channel is visible in both HYCOM (90–140) and
altimetry (but only extending from indices 120–140). This
is consistent with the southwestward propagation of SLA
features depicted in the Hovmoeller plots (Fig 6 and 7) and
provide statistical evidence that eddies occur 5–6 times per
year in the Mozambique Channel. Schouten et al34 show
that the number of anomalies per year in the Mozambique
Channel reduce from 7 in the north to 4 in the south due to
smaller eddies dissipating or merging with larger ones. This
could explain some of the slight differences evident be-
tween HYCOM and altimetry. In HYCOM, this 5–6 per
year signal is clearly seen to extend southwestward into the
northern Agulhas Current (until index 90), again in agree-
ment with the Hovmoeller plot. As mentioned previously
this is an indication that an inter-connection between up-
stream mesoscale eddies in the Mozambique Channel and
the Agulhas Current system exists at this frequency. Further
downstream in the northern Agulhas Current (located at
indices 85–90), there seems to be a discontinuity of the
frequency signals in HYCOM. In the Hovmoeller plot (Fig
7), this seems to be a region where the mesoscale features
are intermittently suppressed in HYCOM. This is not
equally evident in the altimeter Hovmoeller and power
spectrum.
The southern Agulhas Current and retroflection
The southern part of the Agulhas Current system (45–75)
appears to maintain evidence of the southwestward exten-
sion of the frequency peak at 5–6 per year to about index
70 in HYCOM. In the altimeter data a southwestward ex-
tension to about the same position is observed at a fre-
quency peak of about 4–5 per year. Southwestward from
this position the frequency distribution in the altimeter data
broadens from the annual frequency up to 7 per year.
HYCOM also shows this, in addition to a strong 3–4 per
year signal. It remains unclear to what extent and by which
mechanisms the Agulhas Plateau (south of point 65) influ-
ences the mesoscale variability in this area. While the 3–4
per year frequency signal seems to extend towards the retro-
flection area (40–45) in HYCOM, there is an apparent
discontinuity present in the altimeter derived frequencies at
point 55. This area of the Agulhas Current (40–45) is con-
sidered to have limited influence from the monsoon cir-
culation.32 The annual to seasonal signals may thus be
attributed to a variety of other sources including seasonal
signals of the regional wind field.29
Southwestward from point 55 to the retroflection area
both the altimeter and HYCOM contain strong signals from
the annual frequency up to 8 per year. The broadening of
the frequency distribution here provides a good indication
of the position of the retroflection in the section, and both
the model and altimetry power spectra indicate a mean
position of the Agulhas retroflection at index 43. Whereas
HYCOM lacks distinct expressions of frequencies larger
than the monthly signal, the altimeter data shows strong
signals in the retroflection area reaching almost up to 18
per year. This result is consistent with the increased amount
of instabilities in the southern Agulhas Current and the
retroflection region observed in the Hovmoeller plots (Fig 6
and 7). Similarly, the lack of the higher frequencies in
HYCOM is also anticipated from the pattern of propagating
SLA features seen in the Hovmoeller plot (Fig 7).
The ring shedding corridor
In the ring shedding corridor (1–40) the frequency range
rapidly decreases with distance from the retroflection area,
eg, from 10–11 to 1 per year in the altimetry and from 8–9
to 1–2 per year in HYCOM. This is expected for the area,
where rings are known to travel along a variety of pathways,
resulting in a broad fan-shaped area of ring propagation and
mesoscale variability in the Southeast Atlantic Ocean.17 In
agreement with the Hovmoeller plots this frequency de-
crease indicates that the signals of the rings drifting into the
Southeast Atlantic Ocean become less frequently captured
with increasing distance from the retroflection area. In the
upstream part near the retroflection (30–40) the altimetry
reveals northwestward extending signals of an enhanced
frequency at 5, 3–4 and 1.5–2 per year. In comparison,
HYCOM reveals signals at 3–4, 2–3 and 1.5–2 per year
extending northwestward into the Southeast Atlantic Ocean.
These signals suggest that eddies are shed from the retro-
flection area up to five times per year in the altimetery data,
while the more suppressed frequency range in HYCOM
suggests that ring shedding events occur about three times
per year. The overall suppression of mesoscale frequency
signals westward of data index point 5 (20 grid cells from
the HYCOM model boundary) arises from the one-way
nesting scheme implemented in HYCOM, which dissipates
the mesoscale signal near the western open boundary of the
model.
From the above analyses, we conclude that intense in-
stabilities and hence strong mesoscale variability is found
throughout the Agulhas Current system. Furthermore, it is
highlighted that mesoscale features propagating downstream
from their origin in the Mozambique Channel at approxi-
mately 5–6 times per year play an important role in con-
tributing to the overall mesoscale variability in the central
and northern parts of the Agulhas Current. There is also
evidence that upstream meanders and eddies occasionally
influence the ring shedding processes at the retroflection.
Feature tracking and drift estimates
The annual average occurrence of southwestward propagat-
ing meanders and anticyclonic eddies, determined from the
Hovmoeller and FFT analyses are summarized in Table 1
for both altimetry and HYCOM. The results are grouped
according to the different regions along the section from the
Mozambique Channel in the northeast via the northern and
40 Journal of Operational Oceanography Volume 1 No. 1 2008
The greater Agulhas Current system: An integrated study of its mesoscale variability
southern Agulhas Current into the Agulhas retroflection
area and ring shedding corridor in the southwest.
From altimetry, the eddy occurrence estimates of 4.4,
3.4 and 3.1 per year for the Mozambique Channel, Agulhas
retroflection and the ring shedding corridor respectively are
in good agreement with the associated power spectrum. In
the northern and southern Agulhas Current, the respective
altimeter signals in the FFT cannot be confidently isolated
from the background signal. In HYCOM, on the other hand,
the eddy occurrences from the Hovmoeller analysis are in
good agreement with the FFT analysis for all regions of the
section.
The comparison provided in Table 1 highlight the good
consistency between the results independently obtained
from the FFT and Hovmoeller analyses. In particular, the
results indicate that Mozambique Channel eddies consis-
tently merge with the northern Agulhas Current, thereby
stimulating the formation of Natal Pulses. Furthermore,
about 70% of the Mozambique Channel eddies observed in
the altimetry appear at the Agulhas Plateau, while almost
2/3 are advected further southwestward towards the Agulhas
retroflection, where they contribute to the mesoscale varia-
bility and ring shedding processes. These results are sup-
ported by HYCOM, except in the retroflection and ring
shedding corridor the frequencies of occurrences are
slightly weaker.
The mean speeds and standard deviations of the antic-
yclonic eddies and meanders can be estimated directly from
the Hovmoeller plots for the regions from the Mozambique
Channel to the retroflection area and ring shedding corridor.
These results are presented in Fig 10 together with the
average surface speed obtained from the drifters for the
same sub-regions.
The drift estimates range from a maximum of 12km/day
Altimetry observations HYCOM simulationLocation observed Data point indices FFT Hovmoeller
annual avg.FFT Hovmoeller
annual avg.Mozambique Channel 111–152 5–6 4.4 5–6 5.2Northern Agulhas Current 65–111 N/A 4.5 5–6 5.3Southern Agulhas Current 43–65 N/A 3.7 3–4 3.6Agulhas Retroflection 43 3–4 3.4 2–3 2.2Ring shedding corridor 1–43 3 3.1 2 1.9
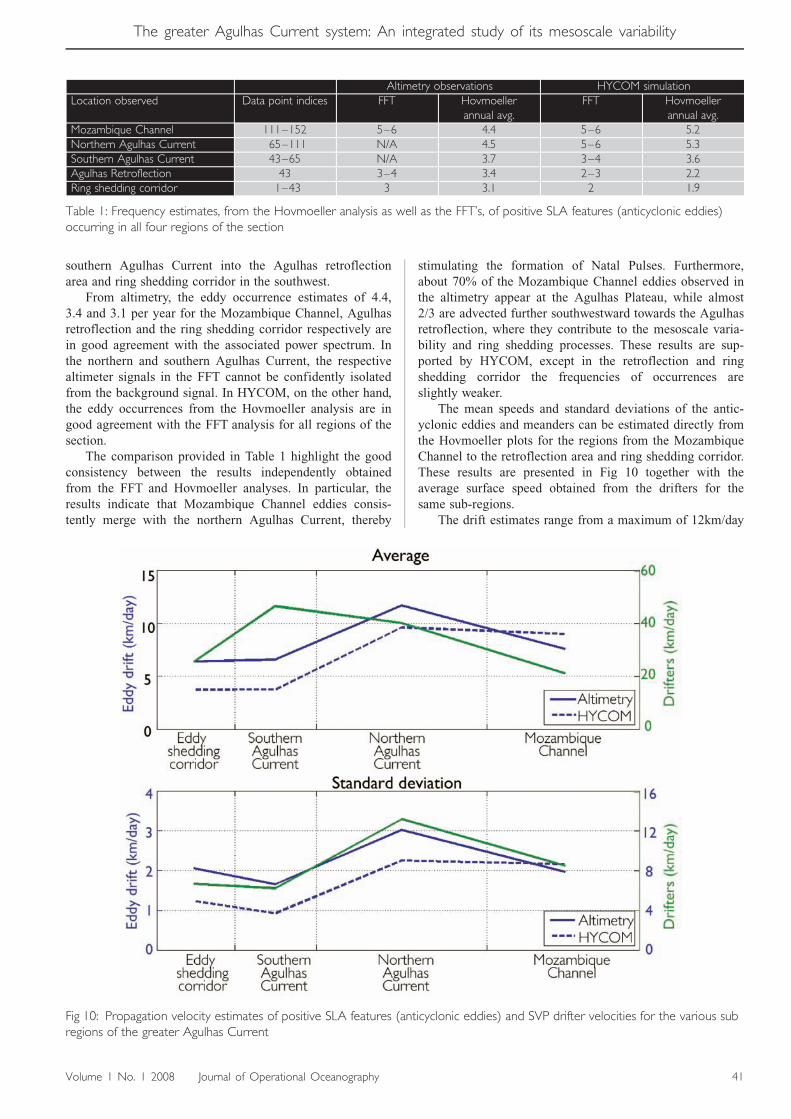
Table 1: Frequency estimates, from the Hovmoeller analysis as well as the FFT’s, of positive SLA features (anticyclonic eddies)occurring in all four regions of the section
Fig 10: Propagation velocity estimates of positive SLA features (anticyclonic eddies) and SVP drifter velocities for the various subregions of the greater Agulhas Current
Volume 1 No. 1 2008 Journal of Operational Oceanography 41
The greater Agulhas Current system: An integrated study of its mesoscale variability
in the central part of the northern Agulhas Current to
3.5km/day in the southern Agulhas Current and ring shed-
ding corridor. On average, throughout the entire section,
their propagation velocity is 7.5km/day. The altimeter drift
estimates consistently exceed HYCOM by about 3km/day,
except in the Mozambique Channel where HYCOM ex-
ceeds the altimeter by 1.5km/day. The variability of the
eddy drift is also higher in the altimeter data, exceeding
HYCOM by 0.75km/day in the standard deviation. The
journey of anticyclonic eddies from the Mozambique Chan-
nel to the retroflection area, a distance of approximately
3000km, will thus take about 400 days.
These drift estimates are slightly different to previously
reported estimates.34,35 For example, Mozambique Channel
eddies travel at 7 �2km/day/9 �2km/day (Fig 10, Altime-
try/HYCOM observations) both much faster than the speed
of 3–6km/day reported35 from altimetry observations.
These differences are due to the fact that the drift velocities
here are estimated from the Hovmoeller plots, while Schou-
ten et al35 manually tracked the eddy propagation.
In the northern Agulhas Current the drift is 11 �3km/
day for altimetry and 9 �2km/day for HYCOM. This is in
good agreement to the documented propagation velocity of
Natal Pulses (10km/day). Additionally, negative SLA sig-
nals, or Natal Pulses, are periodically observed in the Hov-
moeller plots (Fig 6 and 7) at 308S (index 90), and in
almost all cases they are preceded by a positive SLA signal.
This strongly supports that Natal Pulses are in fact induced
by passing Mozambique Channel eddies, as was sug-
gested.34 This behaviour can be seen to occur regularly in
HYCOM (eg, Fig 3, left panel).
As expressed by Jacobsen et al20 the direct comparison
of these drift estimates to the Lagrangian current velocities
calculated from the surface drifters (Fig 10, green curves) is
not straight forward, and neither is the relationship between
the mean current velocity and the propagation speed of
eddies. However, we would like to examine whether the
eddy propagation speed and the mean current velocities are
spatially correlated. The surface drifters provide a good
indication of the background mean current and its standard
deviation, which ranges from 20 �8km/day (0.2 �0.09m/s)
in the Mozambique Channel to 50 �13km/day (0.6
�0.15m/s) in the region of the Agulhas Current and 30
�6km/day (0.3 �0.07m/s) in the ring shedding corridor.
For most parts the estimated eddy drifts and standard devia-
tions in altimetry and HYCOM reach only a quarter of this
mean surface drift and standard deviation obtained from the
drifters. The anticyclonic eddies extend to depths of about
1200m in HYCOM. It is therefore not unrealistic that the
mean eddy drift in altimetry and HYCOM are less than the
mean surface drift derived form the drifters. In addition,
the deeper part of the eddies are expected to interact with
bathymetry which will further tend to slow down their drift.
On the other hand, the spatial patterns of the standard
deviations detected in altimetry, HYCOM and the surface
drifters are more consistent. The variability of the eddy drift
in HYCOM and altimetry therefore appears to be correlated
with the variations observed in the mean surface current.
Hence, the strength of the mean surface current and eddy
drift correlate well with the variations in eddy drift.
SUMMARY AND CONCLUSIONThe greater Agulhas Current system known for its intense
dynamics and mesoscale variability is an excellent natural
laboratory for studies combining numerical ocean models
with satellite and in-situ observations. This is demonstrated
in this study for a period of 11 years from 1996 to 2006.
HYCOM reproduces the general circulation pattern with the
regional characteristic spatial and temporal variability rea-
sonably well, although some deficiencies are encountered,
notably the train of eddies extending from the Agulhas
Plateau to the retroflection, and the exaggerated spatial
scales of Agulhas Rings that display a too narrow drift
pathway into the ring shedding corridor in the Southeast
Atlantic Ocean.
The space-time analyses provide quantitative means for
validation of the model variability, and are also applicable
to other ocean current regimes, such as the Gulf Stream and
Kuroshio Current. Anticyclonic eddies occur in the Mozam-
bique Channel at a frequency of 5–6 per year. In both
HYCOM and altimetry SLA fields these anticyclonic eddies
drift southwards and merge with the offshore side of the
northern Agulhas Current. The model indicates that this
occurs consistently at this frequency and that this merger
contributes to the triggering of Natal Pulses. Furthermore,
eddy propagation velocities determined from the Hovmoel-
ler analyses suggest that the anticyclonic eddies in the
northern Agulhas Current propagate at approximately the
same velocity as Natal Pulses, which further supports
the idea that these southwestward propagating eddies induce
the formation of Natal Pulses. About 70% of the Mozambi-
que Channel eddies are tracked southwestward to the south-
ern Agulhas Current, and ultimately nearly 2/3 of these
appear at the retroflection where they contribute towards
the mesoscale variability and ring shedding.
Upon approaching the retroflection region, the magni-
tude of the SLA in altimetry and HYCOM enhances and
the SLA oscillates more frequently between positive and
negative signals and the power spectra indicate this through
a broadening of the frequency spectrum. HYCOM and the
altimetry data are moreover in very close agreement con-
cerning the mean position of the Agulhas retroflection. The
ring shedding events are revealed to occur in the altimetry
at a frequency of 5 per year. In comparison HYCOM dis-
plays ring shedding events occurring approximately 3–4
times per year.
Adequate validation of HYCOM is mandatory for
further investigation of the greater Agulhas Current regime.
In this study the model capacity has been satisfactorily
documented by intercomparison to satellite passive micro-
wave radiometry, radar altimetry and surface drifter data. In
particular, evidence of anticyclonic eddy drift from the
Mozambique Channel to the retroflection area is demon-
strated. HYCOM is therefore qualified for operational fore-
casting experiments of the greater Agulhas Current regime.
Moreover, since the Indo-Atlantic inter-ocean exchange of
volume, heat and salt occurs predominantly via shedding of
Agulhas Rings, it is important to accurately simulate the
combination of local and upstream processes that triggers
these shedding events. Operational use of HYCOM can
42 Journal of Operational Oceanography Volume 1 No. 1 2008
The greater Agulhas Current system: An integrated study of its mesoscale variability
therefore also contribute to advancing the understanding of
these episodic dynamic events.
ACKNOWLEDGEMENTSWe would like to thank the team at the Mohn-Sverdrup
Center for their technical support with the implementation
of the Hybrid Coordinate Ocean Model to the greater Agul-
has Current system. In particular, special thanks go to Nina
Gjerde Winther, Knut-Arild Lisæter, Francois Counillon,
Belma Batlak and Steinar Orre. This work has been sup-
ported by the Mohn-Sverdrup Center for Global Ocean
Studies and Operational Oceanography, through a private
donation from Trond Mohn C/O Frank Mohn AS, Bergen,
Norway, and a grant for CPU time from the Norwegian
Supercomputing (NOTUR) project. In addition the benefit
from the MERSEA project at NERSC supported by the
European Commission under contract SIP3-CT-2003–
502885 is recognised. We are also grateful for the data
supply from CNES, Remote Sensing Systems and Fisheries
& Oceans Canada, and NASA that made this study feasible.
REFERENCES1. Barnier B, Madec M, Pendruff T, Molines J-M, Tre-
guier A-M, Le Sommer J, Beckmann A, Biastoch A, Bon-
ing C, Dengg J, Derval C, Durand E, Gulev S, Remy E,
Talandier C, Theetten S, Maltrud M, McClean J and De-
Cuevas B. 2006. Impact of partial steps and momentum
advection schemes in a global ocean circulation model at
eddy permitting resolution. Ocean Dynamics, 56(5–6):
543–567.
2. Bentsen M, Evensen G, Drange H and Jenkins AD.
1999. Coordinate transformation on a sphere using confor-
mal mapping. Mon. Weather Rev., 127: 2733–2740.
3. Biastoch A and Krauss W. 1999. The role of mesos-
cale eddies in the source regions of the Agulhas Current. J.
Phys. Oceanogr., 29: 2303–2317.
4. Bleck R. 2002. An oceanic general circulation model
framed in hybrid isopycnic-Cartesian coordinates. Ocean
Modelling, 37: 55–88.
5. Bleck R and Smith L. 1990. A wind-driven isopycnic
coordinate model of the North Atlantic and Equatorial
Atlantic Ocean. 1: Model development and supporting ex-
periments. J. Geophys. Res., 95: 3273–3285.
6. Boebel O, Rossby T, Lutjeharms JRE, Zenk W and
Barron C. 2003. Path and variability of the Agulhas Return
Current. Deep-Sea Res. (II Top. Stud. Oceanogr.), 50:
35–56.
7. Bracewell R. 1999. The Fourier Transform and its
application. New York, McGraw-Hill.
8. Bryden HL, Beal LM and Duncan LM. 2005. Struc-
ture and transport of the Agulhas Current and its temporal
variability. J. Oceanogr., 61: 479–492.
9. Chelton DB, de Szoeke RA, Schlax MG, Naggar KE
and Siwertz N. 1998. Geographical variability of the first-
baroclinic Rossby radius of deformation, J. Phys. Oceanogr.,
28: 433–460.
10. Dai A and Trenberth KE. 2002. Estimates of fresh-
water discharge from continents: Latitudinal and seasonal
variations. Journal of Hydrometeorology, 3(6): 660–687.
11. de Ruijter WPM, Biastoch A, Drijfhout SS, Lutje-
harms JRE, Matano RP, Pichevin T, van Leeuwen PJ and
Weijer W. 1999a. Indian-Atlantic interocean exchange: Dy-
namics, estimation and impact. J. Geophys. Res., 104(C9):
20885–20910.
12. de Ruijter WPM, van Leeuwen PJ and Lutjeharms
JRE. 1999b. Generation and evolution of Natal Pulses:
solitary meanders in the Agulhas Current. Journal of Phys.
Oceanogr., 29(12): 3043–3055.
13. de Ruijter WPM, Ridderinkhof H, Lutjeharms JRE,
Schouten MW and Veth C. 2002. Observations of the flow
in the Mozambique Channel. Geophys. Res. Lett., 29(10):
1502–1504.
14. de Ruijter WPM, van Aken HM, Beier E, Lutje-
harms JRE, Matano RP and Schouten MW. 2004. Eddies
and dipoles around South Madagascar: formation, pathways
and large- scale impact. Deep-Sea Res., 51: 383–400.
15. Ducet N, Traon PYL and Reverdin G. 2000. Global
high-resolution mapping of ocean circulation from TOPEX/
Poseidon and ERS-1 and -2. J. Geophys. Res., 105: 19477–
19498.
16. Dumenil L, Isele K, Liebscher H, Schroder U, Schu-
macher M and Wilke K. 1993. Discharge data from 50
selected rivers for GCM validation. Max-Planck-Institut fur
Meteorologie.
17. Fu L-L. 2006. Pathways of eddies in the South
Atlantic Ocean revealed from satellite altimeter observa-
tions, Geophys. Res. Lett., 33: L14610, doi:10.1029/
2006GL026245.
18. Gordon AL. 1985. Indian-Atlantic transfer of ther-
mocline water at the Agulhas Retroflection. Science, 227:
1030–1033.
19. Grundlingh ML. 1983. On the course of the Agulhas
Current. S. Afr. Geograph. J., 65: 49–57.
20. Jakobsen PK, Ribergaard MH, Quadfasel D,
Schmith T and Hughes CW. 2003. Near-surface circulation
in the northern North Atlantic as inferred from Lagrangian
drifters: Variability from the mesoscale to interannual. J.
Geophys. Res., 108(C8): 3251, doi:10.1029/2002JC001554.
21. Legates D and Willmott C. 1990. Mean seasonal
and spatial variability in gauge-corrected, global precipita-
tion. J. Clim., 10: 111–127.
22. Lutjeharms JRE. 1985. Location of frontal systems
between Africa and Antarctica: some preliminary results.
Deep-Sea Res., 32 (12): 1499–1509.
23. Lutjeharms JRE and Roberts HR. 1988. The Natal
Pulse: An extreme transient on the Agulhas Current.
J. Geophys. Res., 93: 631–645.
24. Lutjeharms JRE and Valentine HR. 1984. Southern
Ocean thermal fronts south of Africa. Deep-Sea Res.,
31(12): 1461–1475.
25. Lutjeharms JRE and Webb DJ. 1995. Modelling the
Agulhas Current system with FRAM (Fine Resolution Ant-
arctic Model). Deep-Sea Res., 42(4): 523–551.
26. Lutjeharms JRE, Wedepohl PM and Meeuwis JM.
2000. On the surface drift of the East Madagascar and the
Mozambique Currents. S. Afr. J. Sci., 96: 141–147.
27. Lutjeharms JRE. 2007. Three decades of research
Volume 1 No. 1 2008 Journal of Operational Oceanography 43
The greater Agulhas Current system: An integrated study of its mesoscale variability
on the greater Agulhas Current. Ocean Science, 3, 129–
147.
28. Lutjeharms JRE and van Ballegooyen R. 1988. The
Retroflection of the Agulhas Current. Journal of Physical
Oeanography, 18, 1570–1583.
29. Matano RP, Simionato CG and Strub PT. 1999.
Modelling the wind-driven variability of the South Indian
Ocean. J. Phys. Oceanogr., 29: 217–230.
30. Pichevin T, Nof D and Lutjeharms JRE. 1999. Why
are there Agulhas Rings. J. Phys. Oceanogr., 29(4): 693–
707.
31. Quartly GD and Srokosz MA. 2004. Eddies in the
southern Mozambique Channel. Deep-Sea Res. (II Top.
Stud. Oceanogr.), 51(1–3): 69–83.
32. Ridderinkhof H and de Ruijter WPM. 2003. Moored
current observations in the Mozambique Channel. Deep-Sea
Res. (II Top. Stud. Oceanogr.), 50: 1933–1955.
33. Sætre R and da Silva AJ. 1984. The circulation of
the Mozambique Channel. Deep-Sea Res., 31: 485–508.
34. Schouten MW, de Ruijter WPM and van Leeuwen
PJ. 2002. Upstream control of Agulhas Ring shedding.
J. Geophys. Res., 107(C8): 3109–3120.
35. Schouten MW, de Ruijter WPM, van Leeuwen PJ
and Rifferinkhof H. 2003. Eddies and variability in the
Mozambique Channel. Deep-Sea Res., 50: 1987–2003.
36. Siedler G, Rouault M and Lutjeharms JRE. 2006.
Structure and origin of the subtropical South Indian Ocean
Countercurrent. Geophys. Res. Lett., 33: L24609,
doi:10.1029/2006GL027399.
37. Slutz R, Hiscox SLJ, Woodruff S, Jenne R, Joseph
D, Steurer P and Elms J. 1985. Comprehensive ocean-
atmosphere dataset; Release 1. Tech. Rep. NTIS PB86–
105723, NOAA Environmental Research Laboratories,
Climate Research Program, Boulder, CO.
38. Stramma L and Lutjeharms JRE. 1997. The flow
field of the subtropical gyre in the South Indian Ocean.
J. Geophys. Res., 99: 14053–14070.
39. Teague WJ, Carron M and Hogan PJ. 1990. A com-
parison between the Generalized Digital Environmental
Model and Levitus climatologies. J. Geophys. Res., 95(C5):
7167–7183.
40. Troccoli A and Kallberg P. 2004. Precipitation cor-
rection in the ERA-40 reanalysis. ERA-40 Project Report
Series, (13):6.
41. Uppala SM, Kallberg PW, Simmons AJ, Andrae U, Da
Costa Bechtold V, Fiorino M, Gibson JK, Haseler J, Hernan-
dez A, Kelly GA, Li X, Onogi K, Saarinen S, Sokka N, Allan
RP, Andersson E, Arpe K, Balmaseda MA, Beljaars ACM,
Van De Berg L, Bidlot J, Bormann N, Caires S, Chevallier F,
Dethof A, Dragosavac M, Fisher M, Fuentes M, Hagemann
S, Holm E, Hoskins BJ, Isaksen L, Janssen PAEM, Jenne R,
McNally AP, Mahfouf J-F, Morcrette J-J, Rayner NA,
Saunders RW, Simon P, Sterl A, Trendberth KE, Untch A,
Vasiljevic D, Viterbo P and Woolen J. 2005. The ERA-40
re-analysis. Q.J.R Meteorol. Soc., 131 (612): 2961–3012.
42. van Leeuwen PJ, de Ruijter WPM and Lutjeharms
JRE. 2000. Natal Pulses and the formation of Agulhas
Rings. J. Geophys. Res., 105: 6425–6436.
44 Journal of Operational Oceanography Volume 1 No. 1 2008
The greater Agulhas Current system: An integrated study of its mesoscale variability