the growth and changing complexion of luton’s population · o luton’s population live in...
TRANSCRIPT

The growth and changing
complexion of Luton’s population
A structural analysis and
decomposition
Dr L. Mayhew Sam Waples Mayhew Harper Associates Ltd. January 2011 [email protected]
Luton population growth and change
2
Executive summary
In recent years, Luton has experienced significant in-migration from Eastern Europe
(both EU and non-EU countries), West Africa and elsewhere. This has significantly
changed the demographic composition and ethnic complexion of the town. This in
turn has impacted upon public service delivery and processes of engagement between
the Council (and other public bodies) and local communities. The Council recognises
the importance of understanding the demographics of the town when planning and
delivering services and in engaging with its diverse communities.
The Council is aware of the limitations of official statistics in providing this evidence.
In particular, the limitations of the 2001 Census, where Luton experienced one of the
lowest response rates in the country. The Council does not accept that the ONS Mid-
Year Population Estimates are an accurate measure of the population of the town. In
turn, this means that the Council does not accept the ONS experimental ethnicity
estimates as being accurate.
The Migration Impact Fund provided an opportunity to plug this gap in knowledge.
The Luton Local Strategic Partnership accepted the business case for research into the
changing population of Luton and released MIF monies for this purpose. The Council
commissioned Mayhew Harper Associates Ltd. to undertake this work with the
following terms of reference:
These were to:
o identify the ‘new communities’ within Luton
o understand the demographic profiles of these new communities
o understand the drivers of migration and how it will change the Luton
population in the future
o understand the drivers of migration and how it will impact upon these new
communities in Luton
o develop a proactive approach to monitoring and assessing the Luton
population.
Mayhew Harper Associates Ltd. used administrative data provided by the Borough
Council and NHS Luton to measure and profile Luton’s population. These data were
supplemented by analysis of a ‘names’ database to help with the identification of
different ethnicities. The analysis is a snapshot of Luton in 2010.
The key findings of the research are:
o Luton’s population is a confirmed minimum of 202,748. This is comparable
with the Council’s own estimate of 204, 700 and significantly above the ONS
Mid-Year Estimate of 194,400.
o Luton’s population live in approximately 77,000 households.
o Average household size in Luton is 2.6 – which is above national averages and
has not decreased since the 2001 Census.
Luton population growth and change
3
o There is wide variation in household size amongst different ethnic groups –
with Asian households being larger than average.
o There have been significant shifts in the ethnic composition of Luton since the
last Census including:
generally increasing ethnic diversity among the population
growth in the Asian population from 33,600 to 50,200;
the Black population increasing from 11,700 to 19,800;
a decline in the White and ‘other’ population from 139,000 to 132,000.
concentrations of different groups across the town, for example
Turkish people in Farley
high turnover of population with estimates that between 50% and 75%
of the population would not have lived in Luton or not have been born
at the time of the 2001 Census.
The key recommendations of the research are to:
o undertake periodic snapshots to understand and monitor demographic changes
over time
o use the evidence in the study to ensure that different ethnic groups are familiar
with the 2011 Census – its importance, the legal obligations, and the form
itself
o take a snapshot that is synchronised with the 2011 Census to provide evidence
to challenge the ONS in event that the Census has a low level of enumeration
and the resultant population figures are significantly lower than anticipated
o develop a single database of all residents (linked to LLPG) that contains key
demographic information and is at the hub of all Council systems
o link all administrative data with the LLPG with appropriate data management
arrangements to provide the basis for demographic intelligence and local level
population profiling
o work with NHS Luton to ensure continued access to key datasets ‘owned’ by
the NHS such as GP Registration Data
o link partnership data to the LLPG to provide high quality intelligence to
support demographic profiling, service planning and monitoring and reduce
reliance on external datasets
Acknowledgements
The authors are most grateful to Paul Barton and Eddie Holmes from the Council’s
Research and Intelligence Team, Caroline Thickens from NHS Luton and to all who
supplied administrative data without which this analysis would not be possible.
Luton population growth and change
4
Contents
1. Introduction
2. Data on migration
3. Counting Luton’s population using administrative data
4. Households by type, benefit and tenure status and occupancy
5. Ethnicity by broad groupings
6. Population by household and ethnic grouping
7. Income deprivation by ethnicity and age
8. Conclusions
Annex A: Analysis of administrative data using Polish surnames
Annex B: Map of households with 6 or more people
Annex C: Ward level tables by age and ethnicity
Dr Les Mayhew
Mayhew Harper Associates Ltd.
February 2011
Luton population growth and change
5
The growth and changing complexion of Luton’s population
~ A structural analysis
1. Introduction
In recent years, Luton has experienced significant in-migration from EU and non-EU
countries and from West Africa, as well as major growth in the number of people
from Pakistan, Bangladesh and India. This has changed the demographic composition
of the town with a resultant impact on the delivery of public services and levels of
engagement with different communities.
A number of key demographic data sources such as the 2001 Census are now
outdated. Population data on ethnicity is now largely invalidated by subsequent
inflows and the underlying demographic composition of the town has undergone a
radical shift, as the population has grown.
Previously Luton had a traditional demographic profile with a dominantly white
population complemented by two or three large ethnic groups (Pakistani, Afro-
Caribbean) and a larger number of relatively small groups.
This has now changed with the addition of new communities from eastern and
southern Europe and also people from various African countries. When added to the
more established populations, this reinforces the perception that Luton is now
becoming more diverse both culturally and ethnically.
Luton Council’s Research & Intelligence Team is investigating this aspect of Luton’s
population and commissioned Mayhew Harper Associates to examine the current
position in more detail by quantifying as far as possible the major ethnic groups and
analysing them demographically.
This is an important undertaking. The Council is committed to ensuring that its
service delivery meets the needs of its community and is also aware that it does not
necessarily fully understand the needs of its new communities. Some of these new
communities comprise young adults and do not necessarily engage with public sector
bodies.
Without a full understanding of the demographics of the new communities the
Council cannot be certain that its attempts to engage with these communities will be
effective. It is of further significance since Luton experienced one of the lowest
response rates to the 2001 Census of all local authorities. With the next Census due in
March 2011, the Council is committed to working with ONS to try and increase the
response rate.
Luton Council recognises that its systems for monitoring demographic changes
arising from international migration are limited and is therefore looking for ways of
improving this capability within existing resources. The aims of this study include the
following: they are to:
o identify and quantify the demographic profiles of these communities

Luton population growth and change
6
o understand the drivers of migration and how they will change the Luton
population in the future
o make recommendations on how the Council can implement a proactive
approach to monitoring and assessing the Luton population on an ongoing
basis.
The Mayhew Harper approach differs from similar studies in that it is based entirely
on administrative data rather than official sources. The argument for this radically
new approach is that, as official sources essentially derive from the 2001 Census, they
no longer reflect accurately the current position. Although there is a new Census in
March 2011, the results will not be available for some time and there are concerns that
because of the ethnic complexion of Luton’s population response rates will be low, in
doing so jeopardising accuracy.
Our approach uses various sources of administrative data including the GP register,
annual school pupil census, electoral roll, and official data on births and deaths and
other sources including tax and benefit records. It combines these data with the Local
Land and Property Gazetteer (LLPG) to derive a demographic profile of households
in Luton, by cross referencing the data according to a set of rules to produce what is
termed a ‘confirmed minimum’ population.
On this basis, it finds that Luton has 202,748 residents living in around 77,000
households as of the 31st March 2010. Our population figure compares with the
ONS’s latest estimate of 194,400, which is 8,348 lower than ours. Our figure is higher
by around 18,000 on the population at the last Census in 2001, which in turn was
about a 12,000 increase on 1991.
Other published data show that births are consistently higher than deaths in Luton
adding weight to the evidence that Luton is continuing to grow through natural
increase as well as by migration over the long term. This growth is in turn putting
pressure on housing and other services; for example we find that average household
size is particularly high among the Asian community in which there are also
significant problems of income deprivation.
Of the total confirmed population, we found that as many as 73% may not have been
living in Luton at the time of the last Census, although this is an upper estimate.
During this time, we find that Asian and Black groups now make up a much larger
percentage of the population than they did in 2001.
Other groups originating from Europe are harder to identify and may not be as great
as was thought based on the evidence of administrative sources such as new National
Insurance (NI) registrations. For example, we could only partly corroborate high
figures quoted for the Polish community that are evident from this and other related
sources (this is discussed further and at Annex A).
It must be noted that NI registration does not necessarily mean that the individuals are
actually working (or living) in a given authority area. For example Luton Airport is a
major point of entry into the UK and may simply act as a staging post for some.
Luton population growth and change
7
However, it is also possible that many migrants stay for short periods only and do not
necessarily appear on any administrative data bases such as the GP register or
Electoral Roll, which are used in this study, especially if they do not bother to
register. This argument applies particularly to some European migrants. Hence, these
populations are more difficult to verify with exactitude.
The report is divided into sections as follows:
o Section 2 briefly reviews administrative data on international migration and
concludes that such data are unable to shed much light on the changes
occurring
o Section 3 describes the methodology and results for counting the population of
Luton and compares it with ONS population estimates
o Section 4 considers household types by ethnicity, tenure and occupancy
o Section 5 breaks down the population by ethnicity and analyses different
groupings insofar as the data allow
o Section 6 considers household structures by ethnicity and occupancy and finds
significant differences in household size and type
o Section 7 considers income deprivation in different communities and age
groups and finds wide variations in deprivation by age and ethnicity
o Section 8 concludes and makes some further recommendations
2. Data on migration
Often the starting point for analyses of changing demography is levels of international
migration, especially if it is perceived that this is the primary reason for population
change. There are two main sources of information on migration at local authority
level: one based on the International Passenger Survey (IPS), and the other on
administrative sources.
2.1 The International Passenger Survey (IPS)
The International Passenger Survey (IPS) is a survey of a random sample of over
250,000 passengers entering and leaving the UK by air, sea or the Channel Tunnel.
The interviewer asks for a passenger’s country of residence (for overseas residents) or
country of visit (for UK residents), and the reason for their visit. It collects
information on intended destinations or areas of departure to and from the UK.
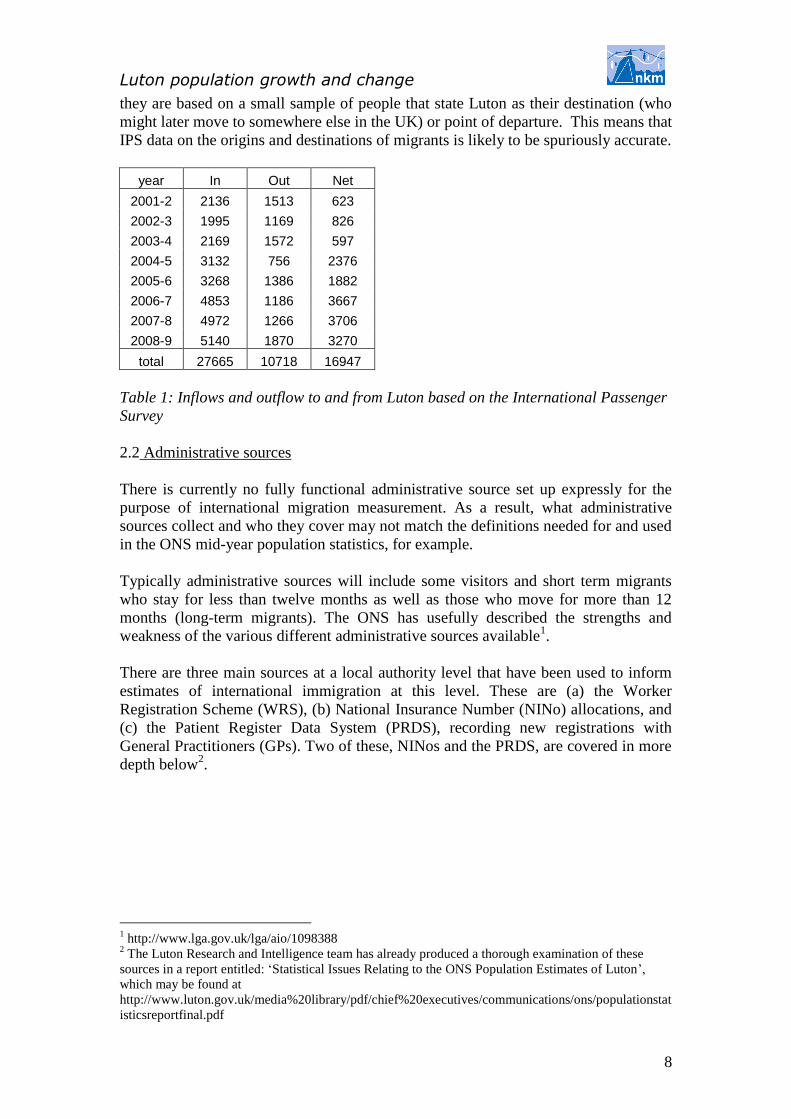
For Luton, the IPS suggests that there have been net inflows averaging 3,000 from
2004 onwards. Prior to 2004 net inflows were more modest (see Table 1). However,
IPS figures may be criticised on several grounds. We have concerns, for example, that
Luton population growth and change
8
they are based on a small sample of people that state Luton as their destination (who
might later move to somewhere else in the UK) or point of departure. This means that
IPS data on the origins and destinations of migrants is likely to be spuriously accurate.
year In Out Net
2001-2 2136 1513 623
2002-3 1995 1169 826
2003-4 2169 1572 597
2004-5 3132 756 2376
2005-6 3268 1386 1882
2006-7 4853 1186 3667
2007-8 4972 1266 3706
2008-9 5140 1870 3270
total 27665 10718 16947
Table 1: Inflows and outflow to and from Luton based on the International Passenger
Survey
2.2 Administrative sources
There is currently no fully functional administrative source set up expressly for the
purpose of international migration measurement. As a result, what administrative
sources collect and who they cover may not match the definitions needed for and used
in the ONS mid-year population statistics, for example.
Typically administrative sources will include some visitors and short term migrants
who stay for less than twelve months as well as those who move for more than 12
months (long-term migrants). The ONS has usefully described the strengths and
weakness of the various different administrative sources available1.
There are three main sources at a local authority level that have been used to inform
estimates of international immigration at this level. These are (a) the Worker
Registration Scheme (WRS), (b) National Insurance Number (NINo) allocations, and
(c) the Patient Register Data System (PRDS), recording new registrations with
General Practitioners (GPs). Two of these, NINos and the PRDS, are covered in more
depth below2.
1 http://www.lga.gov.uk/lga/aio/1098388
2 The Luton Research and Intelligence team has already produced a thorough examination of these
sources in a report entitled: ‘Statistical Issues Relating to the ONS Population Estimates of Luton’,
which may be found at
http://www.luton.gov.uk/media%20library/pdf/chief%20executives/communications/ons/populationstat
isticsreportfinal.pdf
Luton population growth and change
9
NINo data
Each source has its strengths and weaknesses. If we take the example of NI
registrations to illustrate the issues involved, the population coverage includes
o All non-UK born nationals aged 16 or over working, planning to work or
claiming benefits legally in the UK
o All registrations are included, regardless of how long individuals intend to stay
However, it excludes:
o Dependants of NINo applicants, unless they work or claim benefits
o Individuals from overseas not working, planning to work, or claiming benefits
– for example, this will include many students
o Those with an existing national insurance number, for example returning UK
nationals
o Migrants who are not of working age if they are not claiming benefits.
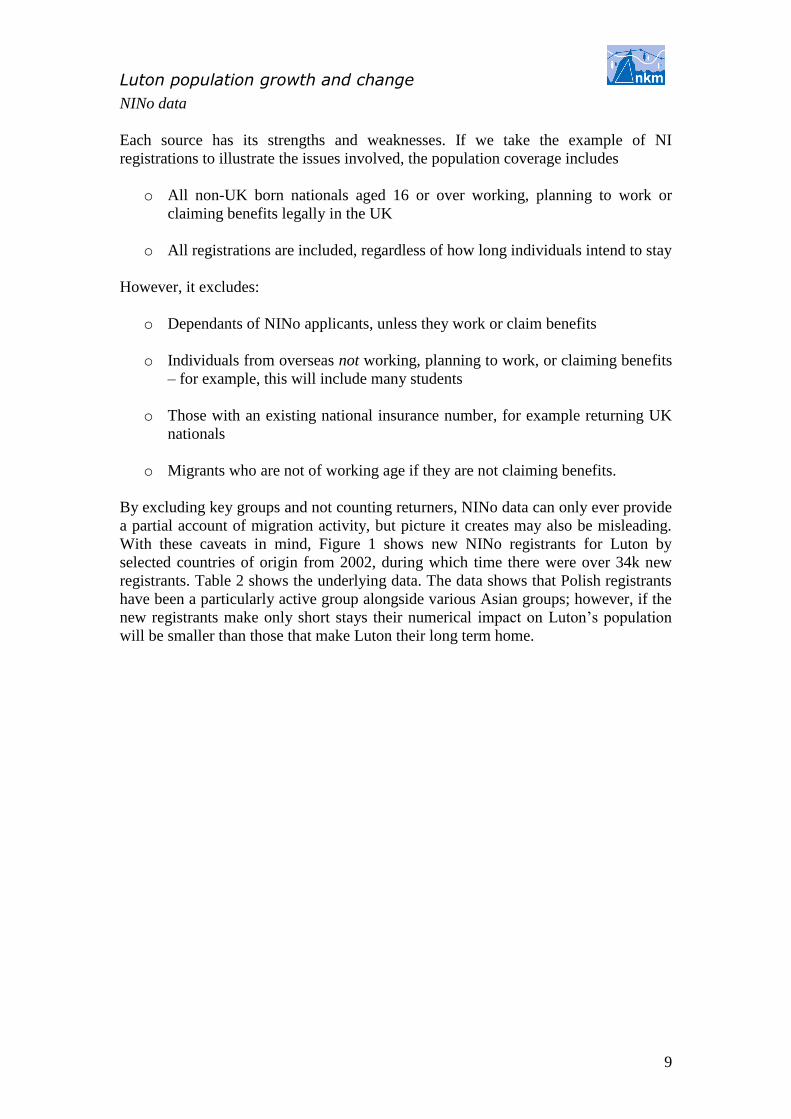
By excluding key groups and not counting returners, NINo data can only ever provide
a partial account of migration activity, but picture it creates may also be misleading.
With these caveats in mind, Figure 1 shows new NINo registrants for Luton by
selected countries of origin from 2002, during which time there were over 34k new
registrants. Table 2 shows the underlying data. The data shows that Polish registrants
have been a particularly active group alongside various Asian groups; however, if the
new registrants make only short stays their numerical impact on Luton’s population
will be smaller than those that make Luton their long term home.

Luton population growth and change
10
0
500
1000
1500
2000
2500
3000
2002 2003 2004 2005 2006 2007 2008 2009 2010
(1st qtr)
year
nu
mb
er
of
ne
w r
eg
istr
atio
ns
Poland
Pakistan
India
Bangladesh
Africa
other
Figure 1: National Insurance registrations by country of origin in Luton from 2002 to
first quarter of 2010
Country of origin
total 2002 to 1st qtr 2010
Poland 11570
Pakistan 4370
India 3270
Bangladesh 1970
Africa 2550
Other 10820
Total 34550
Table 2: NINo data underlying the chart in Figure 1
GP registration data
GP registration data has the advantage of covering all age groups as long as they are
registered with a GP, which in practice is almost the whole population. It covers all
people requiring access to NHS services through a GP, regardless of age or reason for
visit. So, for example, many children and students will be covered. In addition,
individuals staying in the UK for longer than 3 months can register with a GP, so it
includes people that intend to stay for longer periods and possibly make Luton their
home.
GP registration data gives the date at which a person registers with their current GP.
Normally first registration takes place at birth but a person may decide to change GP
on change of address or for other reasons (e.g. if a practice closes). Registrant activity
Luton population growth and change
11
therefore reflects a composite of new births, movements within an area as people
switch GPs, or new arrivals into the area including people from overseas.
Normally one would wish to base registrant analysis on data from at least two
snapshots in time in order to analyse both leavers and joiners by practice geographical
neighbourhood; however, important insights are possible though an examination of
registrant activity at a single snapshot in time, the hypotheses being that high
registrant activity by ethnic group is likely to be correlated with population influxes.
In section 5 we analyse registrant activity and compare our findings with population
breakdowns by ethnic group.
3. Counting Luton’s population using administrative data
In order to understand the relative significance of different communities within Luton,
we need to be able to count them as well as measure their shifts through time. In this
section, we describe how we use administrative data sources to count the population
of Luton. The techniques used are collectively known as ‘neighbourhood knowledge
management’ or nkm and involve data matching techniques, in which administrative
data sources are linked to the Local Land and Property Gazetteer (LLPG). The
resultant geo-referenced data are checked and cleaned to eliminate duplicates and
many other tests are applied to ensure results are robust. The population figure
obtained from this process is called the ‘confirmed minimum’ population which
means that it conforms to the nkm counting rules.
In our approach we adopt several tests before a person is deemed to be confirmed:
o a person is ‘confirmed’ if they are on the GP register3 and on another database
o if they are on the GP register, but not on any other database, they should be
related to someone else at that address by name e.g. a young child
o if they are not on more than one database the person should be the latest
person at that address according to the GP register
o a person may also be included if an address would otherwise be vacant; this is
ascertained after checking for people on other datasets with that address and
removing any records with the same names/dates of birth so as to avoid the
possibility of double counting
o all persons included in the database should have a UPRN and therefore an
address
3 Everyone living in the UK has a right to register with a GP. This right is based on residency and not
nationality or payment of taxes. However, patients must only be registered with one practice at any one
time and generally need to reside in the UK for more than 3 months. If a person moves away and
changes GP the new practice contacts the previous GP for their medical records to be forwarded. Since
well over 95% of the population is typically registered with a GP this is the most reliable source of
information about people living in an area.
Luton population growth and change
12
The word ‘minimum’ is used to signify that there will be people living in Luton that
do not appear on any datasets and people that do not have valid or therefore linkable
addresses. These could include short term economic migrants who work or just visit
for short periods only. Anecdotally these are likely to come from countries in Europe,
especially eastern Europe but also southern Europe and Turkey.
The main finding is that Luton had a confirmed minimum population of 202,748
persons as of the 31st March 2010 living in over 77,500 households. This figure is in
accordance with the nkm methodology which only includes people that have an
address, are confirmed on more than one database, are the latest person at an address,
or are related to someone at that address or can be allocated to an address if the
address would otherwise be unoccupied.
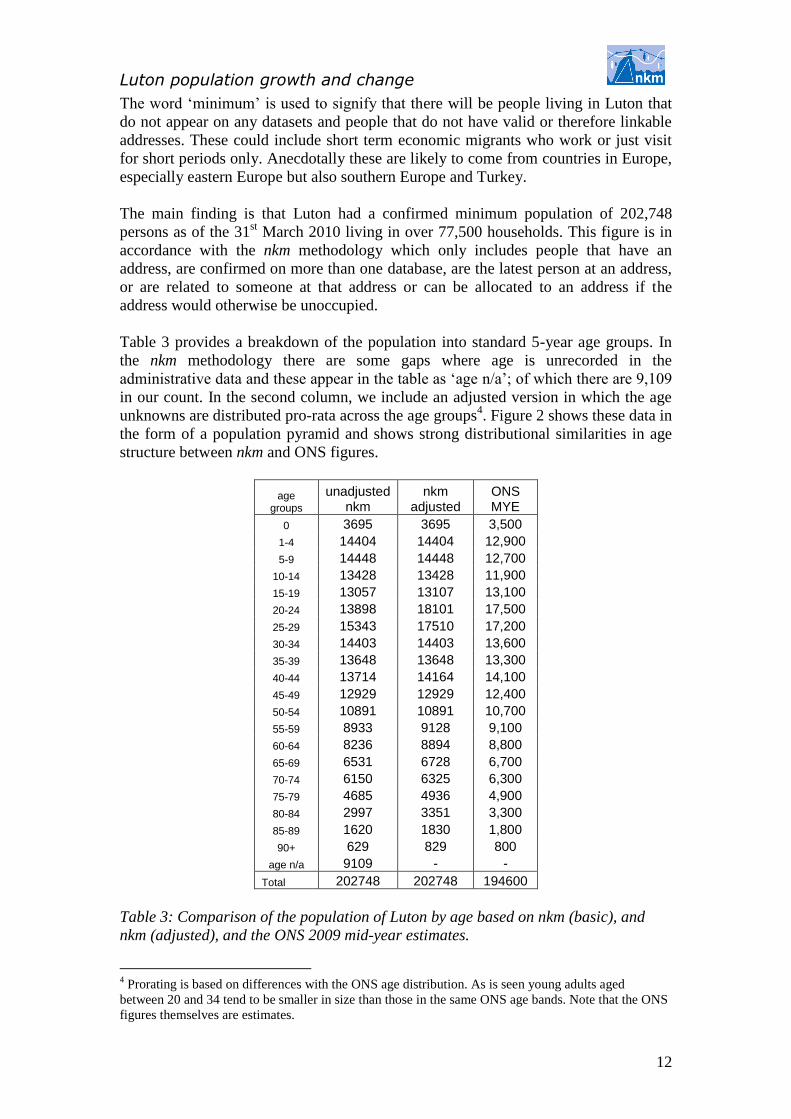
Table 3 provides a breakdown of the population into standard 5-year age groups. In
the nkm methodology there are some gaps where age is unrecorded in the
administrative data and these appear in the table as ‘age n/a’; of which there are 9,109
in our count. In the second column, we include an adjusted version in which the age
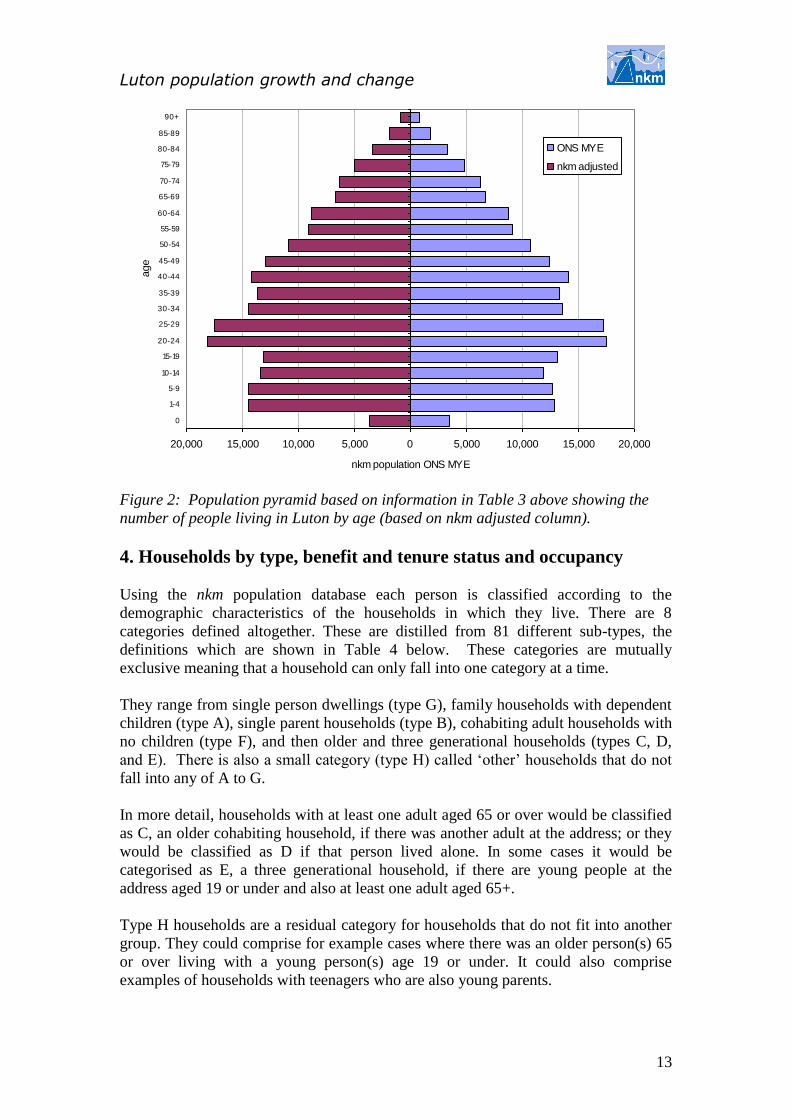
unknowns are distributed pro-rata across the age groups4. Figure 2 shows these data in
the form of a population pyramid and shows strong distributional similarities in age
structure between nkm and ONS figures.
age groups
unadjusted nkm
nkm adjusted
ONS MYE
0 3695 3695 3,500
1-4 14404 14404 12,900
5-9 14448 14448 12,700
10-14 13428 13428 11,900
15-19 13057 13107 13,100
20-24 13898 18101 17,500
25-29 15343 17510 17,200
30-34 14403 14403 13,600
35-39 13648 13648 13,300
40-44 13714 14164 14,100
45-49 12929 12929 12,400
50-54 10891 10891 10,700
55-59 8933 9128 9,100
60-64 8236 8894 8,800
65-69 6531 6728 6,700
70-74 6150 6325 6,300
75-79 4685 4936 4,900
80-84 2997 3351 3,300
85-89 1620 1830 1,800
90+ 629 829 800
age n/a 9109 - -
Total 202748 202748 194600
Table 3: Comparison of the population of Luton by age based on nkm (basic), and
nkm (adjusted), and the ONS 2009 mid-year estimates.
4 Prorating is based on differences with the ONS age distribution. As is seen young adults aged
between 20 and 34 tend to be smaller in size than those in the same ONS age bands. Note that the ONS
figures themselves are estimates.
Luton population growth and change
13
20,000 15,000 10,000 5,000 0 5,000 10,000 15,000 20,000
0
1-4
5-9
10-14
15-19
20-24
25-29
30-34
35-39
40-44
45-49
50-54
55-59
60-64
65-69
70-74
75-79
80-84
85-89
90+
age
nkm population ONS MYE
ONS MYE
nkm adjusted
Figure 2: Population pyramid based on information in Table 3 above showing the
number of people living in Luton by age (based on nkm adjusted column).
4. Households by type, benefit and tenure status and occupancy
Using the nkm population database each person is classified according to the
demographic characteristics of the households in which they live. There are 8
categories defined altogether. These are distilled from 81 different sub-types, the
definitions which are shown in Table 4 below. These categories are mutually
exclusive meaning that a household can only fall into one category at a time.
They range from single person dwellings (type G), family households with dependent
children (type A), single parent households (type B), cohabiting adult households with
no children (type F), and then older and three generational households (types C, D,
and E). There is also a small category (type H) called ‘other’ households that do not
fall into any of A to G.
In more detail, households with at least one adult aged 65 or over would be classified
as C, an older cohabiting household, if there was another adult at the address; or they
would be classified as D if that person lived alone. In some cases it would be
categorised as E, a three generational household, if there are young people at the
address aged 19 or under and also at least one adult aged 65+.
Type H households are a residual category for households that do not fit into another
group. They could comprise for example cases where there was an older person(s) 65
or over living with a young person(s) age 19 or under. It could also comprise
examples of households with teenagers who are also young parents.

Luton population growth and change
14
category Description
A family households with dependent children
B single adult households with dependent children
C older cohabiting5 households
D older person living alone
E three generational households
F cohabiting adult households no children
G single adult households
H other households
Table 4: Household classification by type
Table 5 shows the household structure of Luton based on this classification scheme.
There are 77,477 identifiable households comprising 202,748 people of 2.62 per
household on average. The most numerous households are type A family households
with dependent children totalling nearly 19k; they have the second highest average
size at 4.63 members per household.
These are followed by type F households comprising cohabiting adults with no
children totalling 14k. Types B, C and G households are similar in number at around
20k of each and there are about 6.6k households with an older person living alone.
The most densely occupied households are type E, 3-generational households of
which there are about 1.7k cases. This is a relatively larger number than we tend to
find in other studies and is probably reflective of the ethnic composition of Luton.
Average household size in this category is 66.
The table also gives breakdowns by tenancy and benefits status. For example nearly
10k households are designated as social housing or 12.8% of the total. Of all
households about 25% receive means tested benefits; the households types with the
largest percentages receiving benefits are types B (single parent households), type D
older persons living alone, and type E 3-generational households. These types of
households therefore represent the most income deprived households in Luton.
household type frequency population
persons/ household
no. of households on benefits
% households
benefits
no. households
social housing
% households
social housing
A 18921 87537 4.63 4365 23.1 2197 11.6
B 7545 21385 2.83 3112 41.2 1522 20.2
C 8500 19780 2.33 2063 24.3 785 9.2
D 6622 6622 1.00 2789 42.1 1585 23.9
E 1669 10011 6.00 711 42.6 164 9.8
F 14083 35830 2.54 2186 15.5 1252 8.9
G 19114 19114 1.00 4366 22.8 2339 12.2
H 1023 2469 2.41 326 31.9 107 10.5
total 77477 202748 2.62 19918 25.7 9951 12.8
Table 5: Breakdown of Luton population by household type, tenancy, benefit status
and average household size.
5 Cohabiting simply means two or more adults: it does not imply anything about the relationships or its
legal status 6 Similar but slightly more extreme figures were obtain for example in the London Borough of Tower
Hamlets

Luton population growth and change
15
5. Ethnicity by broad groupings
Definitions of ethnicity are operationally difficult to apply and vary according data
source and purpose. Ethnic status is not the same as nationality or skin colour.
Available data tend to mix all three definitional concepts; in addition, it is extremely
unhelpful that the most comprehensive source of ethnicity data is based on the 2001
Census.
Although partial in their coverage and incomplete in the picture they generate,
administrative data point to different influxes of people of varying nationality and by
extension ethnic status. The aim is therefore to bring together the various sources of
information on ethnicity in to something more comprehensive, up to date and
therefore useful.
A methodology to quantify the ethnic composition of the local population is thus
essential for assessing recent migration and for identifying populations that are likely
to have special needs or requirements (e.g. in terms of employment, local health and
council services). In this section we describe such a methodology to identify and
quantify different ethnic groups in the current population.
There is no routine or complete record of a person’s ethnic origin on any
administrative dataset. One of the few consistent albeit partial sources of information
is the School Census (formerly know as PLASC), the register of pupils attending state
schools which contains both names and ethnicity. It identifies up to 100 different sub-
groups but many of these are small or non-existent in Luton.
It also identifies the first language of each pupil but we have not used these data
because language and ethnicity are not necessarily aligned. The basis for ethnicity
recording is self assessment and some groups overlap, so for example, a person of
African heritage may choose to identify themselves as ‘Other Black African’ or as
Nigerian.
In addition, the list of country codes for ethnicity is not exhaustive. For example,
there is a separate category for White Eastern European but not necessarily for
individual Eastern European countries. These classifications are nevertheless valuable
and can usually be mapped accurately onto broader classifications (e.g. as sometimes
used by the NHS), for example, White, Black, Asian, other and mixed.
Within the classification system used, some countries are easier to identify than
others; for example, it is possible to identify several culturally different Pakistani sub-
groups quite accurately. However, not every parent specifies the ethnicity of a child
and in a small number of cases some children are not assigned to any group e.g. where
a child’s parents have refused to provide information, so some uncertainties remain.
It is known that personal and family names are frequently associated with particular
ethnic groups but also that some are associated with more than one ethnic group.
There are also many surnames in the adult population, examples of which are not
represented in the school population (e.g. in households that do not have children or
are not attending a state school).
Luton population growth and change
16
In our approach, we supplement reported ethnicities in the School Pupil Census with a
large database of unique surnames based on an accumulation of studies. Therefore
each person in the nkm database we can assign a probability of belonging to one of a
small core of high level ethnic groups and a specific selection of groups that are
relevant to Luton.
The justification is as follows. In a majority of cases only one ethnic group is
indicated by any given surname and so it is easy to assign to a group but in other cases
the same name appears in two or more ethnic groups. In these cases a probable ethnic
origin is assigned to the name, based on the frequency of occurrences of the name
within the data base. Extreme cases of representation across multiple ethnic groups
include names like Ahmed, Khan and Brown which appear in all of the basic ethnic
groups (including refused/unknown).
The range and diversity of surnames is very large and in most local authorities there
will be names that appear on local databases which have no comparator on the wider
database nor have any ethnicity assigned. In the methodology, it is thus necessary to
allocate these to a group which comprises mixed, other and not known.
Testing indicates that the method adopted using available data is able to assign an
ethnicity in between 80% to 90% of all cases with an accuracy of over 90%
depending on how many ethnic groups are defined at the outset. The method works
according to the following procedure:
1. Children on the Luton School Census are assigned to their stated ethnic group
based on their self reported classification
2. Adults living at the address of children on the School Census are assigned the
same ethnicity as the child
3. Adults at addresses with no children are assigned the most probable ethnic
group based on their surname using the wider database
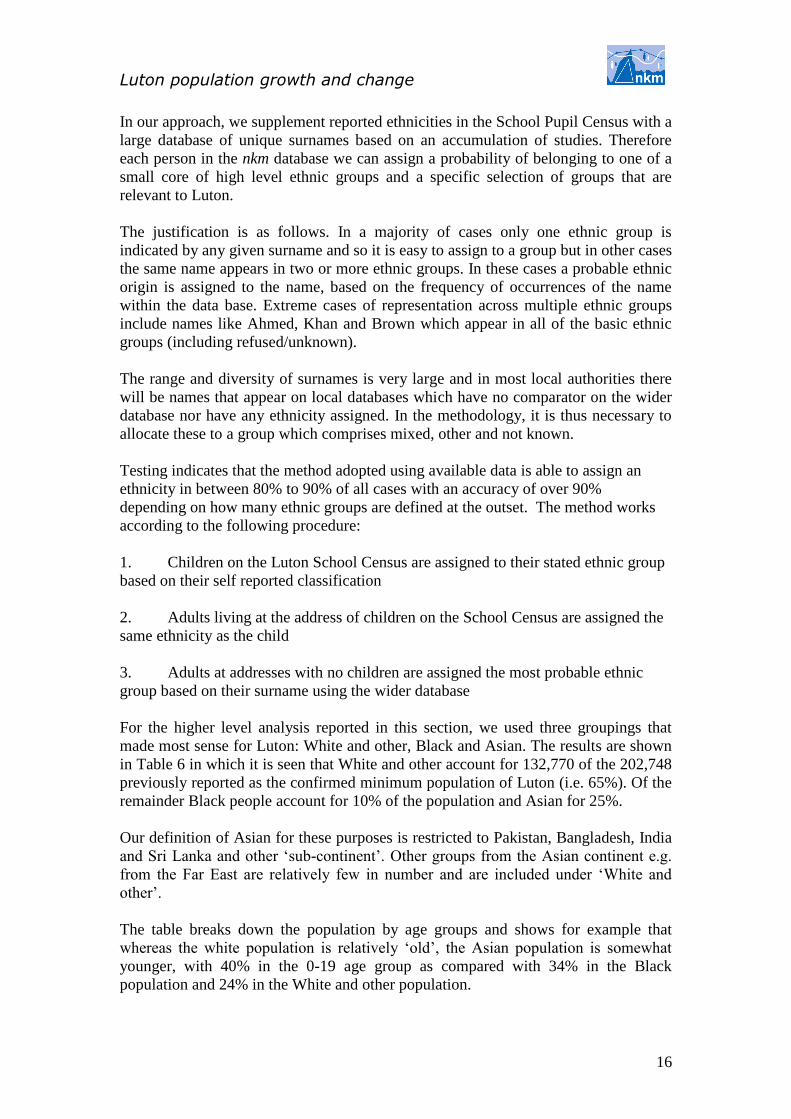
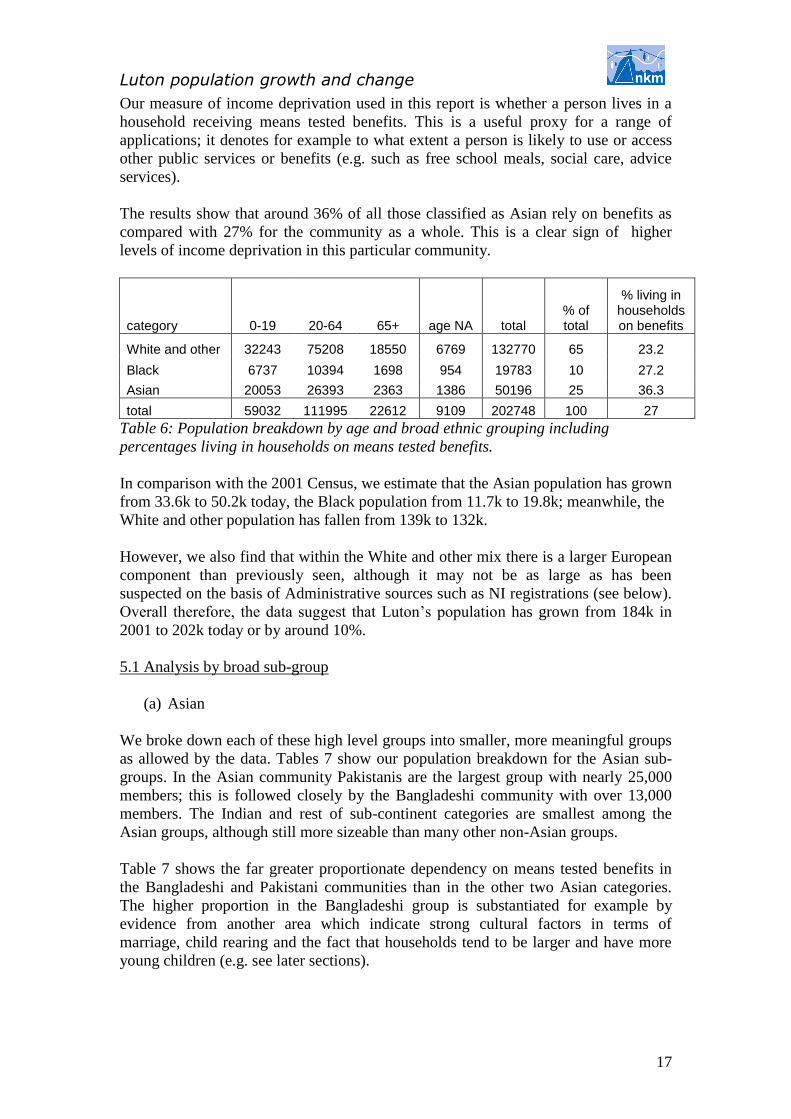
For the higher level analysis reported in this section, we used three groupings that
made most sense for Luton: White and other, Black and Asian. The results are shown
in Table 6 in which it is seen that White and other account for 132,770 of the 202,748
previously reported as the confirmed minimum population of Luton (i.e. 65%). Of the
remainder Black people account for 10% of the population and Asian for 25%.
Our definition of Asian for these purposes is restricted to Pakistan, Bangladesh, India
and Sri Lanka and other ‘sub-continent’. Other groups from the Asian continent e.g.
from the Far East are relatively few in number and are included under ‘White and
other’.
The table breaks down the population by age groups and shows for example that
whereas the white population is relatively ‘old’, the Asian population is somewhat
younger, with 40% in the 0-19 age group as compared with 34% in the Black
population and 24% in the White and other population.
Luton population growth and change
17
Our measure of income deprivation used in this report is whether a person lives in a
household receiving means tested benefits. This is a useful proxy for a range of
applications; it denotes for example to what extent a person is likely to use or access
other public services or benefits (e.g. such as free school meals, social care, advice
services).
The results show that around 36% of all those classified as Asian rely on benefits as
compared with 27% for the community as a whole. This is a clear sign of higher
levels of income deprivation in this particular community.
category 0-19 20-64 65+ age NA total % of total
% living in households on benefits
White and other 32243 75208 18550 6769 132770 65 23.2
Black 6737 10394 1698 954 19783 10 27.2
Asian 20053 26393 2363 1386 50196 25 36.3
total 59032 111995 22612 9109 202748 100 27
Table 6: Population breakdown by age and broad ethnic grouping including
percentages living in households on means tested benefits.
In comparison with the 2001 Census, we estimate that the Asian population has grown
from 33.6k to 50.2k today, the Black population from 11.7k to 19.8k; meanwhile, the
White and other population has fallen from 139k to 132k.
However, we also find that within the White and other mix there is a larger European
component than previously seen, although it may not be as large as has been
suspected on the basis of Administrative sources such as NI registrations (see below).
Overall therefore, the data suggest that Luton’s population has grown from 184k in
2001 to 202k today or by around 10%.
5.1 Analysis by broad sub-group
(a) Asian
We broke down each of these high level groups into smaller, more meaningful groups
as allowed by the data. Tables 7 show our population breakdown for the Asian sub-
groups. In the Asian community Pakistanis are the largest group with nearly 25,000
members; this is followed closely by the Bangladeshi community with over 13,000
members. The Indian and rest of sub-continent categories are smallest among the
Asian groups, although still more sizeable than many other non-Asian groups.
Table 7 shows the far greater proportionate dependency on means tested benefits in
the Bangladeshi and Pakistani communities than in the other two Asian categories.
The higher proportion in the Bangladeshi group is substantiated for example by
evidence from another area which indicate strong cultural factors in terms of
marriage, child rearing and the fact that households tend to be larger and have more
young children (e.g. see later sections).
Luton population growth and change
18
Asian 0-19 20-64 65+ age NA total % of total
% living in households on benefits
Bangladeshi 5699 7080 648 317 13744 27.4 49.8
Indian 2308 5754 782 368 9212 18.4 18.0
Pakistan 10904 11904 779 592 24179 48.2 36.7
other Asian 1142 1655 155 109 3061 6.1 27.2
total 20053 26393 2363 1386 50196 100 36.3
Table 7: Population breakdown by age and sub-group in the Asian community,
including percentages living in households on means tested benefits. (Note to table:
other Asian = sub-continent)
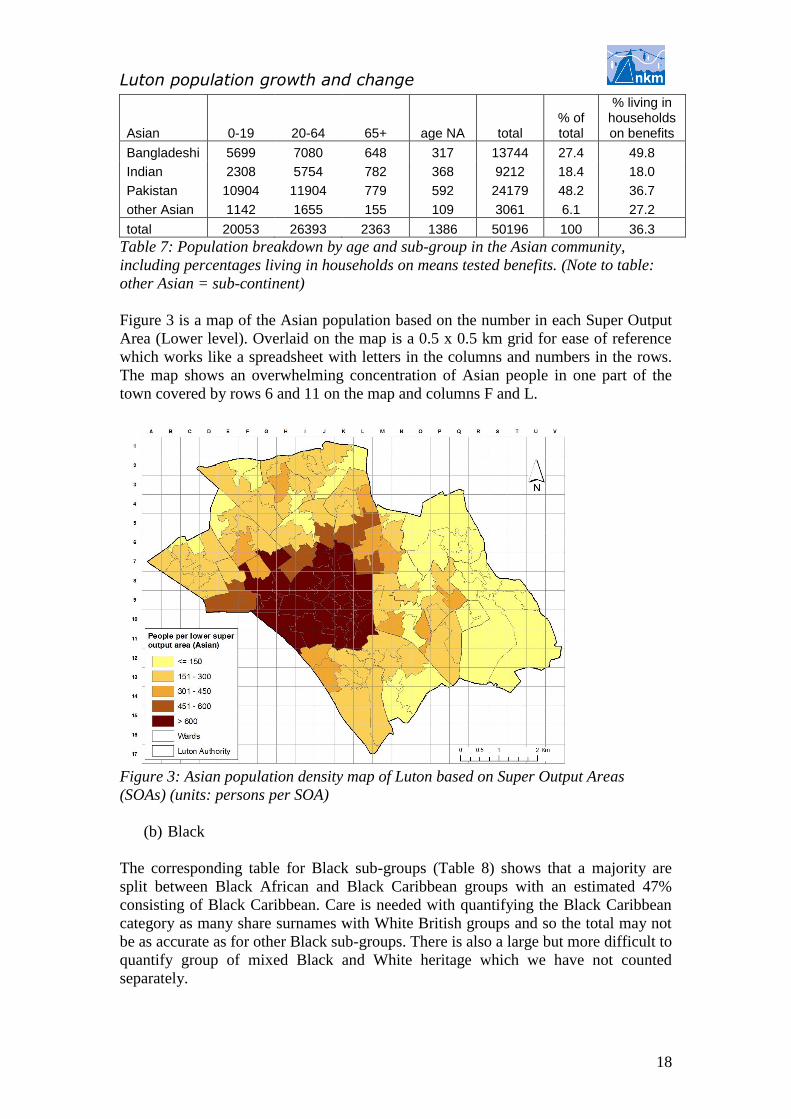
Figure 3 is a map of the Asian population based on the number in each Super Output
Area (Lower level). Overlaid on the map is a 0.5 x 0.5 km grid for ease of reference
which works like a spreadsheet with letters in the columns and numbers in the rows.
The map shows an overwhelming concentration of Asian people in one part of the
town covered by rows 6 and 11 on the map and columns F and L.
Figure 3: Asian population density map of Luton based on Super Output Areas
(SOAs) (units: persons per SOA)
(b) Black
The corresponding table for Black sub-groups (Table 8) shows that a majority are
split between Black African and Black Caribbean groups with an estimated 47%
consisting of Black Caribbean. Care is needed with quantifying the Black Caribbean
category as many share surnames with White British groups and so the total may not
be as accurate as for other Black sub-groups. There is also a large but more difficult to
quantify group of mixed Black and White heritage which we have not counted
separately.
Luton population growth and change
19
The population structure of the Black community tends to be intermediate between
the White and other communities and the Asian community in terms of age.
Unfortunately the Black African community, whilst easier to identify than people of
Caribbean origin, is not as specific as we would like it to be in terms of country of
origin, although Somalis are a relatively easily identifiable group with over 1,300
members followed by the Nigerian community.
It is noteworthy that the percentage of Black Africans that live in households on
benefits is relatively small compared with the Asian community and comparable with
the White and other group. An exception is the Somali group in which an estimated
42.6% live in households on means tested benefits.
Black 0-19 20-64 65+ age NA total
% of
total
% living in households on benefits
Congolese 14 30 1 2 46 0.2 31.1
Ghanaian 143 272 24 26 464 2.3 20.1
Nigerian 322 538 41 54 955 4.8 17.4
Sierra Leone 21 41 6 4 73 0.4 22.8
Somali 579 691 48 42 1360 6.9 42.6
Black African (general) 2524 2750 174 255 5703 28.8 28.8
Black Caribbean 2484 4964 1203 459 9110 46.0 25.7
Any other Black 650 1109 202 112 2072 10.5 25.4
total 6737 10394 1698 954 19783 100 27.2
Table 8: Population breakdown by age and sub-group in the Black community,
including percentages living in households on means tested benefits.
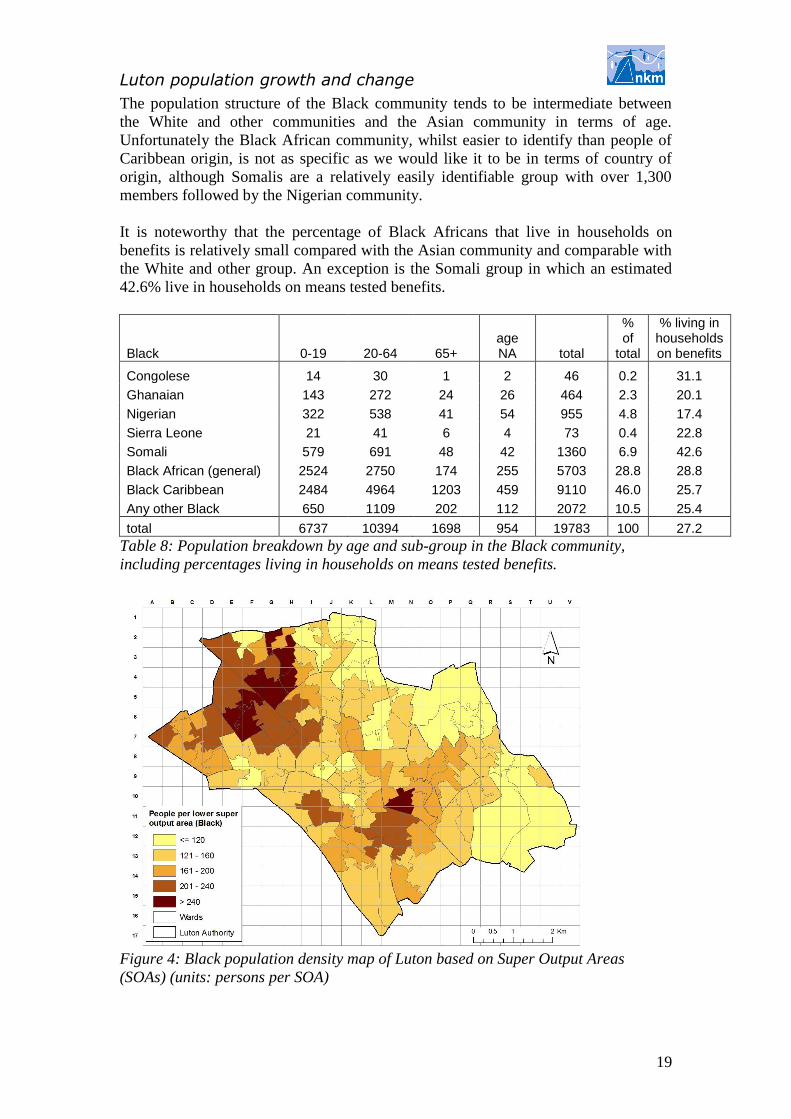
Figure 4: Black population density map of Luton based on Super Output Areas
(SOAs) (units: persons per SOA)

Luton population growth and change
20
Figure 4 is a population map of the Black community based on the number of Black
people living in each Super Output Area. The map shows concentrations of the Black
population in the northwest of the town in rows 2 to 8 and columns A to H and in
south central Luton e.g. see cells M and N 10 and cells below.
(c) Other European
Ignoring for these purposes those of White British origin, the hardest group to
breakdown into sub-groups by country of origin are those of European descent. Table
9 shows sub-groups in four categories; one of these, Eastern European, is not as
precise as we would have liked and some will have been included in the next category
which is designated ‘Other European’.
The numbers in the European category are much smaller than the previous Asian and
Black categories and probably reflect the fact that these groups are based on less
established or permanent influxes. The stock figures that they indicate are less than
the cumulative flows based on NI registration data which may indicate that people of
these backgrounds do not stay for as long in Luton.
However, another explanatory factor is that some registering for work may not go on
to register with a GP and so that the true population is potentially higher than
indicated; it is simply that they do not appear on any of the data sets available. It is
also seen that the percentage of the Eastern European population living in households
on means tested benefits is smallest among the three major groups, suggesting that a
majority are likely to be economic migrants. More refined methods including surveys
may be needed to split and quantify these sub-groups better than has been possible
here.
European origin 0-19 20-64 65+ age NA total
% of total
% living in households on benefits
Irish 601 1366 351 105 2422 39.4 24.8
Former Yugoslavia and Albania 69 110 4 4 187 3.0 40.8
Eastern European 346 840 42 124 1353 22.0 23.4
Other European (not specified) 601 1258 198 134 2191 35.6 24.7
total 1618 3575 595 367 6154 100.0 24.9
Table 9: Population breakdown by age and sub-group in the Other European
community, including percentages living in households on means tested benefits.
Luton population growth and change
21
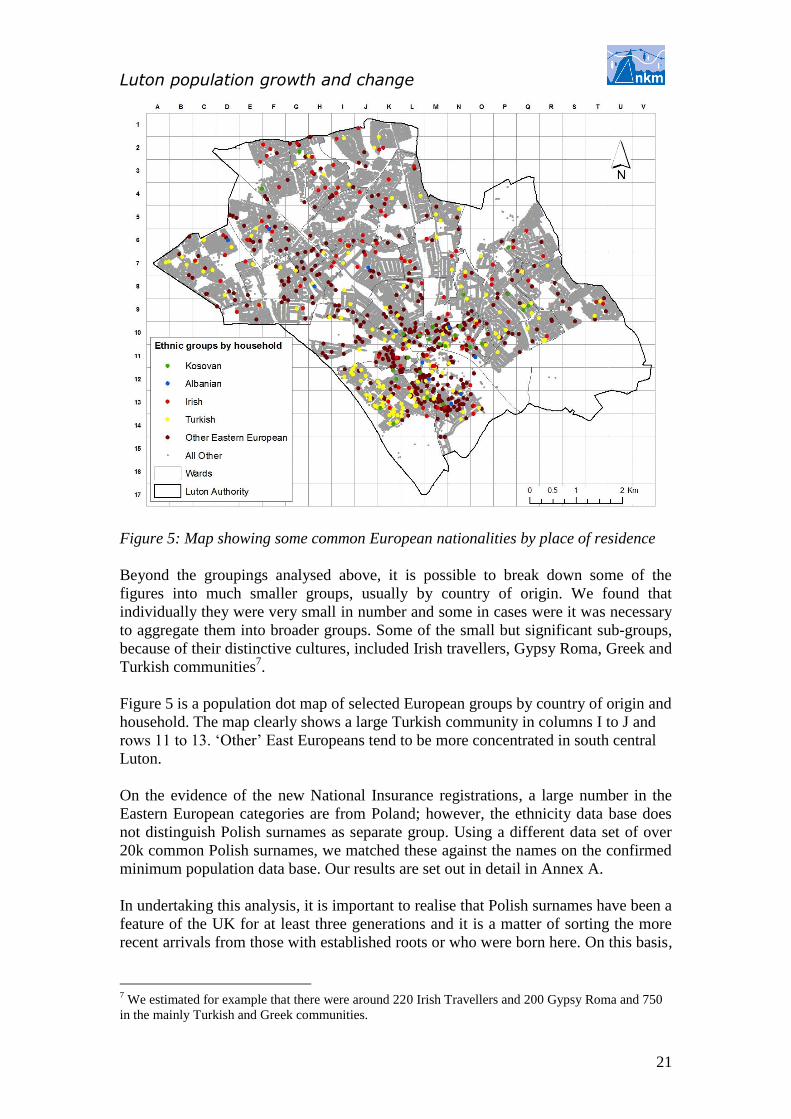
Figure 5: Map showing some common European nationalities by place of residence
Beyond the groupings analysed above, it is possible to break down some of the
figures into much smaller groups, usually by country of origin. We found that
individually they were very small in number and some in cases were it was necessary
to aggregate them into broader groups. Some of the small but significant sub-groups,
because of their distinctive cultures, included Irish travellers, Gypsy Roma, Greek and
Turkish communities7.
Figure 5 is a population dot map of selected European groups by country of origin and
household. The map clearly shows a large Turkish community in columns I to J and
rows 11 to 13. ‘Other’ East Europeans tend to be more concentrated in south central
Luton.
On the evidence of the new National Insurance registrations, a large number in the
Eastern European categories are from Poland; however, the ethnicity data base does
not distinguish Polish surnames as separate group. Using a different data set of over
20k common Polish surnames, we matched these against the names on the confirmed
minimum population data base. Our results are set out in detail in Annex A.
In undertaking this analysis, it is important to realise that Polish surnames have been a
feature of the UK for at least three generations and it is a matter of sorting the more
recent arrivals from those with established roots or who were born here. On this basis,
7 We estimated for example that there were around 220 Irish Travellers and 200 Gypsy Roma and 750
in the mainly Turkish and Greek communities.

Luton population growth and change
22
we estimated around 2,700 likely recent arrivals, although this is clearly only an
estimate.
5.2 Population by ethnicity and date of registration with GP
Section 2 described some of the difficulties involved in estimating population influxes
into Luton. Yet the differences in ethnic structure and population size since 2001
identified in the previous section are indicative that significant changes are occurring,
especially in the Asian community but also among certain smaller groups.
Populations can only grow by people living longer, or by more being born, or through
net immigration into an area. One of the main issues is to try to unpick why the Asian
population has grown to its current size since 2001.
The GP register is still the best and most comprehensive source of information about
population movement, but ideally one would require two full snap shots to be able to
separate these three components of change8. The GP register is not designed to
measure immigration. For example, there will be a delay between arrival into an area
and the registration process.
However, it is possible to analyse general movement activity based on the date of
registration with a person’s current GP using just a single snapshot. It can be safely
assumed for example that a person registered at birth would be likely to have been
born in Luton; those registered at older ages could be the result of internal GP
switches, inward flows from outside Luton or flows into Luton from abroad.
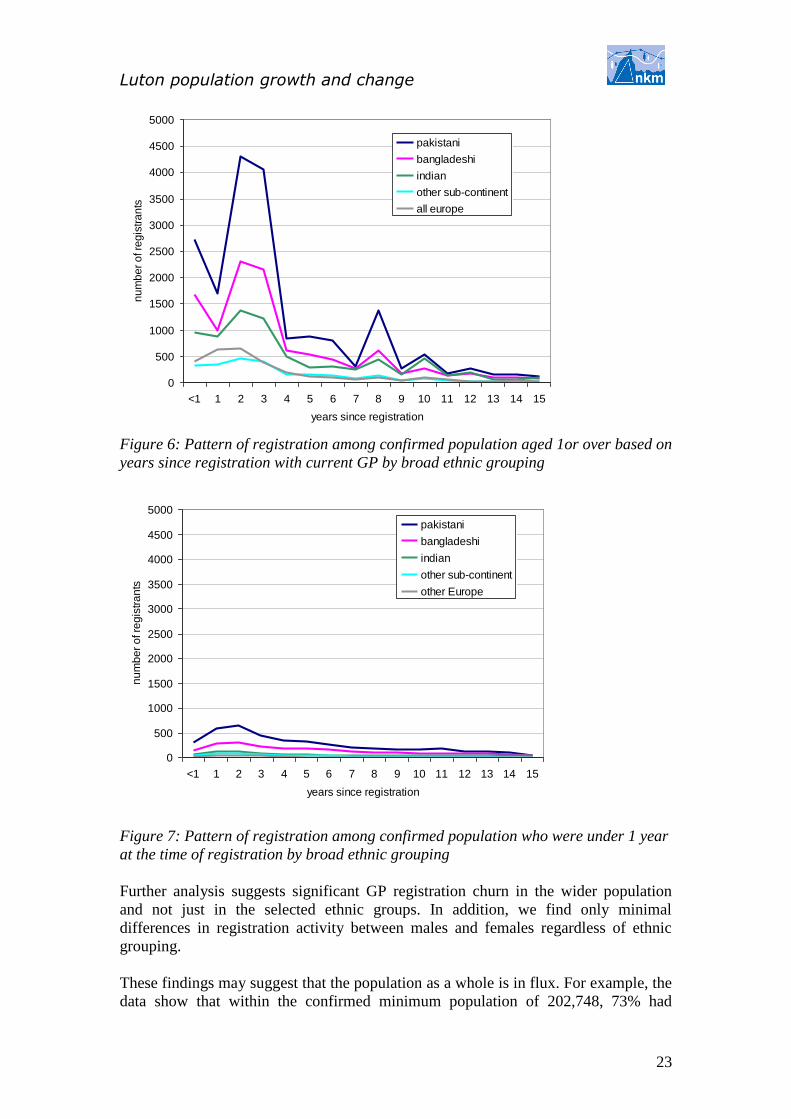
Figure 6 shows the pattern based on registrants aged below 1in which we track five
groups from different countries or areas: Pakistan, Bangladesh, India, other Asian
sub-continent and Europe over a 15 year period. This shows significantly higher
levels of registration activity in the last four years with the most activity occurring in
the Pakistani, Bangladeshi and Indian groups, in that order.
It is noteworthy that the patterns peak and trough together perhaps suggesting a
common underlying factor or factors. These could include housing, the state of the
local labour market or other factors such as changes to primary care practices.
Figure 7 shows a similar pattern of registrants at birth for these groups over the same
period. It shows a steady increase in registrants of children still living in Luton in
2010 that were in their first year of life when registered. Analysis shows that the ratio
of these registrants in the selected ethnic groups to all registrants has remained steady
at about 40% regardless of year of registration.
8 Two snaps shots would allow one to add new arrivals and births, to subtract people who leave Luton
or die and in addition quantify the amount of movement within Luton itself.
Luton population growth and change
23
0
500
1000
1500
2000
2500
3000
3500
4000
4500
5000
<1 1 2 3 4 5 6 7 8 9 10 11 12 13 14 15
years since registration
nu
mb
er
of re
gis
tra
nts
pakistani
bangladeshi
indian
other sub-continent
all europe
Figure 6: Pattern of registration among confirmed population aged 1or over based on
years since registration with current GP by broad ethnic grouping
0
500
1000
1500
2000
2500
3000
3500
4000
4500
5000
<1 1 2 3 4 5 6 7 8 9 10 11 12 13 14 15
years since registration
nu
mb
er
of re
gis
tra
nts
pakistani
bangladeshi
indian
other sub-continent
other Europe
Figure 7: Pattern of registration among confirmed population who were under 1 year
at the time of registration by broad ethnic grouping
Further analysis suggests significant GP registration churn in the wider population
and not just in the selected ethnic groups. In addition, we find only minimal
differences in registration activity between males and females regardless of ethnic
grouping.
These findings may suggest that the population as a whole is in flux. For example, the
data show that within the confirmed minimum population of 202,748, 73% had
Luton population growth and change
24
registered with their current GP after 2000; but among the Pakistani and Bangladeshi
communities this percentage rises to 85% and 83% respectively.
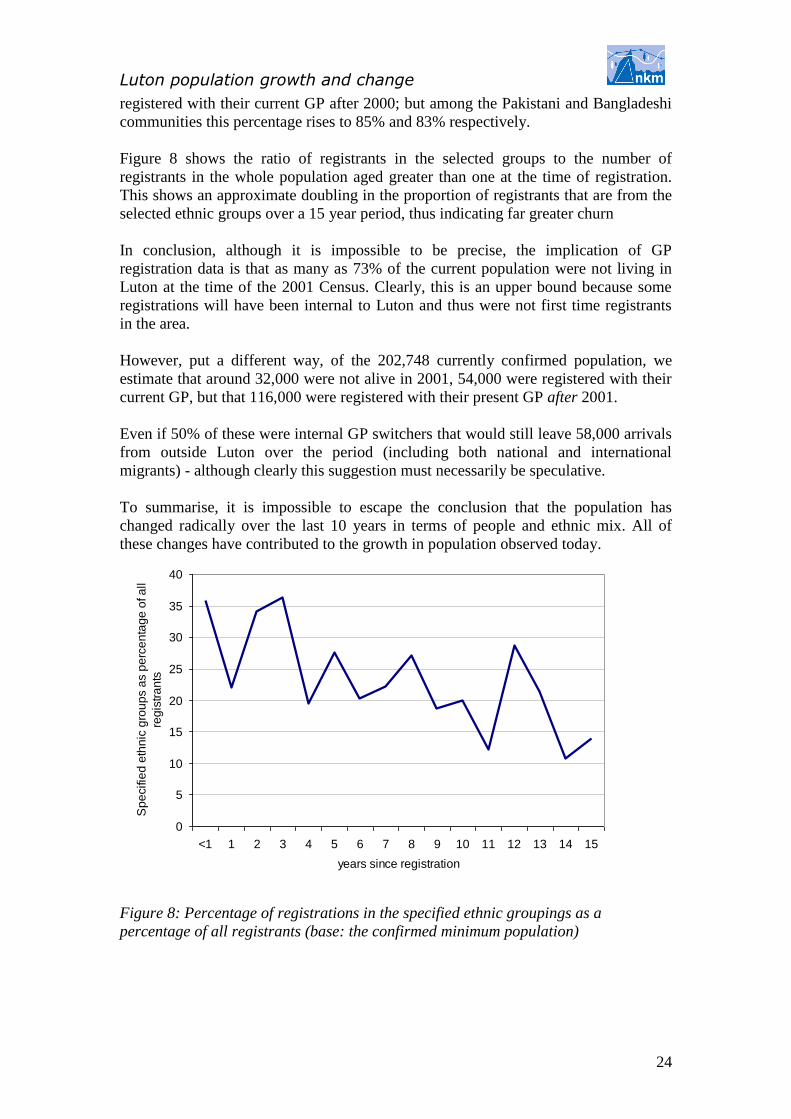
Figure 8 shows the ratio of registrants in the selected groups to the number of
registrants in the whole population aged greater than one at the time of registration.
This shows an approximate doubling in the proportion of registrants that are from the
selected ethnic groups over a 15 year period, thus indicating far greater churn
In conclusion, although it is impossible to be precise, the implication of GP
registration data is that as many as 73% of the current population were not living in
Luton at the time of the 2001 Census. Clearly, this is an upper bound because some
registrations will have been internal to Luton and thus were not first time registrants
in the area.
However, put a different way, of the 202,748 currently confirmed population, we
estimate that around 32,000 were not alive in 2001, 54,000 were registered with their
current GP, but that 116,000 were registered with their present GP after 2001.
Even if 50% of these were internal GP switchers that would still leave 58,000 arrivals
from outside Luton over the period (including both national and international
migrants) - although clearly this suggestion must necessarily be speculative.
To summarise, it is impossible to escape the conclusion that the population has
changed radically over the last 10 years in terms of people and ethnic mix. All of
these changes have contributed to the growth in population observed today.
0
5
10
15
20
25
30
35
40
<1 1 2 3 4 5 6 7 8 9 10 11 12 13 14 15
years since registration
Sp
ecifie
d e
thn
ic g
rou
ps a
s p
erc
en
tag
e o
f a
ll
reg
istr
an
ts
Figure 8: Percentage of registrations in the specified ethnic groupings as a
percentage of all registrants (base: the confirmed minimum population)
Luton population growth and change
25
6. Population by household and ethnic grouping
6.1 Household size by age and sex
In this section, we consider the level of occupation by UPRN9 and tenure based on the
confirmed minimum population as of March 31st 2010. We are interested in the
number and frequency of persons by household in each UPRN in different ethnic
groups and tenancy type. The resultant distributions offer an approach to quantifying
issues such as relative levels of overcrowding in different ethnic communities.
The differences in occupancy that arise could represent variations in family size and
formation between ethnic groups but also other factors. For example, the white
population tends to be older and it is well known that age and occupancy are strongly
linked. As populations age average household size tends to decline.
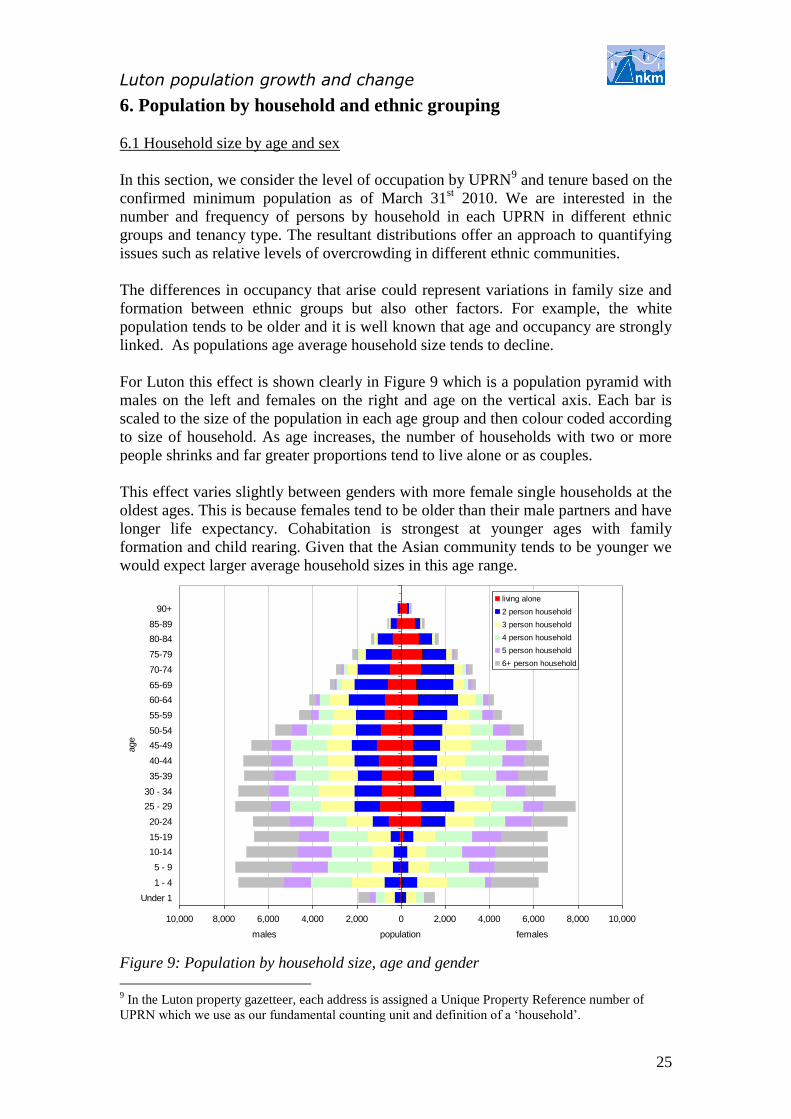
For Luton this effect is shown clearly in Figure 9 which is a population pyramid with
males on the left and females on the right and age on the vertical axis. Each bar is
scaled to the size of the population in each age group and then colour coded according
to size of household. As age increases, the number of households with two or more
people shrinks and far greater proportions tend to live alone or as couples.
This effect varies slightly between genders with more female single households at the
oldest ages. This is because females tend to be older than their male partners and have
longer life expectancy. Cohabitation is strongest at younger ages with family
formation and child rearing. Given that the Asian community tends to be younger we
would expect larger average household sizes in this age range.
10,000 8,000 6,000 4,000 2,000 0 2,000 4,000 6,000 8,000 10,000
Under 1
1 - 4
5 - 9
10-14
15-19
20-24
25 - 29
30 - 34
35-39
40-44
45-49
50-54
55-59
60-64
65-69
70-74
75-79
80-84
85-89
90+
age
males population females
living alone
2 person household
3 person household
4 person household
5 person household
6+ person household
Figure 9: Population by household size, age and gender
9 In the Luton property gazetteer, each address is assigned a Unique Property Reference number of
UPRN which we use as our fundamental counting unit and definition of a ‘household’.
Luton population growth and change
26
6.2 Occupancy by tenure and ethnicity
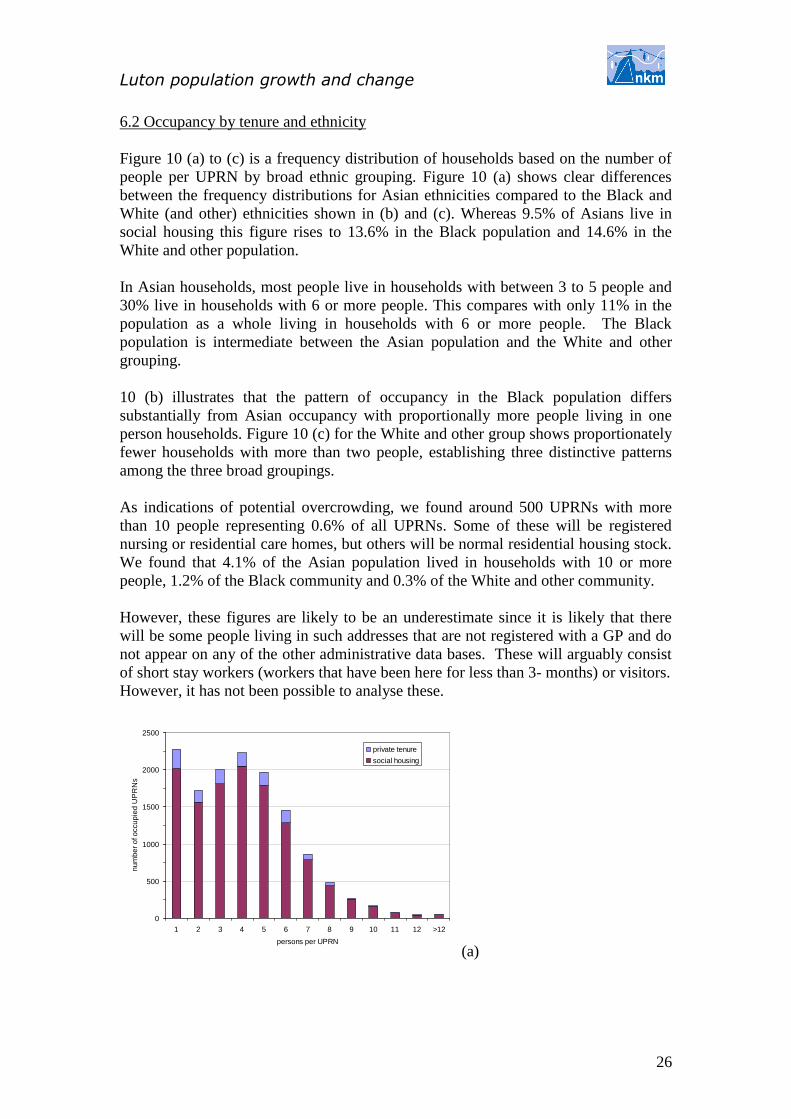
Figure 10 (a) to (c) is a frequency distribution of households based on the number of
people per UPRN by broad ethnic grouping. Figure 10 (a) shows clear differences
between the frequency distributions for Asian ethnicities compared to the Black and
White (and other) ethnicities shown in (b) and (c). Whereas 9.5% of Asians live in
social housing this figure rises to 13.6% in the Black population and 14.6% in the
White and other population.
In Asian households, most people live in households with between 3 to 5 people and
30% live in households with 6 or more people. This compares with only 11% in the
population as a whole living in households with 6 or more people. The Black
population is intermediate between the Asian population and the White and other
grouping.
10 (b) illustrates that the pattern of occupancy in the Black population differs
substantially from Asian occupancy with proportionally more people living in one
person households. Figure 10 (c) for the White and other group shows proportionately
fewer households with more than two people, establishing three distinctive patterns
among the three broad groupings.
As indications of potential overcrowding, we found around 500 UPRNs with more
than 10 people representing 0.6% of all UPRNs. Some of these will be registered
nursing or residential care homes, but others will be normal residential housing stock.
We found that 4.1% of the Asian population lived in households with 10 or more
people, 1.2% of the Black community and 0.3% of the White and other community.
However, these figures are likely to be an underestimate since it is likely that there
will be some people living in such addresses that are not registered with a GP and do
not appear on any of the other administrative data bases. These will arguably consist
of short stay workers (workers that have been here for less than 3- months) or visitors.
However, it has not been possible to analyse these.
0
500
1000
1500
2000
2500
1 2 3 4 5 6 7 8 9 10 11 12 >12
persons per UPRN
nu
mb
er
of o
ccu
pie
d U
PR
Ns
private tenure
social housing
(a)

Luton population growth and change
27
0
200
400
600
800
1000
1200
1400
1600
1 2 3 4 5 6 7 8 9 10 11 12 >12
persons per UPRN
num
ber
of U
PR
Ns
social housing
private tenure
(b)
0
5000
10000
15000
20000
25000
1 2 3 4 5 6 7 8 9 10 11 12 >12
number of persons per UPRN
nu
mb
er
of U
PR
Ns
social housing
private tenure
(c)
Figure 10 (a)-(c): Frequency of UPRN by household size, tenancy and ethnicity:
Asian households; (b) Black households; (c) White and other households
7. Income deprivation by ethnicity and age
Income deprivation is an important indicator of dependency on, and use of a wide
range of council services, especially among young people (e.g. Childrens Centres,
schools, free school means, special educational needs, social services), and for the
population in general (housing, access to benefits, Council Tax, planning applications,
environmental services and so on).
In this section, we identify and profile the population that is at risk of income
deprivation based on whether they live in households receiving means tested benefits,
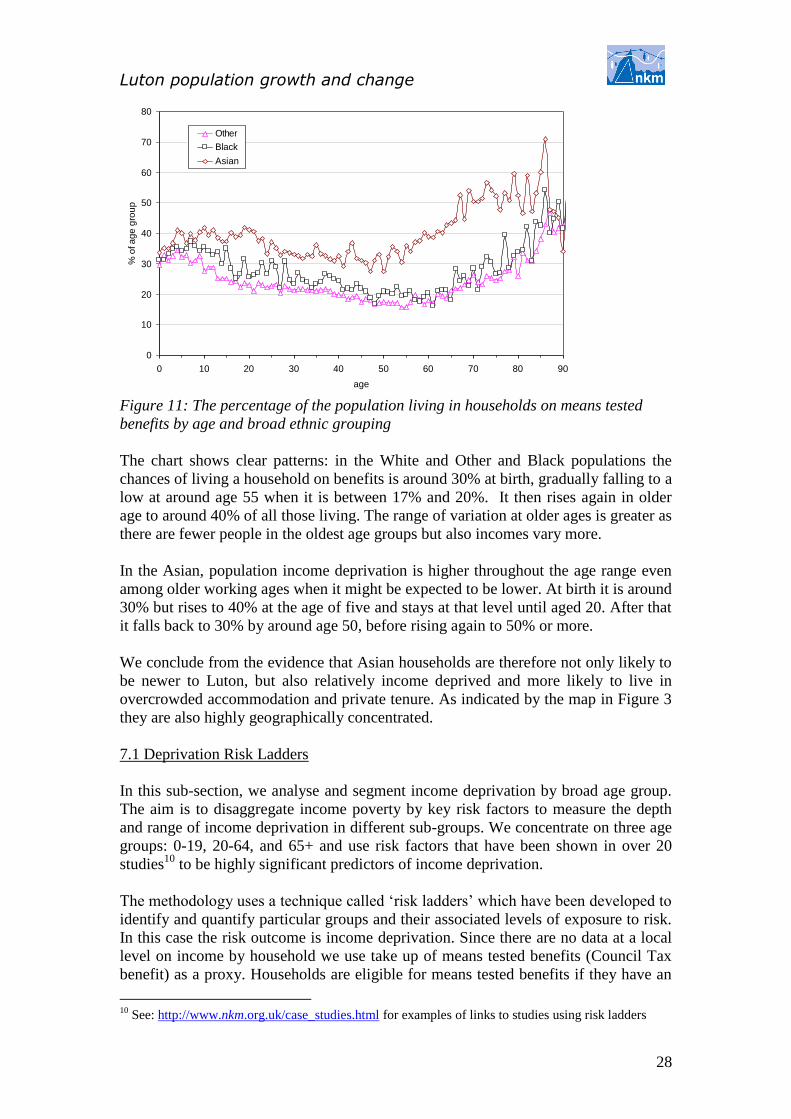
which is a common proxy for low income families. Figure 11 splits the population in
three broad ethnic groupings, Asian, Black and White and other. On the horizontal
axis is age and on the vertical axis the percentage of the population that is living in a
household on means tested benefits.
Luton population growth and change
28
0
10
20
30
40
50
60
70
80
0 10 20 30 40 50 60 70 80 90
age
% o
f a
ge
gro
up
Other
Black
Asian
Figure 11: The percentage of the population living in households on means tested
benefits by age and broad ethnic grouping
The chart shows clear patterns: in the White and Other and Black populations the
chances of living a household on benefits is around 30% at birth, gradually falling to a
low at around age 55 when it is between 17% and 20%. It then rises again in older
age to around 40% of all those living. The range of variation at older ages is greater as
there are fewer people in the oldest age groups but also incomes vary more.
In the Asian, population income deprivation is higher throughout the age range even
among older working ages when it might be expected to be lower. At birth it is around
30% but rises to 40% at the age of five and stays at that level until aged 20. After that
it falls back to 30% by around age 50, before rising again to 50% or more.
We conclude from the evidence that Asian households are therefore not only likely to
be newer to Luton, but also relatively income deprived and more likely to live in
overcrowded accommodation and private tenure. As indicated by the map in Figure 3
they are also highly geographically concentrated.
7.1 Deprivation Risk Ladders
In this sub-section, we analyse and segment income deprivation by broad age group.
The aim is to disaggregate income poverty by key risk factors to measure the depth
and range of income deprivation in different sub-groups. We concentrate on three age
groups: 0-19, 20-64, and 65+ and use risk factors that have been shown in over 20
studies10
to be highly significant predictors of income deprivation.
The methodology uses a technique called ‘risk ladders’ which have been developed to
identify and quantify particular groups and their associated levels of exposure to risk.
In this case the risk outcome is income deprivation. Since there are no data at a local
level on income by household we use take up of means tested benefits (Council Tax
benefit) as a proxy. Households are eligible for means tested benefits if they have an
10
See: http://www.nkm.org.uk/case_studies.html for examples of links to studies using risk ladders

Luton population growth and change
29
income that would put them below the Government poverty line based on their
circumstances.
(i) Children 0-19
Table 10, an example of a risk ladder, covers the whole of the age group 0-19 years.
The risk factors used to estimate the risk of income deprivation are influenced by
what we have found to be the case elsewhere, namely housing tenure (whether private
or social housing), whether the child lives in a single adult household (i.e. there is
only one adult aged 20 or over at an address), and if there are 3 or more children
living at the address.
Each row shows the numbers of children and young people in each of 8 mutually
exclusive categories ranked from most to least income deprived. The totals at the foot
of the columns show the number of people to whom a particular risk factor applies.
For example 28,082 out of 59,032 children and young people children live in social
housing (see foot of col. 5).
The table shows 23.5% of children and young people in this age group live at
addresses receiving means tested benefits. The categories least at risk of income
deprivation are located in row 8 of the table, to whom none of the risk factors apply.
There are 20,283 children and young people based on these criteria of which only
17.1% live at addresses that receive benefits as compared with 80.0% in the highest
risk group (row 1).
(a) 0-19
category frequency social
housing
single adult
household
3+ children
at address
% in households on benefits
lower CI%
upper CI%
1 1567 Y Y Y 80.0 78.0 82.0
2 1628 Y Y 70.7 68.4 72.9
3 3426 Y Y 68.3 66.7 69.9
4 2240 Y 56.3 54.2 58.4
5 3948 Y Y 47.0 45.4 48.6
6 6799 Y 31.3 30.2 32.4
7 19141 Y 30.0 29.4 30.7
8 20283 17.1 16.5 17.6
total 59032 8861 13942 28082 32.5 32.1 32.9
Table 10: Risk ladder showing the number and percentage of children and young
people living in households receiving means tested benefits by risk group (CI = 95%
confidence interval)
The risk factors can be translated into odds of an event happening. In this case, in
Luton, a child or young person aged 0-19 is:
o 5.3 times more likely to be on benefits if living in social housing
o 2.1 times more likely if it is a single adult household
o 2.0 times more likely if there are 3+ children at the same address

Luton population growth and change
30
Note that the risks or odds are multiplicative so that a young person in social housing
and in a single adult household and living with 3 or more children is 5.3 x 2.1 x 2.0
times more likely to be on benefits i.e. 22.2 times more likely. This group is located in
row 1 of the table and comprises 1,567 individual children of whom 80% live at an
address receiving benefits within a 95% confidence interval ranging from 78% to
82%. The chart in Figure 12 shows the predicted risk based on the given risk factors
versus the observed risk and shows clearly their predictive ability, explaining over
99% of the observed variation in benefit entitlement.
y = 1.019x - 0.9831
R2 = 0.9957
0
10
20
30
40
50
60
70
80
90
0 10 20 30 40 50 60 70 80 90
observed %
pre
dic
ted
%
Figure 12: Predicted risk of income poverty based on the given risk factors versus
observed risk for population aged 0-19
(b) 20-64
category frequency social
housing
single adult
household
children or
young person
at address
% in households on benefits
lower CI%
upper CI%
1 1522 Y Y Y 72.5 70.2 74.7
2 2339 Y Y 71.1 69.2 72.9
3 5729 Y Y 60.5 59.2 61.8
4 3859 Y 60.2 58.6 61.7
5 6023 Y Y 33.4 32.2 34.6
6 45728 Y 21.1 20.8 21.5
7 16775 Y 16.1 15.6 16.7
8 39129 14.0 13.7 14.4
total 121104 13449 26659 59002 23.5 23.2 23.7
Table 11: Risk ladder showing the number and percentage of adults aged 20-64 living
in households receiving means tested benefits by risk group (CI = 95% confidence
interval)

Luton population growth and change
31
Table 11 shows the equivalent table for the 20-64 age group, i.e. persons of working
age. There are 121,104 people in this group of whom 23.5% live in a household on
means tested benefits, a much lower percentage than is the case for children and
young people. The risk factors used to estimate the risk of income deprivation are
housing tenure (whether private or social housing), whether the person lives in a
single adult household (i.e. there is only one adult aged 20 or over at an address), and
if there is at least one child or young person under 20 living at the address.
The highest risk category is located in row 1. This comprises of 1522 persons, of
whom 72.5% receive benefits. They are single adult households with at least one child
at the address living in social housing. The least income deprived group in this age
range has 39,129 persons of whom only 14.0% are on benefits (row 8).
There are differences in terms of the relative impact of housing tenure which has a
greater association with this age group than with the 0-19 age group. This is shown in
the odds of income deprivation increasing:
o 7.5 times more likely to be on benefits if living in social housing
o 1.5 time more likely to be on benefits if it is a single adult household
o 1.7 times more likely to be on benefits if there is at least one child at the
address
The risks or odds are multiplicative so that a person in social housing and in a single
adult household and living with at least one child is 7.5 x 1.5 x 1.7 times more likely
to be on benefits i.e. 18.2 times more likely. The graph in Figure 13 shows the
predicted risk based on the given risk factors versus the observed risk and shows that
it explains over 96% of the observed variation.
y = 0.9675x + 0.4603
R2 = 0.9643
0
10
20
30
40
50
60
70
80
0 10 20 30 40 50 60 70 80
observed %
pre
dic
ted
%
Figure 13: Predicted risk of income poverty based on the given risk factors versus
observed risk for population aged 20-64
Luton population growth and change
32
(c) 65+
category frequency social
housing living alone 75+
% in households on benefits
lower CI%
upper CI%
1 668 Y Y 83.7 80.7 86.4
2 917 Y Y Y 80.3 77.5 82.8
3 519 Y Y 76.7 72.8 80.3
4 857 Y 74.6 71.5 77.4
5 2991 Y Y 32.3 30.6 34.0
6 2046 Y 25.8 23.9 27.8
7 5504 Y 23.1 22.0 24.3
8 9110 18.7 17.9 19.6
total 22612 2961 6622 9931 30.1 29.5 30.7
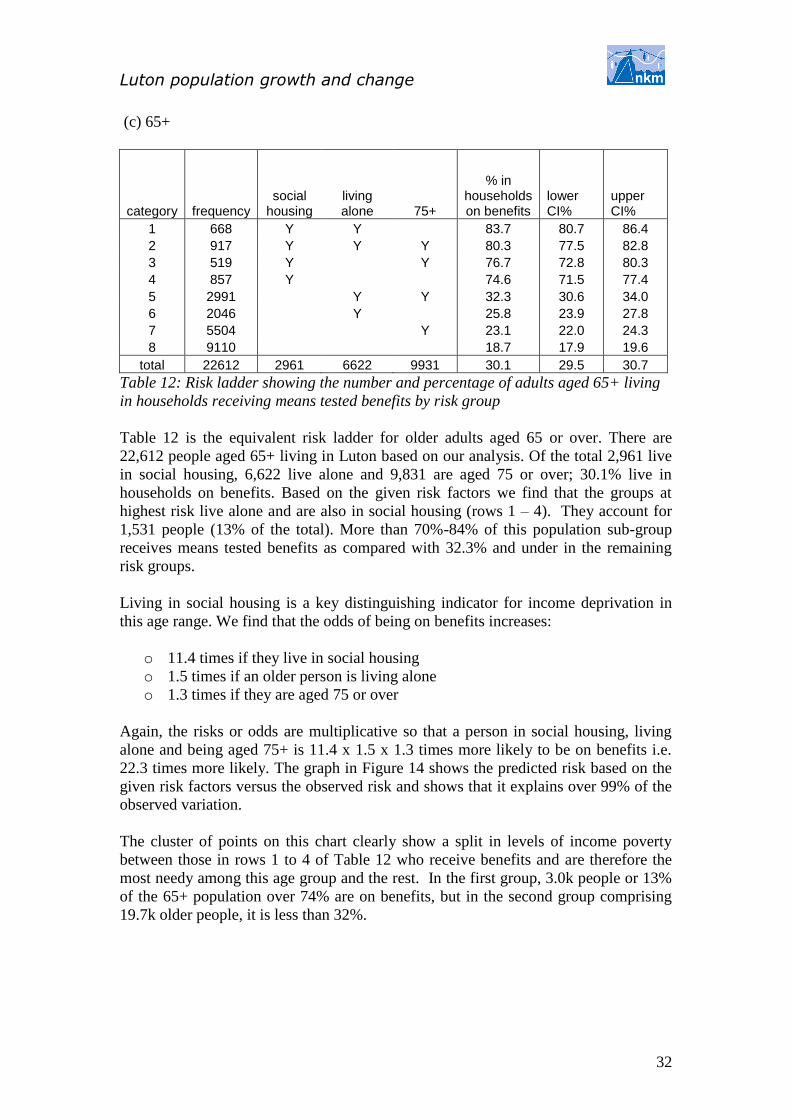
Table 12: Risk ladder showing the number and percentage of adults aged 65+ living
in households receiving means tested benefits by risk group
Table 12 is the equivalent risk ladder for older adults aged 65 or over. There are
22,612 people aged 65+ living in Luton based on our analysis. Of the total 2,961 live
in social housing, 6,622 live alone and 9,831 are aged 75 or over; 30.1% live in
households on benefits. Based on the given risk factors we find that the groups at
highest risk live alone and are also in social housing (rows 1 – 4). They account for
1,531 people (13% of the total). More than 70%-84% of this population sub-group
receives means tested benefits as compared with 32.3% and under in the remaining
risk groups.
Living in social housing is a key distinguishing indicator for income deprivation in
this age range. We find that the odds of being on benefits increases:
o 11.4 times if they live in social housing
o 1.5 times if an older person is living alone
o 1.3 times if they are aged 75 or over
Again, the risks or odds are multiplicative so that a person in social housing, living
alone and being aged 75+ is 11.4 x 1.5 x 1.3 times more likely to be on benefits i.e.
22.3 times more likely. The graph in Figure 14 shows the predicted risk based on the
given risk factors versus the observed risk and shows that it explains over 99% of the
observed variation.
The cluster of points on this chart clearly show a split in levels of income poverty
between those in rows 1 to 4 of Table 12 who receive benefits and are therefore the
most needy among this age group and the rest. In the first group, 3.0k people or 13%
of the 65+ population over 74% are on benefits, but in the second group comprising
19.7k older people, it is less than 32%.

Luton population growth and change
33
y = 0.9954x + 0.1321
R2 = 0.9951
0
10
20
30
40
50
60
70
80
90
0 10 20 30 40 50 60 70 80 90
observed %
pre
dic
ted
%
Figure 14: Predicted risk of income poverty based on the given risk factors versus
observed risk for population aged 65 or over
8. Conclusions
This report finds that 202,748 people lived in Luton in around 77,000 households as
of 31st March 2010. Our population figure compares with the ONS’s latest estimate
for Luton of 194,400, which is 8,348 lower than ours. Our figure is higher by around
18,000 compared with the population at the last Census in 2001, which in turn was
about a 12,000 increase on 1991.
We also find that there have been substantial changes in the ethnic composition of the
population over the last 9 years. For example, in comparison with the 2001 Census,
we estimate that the Asian population has grown from 33.6k to 50.2k by 2010, the
Black population from 11.7k to 19.8k; meanwhile, the White and other population has
fallen from 139k to 132k.
The growing diversity within Luton’s population is partly demographic and partly
economic in origin. Population growth is partly through natural increase and partly by
inflows from elsewhere in the UK and by immigration. It is difficult to separate
inflows from immigration and official data sources are fragmentary or controversial.
Our own work has used different sources albeit based on one snapshot in time. Using
the GP registration as a proxy for population turnover we found that substantial
numbers of new registrants since the last Census and that an increasing proportion of
registrants were of Asian but also European origin.
It is calculated for example that over 50% and possibly as much as 73% of the current
population were not alive or did not live in Luton at the time of the last Census. This
Luton population growth and change
34
finding therefore has obvious implications for the conduct of the forthcoming Census
in March 2011. For example, Luton experienced low response rates at the time of the
last Census and there appears the likelihood that this may happen again in 2011.
Maps of these broad ethnic groups show that the Asian population is the most heavily
concentrated geographically, in the south central area of town. The Asian population
is both poorer and more concentrated than other groups that we have analysed. They
are more likely to live in households on benefits and household size is numerically
larger. In addition, a greater proportion of the Asian population live in private tenure
rather than social housing.
Unpicking the many other nationalities and ethnic groups in Luton is complicated due
to definitional issues. However, it is clear that there is an emerging and growing
African community. The hardest groups to analyse are people from various European
nations although we found distinctive but small concentrations of Turkish
communities, as well as some other nationalities and grouping (e.g. ‘other’ east
Europeans).
The most problematic group to count were Polish migrants, in part because people
with Polish names have been long established in the UK so it is a matter of
distinguishing between established families and new arrivals. National Insurance data
suggest large inflows of Polish economic migrants in recent years but it is less clear
how many of these stayed on in Luton or went elsewhere.
A separate analysis of Polish names showed that the population could be as high as
8.7k. However, closer analysis suggests that in the most mobile age group (16-35) the
numbers registering with a GP in the last six years and living in cohabiting adult or
single person households falls to around 2,700 individuals.
Recommendations
The analysis set out in this report is based on a single snapshot of administrative data.
These datasets have been linked together by each individual in the confirmed data
base meeting a set of conditions before being included. Clearly, these and other
findings have implications for the way the next Census is conducted to ensure that
response rates are maximised and sufficient forms are dispatched to each address. It is
highly recommended therefore that they are taken into account as Census day
approaches.
To understand how this population changes between two points in time it is necessary
to take a second snapshot to show who is new, and who has left or died. Two
snapshots would enable one to look at both leavers and joiners and changes in
mortality and fertility by ethnicity. This in turn would show how long people were
staying in Luton on average, turnover in different areas of town, whether income
deprivation was changing, whether the population was getting younger, older and
more or less cosmopolitan and so on.
The next Census is imminent. It is important that Luton’s population is measured
fairly and accurately. It is therefore recommended that a new snapshot if undertaken
synchronously with the Census would provide independent evidence with which to
Luton population growth and change
35
challenge the ONS in the event of disagreement; a baseline for measuring turnover
and change and enable detailed analyses at any level of geographical resolution.
By routinely combining the data sets with other administrative data such as education
services, children and families and social services and linking them to the Local Land
and Property Gazetteer (LLPG), it would be possible to profile needs and measure
progress across a range of council and other public services. Specific topics such as
voter registration among BME communities; unmet need in social care; youth
offending and crime; and child poverty could be routinely analysed. Thus, it will be
important to establish links across all the data owners to ensure this happens and this
is recommended accordingly.
Such an arrangement may be further facilitated by the transfer of responsibilities in
the area of health and well being from NHS Luton. This project was fortunate to be
able to share data with the PCT for statistical purposes and research. Other data sets
owned by the PCT such as hospital episode data and health visitor data would enable
Luton to expand its understanding of both ethnicity and health needs. With the
abolition of PCTs and Public Health moving to the council, it is therefore vitally
important that access to key NHS data and systems is maintained. This is a priority
for Public Health to enable work to continue at the current level and aid data sharing
with partners and the new GP consortia and so this also recommended.
The greater use of administrative data linked to the Local Land and Property
Gazetteer would help to improve efficiency by reducing reliance on external data sets
and those that require licences; improve quality by using the latest data rather than
data that is up to ten years out of date; and improve the information intelligence
provided to the council and local population in a range of different applications. It is
therefore recommended that consideration should be given to how this could be
achieved within current resources within the Council and among Luton’s public sector
partners.
From a strategic standpoint, the Council and its partners need to make greater use of
their administrative data in order to understand the dynamics of the Luton population.
This is increasingly important as population mobility increases. At present there is no
single comprehensive database of residents, although the GP Register is probably the
most comprehensive. Therefore consideration should be given to the establishment of
a comprehensive residents’ database to which all administrative systems can be
linked. This would provide significant efficiencies in data management terms but also
provide the underlying information infrastructure for demographic analysis and
customer profiling. It is therefore recommended that the Council assesses the business
case for such a database.
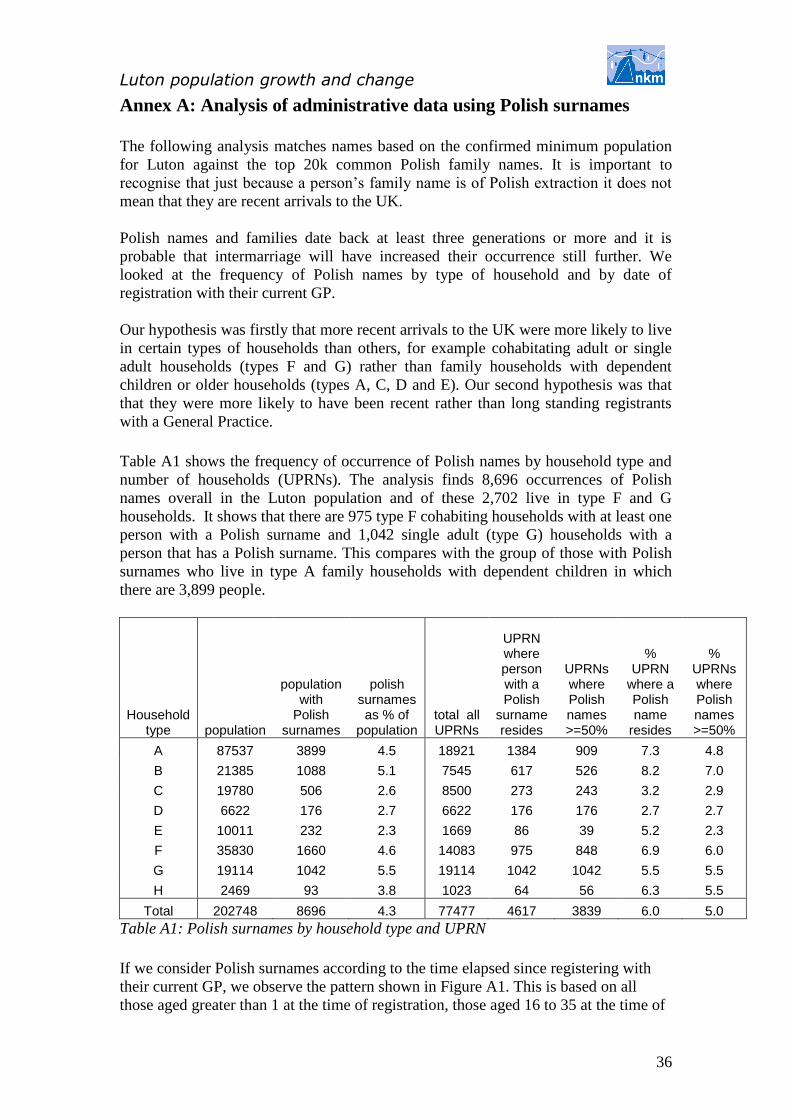
Luton population growth and change
36
Annex A: Analysis of administrative data using Polish surnames
The following analysis matches names based on the confirmed minimum population
for Luton against the top 20k common Polish family names. It is important to
recognise that just because a person’s family name is of Polish extraction it does not
mean that they are recent arrivals to the UK.
Polish names and families date back at least three generations or more and it is
probable that intermarriage will have increased their occurrence still further. We
looked at the frequency of Polish names by type of household and by date of
registration with their current GP.
Our hypothesis was firstly that more recent arrivals to the UK were more likely to live
in certain types of households than others, for example cohabitating adult or single
adult households (types F and G) rather than family households with dependent
children or older households (types A, C, D and E). Our second hypothesis was that
that they were more likely to have been recent rather than long standing registrants
with a General Practice.
Table A1 shows the frequency of occurrence of Polish names by household type and
number of households (UPRNs). The analysis finds 8,696 occurrences of Polish
names overall in the Luton population and of these 2,702 live in type F and G
households. It shows that there are 975 type F cohabiting households with at least one
person with a Polish surname and 1,042 single adult (type G) households with a
person that has a Polish surname. This compares with the group of those with Polish
surnames who live in type A family households with dependent children in which
there are 3,899 people.
Household type population
population with
Polish surnames
polish surnames as % of
population total all UPRNs
UPRN where person with a Polish
surname resides
UPRNs where Polish names >=50%
% UPRN
where a Polish name
resides
% UPRNs where Polish names >=50%
A 87537 3899 4.5 18921 1384 909 7.3 4.8
B 21385 1088 5.1 7545 617 526 8.2 7.0
C 19780 506 2.6 8500 273 243 3.2 2.9
D 6622 176 2.7 6622 176 176 2.7 2.7
E 10011 232 2.3 1669 86 39 5.2 2.3
F 35830 1660 4.6 14083 975 848 6.9 6.0
G 19114 1042 5.5 19114 1042 1042 5.5 5.5
H 2469 93 3.8 1023 64 56 6.3 5.5
Total 202748 8696 4.3 77477 4617 3839 6.0 5.0
Table A1: Polish surnames by household type and UPRN
If we consider Polish surnames according to the time elapsed since registering with
their current GP, we observe the pattern shown in Figure A1. This is based on all
those aged greater than 1 at the time of registration, those aged 16 to 35 at the time of
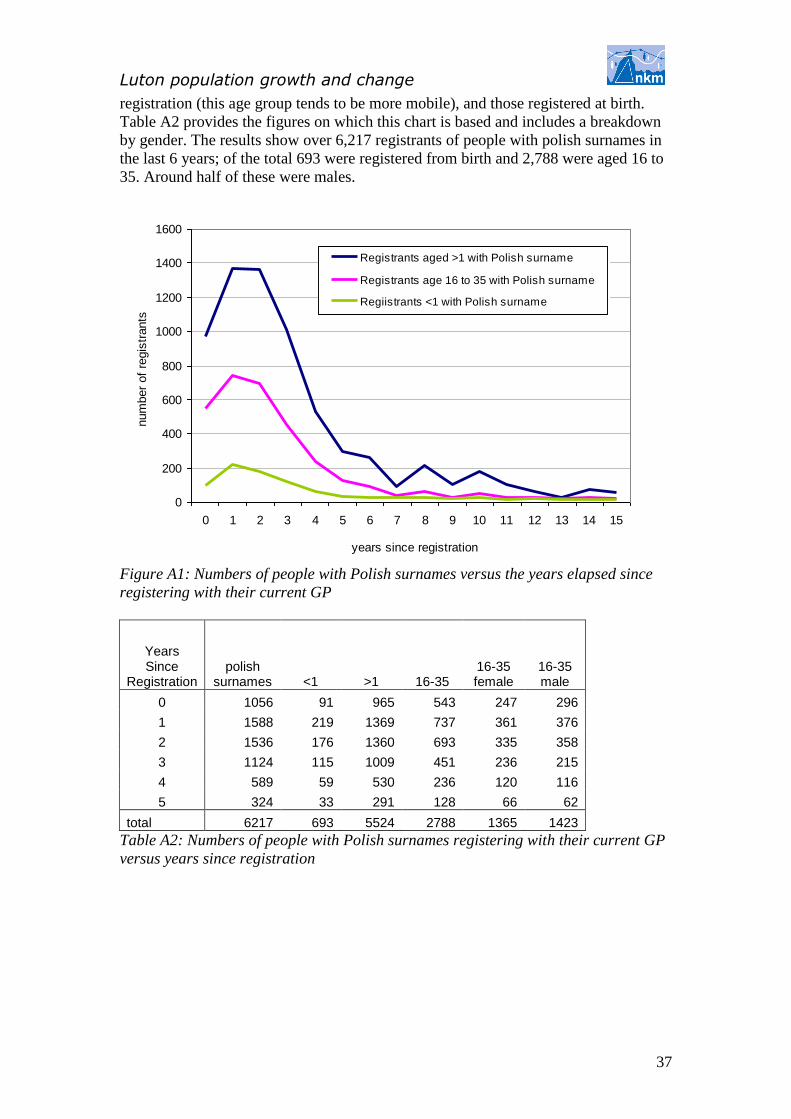
Luton population growth and change
37
registration (this age group tends to be more mobile), and those registered at birth.
Table A2 provides the figures on which this chart is based and includes a breakdown
by gender. The results show over 6,217 registrants of people with polish surnames in
the last 6 years; of the total 693 were registered from birth and 2,788 were aged 16 to
35. Around half of these were males.
0
200
400
600
800
1000
1200
1400
1600
0 1 2 3 4 5 6 7 8 9 10 11 12 13 14 15
years since registration
num
ber
of
regis
trants
Registrants aged >1 with Polish surname
Registrants age 16 to 35 with Polish surname
Regiistrants <1 with Polish surname
Figure A1: Numbers of people with Polish surnames versus the years elapsed since
registering with their current GP
Years Since
Registration polish
surnames <1 >1 16-35 16-35 female
16-35 male
0 1056 91 965 543 247 296
1 1588 219 1369 737 361 376
2 1536 176 1360 693 335 358
3 1124 115 1009 451 236 215
4 589 59 530 236 120 116
5 324 33 291 128 66 62
total 6217 693 5524 2788 1365 1423
Table A2: Numbers of people with Polish surnames registering with their current GP
versus years since registration
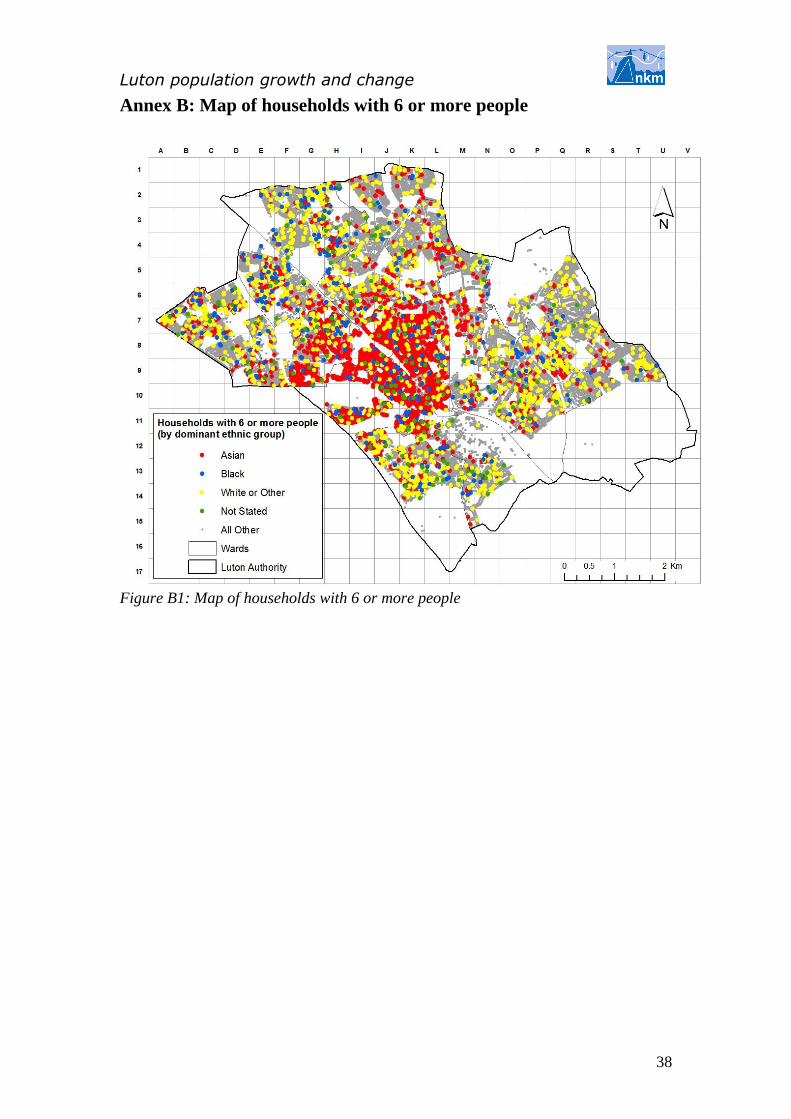
Luton population growth and change
38
Annex B: Map of households with 6 or more people
Figure B1: Map of households with 6 or more people

Luton population growth and change
39
Annex C: Ward level tables by age and ethnicity
Key:
Table no: Ward
C1 All Wards (Luton)
C2 Barnfield Ward
C3 Biscot Ward
C4 Bramingham Ward
C5 Challney Ward
C6 Crawley Ward
C7 Dallow Ward
C8 Farley Ward
C9 High Town Ward
C10 Icknield Ward
C11 Leagrave Ward
C12 Lewsey Ward
C13 Limbury Ward
C14 Northwell Ward
C15 Round Green Ward
C16 Saints Ward
C17 South Ward
C18 Stopsley Ward
C19 Sundon Park Ward
C20 Wigmore Ward

Luton population growth and change
40
C1: Luton
age group Pakistan
i Bangladesh
i
Indian and
other Black
White and
other total
of which Asian sub-
continent
Under 1 731 328 215 375 2047 3695 1273
1-4 2834 1412 865 1564 7729 14404 5111
5-9 3084 1641 867 1763 7094 14448 5592
10-14 2363 1314 754 1634 7363 13428 4431
15-19 1892 1005 749 1401 8011 13057 3646
20-24 2021 1042 935 1153 8745 13898 3999
25-29 2404 1276 1170 1182 9311 15343 4850
30-34 2215 1344 1091 1288 8465 14403 4650
35-39 1723 1131 910 1458 8426 13648 3764
40-44 1224 724 798 1578 9389 13714 2746
45-49 722 455 685 1423 9644 12929 1862
50-54 698 468 740 1002 7982 10891 1907
55-59 577 398 634 693 6631 8933 1609
60-64 320 241 444 616 6615 8236 1005
65-69 235 194 340 491 5270 6531 770
70-74 268 233 272 503 4874 6150 773
75-79 166 136 175 346 3862 4685 477
80-84 74 55 99 210 2559 2997 229
85-89 26 21 40 107 1425 1620 88
90+ 10 7 10 42 560 629 27 Age
Unknown 592 317 477 954 6769 9109 1386
Total 24179 13744 12273 19783 132770 202748 50196
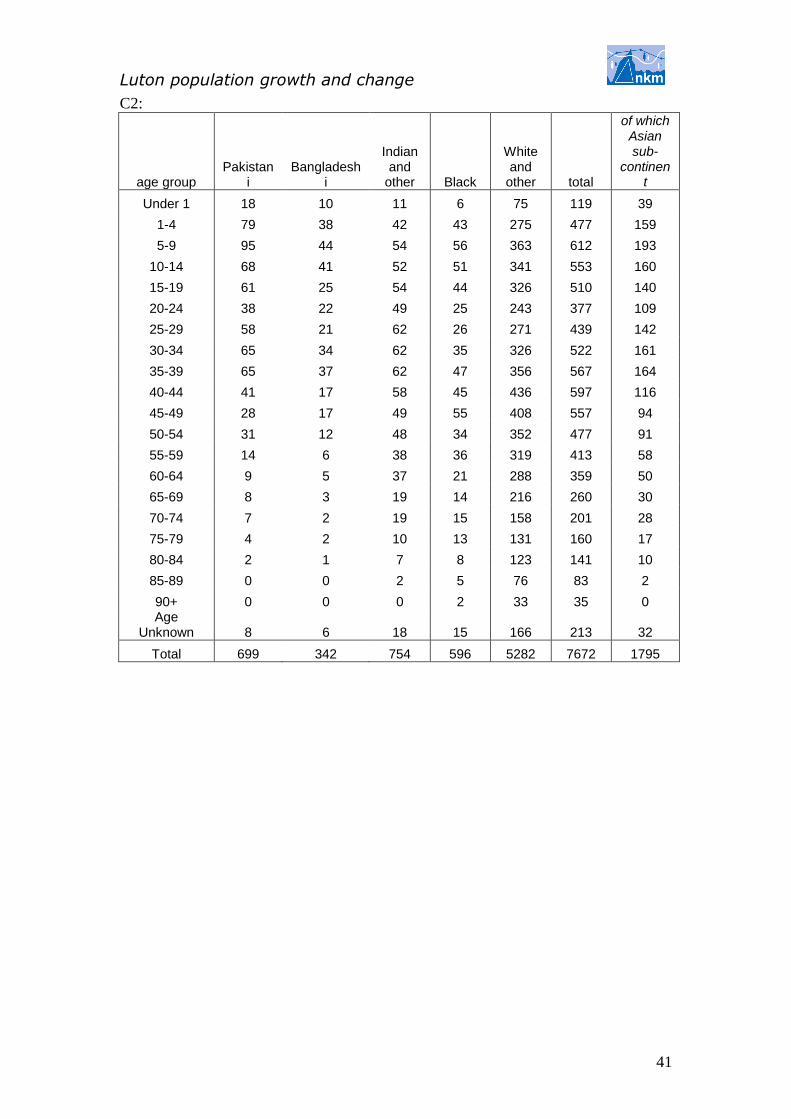
Luton population growth and change
41
C2:
age group Pakistan
i Bangladesh
i
Indian and
other Black
White and
other total
of which Asian sub-
continent
Under 1 18 10 11 6 75 119 39
1-4 79 38 42 43 275 477 159
5-9 95 44 54 56 363 612 193
10-14 68 41 52 51 341 553 160
15-19 61 25 54 44 326 510 140
20-24 38 22 49 25 243 377 109
25-29 58 21 62 26 271 439 142
30-34 65 34 62 35 326 522 161
35-39 65 37 62 47 356 567 164
40-44 41 17 58 45 436 597 116
45-49 28 17 49 55 408 557 94
50-54 31 12 48 34 352 477 91
55-59 14 6 38 36 319 413 58
60-64 9 5 37 21 288 359 50
65-69 8 3 19 14 216 260 30
70-74 7 2 19 15 158 201 28
75-79 4 2 10 13 131 160 17
80-84 2 1 7 8 123 141 10
85-89 0 0 2 5 76 83 2
90+ 0 0 0 2 33 35 0 Age
Unknown 8 6 18 15 166 213 32
Total 699 342 754 596 5282 7672 1795
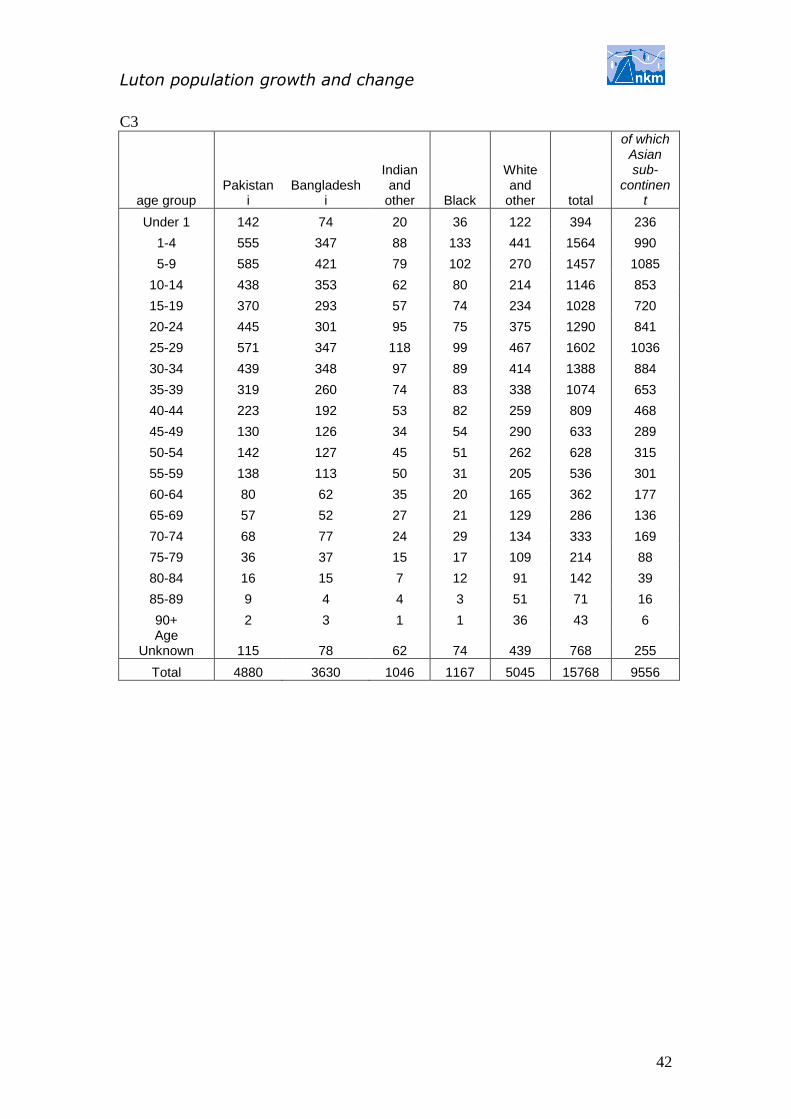
Luton population growth and change
42
C3
age group Pakistan
i Bangladesh
i
Indian and
other Black
White and
other total
of which Asian sub-
continent
Under 1 142 74 20 36 122 394 236
1-4 555 347 88 133 441 1564 990
5-9 585 421 79 102 270 1457 1085
10-14 438 353 62 80 214 1146 853
15-19 370 293 57 74 234 1028 720
20-24 445 301 95 75 375 1290 841
25-29 571 347 118 99 467 1602 1036
30-34 439 348 97 89 414 1388 884
35-39 319 260 74 83 338 1074 653
40-44 223 192 53 82 259 809 468
45-49 130 126 34 54 290 633 289
50-54 142 127 45 51 262 628 315
55-59 138 113 50 31 205 536 301
60-64 80 62 35 20 165 362 177
65-69 57 52 27 21 129 286 136
70-74 68 77 24 29 134 333 169
75-79 36 37 15 17 109 214 88
80-84 16 15 7 12 91 142 39
85-89 9 4 4 3 51 71 16
90+ 2 3 1 1 36 43 6 Age
Unknown 115 78 62 74 439 768 255
Total 4880 3630 1046 1167 5045 15768 9556
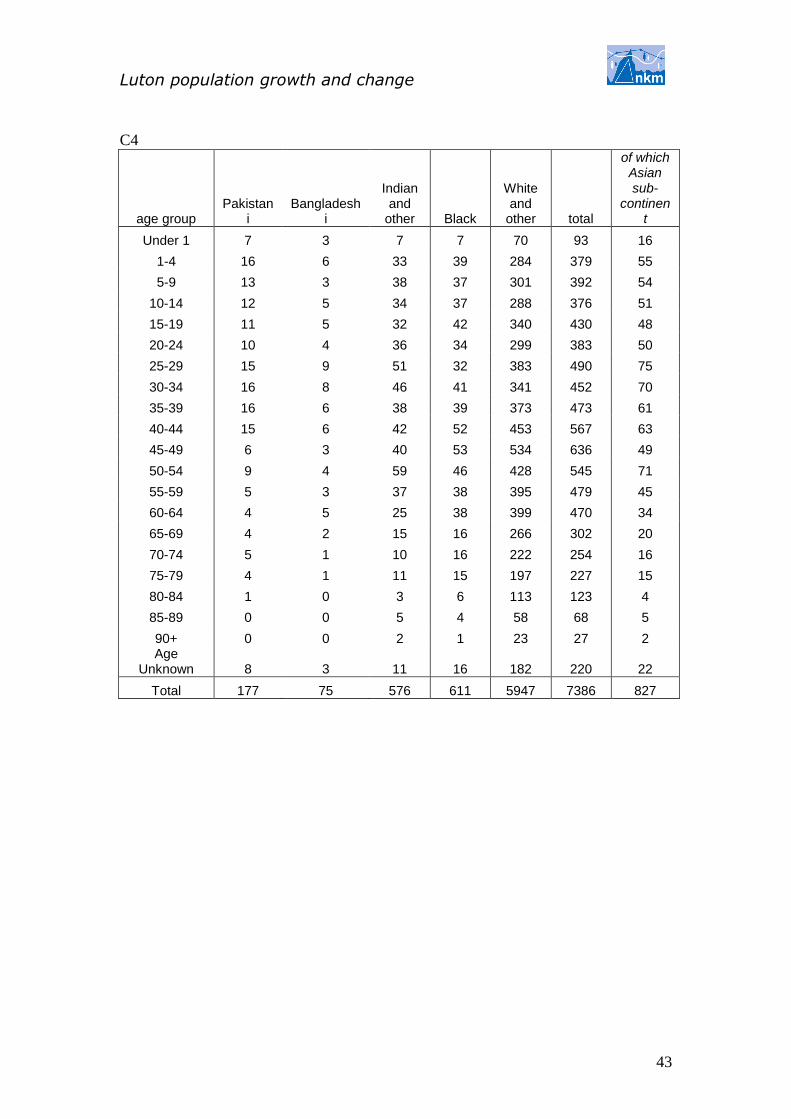
Luton population growth and change
43
C4
age group Pakistan
i Bangladesh
i
Indian and
other Black
White and
other total
of which Asian sub-
continent
Under 1 7 3 7 7 70 93 16
1-4 16 6 33 39 284 379 55
5-9 13 3 38 37 301 392 54
10-14 12 5 34 37 288 376 51
15-19 11 5 32 42 340 430 48
20-24 10 4 36 34 299 383 50
25-29 15 9 51 32 383 490 75
30-34 16 8 46 41 341 452 70
35-39 16 6 38 39 373 473 61
40-44 15 6 42 52 453 567 63
45-49 6 3 40 53 534 636 49
50-54 9 4 59 46 428 545 71
55-59 5 3 37 38 395 479 45
60-64 4 5 25 38 399 470 34
65-69 4 2 15 16 266 302 20
70-74 5 1 10 16 222 254 16
75-79 4 1 11 15 197 227 15
80-84 1 0 3 6 113 123 4
85-89 0 0 5 4 58 68 5
90+ 0 0 2 1 23 27 2 Age
Unknown 8 3 11 16 182 220 22
Total 177 75 576 611 5947 7386 827
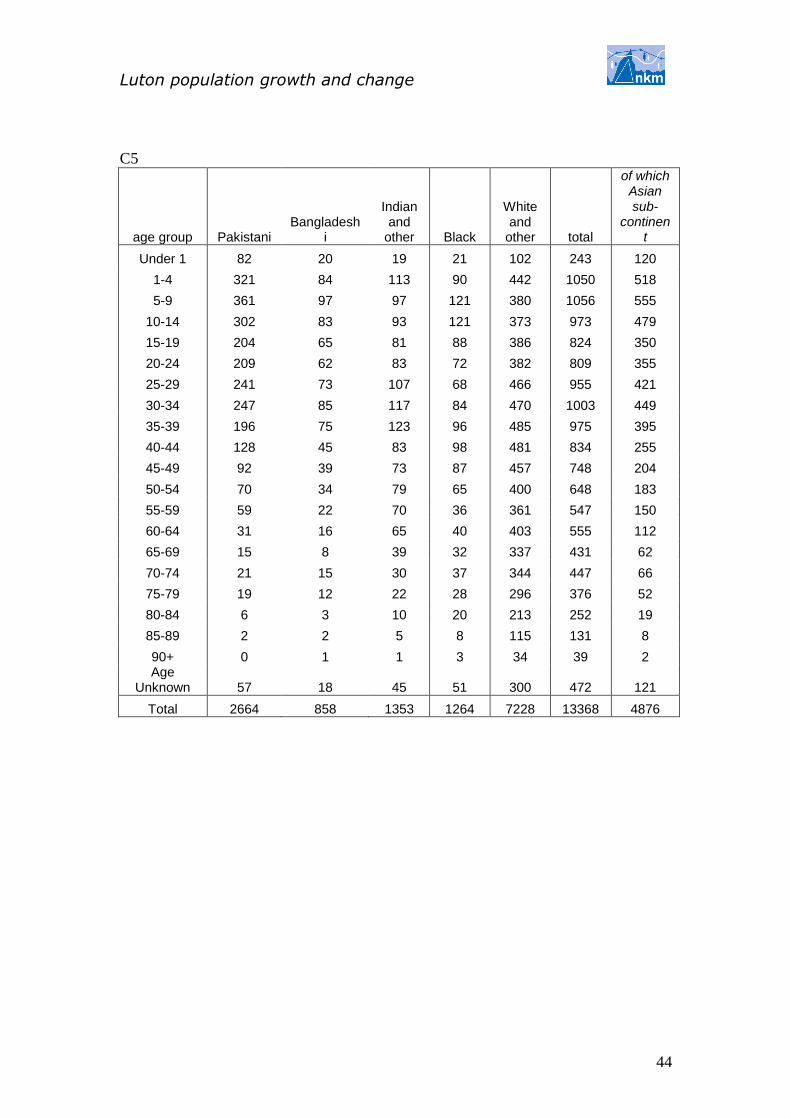
Luton population growth and change
44
C5
age group Pakistani Bangladesh
i
Indian and
other Black
White and
other total
of which Asian sub-
continent
Under 1 82 20 19 21 102 243 120
1-4 321 84 113 90 442 1050 518
5-9 361 97 97 121 380 1056 555
10-14 302 83 93 121 373 973 479
15-19 204 65 81 88 386 824 350
20-24 209 62 83 72 382 809 355
25-29 241 73 107 68 466 955 421
30-34 247 85 117 84 470 1003 449
35-39 196 75 123 96 485 975 395
40-44 128 45 83 98 481 834 255
45-49 92 39 73 87 457 748 204
50-54 70 34 79 65 400 648 183
55-59 59 22 70 36 361 547 150
60-64 31 16 65 40 403 555 112
65-69 15 8 39 32 337 431 62
70-74 21 15 30 37 344 447 66
75-79 19 12 22 28 296 376 52
80-84 6 3 10 20 213 252 19
85-89 2 2 5 8 115 131 8
90+ 0 1 1 3 34 39 2 Age
Unknown 57 18 45 51 300 472 121
Total 2664 858 1353 1264 7228 13368 4876
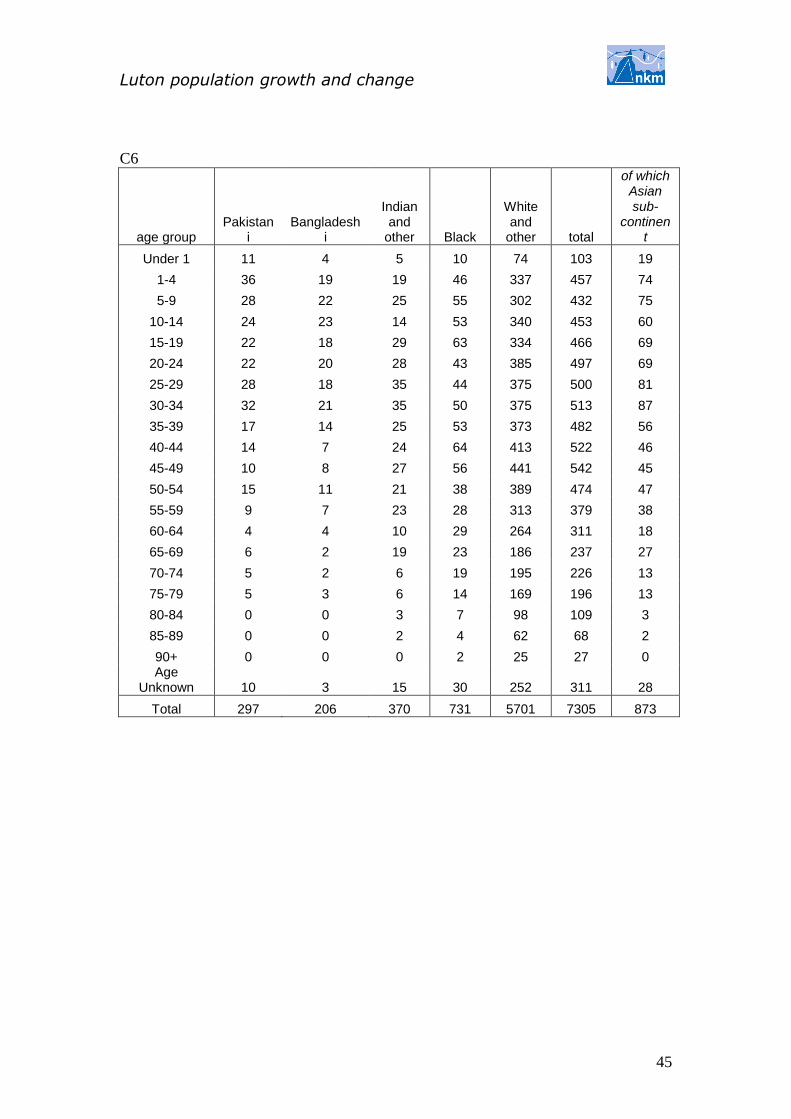
Luton population growth and change
45
C6
age group Pakistan
i Bangladesh
i
Indian and
other Black
White and
other total
of which Asian sub-
continent
Under 1 11 4 5 10 74 103 19
1-4 36 19 19 46 337 457 74
5-9 28 22 25 55 302 432 75
10-14 24 23 14 53 340 453 60
15-19 22 18 29 63 334 466 69
20-24 22 20 28 43 385 497 69
25-29 28 18 35 44 375 500 81
30-34 32 21 35 50 375 513 87
35-39 17 14 25 53 373 482 56
40-44 14 7 24 64 413 522 46
45-49 10 8 27 56 441 542 45
50-54 15 11 21 38 389 474 47
55-59 9 7 23 28 313 379 38
60-64 4 4 10 29 264 311 18
65-69 6 2 19 23 186 237 27
70-74 5 2 6 19 195 226 13
75-79 5 3 6 14 169 196 13
80-84 0 0 3 7 98 109 3
85-89 0 0 2 4 62 68 2
90+ 0 0 0 2 25 27 0 Age
Unknown 10 3 15 30 252 311 28
Total 297 206 370 731 5701 7305 873
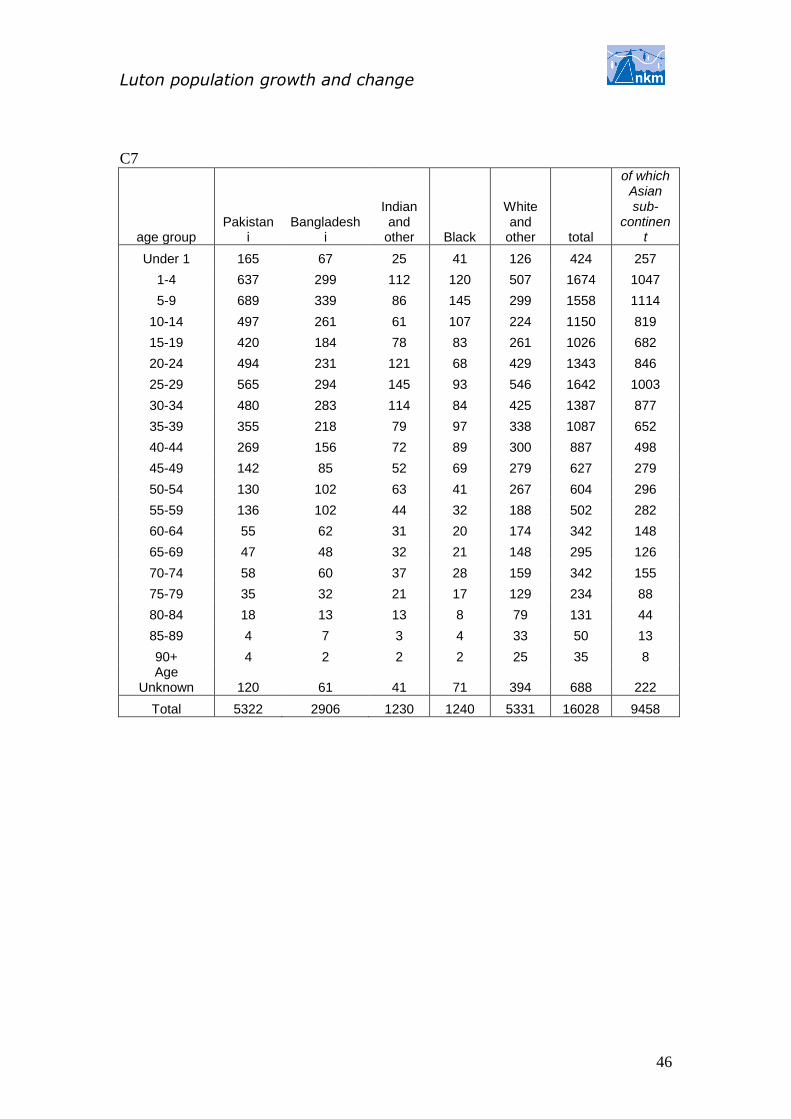
Luton population growth and change
46
C7
age group Pakistan
i Bangladesh
i
Indian and
other Black
White and
other total
of which Asian sub-
continent
Under 1 165 67 25 41 126 424 257
1-4 637 299 112 120 507 1674 1047
5-9 689 339 86 145 299 1558 1114
10-14 497 261 61 107 224 1150 819
15-19 420 184 78 83 261 1026 682
20-24 494 231 121 68 429 1343 846
25-29 565 294 145 93 546 1642 1003
30-34 480 283 114 84 425 1387 877
35-39 355 218 79 97 338 1087 652
40-44 269 156 72 89 300 887 498
45-49 142 85 52 69 279 627 279
50-54 130 102 63 41 267 604 296
55-59 136 102 44 32 188 502 282
60-64 55 62 31 20 174 342 148
65-69 47 48 32 21 148 295 126
70-74 58 60 37 28 159 342 155
75-79 35 32 21 17 129 234 88
80-84 18 13 13 8 79 131 44
85-89 4 7 3 4 33 50 13
90+ 4 2 2 2 25 35 8 Age
Unknown 120 61 41 71 394 688 222
Total 5322 2906 1230 1240 5331 16028 9458

Luton population growth and change
47
C8
age group Pakistan
i Bangladesh
i
Indian and
other Black
White and
other total
of which Asian sub-
continent
Under 1 31 15 13 22 139 221 60
1-4 108 54 35 98 522 817 197
5-9 128 62 38 119 495 843 229
10-14 94 53 27 100 523 797 174
15-19 81 32 17 86 589 805 130
20-24 76 41 35 85 656 892 151
25-29 86 45 47 68 654 900 178
30-34 87 49 40 82 551 808 176
35-39 63 45 29 78 528 743 137
40-44 44 23 30 87 602 785 96
45-49 28 20 17 83 618 766 64
50-54 22 12 25 60 515 635 59
55-59 17 15 18 43 441 534 49
60-64 11 9 15 30 395 460 35
65-69 7 6 10 24 287 334 23
70-74 9 9 13 19 251 302 32
75-79 7 5 7 19 249 286 19
80-84 4 2 5 17 185 213 11
85-89 2 2 2 7 119 132 6
90+ 0 0 0 5 43 48 0 Age
Unknown 28 10 22 48 443 551 60
Total 932 509 445 1181 8805 11872 1886
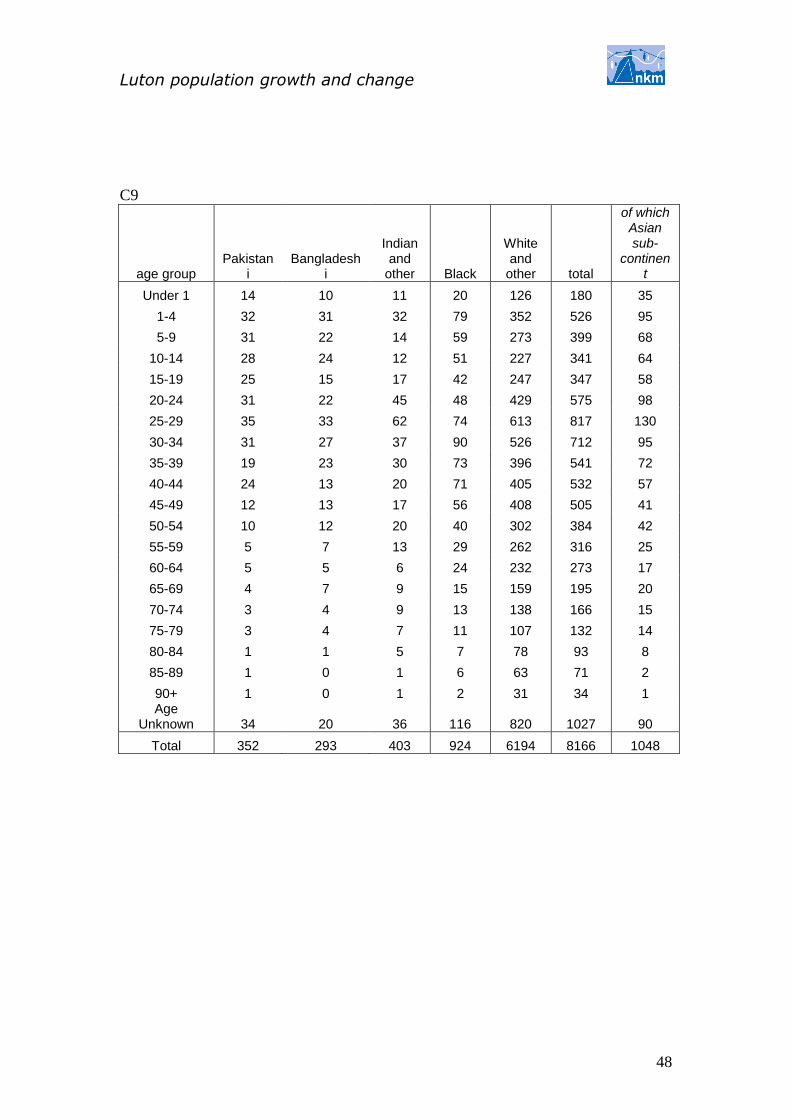
Luton population growth and change
48
C9
age group Pakistan
i Bangladesh
i
Indian and
other Black
White and
other total
of which Asian sub-
continent
Under 1 14 10 11 20 126 180 35
1-4 32 31 32 79 352 526 95
5-9 31 22 14 59 273 399 68
10-14 28 24 12 51 227 341 64
15-19 25 15 17 42 247 347 58
20-24 31 22 45 48 429 575 98
25-29 35 33 62 74 613 817 130
30-34 31 27 37 90 526 712 95
35-39 19 23 30 73 396 541 72
40-44 24 13 20 71 405 532 57
45-49 12 13 17 56 408 505 41
50-54 10 12 20 40 302 384 42
55-59 5 7 13 29 262 316 25
60-64 5 5 6 24 232 273 17
65-69 4 7 9 15 159 195 20
70-74 3 4 9 13 138 166 15
75-79 3 4 7 11 107 132 14
80-84 1 1 5 7 78 93 8
85-89 1 0 1 6 63 71 2
90+ 1 0 1 2 31 34 1 Age
Unknown 34 20 36 116 820 1027 90
Total 352 293 403 924 6194 8166 1048
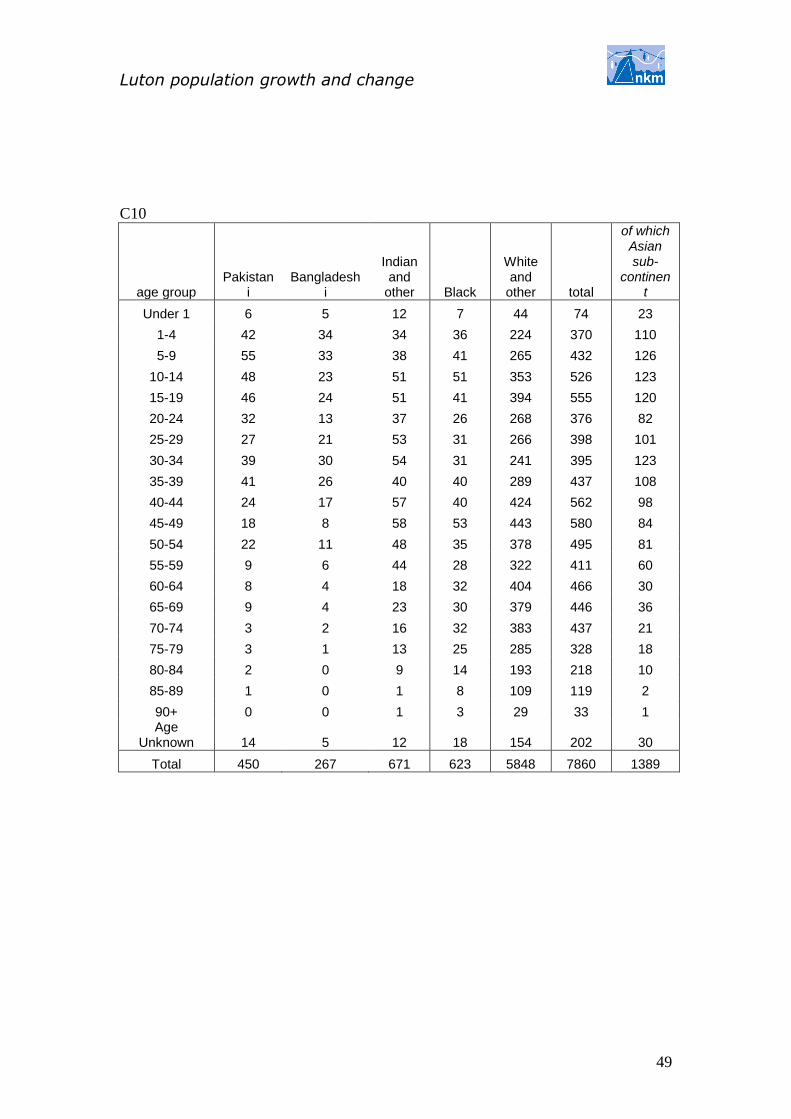
Luton population growth and change
49
C10
age group Pakistan
i Bangladesh
i
Indian and
other Black
White and
other total
of which Asian sub-
continent
Under 1 6 5 12 7 44 74 23
1-4 42 34 34 36 224 370 110
5-9 55 33 38 41 265 432 126
10-14 48 23 51 51 353 526 123
15-19 46 24 51 41 394 555 120
20-24 32 13 37 26 268 376 82
25-29 27 21 53 31 266 398 101
30-34 39 30 54 31 241 395 123
35-39 41 26 40 40 289 437 108
40-44 24 17 57 40 424 562 98
45-49 18 8 58 53 443 580 84
50-54 22 11 48 35 378 495 81
55-59 9 6 44 28 322 411 60
60-64 8 4 18 32 404 466 30
65-69 9 4 23 30 379 446 36
70-74 3 2 16 32 383 437 21
75-79 3 1 13 25 285 328 18
80-84 2 0 9 14 193 218 10
85-89 1 0 1 8 109 119 2
90+ 0 0 1 3 29 33 1 Age
Unknown 14 5 12 18 154 202 30
Total 450 267 671 623 5848 7860 1389

Luton population growth and change
50
C11
age group Pakistan
i Bangladesh
i
Indian and
other Black
White and
other total
of which Asian sub-
continent
Under 1 29 20 17 36 133 235 66
1-4 140 69 42 135 466 853 252
5-9 149 81 44 202 471 947 274
10-14 107 52 40 186 487 873 200
15-19 91 46 34 123 519 813 171
20-24 57 39 41 89 534 760 137
25-29 97 46 62 76 505 786 205
30-34 99 66 70 104 506 846 235
35-39 77 52 52 136 503 821 181
40-44 53 33 28 159 678 952 114
45-49 31 12 40 125 588 796 84
50-54 29 12 50 85 479 655 91
55-59 19 10 40 54 389 512 69
60-64 10 6 21 50 489 576 37
65-69 8 6 21 48 390 473 35
70-74 8 7 16 42 316 388 30
75-79 6 2 4 34 263 309 12
80-84 1 2 5 16 170 194 8
85-89 1 1 2 8 95 107 5
90+ 0 0 0 5 51 57 0 Age
Unknown 19 14 18 58 334 443 51
Total 1031 577 649 1772 8367 12396 2257
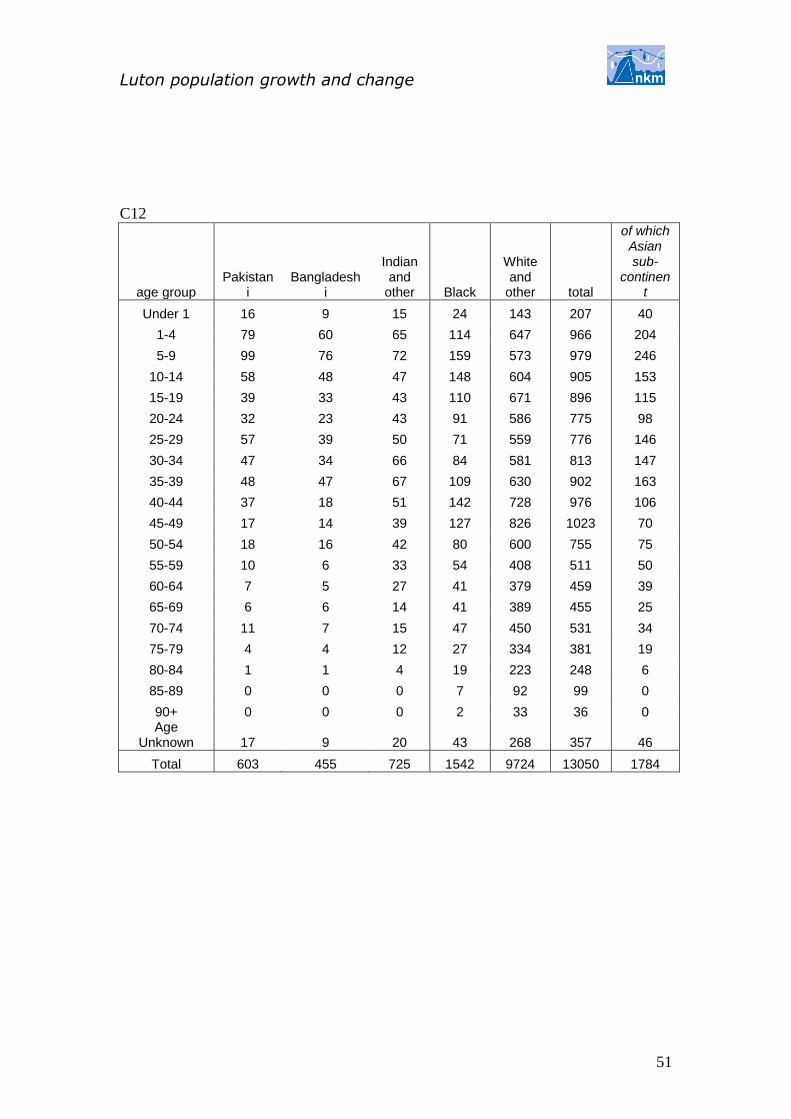
Luton population growth and change
51
C12
age group Pakistan
i Bangladesh
i
Indian and
other Black
White and
other total
of which Asian sub-
continent
Under 1 16 9 15 24 143 207 40
1-4 79 60 65 114 647 966 204
5-9 99 76 72 159 573 979 246
10-14 58 48 47 148 604 905 153
15-19 39 33 43 110 671 896 115
20-24 32 23 43 91 586 775 98
25-29 57 39 50 71 559 776 146
30-34 47 34 66 84 581 813 147
35-39 48 47 67 109 630 902 163
40-44 37 18 51 142 728 976 106
45-49 17 14 39 127 826 1023 70
50-54 18 16 42 80 600 755 75
55-59 10 6 33 54 408 511 50
60-64 7 5 27 41 379 459 39
65-69 6 6 14 41 389 455 25
70-74 11 7 15 47 450 531 34
75-79 4 4 12 27 334 381 19
80-84 1 1 4 19 223 248 6
85-89 0 0 0 7 92 99 0
90+ 0 0 0 2 33 36 0 Age
Unknown 17 9 20 43 268 357 46
Total 603 455 725 1542 9724 13050 1784
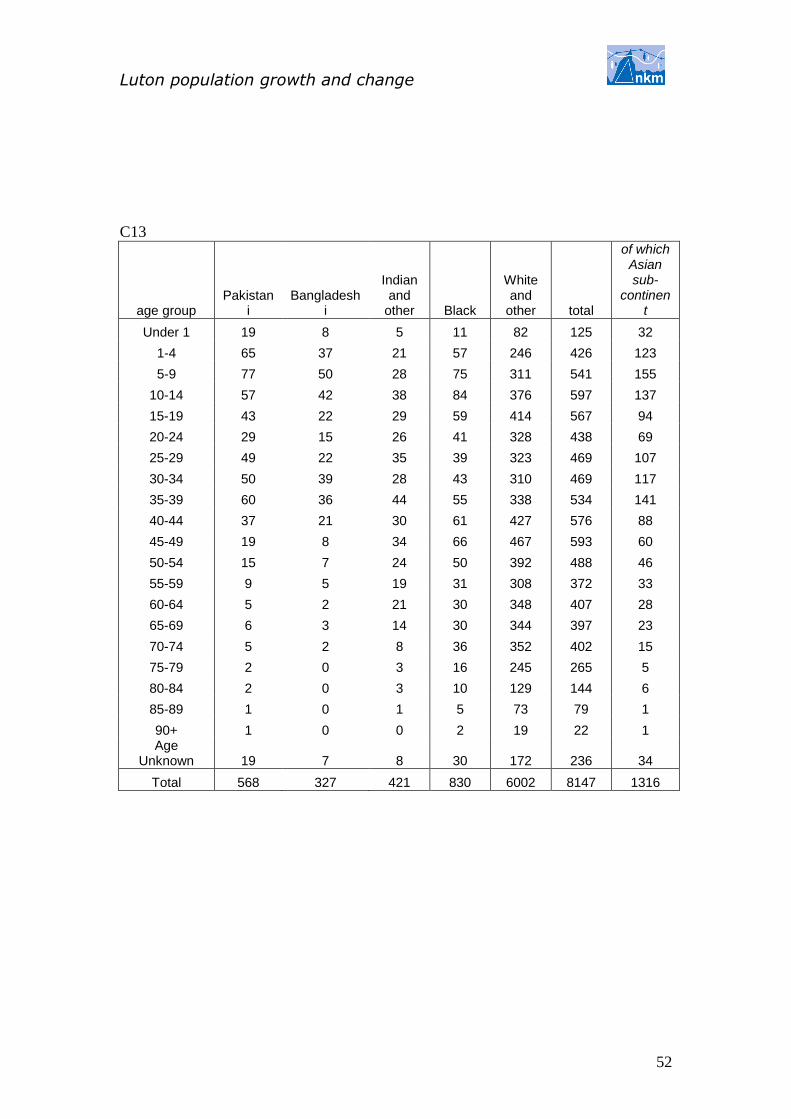
Luton population growth and change
52
C13
age group Pakistan
i Bangladesh
i
Indian and
other Black
White and
other total
of which Asian sub-
continent
Under 1 19 8 5 11 82 125 32
1-4 65 37 21 57 246 426 123
5-9 77 50 28 75 311 541 155
10-14 57 42 38 84 376 597 137
15-19 43 22 29 59 414 567 94
20-24 29 15 26 41 328 438 69
25-29 49 22 35 39 323 469 107
30-34 50 39 28 43 310 469 117
35-39 60 36 44 55 338 534 141
40-44 37 21 30 61 427 576 88
45-49 19 8 34 66 467 593 60
50-54 15 7 24 50 392 488 46
55-59 9 5 19 31 308 372 33
60-64 5 2 21 30 348 407 28
65-69 6 3 14 30 344 397 23
70-74 5 2 8 36 352 402 15
75-79 2 0 3 16 245 265 5
80-84 2 0 3 10 129 144 6
85-89 1 0 1 5 73 79 1
90+ 1 0 0 2 19 22 1 Age
Unknown 19 7 8 30 172 236 34
Total 568 327 421 830 6002 8147 1316

Luton population growth and change
53
C14
age group Pakistan
i Bangladesh
i
Indian and
other Black
White and
other total
of which Asian sub-
continent
Under 1 11 12 4 22 101 150 27
1-4 55 49 16 127 381 628 121
5-9 51 59 19 128 407 664 129
10-14 38 52 24 121 457 692 114
15-19 32 31 30 98 450 641 93
20-24 33 44 29 74 393 573 106
25-29 41 49 38 68 428 624 128
30-34 36 48 39 81 438 642 123
35-39 36 35 19 105 443 639 91
40-44 17 22 25 120 469 654 64
45-49 11 8 28 94 395 536 47
50-54 13 13 34 66 346 473 61
55-59 16 12 24 37 349 437 51
60-64 7 10 24 41 331 412 40
65-69 4 7 16 19 229 275 27
70-74 4 3 6 20 195 229 13
75-79 2 3 8 15 105 134 13
80-84 2 2 1 4 45 55 6
85-89 0 0 0 3 31 34 0
90+ 0 0 0 0 9 9 0 Age
Unknown 8 6 6 36 192 248 20
Total 416 468 391 1281 6193 8749 1275
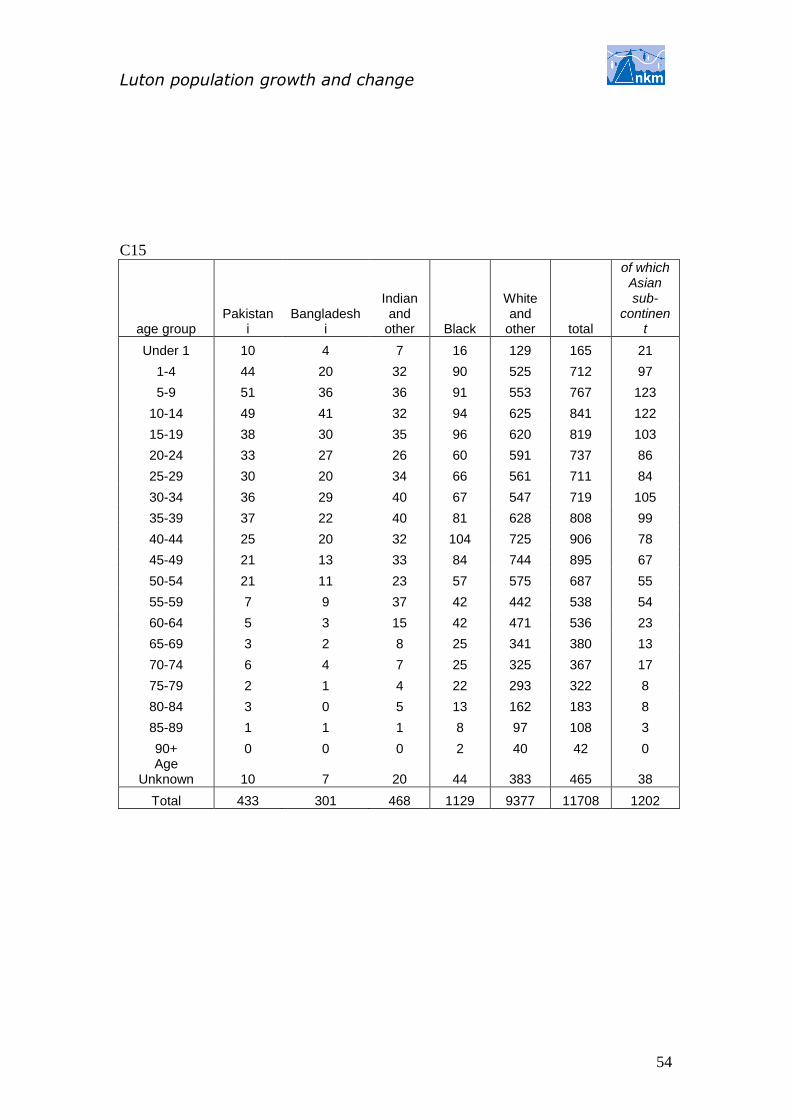
Luton population growth and change
54
C15
age group Pakistan
i Bangladesh
i
Indian and
other Black
White and
other total
of which Asian sub-
continent
Under 1 10 4 7 16 129 165 21
1-4 44 20 32 90 525 712 97
5-9 51 36 36 91 553 767 123
10-14 49 41 32 94 625 841 122
15-19 38 30 35 96 620 819 103
20-24 33 27 26 60 591 737 86
25-29 30 20 34 66 561 711 84
30-34 36 29 40 67 547 719 105
35-39 37 22 40 81 628 808 99
40-44 25 20 32 104 725 906 78
45-49 21 13 33 84 744 895 67
50-54 21 11 23 57 575 687 55
55-59 7 9 37 42 442 538 54
60-64 5 3 15 42 471 536 23
65-69 3 2 8 25 341 380 13
70-74 6 4 7 25 325 367 17
75-79 2 1 4 22 293 322 8
80-84 3 0 5 13 162 183 8
85-89 1 1 1 8 97 108 3
90+ 0 0 0 2 40 42 0 Age
Unknown 10 7 20 44 383 465 38
Total 433 301 468 1129 9377 11708 1202

Luton population growth and change
55
C16
age group Pakistan
i Bangladesh
i
Indian and
other Black
White and
other total
of which Asian sub-
continent
Under 1 144 51 25 27 102 349 220
1-4 528 184 89 84 350 1235 801
5-9 580 222 111 108 317 1337 913
10-14 490 170 101 98 310 1169 761
15-19 360 146 88 104 338 1035 593
20-24 409 136 82 61 339 1027 627
25-29 423 172 114 69 409 1187 709
30-34 434 174 98 70 368 1143 705
35-39 315 175 102 81 347 1020 592
40-44 232 106 91 73 388 891 430
45-49 135 66 76 75 359 711 277
50-54 131 70 78 61 319 659 279
55-59 102 62 61 34 236 495 225
60-64 63 33 47 28 239 410 143
65-69 37 34 37 23 222 353 108
70-74 43 30 28 28 193 323 102
75-79 24 22 17 19 167 248 63
80-84 13 9 9 9 101 142 32
85-89 4 4 6 7 70 91 14
90+ 1 2 0 2 23 28 3 Age
Unknown 57 27 31 46 299 460 115
Total 4523 1896 1291 1106 5496 14313 7711
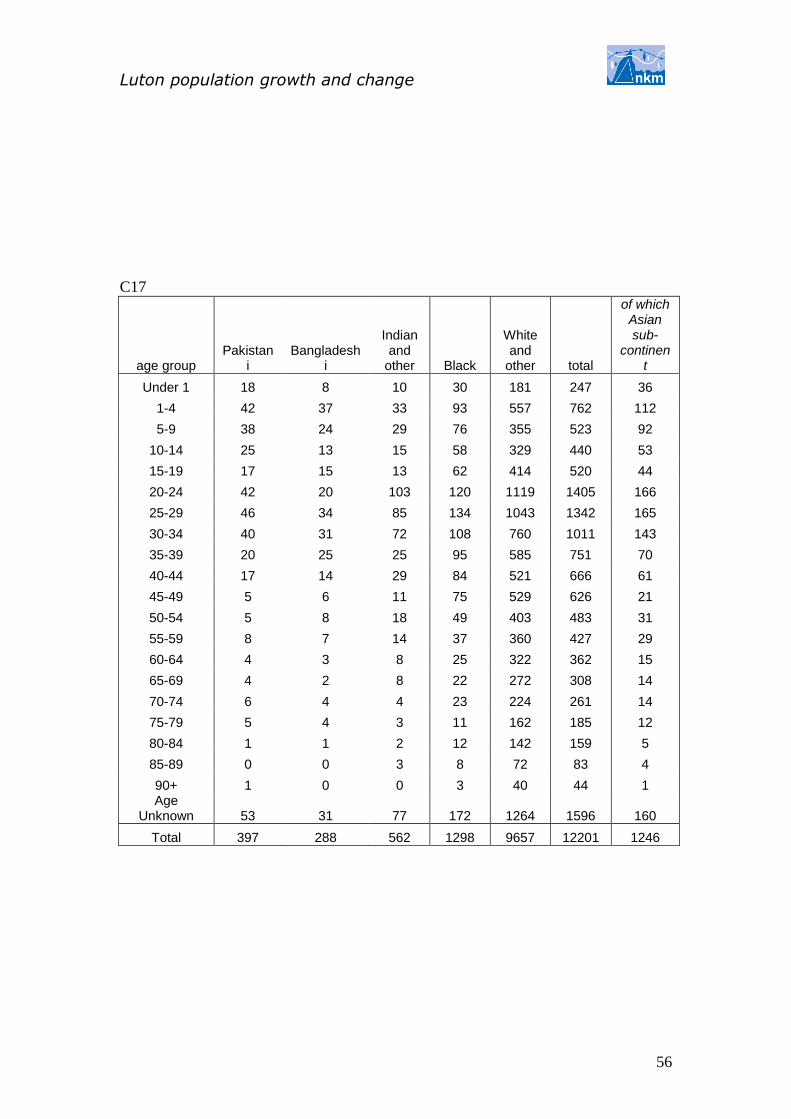
Luton population growth and change
56
C17
age group Pakistan
i Bangladesh
i
Indian and
other Black
White and
other total
of which Asian sub-
continent
Under 1 18 8 10 30 181 247 36
1-4 42 37 33 93 557 762 112
5-9 38 24 29 76 355 523 92
10-14 25 13 15 58 329 440 53
15-19 17 15 13 62 414 520 44
20-24 42 20 103 120 1119 1405 166
25-29 46 34 85 134 1043 1342 165
30-34 40 31 72 108 760 1011 143
35-39 20 25 25 95 585 751 70
40-44 17 14 29 84 521 666 61
45-49 5 6 11 75 529 626 21
50-54 5 8 18 49 403 483 31
55-59 8 7 14 37 360 427 29
60-64 4 3 8 25 322 362 15
65-69 4 2 8 22 272 308 14
70-74 6 4 4 23 224 261 14
75-79 5 4 3 11 162 185 12
80-84 1 1 2 12 142 159 5
85-89 0 0 3 8 72 83 4
90+ 1 0 0 3 40 44 1 Age
Unknown 53 31 77 172 1264 1596 160
Total 397 288 562 1298 9657 12201 1246
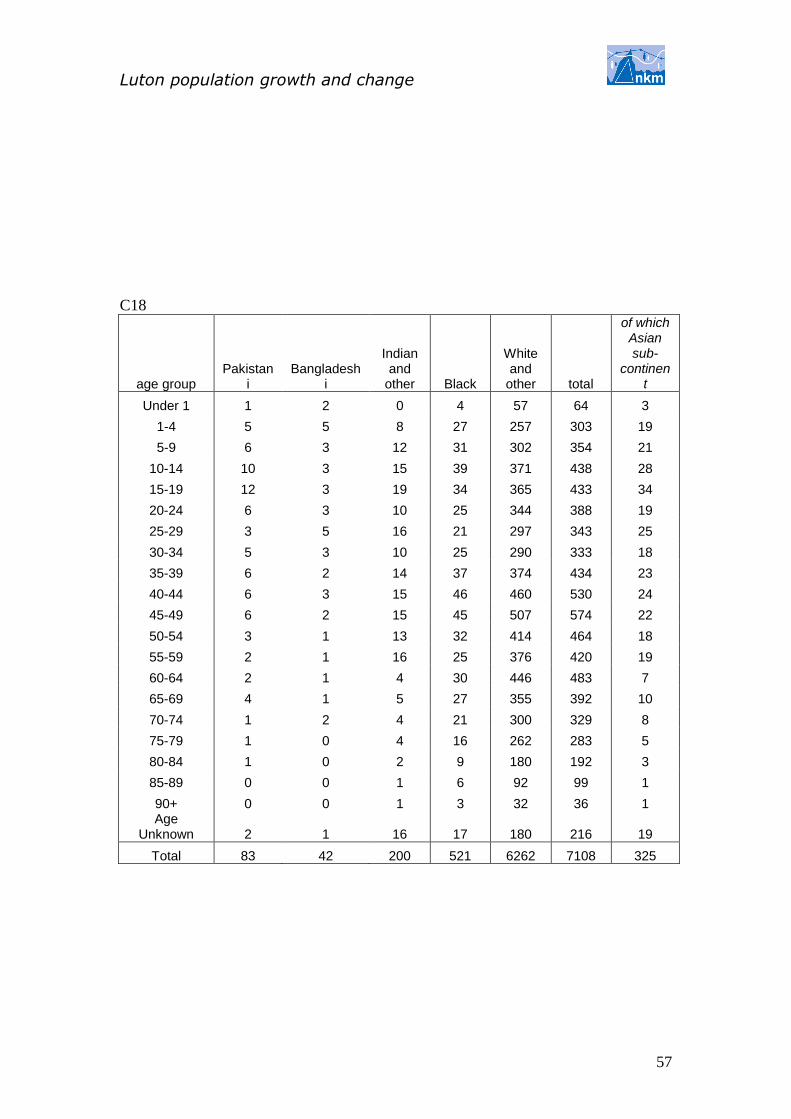
Luton population growth and change
57
C18
age group Pakistan
i Bangladesh
i
Indian and
other Black
White and
other total
of which Asian sub-
continent
Under 1 1 2 0 4 57 64 3
1-4 5 5 8 27 257 303 19
5-9 6 3 12 31 302 354 21
10-14 10 3 15 39 371 438 28
15-19 12 3 19 34 365 433 34
20-24 6 3 10 25 344 388 19
25-29 3 5 16 21 297 343 25
30-34 5 3 10 25 290 333 18
35-39 6 2 14 37 374 434 23
40-44 6 3 15 46 460 530 24
45-49 6 2 15 45 507 574 22
50-54 3 1 13 32 414 464 18
55-59 2 1 16 25 376 420 19
60-64 2 1 4 30 446 483 7
65-69 4 1 5 27 355 392 10
70-74 1 2 4 21 300 329 8
75-79 1 0 4 16 262 283 5
80-84 1 0 2 9 180 192 3
85-89 0 0 1 6 92 99 1
90+ 0 0 1 3 32 36 1 Age
Unknown 2 1 16 17 180 216 19
Total 83 42 200 521 6262 7108 325
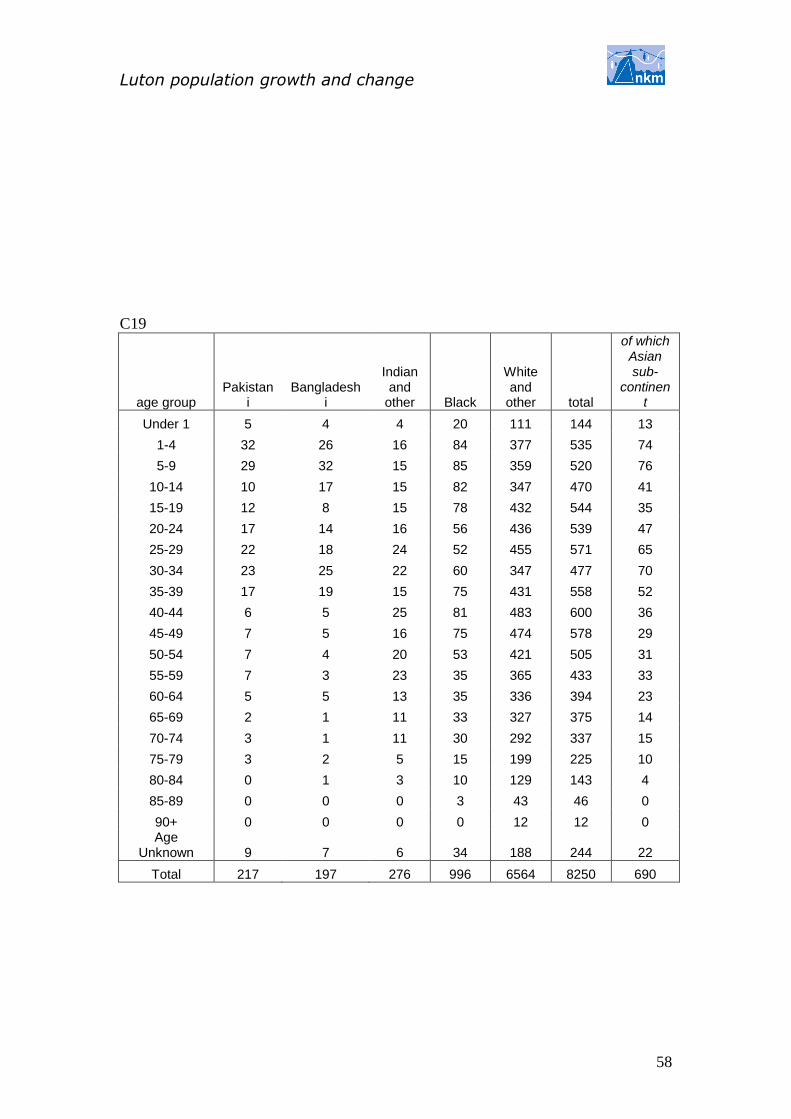
Luton population growth and change
58
C19
age group Pakistan
i Bangladesh
i
Indian and
other Black
White and
other total
of which Asian sub-
continent
Under 1 5 4 4 20 111 144 13
1-4 32 26 16 84 377 535 74
5-9 29 32 15 85 359 520 76
10-14 10 17 15 82 347 470 41
15-19 12 8 15 78 432 544 35
20-24 17 14 16 56 436 539 47
25-29 22 18 24 52 455 571 65
30-34 23 25 22 60 347 477 70
35-39 17 19 15 75 431 558 52
40-44 6 5 25 81 483 600 36
45-49 7 5 16 75 474 578 29
50-54 7 4 20 53 421 505 31
55-59 7 3 23 35 365 433 33
60-64 5 5 13 35 336 394 23
65-69 2 1 11 33 327 375 14
70-74 3 1 11 30 292 337 15
75-79 3 2 5 15 199 225 10
80-84 0 1 3 10 129 143 4
85-89 0 0 0 3 43 46 0
90+ 0 0 0 0 12 12 0 Age
Unknown 9 7 6 34 188 244 22
Total 217 197 276 996 6564 8250 690

Luton population growth and change
59
C20
age group Pakistani Bangladeshi
Indian and
other Black
White and
other total
of which Asian sub-continent
Under 1 3 2 6 15 132 158 11
1-4 18 14 33 66 540 670 64
5-9 17 15 32 73 498 635 64
10-14 10 11 19 74 574 688 40
15-19 10 9 27 72 679 798 47
20-24 7 6 29 62 609 714 43
25-29 10 9 32 52 688 791 51
30-34 10 11 44 59 646 770 65
35-39 13 11 32 74 672 802 56
40-44 12 6 32 81 737 868 51
45-49 4 3 28 93 875 1003 34
50-54 3 0 30 60 739 832 34
55-59 4 2 29 43 593 671 35
60-64 4 1 23 40 532 599 27
65-69 3 2 13 27 292 337 18
70-74 1 1 7 24 242 275 9
75-79 1 0 6 12 161 180 7
80-84 1 1 3 7 103 115 5
85-89 0 0 1 4 76 81 1
90+ 0 0 0 1 21 22 0 Age
Unknown 4 3 14 32 340 392 20
Total 135 106 442 970 9748 11401 683